Article

Tracing Phase Transformation and Lattice Evolution in a TRIP Sheet Steel under High-Temperature Annealing by Real-Time In Situ Neutron Diffraction

1
Neutron Scattering Division, Oak Ridge National Laboratory, Oak Ridge, TN 37831, USA
2
Shull Wollan Center, Oak Ridge National Laboratory, Oak Ridge, TN 37831, USA
3
Automotive Solutions Center, United States Steel Corporation, Troy, MI 48098, USA
*
Author to whom correspondence should be addressed.
Crystals 2018, 8(9), 360; https://doi.org/10.3390/cryst8090360
Submission received: 31 July 2018 / Revised: 22 August 2018 / Accepted: 6 September 2018 / Published: 11 September 2018
(This article belongs to the Special Issue Neutron Diffractometers for Single Crystals and Powders)

Abstract

:
Real-time in situ neutron diffraction was used to characterize the crystal structure evolution in a transformation-induced plasticity (TRIP) sheet steel during annealing up to 1000 °C and then cooling to 60 °C. Based on the results of full-pattern Rietveld refinement, critical temperature regions were determined in which the transformations of retained austenite to ferrite and ferrite to high-temperature austenite during heating and the transformation of austenite to ferrite during cooling occurred, respectively. The phase-specific lattice variation with temperature was further analyzed to comprehensively understand the role of carbon diffusion in accordance with phase transformation, which also shed light on the determination of internal stress in retained austenite. These results prove the technique of real-time in situ neutron diffraction as a powerful tool for heat treatment design of novel metallic materials.

1. Introduction

Known as one type of advanced high strength steels for the automotive industry, transformation-induced plasticity (TRIP) steels offer an outstanding combination of strength, ductility, and work hardening capacity, thus providing excellent formability and energy absorption capacity. The superior mechanical performance of TRIP steels is a result of the composite microstructure: islands of hard retained austenite (RA) dispersed in a soft bainite ferritic matrix. The transformation of RA to martensite at straining renders the material high strength and work hardening capacity and promotes bulk uniform deformation while delaying localized necking. To achieve the desired microstructure, designated chemical compositions and relatively complex heat treatment processes are required [1,2]. Modern low-alloyed TRIP steels contain ~3.5% alloy elements (in weight fraction), typically including 0.20–0.25% C, ~1.5% Mn and at least 0.3–0.8% Si. The C and Mn play a key role of austenite stabilizer to retain austenite at room temperature. The Si is mainly to suppress the formation of cementite and thus to promote carbon enrichment in RA. The conventional heat treatment processing for cold-rolled TRIP steels involves two main annealing steps: intercritical annealing at 750–800 °C to yield an austenite-ferrite microstructure with a certain degree of carbon enrichment in austenite, and isothermal bainitic transformation at 350–490 °C to allow part of austenite to transform to bainite, thus leading to further carbon enrichment in RA. In addition, Zn or Zn alloy coatings are typically applied to achieve corrosion protection of the steel substrate. When hot dip galvanizing or hot dip galvannealing are utilized during the coating process, additional heat treatments to the substrate materials are involved. The hot dip galvanizing and galvannealing require temperature ranges of 450–470 °C and 500–550 °C, respectively, which could further influence the microstructure of cold-rolled TRIP steels [3,4]. Collectively, the manufacture of cold-rolled TRIP steels involves a series of annealing processing that could largely affect the microstructure. Therefore, it is desired to understand the phase transformation behavior during those annealing processes thus to characterize the microstructure changes as a function of annealing processing.
Recent advances on in situ neutron or high-energy X-ray diffraction allow researchers to trace microstructure evolution in TRIP and other steels under heating/cooling [5,6,7,8,9,10,11,12,13,14]. Choi et al. [13] studied the stability of RA in a hot-rolled TRIP steel during annealing up to 450 °C at a rate of 0.2 °C/s by in situ synchrotron X-ray diffraction, and claimed that RA started to transform to ferrite at ~330 °C and precipitate iron carbide at ~390 °C. Babu et al. [6] investigated the isothermal transformation of austenite-to-bainitic ferrite in a high-carbon steel during annealing at 300 °C for 12 h by in situ synchrotron X-ray diffraction and proposed a theory that the development of carbon-rich and carbon-poor regions in the austenite could be a precursor to transformations including the bainite reaction. Jimenez-Melero et al. [9] and Van Dijk et al. [7] found in several TRIP steels by in situ synchrotron X-ray diffraction that the carbon content played a key role in the thermal stability of RA during cooling down to −173 °C. Allain et al. [11,12,13] determined the time and temperature evolutions of phase fractions and their carbon content in a high-strength steel during a quenching and partitioning (Q&P) process by in situ synchrotron X-ray diffraction, and concluded the carbon diffusion from martensite to austenite as the main mechanisms responsible for the carbon enrichment in RA in the partitioning step. Compared to the conventional post-test techniques such as optical microscopy (OM), scanning electron microscopy (SEM), electron backscatter diffraction (EBSD) and transmission electron microscopy (TEM) that give relatively localized observation of the resulted microstructures after varied heat treatment processes, in situ diffraction techniques enable the measurement of kinetic lattice structures of constituent phases over a relatively large bulk gauge volume during heat treatment processes to elucidate how to attain the final microstructure.
Thanks to the high flux and deep penetration of the time-of-flight (TOF) neutrons, real-time in situ study is facilitated with complex sample environment equipped enabling loading [15,16,17,18,19,20,21,22,23,24], heating/cooling [25,26] charging [27,28] etc. as well as their combinations [29,30,31,32]. The large cross-section of all components in the material make it possible to differentiate mixed phases and to monitor the phase evolutions under the external stimuli [33,34,35,36]. The static neutron incident slits and detectors of the TOF diffractometer ensure the high resolution to precisely resolve the lattice parameters/strains [37,38]. The average structure information given from a bulk provide statistical quantities such as phase fraction [39], preferential orientation [40], lattice site occupancy [41,42] and their evolutions [43,44]. Being benefited with the advantages above, in this study, a real-time in situ neutron diffraction was used to characterize the phase transformation in a cold-rolled TRIP sheet steel during two cycles of annealing up to 850 °C and 1000 °C and then cooling to 60 °C. Phase-specific lattice parameters and weight fractions were determined as a function of temperature. Phase transformation behavior was thus analyzed in association with carbon diffusion. Internal stress in RA due to the mismatch of coefficients of thermal expansion between austenite and ferrite was further estimated. These results are aimed to reveal the continuous phase transformation kinetics during heat treatment of cold-rolled TRIP steels and to prove the in situ diffraction technique as a powerful tool for the research of microstructure controlling of metallic materials by heat treatment.

2. Material and Experiment

The TRIP sheet steel tested in this study is a typical C-Mn-Si steel that has been cold rolled to 1.8-mm thickness and heat treated in a continuous anneal commercial production line [45]. Dog-bone shaped tensile specimens were cut from the steel sheet, as reported in our prior study [46], showing a yield strength of 500 MPa, a tensile strength of 800 MPa and an elongation of 26–28%.
The in situ neutron diffraction experiments were conducted at the engineering materials diffractometer, VULCAN, at the Spallation Neutron Source, Oak Ridge National Laboratory (Oak Ridge, TN, USA) [47]. A schematic illustration of the testing configuration is shown in Figure 1. The dog-bone tensile specimen was horizontally placed with its axial direction at 45° with respect to the incident neutron beam. One clamping end of the specimen was fixed in a sample holder on a load frame (the holder was originally used for tension of dog-bone shaped specimen like the one used in this study), which stood on a sample positioning system that enables three-dimensional translation movement and horizontal rotation by the center. The other end, as the part to be measured, was aligned to the center of gauge volume. The neutron beam gauge volume was defined by the adjustable incident slits (8 mm in horizontal and 10 mm in vertical) and the 5 mm receiving collimators as an option. Two detectors that are located at −90° and +90° with respect to the incident beam collected neutrons scattered by crystal lattice planes parallel and perpendicular with the axial direction of the specimen, respectively. In the experiment, the nominal neutron beam power was about 1.3 MW. The chopper configuration was set at 30 Hz with bandwidth at 2.88 Å and center at 2.0 Å, which measured the d-spacing range of 0.40~2.43 Å at the −90° and +90° detectors. The high-intensity mode was used, where the d-spacing resolution (Δd/d) was about 0.45%.
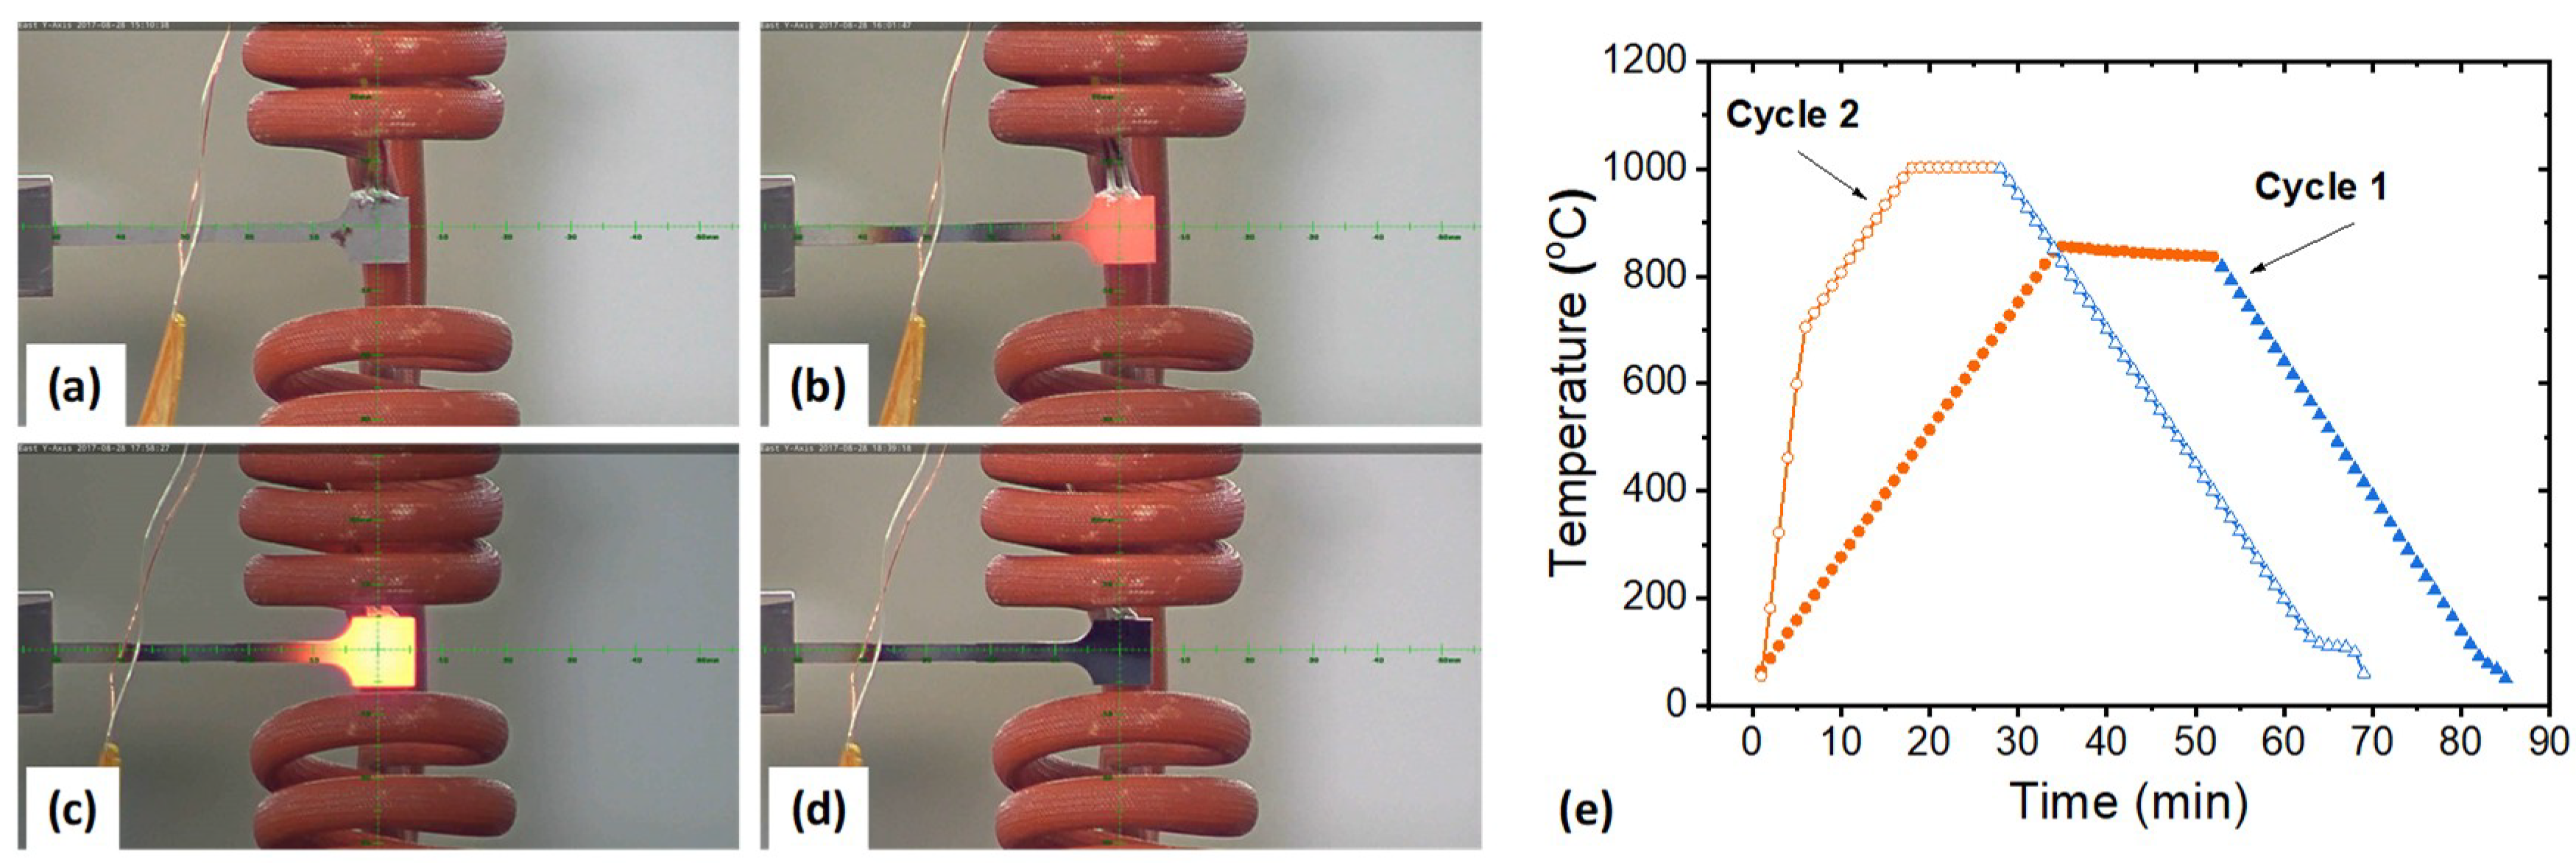
In the experiment, a special induction coil was used for the controlled in situ heating while the gap of the coil allowed clear neutron paths. K-type thermal couple wires were welded on the middle top of the clamping end for temperature monitoring and controlling. Note that only the free end of the specimen, i.e., the end in the neutron beam was heated, as seen from Figure 2a–d.
The specimen was in situ annealed twice, and the annealing profiles are shown in Figure 2e. In the first cycle, the specimen was heated to 850 °C and held for ~15 min before cooled down. The heating/cooling rates were 24 °C/min. In the second cycle, the specimen was first rapidly heated to 700 °C at a rate of 140 °C/min and then slowly heated to 1000 °C at 24 °C/min and held for ~10 min before cooled down. During the heating and cooling processes, the scattered neutrons along with the camera views were collected in real time. The continuous neutron data was then chopped by 1-min time interval using the VDRIVE software [48] to render each bin of neutron data with enough statistics to reflect information averaged over the corresponding time interval. The GSAS software [49] was then used to perform full-pattern Rietveld refinement on the diffraction profiles, from which phase-specific weight fractions and lattice parameters were derived.

3. Results and Discussion

3.1. Phase Transformation

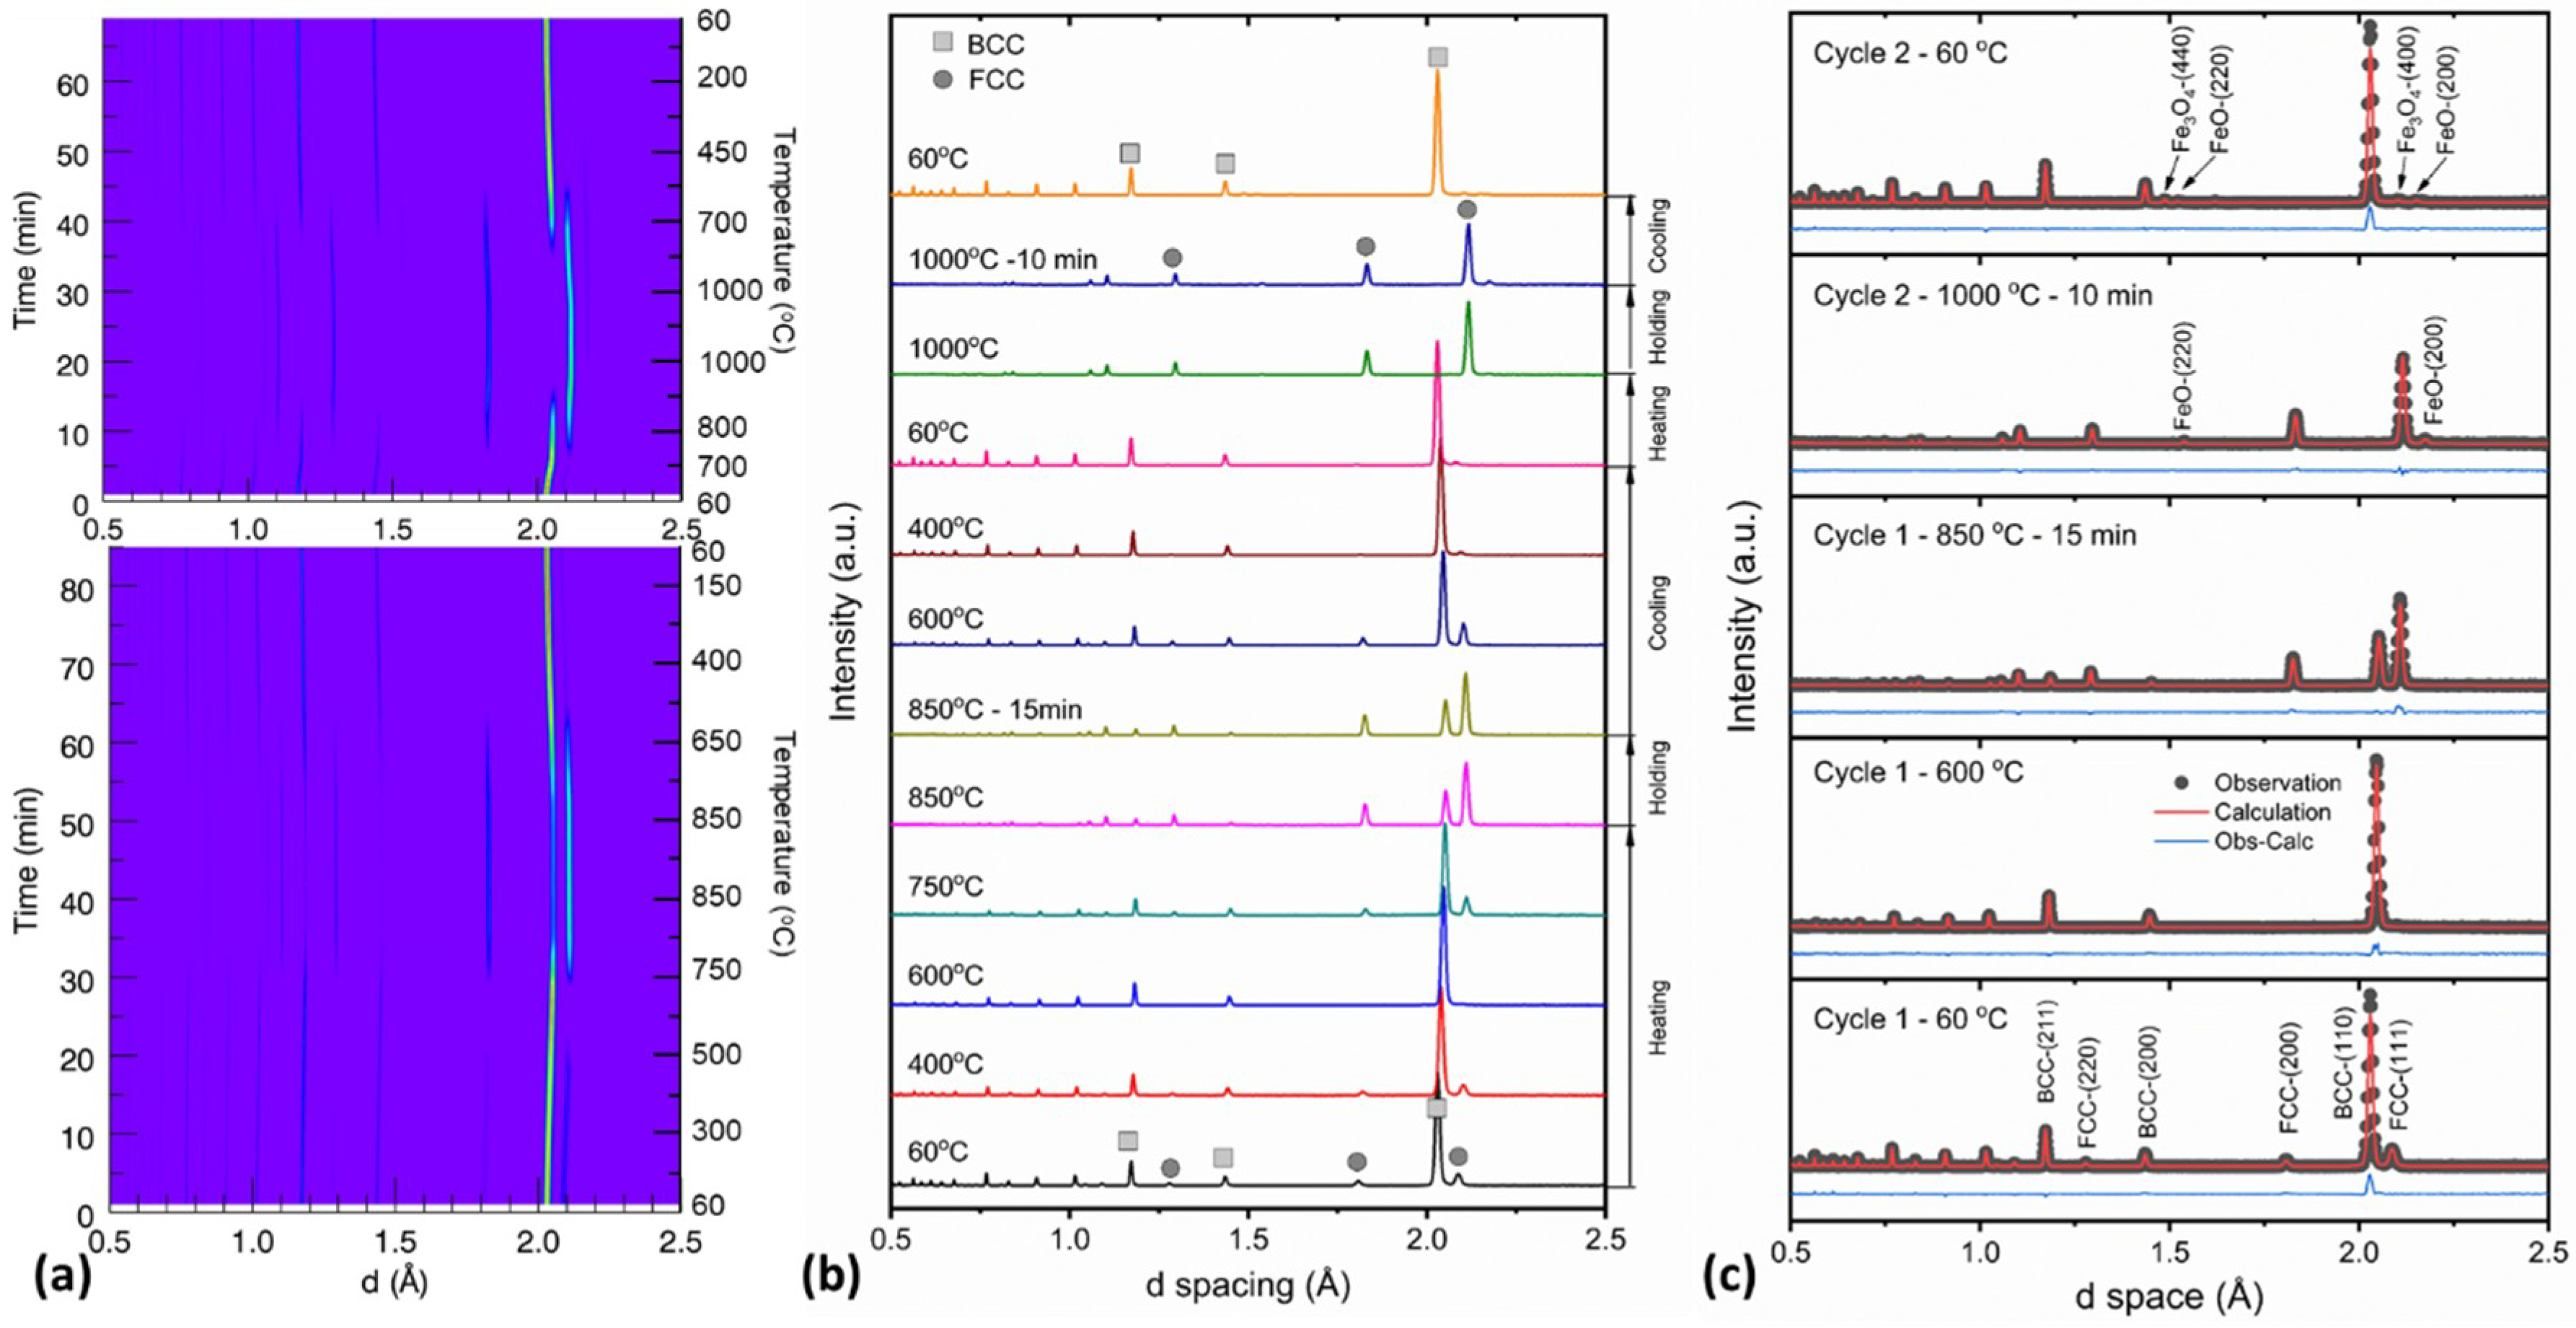
Phase transformation in the TRIP steel can be evidenced by dramatic changes of diffraction patterns. As shown in Figure 3a,b, the disappearance/appearance of diffraction peaks are typical indictors of phase transformation. In the first annealing cycle, before heating up, the diffraction pattern constitutes a mixture of body-centered cubic (BCC) structure and face-centered cubic (FCC) structure. The BCC pattern reflects the matrix of ferrite, bainite and martensite, which are hard to be distinguished by neutron diffraction, while the FCC pattern reflects the RA. As temperature increases to 600 °C, the FCC peaks disappear while the BCC peaks grow, indicating the transformation of RA to ferrite. With further heating up, the FCC peaks reappear and become stronger than the BCC peaks, indicating the transformation of ferrite to high-temperature austenite. During holding at 850 °C, the diffraction patterns hardly change, indicating no further phase transformation in this period. Upon cooling, the FCC peaks gradually become weaker and are barely observable at 400 °C and down to 60 °C, indicating the transformation of austenite to ferrite. In the second annealing cycle, the diffraction pattern shows almost only FCC at 1000 °C whereas solely BCC after cooling to 60 °C. Collectively, RA transforms to ferrite as heating up, and then ferrite transforms to high-temperature austenite upon further heating, and high-temperature austenite transforms back to ferrite upon cooling.
To distinguish the critical temperature regions of transformation between austenite and ferrite more specifically, quantitative analysis of constituent phase compositions was performed based on full-pattern Rietveld refinement. As shown in Figure 3c, the refinement on the diffraction patterns via GSAS shows excellent agreement with the experimental data. The weight fraction evolutions of FCC, BCC and iron oxides with temperature/time were thus derived and shown in Figure 4, from which a total of 8 temperature regions can be identified during heating and cooling. The features of those regions are discussed as follows:
(I) 60–300 °C. The fractions of BCC and FCC show no observable changes, indicating that the RA is stable during heating in this temperature range.
(II) 300–500 °C. There are a slight and gradual increase in the fraction of BCC and a slow decrease in the fraction of FCC, indicating that the RA starts to transform to ferrite during heating in this temperature range.
(III) 500–600 °C. The fraction of FCC decreases rapidly to zero while that of BCC increases to one, indicating that the RA is no longer stable above 500 °C and quickly transforms to ferrite until the transformation finishes at 600 °C.
(IV) 600–730 °C. The fractions of BCC and FCC remain at one and zero, respectively, indicating that the steel is composed of pure ferrite during heating in this temperature region.
(V) 730–1000 °C. The fraction of FCC increases rapidly to ~82% at 850 °C in Cycle 1 and 100% at 1000 °C in Cycle 2. This indicates that the temperature at which austenite transformation begins during heating (Ac1) is around 730 °C in both cycles and the temperature at which the transformation completes during heating (Ac3) is around 1000 °C in Cycle 2. It is noted that the transformation rate in Cycle 1 is higher than in Cycle 2, so it could be possible that Ac3 is lower in Cycle 1 than in Cycle 2. The underlying mechanism for the retarded austenite transformation will be discussed later in association with the variation of lattice parameter. Meanwhile, during isothermal holding at 850 °C in Cycle 1 and 1000 °C in Cycle 2, the fractions of FCC keeps decreasing slowly. In Cycle 1, the decrease in FCC fraction is postulated to be related to the gradual on-going phase transformation. In Cycle 2, iron oxide FeO forms on the surface, and the oxide content increases with time, resulting in the decrease of FCC fraction (Figure 3c).
(VI) 1000–850 °C. The fractions of FCC and BCC remain at one and zero, respectively, indicating that the steel is composed of pure austenite during cooling in this temperature region.
(VII) 850–500 °C. The fraction of FCC rapidly decreases to ~5% at 500 °C in Cycle 1 and to almost zero at 500 °C in Cycle 2. It indicates that the finish temperature of austenite transformation during cooling (Ar3) is ~850 °C and the start temperature during cooling (Ar1) is ~500 °C. It is seen that Ar1 and Ar3 are significantly lower than Ac1 and Ac3, respectively. This is known as the hysteresis in heating and cooling of carbon steels, which could result from non-equilibrium phase transformation due to the relatively fast heating and cooling in this study. It is interesting that the transformation seems to be slightly retarded at ~700 °C. This is evidenced by a kink feature shown in Figure 4, which indicates a transition of a higher transformation rate to a lower one. The possible cause for the kink will be discussed later in association with the lattice parameter evolution.
(VIII) 500–60 °C. The fractions of BCC and FCC show no distinguishable changes, indicating that the RA is stable during cooling in this temperature range. The iron oxides, including Fe3O4 and FeO, account for ~10% of the total weight, and can be observed from the camera view after cooling in Figure 2d, as compared to that before heating in Figure 2a.

3.2. Lattice Parameter Evolution

Variation of phase-specific lattice parameter during heating and cooling can reflect information on thermal expansion, carbon diffusion and internal stress, which could affect the phase transformation. Figure 5 shows the evolutions of BCC and FCC lattice parameters as a function of temperature. The BCC phase shows nearly linear a-T relations repeated in both cycles while the FCC phase shows relatively complex non-linear a-T relations. To interpret those a-T relations, a few equations regarding thermal expansion and carbon concentration are introduced first as follows. Assuming a linear thermal expansion, the lattice parameter a can be described as a first-order function of temperature T by the following equation:
a = a 0 + b ( T T 0 )   ( Å )
where a0 is the lattice parameter at reference temperature T0, and b is a constant, corresponding to the slope of a-T relation. The coefficient of thermal expansion (CTE) α can be derived as in the following equation:
α = 1 a 0 d a d T = b a 0   ( 10 6   ° C 1 )
Meanwhile, carbon, being an interstitial solute element in ferrous alloys, is known as a major factor that affects the lattice parameters of austenite and ferrite. Carbon concentration has been reported to increase the lattice parameter by the following general form of equation:
a 0 = a 0 , c + β X c   ( Å )
where a 0 , c is the zero-carbon lattice parameter at T0; X c is the carbon concentration in austenite or ferrite in atomic or weight fraction; and β is a constant. Considering the low solubility of carbon in ferrite, most literatures focused on the carbon concentration in austenite. As summarized in reference [50], the zero-carbon lattice parameter of austenite at room temperature ranged from 3.5467 to 3.6003 Å, and the values of β were reported to be 0.044, 0.033 or 0.047 with X c being in w.t.%. Onink et al. [51] reported the a 0 , c of austenite at 727 °C to be 3.6307 Å, and the value of β to be 0.0078 with X c being the number of C atoms per 100 Fe atoms. They also provided the CTE of austenite as a function of carbon concentration for calculation of austenite lattice parameters at other temperatures between 527 and 927 °C. Some of the above values have been used to calculate the carbon concentration of RA in TRIP steels [5,52,53,54]. However, besides thermal expansion and carbon concentration, internal stress due to the mismatch of CTE between austenite and ferrite also contributes to the variation of lattice parameter, as recently reported in a Q&P TRIP-assisted steel [12,13]. Moreover, the concentration of other alloying elements such as Mn and Si, also affects the lattice parameter when they substitute the major Fe elements [55]. Therefore, it is inaccurate to quantify the carbon concentration in RA barely on the ground of the lattice parameter measurement. In the following, carbon concentration evolution is qualitatively discussed with a comprehensive analysis of CTE and internal stress that may cause the variation of lattice parameter.
Following the eight temperature regions discussed before, the lattice evolution and possible carbon diffusion mechanisms are discussed as follows:
(I) + (II) 60−500 °C. The BCC shows a linear expansion with a CTE of 14.6 × 10⁻⁶ °C−1, while the FCC shows a three-stage expansion behavior consisting of a linear expansion with a CTE of 18.6 × 10⁻⁶ °C−1 at up to ~300 °C, and then an accelerated nonlinear expansion till ~470 °C, followed by a subsequent rapid contraction. Choi et al. [5] observed a similar three-stage expansion behavior of RA in a TRIP steel during annealing up to 450 °C. They attributed the slightly enhanced expansion of austenite lattice to the carbon concentration change because of transformation to ferrite of low-carbon solubility, and the rapid contraction to carbon depletion due to the formation of cementite. In this study, the onset of nonlinear expansion coincides with that of phase transformation in Figure 4. The observations indicate a process similar to the isothermal bainitic transformation: a portion of RA transforms to ferrite leading to further carbon enrichment in the remained portion of RA, and thus, the additional expansion to thermal expansion. However, iron carbides were not observed in the studied steel during annealing, which is different from the results reported by Choi and colleagues. The significant mobility of atoms, particularly carbon atoms, is thus evidenced at the temperature range of 300~450 °C. At the temperature higher than 470 °C, the FCC lattice starts to shrink, which is resulted from a rapid carbon diffusion from RA to ferrite. As proposed by Babu et al. [6], carbon-depleted regions could be developed in RA before its massive transformation. In the meantime, due to the much larger fraction of ferrite in comparison to the RA, the carbon concentration in ferrite is not so significant considering the low carbon content. Thus, BCC lattice parameter frustration is not observed besides the linear thermal expansion.
(III) 500–600 °C. The BCC still shows a linear expansion, while the FCC shows a slightly further contraction till 550 °C and then a slight expansion. Such behavior of FCC is considered a result of competition between carbon depletion and thermal expansion along with the phase transformation.
(IV) 600–730 °C. The steel consists of pure BCC and shows a linear expansion with a CTE of 15.4 × 10⁻⁶ °C−1, which is slightly higher than the value in region (I).
(V) 730–1000 °C. The expansion of BCC lattice seems restrained to some extent up to ~850 °C by showing a slight rightward flattening trend. After that, the BCC shows a linear expansion with a CTE of 14.8 × 10⁻⁶ °C−1, which is close to the values in region (I) and (IV). In the meantime, the FCC first shows a gradual contraction up to ~850 °C followed by a gradual expansion and eventually a linear expansion. The contraction of FCC lattice is the result of decreasing carbon solubility with increasing temperature when the temperature is higher than the eutectoid temperature, which is about 730 °C in this study. Though carbon concentration in austenite is decreasing, the austenite volume is increasing due to phase transformation. Thus, carbon atoms are still diffusing from ferrite to austenite in general, leading to the restrained expansion of BCC lattice. Along with phase transformation, thermal expansion gradually overweighs carbon-depletion induced contraction, finally leading to a linear expansion above 900 °C.
(VI) 1000–850 °C. The steel consists of pure FCC (excluding the outside layer of iron oxides) and shows a linear expansion with a CTE of 23.5 × 10⁻⁶ °C−1, which is significantly higher than the value in region (I). This value is consistent with the constant CTEs of FCC iron alloys reported in literatures, such as 24.1 × 10⁻⁶ °C−1 by Choi et al. [5] and Allain et al. [13], 22.9–24.7 × 10⁻⁶ °C−1 by Onink et al. [51], 22.3 × 10⁻⁶ °C−1 by Huang et al. [52], 23.1–23.7 × 10⁻⁶ °C−1 by Li et al. [55], 24.3 × 10⁻⁶ °C−1 by Lu et al. [56]. The potential causes for the CTE difference between region (VI) and (I) are discussed below for region (VIII).
(VII) 850–500 °C. The newly formed BCC shows a slightly rightward flattening trend at ~700 °C, almost coinciding with the rightward trend observed in region (V). The FCC shows a more evident leftward flattening trend, deviating from the linear contraction path in region (VI). This further indicates the carbon-concentration induced expansion since the carbon solubility in both austenite and ferrite is known to reach maximum at the eutectoid temperature. The carbon-concentration induced expansion competes with thermal contraction during cooling, leading to the above deviation from linear contraction. Such deviation coincides with the kink feature at ~700 °C during phase transformation in Figure 4, when the fractions of BCC and FCC are almost equivalent (half-half). This may indicate that carbon concentration in austenite could retard the phase transformation to ferrite to some extent.
(VIII) 500–60 °C. Both BCC and FCC show a linear contraction with decreasing temperature. The CTE of FCC is 18.8 × 10⁻⁶ °C−1, which is very close to that in region (I) but significantly lower than that in region (VI). One proposed cause could be related to the carbon concentration. As evidenced in region (VII), carbon-concentration induced expansion in austenite is enough to counteract thermal contraction. The CTE of austenite was reported to decrease with increasing carbon content for Fe-C alloys between 527 and 927 °C [51]. However, this may not be the case for the present study. The FCC lattice parameter in region (VIII) is much higher than that in region (I), indicating lower carbon concentration in region (VIII), but the CTE shows no significant difference. In fact, it is possible that thermal constrain by BCC due to the mismatch of CTE between the two phases may contribute to the lower CTE of FCC. One prerequisite for such assumption is that BCC and FCC start to bond rigidly at a “jointing” temperature. The jointing temperature is difficult to determine but could be around 550 °C in this study, where the flattening trend of FCC transitions to the linear contraction. It is noted that the thermal constrain on BCC in this temperature region could be much weaker due to the low fraction of FCC, thus hardly affecting the CTE of BCC. Under such assumption, the constrain strain of FCC caused by mismatch of CTE can be estimated by the following equation:
Δ ε c = ( α c α 0 ) ( T T c )
where T c is the jointing temperature, Δ ε c is the constrain strain at temperature T, α c is the CTE under constrain and α 0 is the CTE under free expansion/contraction. Thus, the constrain strain of FCC at 25 °C is ~0.26%. With the thermal constrain strain being a hydrostatic strain, the RA at room temperature should be under a tensile hydrostatic stress of ~416 MPa by a bulk modulus of 160 GPa.

4. Conclusions

In this study, the phase transformation and phase-specific lattice variation in a TRIP sheet steel during high-temperature annealing were traced by real-time in situ neutron diffraction. The following conclusions are drawn:
(1)
Upon heating, the RA is stable in the temperature region below 300 °C and starts to transform to ferrite drastically in the temperature region between 500 and 600 °C. Carbon diffusion occurs in between 300 and 500 °C accompanied by a gradual phase transformation.
(2)
Upon further heating, the transformation of ferrite to austenite starts at ~730 °C accompanied by a lattice contraction of FCC due to carbon depletion in austenite. The finish temperature could be dependent on the heating history. In this study, the heating scheme is composed of one cycle of annealing up to 850 °C and then a rapid heating up to 700 °C before slow heating to the finish temperature of ~1000 °C.
(3)
Upon cooling from the finish temperature, the transformation of austenite to ferrite starts at ~850 °C and finishes at ~500 °C. The thermal contractions of FCC and BCC with decreasing temperature are retarded due to carbon-concentration induced expansion. Restrained phase transformation is also observed to some degree starting at ~700 °C.
(4)
The CTE of FCC in the temperature region below 550 °C is much lower than that above 900 °C, which is considered as the result of thermal constrain induced by the mismatch of CTE of BCC and FCC. The RA could be under a tensile hydrostatic stress state at room temperature.
(5)
The above results prove that the technique of real-time in situ neutron diffraction can be a powerful tool for heat treatment design of novel metallic materials.

Author Contributions

Conceptualization, K.A.; Investigation, D.Y.; Methodology, Y.C.; Resources, L.H.; Supervision, K.A.; Writing: original draft, D.Y.; Writing: review and editing, Y.C., L.H. and K.A.

Acknowledgments

The neutron scattering experiment was carried out at the Spallation Neutron Source (SNS), which is the U.S. Department of Energy (DOE) user facility at the Oak Ridge National Laboratory, sponsored by the Scientific User Facilities Division, Office of Basic Energy Sciences. D.Y. thanks the support of the ORNL-UTK SWC IAP program. The authors thank M.J. Frost from SNS for the technical support. L.H. would like to thank United States Steel Corporation for the permission to publish the data in this paper.

Conflicts of Interest

The authors declare no conflicts of interest.

Disclaimer

The material in this paper is intended for general information only. Any use of this material in relation to any specific application should be based on independent examination and verification of its unrestricted availability for such use and a determination of suitability for the application by professionally qualified personnel. No license under any patents or other proprietary interests is implied by the publication of this paper. Those making use of or relying upon the material assume all risks and liability arising from such use or reliance.

Notice of Copyright

This manuscript has been authored by UT-Battelle, LLC under Contract No. DE-AC05-00OR22725 with the U.S. Department of Energy. The United States Government retains and the publisher, by accepting the article for publication, acknowledges that the United States Government retains a non-exclusive, paid-up, irrevocable, worldwide license to publish or reproduce the published form of this manuscript, or allow others to do so, for United States Government purposes. The Department of Energy will provide public access to these results of federally sponsored research in accordance with the DOE Public Access Plan (http://energy.gov/downloads/doe-public-access-plan).

References

  1. De Cooman, B.C. Structure–properties relationship in TRIP steels containing carbide-free bainite. Curr. Opin. Solid State Mater. Sci. 2004, 8, 285–303. [Google Scholar] [CrossRef]
  2. Zhao, J.; Jiang, Z. Thermomechanical processing of advanced high strength steels. Prog. Mater. Sci. 2018, 94, 174–242. [Google Scholar] [CrossRef]
  3. Mahieu, J.; De Cooman, B.C.; Claessens, S. Galvanizability of high-strength steels for automotive applications. Metall. Mater. Trans. A 2001, 32, 2905–2908. [Google Scholar] [CrossRef]
  4. Mintz, B. Hot dip galvanising of transformation induced plasticity and other intercritically annealed steels. Int. Mater. Rev. 2001, 46, 169–197. [Google Scholar] [CrossRef]
  5. Choi, S.D.; Kim, H.S.; Je, J.H.; Park, S.H. Annealing behavior of retained austenite in low carbon steel: Real time synchrotron X-ray scattering study. J. Mater. Sci. Lett. 2002, 21, 353–355. [Google Scholar] [CrossRef]
  6. Babu, S.S.; Specht, E.D.; David, S.A.; Karapetrova, E.; Zschack, P.; Peet, M.; Bhadeshia, H.K.D.H. In-situ observations of lattice parameter fluctuations in austenite and transformation to bainite. Metall. Mater. Trans. A 2005, 36, 3281–3289. [Google Scholar] [CrossRef]
  7. Van Dijk, N.H.; Butt, A.M.; Zhao, L.; Sietsma, J.; Offerman, S.E.; Wright, J.P.; Van Der Zwaag, S. Thermal stability of retained austenite in TRIP steels studied by synchrotron X-ray diffraction during cooling. Acta Mater. 2005, 53, 5439–5447. [Google Scholar] [CrossRef]
  8. Xu, P.G.; Tomota, Y.; Lukáš, P.; Muránsky, O.; Adachi, Y. Austenite-to-ferrite transformation in low alloy steels during thermomechanically controlled process studied by in situ neutron diffraction. Mater. Sci. Eng. A 2006, 435–436, 46–53. [Google Scholar] [CrossRef]
  9. Jimenez-Melero, E.; Van Dijk, N.H.; Zhao, L.; Sietsma, J.; Offerman, S.E.; Wright, J.P.; Van Der Zwaag, S. Characterization of individual retained austenite grains and their stability in low-alloyed TRIP steels. Acta Mater. 2007, 55, 6713–6723. [Google Scholar] [CrossRef]
  10. Christien, F.; Telling, M.T.F.; Knight, K.S. A comparison of dilatometry and in-situ neutron diffraction in tracking bulk phase transformations in a martensitic stainless steel. Mater. Charact. 2013, 82, 50–57. [Google Scholar] [CrossRef]
  11. Allain, S.Y.P.; Geandier, G.; Hell, J.-C.; Soler, M.; Danoix, F.; Gouné, M. Effects of Q&P processing conditions on austenite carbon enrichment studied by in situ high-energy X-ray diffraction experiments. Metals 2017, 7, 232. [Google Scholar]
  12. Allain, S.Y.P.; Geandier, G.; Hell, J.C.; Soler, M.; Danoix, F.; Gouné, M. In-situ investigation of quenching and partitioning by high energy X-ray diffraction experiments. Scr. Mater. 2017, 131, 15–18. [Google Scholar] [CrossRef]
  13. Allain, S.Y.P.; Gaudez, S.; Geandier, G.; Hell, J.-C.; Gouné, M.; Danoix, F.; Soler, M.; Aoued, S.; Poulon-Quintin, A. Internal stresses and carbon enrichment in austenite of quenching and partitioning steels from high energy X-ray diffraction experiments. Mater. Sci. Eng. A 2018, 710, 245–250. [Google Scholar] [CrossRef]
  14. Liss, K.-D.; Yan, K. Thermo-mechanical processing in a synchrotron beam. Mater. Sci. Eng. A 2010, 528, 11–27. [Google Scholar] [CrossRef]
  15. Wu, W.; An, K.; Huang, L.; Lee, S.Y.; Liaw, P.K. Deformation dynamics study of a wrought magnesium alloy by real-time in situ neutron diffraction. Scr. Mater. 2013, 69, 358–361. [Google Scholar] [CrossRef]
  16. Yu, D.; Bei, H.; Chen, Y.; George, E.P.; An, K. Phase-specific deformation behavior of a relatively tough NiAl–Cr(Mo) lamellar composite. Scr. Mater. 2014, 84–85, 59–62. [Google Scholar] [CrossRef]
  17. Chen, Y.; Yu, D.; An, K. Stress-induced charge-ordering process in LiMn2O4. Mater. Res. Lett. 2017, 5, 89–94. [Google Scholar] [CrossRef]
  18. Yang, H.; Yu, D.; Chen, Y.; Mu, J.; Wang, Y.D.; An, K. In-situ TOF neutron diffraction studies of cyclic softening in superelasticity of a NiFeGaCo shape memory alloy. Mater. Sci. Eng. A 2017, 680, 324–328. [Google Scholar] [CrossRef]
  19. Wu, W.; Liaw, P.K.; An, K. Unraveling cyclic deformation mechanisms of a rolled magnesium alloy using in situ neutron diffraction. Acta Mater. 2015, 85, 343–353. [Google Scholar] [CrossRef] [Green Version]
  20. Wu, W.; An, K. Understanding low-cycle fatigue life improvement mechanisms in a pre-twinned magnesium alloy. J. Alloy Compd. 2016, 656, 539–550. [Google Scholar] [CrossRef]
  21. Wu, W.; Qiao, H.; An, K.; Guo, X.; Wu, P.; Liaw, P.K. Investigation of deformation dynamics in a wrought magnesium alloy. Int. J. Plast. 2014, 62, 105–120. [Google Scholar] [CrossRef]
  22. Lee, S.Y.; Wang, H.; Gharghouri, M.A.; Nayyeri, G.; Woo, W.; Shin, E.; Wu, P.D.; Poole, W.J.; Wu, W.; An, K. Deformation behavior of solid-solution-strengthened Mg–9 wt.% Al alloy: In situ neutron diffraction and elastic–viscoplastic self-consistent modeling. Acta Mater. 2014, 73, 139–148. [Google Scholar] [CrossRef]
  23. Cakmak, E.; Kirka, M.M.; Watkins, T.R.; Cooper, R.C.; An, K.; Choo, H.; Wu, W.; Dehoff, R.R.; Babu, S.S. Microstructural and micromechanical characterization of IN718 theta shaped specimens built with electron beam melting. Acta Mater. 2016, 108, 161–175. [Google Scholar] [CrossRef] [Green Version]
  24. Huang, E.W.; Barabash, R.I.; Wang, Y.; Clausen, B.; Li, L.; Liaw, P.K.; Ice, G.E.; Ren, Y.; Choo, H.; Pike, L.M.; et al. Plastic behavior of a nickel-based alloy under monotonic-tension and low-cycle-fatigue loading. Int. J. Plast. 2008, 24, 1440–1456. [Google Scholar] [CrossRef]
  25. Chen, Y.; Rangasamy, E.; dela Cruz, C.R.; Liang, C.; An, K. A study of suppressed formation of low-conductivity phases in doped Li7La3Zr2O12 garnets by in situ neutron diffraction. J. Mater. Chem. A 2015, 3, 22868–22876. [Google Scholar] [CrossRef]
  26. Jin, K.; Mu, S.; An, K.; Porter, W.D.; Samolyuk, G.D.; Stocks, G.M.; Bei, H. Thermophysical properties of Ni-containing single-phase concentrated solid solution alloys. Mater. Des. 2017, 117, 185–192. [Google Scholar] [CrossRef]
  27. Wang, X.-L.; An, K.; Cai, L.; Feng, Z.; Nagler, S.E.; Daniel, C.; Rhodes, K.J.; Stoica, A.D.; Skorpenske, H.D.; Liang, C.; et al. Visualizing the chemistry and structure dynamics in lithium-ion batteries by in-situ neutron diffraction. Sci. Rep. 2012, 2, 747. [Google Scholar] [CrossRef] [PubMed] [Green Version]
  28. Liu, H.; Chen, Y.; Hy, S.; An, K.; Venkatachalam, S.; Qian, D.; Zhang, M.; Meng, Y.S. Operando lithium dynamics in the Li-Rich layered oxide cathode material via neutron diffraction. Adv. Energy Mater. 2016, 6, 1502143. [Google Scholar] [CrossRef]
  29. Liu, T.; Gao, Y.; Bei, H.; An, K. In situ neutron diffraction study on tensile deformation behavior of carbon-strengthened CoCrFeMnNi high-entropy alloys at room and elevated temperatures. J. Mater. Res. 2018, 1–12. [Google Scholar] [CrossRef]
  30. Yu, D.; An, K.; Chen, X.; Bei, H. Phase-specific deformation behavior of a NiAl–Cr(Mo) lamellar composite under thermal and mechanical loads. J. Alloy Compd. 2016, 65, 481–490. [Google Scholar] [CrossRef]
  31. Benafan, O.; Noebe, R.D.; Padula II, S.A.; Gaydosh, D.J.; Lerch, B.A.; Garg, A.; Bigelow, G.S.; An, K.; Vaidyanathan, R. Temperature-dependent behavior of a polycrystalline NiTi shape memory alloy around the transformation regime. Scr. Mater. 2013, 68, 571–574. [Google Scholar] [CrossRef]
  32. Huang, S.; Gao, Y.; An, K.; Zheng, L.; Wu, W.; Teng, Z.; Liaw, P.K. Deformation mechanisms in a precipitation-strengthened ferritic superalloy revealed by in situ neutron diffraction studies at elevated temperatures. Acta Mater. 2015, 83, 137–148. [Google Scholar] [CrossRef] [Green Version]
  33. Wang, D.M.; Chen, Y.; Mu, J.; Zhu, Z.W.; Zhang, H.F.; Wang, Y.D.; An, K. An in situ neutron diffraction study of plastic deformation in a Cu46.5Zr46.5Al7 bulk metallic glass composite. Scr. Mater. 2018, 153, 118–121. [Google Scholar] [CrossRef]
  34. Chen, Y.; Yang, L.; Ren, F.; An, K. Visualizing the structural evolution of LSM/xYSZ composite cathodes for SOFC by in-situ neutron diffraction. Sci. Rep. 2014, 4, 5179. [Google Scholar] [CrossRef] [PubMed]
  35. Wu, Y.; Ma, D.; Li, Q.K.; Stoica, A.D.; Song, W.L.; Wang, H.; Liu, X.J.; Stoica, G.M.; Wang, G.Y.; An, K.; et al. Transformation-induced plasticity in bulk metallic glass composites evidenced by in-situ neutron diffraction. Acta Mater. 2017, 124, 478–488. [Google Scholar] [CrossRef]
  36. Huang, H.; Wu, Y.; He, J.; Wang, H.; Liu, X.; An, K.; Wu, W.; Lu, Z. Phase-Transformation Ductilization of Brittle High-Entropy Alloys via Metastability Engineering. Adv. Mater. 2017, 29, 1701678. [Google Scholar] [CrossRef] [PubMed]
  37. An, K.; Yuan, L.; Dial, L.; Spinelli, I.; Stoica, A.D.; Gao, Y. Neutron residual stress measurement and numerical modeling in a curved thin-walled structure by laser powder bed fusion additive manufacturing. Mater. Des. 2017, 135, 122–132. [Google Scholar] [CrossRef]
  38. Chen, Y.; Cheng, Y.; Li, J.; Feygenson, M.; Heller, W.T.; Liang, C.; An, K. Lattice-Cell Orientation Disorder in Complex Spinel Oxides. Adv. Energy Mater. 2017, 7, 1601950. [Google Scholar] [CrossRef]
  39. Yu, D.; An, K.; Chen, Y.; Chen, X. Revealing the cyclic hardening mechanism of an austenitic stainless steel by real-time in situ neutron diffraction. Scr. Mater. 2014, 89, 45–48. [Google Scholar] [CrossRef]
  40. Stoica, G.M.; Stoica, A.D.; An, K.; Ma, D.; Vogel, S.; Carpenter, J.; Wang, X.-L. Extracting grain-orientation-dependent data from in situ time-of-flight neutron diffraction. I. Inverse pole figures. J. Appl. Crystallogr. 2014, 47, 2019–2029. [Google Scholar] [CrossRef]
  41. Chen, Y.; Rangasamy, E.; Liang, C.; An, K. Origin of high Li+ conduction in doped Li7La3Zr2O12 garnets. Chem. Mater. 2015, 27, 5491–5494. [Google Scholar] [CrossRef]
  42. Cai, L.; Liu, Z.; An, K.; Liang, C. Unraveling structural evolution of LiNi0.5Mn1.5O4 by in situ neutron diffraction. J. Mater. Chem. A 2013, 1, 6908–6914. [Google Scholar] [CrossRef]
  43. Xie, Q.; Chen, Y.; Yang, P.; Zhao, Z.; Wang, Y.D.; An, K. In-situ neutron diffraction investigation on twinning/detwinning activities during tension-compression load reversal in a twinning induced plasticity steel. Scr. Mater. 2018, 150, 168–172. [Google Scholar] [CrossRef]
  44. Wu, W.; Gao, Y.; Li, N.; Parish, C.M.; Liu, W.; Liaw, P.K.; An, K. Intragranular twinning, detwinning, and twinning-like lattice reorientation in magnesium alloys. Acta Mater. 2016, 121, 15–23. [Google Scholar] [CrossRef] [Green Version]
  45. United States Steel Corporation. Transformation Induced Plasticity 780 Grades. Available online: https://www.ussteel.com/products-solutions/products/transformation-induced-plasticity-780 (accessed on 6 September 2018).
  46. Yu, D.; Huang, L.; Chen, Y.; Komolwit, P.; An, K. Real-time in situ neutron diffraction investigation of phase-specific load sharing in a cold-rolled TRIP sheet steel. JOM 2018, 70, 1576–1586. [Google Scholar] [CrossRef]
  47. An, K.; Skorpenske, H.D.; Stoica, A.D.; Ma, D.; Wang, X.-L.; Cakmak, E. First in situ lattice strains measurements under load at VULCAN. Metall. Mater. Trans. A 2011, 42, 95–99. [Google Scholar] [CrossRef]
  48. An, K. VDRIVE-Data Reduction and Interactive Visualization Software for Event Mode Neutron Diffraction; ORNL Report No. ORNL-TM-2012-621; Oak Ridge National Laboratory: Oak Ridge, TN, USA, 2012. [Google Scholar]
  49. Toby, B.H. EXPGUI, a graphical user interface for GSAS. J. Appl. Crystallogr. 2001, 34, 210–213. [Google Scholar] [CrossRef]
  50. De Meyer, M.; Vanderschueren, D.; De Blauwe, K.; De Cooman, B.C. Presented at the Characterization of Retained Austenite in TRIP Steels by X-ray Diffraction, ISS, 41st Mechanical Working and Steel Processing Conference, Baltimore, MD, USA, 24–27 October 1999; pp. 483–491.
  51. Onink, M.; Brakman, C.M.; Tichelaar, F.D.; Mittemeijer, E.J.; Van Der Zwaag, S.; Root, J.H.; Konyer, N.B. The lattice parameters of austenite and ferrite in Fe-C alloys as functions of carbon concentration and temperature. Scr. Metall. Mater. 1993, 29, 1011–1016. [Google Scholar] [CrossRef]
  52. Huang, J.; Vogel, S.C.; Poole, W.J.; Militzer, M.; Jacques, P. The study of low-temperature austenite decomposition in a Fe–C–Mn–Si steel using the neutron Bragg edge transmission technique. Acta Mater. 2007, 55, 2683–2693. [Google Scholar] [CrossRef]
  53. Lee, S.-J.; Lusk, M.T.; Lee, Y.-K. Conversional model of transformation strain to phase fraction in low alloy steels. Acta Mater. 2007, 55, 875–882. [Google Scholar] [CrossRef]
  54. Lee, S.-J.; Lee, S.; De Cooman, B.C. Mn partitioning during the intercritical annealing of ultrafine-grained 6% Mn transformation-induced plasticity steel. Scr. Mater. 2011, 64, 649–652. [Google Scholar] [CrossRef]
  55. Li, C.-M.; Sommer, F.; Mittemeijer, E.J. Characteristics of the γ→α transformation in Fe–Mn alloys. Mater. Sci. Eng. A 2002, 325, 307–319. [Google Scholar] [CrossRef]
  56. Lu, X.-G.; Selleby, M.; Sundman, B. Assessments of molar volume and thermal expansion for selected bcc, fcc and hcp metallic elements. Calphad 2005, 29, 68–89. [Google Scholar] [CrossRef]
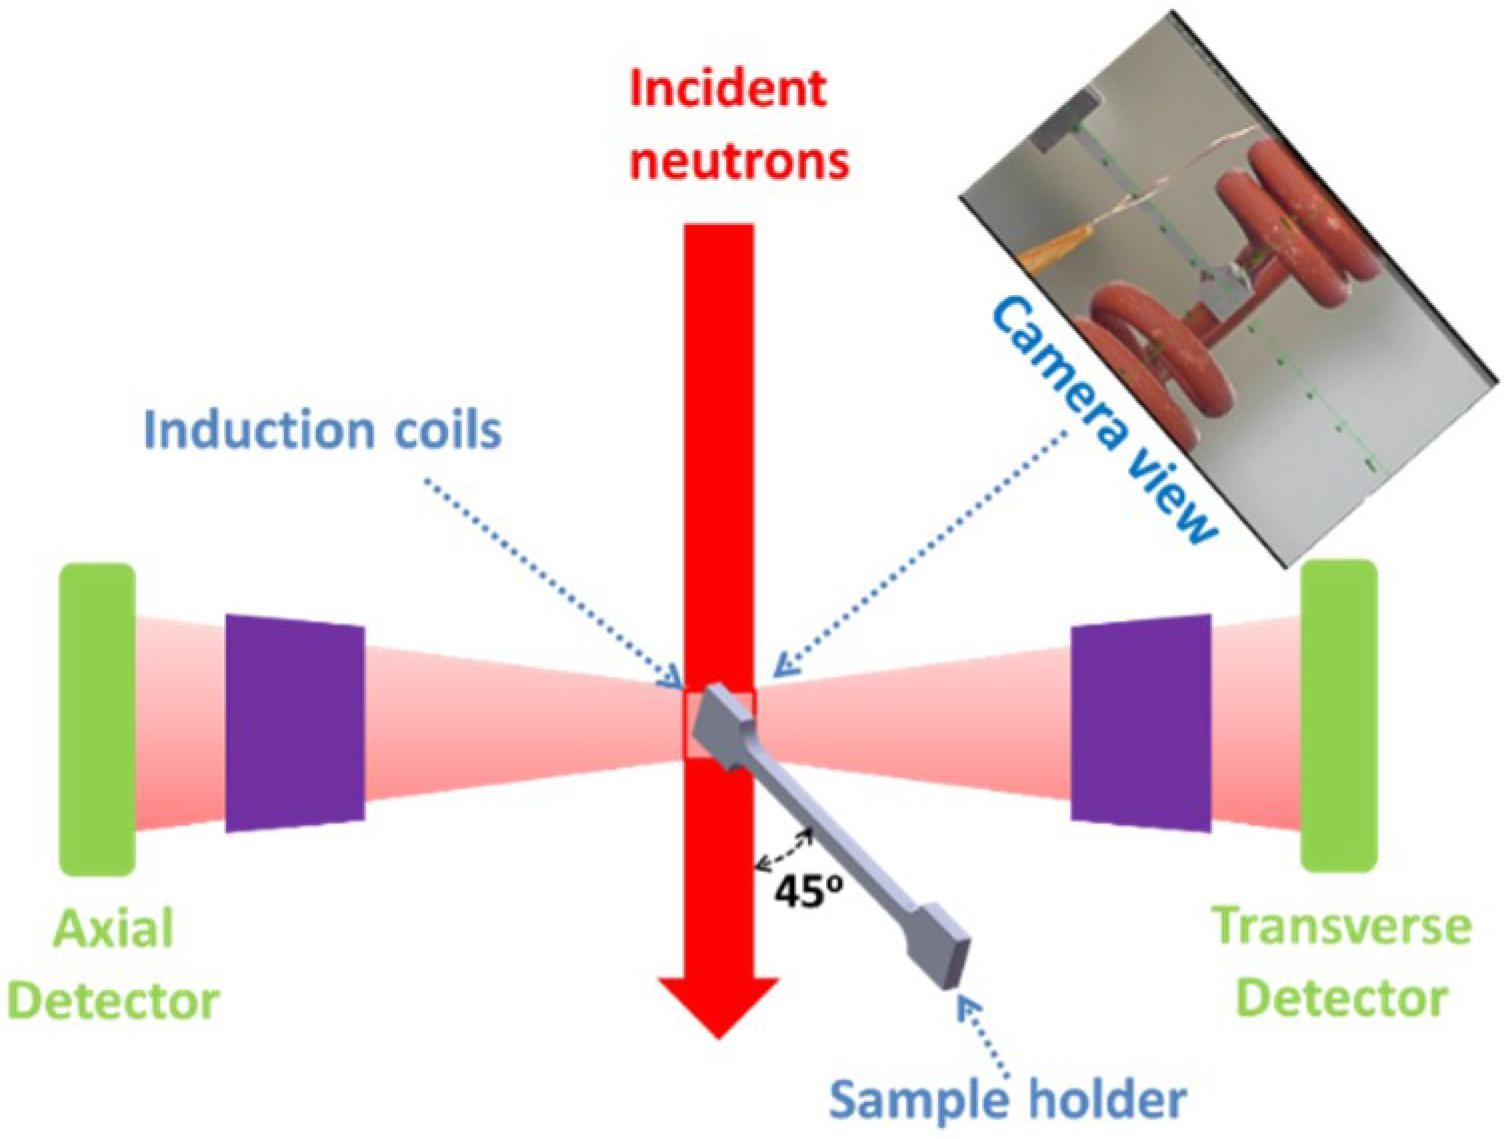
Figure 1. Schematic configuration of the real-time in situ neutron diffraction on the sample under heating by induction coils. The upper right inset shows the camera view of the heating set-up.
Crystals 08 00360 g001
Figure 2. Camera views of the specimen at different temperatures: (a) 60 °C in Cycle 1 before heating up, (b) isothermal holding at 850 °C in Cycle 1, (c) isothermal holding at 1000 °C in Cycle 2 and (d) 60 °C in Cycle 2 after cooling down. (e) Annealing profiles of two cycles.
Crystals 08 00360 g002
Figure 3. (a) Contour plots of diffraction peak intensity as a function of time/temperature (upper image: Cycle 1, lower image: Cycle 2). The color indicates the scale of intensity with purple as minimum (background) and yellow as maximum. (b) Selected 1-min diffraction patterns during annealing. (c) Examples of full-pattern Rietveld refinement via GSAS.
Crystals 08 00360 g003
Figure 4. Weight fraction evolutions of constituent phases as a function of temperature/time. The three subsets from left to right correspond to heating, isothermal holding and cooling stages, respectively.
Crystals 08 00360 g004
Figure 5. Evolution of lattice parameter as a function of temperature: (a) BCC and (b) FCC. The dash lines are the linear fittings by Equation (1) in different temperature regions: (a) L1 for 60~300 °C, L2 for 600~700 °C, and L3 for 900~1000 °C; (b) L1 for 60~300 °C, L2 for 300~60 °C, and L3 for 1000~900 °C. The reference temperature was set to 0 °C for comparison convenience.
Crystals 08 00360 g005