1. Introduction
To investigate internal stresses in materials, various non-destructive methods, including X-ray diffraction, ultrasonic scanning, and a variety of magnetic methods (based on the measurement of magnetic induction, penetrability, anisotropy, Barkhausen effect, and magnetoacoustic effects), have been used for many years. All of them, however, are of limited application. For example, X-ray scattering and magnetic methods can be only used to investigate stresses near surfaces due to their low penetration depth. Besides, the application of magnetic methods is restricted to ferromagnetic materials. In addition, magnetic and ultrasonic methods are greatly influenced by the texture in a sample. The method of mechanical stress investigations by neutron diffraction appeared about 35 years ago. Since then, it has been widely used because of a number of advantages. In contrast to traditional methods, neutrons can non-destructively penetrate into the material to a depth of up to 2–3 cm in steel and up to 5 cm in aluminum. For multiphase materials (composites, reinforced materials, ceramics, and alloys), neutrons give separate information about each phase. Internal stresses in materials cause deformation of the crystalline lattice, leading to Bragg peak shifts in the diffraction spectrum. Therefore, neutron diffraction can be used for non-destructive stress evaluation, as well as for the calibration of other non-destructive techniques.
For these reasons, experiments for residual stress studies started to occupy a noticeable position in the research programs of leading neutron centers. To conduct such experiments, specialized neutron diffractometers were developed at both steady state reactors (e.g., ILL (Grenoble, France), Chalk River (Ontario, Canada), and HZB (Berlin, Germany)) and pulsed neutron sources (e.g., Los Alamos (Santa Fe, New Mexico, USA), ISIS (Didcot, UK), and J-PARC (Ibaraki, Japan)). The strain caused by internal stresses is of the order 10–3 ÷ 10–5 and requires a quite high resolution of the diffractometer, i.e., Δd/d ≈ 0.2 ÷ 0.3%. A feature of the neutron experiment for internal stress study is the scanning of the investigated region in a bulk sample by means of a small scattering (gauge) volume, which requires a high luminosity of the diffractometer.
The original idea of using the Fourier chopper for neutron beam intensity modulation in diffraction experiments was suggested in 1969 [
1,
2], which was later realized in neutron experiments with a single crystal [
3,
4]. These attempts were rather unsuccessful due to the insufficient accuracy and stability of the chopper rotation. In 1975, a new correlation method for detecting scattered neutrons, reverse time-of-flight (RTOF), was proposed [
5] and successfully realized on the first RTOF Fourier diffractometer ASTACUS [
6] at the FiR-1 250 kW TRIGA-reactor in the VTT Technical Research Centre (Espoo, Finland). This achievement stimulated the construction of two more Fourier diffractometers at steady state reactors: mini-SFINKS for structural investigations in PNPI (Gatchina, Russia) [
7] and FSS for residual stress studies in GKSS (Geesthacht, Germany) [
8,
9].
In 1994, the RTOF method was successfully applied on a long-pulse neutron source, the IBR-2 pulsed reactor in FLNP JINR [
10], where a high resolution Fourier diffractometer HRFD for structural studies of polycrystalline materials was designed and constructed [
11,
12]. Soon afterwards, the first stress experiments by the RTOF diffraction method were performed on an HRFD diffractometer [
13,
14,
15,
16]. It was shown that the RTOF technique is a unique method possessing a sufficient resolution and luminosity for the precise determination of residual strain from relative shifts of the diffraction peak, as well as for the reliable detection of peak broadening with subsequent microstrain calculation. This work experience made it possible to construct a specialized neutron stress diffractometer, the FSD (Fourier Stress Diffractometer), optimized for residual stress studies [
17]. During the last years, a great number of experiments have been performed on the IBR-2 reactor in order to approve the method and to define the potential application domain.
2. Residual Stress Measurements by Neutron Diffraction
The diffraction of thermal neutrons is one of the most informative methods when solving actual problems in the field of engineering and materials science, and it has a number of significant advantages compared to other techniques. The main advantages of the method are deep scanning of the material under study (up to 2 cm for steel) due to the high penetration power of the neutrons, the non-destructive character of the method, the good spatial resolution (up to 1 mm in any dimension), the determination of stress distributions for each component of the multiphase material separately (composites, ceramics, alloys, etc.), and the possibility to study materials’ microstructure and defects (microstrain, crystallite size, dislocation density, etc.). In combination with the TOF (time-of-flight) technique at pulsed neutron sources, this method allows researchers to record complete diffraction patterns in a wide range of interplanar spacing at a fixed scattering angle and to analyze polycrystalline materials with complex structures. In addition, with TOF neutron diffraction, it is possible to determine lattice strains along different [hkl] directions simultaneously, i.e., to investigate the mechanical anisotropy of crystalline materials on a microscopic scale.
The neutron diffraction method is very similar to the X-ray technique. However, in contrast to the characteristic X-ray radiation, the energy spectrum of thermal neutrons has a continuous (Maxwellian distribution) character. The velocities of thermal neutrons are rather small and this gives the opportunity to analyze the energy of neutrons using their flight time during experiments at a pulsed neutron source. Depending on the neutron wavelength, the peak position on the TOF scale is defined by the condition
where
C = 2
mn/
h,
mn is the neutron mass,
h is Planck’s constant,
L is the total flight distance from a neutron source to the detector,
v is the neutron velocity,
λ is the neutron wavelength,
dhkl is the interplanar spacing, and
θ is the Bragg angle.
Internal stresses existing in a material cause corresponding lattice strains, which, in turn, result in shifts of Bragg peaks in the diffraction spectrum. This yields direct information on changes in interplanar spacing in a gauge volume, which can be easily transformed into data on internal stresses, using known elastic constants (Young’s modulus) of a material. The principle of the determination of the lattice strain is based on Bragg’s law:
On a two-axis constant wavelength diffractometer at a neutron source with continuous flux, the strain is determined by the change in the scattering angle:
When using the TOF method at a pulsed source, the lattice strain is determined by the relative change in the neutron time-of-flight Δ
t/
t:
where
dhkl is the measured interplanar spacing and is the same interplanar spacing in a stress-free material, and
t is the neutron time-of-flight.
The components of the residual stress tensor can be determined from the measured residual strain according to Hooke’s law:
where
ii =
X,
Y,
Z;
σii and
εii are components of the stress and strain tensors, respectively;
E is Young’s modulus; and
ν is Poisson’s ratio.
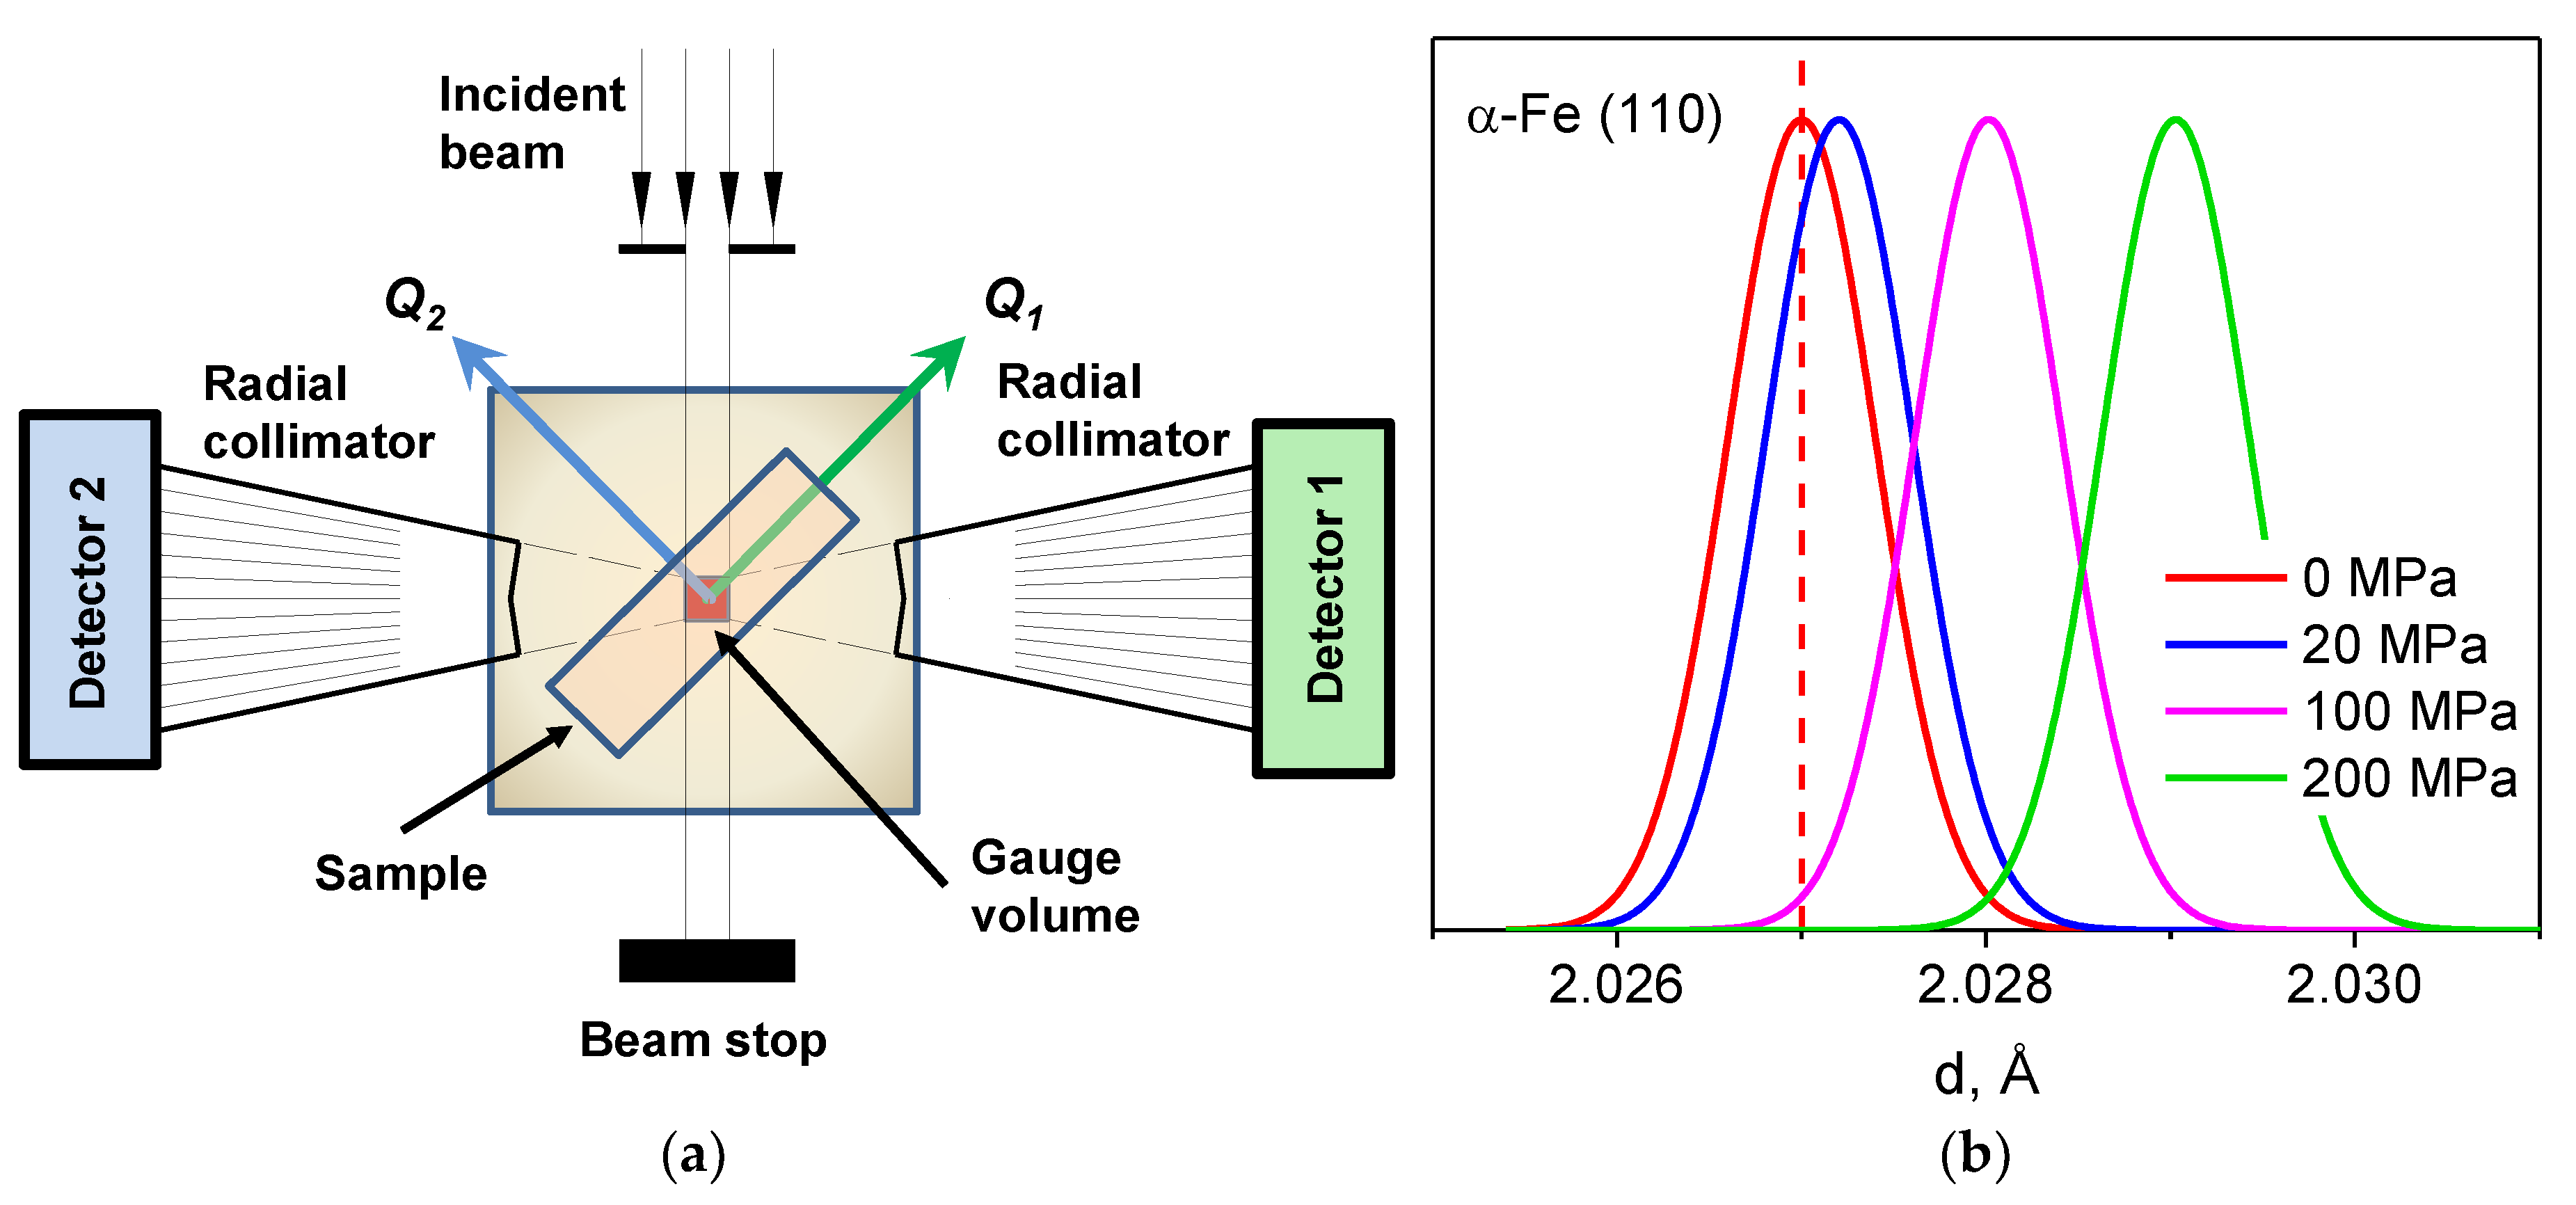
The essence of the diffraction method for studying stresses is rather simple and, in a conventional layout of the experiment, consists of incident and scattered neutron beam shaping using diaphragms and/or radial collimators and the definition of a small gauge volume in the bulk of the specimen (
Figure 1) [
18]. The incident beam is usually formed using diaphragms with typical sizes from 1–2 mm to several cm, depending on the purpose of the experiment. To define a gauge volume of an optimum shape in the studied specimen, at the scattered beam, radial collimators with many (about several tens) vertical slits formed by Mylar films with gadolinium oxide coating are often used. A radial collimator is placed at a quite large fixed distance (usually 150 ÷ 450 mm) from the specimen and provides a good spatial resolution of the level of 1–2 mm along the incident neutron beam direction. The lattice strain is measured in the direction parallel to the neutron scattering vector
Q. The sample region under study is scanned using the gauge volume by moving the sample in the required directions. In this case, relative shifts of diffraction peaks from the positions defined by unit cell parameters of an unstrained material are measured.
Based on known values of the Young’s modulus, the required interplanar spacing measurement accuracy can be estimated, so that the σ determination error does not exceed, e.g., 20 MPa, which is, as a rule, quite sufficient for engineering calculations. For aluminum,
E ≈ 70 GPa, hence, it is sufficient to measure Δ
a/
a0 with an accuracy of 3 × 10
–4; for steel,
E ≈ 200 GPa, and the accuracy should be better than 1 × 10
–4. These requirements appreciably exceed the capability of conventional neutron diffractometers with a typical resolution level of ~1–2%. Thus, for residual stresses studies, a diffractometer with an order of magnitude better resolution is needed. Existing practice has shown that a required accuracy can be achieved for diffractometers with monochromatic neutron beams, operating at stationary reactors, and for TOF diffractometers operating at pulsed neutron sources [
19]. Without going into the details of experiments in these two cases, it should be noted that a main advantage of a constant wavelength instrument is a higher luminosity and, hence, the possibility of sample scanning with a good spatial resolution. In the case of a TOF instrument, a fixed and most optimal 90° experimental geometry is easily implemented and, in contrast to the former case, several diffraction peaks are simultaneously measured, which allows the analysis of strain anisotropy.
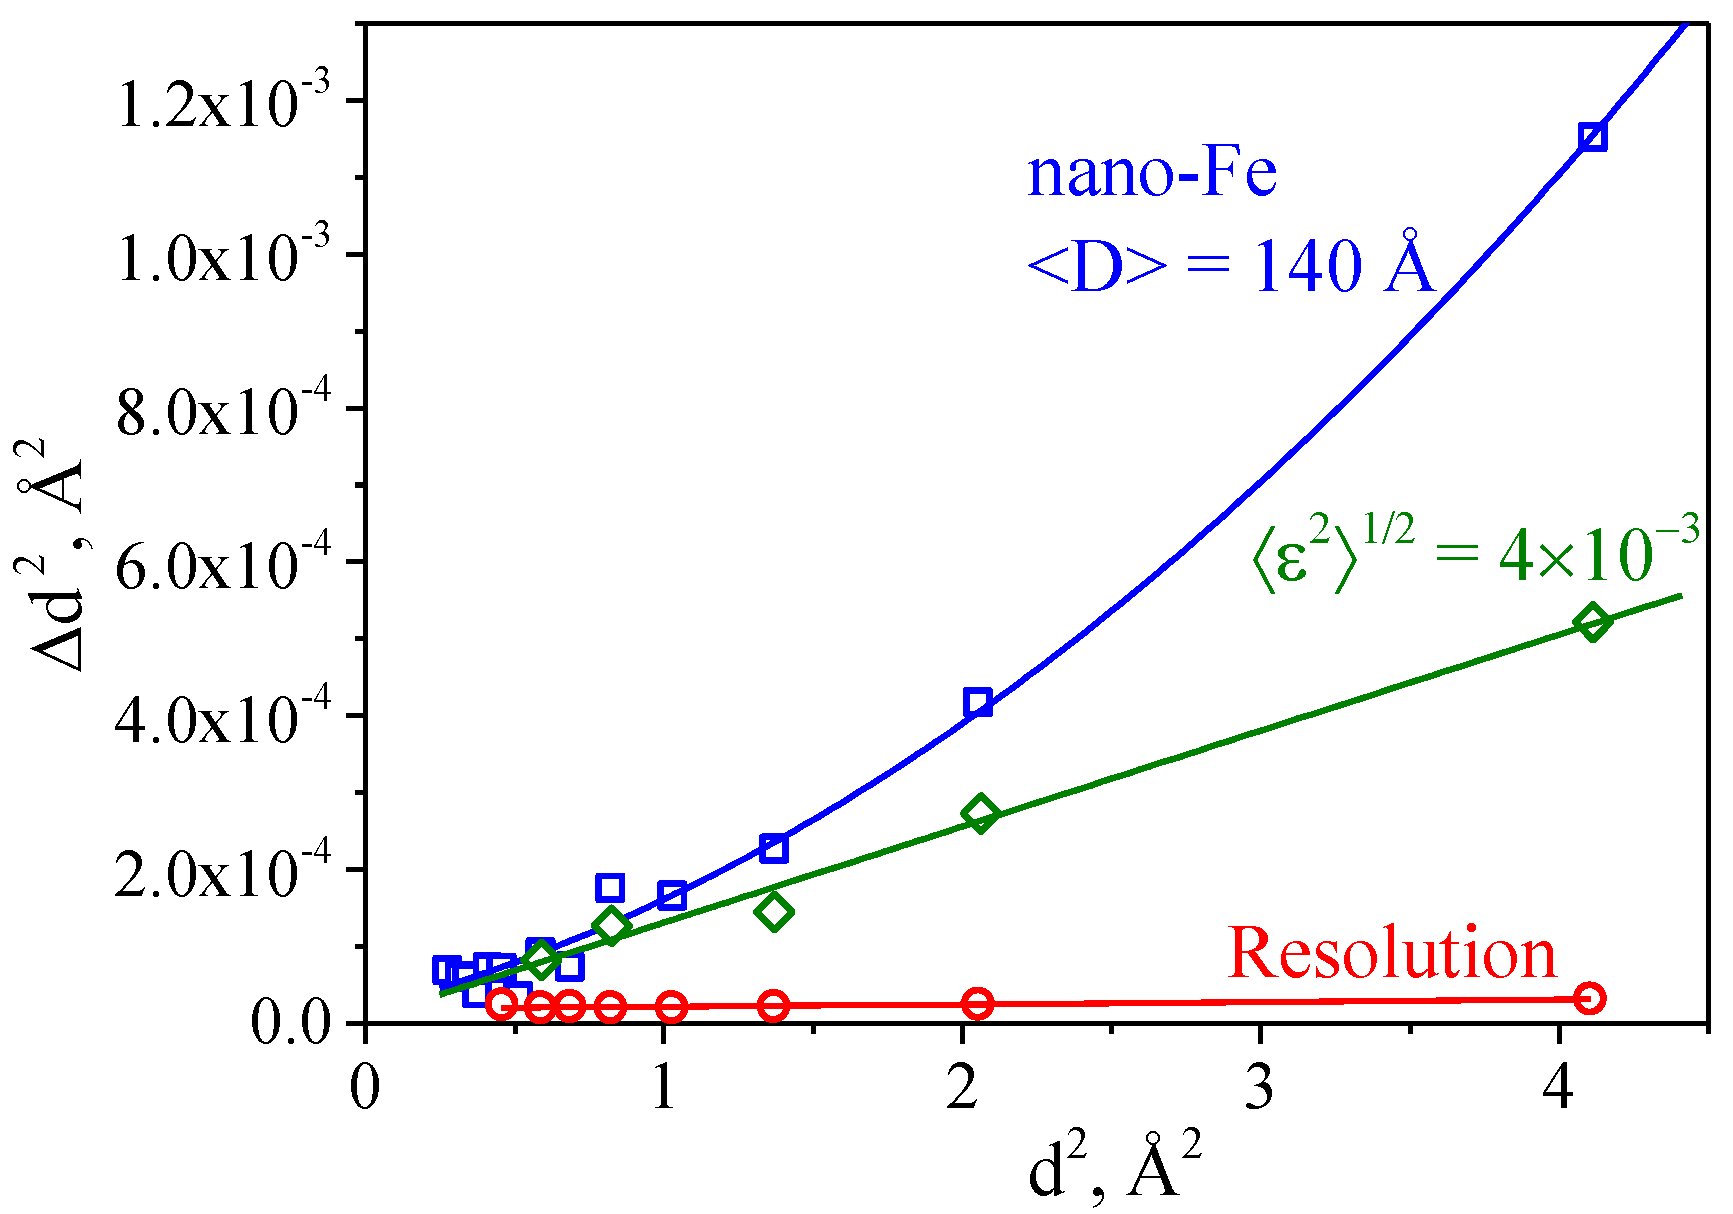
An important possibility for microstructure investigation is an analysis of the width and shape of a diffraction peak, which can provide data on crystal lattice microstrain and crystallite size [
20]. TOF diffractometers at pulsed sources have a good potential for materials’ microstructure characterization due to the simplicity of the functional relationship between the instrument resolution
R(
d) and the interplanar spacing
dhkl, which is almost independent of
dhkl within a fairly wide range. In addition, TOF instruments exhibit a rather wide range of interplanar spacing and, consequently, possess a large number of simultaneously observed diffraction peaks with the almost similar contribution of the resolution function to their widths. This enables one to estimate lattice microstrain and the size of coherently scattering domains (crystallites) from diffraction peak widths in a rather simple way [
21,
22] (
Figure 2):
where
W is the peak width,
C1 and
C2 are the constants defining the diffractometer resolution function and known from measurements with a reference sample,
C3 = 〈
ε2〉 = (Δ
a/a)
2 is the unit cell parameter dispersion (microstrain), and
C4 ~ 1/〈
D〉
2 is the constant related to the crystallite size.
The resolution of the neutron TOF diffractometer in a first approximation is defined by three terms,
where Δ
t0 is the neutron pulse width,
t = C
Lsin
θdhkl is the total time-of-flight (μs), and
L is the neutron source–detector distance (m). The first term is the time-of-flight uncertainty, the second term includes all geometrical uncertainties associated with scattering at various angles, and the third term is the uncertainty in the flight path length. The resolution will improve as the Bragg angle approaches 90°, as the pulse width decreases, and as the flight distance increases. For neutron sources with a short pulse, the thermal neutron pulse width can be decreased to ~20 μs/Å; as the flight path length increases to 100 m, the resolution can be improved to 0.001 and, if required, to 0.0005.
For neutron sources with long pulses, e.g., the IBR-2 pulsed reactor, such a way to achieve a high resolution is a priori unacceptable; the only practical way is to use the RTOF method in combination with a Fourier chopper [
10], which provides a higher luminosity of experiments in comparison with other correlation techniques. In the RTOF method [
23], the spectrum acquisition is performed with continuous variation of the rotation frequency of the Fourier chopper from zero to a certain maximal value
Ωmax. The modulation frequency of the neutron beam ω is defined by the rotational speed of the Fourier chopper
Ω and by the number of slits transparent for thermal neutrons
NS in the rotor disk:
ω =
ΩNS. In this case, the time component of the resolution function is defined by the resolution function of the Fourier chopper
RC, which depends on a particular frequency distribution
g(
ω) and can be written as
where
ωmax =
ΩmaxNS is the maximum frequency of neutron beam intensity modulation. With a reasonable choice of
g(
ω), the effective neutron pulse width is defined by the maximum modulation frequency: ∆
t0 ≈ 1/
ωmax. For standard FSD parameters
NS = 1024,
Ωmax = 6000 rpm, and
ωmax = 102.4 kHz, the effective neutron pulse width is reduced to ∆
t0 ≈ 10 μs. This means that even at a chopper–detector flight distance of ~6.6 m and scattering angle of 2
θ = 90°, the contribution of the time component to the resolution function can be ∆
t0/t ≈ 2 × 10
–3 at
d = 2 Å [
24].
When using thin detectors, the term ΔL/L in Equation (7) becomes negligible, and the geometrical contribution can be optimized based on the desirable relation between resolution and intensity. A typical solution is the choice of focusing geometry in the arrangement of detector elements, with parameters providing a geometrical contribution equal to the time contribution to the complete resolution function. To increase the luminosity of the TOF diffractometer and decrease the background level, the primary neutron beam is formed using a curved mirror neutron guide. In this case, the neutron spectrum is cut off from the side of short wavelengths due to the neutron guide curvature radius chosen from the condition of the absence of line-of-sight of the neutron moderator. A calculation shows that, at a total flight path length from the source to the sample of ~20 m and a horizontal cross section of the neutron guide of ≤1 cm, the curvature radius can be sufficiently large to pass neutrons up to λ ≈ 1 Å. In this case, the number of simultaneously observed diffraction peaks, even for materials with small unit cell sizes (steel, aluminum), is about ten, which is sufficient to analyze strain/stress anisotropy. Furthermore, a sample place should be specially organized on the stress diffractometer, i.e., the possibility of installing large and heavy equipment (goniometers, loading machines, etc.).
3. FSD Diffractometer at the IBR-2 Pulsed Reactor
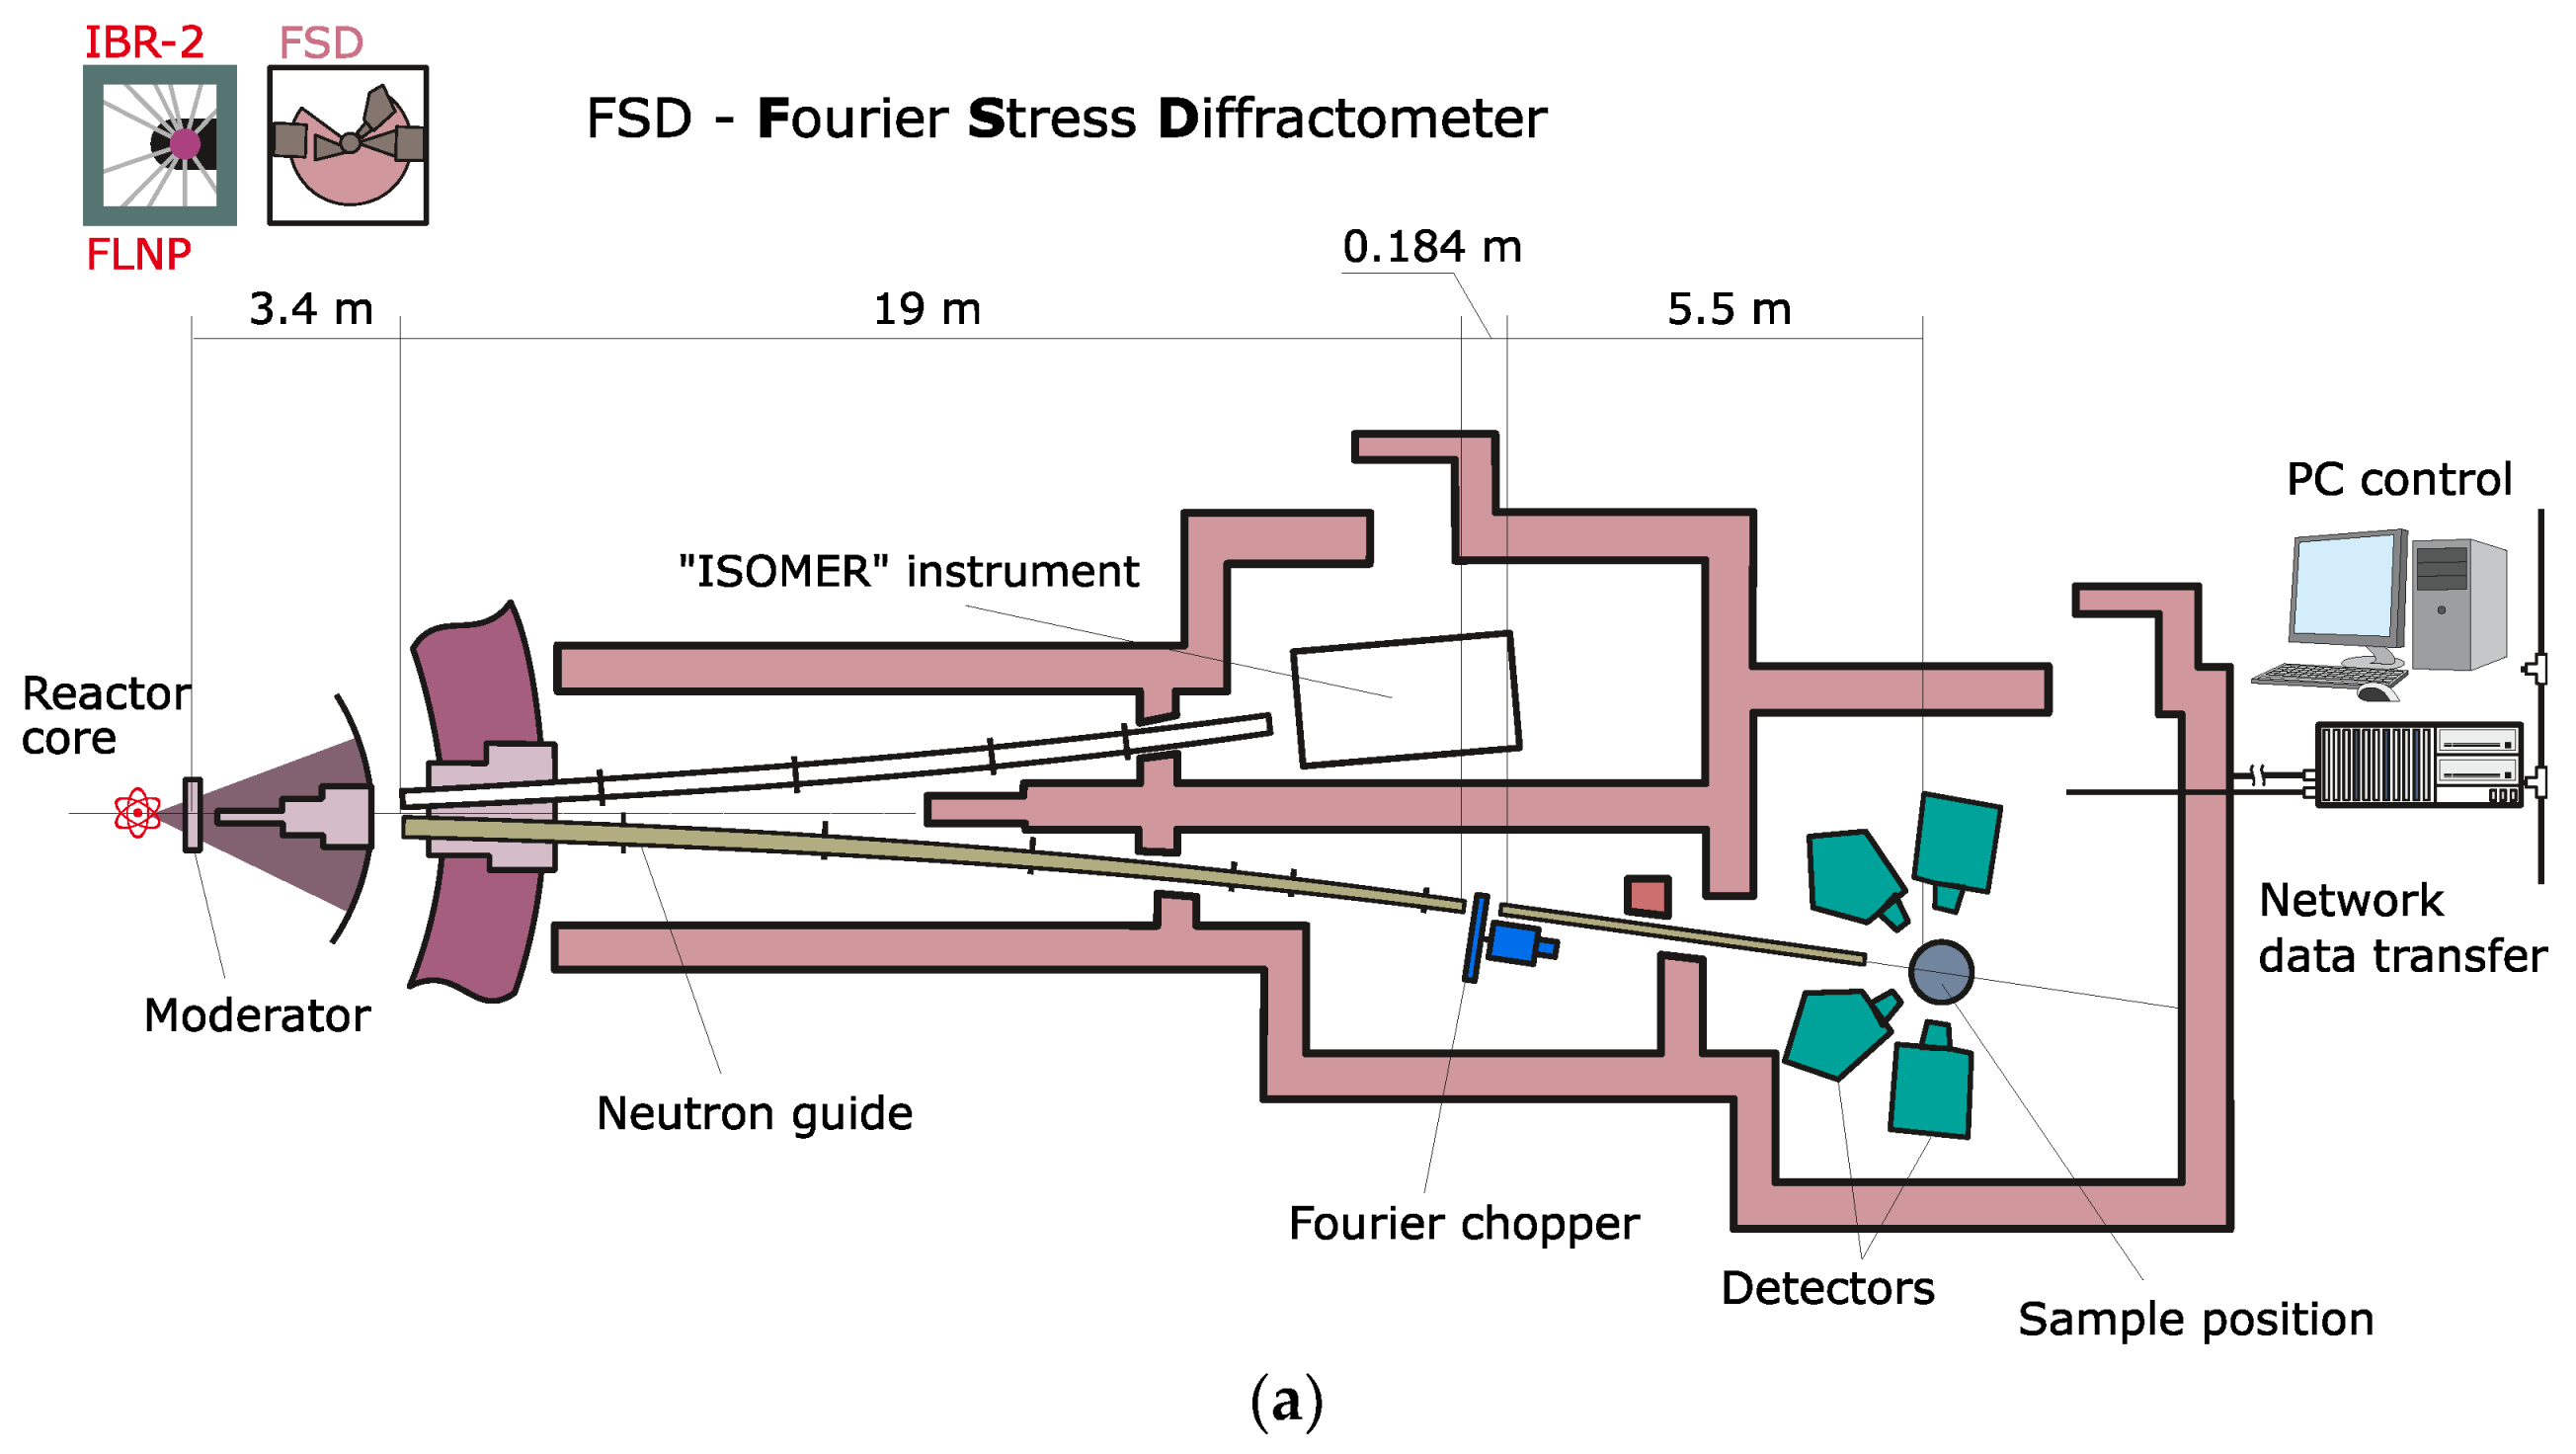
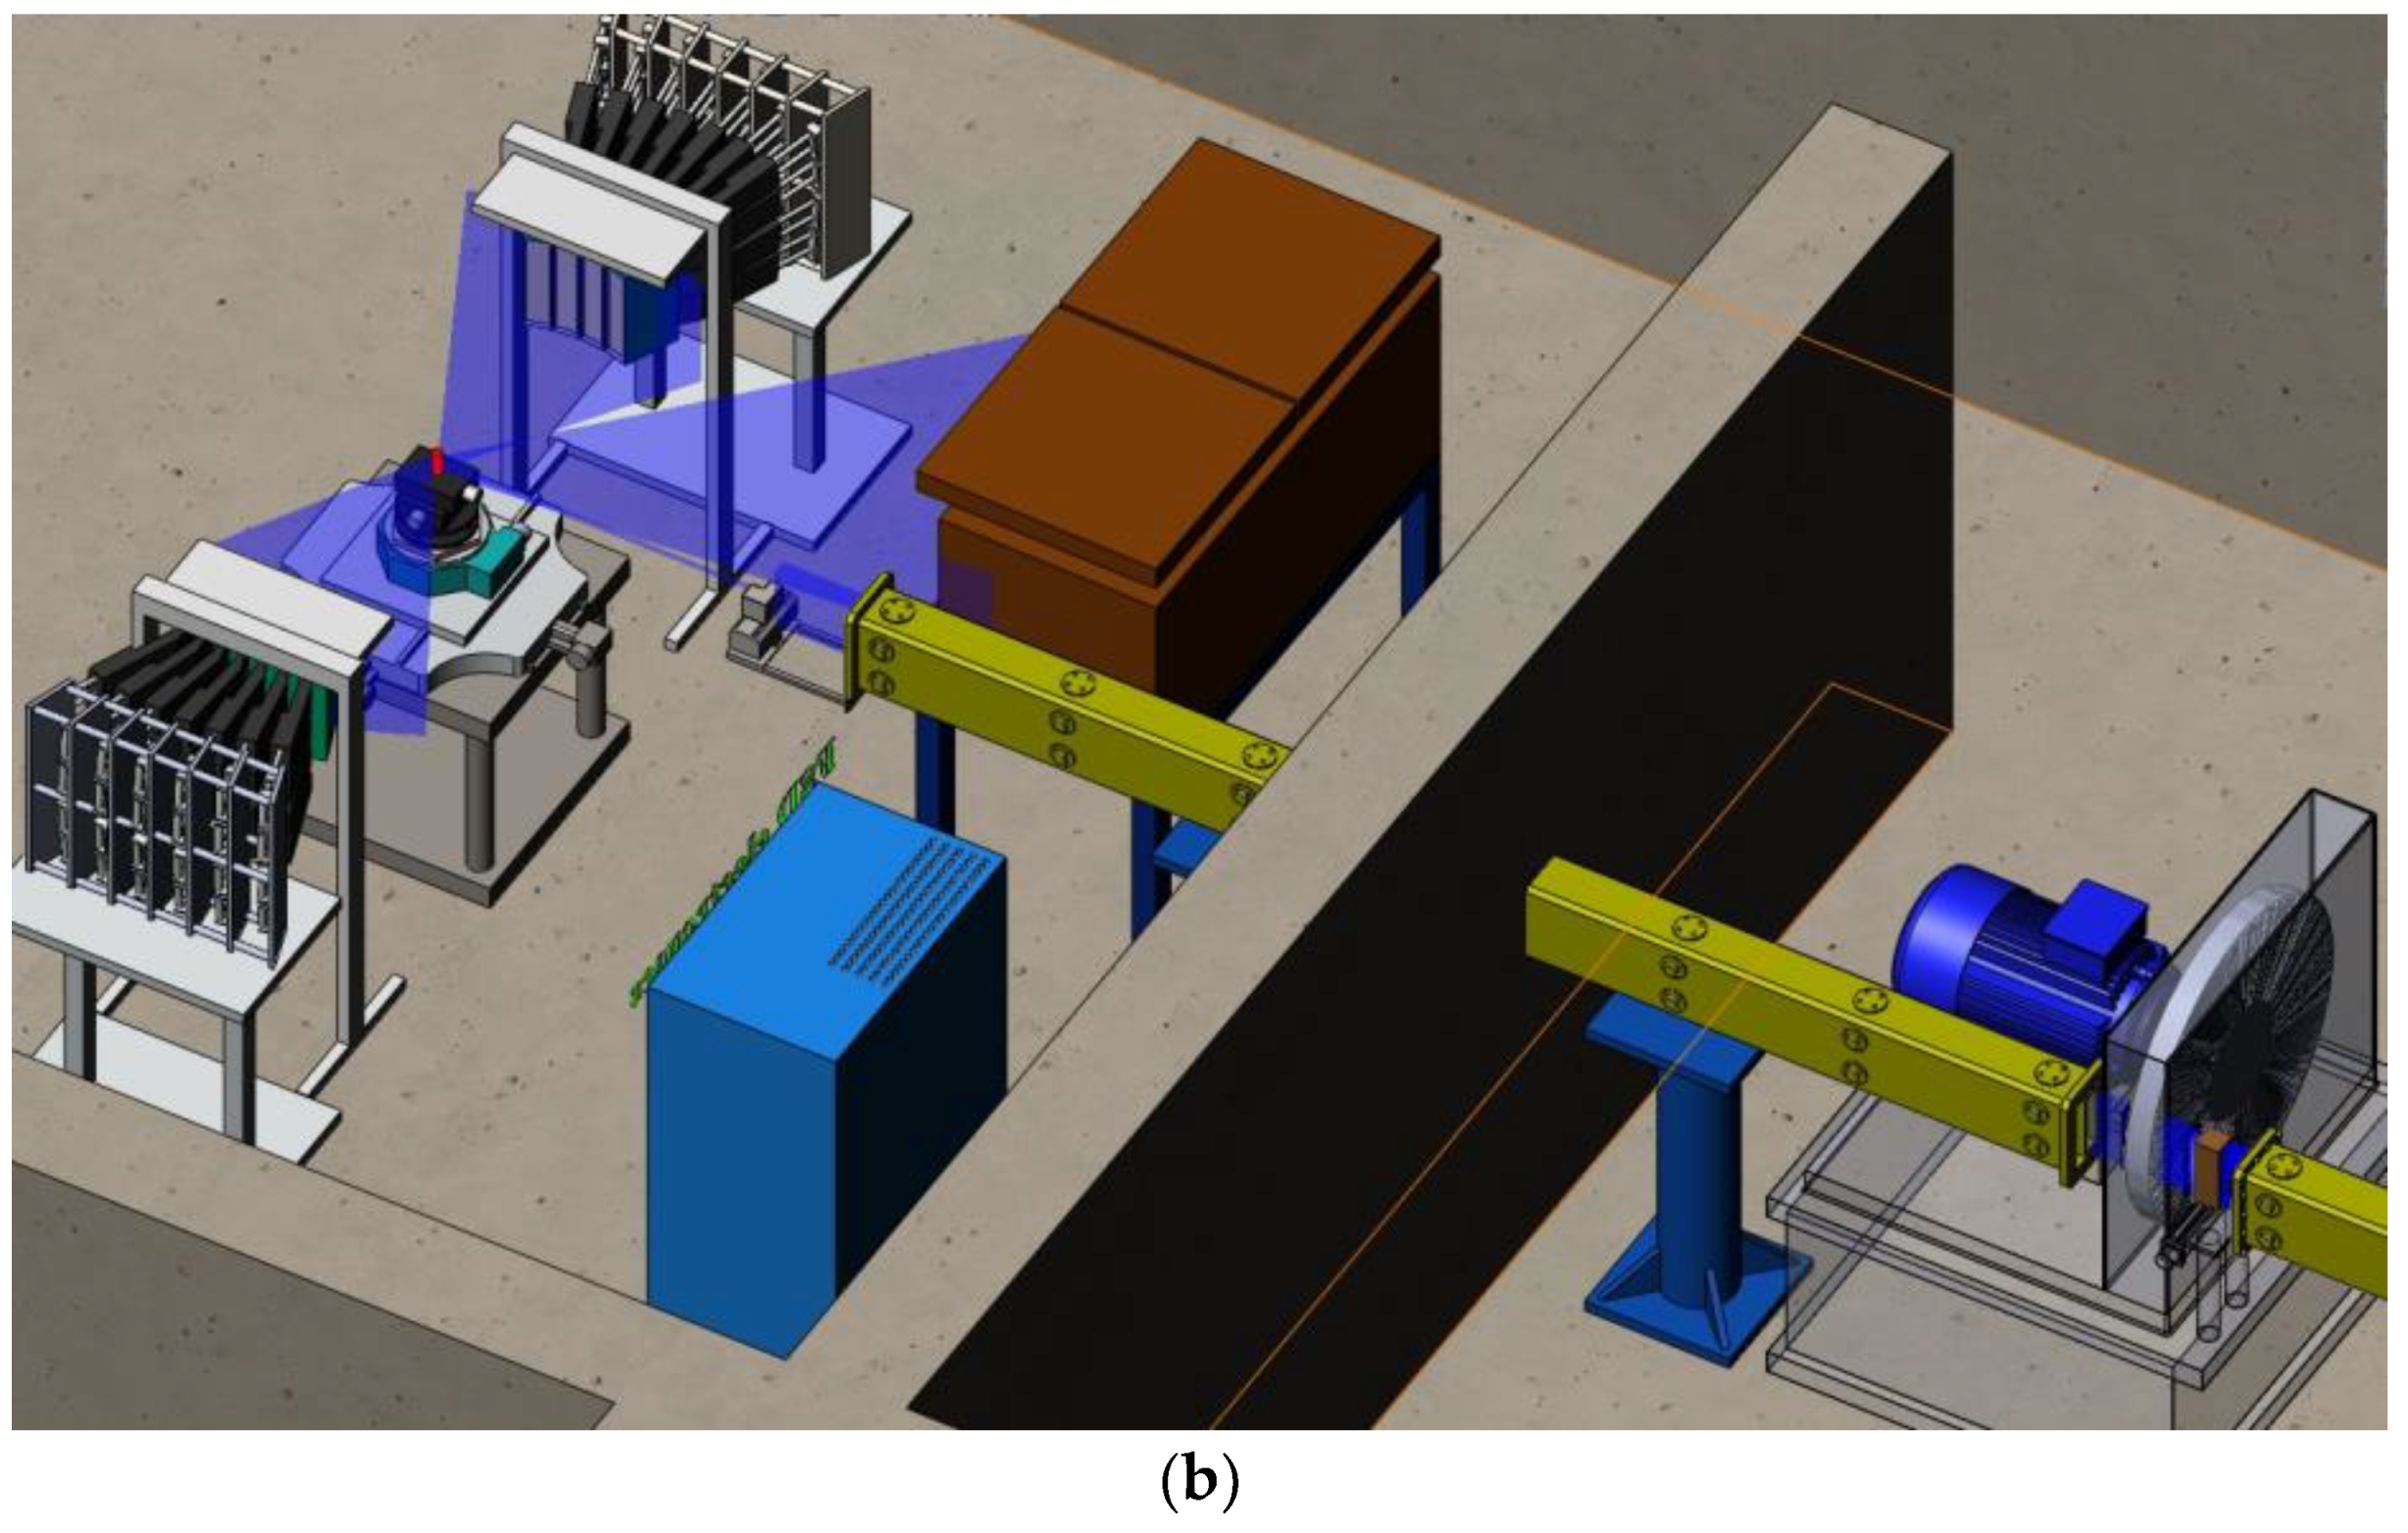
The basic functional units of the FSD diffractometer are the neutron source IBR-2 reactor with comb-like water moderator-generating thermal neutron pulses of ~340 μs with a frequency of 5 Hz; the curved mirror neutron guide eliminating fast neutrons and γ-rays from the neutron beam; the fast Fourier chopper providing neutron beam intensity modulation; the straight mirror neutron guide shaping the thermal neutron beam on the sample; the detector system consisting of detectors at scattering angles of ±90° and a backscattering detector; a heavy-load capacity goniometer, a diaphragm setting primary beam divergence, and radial collimators defining a gauge volume in the sample; and data acquisition electronics including an RTOF analyzer (
Figure 3) [
25]. The FSD diffractometer automation system [
26] allows local or remote control of the experiment.
Mirror neutron guide. The neutron beam on the sample is formed by the mirror neutron guide made of high-quality borated (14% boron) K8 glass that is 19 mm thick with a Ni coating (m = 1). The neutron guide consists of two parts: one is 19 m long and bent with a curvature radius of R = 2864.8 m; the other is straight and 5.01 m long. The neutron guide is cone-shaped in the vertical plane with cross sections of 10 × 155 mm2 at the curved part input, 10 × 91.8 mm2 at the curved part output and at the straight part input, and 10 × 75 mm2 at the straight part output. At the Fourier chopper removed from the beam, the total thermal neutron flux at the sample position is 1.8 × 10⁶ neutron/cm2⋅sec; it decreases to 3.7 × 10⁵ neutron/cm2⋅sec due to a finite transmittance of the Fourier chopper.
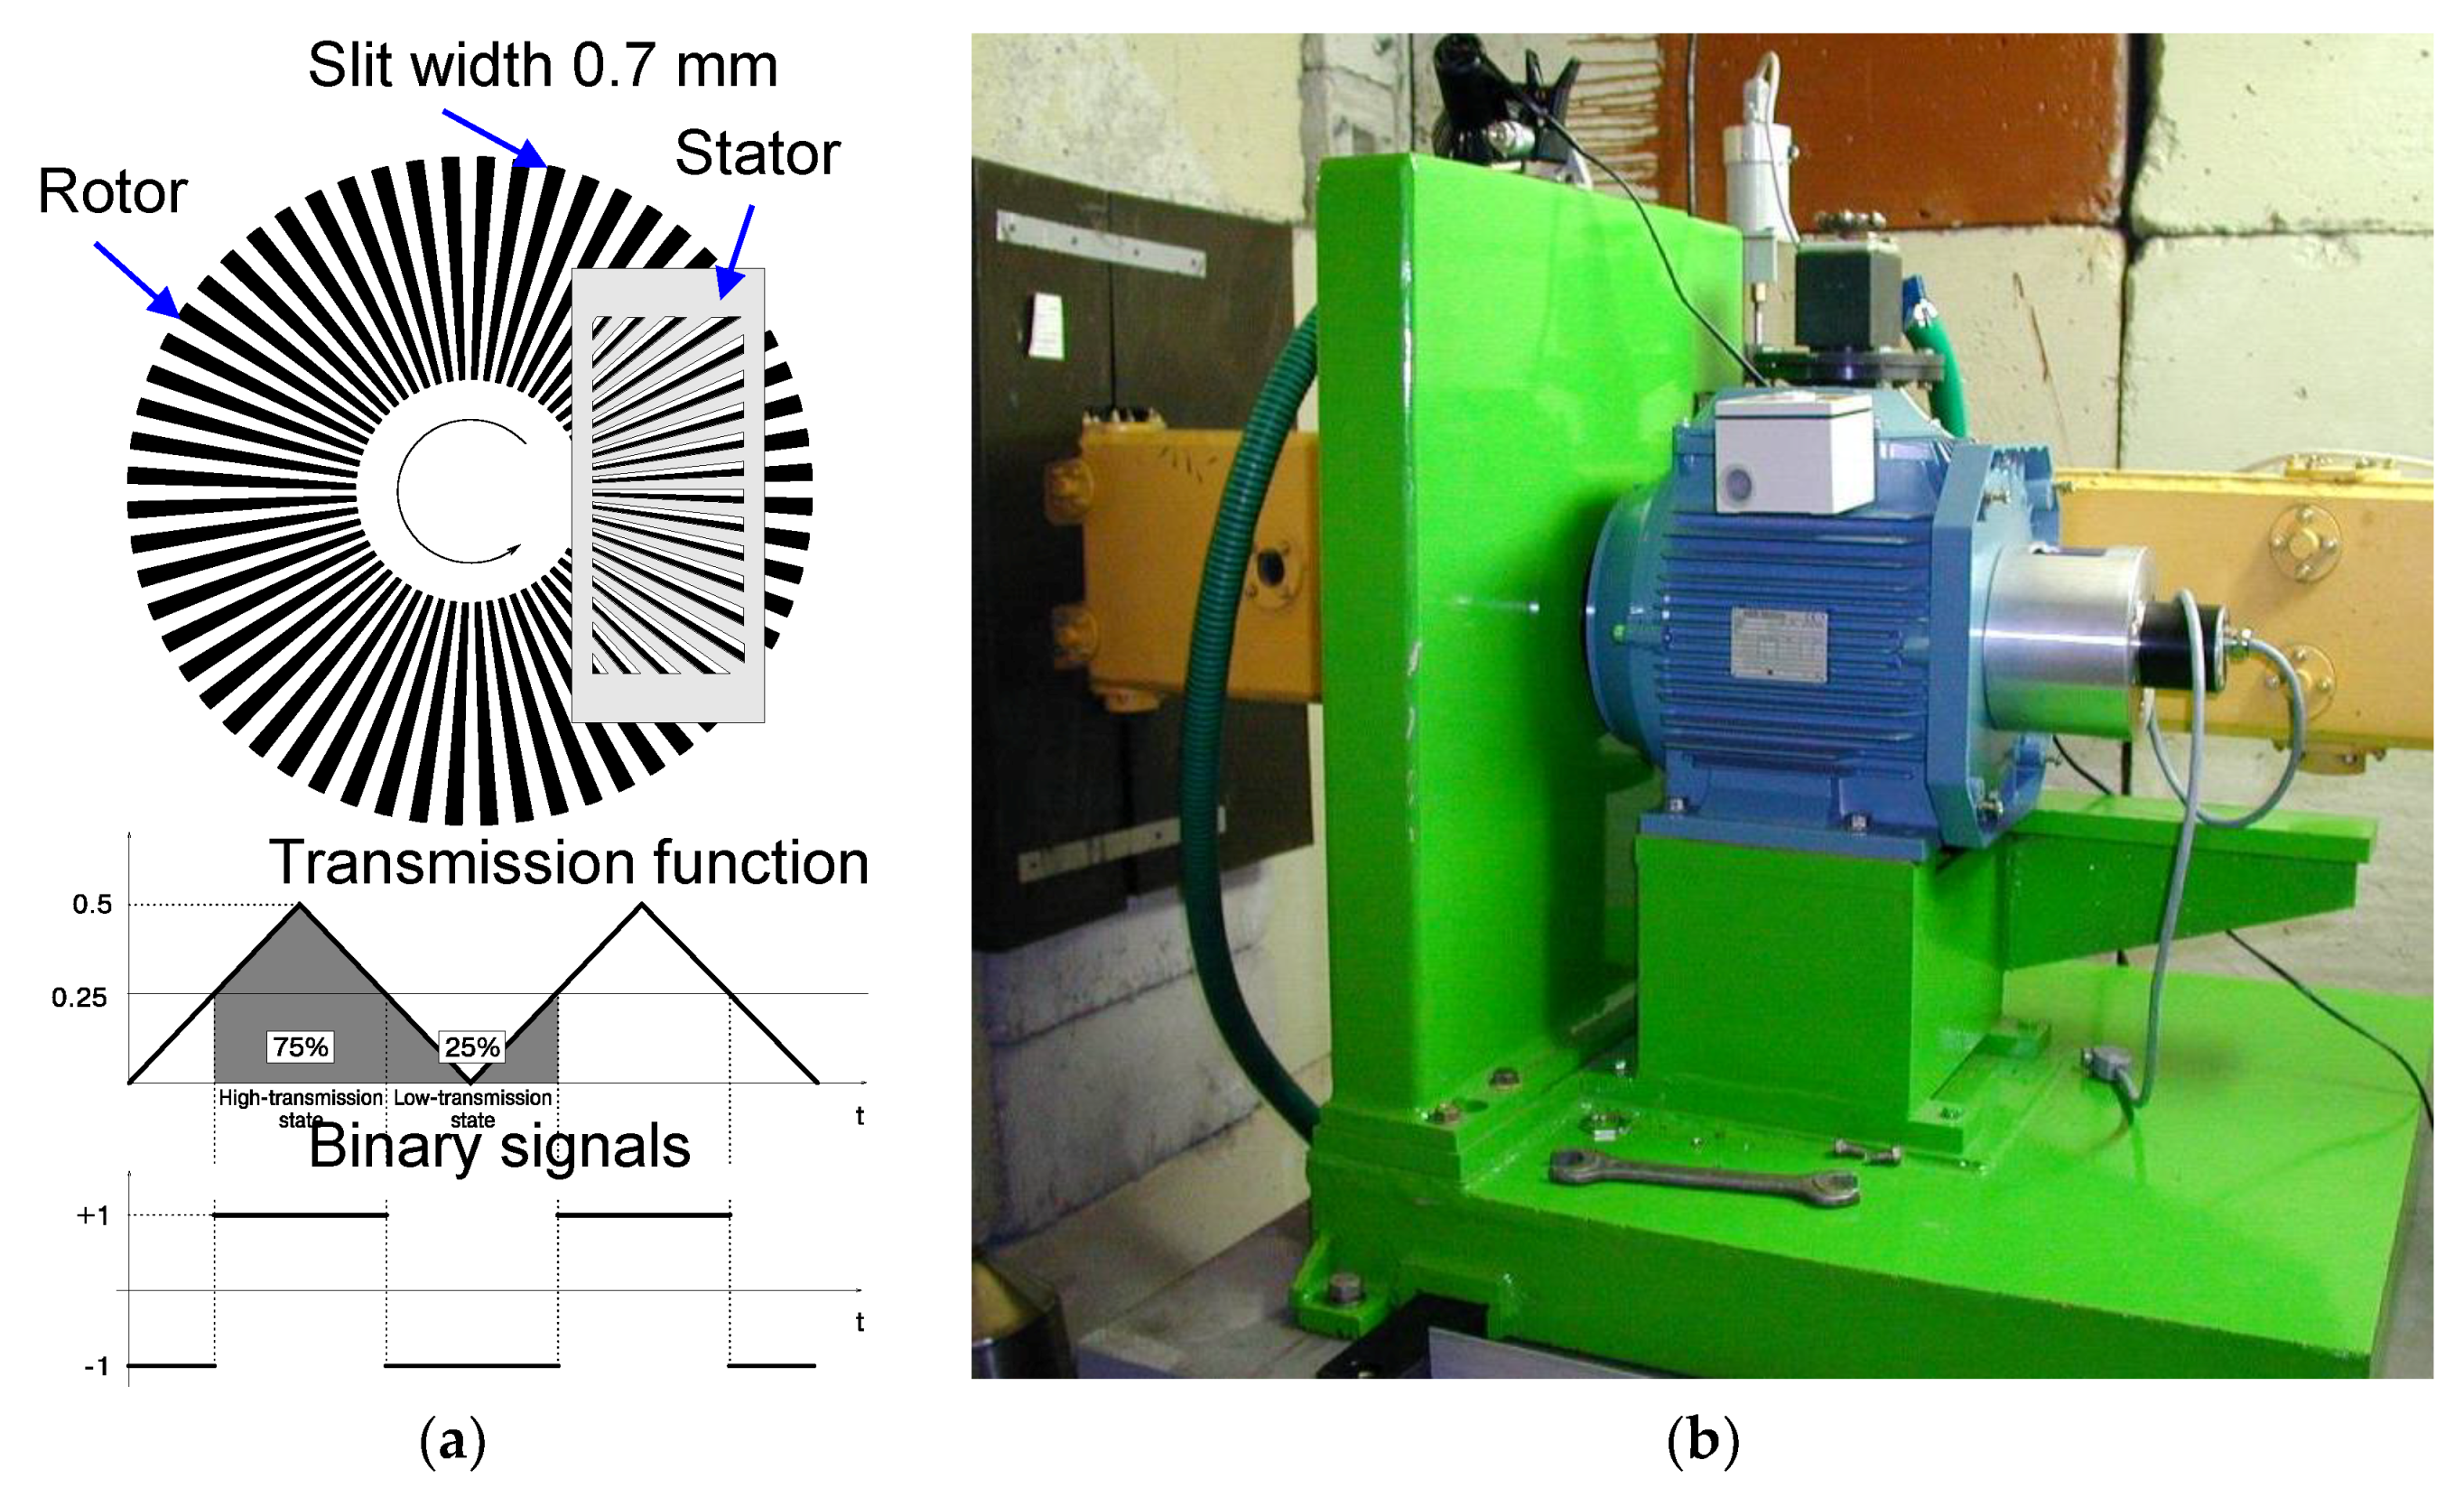
Fourier chopper. The Fourier chopper consists of a rotor disk that is 540 mm in diameter, installed on the motor axis, and a stator plate fixed on the stage (
Figure 4a). The disk and plate are made of high-strength aluminum alloy. At the disk periphery, on the radius of 229 mm, there are 1024 radial slits 60 mm long and 0.7026 mm wide, filled with a Gd
2O
3 layer of a 0.8 mm thickness. Similar slits are made on the stator plate. The chopper is rotated by an M2AA 132SB-2 asynchronous bipolar motor (ABB Motors, Karlstad, Sweden) with a power of 7.5 kW. An incremental optical encoder TEKEL TK560 (Italsensor s.r.l., Pinerolo, Italy) with 1024 native pulses per revolution is fixed on the motor axis for measuring the disk velocity and for generating a pickup signal coming to the RTOF analyzer (
Figure 4b). The motor is supplied by a VECTOR VBE750 control drive (Control Techniques, Telford, UK) with a built-in microcomputer, which receives information about the disk velocity and acceleration.
Detector system. In developing the detector system for the stress diffractometer, two mutually exclusive requirements should be satisfied: the solid angle of the detector system should be large enough to acquire statistics from a small sample volume for a reasonable exposition time; and the contribution of the detector system to the geometrical component of the resolution function should not exceed the time component to retain the high resolution of the instrument. There are two well-known versions of such a type of detector used on TOF diffractometers: position-sensitive systems and detectors with geometrical TOF focusing during diffraction [
27]. However, the need to use the correlation principle of data recording in Fourier diffractometry almost excludes the possibility of using the position detector in this method. On the contrary, as for TOF focusing, it is successfully used on all operating Fourier diffractometers. A disadvantage of this method is a significant disproportion of the effective solid angle of the detector with its actual geometrical sizes. Progress in the development of relatively low-cost correlation electronics based on digital signal processors made it possible to propose a new principle of the development of the FSD detector system, namely, the multi-element detector with combined electronic and geometrical focusing [
28]. The schematic representation of such a detector, called the ASTRA, is shown in
Figure 5. Each detector element is a counter based on an ZnS(Ag) scintillation screen with a sensitive layer thickness of 0.42 mm and several hundred square centimeters in area. The scintillation screen consists of a powder mixture of
6LiF crystals (nuclear active additive) and ZnS(Ag) (scintillator) fixed in a Plexiglas optical matrix. The screen flexibility allows an approximation of the TOF focusing surface by conical surface segments with the required accuracy. Such an approximation method excludes dead areas on the sensitive layer and increases the quality of geometrical focusing. The detector efficiency is mostly defined by the
6Li concentration in the screen and is ~60%.
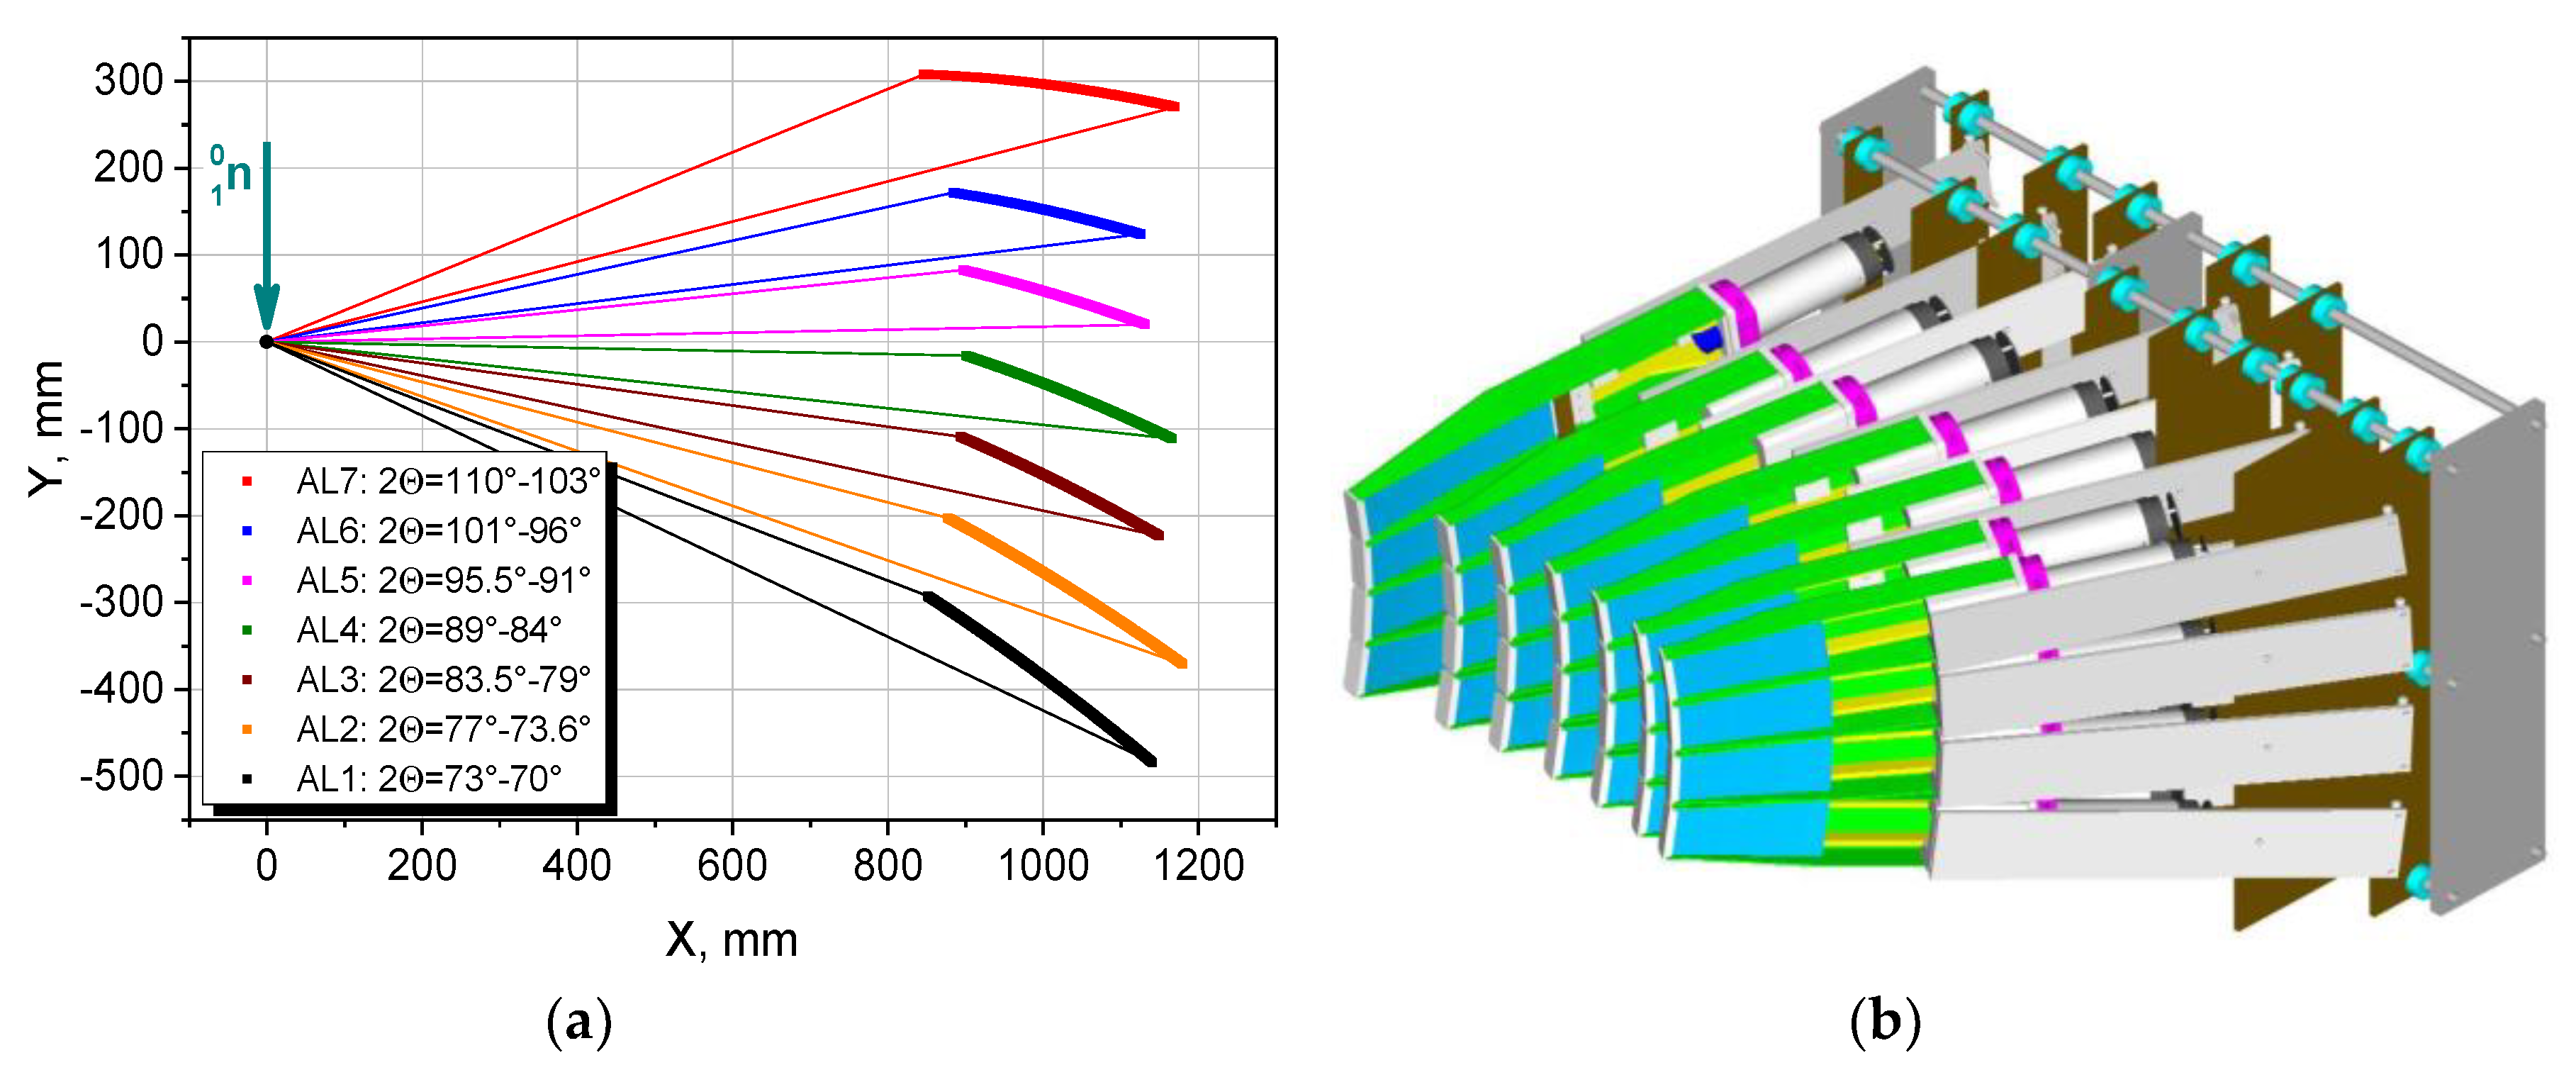
In the final version (
Figure 6a), the FSD detector system consists of one backscattering detector (BS) at the scattering angle 2
θ = 140° and two ASTRA detectors at the scattering angle 2
θ = ± 90°. The BS detector is assembled from 16
6Li-based elements, which are spatially arranged according to the TOF focusing condition (
Figure 6b). Each ASTRA detector includes seven independent TOF focused ZnS(Ag) elements, i.e., with independent outputs of electronic signals of elements [
29]. The combined use of electronic and TOF focusing of the scattered neutron beam allows researchers to increase the solid angle up to ~0.16 sr for each ASTRA detector. This sharply increases the instrument luminosity while retaining the high resolution level in the interplanar spacing
dhkl. Currently, eight elements (among 14 planned) of ASTRA 90°-detectors are installed on the FSD. The application of the RTOF method makes it possible to obtain high-resolution (Δ
d/
d ≈ 0.2 ÷ 0.4%) diffraction spectra with the fairly short flight distance (~6.6 m) between the Fourier chopper and neutron detectors [
30].
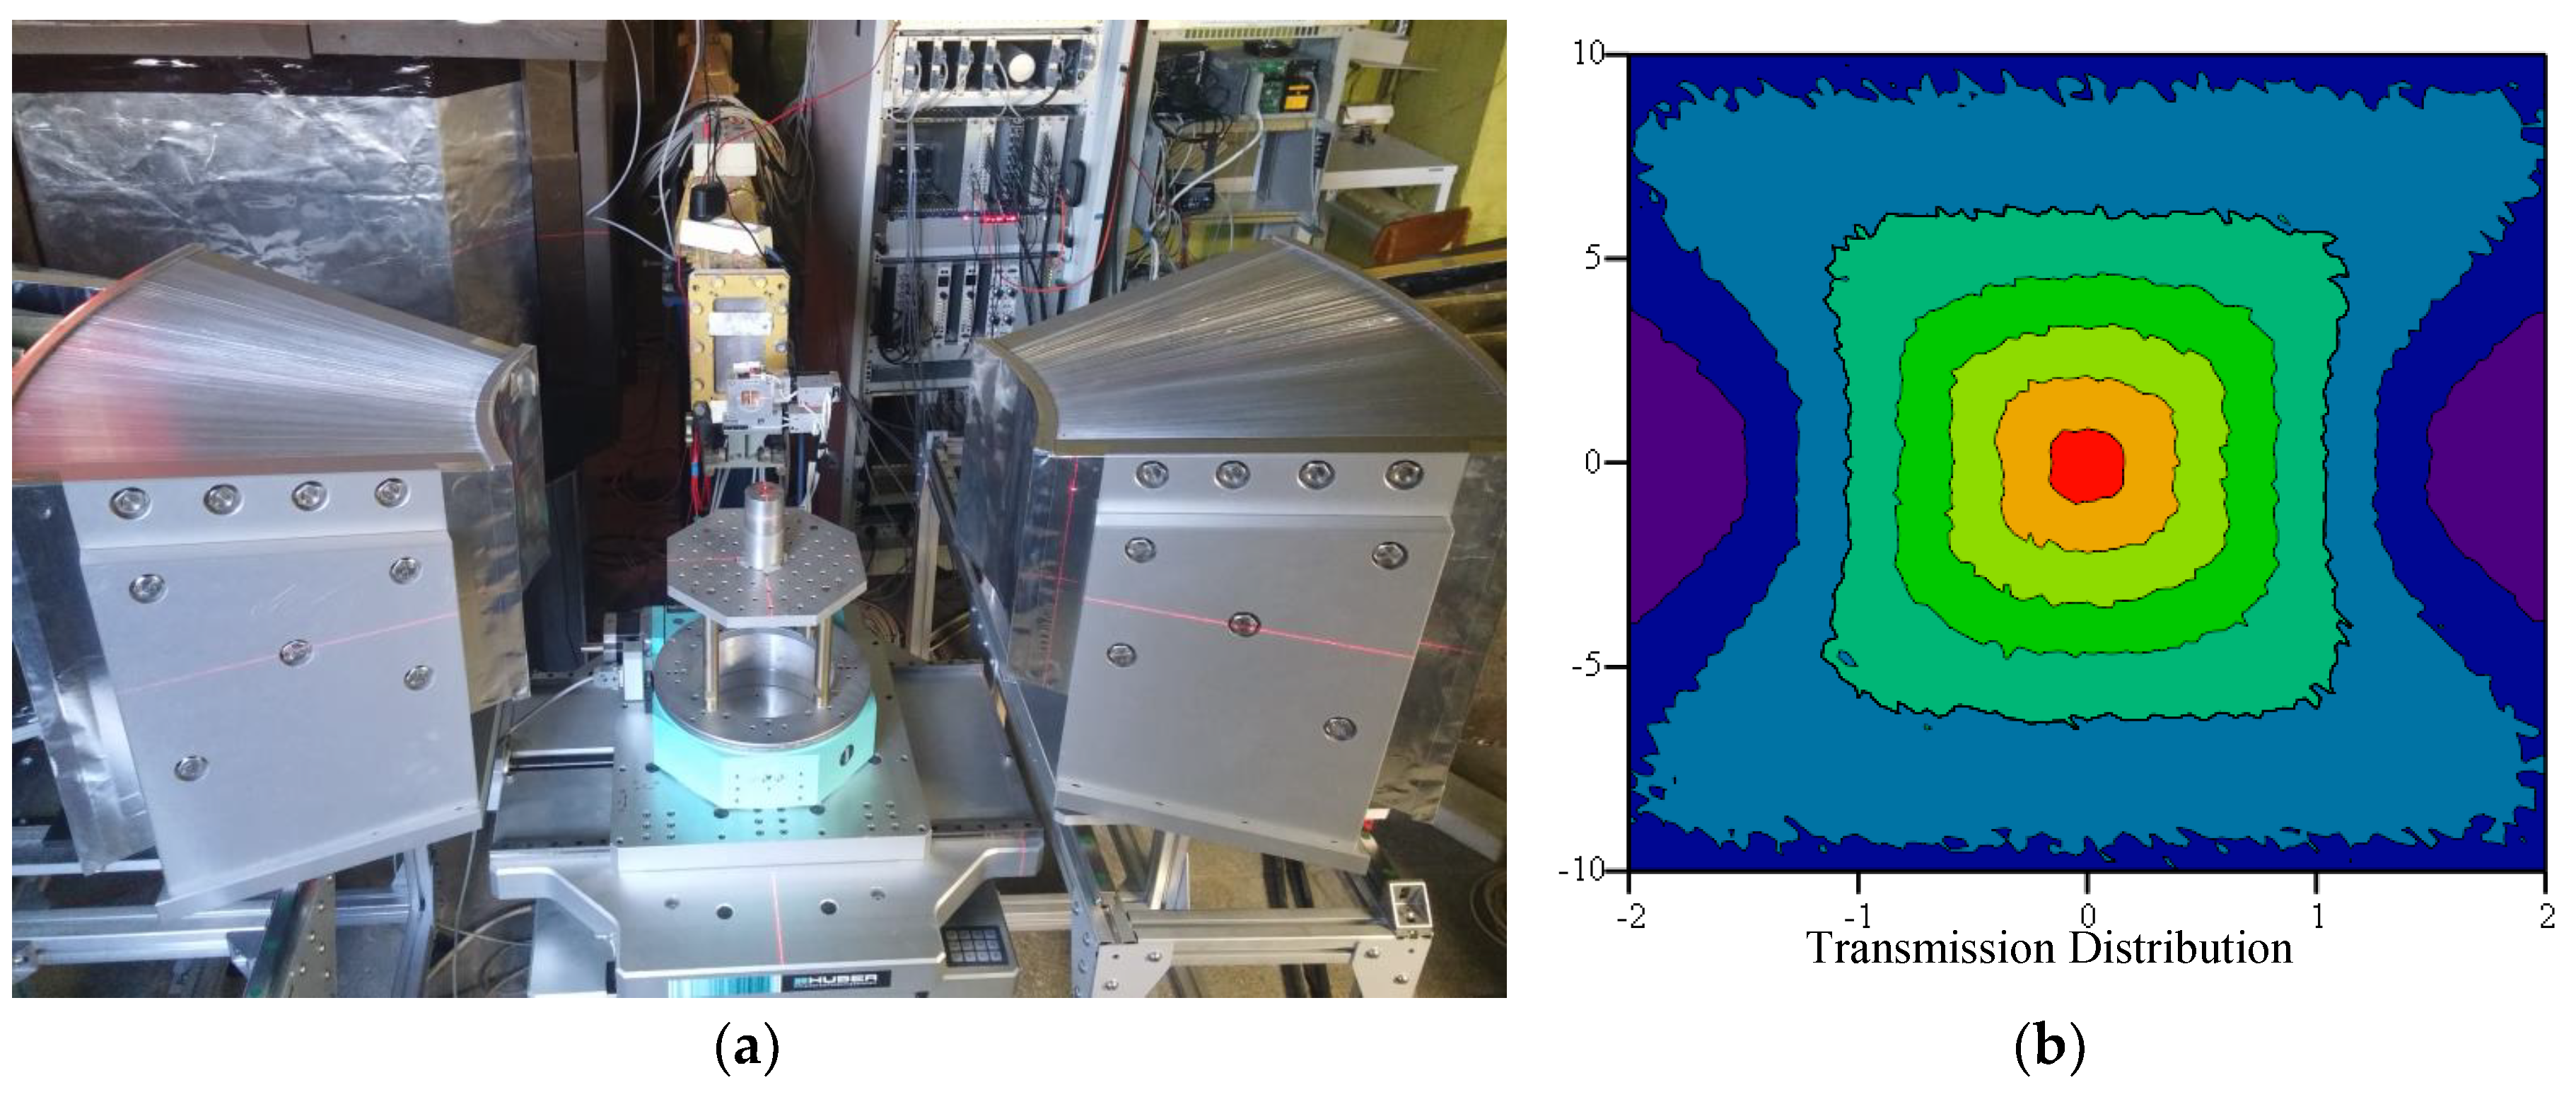
Gauge volume definition with radial collimator. To form the incident neutron beam, a diaphragm with precision step motors and variable aperture (0–30 mm for width and 0–80 mm for height) is installed on the neutron guide exit of FSD. The experimentally estimated horizontal and vertical divergences of the incident beam are 0.001 and 0.002 radians, correspondingly. The scattered neutron beams are formed using two new multi-slit radial collimators with a wide acceptance angle of ±20° (
Figure 7). This allows a definition of the gauge volume in the studied sample. The performed experiments showed that the radial collimators provide a spatial resolution of ~1.8 mm with an improved neutron transmission capacity and precisely form the required gauge volume within the studied sample. Performed test measurements with the VAMAS [
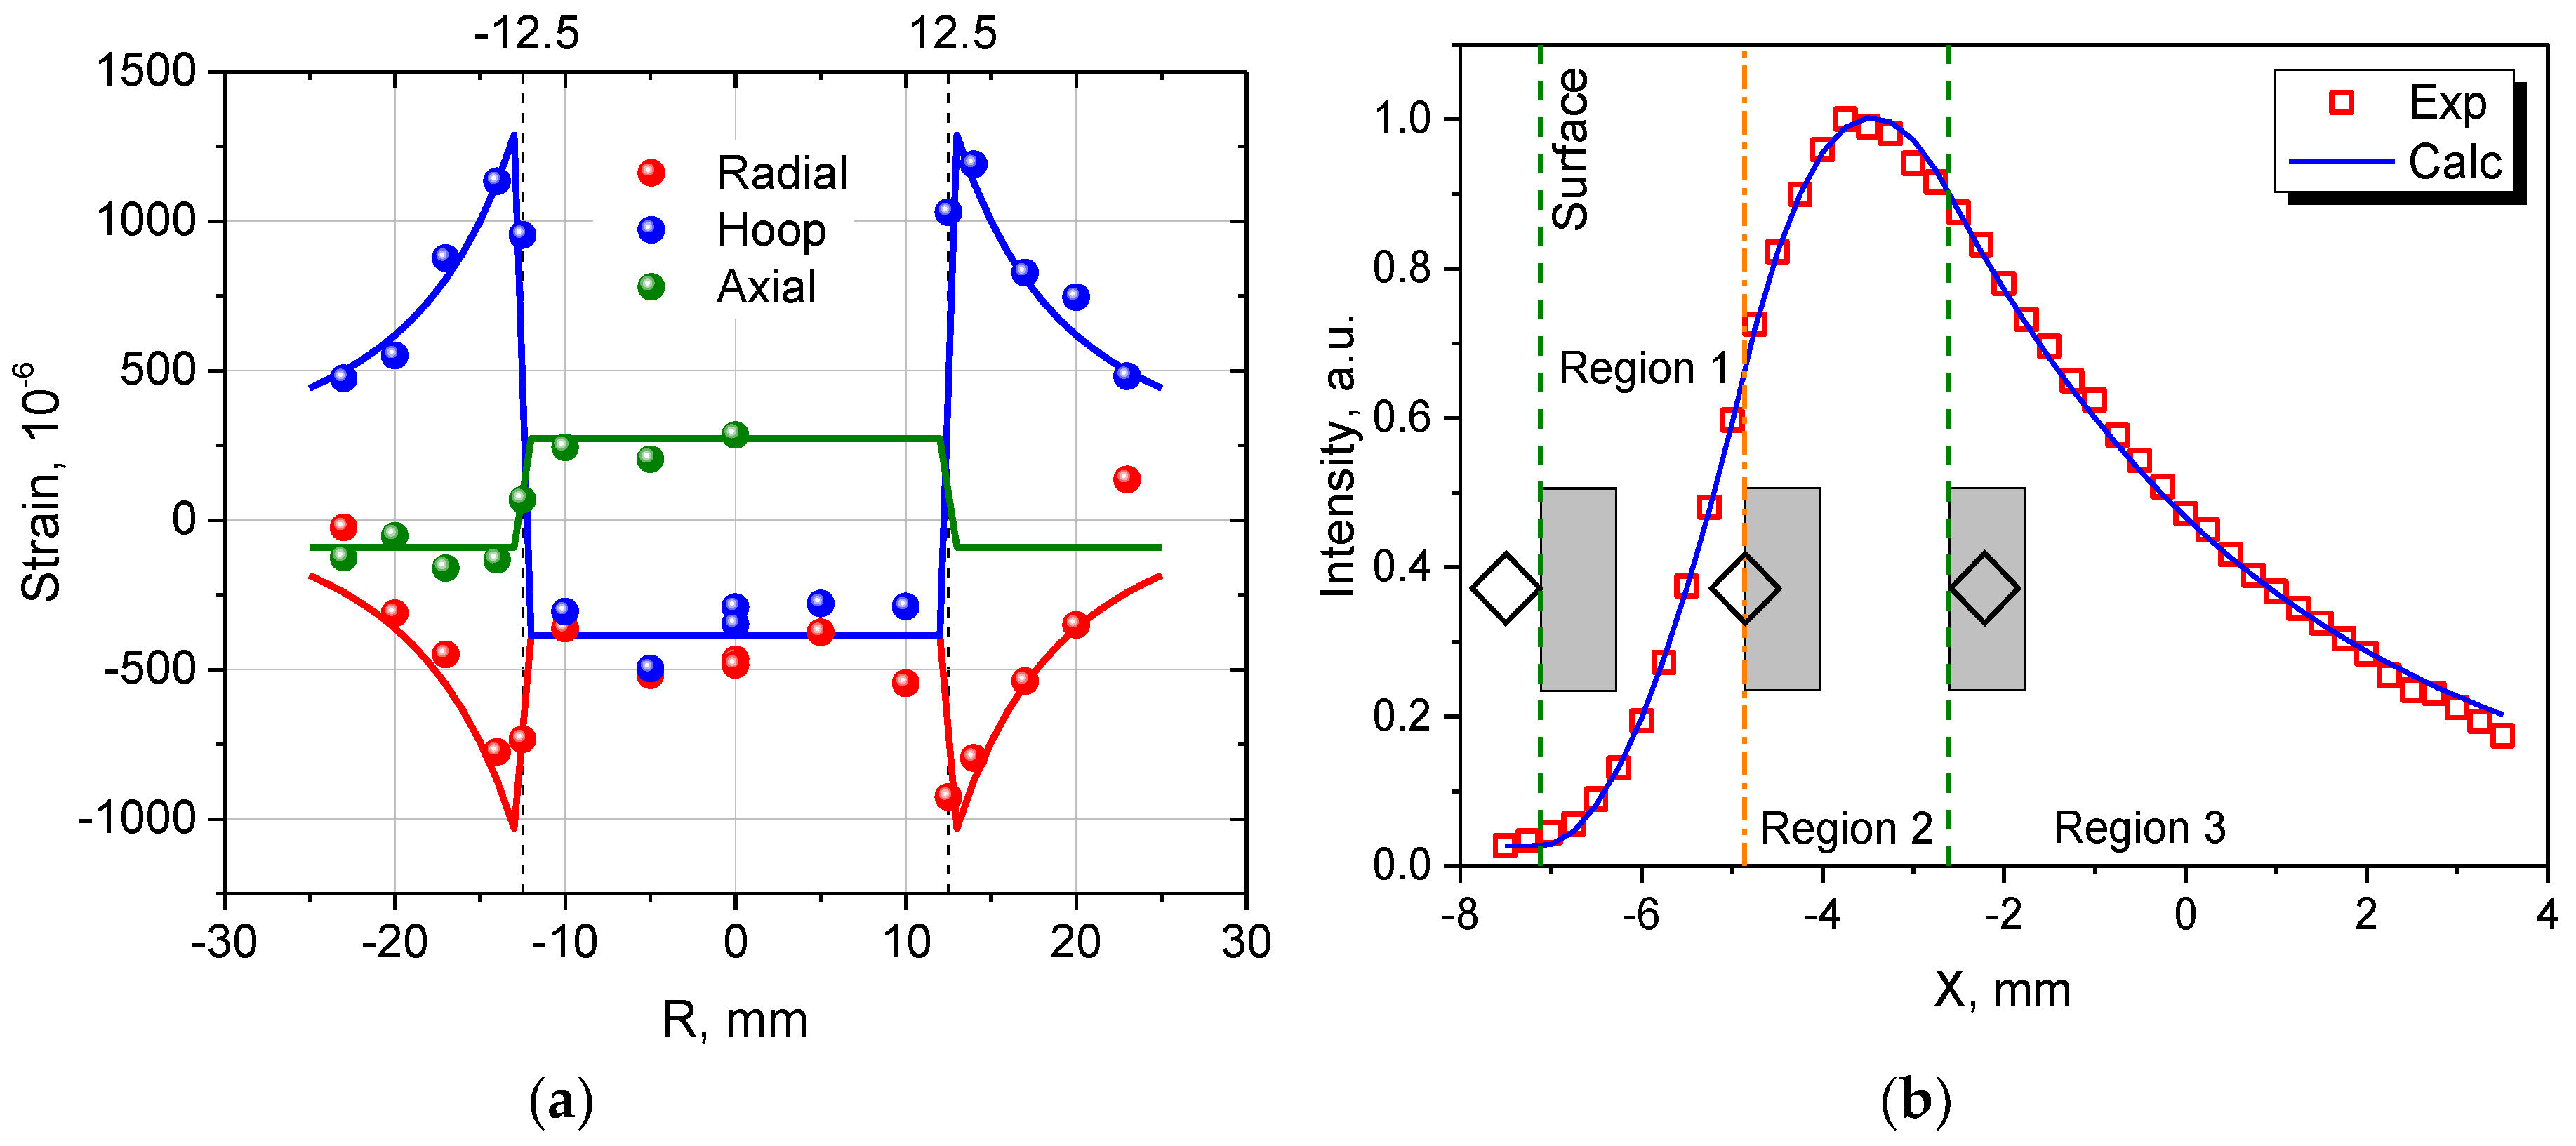
31] shrink-fit ring and plug standard round robin sample with known residual stress profiles confirmed the high sensitivity of the FSD instrument to strain gradients and the high accuracy of the measured strain values (
Figure 8a).
Using neutron scanning, the gauge volume position can be easily determined with respect to the sample surface; then, its position in the sample bulk can also be accurately positioned in further strain measurements. The neutron scanning method involves measuring the dependence of the diffraction peak intensity on the gauge volume center position. The sample is sequentially displaced so that the gauge volume is gradually immersed into the sample (
Figure 8b). The initial point in the plot corresponds to the gauge volume position outside the sample; in this case, the diffraction peak intensity is zero (there is no diffraction from the sample material). Then, the gauge volume gradually enters the sample, hence, the diffraction peak intensity, which is proportional to the scattering material volume, begins to increase. The point of the maximum in the plot approximately corresponds to the position at which the gauge volume is completely immersed into the sample. During further motion to the sample depth, the scattering material volume remains unchanged; however, the intensity begins to decrease slowly due to neutron absorption according to the exponential law
where
μ is the material attenuation coefficient and
D is the total neutron path in the sample. Thus, neutron scanning allows the determination of the gauge volume in the sample with a high enough accuracy (~0.1 mm).
List-mode DAQ system. Recently, a new unified MPD (Multi Point Detector) DAQ unit intended for data registration from individual neutron detector elements was elaborated in FLNP JINR [
32]. The electronic part of the MPD unit is based on five ALTERA FPGAs and it is implemented on a modular principle. The elaborated MPD unit allows the connection of up to 240 detector elements. On the FSD diffractometer, the MPD-32 DAQ unit with 32 input detector signals is installed for routine operation. Due to the peculiarities of the RTOF method, four main types of events are registered by MPD-32 on FSD: detector events, reactor pulses, and rising and falling fronts of Fourier chopper pickup signals. The MPD-32 unit can operate simultaneously in two modes: histogram-mode of TOF-spectra accumulation and list-mode of raw data transfer [
33]. In histogram-mode, the TOF spectrum (low-resolution spectrum) is accumulated in internal memory (64 Mb) of the MPD unit with a programmable fixed number of channels and channel widths, and can be visualized on screen online. In list-mode, raw data events are recorded as a list of 32-bit words with a total maximum data flow rate of 8 × 10
6 events/sec. and maximum sampling frequency of 62.5 MHz, which corresponds to a discretization time of 16 ns. Thus, in this case, the absolute time of each event (timestamp) is defined with a high precision and is written as raw data on a computer HDD. The elaborated LM-algorithm provides a fast
a posteriori reconstruction of high-resolution neutron diffraction spectra (RTOF spectra) from raw data in a wide
dhkl range with flexibly configurable parameters of the TOF-scale., i.e., number of channels in the spectrum, channel width, spectrum and strobe pulse delays, flight paths relation coefficient, etc. If necessary, this procedure can be performed repeatedly without additional measurements. Moreover, the LM algorithm includes some auxiliary opportunities for spectra correction (chopper phase shift correction, detector signal filtering, precise electronic focusing of individual detector elements into the single TOF scale, real frequency window reconstruction, etc.).
The main idea of the RTOF method is to examine the registration probability (high or low) for detected neutrons [
5]. This is realized by the reverse analysis of “open” and “closed” states of the neutron source and Fourier chopper for each detector event. Registering neutrons with continuous beam modulation according to the particular law (frequency window
g(
ω)), it is possible to obtain the TOF distribution of elastically scattered neutrons. In simplified form, the unity is added to the analyzer memory cell if both the neutron source and the chopper are in the “open” state.
The neutron intensity measured by RTOF method at a pulsed neutron source can be described as [
10]:
where
RС is the resolution function of the Fourier chopper (see Equation (8)),
RS is the function describing the neutron pulse from the source,
σ is the coherent scattering cross section of the sample,
B is the conventional background, and
c ≈ 1 is a constant.
The width of the RS function is about WS ≈ 340 μs for the IBR-2 reactor, while the width of RС is defined by the maximal modulation frequency ωmax of the Fourier chopper and it is about ∆t0 ≈ 10 μs for the FSD diffractometer. Thus, the first term in Equation (10) is a narrow peak with a width of 10 μs, and the second one is the broad peak-like distribution with a width of 340 μs, which is called the correlation background.
The + or − sign before the first term in Equation (10) corresponds to correlation patterns
I+(
t) (“positive”) and
I−(
t) (“negative”) accumulated with non-inverted and inverted pickup signals of the Fourier chopper, correspondingly (
Figure 9). The non-inverted binary pickup signal is 1 for the high transmission (“open”) state of the Fourier chopper and 0 for the low-transmission (“closed”) state, whereas the inverted pickup signal is 1 for the low-transmission state and 0 for the high-transmission state. The high-resolution diffraction RTOF spectrum is calculated as a difference of “positive” and “negative” patterns:
H(t) =
I+(
t) –
I–(
t). The high-resolution spectrum
H(t) contains narrow diffraction Bragg peaks with widths corresponding to the diffractometer resolution function for a certain interplanar spacing
dhkl. The high-resolution peak position in the TOF-scale is defined as (cf. Equation (1)):
where
LRTOF is the flight path between the Fourier chopper and detector.
Electronic focusing of detector elements. Usually, during stress scanning experiments, the radial collimators are used in front of the 90°-detectors for small gauge volume selection in the depth of the sample. Therefore, the intensity factor is a very important parameter and the whole detector solid angle should be used in such experiments. For the summation of the spectra from the individual elements of ASTRA ±90°-detectors, the electronic focusing method is used. This method implies the use of scale coefficients for each detector element and measuring RTOF spectra with individual channel widths
τi,
where
Li,
L0 are the flight paths (i.e. distance between the Fourier chopper and neutron detector);
θi,
θ0 are the scattering angles; and
τi, τ0 are the RTOF channel widths for the
i-th and basic detectors, respectively.
Usually,
τi are real (noninteger) numbers and RTOF spectra with such channel width values are readily reconstructed from raw list-mode data with the required accuracy. Therefore, all spectra are reduced to a unified TOF scale corresponding to the basic detector with parameters
L0,
θ0, and
τ0, and can be summed channel by channel. The final diffraction spectrum is characterized by a multiple increase in the intensity at the same resolution level as for the spectra from individual detector elements (
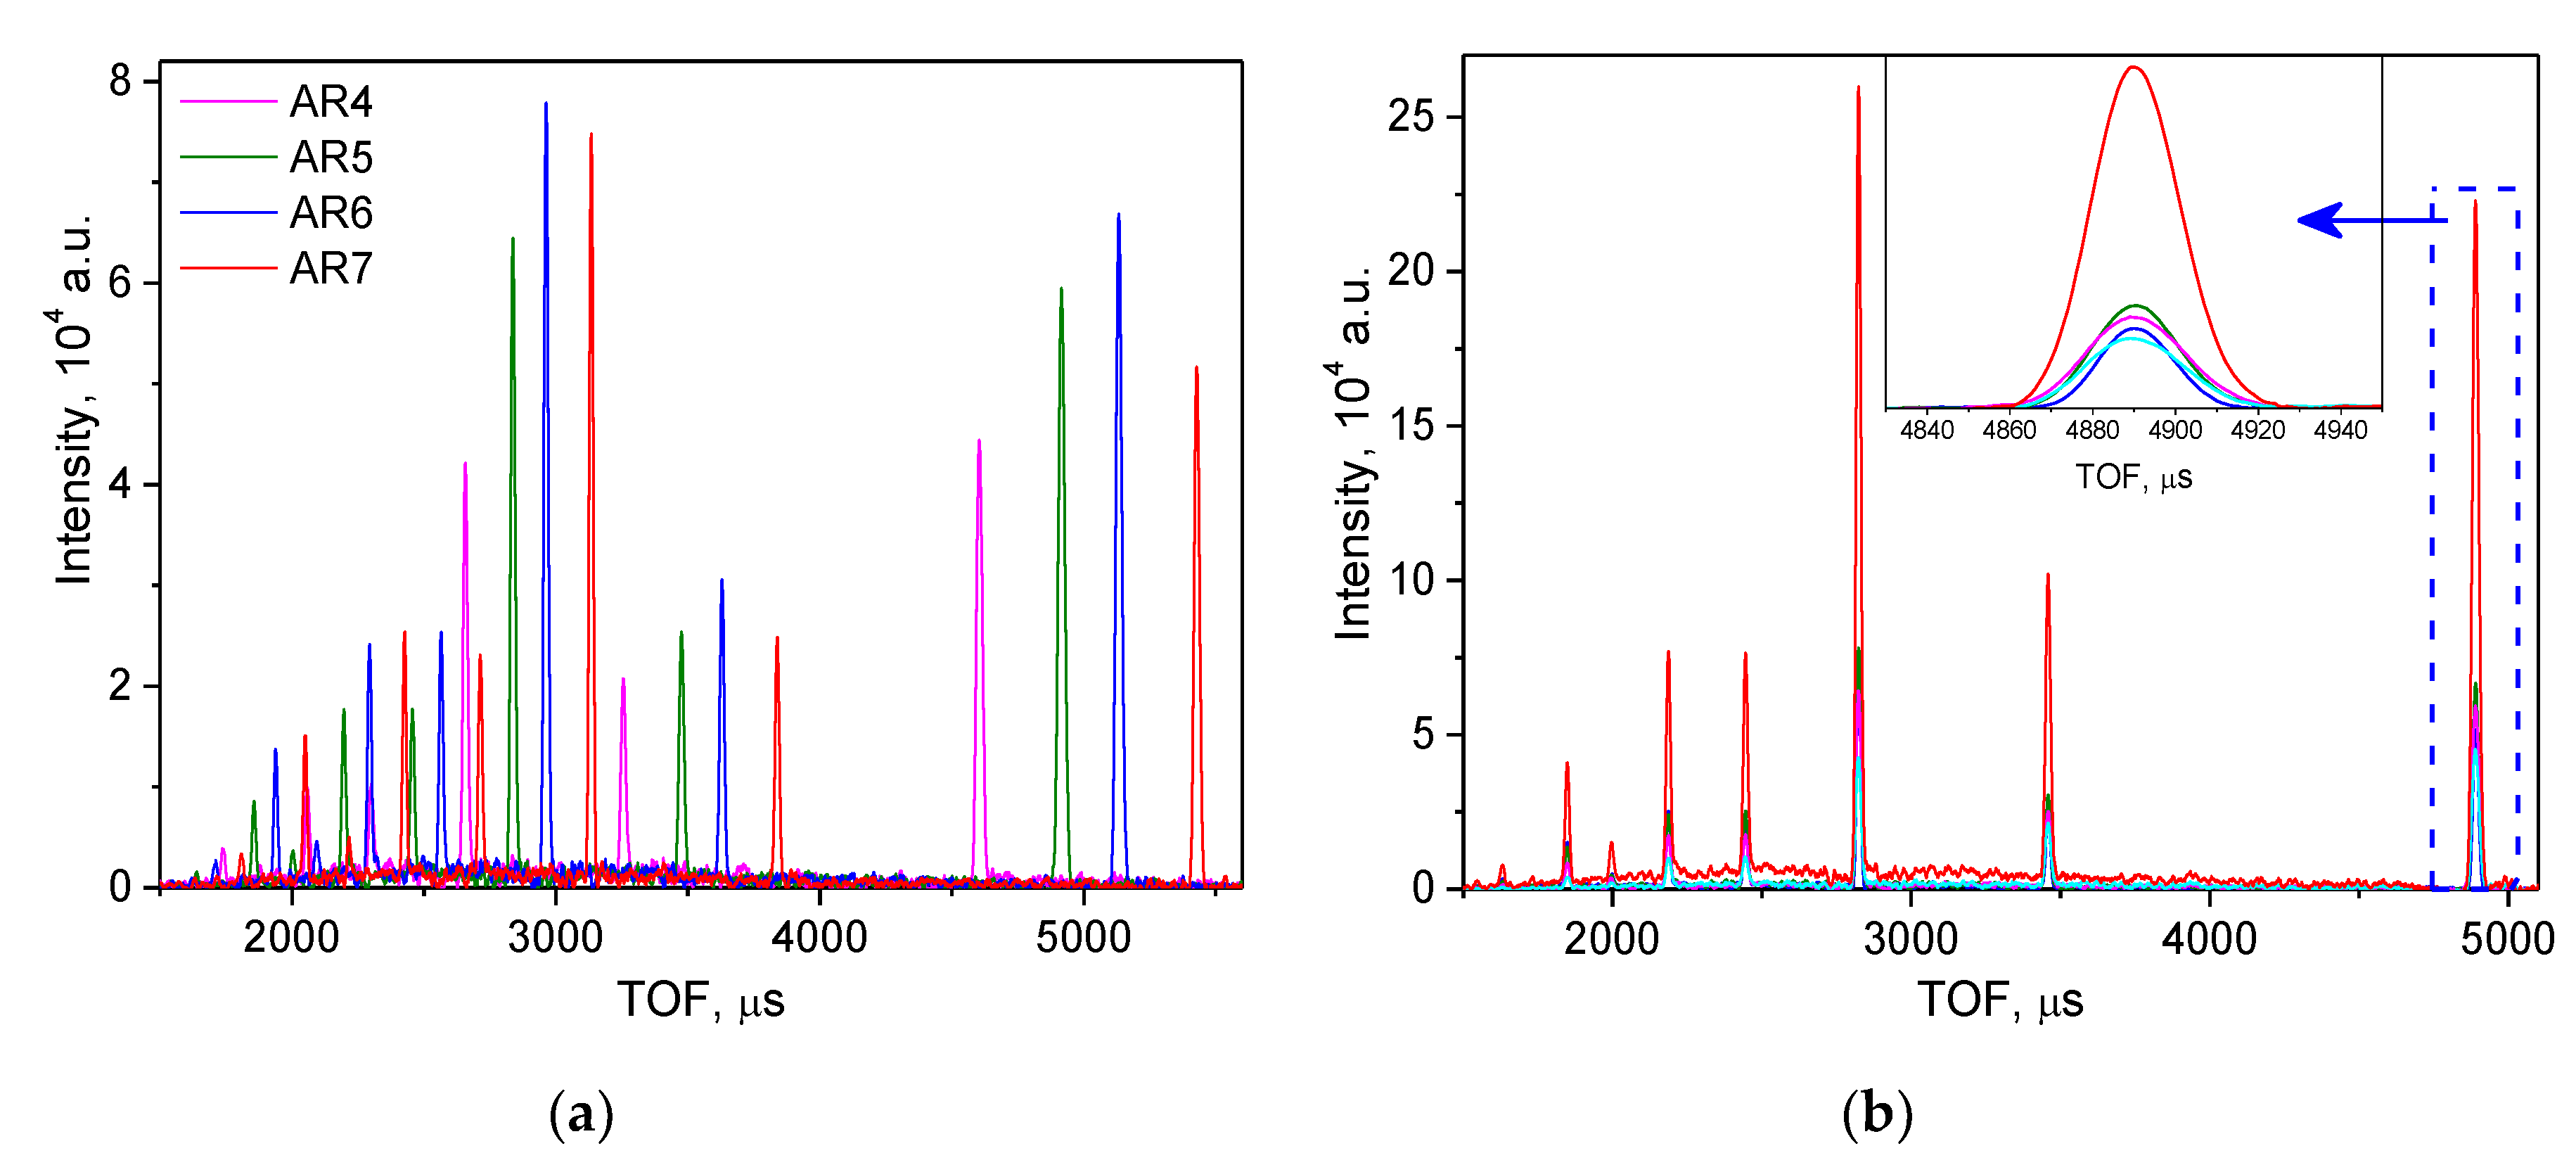
Figure 10). Thus, the luminosity of the experiment on FSD is increased by a factor of four using electronic focusing for all elements of ASTRA ±90°-detectors. A similar approach was used for additional fine tuning of individual elements of the BS detector with geometrical TOF focusing, which allowed the detector resolution to improve by ~5%.
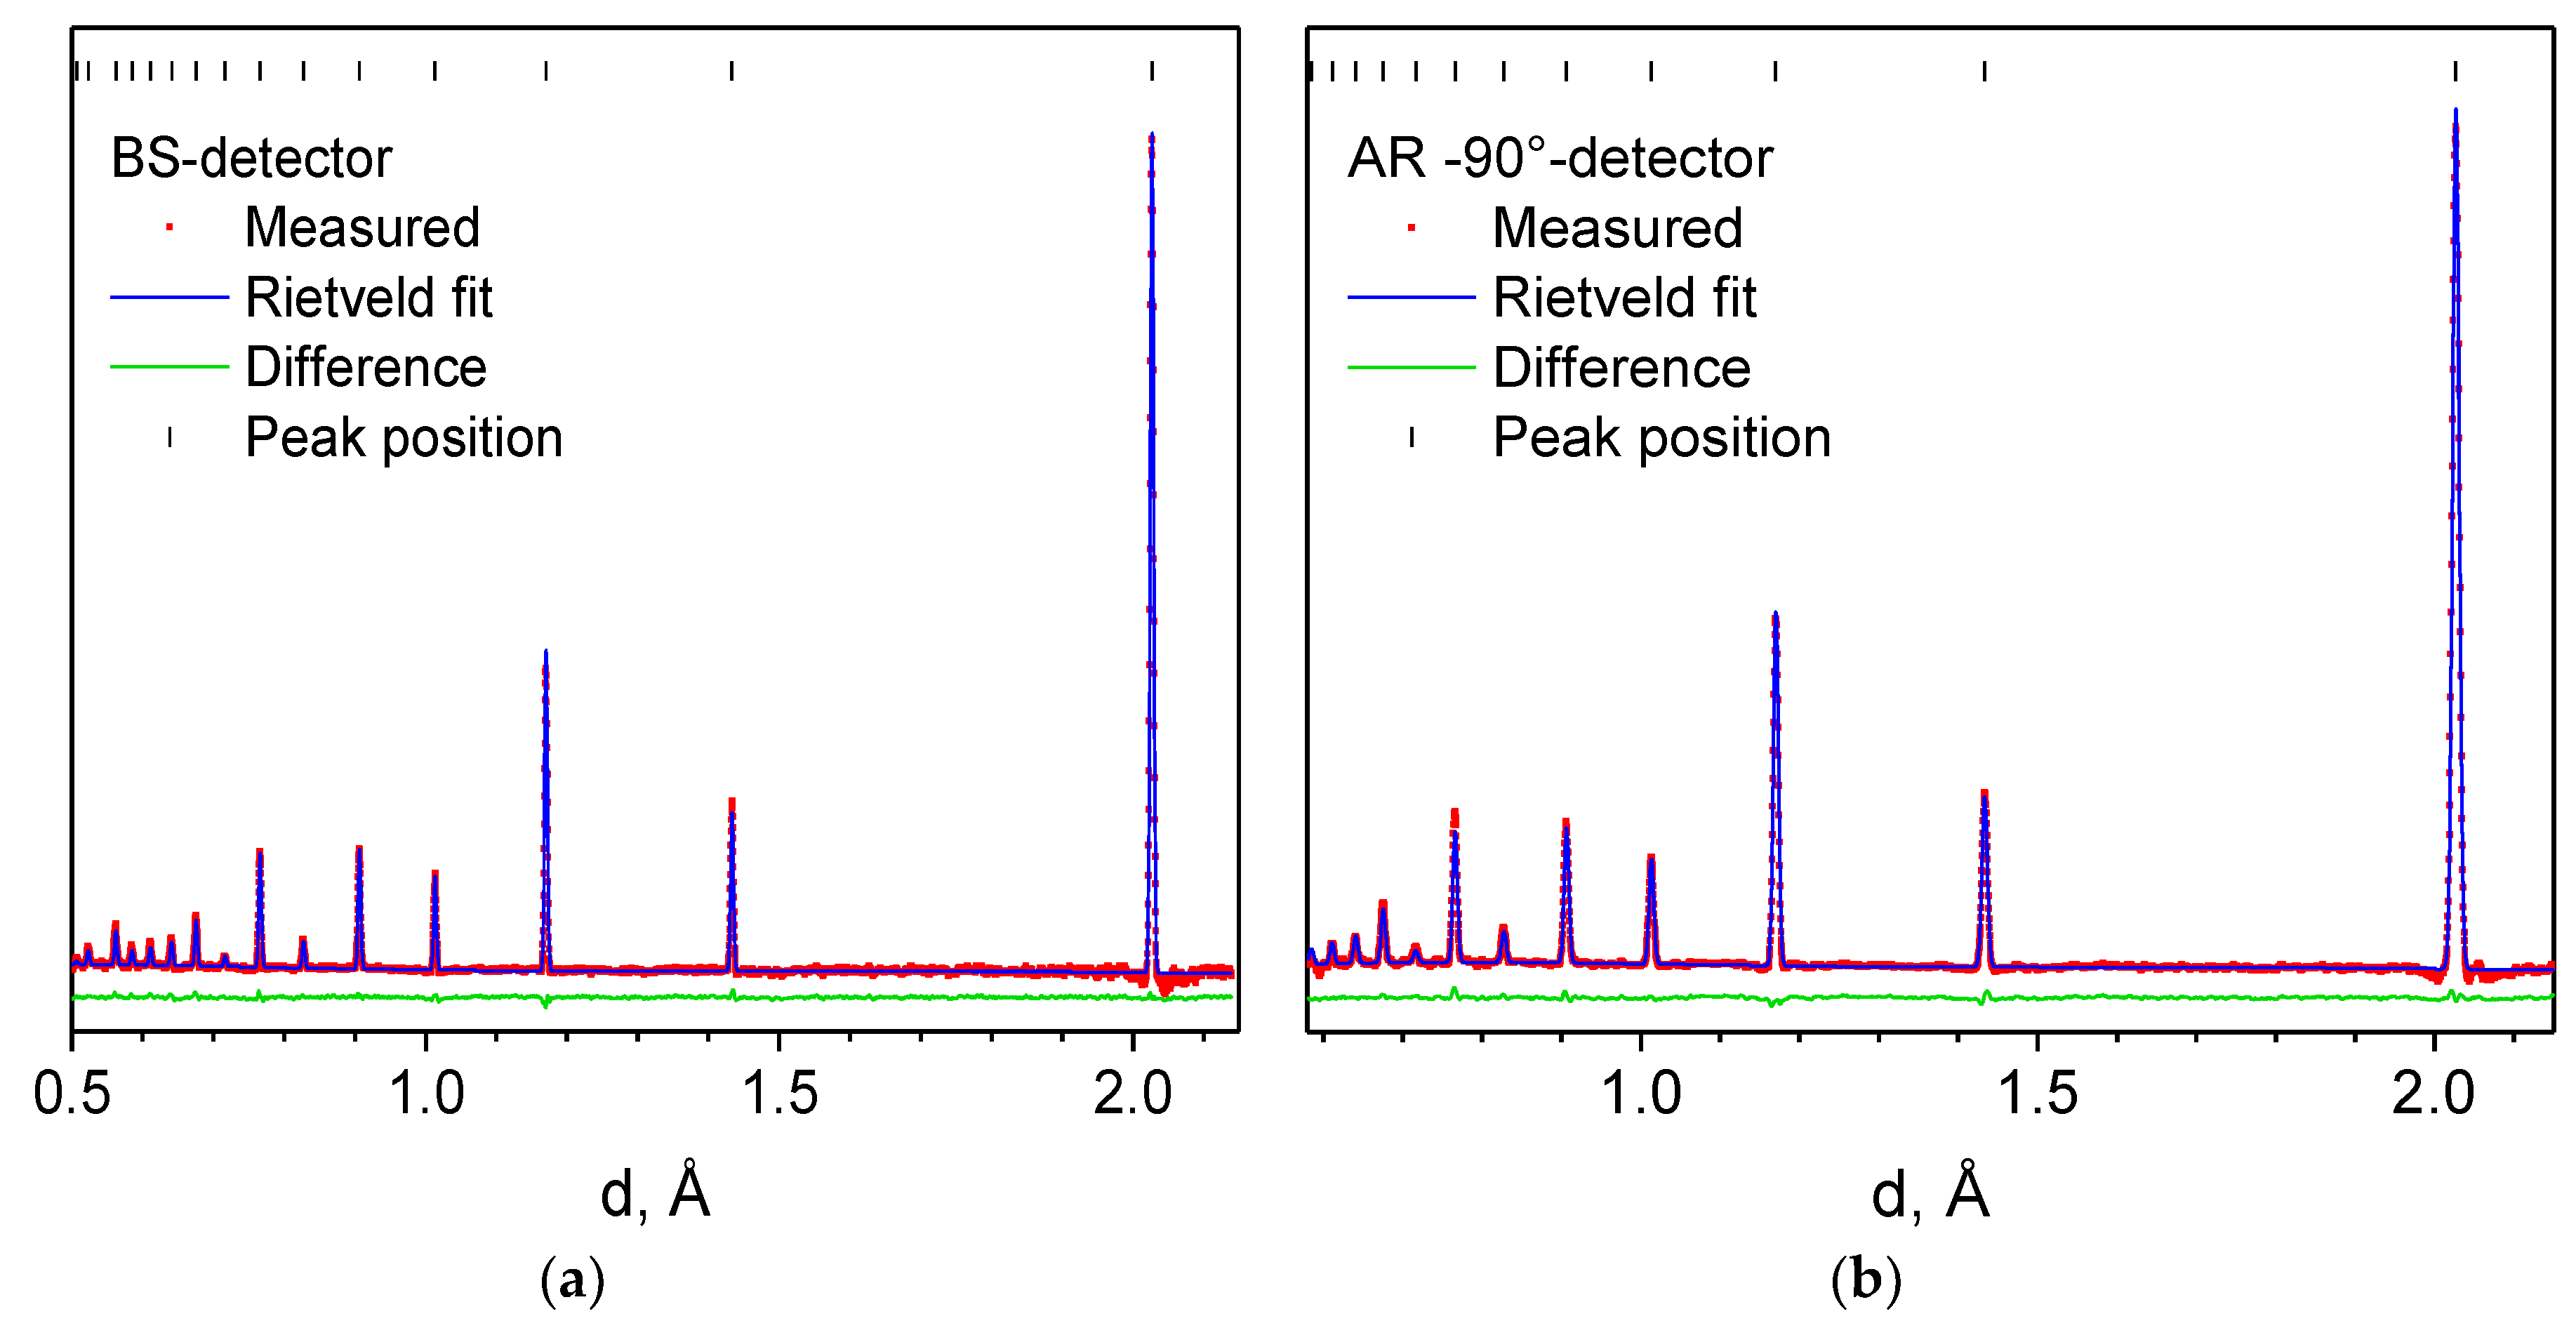
FSD diffractometer performance. To study the main characteristics of the FSD diffractometer, a number of test experiments were performed to estimate the instrument resolution, sensitivity to the spatial distribution of strains, and the possibility of studying typical structural materials under external loads. The spectral distribution of the incident neutron beam intensity on the FSD allows efficient operation at
λ ≥ 1 Å. This makes it possible to measure diffraction spectra in the ranges
dhkl = 0.63 ÷ 6.7 Å at 2
θ = 90° and
dhkl = 0.51 ÷ 5.4 Å at 2
θ = 140°, which is an optimum range for most structural materials used in industry. The typical high-resolution diffraction spectra measured on the α-Fe reference powder sample at a maximum rotation speed of the Fourier chopper
Ωmax = 6000 rpm are shown in (
Figure 11).
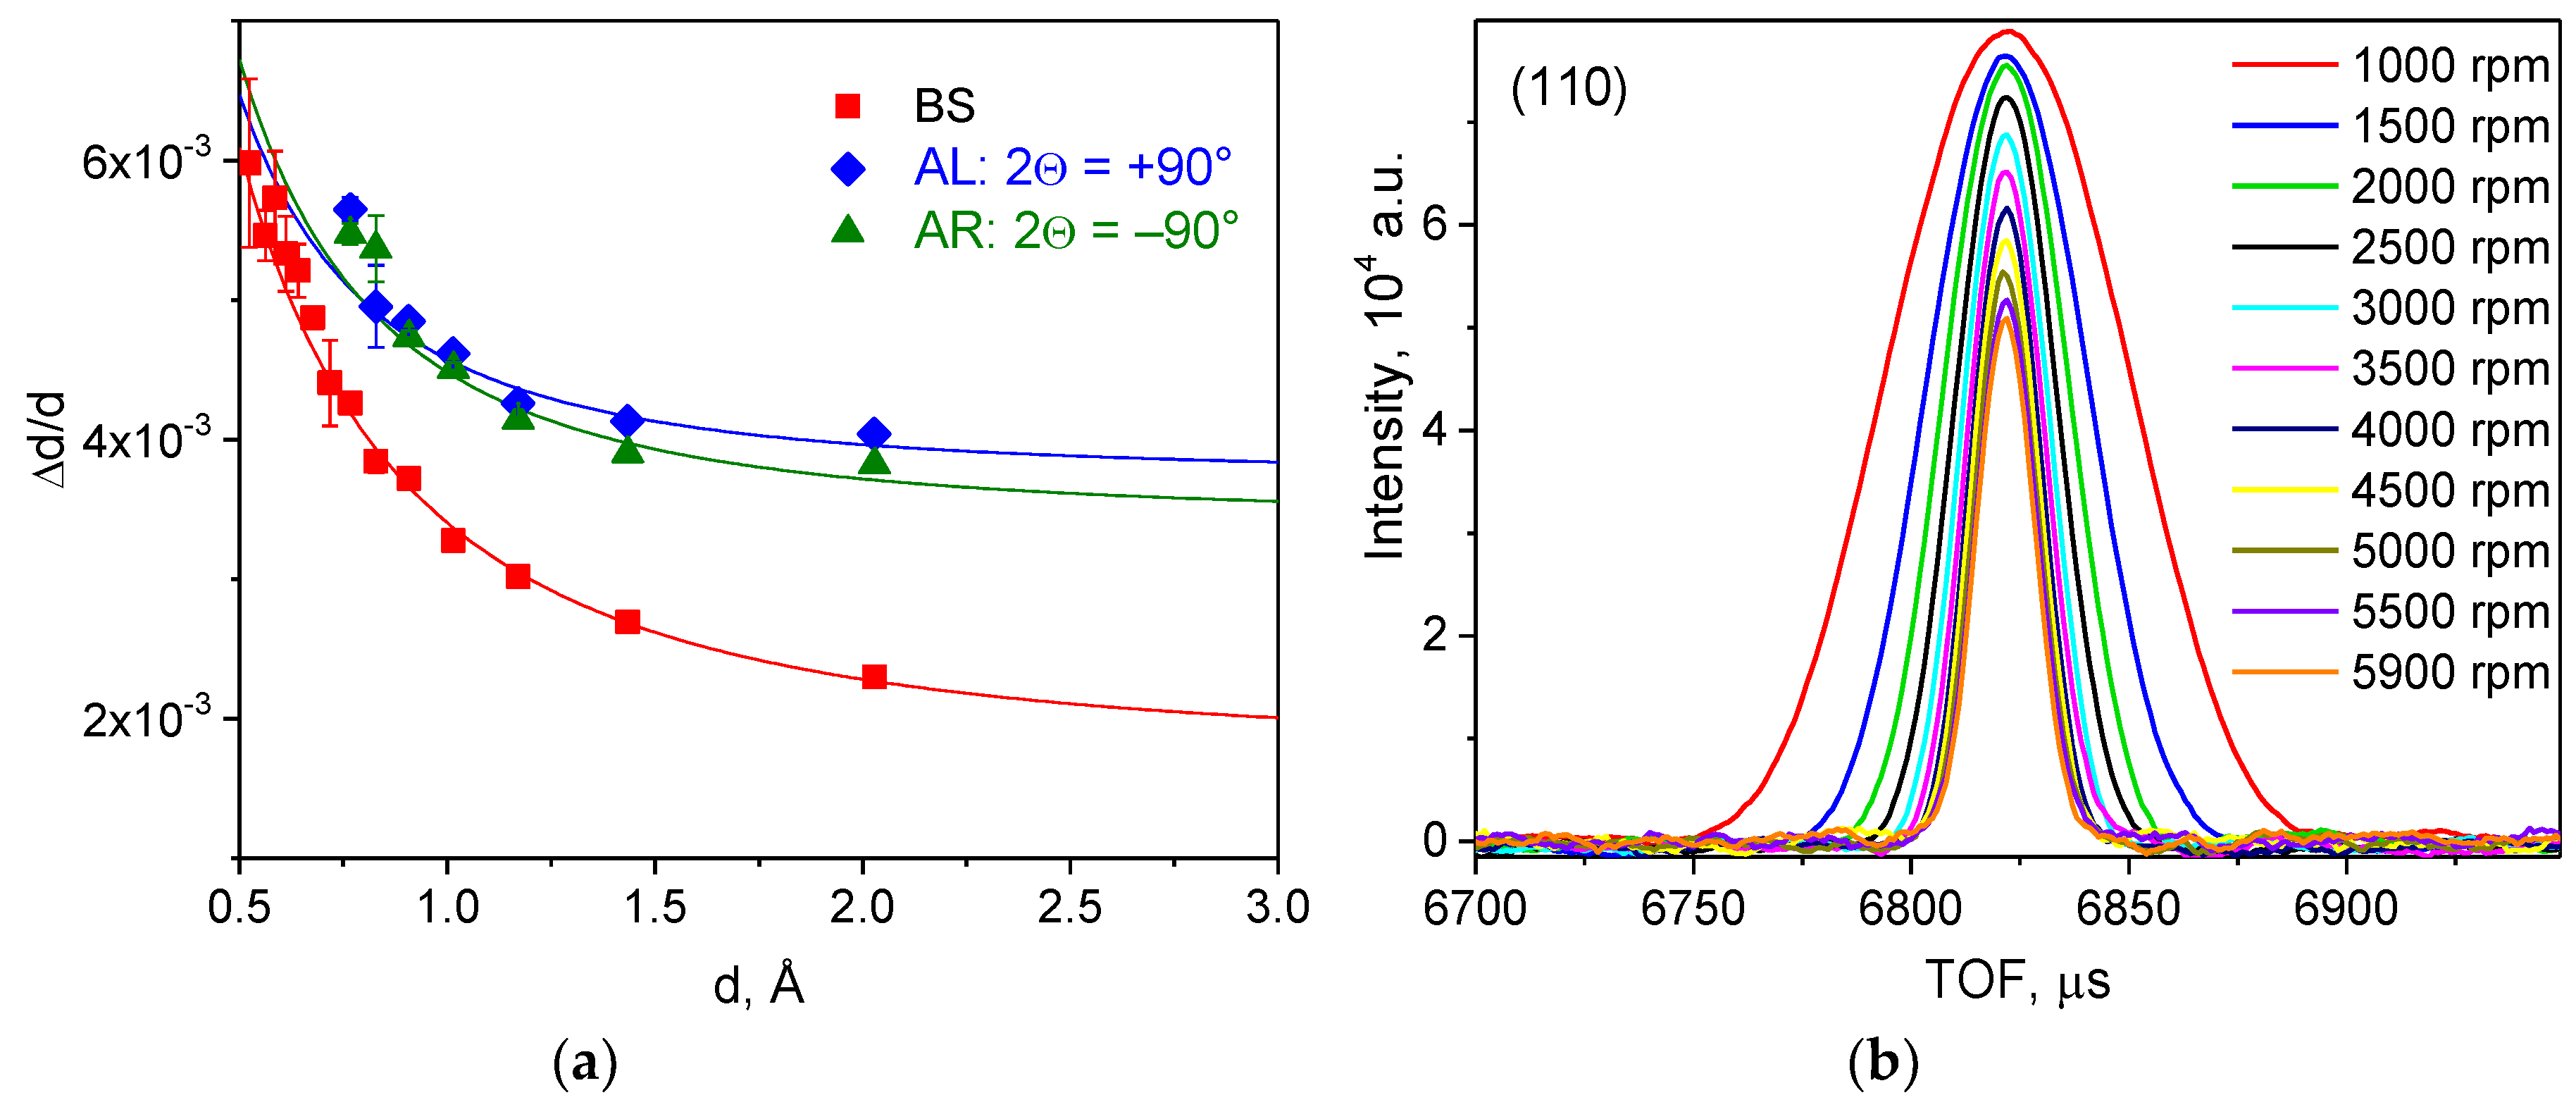
An analysis of the diffractometer resolution function showed that FSD detectors indeed have a necessary resolution level in the interplanar spacing: Δ
d/
d ≈ 2.3 ×⋅10
–3 for the backscattering detector BS and Δ
d/
d ≈ 4 × 10
−3 for both ASTRA ±90°-detectors at
d = 2 Å and at a maximum rotation speed of the Fourier chopper
Ωmax = 6000 rpm (
Figure 12a). Furthermore, the dependence of the shape of an individual diffraction peak on the maximum speed of the Fourier chopper and resolution function for all detectors were investigated (
Figure 12b). According to expectations, the effective neutron pulse width decreases as 1/
ωmax, reaching a minimum of ~10 μs. Thus, the diffractometer parameters can be optimized, taking into account the required accuracy of peak position determination and scheduled beamtime. Main parameters of the FSD diffractometer are given in
Table 1.
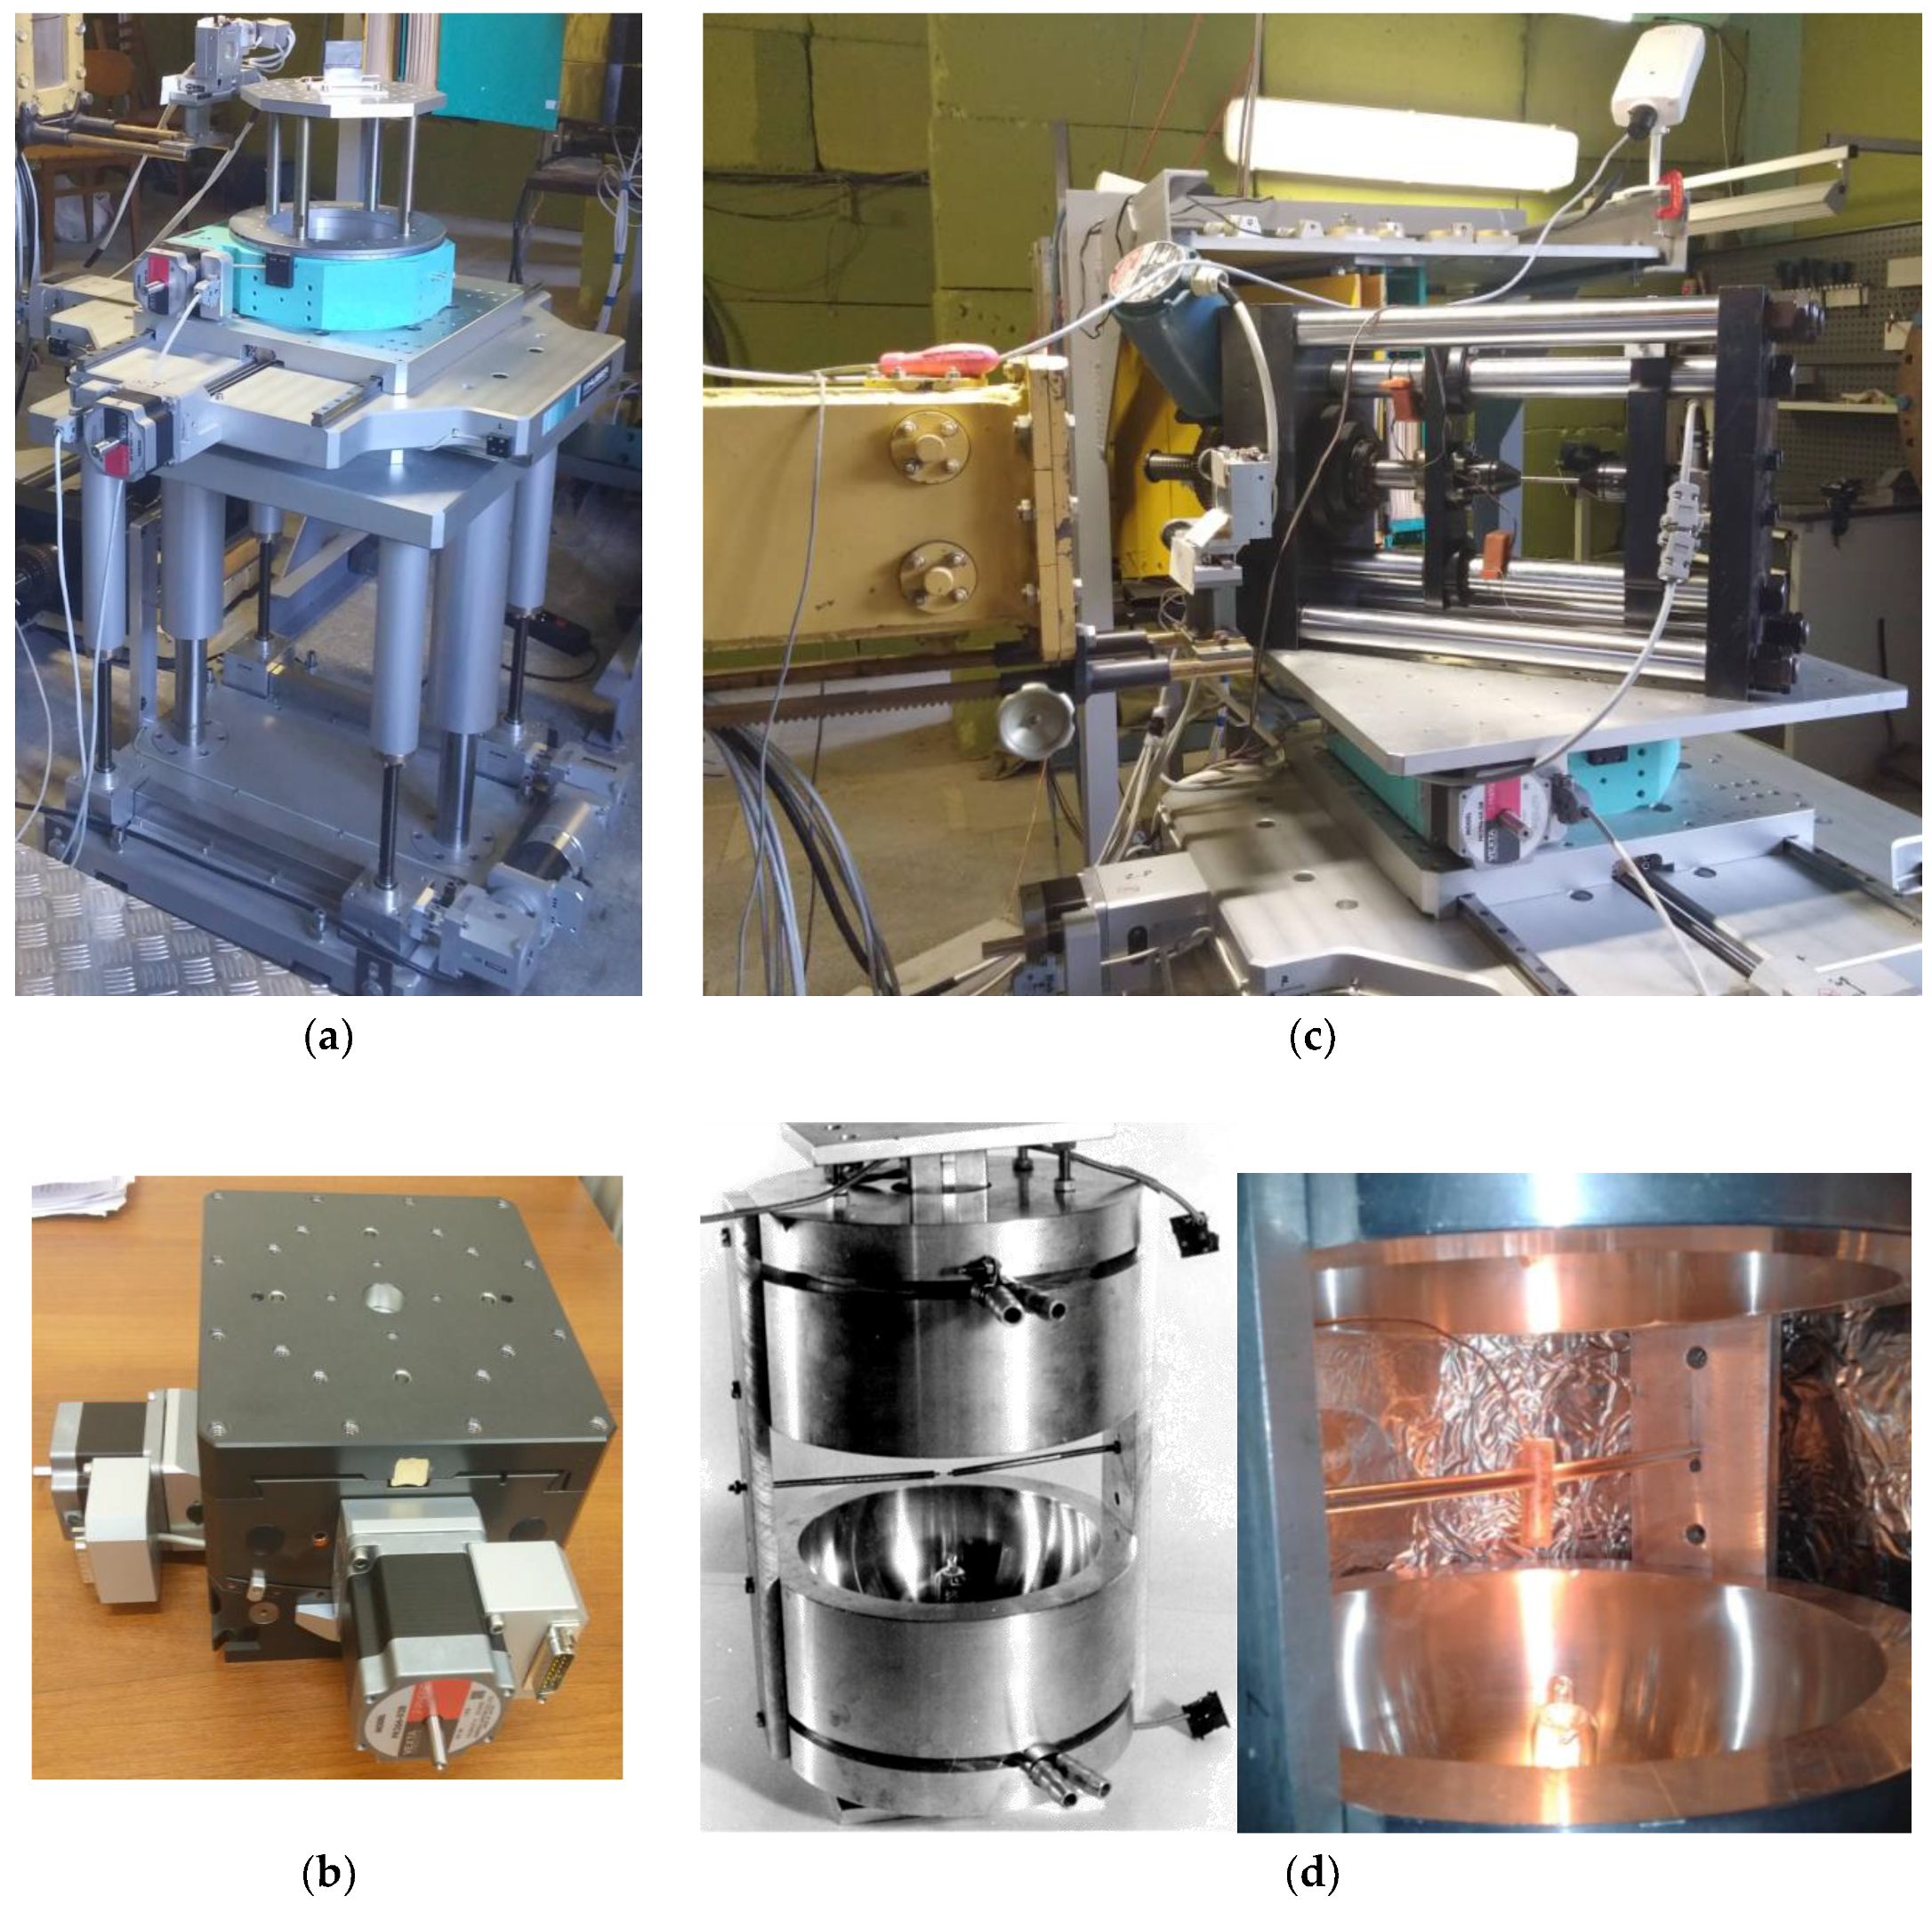
Sample environment. Available supplementary equipment integrated into the experiment control system makes it possible to provide various conditions (load, temperature, etc.) at the sample. For precise sample positioning, a four-axis (X, Y, Z, Ω) HUBER goniometer with the maximal carrying capacity of 300 kg is used (
Figure 13a). It can be equipped with an additional goniometer head with ±15°-tilt (
Figure 13b). To study the behavior of structural materials under an external load in situ in a neutron beam, an LM-29 uniaxial mechanical-type loading machine is used; it provides any required combination of external load and temperature, which considerably extends the range of possible experiments on the diffractometer. The device provides a tensile/compressive load at the sample of up to 29 kN. There is also the possibility to heat metallic samples by an electric current up to 800 °С (with temperature control). The main advantage of this loading machine is the almost slack-free load transfer to the sample (
Figure 13c). For neutron diffraction experiments at elevated temperatures (up to 1000 °С) with small samples of typical dimensions of ~1 cm, the MF2000 water-cooled mirror furnace is used (
Figure 13d). The furnace consists of two polished aluminum reflectors and two halogen lamps with temperature stabilization by the Lakeshore controller.


