1. Introduction
Solid–solid phase transformations, such as the well-known
–
transition occurring in pure iron and in steels, play an important role in the behavior of these materials and in technological applications [
1,
2]. In the recent past, atomistic simulations have been used to obtain insight into the dynamics of this transformation [
3,
4]. While many aspects have been investigated, the influence of crystal defects on the transformation path is still under discussion. Thus, it has been found that grain boundaries [
5,
6], other planar defects such as stacking faults [
7] and dislocations [
8,
9,
10] may act as nucleation sites for the transformation. In addition, phase boundaries [
11,
12,
13,
14] and heterogeneous interfaces, such as with carbide phases [
15], affect the transformation behavior; in these cases, of course, the crystal orientation at the interface is decisive.
Surfaces provide another source of planar defect that may influence the transformation. Despite the inevitable presence of surfaces, their role in the transformation process does not appear to have been thoroughly investigated up to now [
16]. Surfaces provide free volume, which facilitates the cooperative motion necessary for the transformation. In addition, the potential energy stored in surfaces with high specific surface energy may be used to trigger the transformation [
17]. In nanowires, it has even been found that the surface stress may induce a phase transformation that does not exist in the bulk, such as from fcc-Au phase to bct-Au phase [
18]. On the other hand, the pathway followed during the transformation may not agree with the surface orientation—in the sense that the surface plane is not conserved during the transformation—and thus delay or even impede the transformation.
We used molecular dynamics simulation to investigate the influence that the surface exerts on the - transition in pure iron; both the transition—denoted for convenience as the “austenitic” transformation—and the transition—the “martensitic” transformation—were considered. We concentrated on (100) and (110) surfaces as well as [001] tilt surfaces that interpolate between these two. Thus, our study allowed identifying the influence of the specific surface energy and the surface orientation on the transformation pathway and the transformation temperature.
2. Simulation Method
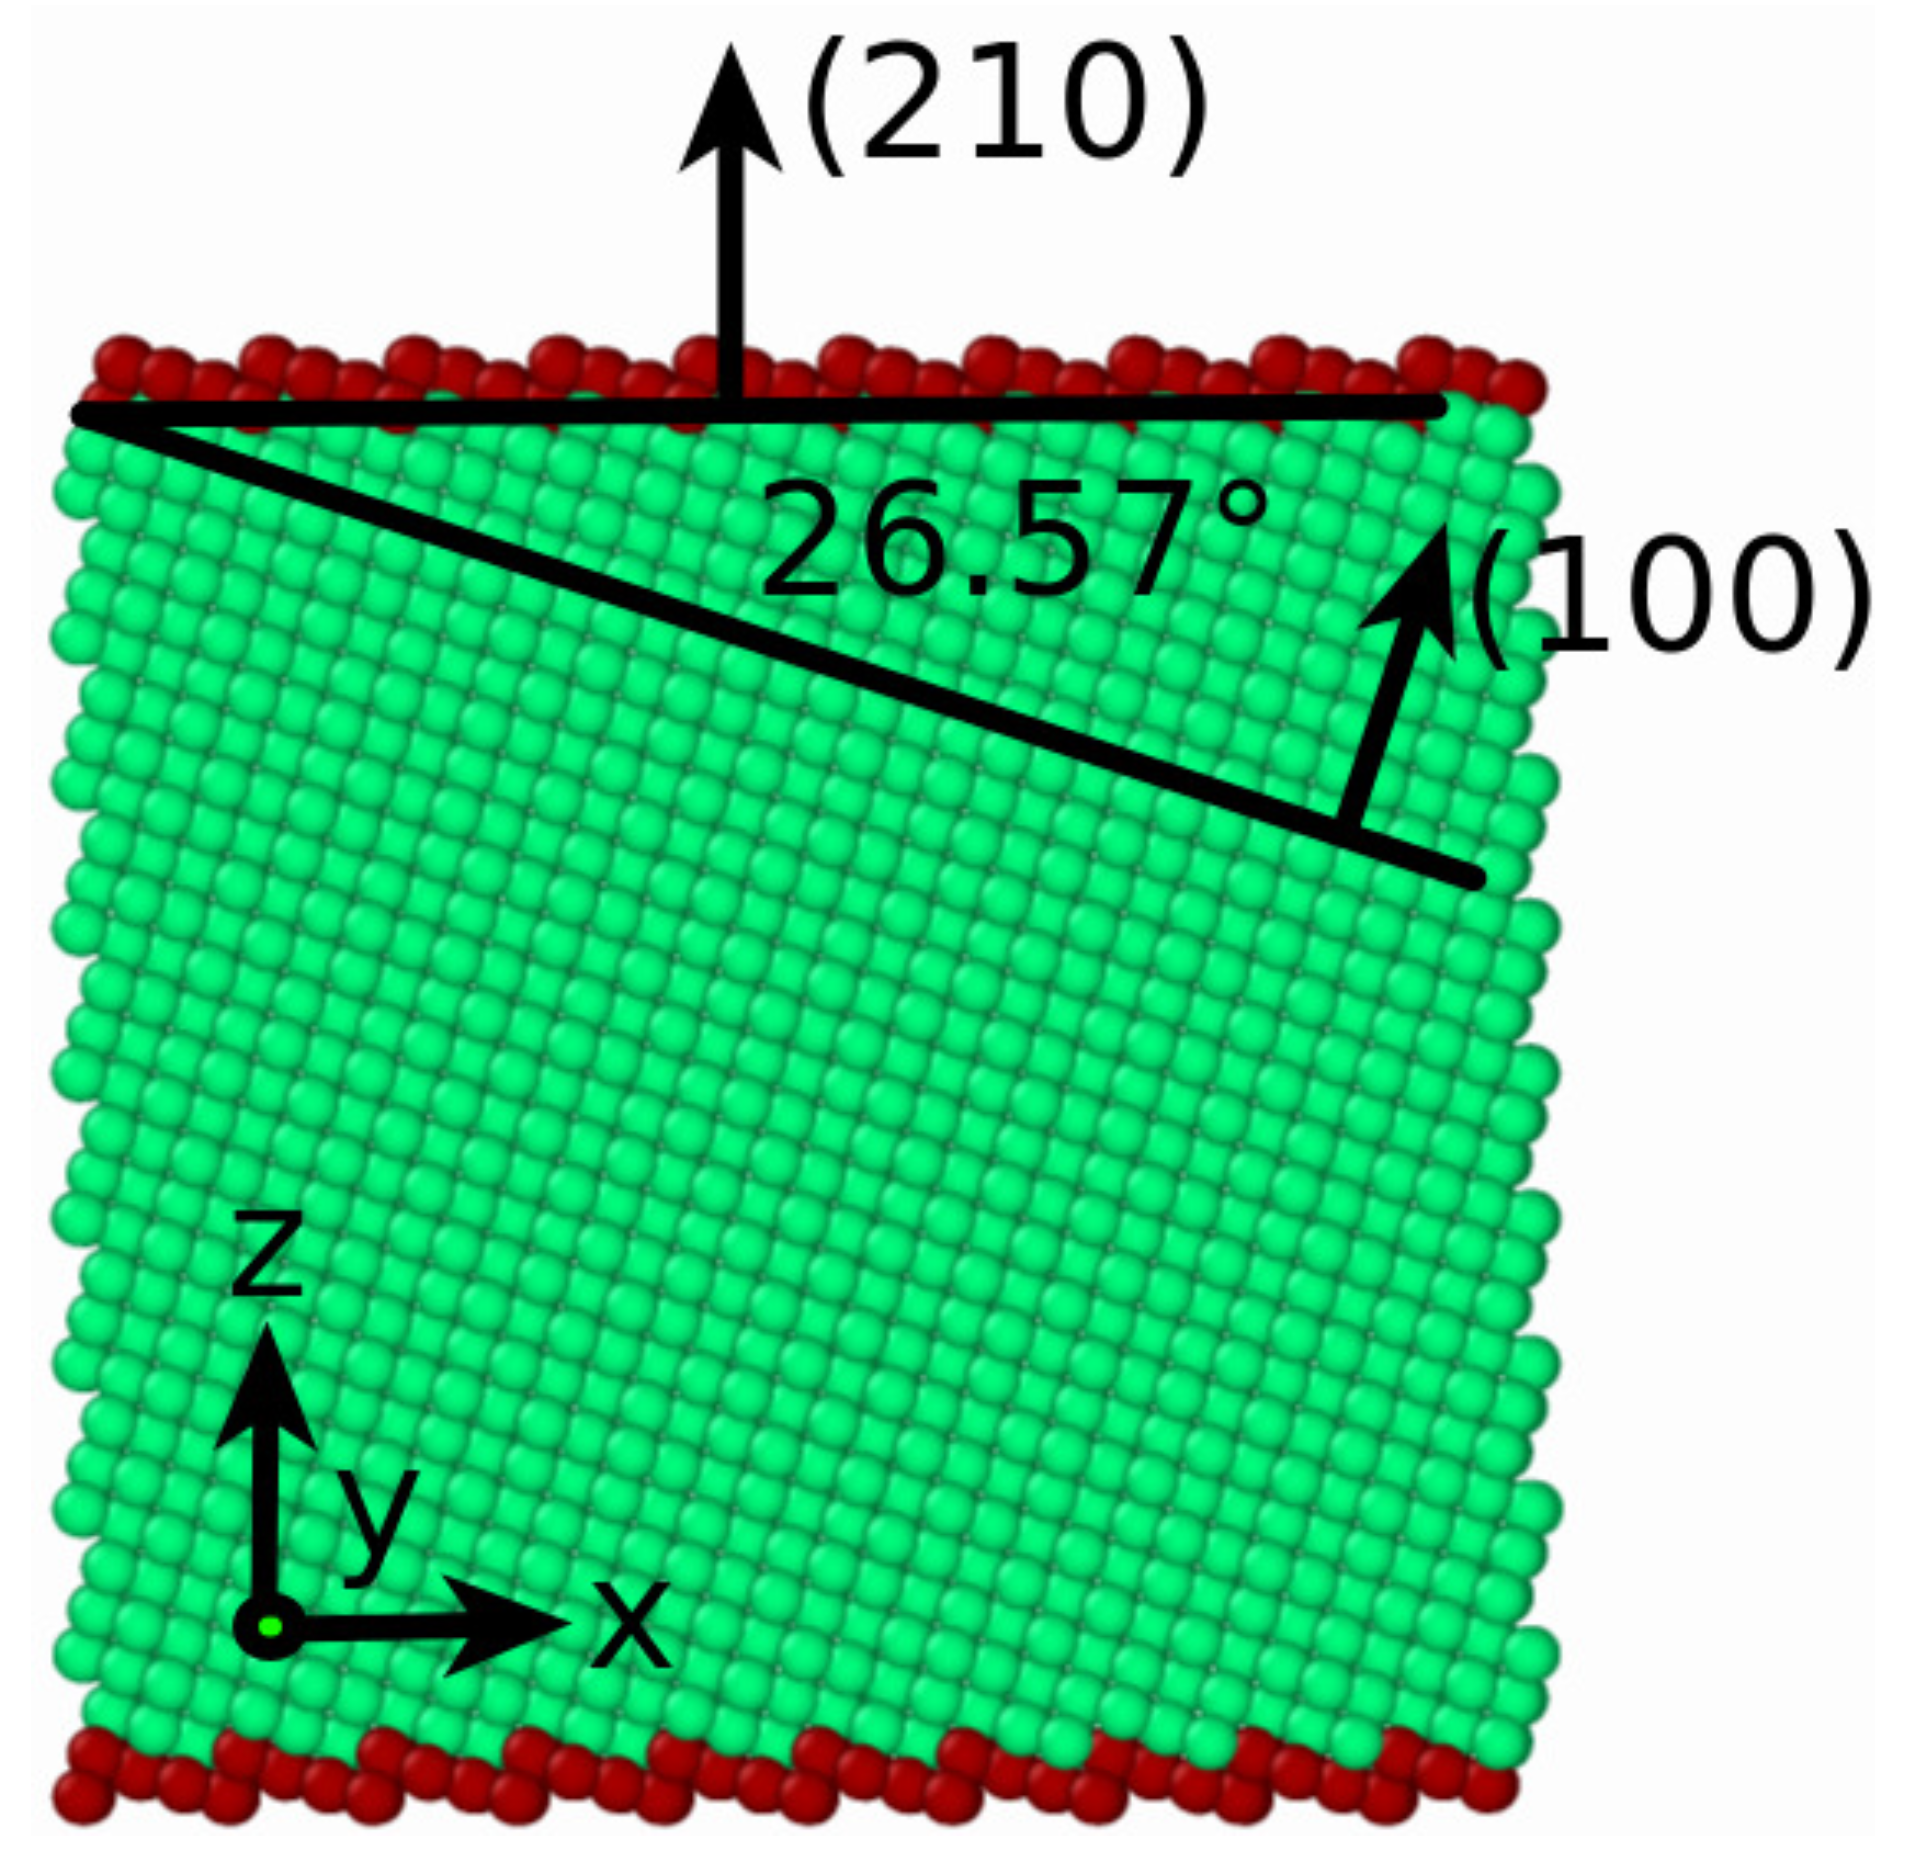
We studied (100) and (110) surfaces of face-centered-cubic (fcc) and body-centered-cubic (bcc) Fe, as well as the higher-indexed (
hk 0) planes interpolating between (100) plane and (110) plane. They can be described by the tilt angle towards (100) plane,
, given by
which denotes the rotation angle around the [001] axis, as indicated in
Figure 1. This figure also introduces our coordinate system; the
z axis points normal to the free surface, while the
y axis is the [001] direction.
Table 1 lists the surfaces studied in this investigation.
Our samples were thin films containing two free surfaces in
z direction; in
x and
y direction, we employed periodic boundary conditions to mimic laterally infinitely extended surfaces. Note that tilted surfaces exhibit a periodicity with a length of
where
a denotes the lattice constant. Correspondingly, the system size must be chosen such that an integer number of these period fits into the lengths of the simulation volume in
x and
z direction cf.
Figure 1. The length in
y direction was chosen as an integer multiple of
a. The simulation systems contained roughly 22,000 atoms. We created bcc crystallites to study the austenitic transformation; these have extensions of approximately 64 Å × 64 Å × 64 Å in
x,
y,
z direction, respectively; the exact numbers depended on the periodicity length
d, and hence on the surface studied. Analogously, for the study of the martensitic transformation, we created fcc crystallites with extensions of 80 Å × 80 Å × 40 Å. The effect of the system size on the transformation behavior is presented in the
Appendix.
The samples were relaxed using the method of energy minimization by conjugate gradients [
19] at 0 K. Then, we equilibrated the systems for 10 ps at the starting temperature. The starting temperature was 10 K for the austenitic transition, and 400 K for the martensitic transition. The transformations were induced by heating or cooling the system at a prescribed rate, i.e., 1 K/ps for the austenitic transformation and 0.33 K/ps for the martensitic transformation. During heating/cooling, the temperature was controlled by a Nose–Hoover thermostat [
20,
21], and the Cartesian components of the pressure were kept constant at zero by a barostat. This means that we accomplished strain accommodation not only in the direction normal to the surface, but also within the surface plane. The phase transformation temperature,
, was determined from the change of the volume size with temperature; a sudden jump of the system volume indicates the transformation.
Iron atoms interact via the Meyer–Entel interaction potential [
22], which implements the phase transition between the
and
phase [
23]. Note that the equilibrium transition temperature
of this potential is
K, as determined by both free-energy calculations [
23,
24] and dynamic molecular dynamics simulations [
25,
26]. This temperature is smaller than in experiment (1184 K); this feature of the Meyer–Entel potential is well-known and implies that the results presented here need to be scaled appropriately to apply to realistic systems.
All calculations were performed with the open-source LAMMPS code [
27]. The local lattice structure was determined by the common-neighbor analysis (CNA) [
28,
29]. The free software tool OVITO [
30] was used for visualization of the local structure of the atoms.
The surface energy,
, was calculated from the energy difference of a thin film (containing two surfaces, each of area
A) and a bulk material containing the same number of atoms,
N:
where
is the potential energy of the thin-film system and
is the cohesive energy. The surface energies increased for bcc-Fe in the order of (110), (100), and (111); and for fcc-Fe in the order of (111), (100), and (110). This order is the same as that found in previous studies [
31,
32]. We note, however, that the magnitude of the surface energies obtained for the Meyer–Entel potential was somewhat smaller than in experiment [
32]. For the Meyer–Entel potential, the cohesive energy was 4.2784 (4.2407) eV for the bcc (fcc) structure; the lattice constant was 2.8655 (3.6862) Å.
3. Austenitic Transformation
As a reference, we first note that we also simulated the transformation of bulk iron in the absence of any surface; this was done by using periodic boundary conditions in all Cartesian directions. For a system with 22528 atoms in a cubic box of 64.83 Å edge length, we found a of 1458 K. In the following, we report on how the presence of a surface may lower the phase transition temperature.
3.1. (100) Surface
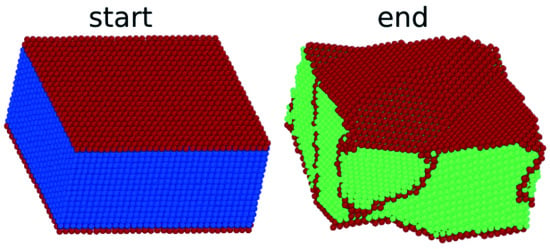
We first studied the austenitic transformation of a
surface.
Figure 2 demonstrates that the material completely transforms into the fcc structure, without any defects formed. An inspection of the atomistics of the surface shows that that
surface was transformed to the
surface. In addition, the
direction and the
direction were transformed into the
direction and the
direction, respectively. This is the classical Bain orientation relationship [
33]:
During the transformation, the surface area shrunk by 18%. In addition, the (specific) surface energy also decreased from a value of 1.73 J/m2 for the surface to a value of 1.57 J/m2 for the surface. In total, the gain in surface energy assisted the transformation. The transition temperature was K; compared to the values cited below, this is a rather small value.
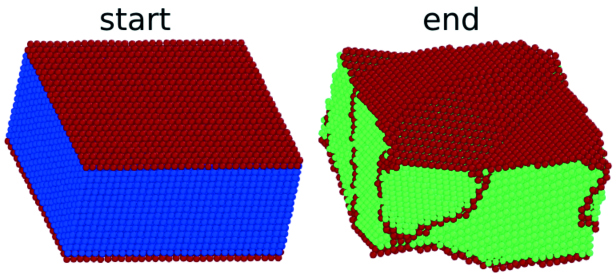
3.2. (110) surface
The transformation of a bcc crystal with a (110) surface proceeded very differently. While the bcc lattice transformed completely to a close-packed structure, it resulted in hcp rather than fcc phase. Note that the energy difference between the two close-packed phases—hcp and fcc— in the Meyer–Entel potential is tiny, i.e., 2.9 meV/atom, while the bcc phase has a 40 meV/atom smaller energy [
25,
34]. In simulation studies of the austenitic transformation in Fe, typically both close-packed phases, fcc and hcp, are created [
16,
35,
36].
Figure 3a shows the sample before and after the phase transition. The changes in surface area (
%) and crystal thickness are considerably smaller than for the (100) surface. We see that the
plane perpendicular to the surface was conserved over the phase transition and transforms into the
plane. Stacking fault planes run perpendicular to the surface. Their creation leads to a considerable roughening of the surface.
An atomistic view of the conserved planes (
Figure 3b,c) shows how the transition occurs in this plane. The
direction transforms into the
direction by an expansion. while the
-direction transforms into the
direction by a compression. This transition process was described by Mao et al. [
37] and Wang and Ingalls [
38]:
It is the bcc–hcp analog to the Nishiyama–Wassermann [
39,
40] pathway for the bcc–fcc phase transition. We may assume that, if the Meyer–Entel potential preferred the fcc structure, we would probably see the Nishiyama–Wassermann pathway for this surface.
The specific surface energy of the original surface is 1.35 J/m2. After the transformation, has an energy of 1.33 J/m2. Both values are small, since the surfaces are close-packed. The small energy difference between the surface structures is compatible with a high transformation temperature, K.
3.3. (111) Surface
We could not observe the austenitic transformation of thin slabs with
surfaces, even when heating the specimen up to 2000 K. Note that the bulk specimen transformed already at 1485 K; hence, it appears that the (111) surface actually impedes a transformation that would have occurred in the absence of any surface. Even homogeneous nuclei—that started the transformation in the bulk specimen—would not lead to the transformation in thin slabs bounded by the
surface. When analyzing the bulk transformation behavior in detail, we observed that it was governed by the Bain path, similar to the thin film with a
surface. This path is, however, not available for the
surface, since the
surface plane was not conserved in this transformation path; actually, it was not conserved in any of the transformation pathways observed in our study. Hence, the nucleation of the close-packed phase at this surface was impeded. If the transformation started homogeneously in the bulk following the Bain path, the
surfaces were subjected to strong deformations, similar to the transformation of the
surface presented in
Section 4.2. Even the high specific surface energy of 1.76 J/m
2 did not help to induce the phase transition. We conclude that this surface works rather as an obstacle to the phase transition.
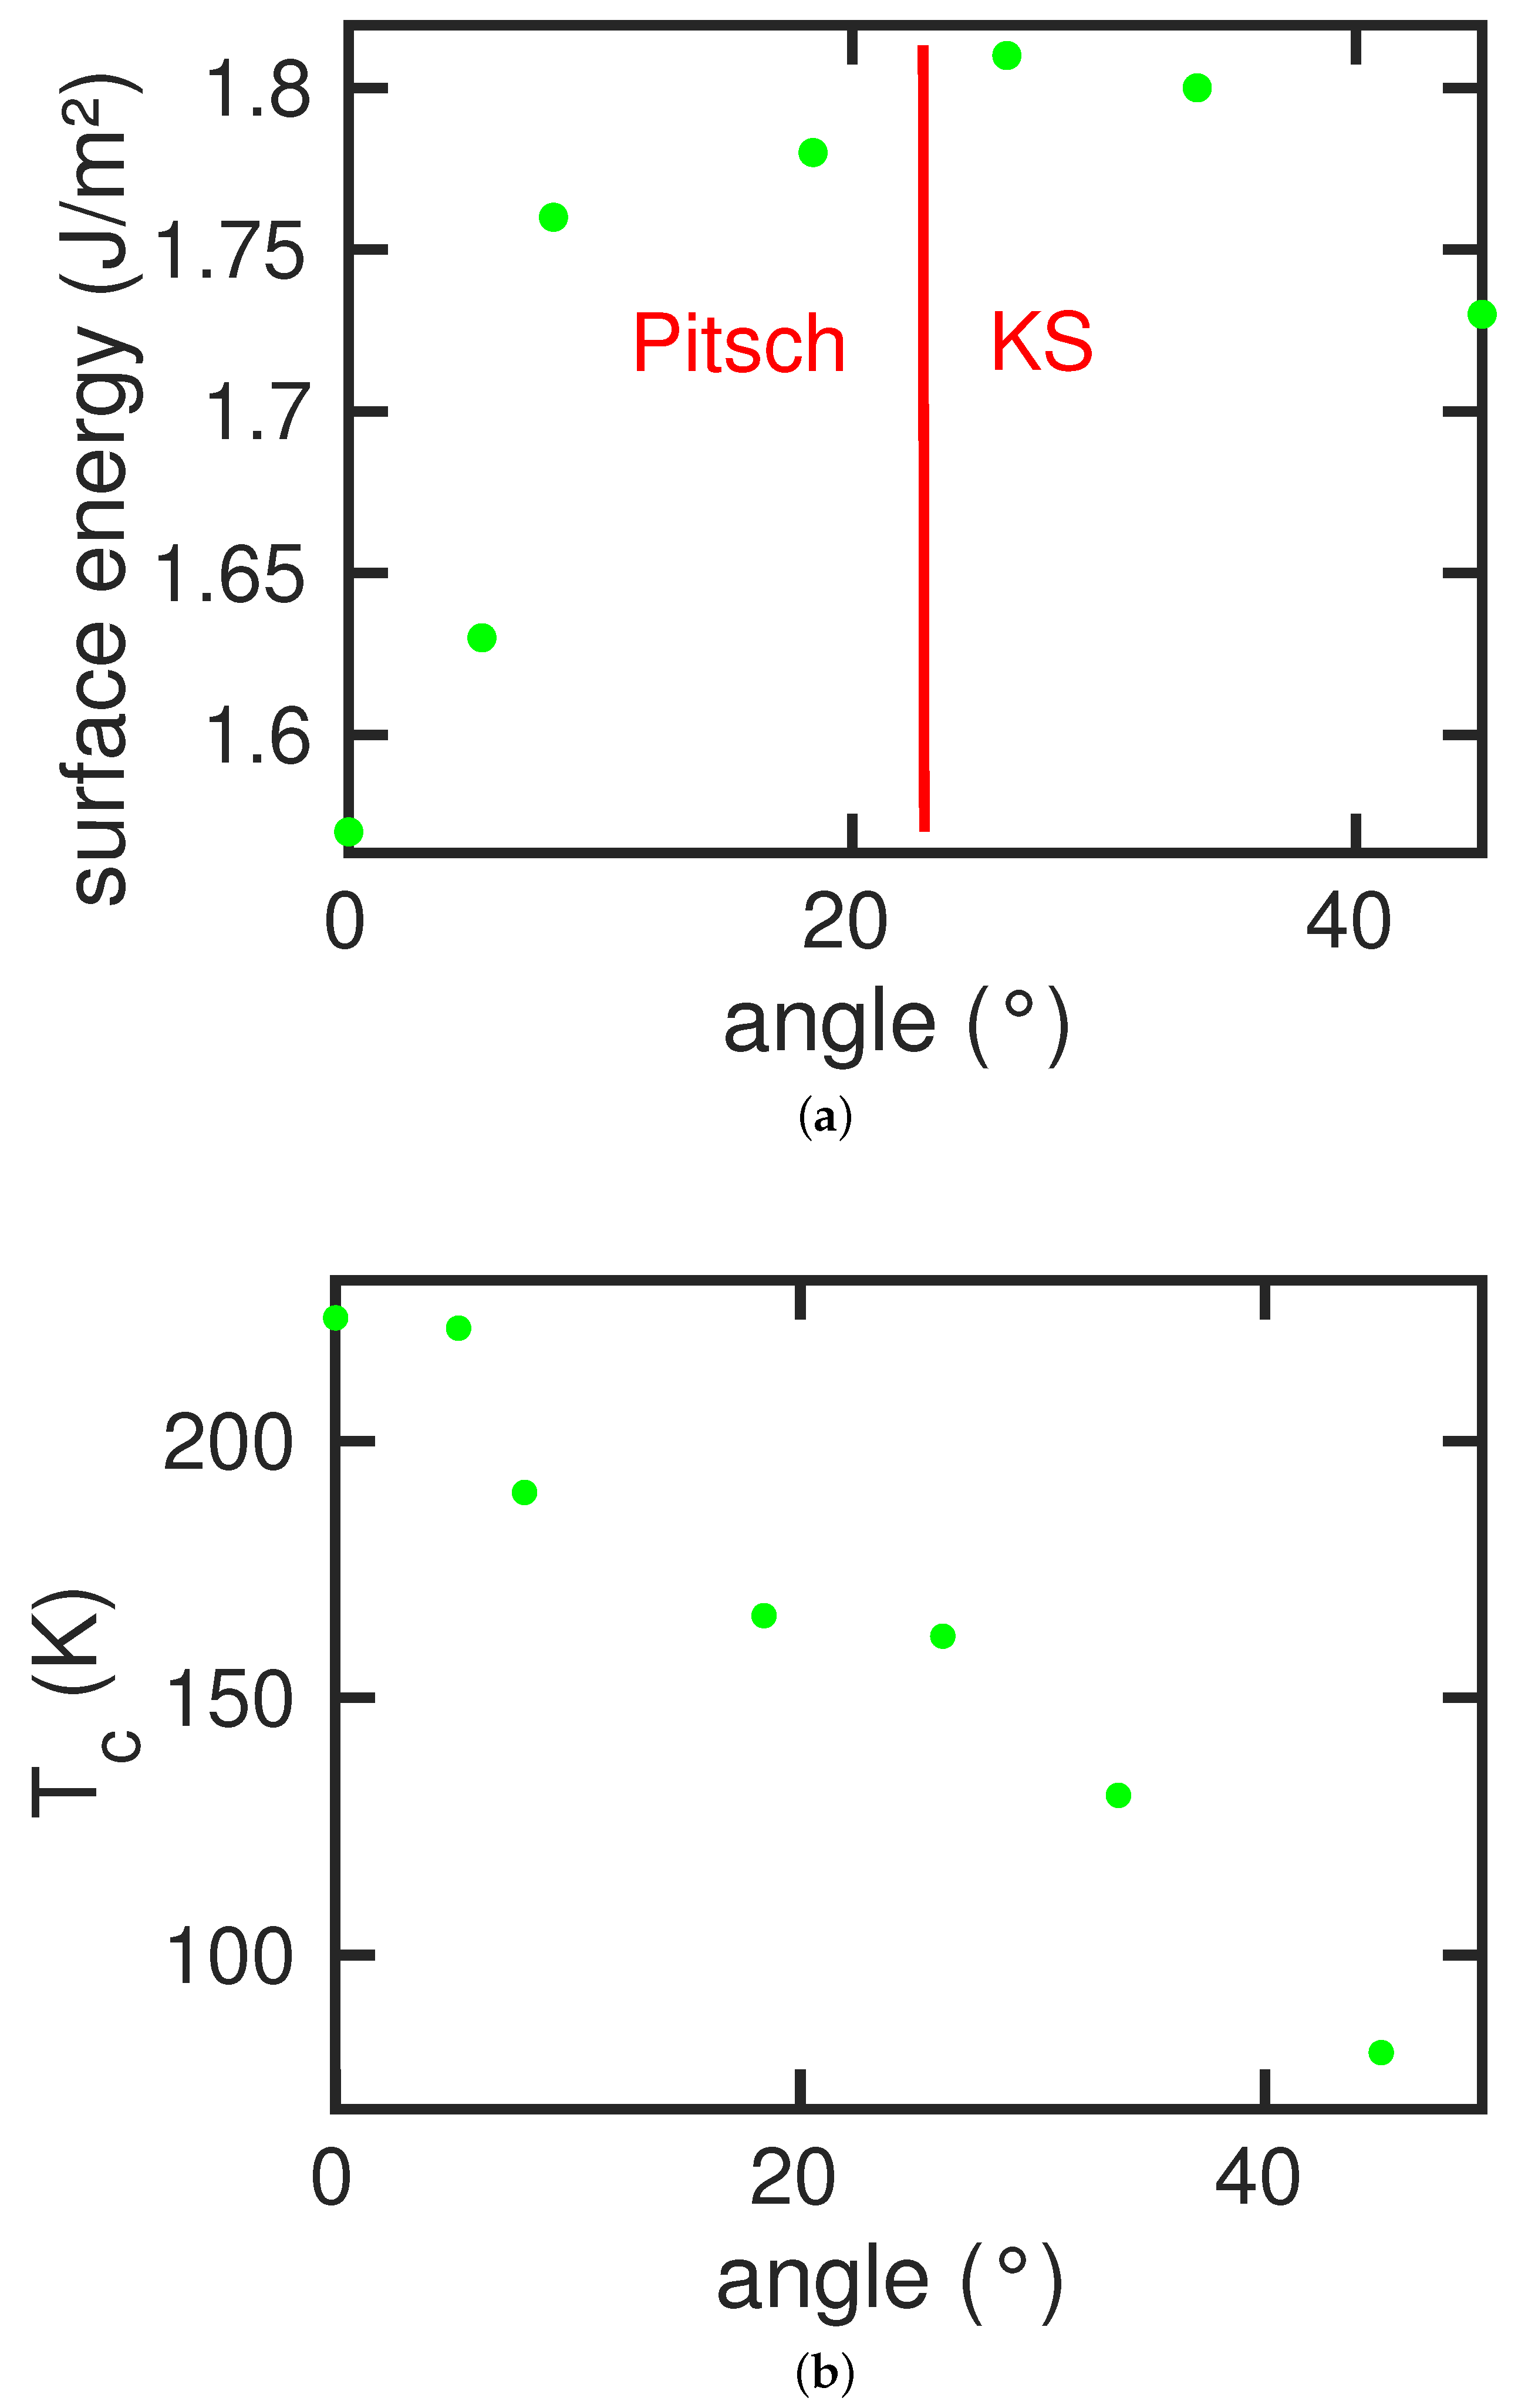
3.4. Tilted Surfaces
3.4.1. Specific Surface Energy and Phase Transition Temperature
The surfaces used in this study are assembled in
Table 1. We display in
Figure 4a the variation of the specific surface energy on the tilt angle. The
surface,
, has a rather high specific surface energy of 1.73 J/m
2, while the
,
, is close-packed and has a low specific surface energy of 1.35 J/m
2. Slight misorientations from the
surface lead to faceting; the surface develops steps, so that the specific surface energy increases somewhat. Beyond a maximum at around
–
, the energy decreases with the packing density of the surface.
All these tilted surfaces show an austenitic transformation upon heating.
Figure 4b displays the transformation temperatures
. Note that
and
are anticorrelated; the surfaces with the highest values of
transform most easily, i.e., at the lowest temperatures. In addition, note that all transformation temperatures are lower than for the bulk sample,
K; the existence of a surface lowers the phase transition temperature for all surfaces investigated here.
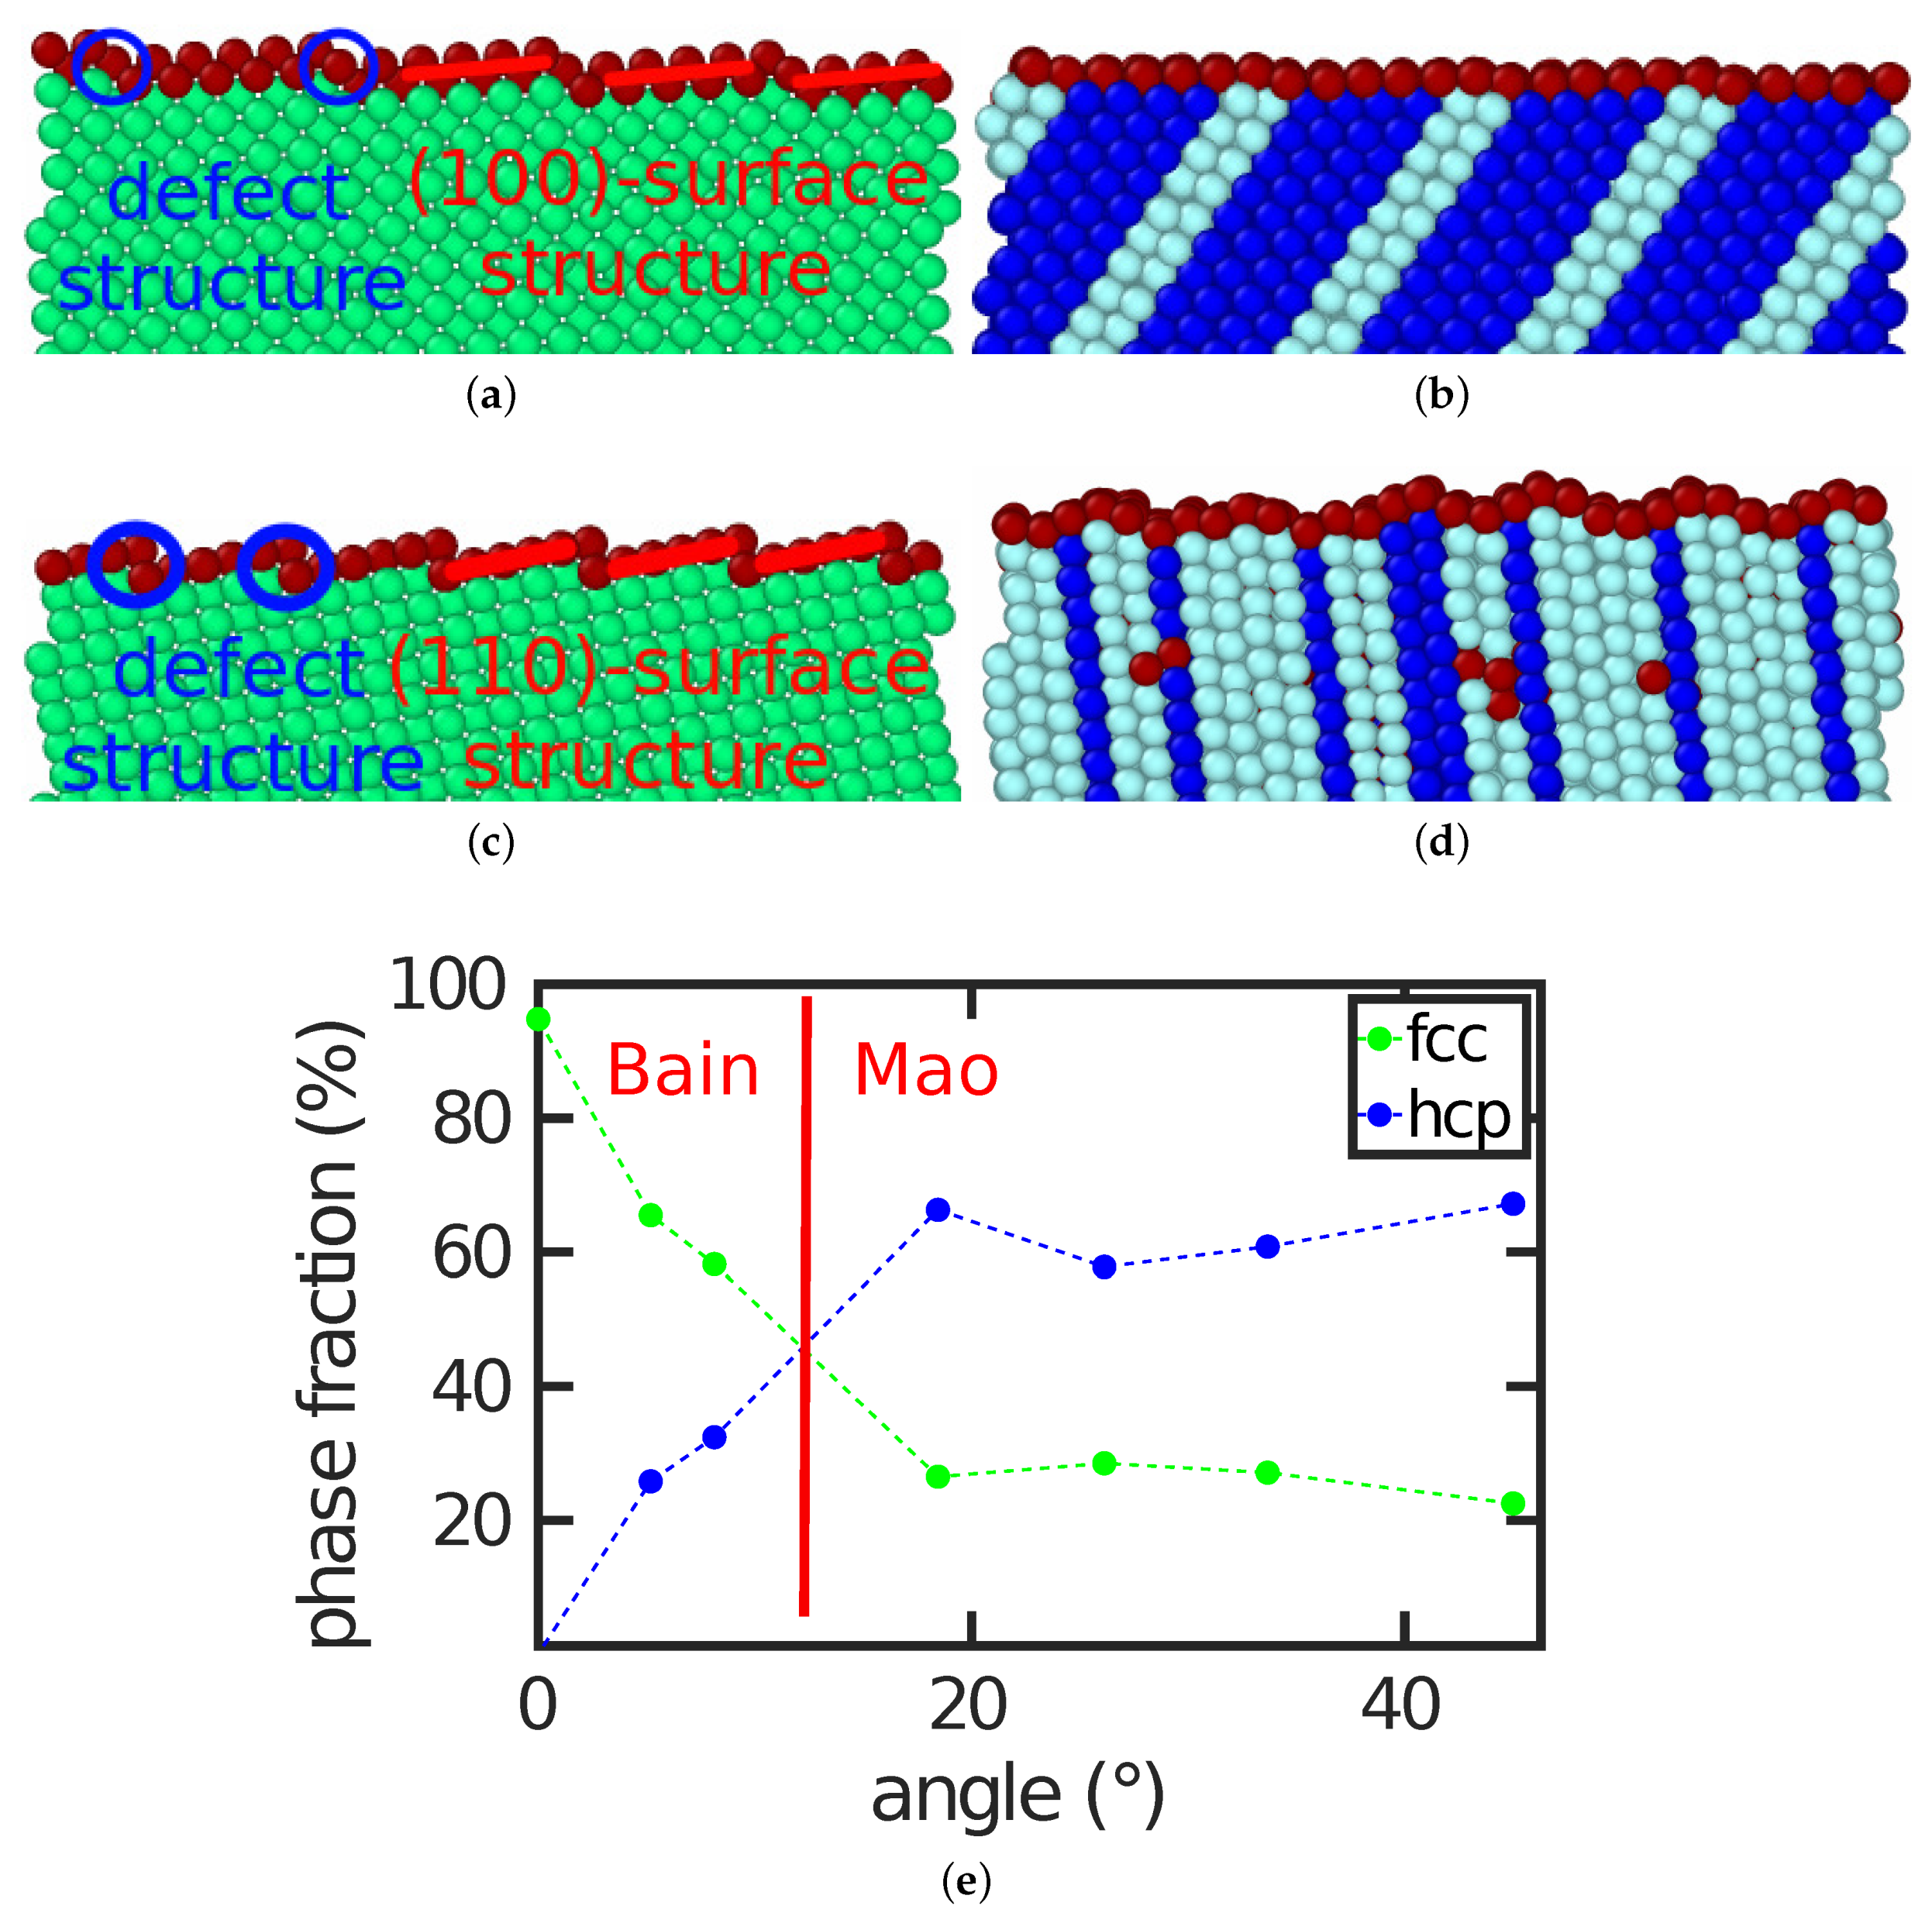
3.4.2. Transformation Path
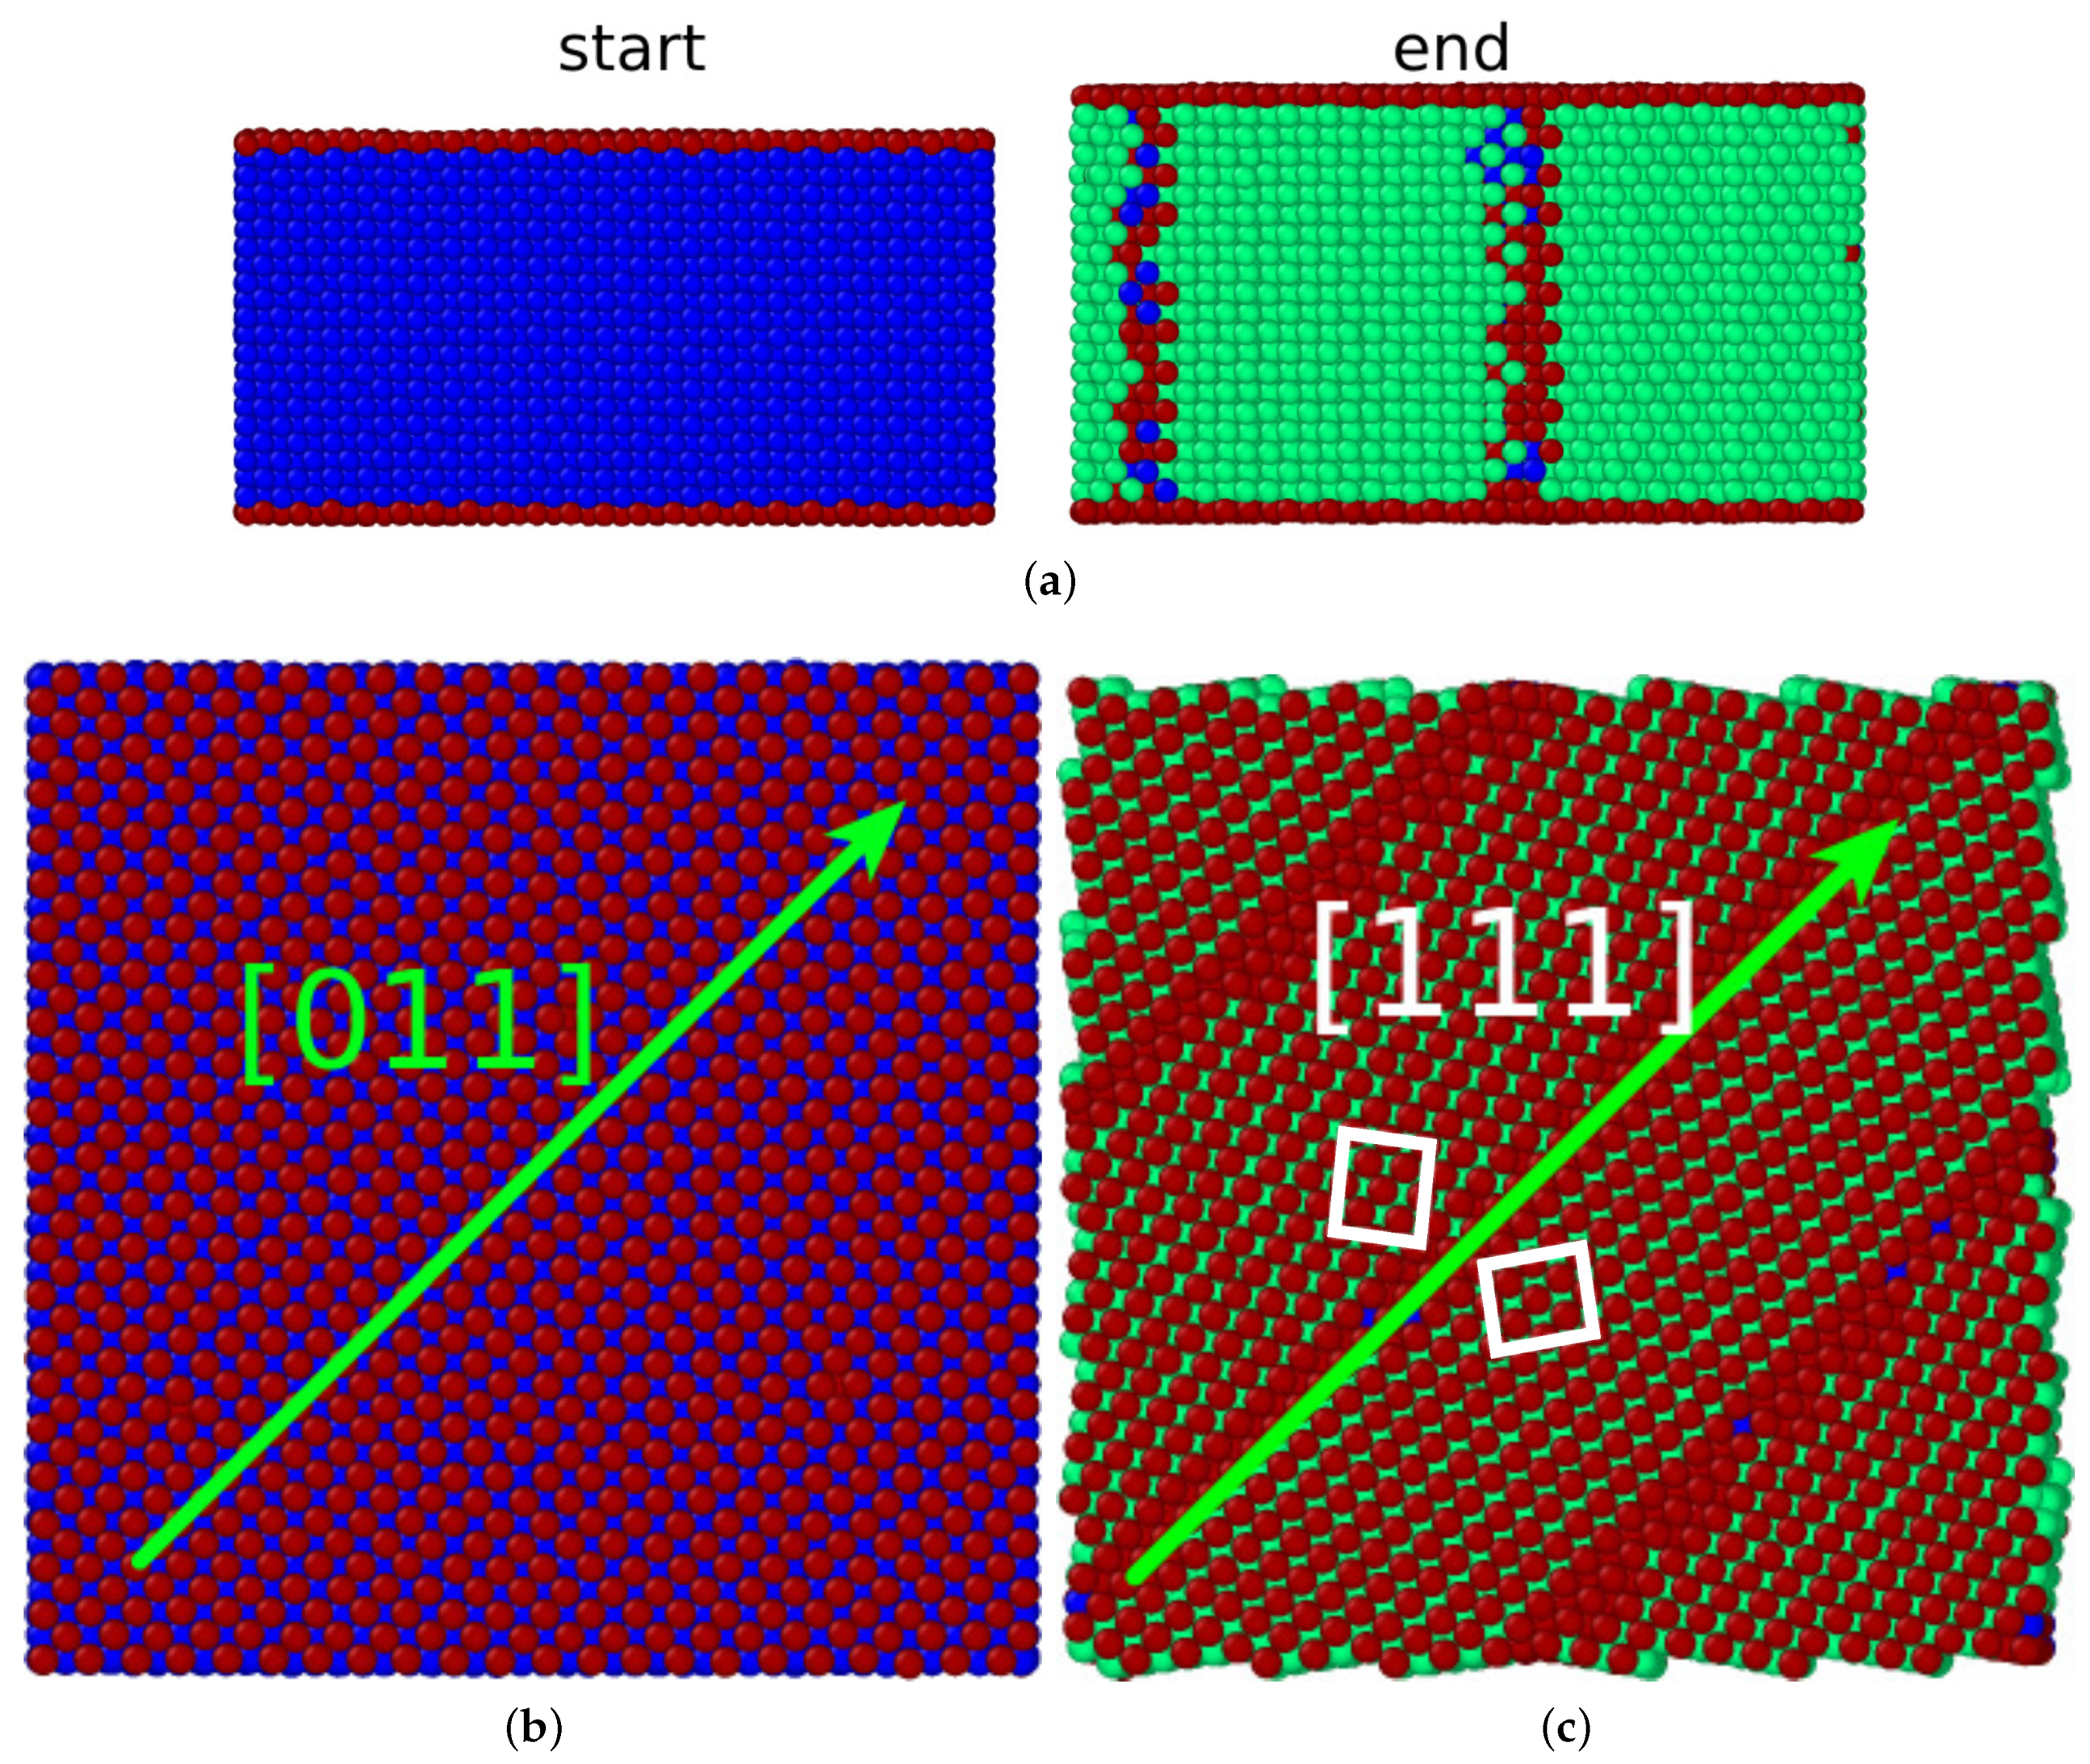
A surface with a tilt angle of transforms via the Bain path and a surface with a tilt angle of with the Mao pathway. In this section, we present how intermediate surfaces transform.
Figure 5a,b answers this question for the example of the (11 1 0)
surface with a tilt angle of
. In this case the surface topography plays an important role. The surface features (100) facets, marked in
Figure 5a, with defects (steps) in between. Four of these periodic defect structures fit into the size of the bcc specimen shown. After the transformation, the same number of four hcp plates were found in the transformed fcc sample; these can be seen as stacking fault planes in the dominant fcc structure. This demonstrates how the surface structure affects the transformation behavior.
For higher angles, the topography changed. The example of the (3 2 0)
surface with a surface angle of 33.69
is shown in
Figure 5c,d. It is facetted featuring (110) facets. Now, the correlation between the six surface steps existing in the bcc structure of our simulation volume and the seven stacking fault lines generated in the transformed structure is less clear; the surface is no longer planar but shows a considerably roughened structure that is correlated with the stacking fault planes.
Figure 5e provides an overview of the fractions of hcp and fcc phase generated by the transformation. Beyond a tilt angle of
, hcp was the dominant phase generated. This is correlated with the fact that, beyond this angle, the Mao path is preferred, while, for smaller angles, where the fcc phase is favored, the systems follow the Bain pathway.
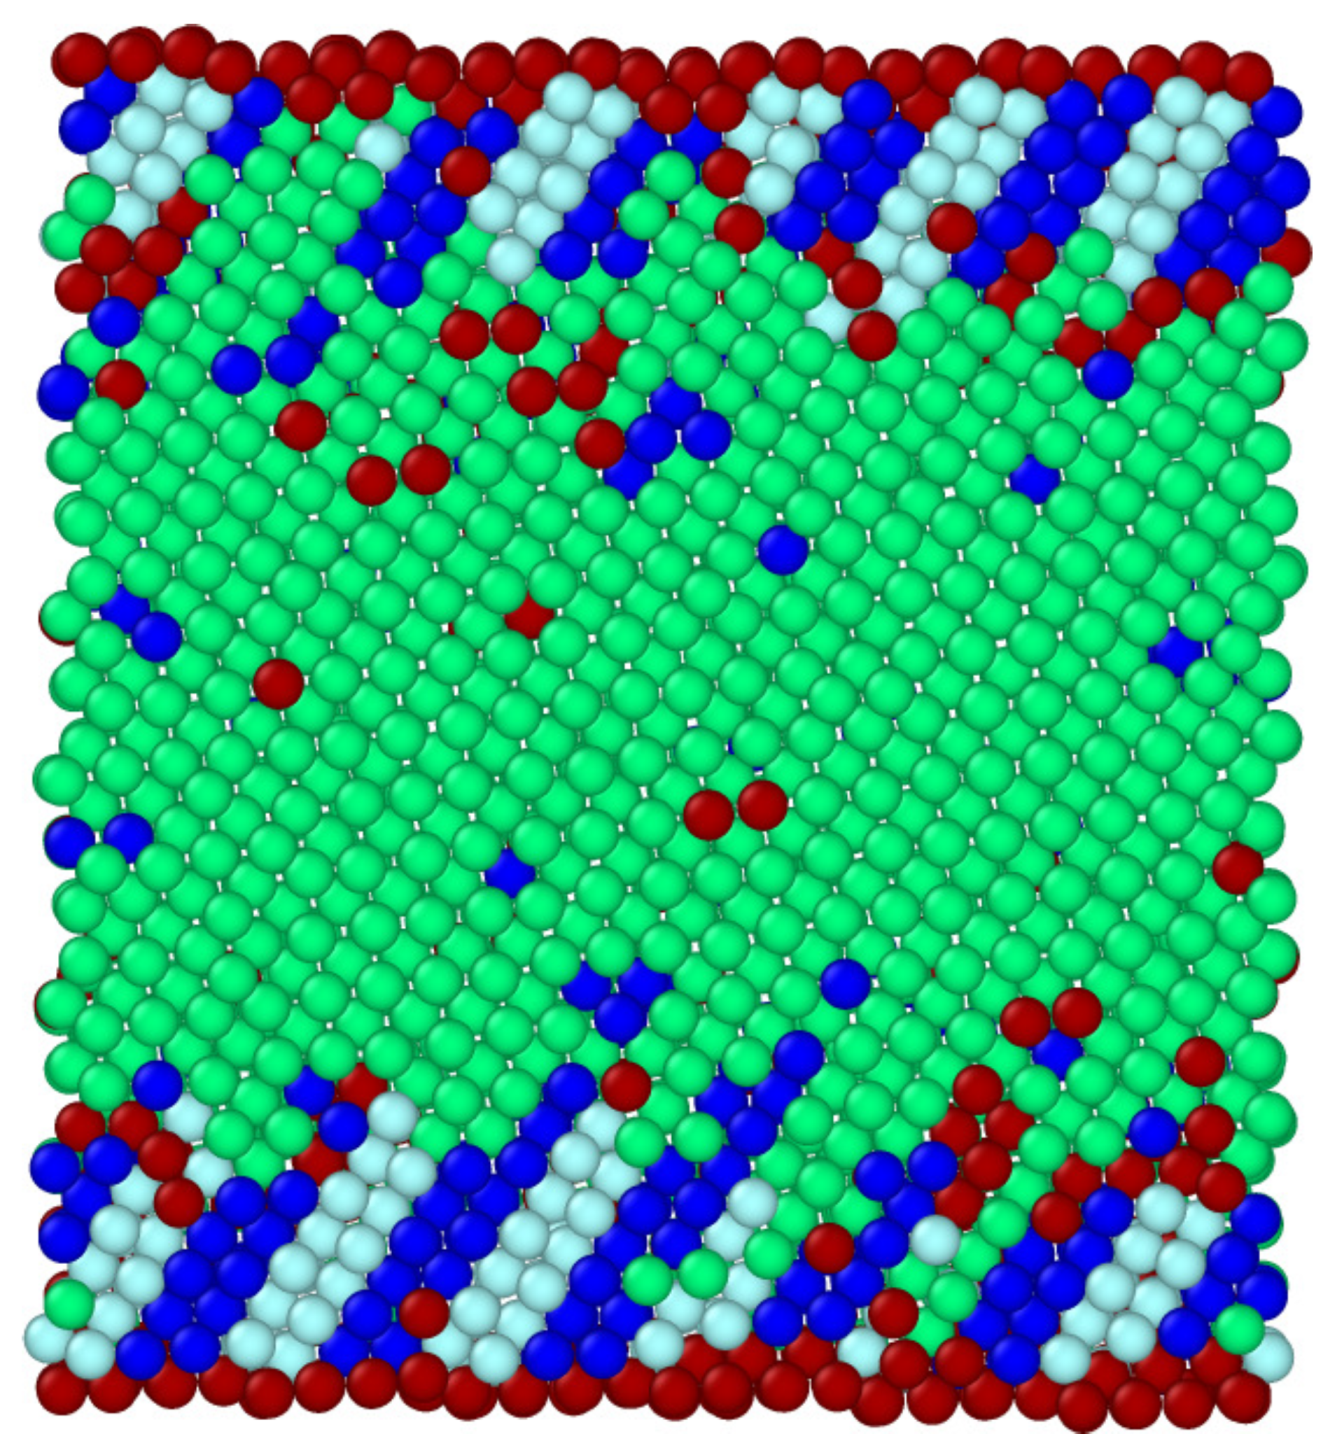
In all the tilted surfaces investigated, the new phase nucleated at the surface.
Figure 6 exemplifies this for the case of the (7 1 0)
surface, but we observed this nucleation path for all austenitic transformations studied. This behavior appears plausible, since without a surface the bulk system would transform only at substantially higher temperatures, 1458 K.
As discussed above, high-energy surfaces have a tendency to nucleate the new phase earlier. This reduction can be explained firstly by the reduction in specific energy density (see
Section 3.4.1) and secondly by the reduction in total surface area. The surface area of the transformed system decreased for all tilt angles; however, the reduction was reduced for larger
, since more hcp phase was formed. While for
, the reduction of the surface area was 18%, it was reduced to only 7% for
.
4. Martensitic Transformation
In contrast to the austenitic transformation, in our simulations, the bulk fcc crystal under periodic boundary conditions did not transform martensitically under cooling. The reason hereto lies in the thermal fluctuations of the atom positions, which are necessary to overcome the kinetic barrier for nucleating the new phase. These were substantially smaller in the temperature range of the martensitic transformation than for the austenitic transformation. However, we show in this section that the presence of a surface can trigger the martensitic transformation. Note that, in an experiment, bulk fcc-Fe will transform as soon as the temperature falls below the equilibrium transition temperature,
, and a sufficient undercooling (of the order of 100 K) provides the necessary energy to surmount the strain energy arising from the volume difference of the two phases [
41,
42]. We emphasize that, in our present study, we investigated only the thermally induced transformation; the effect of mechanical load to induce the martensitic transformation has been studied elsewhere [
12,
34,
35,
36,
43].
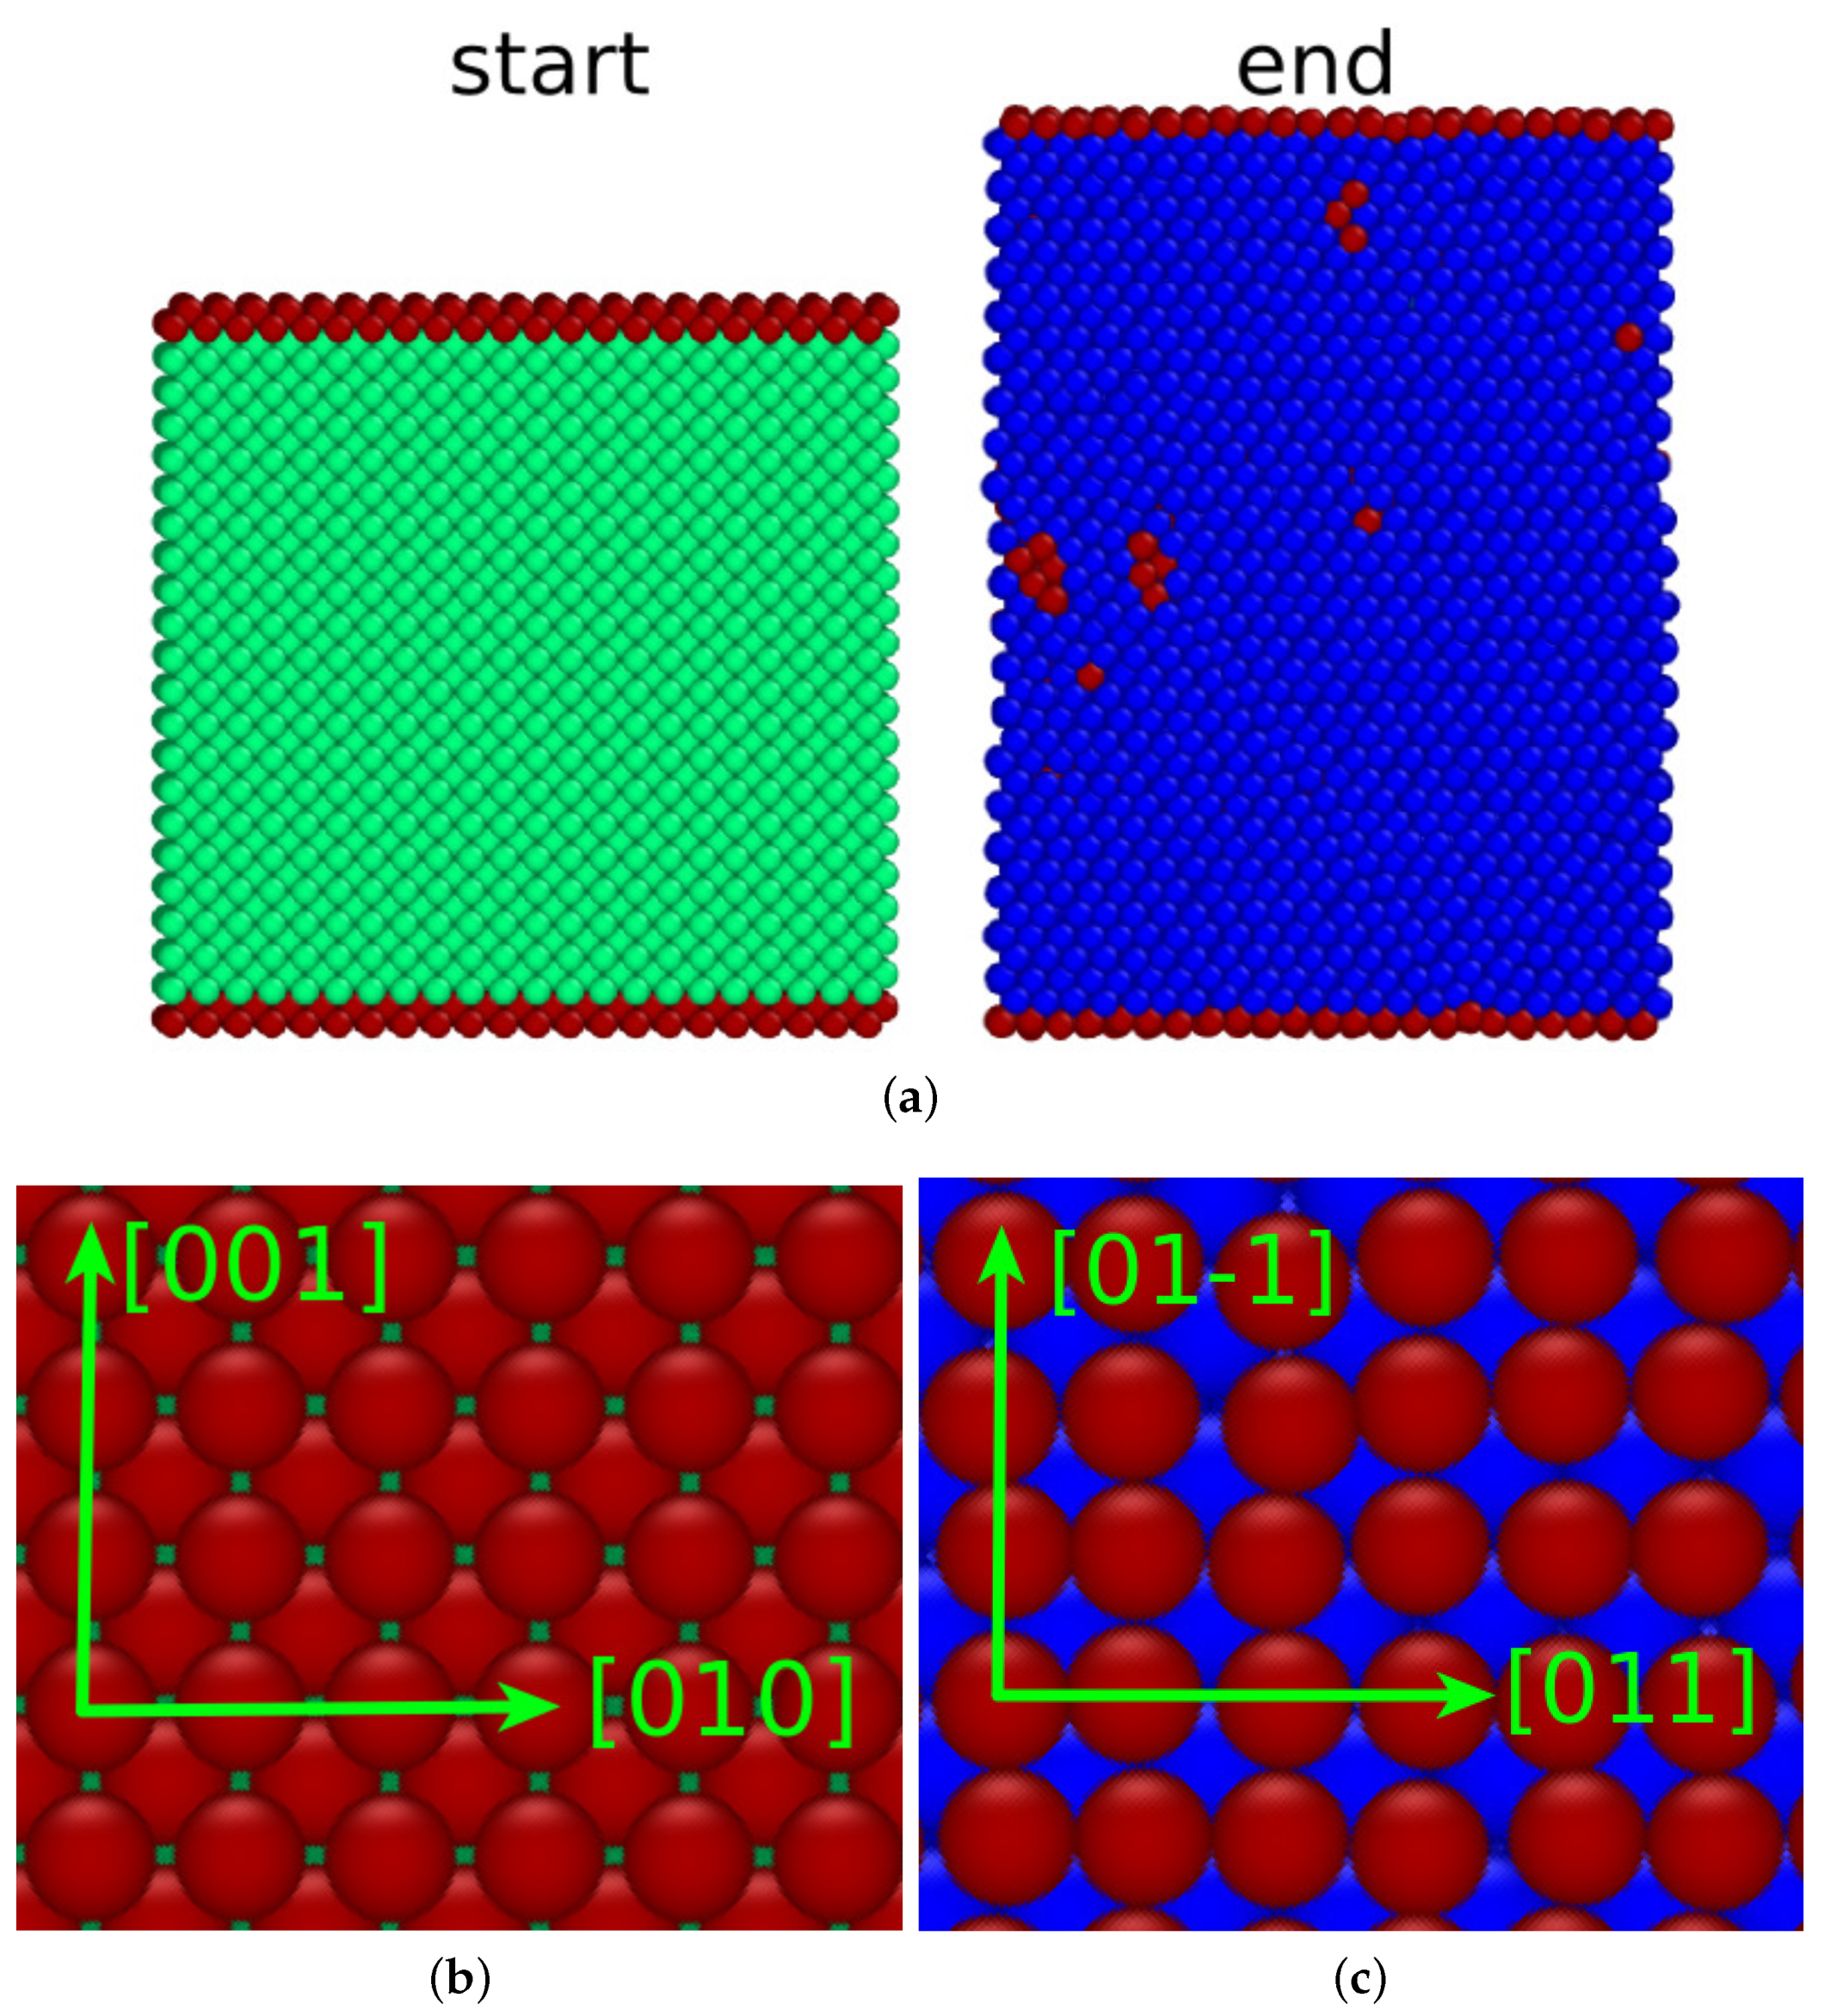
4.1. (100) Surface
Figure 7 shows the martensitic transformation of an fcc sample with a (100) surface. It transforms to a bcc crystal containing a microstructure. A detailed analysis (
Figure 7c) shows that the structure is an ordered array of twins. The crystal deformation was small; the surface shrunk by 1% by the phase transition. We note that the new phase nucleated at the surface.
Figure 7b,c shows that the
surface was transformed into the close-packed
plane. In addition, the close-packed directions were conserved: the
direction was transformed into the
direction. This is the signature of the Pitsch orientation relationship [
44]:
The twin boundaries established under the transformation are planes.
In addition, in this transformation, the specific surface energy was reduced; here, the reduction was from a value of 1.57 J/m2 for the surface to a value of 1.35 J/m2 for the surface. This feature correlates well with the rather high martensitic transformation temperature of K.
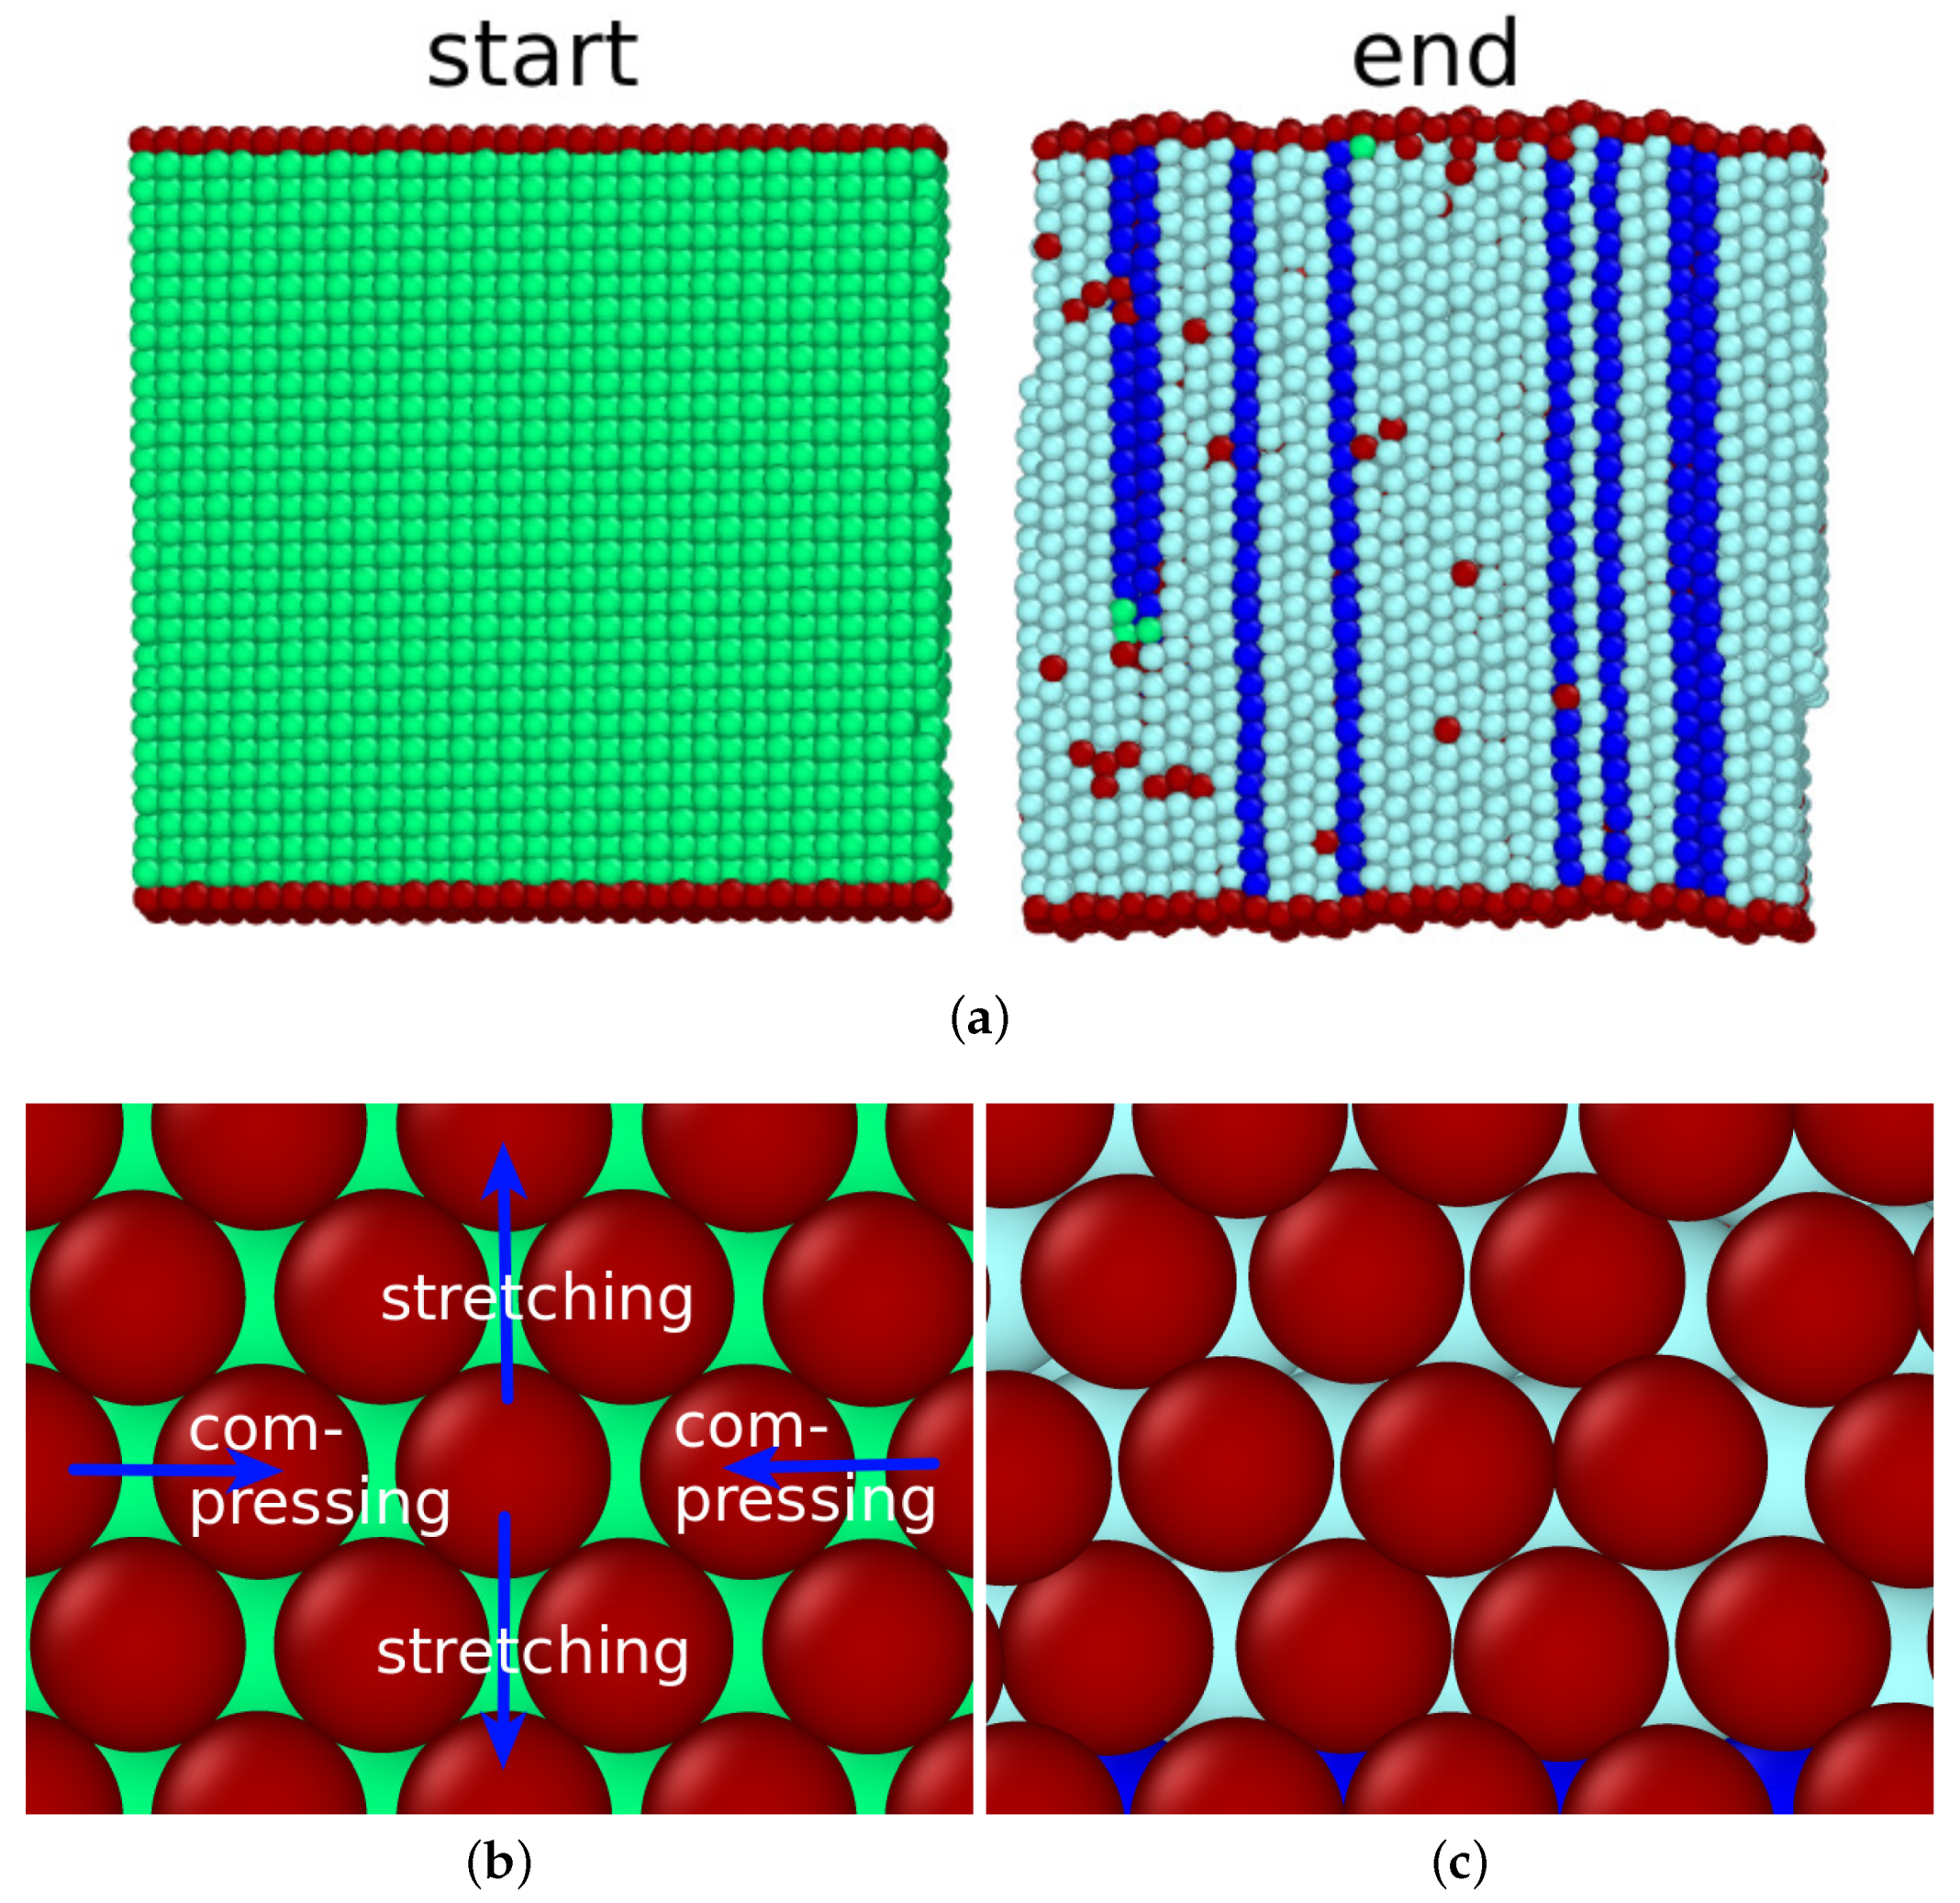
4.2. (110) Surface
Similar to the
surface, the
surface is not conserved under any orientation relationship. However, we observed a phase transition. In contrast to all other surfaces studied here, the flat surface structure was destroyed during the transition (cf.
Figure 8a).
In addition, this transformation conserved close-packed directions and planes. The
direction transformed into the
direction, as demonstrated in
Figure 8b,c. This figure displays the close-packed
plane that transformed into the
plane. This is the signature of the Kurdjumov–Sachs orientation relationship [
45]:
In the Kurdjumov–Sachs orientation relationship, usually twinning is observed. Indeed,
Figure 8c shows the twin structure that developed under the transformation. The twin boundaries were again built by
planes. Under the Kurdjumov–Sachs orientation relationship, the surface plane cannot be conserved, resulting in the strongly distorted surface seen in
Figure 8a after the transformation. The new surface is strongly facetted and consists of
and
planes. Consequently, the transformation did not start at the surface but in the bulk (see
Figure 8d).
This transformation had a very low transformation temperature, 81 K. This is in line with the fact that the surface did not induce the transformation and did not even assist in nucleating the new phase, despite the relatively high surface energy of 1.73 J/m2. However, note that, in a periodic volume, the martensitic transformation would not happen at all; hence, the presence of the surface, and its ability to provide free volume for coordinated atom movement, is key to facilitating the transformation.
4.3. (111) Surface
Similar to the case of the surface, the surface did not transform. This surface is close-packed with a small surface energy, 1.40 J/m2. It was not conserved under any orientation relationship with the bcc phase.
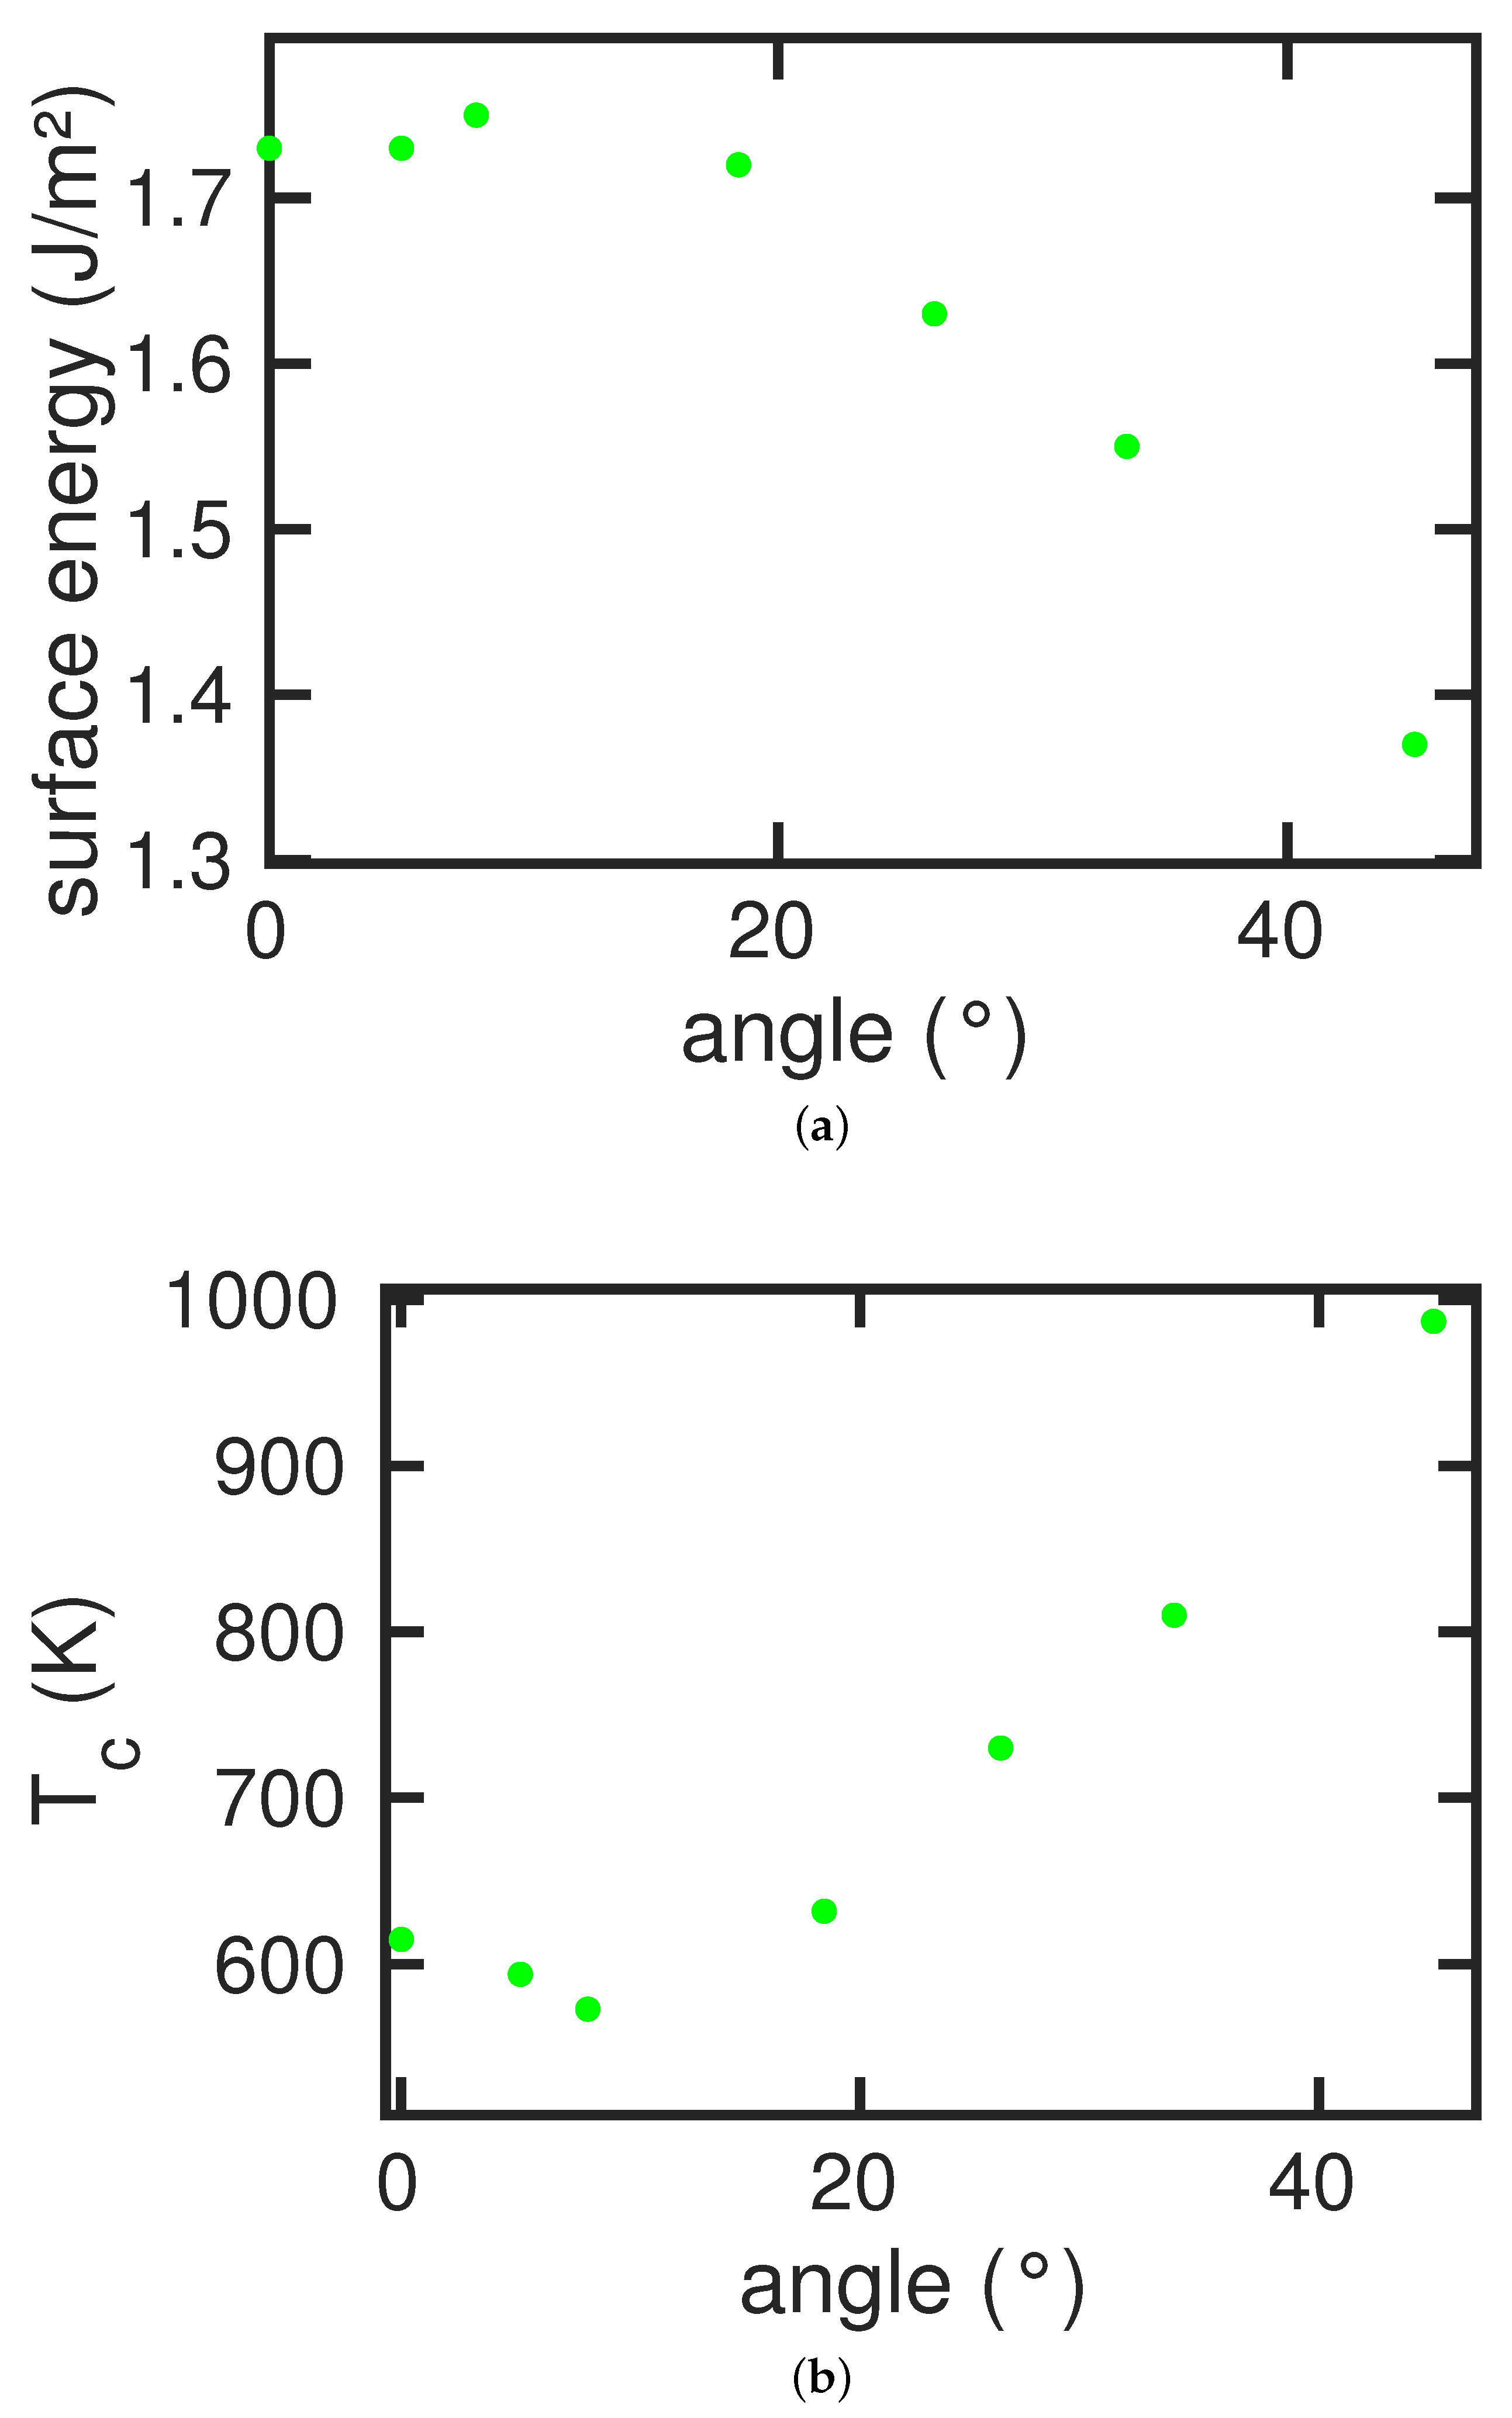
4.4. Tilted Surfaces
Figure 9a shows the specific surface energy as a function of the tilt angle. Here, the
surface has the lowest energy, 1.57 J/m
2, and the more open
surface has a higher energy, 1.73 J/m
2. Due to surface facetting, tilted surfaces exhibit a maximum in surface energy, which occurs for tilt angles around
.
In this figure, we also show the dependence of the transformation path on the tilt angle. We observed the Pitsch path for angles below around and the Kurdjumov–Sachs path at larger angles.
The dependence of the martensitic transformation temperature,
, on the tilt angle is displayed in
Figure 9b. In contrast to the case of the austenitic transformation, here the transformation temperature did not follow the dependence of the surface energy. Rather,
decreased more or less continuously with the tilt angle. This shows that the surface energy was not the prime agent that influences the martensitic temperature. Here, the surface topography plays a decisive role. With increasing tilt angle, the surface included more
facets; since
surface was not conserved by the orientation relationships, nucleation of the new phase at the surface became harder and the transformation was delayed, decreasing the martensitic temperature. Thus, since the Kurdjumov–Sachs path, which operated here, does not conserve
surface, the transformed surface became strongly facetted.
Note that a bulk system under periodic boundary conditions does not transform martensitically. This means that the presence of the surface also here induced the transformation; this is even true for the case of the surface, which was not conserved under the orientation relationships. We argue that it is the high surface energy of this surface that helped induce that transformation; as a counter-example, we mention the surface which has a low specific surface energy (1.40 J/m2) and which does not feature any phase transformation.
We conclude that, in contrast to the austenitic transformation, where transition temperatures were dominated by the surface energy, the transformation path played a decisive role in the martensitic transformation. For dominating surface structure—that is for tilt angles beyond —the Kurdjumov–Sachs path takes over and the transformation was increasingly delayed.
5. Conclusions
We studied the influence of free surfaces on the martensitic and austenitic phase transformation in iron. Using periodic boundary conditions, i.e., in the absence of free surfaces, the austenitic transformation occurs at 1458 K for the system size adopted in this study, while the martensitic transformation does not take place. For surfaces that are not conserved under any orientation relationship—such as or —neither the martensitic nor the austenitic transformation occurs. This shows that orientation relations play an important role in starting the transition.
Indeed, for the single-indexed surfaces and , the austenitic transformation starts easily. The transformation at these two surfaces follows simple transformation paths, namely the Bain and the Mao et al. path, respectively. Higher-indexed surfaces, which interpolate between these two, show either of the transformation pathways, depending on the tilt angle.
Analogous behavior was observed for the martensitic transformation on the single-indexed surfaces and . These transformations follow the Pitsch and the Kurdjumov–Sachs pathway, respectively. Again, tilted surfaces use the pathway of the neighboring single-indexed plane.
The austenitic transformation temperature follows well the specific surface energy of the native bcc phase. High-energy surfaces allow a quick nucleation of the close-packed phase, leading to a low transition temperature. Low-energy surfaces, which contain a high fraction of (110) facets, only transform at higher temperatures. In all cases, the new phase nucleates at the surface.
The martensitic transformation does not show this direct correlation with the surface energy. Here, the transformation temperature steadily decreases if the surface is tilted from the (100) to the (110) orientation. This is caused by the fact that the (110) surface is not a conserved plane under the Kurdjumov–Sachs pathway, which governs the transformation; consequently, the transformed surface shows a strong out-of-plane deformation. In this case, the new phase even nucleates in the bulk rather than close to the surface.


