Article

Phosphorus SAD Phasing for Nucleic Acid Structures: Limitations and Potential

Department of Biochemistry, Vanderbilt University, Nashville TN 37240, USA
*
Authors to whom correspondence should be addressed.
Crystals 2016, 6(10), 125; https://doi.org/10.3390/cryst6100125
Submission received: 14 August 2016 / Revised: 12 September 2016 / Accepted: 13 September 2016 / Published: 1 October 2016
(This article belongs to the Special Issue Nucleic Acid Crystallography)

Abstract

:
Phasing of nucleic acid crystal diffraction data using the anomalous signal of phosphorus, P-SAD, at Cukα wavelength has been previously demonstrated using Z-DNA. Since the original work on P-SAD with Z-DNA there has been, with a notable exception, a conspicuous absence of applications of the technique to additional nucleic acid crystal structures. We have reproduced the P-SAD phasing of Z-DNA using a rotating-anode source and have attempted to phase a variety of nucleic acid crystals using P-SAD without success. A comparison of P-SAD using Z-DNA and a representative nucleic acid, the Dickerson-Drew dodecamer, is presented along with a S-SAD using only two sulfurs to phase a 2’-thio modified DNA decamer. A theoretical explanation for the limitation of P-SAD applied to nucleic acids is presented to show that the relatively high atomic displacement parameter of phosphorus in the nucleic acid backbone is responsible for the lack of success in applying P-SAD to nucleic acid diffraction data.

Graphical Abstract

1. Introduction

Anomalous dispersion phasing is an attractive approach to solving the phase problem in crystallography of biological macromolecules. In the best cases, experimental phases determined using anomalous dispersion techniques are capable of producing interpretable electron density maps without knowledge of the sequence of the protein or nucleic acid. The ability to exploit these techniques obviates the requirement for previously determined structures of similar conformation for molecular replacement phasing. However, the presence of a tractable anomalous signal depends on the presence of a suitable anomalous scatterer and the ability to collect diffraction data to adequate precision to extract that signal. In most cases, the anomalous scatterer is an artificial addition to the structure to be determined. Ideally, the anomalous scatterer is an atom naturally occurring in the molecule whose structure is to be determined precluding any question of isomorphism.
Compared with protein crystals the available approaches to derivatize DNA and RNA, in particular oligonucleotide-size molecules of up to about 20 kDa, for crystallographic phasing are relatively limited. The surfaces of nucleic acids are rich in oxygen acceptors (phosphates, sugar O4’, nucleobase keto groups) but virtually deficient in donors (i.e. ribose 2’-OH). Thus, the coordination is mostly limited to alkali and alkaline earth metal ions (i.e., [1,2,3,4,5,6,7,8,9]) or other oxophilic metal ions that occupy similar sites (i.e., T l + [10,11] or Z n 2 + [12,13]). In addition, nucleic acid crystals often lack large solvent channels that facilitate derivatization by soaking in heavy atom solutions. Classic heavy atoms agents such as platinum or mercury salts [14,15] are therefore of little use for determining crystal structures of DNA and RNA. However, lanthanides (i.e., S m 3 + [16,17]), osmium hexamine [18,19] and cobalt hexamine [20]) were used successfully to phase the structures of medium- and large-size RNAs.
Covalent modification of oligonucleotide-size fragments with bromine (also iodine) at the C5-position of uracil or cytosine in combination with the multiple-wavelength anomalous dispersion (MAD) [21], or single-wavelength anomalous dispersion (SAD) [22], techniques is a common phasing approach [23]. Halogenated nucleotides can be incorporated using both solid phase synthesis and in vitro transcription, the required reagents are commercially available and relatively cheap, and the bromine K edge is easily accessible at X-ray synchrotrons. However, despite its success the approach often fails: the carbon-halogen bond is light sensitive and halogenation can prevent crystallization or negatively affect the quality of crystals; the limited choice of incorporation sites constitutes a further disadvantage (i.e., [24,25,26]). Covalent incorporation of selenium into proteins in the form of Se-Met has greatly facilitated protein crystallography [27,28,29]. Selenium modification has recently also been established for native and chemically modified nucleic acids and offers considerable benefits over bromine modification in terms of phasing [30,31,32,33,34,35,36,37,38].
Phasing based on intrinsically present heavy atoms such as sulfur in proteins obviously precludes the need for covalent or non-covalent modification. Thus, SAD phasing using the anomalous signal of sulfur (S-SAD) at either copper or chromium K α wavelengths on in-house rotating anode generators has enjoyed considerable success [39,40,41,42,43,44,45,46,47,48,49], even though the data are collected at energies considerably lower than the absorption edge. Wang [50] formulated a theoretical limit for the anomalous signal for a successful SAD phasing at 0.6%. Ramagopal et al. [51] were able to phase crystals of glucose isomerase and xylanase with anomalous signals below 1% and establish the validity of the Wang limit for S-SAD.
By comparison, in the years since the original work on phosphorus SAD (P-SAD) phasing of Z-DNA was done by Dauter and Adamiak [52], there has been little evidence of success using the phosphorus signal to phase oligonucleotide crystal diffraction data. This is in spite of the theoretical utility of the phosphorus signal. Oligonucleotide crystals generally contain one phosphorus atom per nucleotide (the 5’-terminal residue in chemically synthesized material typically carries a free hydroxyl group). Therefore the average anomalous signal will not vary by molecular weight. So, why has P-SAD not become a method of choice for phasing nucleic acid diffraction data?
We have explored the possibility of P-SAD phasing for several DNA and RNA oligonucleotides of known or unknown crystal structure using data collected on an in-house source with copper Kα radiation. The work on the Z-DNA hexamer d(CGCGCG) follows and duplicates that by Dauter and Adamiak [52] who successfully phased diffraction data from a crystal of Z-DNA using 1.5418 Å data collected using a synchrotron source. The present work verifies the use of a rotating-anode source for phasing of Z-DNA diffraction data using P-SAD. Although a number of oligonucleotide crystals were examined in this study, only the Z-DNA crystal could be phased using P-SAD. It appears that the anomalous signal of phosphorus is too weak for P-SAD structure determination with even well diffracting crystals of relatively small oligonucleotides (i.e., the Dickerson-Drew dodecamer [2,53]). Rather than discuss each unsuccessful case, the Dickerson-Drew dodecamer, DDD d(CGCGAATTCGCG), is presented as representative of oligonucleotide crystals that would appear to be amenable to phasing by P-SAD but were not. The 2’-thio dodecamer crystal,(GCGTAU*ACGC; U*=2’-SMe-rU) is discussed as a case in which an oligonucleotide crystal could be phased using only two sulfur atoms demonstrating that the structural form of oligonucleotide crystals does not account for the lack of success using phosphorus alone. A theoretical explanation for this unexpected lack of success is presented. While the method is not yet routinely feasible, new developments and methods of data collection may help to achieve the levels of precision needed to make P-SAD a viable technique.

2. Results

2.1. Z-DNA

The Z-DNA crystal was flash-cooled directly from the mother liquor and maintained at 100 K during data collection. The data collection strategy determined using the Bruker Cosmo software (Bruker AXS, Karlsruhe, Germany) to maximize real redundancy required a total of 13 separate ω and ϕ scans with 2θ angles up to 67 degrees. A total of 2323.5 degrees of data were collected from the single crystal. Data collection statistics are presented in Table 1.
Data were collected to a maximum resolution of 0.95Å matching the resolution of data used by Adamiak and Dauter [52]. The quality of the data clearly exceeded that limit (see Table 1). Phasing of the integrated and scaled data using SHELXC/D/E [54] was done through the hkl2map gui [55] assuming 10 phosporus atoms and a solvent content of 46%. The solvent content calculated using the Matthews Probability Calculator is 49.94% [56,57].
SHELXD was run on the prepared data for a total of 10,000 tries. A plot of the correlation coefficient calculated for all data, CCall, versus try number is presented in Figure 1. The vast majority of tries resulted in CCall around 20%. A quick look at the scatter plot would suggest that successful tries were those with a CCall greater than 40% of which there are 65 or about 0.65% of all tries. However, tries with CCall as low as 24.59% still provided excellent phases. Successful tries in Figure 1 are denoted in red and unsuccessful tries with green. From this it can be seen that the success rate is much higher, 373 or about 3.73%. The CC for all data appears to be the best indicator of a successful try but is not perfect as can be seen from the overlap of successful and unsuccessful tries. In fact, a try with a CCall value of 24.76% and a CC weak value of 8.91% was successful while a different try with an identical value for CCall but a CC weak of 5.37% failed. The cutoff of successful CCall values just below 25% is consistent with previous studies of protein SAD phasing [58]. It is interesting that there is not a clear clustering for successful and unsuccessful tries. The peak height for sites is plotted in Figure 2. This plot shows that the peak height or occupancies calculated by SHELXD do not readily indicate true results from noise. Although the cluster of best tries clearly shows all 10 sites with high occupancy, there are a larger number of less well defined tries that provide excellent phases without all sites being well defined. The density modification in SHELXE is capable of refining less well defined phosphorus atom positions as shown in Figure 3. There are 3 phosphorus atoms which appear among the top peaks in all trials while the remainder do not follow a definite sequence (see Table 2) so that the peak height found by SHELXD is only crudely correlated with atomic B-factor refined in SHELXL (see Table 3). All peaks found in the top try (correlation coefficient of 44.98%) are shown in Figure 4 to be closely aligned with the final refined Z-DNA structure. Refinement statistics for Z-DNA are given in Table 4.
As a further test of the quality of the Z-DNA data, phasing was done using all data to 0.95 Å by direct methods using SIR2004 [59]. The Z-DNA data set was given to SIR2004 using the “nopatterson” option so that phasing was done using only the tangent method and the anomalous signal in the data was ignored (Figure 5a). Direct methods phasing was able to produce a map of sufficient quality to automatically place six atoms of the spermine molecule correctly (see Figure 5b). The resolution of the data is critical to the success of the direct methods tangent procedure given 240 non-hydrogen atoms in the asymmetric unit. The tangent procedure was unsuccessful when the data were limited to 1.1 Å resolution.

2.2. Dickerson-Drew Dodecamer

A large number of DDD crystals were used to collect diffraction data. Data collection statistics from a representative crystal are presented in Table 1. Repeated attempts to phase the data using the anomalous signal of phosphorus were unsuccessful. A representative crystal chosen for discussion here was collected at 100 K. The strategy determined using the Bruker Cosmo software required 25 separate ω and ϕ scans totaling 4638.5 degrees of data. Diffraction data collection statistics are presented in Table 1.
Attempts at phasing of the diffraction data were done using SHELXD through the hkl2map gui for a minimum of 10000 tries. Phasing attempts were performed using a variety of data cut-offs in both resolution and I/σ(I). Phasing of the data was attempted using SHARP [60] and SOlVE [61] without success.

2.3. 2’-Thiomethyl-Modified DNA Decamer

Diffraction data were collected at 100 K to a resolution of 1.3 Å. The data collection strategy determined using the Bruker Cosmo software required 21 separate ϕ and ω scans with a total of 5,326 degrees of data collected from a single crystal. Data collection statistics are presented in Table 1. Refinement statistics for the 2’-thio decamer are given in Table 4.
Phasing of the diffraction data was done using SHELXD/E through the hkl2map gui using a search for 20 phosphorus atoms and a resolution cut-off of 1.6 Å. A scatter plot of correlation coeffiecient for all data, CCall, versus try number over 10000 tries is presented in Figure 6. Comparison of Figure 6 with Figure 1 demonstrates the much higher success rate for phasing with the 2’-thio decamer over the Z-DNA data even given the exceptionally high quality of the Z-DNA data. In each successful phasing try the two sulfur atoms were the first anomalous scatterers found and have the highest occupancy values. It is common practice to use the phosphorus anomalous signal as an internal control for correctness of SAD phasing using strong anomalous scattering from such elements as platinum, thallium, and rubidium [62] so the phosphorus positions are likely due primarily to the quality of the sulfur phases.

3. Discussion

3.1. Anomalous Signal

The relative level of difficulty in extracting an anomalous signal using phosphorus atoms can be appreciated through a graph of f and f of phosphorus along with commonly used elements, sulfur, selenium, and barium (see Figure 7). Comparing this to the specific instance of sulfur and phosphorous signal at the in-house Cu K α wavelength (Figure 8) illustrates the difficulty of obtaining a sufficient signal:noise ratio to adequately retrieve the anomalous signal.
It seems from these results that the most important factor for success is the quality of the data and thus the signal to noise ratio. While Dauter and Adamiak [52] demonstrated the value of redundancy for success in phasing Z-DNA diffraction data, it must be noted that Z-DNA crystals provide unusually high quality diffraction data extending to 0.6Å using synchrotron radiation [7] and extending well beyond the present 0.95Å resolution in-house as seen by the data collection statistics for Z-DNA in Table 1.
The anomalous contribution of the phosphorus atoms at copper K α is generally represented as the ratio of the mean Bijvoet difference to the mean amplitude at a given diffraction angle θ:
Δ F ± F = 2 N A f A N P f e f f ( θ )
where N A is the number of anomalous scatterers, phosphorus atoms, N P is the number of protein atoms and f e f f = 1 N Σ f i which is the effective scattering from an average atom at diffraction angle θ. The theoretical value of Δ F a n o /F for nucleic acid crystal containing one phosphorus atom per base has been calculated by Dauter and Adamiak [52] to be about 2.0%. Calculation of Δ F a n o /F for actual diffraction data is necessarily overestimated and the degree of overestimation provides a measure of noise in the anomalous signal. A comparison of the Δ F a n o /F ratio plotted by resolution for the three data sets is presented in Figure 9.

3.2. Identification of Correct Solutions

There are no well established methods for identification of a correct solution other than examination of the electron density maps. There are a number of indicators including various figures of merit. SHELXD provides a Patterson Figure-of-Merit, FOM, to assess the correspondence between calculated and observed Patterson maps and a correlation coefficient between calculated and observed E-values. A clear separation of clustering of correct and incorrect solutions by correlation coefficient or a clear drop in occupancy values after the expected number of positions are valuable aids in recogition of success. However, in the case of Z-DNA, a number of apparently noise level solutions from SHELXD were identified after refinement in SHELXE (Figure 10). It may be that advances in refinement of anomalous scatterers such as the “free-lunch algorithm” [63] will facilitate the application of P-SAD.
In an evaluation of the Measurability of Bijvoet differences as an indicator for phasing success (see Table 5), the DDD data showed the highest percentage measurability of the three and Z-DNA the lowest. It may be that the contributions of experimental error and noise at this level of anomalous signal make this measure unreliable for P-SAD.

3.3. Limitation of P-SAD

While in theory it might appear that P-SAD should be effective in phasing in-house data from oligonucleotide crystals, in practice it is rare that the phosphorus signal is sufficient to determine structure. Indeed, the one case in which the anomalous signal from phosphorus was sufficient to phase the data, Z-DNA, is now shown to be a special case. The first novel nucleic acid structure solved by P-SAD is the Z-DNA dodecamer, d(CGCGCGCGCGCG) [64]. While a significant milestone in the advancement of the technique, this may represent a special case given that the crystals were capable of diffraction to a resolution of 0.75 Å. Phasing was done using a synchrotron source, 22-ID APS, at a wavelength of 1.5418 Å to simulate copper Kα radiation. The success of P-SAD phasing in this instance is remarkable in that the multiplicity of the data with Friedel mates unmerged was only 5.7 overall and 3.7 in the highest resolution shell, 1.70-1.64 Å. Native data to the ultra-high resolution were collected separately. The relative thermal motion of the phosphate backbone was high in the Z-DNA dodecamer with 6 out of the 11 phosphates modeled in multiple conformations. This in itself suggests that P-SAD phasing can ultimately be successful in nucleic acid structure determinations. Even though very few nucleic acids will provide such ultra-high resolution, as will be discussed later, new techniques may be capable of providing adequate anomalous signal from even average crystals.
Early in our efforts to apply P-SAD to nucleic acid structure determination, a number of hypotheses were considered to explain the discrepancy between theory and practice in the application of P-SAD phasing. It was considered possible that the periodicity of base-stacking could be overwhelming the anomalous signal from phosphorus. Base-stacking dominates the Patterson maps and tends to produce exceptionally strong reflections at around 3.4 Å and multiples of that dimension could affect signal to noise ratio of the anomalous signal. This does not appear to be the case as anomalous Patterson maps are quite clear for the Z-DNA data.
The most likely cause for the lack of success for P-SAD phasing comes from the relative thermal motion of the P atoms as opposed to the non-anomalous atoms. This was shown for S-SAD phasing to be one reason why sulfurs were useful [65] in phasing protein diffraction data. An analysis of the impact of the difference in average B-factor for phosphorus in relation to the non-anomalously scattering atoms was made by calculating the theoretical anomalous signal versus scattering angle (see Figure 11) according to the equation:
| Δ F ± | F = ( 2 N A N N ) 1 / 2 f f e f f e Δ B ( s i n θ λ ) 2

3.3.1. Phosphorus Mobility

Here Δ B , is the average difference in B factor of phosphorus versus the average B factor of all other non-hydrogen atoms in the model. For proteins, it was found that sulfur atoms tend to have lower B factors than the average of the other non-hydrogen atoms and a survey of models in the PDB showed that Δ B for proteins was about +3 Å2. A search of the PDB for double helical DNAs was made and resulted in a list of 34 structures as detailed in Table 6. From this list of models, Δ B for phosphorus was found to be -5.24 Å2. However, three of the models were outliers with phosphorus B-factors lower than the average for all other non-hydrogen atoms. In these unpublished models, PDB ID code 3F80, 1EHV, and 3GDA, an unpaired base with high B-factors is flipped out and skews the result. If these models are omitted, the average Δ B is about -6.0 Å2.
A more exhaustive study of the value of Δ B in nucleic acid crystals was undertaken to supplement the selected group of 34 structures. A cohort of 934 duplex DNA structures for which the B-factors were refined individually was examined calculating Δ B by comparing PO2 versus only the remaining atoms in the DNA duplex. The value of Δ B was calculated for each structure individually and an overall mean value of Δ B was found to be -7.27±5.05 Å2. A scatter plot of the values of Δ B versus reported resolution of the models is presented in Figure 12. A regression of Δ B on resolution is plotted with the average Δ B shown with error bars where the slope of the regression is -3.086 and the intercept is -1.49. From this it is clear that the resolution of the data bears some influence on the feasibility of P-SAD through its relation to Δ B .
The theoretical level of the anomalous signal for phosphorus was calculated to be about 2% using a value for f e f f of about 6.7. However, this is the value at zero scattering angle. In order to evaluate the scattering factor over the full range of scattering angles, the effective scattering was calculated using the four-Gaussian approximation with the Cromer-Mann coefficients for each of the elements, C, N, O, and P [91]. To approximate the effective scattering factor for DNA, the relative abundance of each of the elements was tabulated from d(GT)/d(AC). This resulted in the relative proportions of the element, C:N:O:P, to be 0.476:0.183:0.293:0.049. The scattering curves in Figure 11 were calculated for each of the elements and the effective scattering factor, f e f f , was calculated as the weighted sum of the individual element contributions. The theoretical value of the anomalous signal < | Δ F ± | > / < F > is plotted by scattering angle, s i n θ / λ , for three values of Δ B , +3, 0.0, and -6.0, in Figure 13. From this plot, it is apparent that the higher atomic displacement parameter value of phosphorus atoms in nucleic acids versus the average atomic displacement parameter for non-anomalously scattering atoms is likely to be the primary contributing factor to the continued lack of success in the application of P-SAD.

3.4. Potential for P-SAD

Even given the limitation of P-SAD phasing due to the mobility of the phosphates on the nucleic acid backbone, there is yet hope that recent advances in instrumentation and methodology will allow for data collection to the precision required for this challenging method.
Advances include new sources such as the X-ray Free Electron Laser (XFEL) [92]. Sulfur/chlorine SAD phasing has been reported using serial femtosecond crystallography with XFEL [93]. The development of XFEL techniques is very promising given the diffraction:damage ratios although radiation damage has been shown to be a factor in serial femtosecond XFEL crystallography as well [94].
Recent advances in detectors and goniometers as well as X-ray sources have extended our ability to acquire high quality diffraction data. New multi-axis goniometers at synchrotron sources such as the ESRF/EMBL mini-κ goniometer and the Parallel Robotics Inspired Goniometer, PRIGo [95]. The PRIGo goniometer serves as an Eulerian cradle providing three circles for ω , χ , and ϕ angles.

3.4.1. Phasing and Data Collection

This study was done using an in-house rotating-anode X-ray source to determine the feasibility and best approaches for solving the phase problem without recourse to synchrotron data as a mostly practical solution since most institutions employing crystallographers interested in nucleic acid structure will have in-house equipment. It should also be noted that rotating-anodes do have some advantages over synchrotron beam lines in this regard [96]. The most obvious advantage is the greater degree of access and control allowing for careful maintenance and alignment prior to a demanding data collection. The high redundancies required for P-SAD phasing are more difficult to achieve at synchrotrons due to both time limitations and the greater degree of radiation damage from synchrotron beams. A fundamental advantage in the use of a modern rotating-anode X-ray source is the lack of wavelength drift during data collection. Wavelength drift can introduce systematic error in synchrotron data that justifies choosing the high energy remote wavelength as the reference wavelength in MAD data collection as the anomalous signal remains significant but is relatively insensitive to wavelength drift [58].
Specific strategies for acquiring precise native SAD data have been developed and demonstrated, primarily for S-SAD, involving either a Multi-Data Set (MDS), approach with a single crystal or sophisticated merging of data sets from multiple crystals in a Multi-Crystal Approach or MCA. For MDS approaches [97,98,99,100], the Garman limit for absorbed radiation dose [101] is determined. The resulting exposure time is then "dose-sliced" by dividing the exposure time to achieve the Garman limit by the number of data sets to be collected. The MCA technique [102,103] involves collecting complete data sets from as few as 5 and as many as 13 different crystals. One of the most critical elements of MCA is assuring that diffraction and lattice parameters from each of the crystals are statistically equivalent. Three tests for identification of statistical outliers were developed [102] and cluster analysis was used to verify equivalence of unit cell parameters and for both intensity and anomalous correlation between sets. Application of the two approaches was shown to be particularly effective for S-SAD phasing of a histidine kinase [104]. A tour de force application of the combination of the two data collection strategies has recently been used to solve three challenging structures by native SAD phasing [105]. In one case, the CRISPR-associated protein, Cas9, in complex with sgRNA and target DNA was solved using MDS data merged from 3 crystals. The complex crystallized in the relatively low symmetry space group, C2, with 1371 amino acids, 83 RNA nucleotides, and 39 DNA nucleotides in the asymmetric unit. The anomalous substructure comprised of 24 S atoms and 120 P atoms could be solved only after merging multiple low dose data sets collected in multiple orientations and from multiple crystals. This is the largest substructure solved thus far using native SAD phasing.

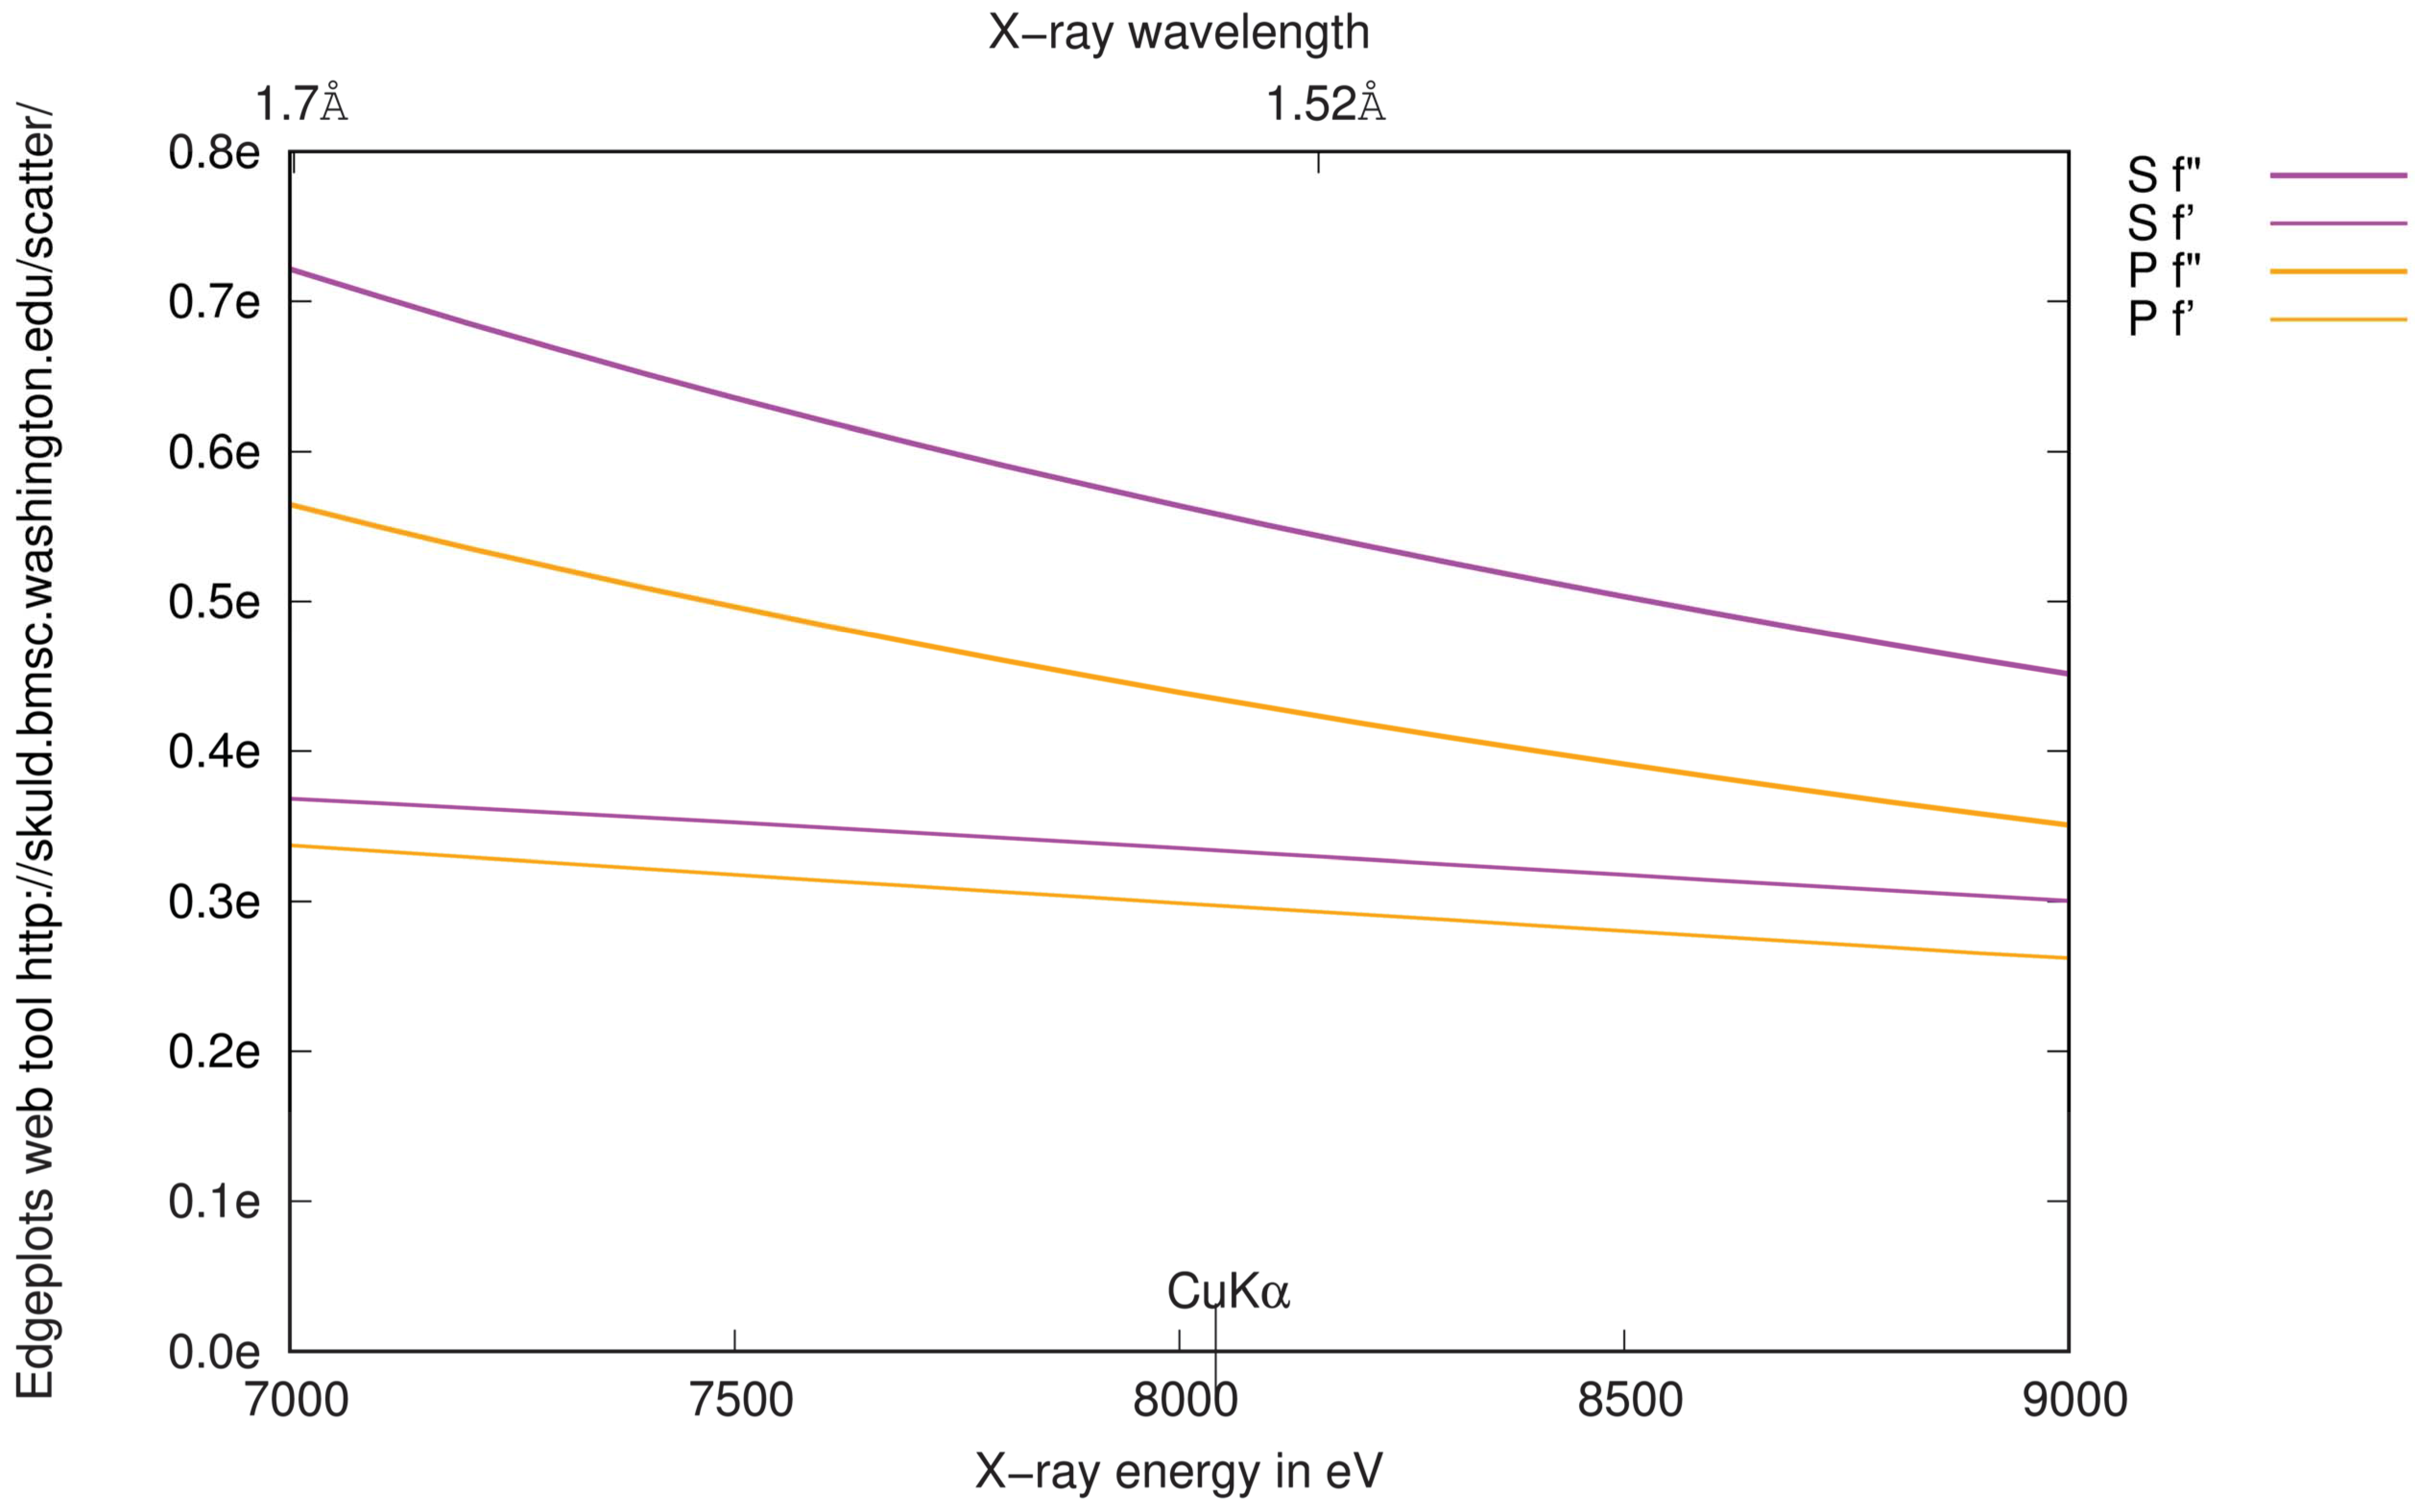
3.4.2. Choice of Wavelength

Ideally, when collecting anomalous dispersion data the wavelength used will correspond to an absorption edge for the anomalous scatterer present in the crystal. For phosphorus, this would mean collecting data at the K-edge energy of 2.1455 keV, 5.7788 Å. This exceptionally low energy is not generally attainable at a synchrotron source due to absorption and heating in beamline components. The choice of wavelength will depend on a calculation taking into account absorption, crystal size and a number of other factors with the object of maximizing the signal as quantified in the statistic, I/σ(I). Lower energies with corresponding higher values of f” for phosphorus phasing will also suffer from increase in radiation damage and increased absorption. Away from the absorption edge, absorption and, thus, the intensity of individual reflections will scale as the cube of the wavelength. Larger crystals may benefit from a higher energy so that for native SAD crystals of 50 μm or smaller would be favored. Experiments examining the relationship between crystal size and wavelength did not establish a clear relationship [106] and implicated individual sample quality. It was also suggested that small unit cells and higher symmetry space groups are detrimental by reducing the number of Bijvoet pairs at lower resolutions making substructure determination in SHELXD more difficult. Longer wavelengths also present issues with data collection strategy. The highest resolution attainable for diffraction data collection will depend on the beamline equipment. If the data collection strategy is limited to a single rotation axis, then the higher resolution regions unreachable by the Ewald sphere increase with increasing wavelength and the highest resolution data measurable depends on the minimum crystal to detector distance available [107]. The mini-κ goniometer and the PRIGo goniometers are well suited to offset these issues. While it may not be a significant factor currently, the limiting sphere in diffraction means that the ultimate diffraction possible is limited to one-half of the wavelength of the radiation used so that data collection at a wavelength of 4 Å limits diffraction resolution to 2 Å.
Synchrotron beamlines are attempting to approach the lower energies needed to enable techniques such as native SAD phasing. Previous experiments at synchrotron sources have recommended 2.1 Å as an optimum wavelength [75] however, new developments at synchrotron sources have extended the range of energies available. The EMBL P13 beamline at the PETRA III synchrotron source in Hamburg is now capable of providing a variable focus size beam at wavelengths as long a 3.1 Å [108] at which the f” for phosphorus becomes about 1.2 e.
The choice of wavelength for in-house data collection is generally limited to either copper Kα, 8.046 keV and 1.5418 Å, or chromium Kα, 5.415 keV and 2.2909 Å. Copper is by far the most common source available for in-house data collection. The use of chromium targets has been thoroughly investigated and proven useful [97,98] although the increase in air-scatter generally requires the additional complication of a helium filled chamber between the crystal and detector face to maintain an acceptable signal:noise ratio.

3.4.3. Radiation Damage

The need for exceptional levels of multiplicity in diffraction data collection in order to extract the phosphorus anomalous signal implies a concomitant increase in exposure time and radiation dose and concern for potential issues with chemical changes during data collection. For nucleic acid crystallography, radiation damage, while a critically important factor, may not be as serious as it is for protein S-SAD. A recent study of a nucleoprotein complex [109] quantified the per-atom electron density changes over a wide range of radiation dose levels (1.3–25.0 MGy) and showed that RNA is much less sensitive to radiation-induced chemical changes than protein. And, unexpectedly, the normally radiation sensitive Glu and Asp residues within RNA binding pockets appear to have been protected by the association with RNA.
Software for simulation of radiation absorbed dose has been developed [110,111] that takes into account beam characteristics, crystal composition and exposure rates. These programs provide sophisticated calculations that should be used to provide guidance in setting up diffraction data collection strategies. This is particularly important when using the dose-sliced multiple-data set approach as discussed in Section 3.4.1.

3.4.4. Successful Application of P-SAD

The most remarkable application of P-SAD to date is the structure of a DNA dodecamer containing 5-formylcytosine (5fC), d(CTA-5fC-G-5fC-G-5fC-GTAG ) [112] at 1.4 Å resolution and phased entirely using the anomalous signal of phosphorus in-house at copper Kα wavelength. The data were collected using a κ-axis goniometer and a Platinum 135 CCD area detector (Proteum X8, Bruker AXS, Madison, WI, USA) similar to the system used in the experiments reported here and utilizing that systems strategy software to maximize the redundancy of the data while evening out the sampling over the entire reciprocal lattice. The data were collected from a low resolution of 45.94 Å to a high of 1.60 Å with the highest resolution shell from 1.63–1.60 Å. The overall redundancy of the data was a remarkable 85.1 and for the highest resolution shell an even more remarkable 40.6. The higher redundancies were facilitated by the high symmetry of the crystal, a tetragonal lattice with space group P43212. The signal:noise ratio of the data were reported as an I/σ(I) of 48.8 overall and 4.9 in the highest resolution shell and a significant anomalous signal to a resolution of 2.2 Å. This successful application of P-SAD appears to be due to the remarkably high redundancy of the data. All eleven phosphorus atoms in the asymmetric unit were located by P-SAD phasing in PHENIX [113]. Location of the anomalous scattering atoms was facilitated by the symmetry of the nucleic acid duplex corresponding to a crystallographic symmetry element. Calculations made here for ΔB (as discussed in Section 3.3.1) for phosphorus using the model for the 5fC containing dodecamer, PDB id 4QKK, showed that the average B-factor for P, OP1, and OP2 atoms in the backbone was 32.966 ± 6.37 Å2 and for the other atoms in the model 25.283±4.251 Å2 leaving a nearly average ΔB of -7.68 Å2. The successful phasing of the 5fC dodecamer suggests that, while highly challenging due to the relative mobility of the phosphates in the nucleic acid backbone, P-SAD is yet a worthwhile goal. It may be that more structures may be phased using P-SAD by taking full advantage of all the recent developments in instrumentation and data collection strategies.

4. Materials and Methods

4.1. Crystallization

Z-DNA crystals were grown using sitting-drop vapor diffusion in deep-well plates as described previously [114]. Drops contained 1.1 mM Z-DNA, 30 mM sodium cacodylate, pH 6.9, 15 mM MgCl2, 10 mM spermine·4HCl. The well tray was suspended over a reservoir of 40% 2-methyl-2,4-pentanediol (MPD).
The Dickerson-Drew Dodecamer, DDD, was crystallized from oligonucleotides purchased from Integrated DNA Technologies (Coralville, Iowa). Crystallization was done using sitting drop vapor diffusion against a reservoir of 40% MPD. Drops contained 1.2 mM DNA, 8 mM spermine·4HCl, 40 mM MgCl2, 20 mM sodium cacodylate, pH 6.9. Crystals were flash-cooled from the crystallization drop without further treatment.
The 2’-thio modified oligonucleotide DNA, GCGTAU*ACGC (U*=2’-SMe-rU) was synthesized by solid-phase phosphoramidite chemistry and purified as previously described [115]. Crystals were grown by hanging drop vapor diffusion using the Nucleic Acid Miniscreen (Hampton Research, Aliso Viejo, Ca). Crystals were flash-cooled without the need for additional cryoprotectant.

4.2. Diffraction Data Collection

All diffraction screening and data collections were performed using the Biomolecular Crystallography Facility in the Vanderbilt University Center for Structural Biology. All in-house data collection was performed using a Bruker-Nonius Microstar rotating anode X-ray generator equipped with a Proteum PT135 CCD area detector mounted on an X8 kappa goniometer with Montel confocal multilayer optics. Crystals were maintained at 100K using a Bruker KryoFlex cryostat. Autoindexing, strategy calculations and data reduction was done using Proteum2 software (Bruker-AXS, Madison, WI). Use of the COSMO module in the Proteum software in conjunction with the 4-circle goniometer allowed for high redundancy in data collection encompassing the full reciprocal space lattice. The system was aligned immediately prior or close to the time of data collection to insure optimum performance during data collection. Scaled data were evaluated and reflection files written using XPREP [116].

4.3. Diffraction Data Phasing and Model Refinement

Direct methods phasing of diffraction data was done using SIR2004 [59]. Phasing using the anomalous signal from P atoms was done using SHELXC, SHELXD, SHELXE [117] and the hkl2map gui [55]. The critical decision of resolution limit for phasing calculations was made by the hkl2map script using a cutoff of about 1.3 for the ratio of Δ F to its estimated standard deviation. Refinement was done using SHELXL [117]. Map calculation and structure visualization and manipulation were done using Coot [118] and PyMol [119].

4.4. Data Quality Indicators
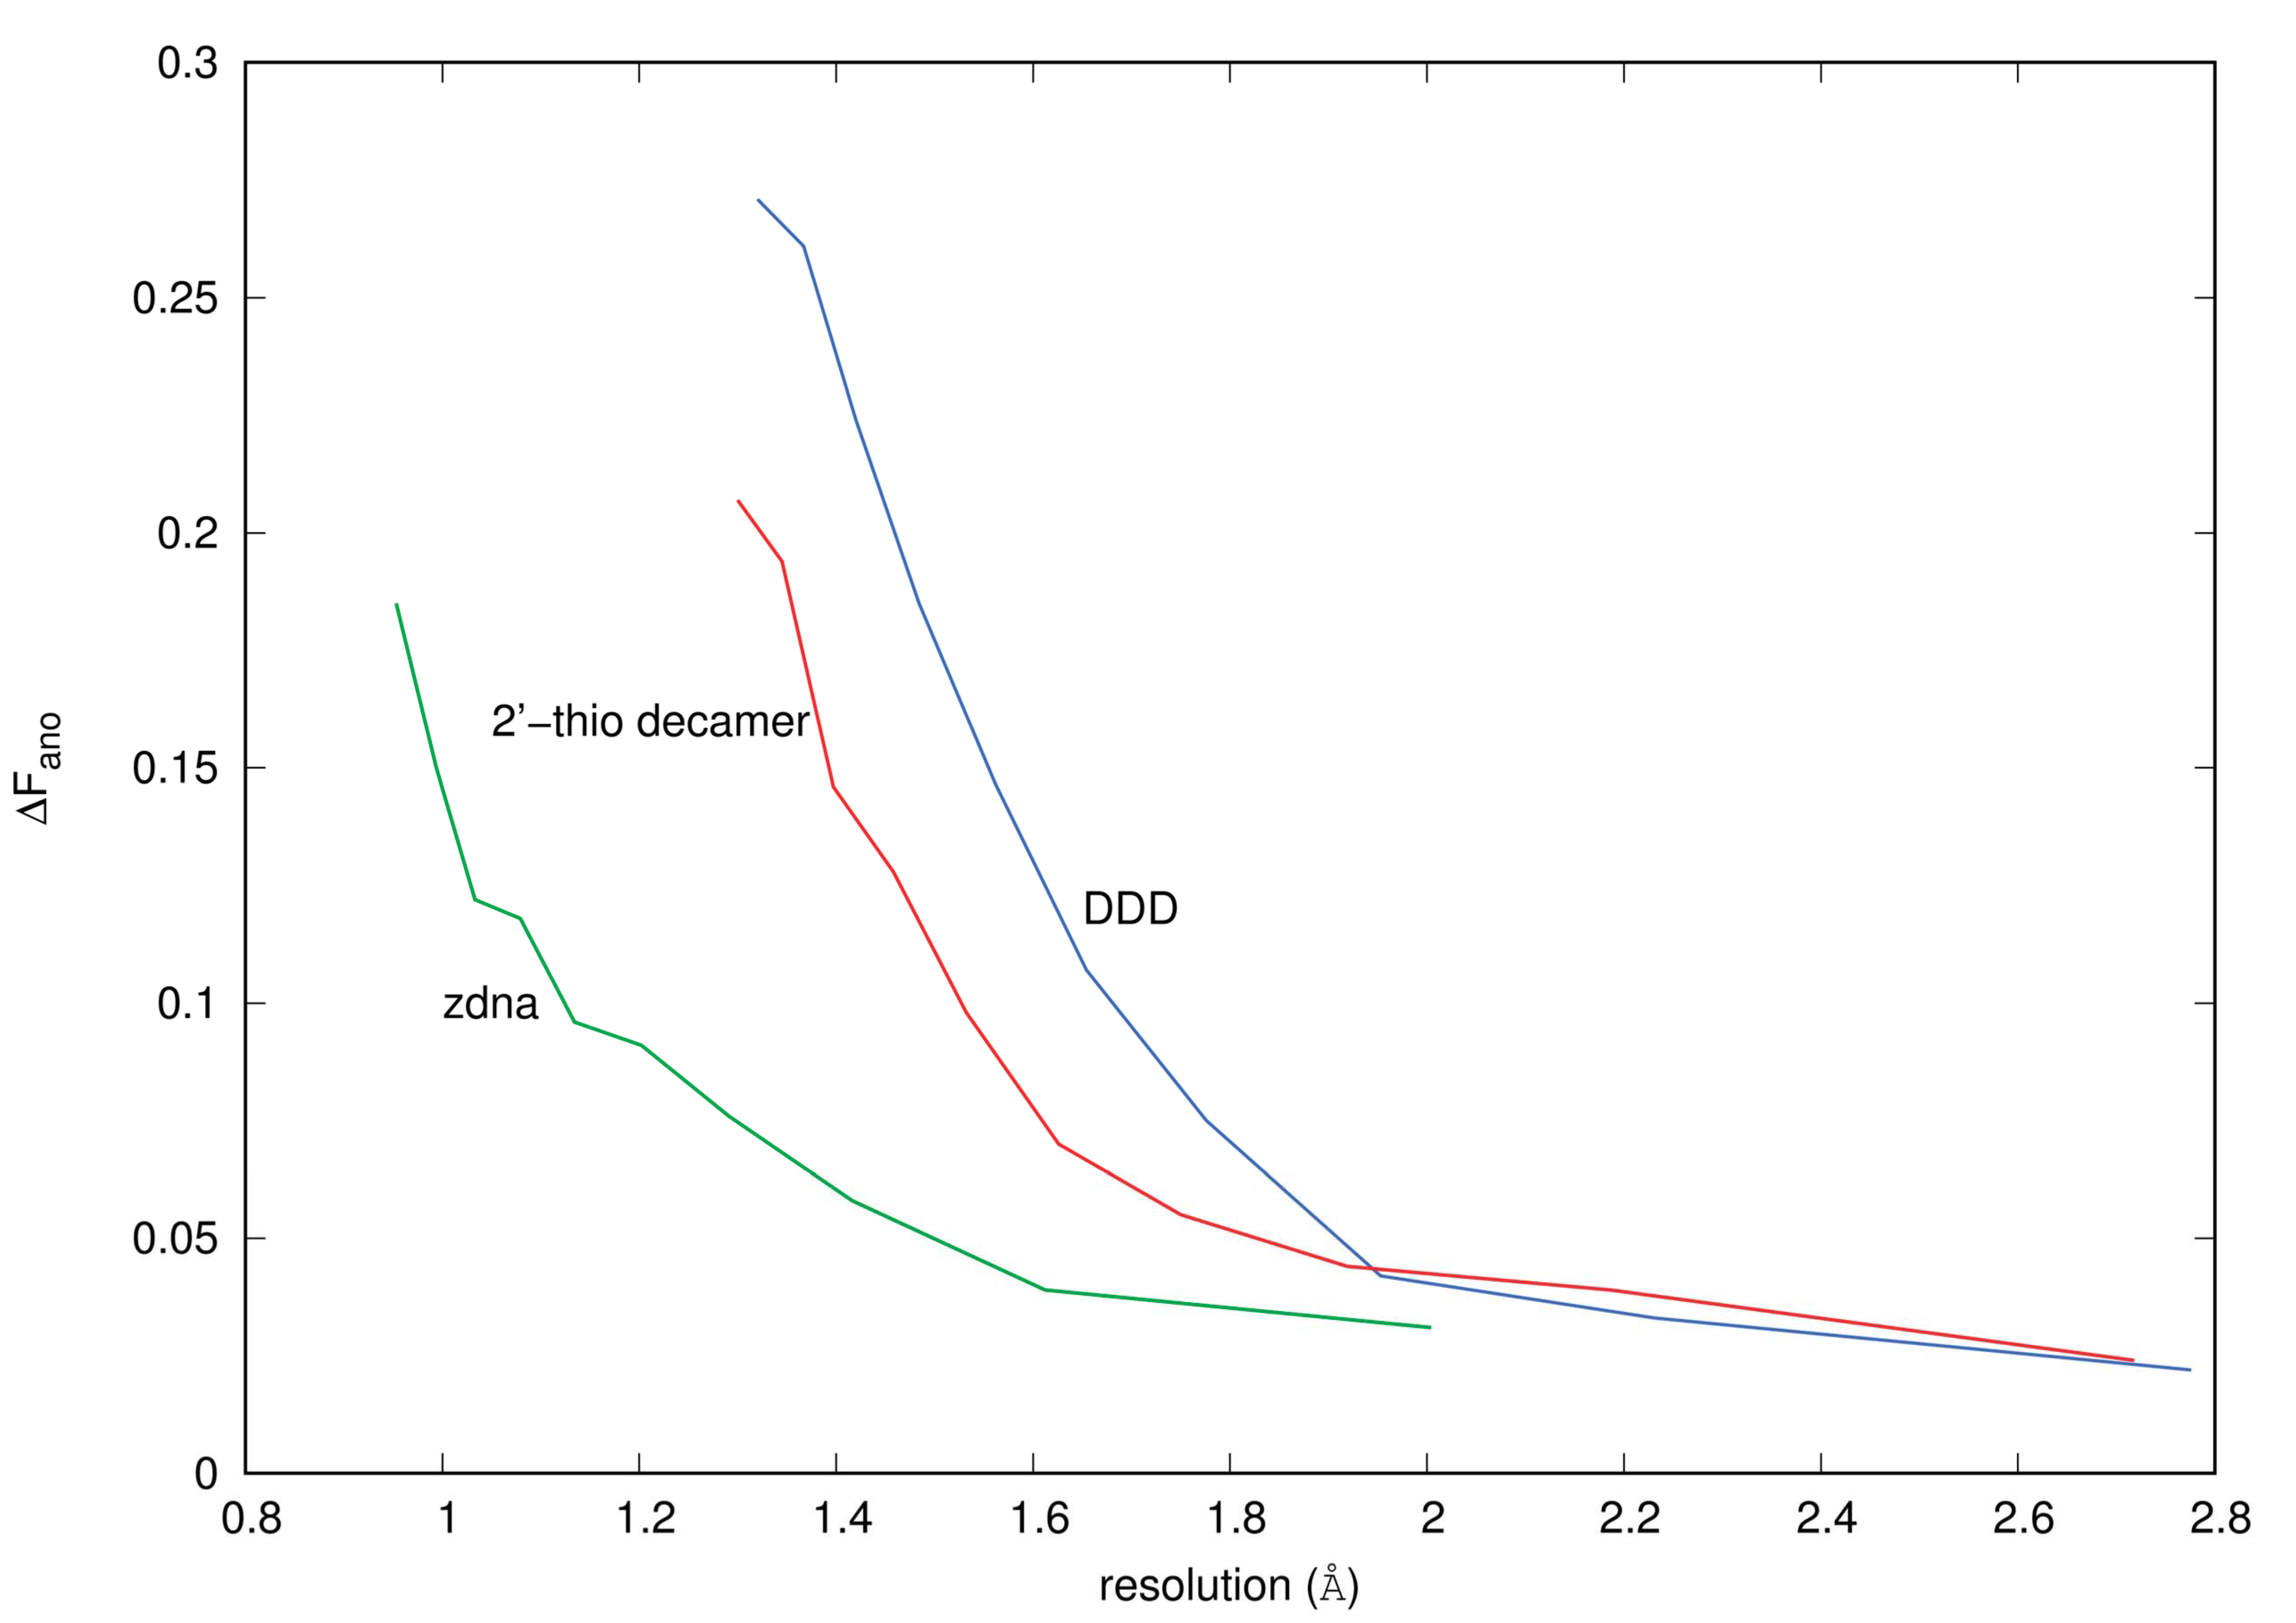
4.4.1. ΔFano/F

ΔFano/F was calculated by importing data from XPREP into CCP4 [120] using scalepack2mtz. Structure factor amplitudes calculated with scalepack2mtz after applying corrections and Wilson scaling were used to generate anomalous difference data. The ΔFano/F was then plotted versus resolution bin with 10 bins of equal numbers of reflections for each data set.

4.4.2. Measurability

Zwart [121] discussed quality metrics applied to anomalous data in order to predict success or failure of phasing attempts. Sorted intensity data from XPREP output in scalepack format was used to calculate the anomalous signal:noise ratio:
| I + I | ( σ I + 2 + σ I 2 ) 1 / 2
The average signal:noise ratio of a data set was calculated based on all measured Bijvoet pairs and the Measurability of the anomalous signal was calculated as the ratio over all measured Bijvoet pairs of Bijvoet pairs satifying the conditions:
| I + I | ( σ I + 2 + σ I 2 ) 1 / 2 3.0
m i n ( I + σ I + , I σ I ) 3.0

Acknowledgments

The authors would like to thank Zbigniew Dauter for useful discussions and an anonymous reviewer for a valuable suggestion.

Author Contributions

Joel M. Harp and Martin Egli conceived and designed the experiments; Joel M. Harp performed the experiments and analyzed the data; Pradeep S. Pallan contributed crystals and data; Joel M. Harp and Martin Egli wrote the paper.

Conflicts of Interest

The authors declare no conflict of interest.

References

  1. Cate, J.H.; Hanna, R.L.; Doudna, J.A. A magnesium core at the heart of a ribozyme domain. Nat. Struc. Bio. 1997, 4, 553–558. [Google Scholar] [CrossRef]
  2. Tereshko, V.; Minasov, G.; Egli, M. The Dickerson-Drew B-DNA dodecamer revisited - at atomic resolution. J. Am. Chem. Soc. 1999, 121, 470–471. [Google Scholar] [CrossRef]
  3. Tereshko, V.; Minasov, G.; Egli, M. A “hydrat-ion” spine in a B-DNA minor groove. J. Am. Chem. Soc. 1999, 121, 3590–3595. [Google Scholar] [CrossRef]
  4. Minasov, G.; Tereshko, V.; Egli, M. Atomic-resolution crystal structures of B-DNA reveal specific influences of divalent metal ions on conformation and packing. J. Mol. Biol. 1999, 291, 83–99. [Google Scholar] [CrossRef] [PubMed]
  5. Chiu, T.K.; Dickerson, R.E. 1 Å Crystal structures of B-DNA reveal sequence-specific binding and groove-specific bending of DNA by magnesium and calcium. J. Mol. Biol. 2000, 301, 915–945. [Google Scholar] [CrossRef] [PubMed]
  6. Robinson, H.; Gao, Y.G.; Sanishvili, R.; Joachimiak, A.; Wang, A.H.J. Hexahydrated magnesium ions bind in the deep major groove and at the outer mouth of A-form nucleic acid duplexes. Nucleic Acids Res. 2000, 28, 1760–1766. [Google Scholar] [CrossRef] [PubMed]
  7. Tereshko, V.; Wilds, C.J.; Minasov, G.; Prakash, T.P.; Maier, M.A.; Howard, A.; Wawrzak, Z.; Manoharan, M.; Egli, M. Detection of alkali metal ions in DNA crystals using state-of-the-art X-ray diffraction experiments. Nucleic Acids Res. 2001, 29, 1208–1215. [Google Scholar] [CrossRef] [PubMed]
  8. Egli, M. DNA-cation interactions: quo vadis? Chem. Biol. 2002, 9, 277–286. [Google Scholar] [CrossRef]
  9. Egli, M.; Minasov, G.; Su, L.; Rich, A. Metal ion and flexibility in a viral RNA pseudoknot and atomic resolution. Proc. Natl. Acad. Sci. USA. 2002, 99, 4302–4307. [Google Scholar] [CrossRef] [PubMed]
  10. Basu, S.; Rambo, R.P.; Strauss-Soukup, J.; Cate, J.; Ferré-D’Amaré, A.R.; Strobel, S.A.; Doudna, J.A. A specific monovalent metal ion integral to the AA platform of the RNA tetraloop receptor. Nat. Struct. Biol. 1998, 5, 986–992. [Google Scholar] [CrossRef] [PubMed]
  11. Conn, G.L.; Gittis, A.G.; Lattman, E.E.; Misra, V.K.; Draper, D.E. A compact RNA tertiary structure contains a buried backbone-K+ complex. J. Mol. Biol. 2002, 318, 963–973. [Google Scholar] [CrossRef]
  12. Ennifar, E.; Walter, P.; Dumas, P. An efficient method for solving RNA structures: MAD phasing by replacing magnesium with zinc. Acta Crystallogr. Sect. D Biol. Crystallogr. 2001, D57, 330–332. [Google Scholar] [CrossRef]
  13. Ennifar, E.; Walter, P.; Dumas, P. A crystallographic study of the binding of 13 metal ions to two related RNA duplexes. Nucleic Acids Res. 2003, 31, 2671–2682. [Google Scholar] [CrossRef] [PubMed]
  14. Petsko, G.A. Preparation of isomorphous heavy atom derivatives. Methods Enzymol. 1985, 114, 147–156. [Google Scholar] [PubMed]
  15. Rould, M.A. Screening for heavy-atom derivatives and obtaining accurate isomorphous differences. Methods Enzymol. 1997, 276, 461–472. [Google Scholar]
  16. Holbrook, S.R.; Kim, S.H. Crystallization and heavy atom derivatives of polynucleotides. Methods Enzymol. 1985, 114, 167–176. [Google Scholar] [PubMed]
  17. Kim, S.H.; Shin, W.C.; Warrant, R.W. Heavy metal ion-nucleic acid interaction. Methods Enzymol. 1985, 114, 156–167. [Google Scholar] [PubMed]
  18. Cate, J.H.; Gooding, A.R.; Podell, E.; Zhou, K.; Golden, B.L.; Kundrot, C.E.; Cech, T.R.; Doudna, J.A. Crystal structure of a group I ribozyme domain: principles of RNA packing. Science 1996, 273, 1678–1685. [Google Scholar] [CrossRef] [PubMed]
  19. Su, L.; Chen, L.; Egli, M.; Berger, J.M.; Rich, A. A minor groove RNA triplex in the crystal structure of a viral pseudoknot involved in ribosomal frameshifting. Nat. Struc. Bio. 1999, 6, 285–292. [Google Scholar]
  20. Keel, A.Y.; Rambo, R.P.; Batey, R.T.; Kieft, J.S. A general strategy to solve the phase problem in RNA crystallography. Structure 2007, 15, 761–772. [Google Scholar] [CrossRef] [PubMed]
  21. Hendrickson, W.A. Maturation of MAD phasing for the determination of macromolecular structures. J. Synchrotron Rad. 1999, 6, 845–851. [Google Scholar] [CrossRef]
  22. Dauter, Z.; Dauter, M.; Dodson, E. Jolly SAD. Acta Crystallogr. Sect. D Biol. Crystallogr. 2002, D58, 494–506. [Google Scholar] [CrossRef]
  23. Correll, C.C.; Freeborn, B.; Moore, P.B.; Steitz, T.A. Use of chemically modified nucleotides to determine a 62-nucleotide RNA crystal structure: a survey of phosphorothioates, Br, Pt and Hg. J. Biomol. Struct. Dyn. 1997, 15, 16–172. [Google Scholar] [CrossRef] [PubMed]
  24. Ennifar, E.; Carpentier, P.; Ferrer, J.; Walter, P.; Dumas, P. X-ray induced debromination of nucleic acids at the Br K aborption edge and implications for MAD phasing. Acta Crystallogr. Sect. D Biol. Crystallogr. 2002, D58, 1262–1269. [Google Scholar] [CrossRef]
  25. Egli, M.; Lubini, P.; Pallan, P.S. The long and winding road to the structure of homo-DNA. Chem. Soc. Rev. 2007, 36, 31–45. [Google Scholar] [CrossRef] [PubMed]
  26. Sanishvili, R.; Besnard, C.; Camus, F.; Fleurant, M.; Pattison, P.; Bricogne, G.; Schiltz, M. Polarization-dependence of anomalous scattering in brominated DNA and RNA molecules, and importance of crystal orientation in single- and multiple-wavelength anomalous diffraction phasing. J. Appl. Crystallogr. 2007, 40, 552–558. [Google Scholar] [CrossRef]
  27. Hendrickson, W.A.; Horton, J.R.; LeMaster, D.M. Selenomethionyl proteins produced for analysis by multiwavelength anomalous diffraction (MAD): a vehicle for direct determination of three-dimensional structure. EMBO J. 1990, 9, 1665–1672. [Google Scholar] [PubMed]
  28. Doublié, S. Selenomethionyl protein expression. In Macromolecular Crystallography Protocols, Volume 1, Preparation and Crystallization of Macromolecules; Humana Press: Totowa, NJ, USA, 2006. [Google Scholar]
  29. Hendrickson, W.A. Synchrotron crystallography. Trends Biochem. Sci. 2001, 25, 637–643. [Google Scholar] [CrossRef]
  30. Du, Q.; Carrasco, N.; Teplova, M.; Wilds, C.J.; Kong, X.; Egli, M.; Huang, Z. Internal derivatization of oligonucleotides with selenium for X-ray crystallography using MAD. J. Am. Chem. Soc. 2002, 124, 24–25. [Google Scholar] [CrossRef] [PubMed]
  31. Teplova, M.; Wilds, C.J.; Wawrzak, Z.; Tereshko, V.; Du, Q.; Carrasco, N.; Huang, Z.; Egli, M. Covalent incorporation of selenium into oligonucleotides for X-ray crystal structure determination via MAD: proof of principle. Biochimie 2002, 84, 849–858. [Google Scholar] [CrossRef]
  32. Wilds, C.J.; Pattanayek, R.; Pan, C.; Wawrzak, Z.; Egli, M. Selenium-assisted nucleic acid crystallography: use of DNA phosphoroselenoates for MAD phasing. J. Am. Chem. Soc. 2002, 124, 14910–14916. [Google Scholar] [CrossRef] [PubMed]
  33. Höbartner, C.; Rieder, R.; Kreutz, C.; Puffer, B.; Lang, K.; Polonskaia, A.; Serganov, A.; Micura, R. Syntheses of RNAs with up to 100 nucleotides containing site-specific 2’-methylseleno labels for use in X-ray crystallography. J. Am. Chem. Soc. 2005, 127, 12035–12045. [Google Scholar] [CrossRef] [PubMed]
  34. Serganov, A.; Keiper, S.; Malinina, L.; Tereshko, V.; Skripkin, E.; Höbartner, C.; Polonskaia, A.; Phan, A.T.; Wombacher, R.; Micura, R.; Dauter, Z.; Jaschke, A.; Patel, D.J. Structural basis for Diels-Alder ribozyme catalyzed carbon-carbon bond formation. Nat. Struct. Bio. 2005, 12, 218–224. [Google Scholar] [CrossRef] [PubMed]
  35. Egli, M.; Pallan, P.S.; Pattanayek, R.; Wilds, C.J.; Lubini, P.; Minasov, G.; Dobler, M.; Leumann, C.; Eschenmoser, A. Crystal structure of homo-DNA and nature’s choice of pentose of hexose in the genetic system. J. Am. Chem. Soc. 2006, 128, 10847–10856. [Google Scholar] [CrossRef] [PubMed]
  36. Pallan, P.S.; Egli, M. Selenium modification of nucleic acids: Preparation of oligonucleotides with incorporated 2’-SeMe-uridine for crystallographic phasing of nucleic acid structures. Nat. Protoc. 2007, 2, 647–651. [Google Scholar] [CrossRef] [PubMed]
  37. Pallan, P.S.; Egli, M. Selenium modification of nucleic acids: Preparation of phosphorothioate derivatives for crystallographic phasing of nucleic acid structures. Nat. Protoc. 2007, 2, 640–646. [Google Scholar] [CrossRef] [PubMed]
  38. Sheng, J.; Huang, Z. Selenium derivatization of nucleic acids for phase and structure determination in nucleic acid X-ray crystallography. Int. J. Mol. Sci. 2008, 9, 258–271. [Google Scholar] [CrossRef] [PubMed]
  39. Kwiatkowski, W.; Noel, J.P.; Choe, S. Use of Cr Kα radiation to enhance the signal from anomalous scatterers including sulfur. J. Appl. Crystallogr. 2000, 33, 876–881. [Google Scholar] [CrossRef]
  40. Yang, C.; Pflugrath, J.W. Applications of anomalous scattering form S atoms for improved phasing of protein diffraction data at Cu Kα wavelength. Acta Crystallogr. Sect. D Biol. Crystallogr. 2001, D57, 1480–1490. [Google Scholar] [CrossRef]
  41. Debreczeni, J.E.; Bunkóczi, G.; Girmann, B.; Sheldrick, G.M. In-house phase determination of the lima bean trypsin inhibitor: a low resolution sulfur-SAD case. Acta Crystallogr. Sect. D Biol. Crystallogr. 2003, D59, 393–395. [Google Scholar] [CrossRef]
  42. Debreczeni, J.E.; Bunkóczi, G.; Ma, Q.; Blaser, H.; Sheldrick, G.M. In-house measurement of the sulfur anomalous signal and its use for phasing. Acta Crystallogr. Sect. D Biol. Crystallogr. 2003, D59, 688–696. [Google Scholar] [CrossRef]
  43. Yang, C.; Pflugrath, J.W.; Courville, D.A.; Stence, C.N.; Ferrara, J.D. Away from the edge: SAD phasing from the sulfur anomalous signal measured in-house with chromium radiation. Acta Crystallogr. Sect. D Biol. Crystallogr. 2003, D59, 1943–1957. [Google Scholar] [CrossRef]
  44. Cianci, M.; Helliwell, J.R.; Moorcroft, D.; Olczak, A.; Raferty, J.; Rizkallah, P.J. The role of wavelength and source in the search for sulfur-atom positions evaluated in two case studies: lysozyme at room temperature and cryo apocrustacyanin A1. J. Appl. Crystallogr. 2004, 37, 555–564. [Google Scholar] [CrossRef]
  45. Olsen, J.G.; Flensburg, C.; Olsen, O.; Bricogne, G.; Hendricksen, A. Solving the structure of the bubble protein using the anomalous sulfur signal from single-crystal in-house Cu Kα diffraction data only. Acta Crystallogr. Sect. D Biol. Crystallogr. 2004, D60, 250–255. [Google Scholar] [CrossRef] [PubMed]
  46. Kitago, Y.; Watanabe, N.; Tanaka, I. Structure determination of a novel protein by sulfur SAD using chromium radiation in combination with a new crystal-mounting method. Acta Crystallogr. Sect. D Biol. Crystallogr. 2005, D61, 1013–1021. [Google Scholar] [CrossRef] [PubMed]
  47. Nagem, R.A.P.; Ambrosio, A.L.B.; Rojas, A.L.; Navarro, M.V.A.S.; Golubev, A.M.; Garratta, R.C.; Polikarpov, I. Getting the most out of X-ray home souces. J. Mol. Biol. 2005, D61, 1022–1030. [Google Scholar]
  48. Watanabe, N.; Kitago, Y.; Tanaka, I.; Wang, J.; Gu, Y.; Zheng, C.; Fan, H. Comparison of phasing methods for sulfur-SAD using in-house chromium radiation: Case studies for standard proteins and a 69 kDa protein. Acta Crystallogr. Sect. D Biol. Crystallogr. 2005, D61, 1533–1540. [Google Scholar] [CrossRef] [PubMed]
  49. Sarma, G.N.; Karplus, P.A. In-house sulfur SAD phasing: A case study of the effects of data quality and resolution cutoffs. Acta Crystallogr. Sect. D Biol. Crystallogr. 2006, D62, 707–716. [Google Scholar] [CrossRef] [PubMed]
  50. Wang, B.C. Resolution of phase ambiguity in macromolecular crystallography. Methods Enzymol. 1985, 115, 90–112. [Google Scholar] [PubMed]
  51. Ramagopal, U.A.; Dauter, M.; Dauter, Z. Phasing on anomalous signal of sulfurs: what is the limit? Acta Crystallogr. Sect. D Biol. Crystallogr. 2003, D59, 1020–1027. [Google Scholar] [CrossRef]
  52. Dauter, Z.; Adamiak, D.A. Anomalous signal of phosphorus used for phasing DNA oligomer: Importance of data redundancy. Acta Crystallogr. Sect. D Biol. Crystallogr. 2001, D57, 990–995. [Google Scholar] [CrossRef]
  53. Wing, R.; Drew, H.; Takano, T.; Broka, C.; Takano, S.; Itakura, K.; Dickerson, R.E. Crystal structure analysis of a complete turn of B-DNA. Nature 1980, 287, 755–758. [Google Scholar] [CrossRef] [PubMed]
  54. Sheldrick, G.M. Experimental phasing with SHELXC/D/E: Combining chain tracing with density modification. Acta Crystallogr. Sect. D Biol. Crystallogr. 2010, D66, 479–485. [Google Scholar] [CrossRef] [PubMed]
  55. Pape, T.; Scheider, T.R. HKL2MAP: A graphical user interface for phasing with SHELX programs. J. Appl. Crystallogr. 2004, 37, 843–844. [Google Scholar] [CrossRef]
  56. Matthews, B.W. Solvent content of protein crystals. J. Mol. Biol. 1968, 33, 491–497. [Google Scholar] [CrossRef]
  57. Kantardjieff, K.; Rupp, B. Matthews coefficient probabilities: Improved estimates for unit cell contents of proteins, DNA, and protein-nucleic acid complex crystals. Protein Sci. 2003, 12, 1865–1871. [Google Scholar] [CrossRef] [PubMed]
  58. Schneider, T.R.; Sheldrick, G.M. Substructure solution with SHELXD. Acta Crystallogr. Sect. D Biol. Crystallogr. 2002, D58, 1772–1779. [Google Scholar] [CrossRef]
  59. Burla, M.C.; Caliandro, R.; Camalli, M.; Carrozzini, B.; Cascarano, G.; Caro, L.D.; Giacovazzo, C.; Polidori, G.; Spagna, R. SIR2004: an improved tool for crystal structure determination and refinement. J. Appl. Crystallogr. 2005, 38, 381–388. [Google Scholar] [CrossRef]
  60. Bricogne, G.; Vonrhein, C.; Flensburg, C.; Schlitz, M.; Paciorek, W. Generation, representation and flow of phase information in structure determination: recent developments in and around SHARP 2.0. Acta Crystallogr. Sect. D Biol. Crystallogr. 2003, D59, 2023–2030. [Google Scholar] [CrossRef]
  61. Terwilliger, T.C.; Berendzen, J. Automated MAD and MIR structure solution. Acta Crystallogr. Sect. D: Biol. Crystallogr. 1999, D55, 849–861. [Google Scholar] [CrossRef]
  62. Watkins, D.; Moulaei, T.; Komeda, S.; Williams, L.D. Application of anomalous diffraction methods to the study of DNA and DNA-complexes. Methods Mol. Bio. 2010, 613, 133–152. [Google Scholar]
  63. Caliandro, R.; Carrozzini, B.; Cascarano, G.L.; DeCaro, L.; Giacovazzo, C.; Siliqi, D. Advances in the free lunch method. J. Appl. Crystallogr. 2007, 40, 931–937. [Google Scholar] [CrossRef]
  64. Luo, Z.; Dauter, M.; Dauter, Z. Phosphates in the Z-DNA dodecamer are flexible, but their P-SAD signal is sufficient for structure solution. Acta Crystallogr. Sect. D Biol. Crystallogr. 2014, D70, 1790–1800. [Google Scholar] [CrossRef] [PubMed]
  65. Shen, Q.; Wang, J.; Ealick, S.E. Anomalous difference signal in protein crystals. Acta Crystallogr. Sect. D Biol. Crystallogr. 2003, A59, 371–373. [Google Scholar] [CrossRef]
  66. Hays, F.A.; Teegarden, A.T.; Jones, Z.J.R.; Harms, M.; Raup, D.; Watson, J.; Cavaliere, E.; Ho, P.S. How sequence defines structure: a crystallographic map of DNA structure and conformation. Proc. Natl. Acad. Sci. USA. 2005, 102, 7157. [Google Scholar] [CrossRef] [PubMed]
  67. Gao, Y.G.; Robinson, H.; Wang, A.H. High-resolution A-DNA structures of d(AGGGGCCCCT), an A-DNA model of poly(dG) x poly(dC). Eur. J. Biochem. 1999, 261, 413. [Google Scholar] [CrossRef] [PubMed]
  68. Ng, H.L.; Kopka, M.L.; Dickerson, R.E. The structure of a stable intermediate in the A->B DNA helix transition. Proc. Natl. Acad. Sci. USA. 2000, 97, 2035. [Google Scholar] [CrossRef] [PubMed]
  69. Thota, N.; Li, X.H.; Bingman, M.; Sundaralingam, M. High-resolution refinement of the hexagonal A-DNA octamer d(GTGTACAC) at 1.4 Å. Acta Crystallogr. Sect. D Biol. Crystallogr. 1993, D49, 282. [Google Scholar] [CrossRef] [PubMed]
  70. Drew, H.R.; Dickerson, R.E. Conformation and dynamics in a Z-DNA tetramer. J. Mol. Biol. 1981, 152, 723. [Google Scholar] [CrossRef]
  71. Pan, B.; Sundaralingam, M. Crystal structure of rGd(CGCGCG): a Z-DNA hexamer with a 5’-(rG) overhang. Acta Crystallogr. Sect. D Biol. Crystallogr. 2003, D59, 433–437. [Google Scholar] [CrossRef]
  72. Girard, E.; Prange, T.; Kahn, R.; Fourme, R. Adaptation of the base-paired double-helix molecular architecture to extreme pressure. Nucleic Acids Res. 2007, 35, 4800. [Google Scholar] [CrossRef] [PubMed]
  73. Bingman, C.; Li, X.; Zon, G.; Sundaralingam, M. Crystal and molecular structure of d(GTGCGCAC): investigation of the effects of base sequence on the conformation of octamer complexes. Biochemistry 1992, 31, 12803. [Google Scholar] [CrossRef] [PubMed]
  74. Ramakrishnan, B.; Sundaralingam, M. High resolution crystal structure of the A-DNA decamer d(CCCGCCGGG). Novel intermolecular base-paired G*(G.C) triplets. J. Mol. Biol. 1993, 231, 431–444. [Google Scholar] [CrossRef] [PubMed]
  75. Mueller-Dieckmann, C.; Panjikar, S.; Tucker, P.A.; Weiss, M.S. On the routine use of soft X-rays in macromolecular crystallography. Part III. the optimal data-collection wavelength. Acta Crystallogr. Sect. D Biol. Crystallogr. 2005, D61, 1263–1272. [Google Scholar] [CrossRef] [PubMed]
  76. Kitayner, M.; Rozenberg, H.; Rabinovich, D.; Shakked, Z. Structures of the DNA-binding site of Runt-domain transcription regulators. Acta Crystallogr. Sect. D Biol. Crystallogr. 2005, D61, 236–246. [Google Scholar] [CrossRef] [PubMed]
  77. Mandal, P.K.; Venkadesh, S.; Gautham, N. Crystal structures of d(CACGCG).d(CGCGTG) grown with different metal ions. To be published.
  78. Ramakrishnan, B.; Sundaralingam, M. Evidence for crystal environment dominating base sequence effects on DNA conformation: Crystal structures of the orthorhombic and hexagonal polymorphs of the A-DNA decamer d(GCGGGCCCGC) and comparison with their isomorphous crystal structures. Biochemistry 1993, 32, 11458–11468. [Google Scholar] [CrossRef] [PubMed]
  79. Johansson, E.; Parkinson, G.; Neidle, S. A new crystal form for the dodecamer C-G-C-G-A-A-T-T-C-G-C-G: symmetry effects on the sequence-dependent DNA structure. J. Mol. Biol. 2000, 300, 551–561. [Google Scholar] [CrossRef] [PubMed]
  80. Mandal, P.K.; Venkadesh, S.; Nandini, M.; Gautham, N. Crystal studies of d(CACGCG).d(CGCGTG) grown with various metal ions. To be published.
  81. Heinemann, U.; Lauble, H.; Frank, R.; Blocker, H. Crystal structure analysis of an A-DNA fragment at 1.8 Åresolution: d(GCCCGGGC). Nucleic Acids Res. 1987, 15, 9531–9550. [Google Scholar] [CrossRef] [PubMed]
  82. Han, G.W.; Kopka, M.L.; Cascio, D.; Grzeskowiak, K.; Dickerson, R.E. Structure of a DNA analog of the primer for HIV-1 RT second strand synthesis. J. Mol. Biol. 1997, 269, 811–826. [Google Scholar] [CrossRef] [PubMed]
  83. Mandal, P.K.; Venkadesh, S.; Gautham, N. Crystal structure of d(CACGCG).d(CGCGTG) grown in the presence of SnCl2. To be published.
  84. Drew, H.R.; Wing, R.M.; Takano, T.; Broka, C.; Tanaka, S.; Itakura, K.; Dickerson, R.E. Structure of a B-DNA dodecamer: Conformation and dynamics. Proc. Natl. Acad. Sci. USA. 1981, 78, 2179–2183. [Google Scholar] [CrossRef] [PubMed]
  85. Ban, C.; Sudaralingam, M. Crystal structure of the self-complementary 5’-purine start decamer d(GCACGCGTGC) in the A-DNA conformation. II. Biophys. J. 1996, 71, 1222–1227. [Google Scholar] [CrossRef]
  86. Tippin, D.B.; Sundaralingam, M. Structure of d(CCCTAGGG): comparison with nine isomorphous octamer sequences reveals four distinct patterns of sequence-dependent intermolecular interactions. Acta Crystallogr. Sect. D Biol. Crystallogr. 1996, D52, 997–1003. [Google Scholar] [CrossRef] [PubMed]
  87. Holbrook, S.R.; Dickerson, R.E.; Kim, S.H. Anisotropic thermal-parameter refinement of the DNA dodecamer CGCGAATTCGCG by the segmented rigid-body method. Acta Crystallogr. Sect. D Biol. Crystallogr. 1985, B41, 255–262. [Google Scholar] [CrossRef]
  88. Goodsell, D.S.; Kopka, M.L.; Cascio, D.; Dickerson, R.E. Crystal structure of CATGGCCATG and its implications for A-tract bending models. Proc. Natl. Acad. Sci. USA. 1993, 90, 2930–2934. [Google Scholar] [CrossRef] [PubMed]
  89. Malinina, L.; Tereshko, V.; Ivanova, E.; Subirana, J.A.; Zarytova, V.; Nekrasov, Y. Structural variability and new intermolecular interactions of Z-DNA in crystals of d(PCPGPCPGPCPG). Biophys. J. 1998, 74, 2482–2490. [Google Scholar] [CrossRef]
  90. Venkadesh, S.; Mandal, P.K.; Gautham, N. Crystal structures of d(CACGCG).d(CGCGTG) cocrystallized with MnCl2. To be published.
  91. Shmueli, U. International Tables for Crystallography, second ed.; Vol. B, Kluwer Academic Publishers: Dordrecht, Netherlands, 2001. [Google Scholar]
  92. Chapman, H.N.; Fromme, P.; Barty, A.; White, T.A.; Kirian, R.A.; Aquila, A.; Hunter, M.S.; Schulz, J.; DePonte, D.P.; Weierstall, U.; et al. Femtosecond X-ray protein nanocrystallography. Nature 2011, 470, 73–77. [Google Scholar] [CrossRef] [PubMed]
  93. Nakane, T.; Song, C.; Suzuki, M.; Nango, E.; Kobayashi, J.; Masuda, T.; Inoue, S.; Mizohata, E.; Nakatsu, T.; Tanaka, T.; et al. Native sulfur/chlorine SAD phasing for serial femtosecond crystallography. Acta Crystallogr. Sect. D Biol. Crystallogr. D71, 2519–2525. [CrossRef] [PubMed]
  94. Lomb, L.; Barends, T.R.M.; Kassemeyer, S.; Aquila, A.; Epp, S.W.; Erk, B.; Foucar, L.; Hartmann, R.; Rudek, B.; Rolles, D.; et al. Radiation damage in protein serial femtosecond crystallography using an x-ray free-electron laser. Phys. Rev. B 2011, 84, 214111. [Google Scholar] [CrossRef] [PubMed]
  95. Finke, A.D.; Panepucci, E.; Vonrhein, C.; Wang, M.; Bricogne, G.; Olieric, V. Advanced crystaltallographic data colllection protocols for experimental phasing. In Nucleic Acid Crystallography: Methods and Protocols, Methods in Molecular Biology; Ennifar, E., Ed.; Springer Science+Business Media: New York, NY, USA, 2016; pp. 175–191. [Google Scholar]
  96. Diederichs, K. Quantifying instrument errors in macromolecular X-ray data sets. Acta Crystallogr. Sect. D Biol. Crystallogr. 2010, D66, 733–740. [Google Scholar] [CrossRef] [PubMed]
  97. Rose, J.P.; Wang, B.C. SAD phasing: history, current impact and future opportunities. Arch. Biochem. Biophys. 2016, 602, 80–94. [Google Scholar] [CrossRef] [PubMed]
  98. Rose, J.P.; Wang, B.C.; Weiss, M.S. Native SAD is maturing. IUCr J. 2015, 2, 431–440. [Google Scholar] [CrossRef] [PubMed]
  99. Weinert, T.; Olieric, V.; Waltersperger, S.; Panepucci, E.; Chen, L.; Zhang, H.; Zhou, D.; Rose, J.; Ebihara, A.; Kuramitsu, S. et. al Fast native-SAD phasing for routine macromolecular structure detemination. Nat. Methods 2015, 12, 131–133. [Google Scholar] [CrossRef] [PubMed]
  100. Liu, Z.J.; Chen, L.; Wu, D.; Ding, W.; Zhang, H.; Zhou, W.; Fu, Z.Q.; Wang, B.C. A multi-dataset data-collection strategy produces better diffraction data. Acta Crystallogr. Sect. A Found. Crystallogr. 2011, A67, 544–549. [Google Scholar] [CrossRef] [PubMed]
  101. Owen, R.L.; no Piñera, E.R.; Garman, E.F. Experimental determination of the radiation dose limit for cryococryo protein crystals. Proc. Natl. Acad. Sci. USA. 2006, 103, 4912–4917. [Google Scholar] [CrossRef] [PubMed]
  102. Liu, Q.; Dahmane, T.; Zhang, Z.; Assur, Z.; Brasch, J.; Shapiro, L.; Mancia, F.; Hendrickson, W.A. Structures from anomalous diffraction of native biologicsl macromolecules. Science 2012, 336, 1033–1037. [Google Scholar] [CrossRef] [PubMed]
  103. Liu, Q.; Liu, Q.; Hendrickson, W.A. Robust structural analysis of native biological macromolecules from multi-crystal anomalous diffraction data. Acta Crystallogr. Sect. D Biol. Crystallogr. 2013, D69, 1314–1332. [Google Scholar] [CrossRef] [PubMed]
  104. Klinke, S.; Foos, N.; Rinaldi, J.J.; Paris, G.; Goldbaum, F.A.; Legrand, P.; Guimarães, B.G.; Thompson, A. S-SAD phasing of monoclinic histidine kinase from Brucella abortus combining data from multiple crystals and orientations: an example of data-collection strategy and a posteriori analysis of different data combinations. Acta Crystallogr. Sect. D Biol. Crystallogr. 2015, D71, 1433–1443. [Google Scholar] [CrossRef] [PubMed]
  105. Olieric, V.; Weinert, T.; Finke, A.D.; Anders, C.; Li, D.; Olieric, N.; Borca, C.N.; Steinmetz, M.O.; Caffrey, M.; Jinek, M.; Wang, M. Data-collection strategy for challenging native SAD phasing. Acta Crystallogr. Sect. D Biol. Crystallogr. 2016, D72, 421–429. [Google Scholar] [CrossRef] [PubMed]
  106. Liebschner, D.; Yamada, Y.; Matsugaki, N.; Senda, M.; Senda, T. On the influence of crystal size and wavelength on native SAD phasing. Acta Crystallogr. Sect. D Biol. Crystallogr. 2016, D72, 728–741. [Google Scholar] [CrossRef] [PubMed]
  107. Dauter, Z. Data-collection strategies. Acta Crystallogr. Sect. D Biol. Crystallogr. 1999, D55, 1703–1717. [Google Scholar] [CrossRef]
  108. Cianci, M.; Groves, M.R.; Barford, D.; Schneider, T.R. Data collection with a tailored X-ray beam size at 2.69 Å wavelength (4.6 keV): sulfur SAD phasing of Cdc23Nterm. Acta Crystallogr. Sect. D Biol. Crystallogr. 2016, D72, 403–412. [Google Scholar] [CrossRef] [PubMed]
  109. Bury, C.S.; McGeehan, J.E.; Antson, A.A.; Carmichael, I.; Gerstel, M.; Shevtsov, M.B.; Garman, E.F. RNA protects a nucleoprotein complex against radiation damage. Acta Crystallogr. Sect. D Biol. Crystallogr. 2016, D72, 648–657. [Google Scholar] [CrossRef] [PubMed]
  110. Zeldin, O.B.; Gerstel, M.; Garman, E.F. RADDOSE-3D: Time- and space-resolved modelling of dose in macromolecular crystallography. J. Appl. Crystallogr. 2013, 46, 1225–1230. [Google Scholar] [CrossRef]
  111. Murray, J.W.; Garman, E.F.; Ravelli, R.B.G. X-ray absorption by macromolecular crystals: The effects of wavelength and crystal composition on absorbed dose. J. Appl. Crystallogr. 2004, 37, 513–522. [Google Scholar] [CrossRef]
  112. Raiber, E.A.; Muray, P.; Chirgadze, D.Y.; Beraldi, D.; Luisi, B.F.; Balasubramanian, S. 5-Formylcytosine alters the structure of the DNA double helix. Nat. Struct. Mol. Bio. 2015, 22, 44–49. [Google Scholar] [CrossRef] [PubMed] [Green Version]
  113. Adams, P.D.; Afonine, P.V.; Bunkoczi, G.; Chen, V.B.; Davis, I.W.; Echols, N.; Headd, J.J.; Hung, L.W.; Kaprai, G.J.; Grosse-Kunstleve, R.W.; et al. PHENIX: a comprehensive Python-based system for macromolecular structure solution. Acta Crystallogr. Sect. D Biol. Crystallogr. 2010, D66, 213–221. [Google Scholar] [CrossRef] [PubMed]
  114. Gessner, R.V.; Quigley, G.J.; Egli, M. Comparative studies of high resolution Z-DNA crystal structures. Part 1: Common hydration patterns of alternating dG-dC. J. Mol. Biol. 1994, 236, 1154–1168. [Google Scholar] [CrossRef]
  115. Pallan, P.S.; Prakash, T.P.; Li, F.; Eoff, R.L.; Manoharan, M.; Egli, M. A conformational transition in the structure of a 2’-modified DNA visualized at high resolution. Chem. Commun. 2009, 2017–2019. [Google Scholar] [CrossRef] [PubMed]
  116. Sheldrick, G.M. XPREP. Bruker AXS: Karlsruhe, Germany, 2003. [Google Scholar]
  117. Sheldrick, G.M. A short history of SHELX. Acta Crystallogr. Sect. A Found. Crystallogr. 2006, A64, 112–122. [Google Scholar]
  118. Emsley, P.; Cowtan, K. Coot: model-building tools for molecular grapics. Acta Crystallogr. Sect. D Biol. Crystallogr. 2004, D60, 2126–2132. [Google Scholar] [CrossRef] [PubMed]
  119. Schrödinger, L. The PyMOL Molecular Graphics System. Version 1.3r1 . Schrödinger LLC: New York, NY, USA,, 2010. [Google Scholar]
  120. Collaborative Computational Project, N. The CCP4 suite:programs for protein crystallography. Acta Crystallogr. Sect. D Biol. Crystallogr. 1994, D50, 760–763. [Google Scholar] [CrossRef] [PubMed]
  121. Zwart, P.H. Anomalous signal indicators in protein crystallography. Acta Crystallogr. Sect. D Biol. Crystallogr. 2005, D61, 1437–1448. [Google Scholar] [CrossRef] [PubMed]
Figure 1. Scatter plot of correlation coefficient calculated for all data (CCall) calculated by SHELXD versus try number for Z-DNA.
Crystals 06 00125 g001
Figure 2. Site peak heights as a percentage of the top peak for Z-DNA calculated by SHELXD for a range of tries by the CCall value. The top tries, CCall > 40.00, are shown in purple. Other successful tries, CCall < 40.00, are in green, and unsuccessful tries are shown in red.
Crystals 06 00125 g002
Figure 3. Connectivity calculated by SHELXE plotted by density modification cycle for Z-DNA for a range of tries based on the correlation coefficient.
Crystals 06 00125 g003
Figure 4. Patterson superposition minimum function (PSMF) peaks superimposed onto the refined Z-DNA structure shows that the peaks do not fall on a single molecule.
Crystals 06 00125 g004
Figure 5. (a) Model of Z-DNA resulting from the direct methods’ phasing by SIR2004. Although element assignment is often incorrect, phasing by direct methods was quite good. In the figure, carbon atoms are green; oxygen atoms are red; phosphorus atoms are orange; and nitrogen atoms are blue. (b) Direct methods’ phasing using SIR2004 was able to place six atoms of the spermine molecule.
Crystals 06 00125 g005
Figure 6. Scatter plot of CCall calculated by SHELXD versus try number for 2’-thio decamer.
Crystals 06 00125 g006
Figure 7. Plot for f′ and f″ for some of the more commonly used anomalously scattering atoms.
Crystals 06 00125 g007
Figure 8. Plot for f′ and f″ for S and P atoms around the Cu Kα wavelength.
Crystals 06 00125 g008
Figure 9. The signal to noise ratio evaluated using ΔFano versus resolution plotted for the three data sets, zdna, DDD, and 2’-thio decamer. The data were calculted by resolution bin using 10 bins each for plotting.
Crystals 06 00125 g009
Figure 10. Scatter plot of correlation coefficient for all data, CCall, and related Patterson Figure of Merit, PatFOM, values over 10,000 tries for SHELXD with Z-DNA data. Tries resulting in useful phases are red and unsuccessful tries are green.
Crystals 06 00125 g010
Figure 11. Plot of scattering factors calculated using Cromer-Mann coefficients in a four Gaussian approximation. The effective scattering, f(eff), is calculated by weighting the scattering factor of each element by its relative proportion to the total number of non-hydrogen atoms in d(GT)/d(AC).
Crystals 06 00125 g011
Figure 12. Values of ΔB for 934 models of nucleic acid from the PDB plotted against reported resolution. The regression line is shown in green with the average value of ΔB, -7.237 Å2, shown with the error bars in blue.
Crystals 06 00125 g012
Figure 13. Plot of the calculated anomalous signal as a function of resolution and including the term for ΔB representing the relative atomic displacement factor for phosphorus atoms in relation to non-anomalously scattering atoms.
Crystals 06 00125 g013
Table 1. Data collection statistics for Z-DNA, Drew–Dickerson DNA dodecamer (DDD) and 2’-thio decamer.
Z-DNADDD2’-Thio Decamer
Unit Cell (Å)
a17.86324.87324.768
b31.48039.76243.248
c44.22865.62545.318
Resolution (Å)0.95 (1.04–0.95)1.32 (1.41–1.32)1.30 (1.39–1.30)
No. of reflections
Measured255,194507,675506,771
Unique15,97615,75612,553
Completeness (%)97.8 (92.2)98.6 (98.2)99.9 (100.0)
Redundancy15.6 (5.2)29.6 (13.3)34.5 (17.4)
I/σ (I)31.7 (7.5)42.46 (3.02)37.52 (4.73)
Rint0.058 (0.183)0.046 (0.604)0.042 (0.494)
* R i n t = Σ | F o 2 < F o 2 > | Σ F o 2 .
Table 2. Z-DNA phosphorus atoms found by SHELXD for tries with varying scores.
Peak Number8833 (44.98)9700 (29.06)8500 (26.99)1084 (26.01)8(25.58)
1669610
259696
395555
481010108
54211119
6211884
712812123
811122212
9104342
10334311
Table 3. Z-DNA phosphorus atoms found by SHELXD related to peak heights and refined B-factors.
Peak NumberPeak HeightB FactorBase
10.99003.356
20.96834.095
30.96833.549
40.93894.168
50.89366.814
60.87874.582
70.82365.7012
80.81815.2611
90.80544.6010
100.75495.693
Table 4. Refinement statistics for Z-DNA and 2’-thio-modified DNA decamer refined using SHELXL.
Z-DNA2’-Thio Decamer
R/Rfree0.099/0.1080.152/0.192
No. of Reflections242,13811,859
Number of non-hydrogen atoms
 No. of nucleic acid atoms240386
 No. of heteroatoms2043
 No. of water atoms7676
R.M.S. Deviations
 Bond length (Å)0.0580.012
 Angle distance (Å)0.4360.02
Table 5. Measurability of Bijvoet differences.
CrystalAverage Bijvoet Signal *Measurability (%)
Z-DNA1.216.55
DDD1.379.55
2’-thio decamer1.318.43
* < | I + I | ( σ I + 2 + σ I 2 ) 1 / 2 > ; Discussed in the text.
Table 6. Structures examined to determine spacing and B-factors.
PDB IDDNA formsequencereferenceresolution(Å)
1ZFFB-DNAd(CCGAATTCGG)[66]0.94
1ZF5B-DNAd(CCAGCGTGG)[66]0.99
440DA-DNAd(AGGGGCCCT)[67]1.10
1DC0A/B-DNAd(CATGGGCCCATG)[68]1.30
1ZF1A-DNAd(CCGGGCCCGG)[66]1.35
1D78A-DNAd(GTGTACAC)[69]1.40
1D79A-DNAd(GTGTACAC)[69]1.45
1ZNAZ-DNAd(CGCG)[70]1.50
1M6RZ-DNAd(CGCGCG)[71]1.54
2PKVA/B-DNAd(GGTATACC)[72]1.60
118DA-DNAd(GTGCGCAC)[73]1.64
160DA-DNAc(CCCGGCCGGG)[74]1.65
1ZEXA-DNAd(CCCGGCCGGG)[66]1.65
2A7EA-DNAd(CCCTAGGG)[75]1.66
137DA-DNAd(GCGGGCCCGC)[74]1.70
1XJXA-DNAd(TCTGCGGTC).d(TGACCCGCAG)[76]1.70
3F8OZ-DNAd(CACGCG).d(CTCGCG)[77]1.72
1ZFGB-DNAd(CCGAGCTCGG)[66]1.75
138DA-DNAd(GCGGGCCCGC)[78]1.80
1EHVB-DNAd(CGCGAATTCGCG)[79]1.80
3GCYZ-DNAd(CACGCG).d(CGCGCG)[80]1.80
9DNAA-DNAd(GCCCGGGC)[81]1.80
307DB-DNAd(CAAAAGAAAAG).d(CTTTTCTTTG)[82]1.85
3GDAZ-DNAd(CACGCG).(CGCGTG)[83]1.88
1BNAB-DNAd(CGCGAATTCGCG)[84]1.90
260DA-DNAd(GCACGCGTGC)[85]1.90
279DZ-DNAd(GCGCGCGCGC)[85]1.90
317DA-DNAd(CCCTAGGG)[86]1.90
7BNAB-DNAd(CGCGAATTCGCG)[87]1.90
126DB-DNAd(CATGGCCATG)[88]2.00
1XJYA-DNAd(TCTGCGGTC).d(TGACCGCAG)[76]2.00
390DZ-DNAd(CGCGCG)[89]2.00
3G2AZ-DNAd(CACGCG).d(CGCCTG)[90]2.00
1ZFCB-DNAd(CCGATATCGG)[66]2.00

