Article

hklstrain: An Algorithm for Orientation-Dependent Micro-Strain Calculation Using Laue Crystallography Methodology


Shanghai Advanced Research Institute, Chinese Academy of Sciences, Shanghai 201210, China
Crystals 2026, 16(9), 554; https://doi.org/10.3390/cryst16090554
Submission received: 27 July 2026 / Revised: 24 August 2026 / Accepted: 24 August 2026 / Published: 26 August 2026
(This article belongs to the Section Industrial Crystallization)

Abstract

The precise characterization of micro-strain distribution within crystalline materials using Laue crystallography methodology is critically important. Applying the strain tensor based on the Green–Lagrange deformation matrix to represent the hkl lattice strain tensor often suffers from insufficient accuracy and drawbacks in evaluation criteria, especially for non-cubic crystal systems. To address these challenges, a novel algorithm hklstrain is designed. The unstrained interplanar spacing d0 is obtained according to the theoretically indexed spot positions, while the strained interplanar spacing dmes is obtained via the global fitting method according to the principle of Laue X-ray reflection and orientation information, and then the micro-strain of all lattice planes of interest is mapped into the sample coordinate system. hklstrain reaches a strain resolution down to 2 × 10⁻⁴, and quantitatively determines the orientation-dependent micro-strain fields, offering intuitive insights into the characterization of crystalline materials. It has been successfully applied in the BL03HB beamline at Shanghai Synchrotron Radiation Facility (SSRF) for micro-strain analysis. In contrast to Green–Lagrange strain tensor method, hklstrain produces reliable orientation-dependent micro-strain maps of interplanar spacing variation, thus providing significant advantages in strain tensor analysis for crystalline materials using Laue crystallography methodology.

1. Introduction

Crystalline materials are widely used as key components in modern industry, including aerospace components, energy-related devices, and high-performance electronic systems [1,2,3,4]. The internal strain states influence mechanical performance, service lifetime, and structural failure under different environments [5,6,7,8]. The strain distributions within crystalline materials are highly inhomogeneous [9,10]. Accurate measurement of strain distributions is thus essential for understanding material deformation and ensuring the long-term safe service of key structural components [11,12,13].
The requirements for strain characterization have shifted from conventional overall strain measurement toward high-resolution mapping of microscale strain distribution [14,15,16]. Capturing local strain fluctuations within crystalline materials has become an essential requirement for material research [17,18,19,20,21]. Different strain measurement approaches exhibit practical limitations. For instance, resistance strain gauges can only obtain averaged macroscopic strain signals over a relatively large sample area [22]. (1) Electron backscatter diffraction (EBSD) can only be applied as an auxiliary tool for micro-strain analysis [23,24]. (2) A scanning electron microscope (SEM)-based technique links orientation and strain in crystalline materials. It is one major alternative to Laue diffraction for micro-strain analysis. However, the sample requires pre-treatment, which restricts its capability to capture subtle lattice distortions [25,26]. (3) Transmission electron microscopy (TEM)-based strain mapping uses high-energy electrons to enable atomic-scale spatial resolution, making it suitable for ultra-microscale strain analysis [27,28], but sample preparation is extremely complex and time-consuming. It is limited to small sample volumes. (4) Digital image correlation (DIC) is an optical technique that measures full-field strain [29]. It is widely used for both macroscale and mesoscale strain analysis with no orientation information. It is limited to surface measurements. (5) Raman spectroscopy measures strain by detecting shifts in the Raman-scattering frequencies but requires materials to have strong Raman signals [30].
Laue crystallography methodology represents a state-of-the-art characterization tool for crystalline materials [7,31,32,33,34]. Laue micro-diffraction offers unique advantages that conventional methods cannot match [35,36]; for example, its excellent non-destructive nature and in situ capability allow real-time monitoring of the dynamic sample evolution. It supports in situ experiments under diverse environments including room temperature, high temperature, cryogenic conditions, and external mechanical loading, making it ideal for studying deformation processes [36,37].
There are several reported micro-strain analysis software packages using Laue diffraction, for example, LaueTools 3.2.1, accessed on 1 May 2025 (https://github.com/BM32ESRF/lauetools, developed at BM32 of ESRF), and XMAS 6.0, accessed on 12 May 2023 (https://sites.google.com/a/lbl.gov/bl12-3-2/user-resources, developed at beamline 12.3.2 of ALS), XtalCAMP 2.4, accessed on 12 March 2026 [38] and PYXIS, accessed on 12 March 2026 [39]. The strain calculation module of LaueTools remains under development at the ESRF. Currently, it is very difficult and inconvenient to process Laue diffraction data using LaueTools in terms of spot indexing and strain calculation. XMAS, XtalCAMP, and PYXIS are closed-source software. These three software packages have been extensively used by users for micro-strain calculations at beamline 12.3.2 (closed for upgrade since 2026) of ALS.
However, LaueTools, XMAS, XtalCAMP, and PYXIS are all based on a Green–Lagrange deformation matrix in strain calculations. The Green–Lagrange strain tensor is widely adopted in geometric-nonlinear mechanical models [40,41]. Moreover, a Green–Lagrange strain tensor was previously applied in Laueprocess for crystal orientation angle (PhiX, PhiY, and PhiZ) and beam center refinement [42]. Mapping this Green–Lagrange strain tensor to the hkl lattice strain tensor remains challenging, particularly for non-cubic crystal systems.
Here, a novel algorithm named hklstrain for micro-strain calculation is specially developed and applied at the BL03HB Laue crystallography beamline of the Shanghai Synchrotron Radiation Facility (SSRF) for the quantitative calculation of micro-strain. Based on the fundamental principles of Laue crystallography and advanced numerical optimization algorithms, hklstrain is designed to overcome the drawbacks of Green–Lagrange strain tensors in micro-strain analysis. Its core goal is to provide a reliable, open-source, adaptable, and integrated assessment method for strain analysis of crystalline materials.

2. The Workflow of Hklstrain

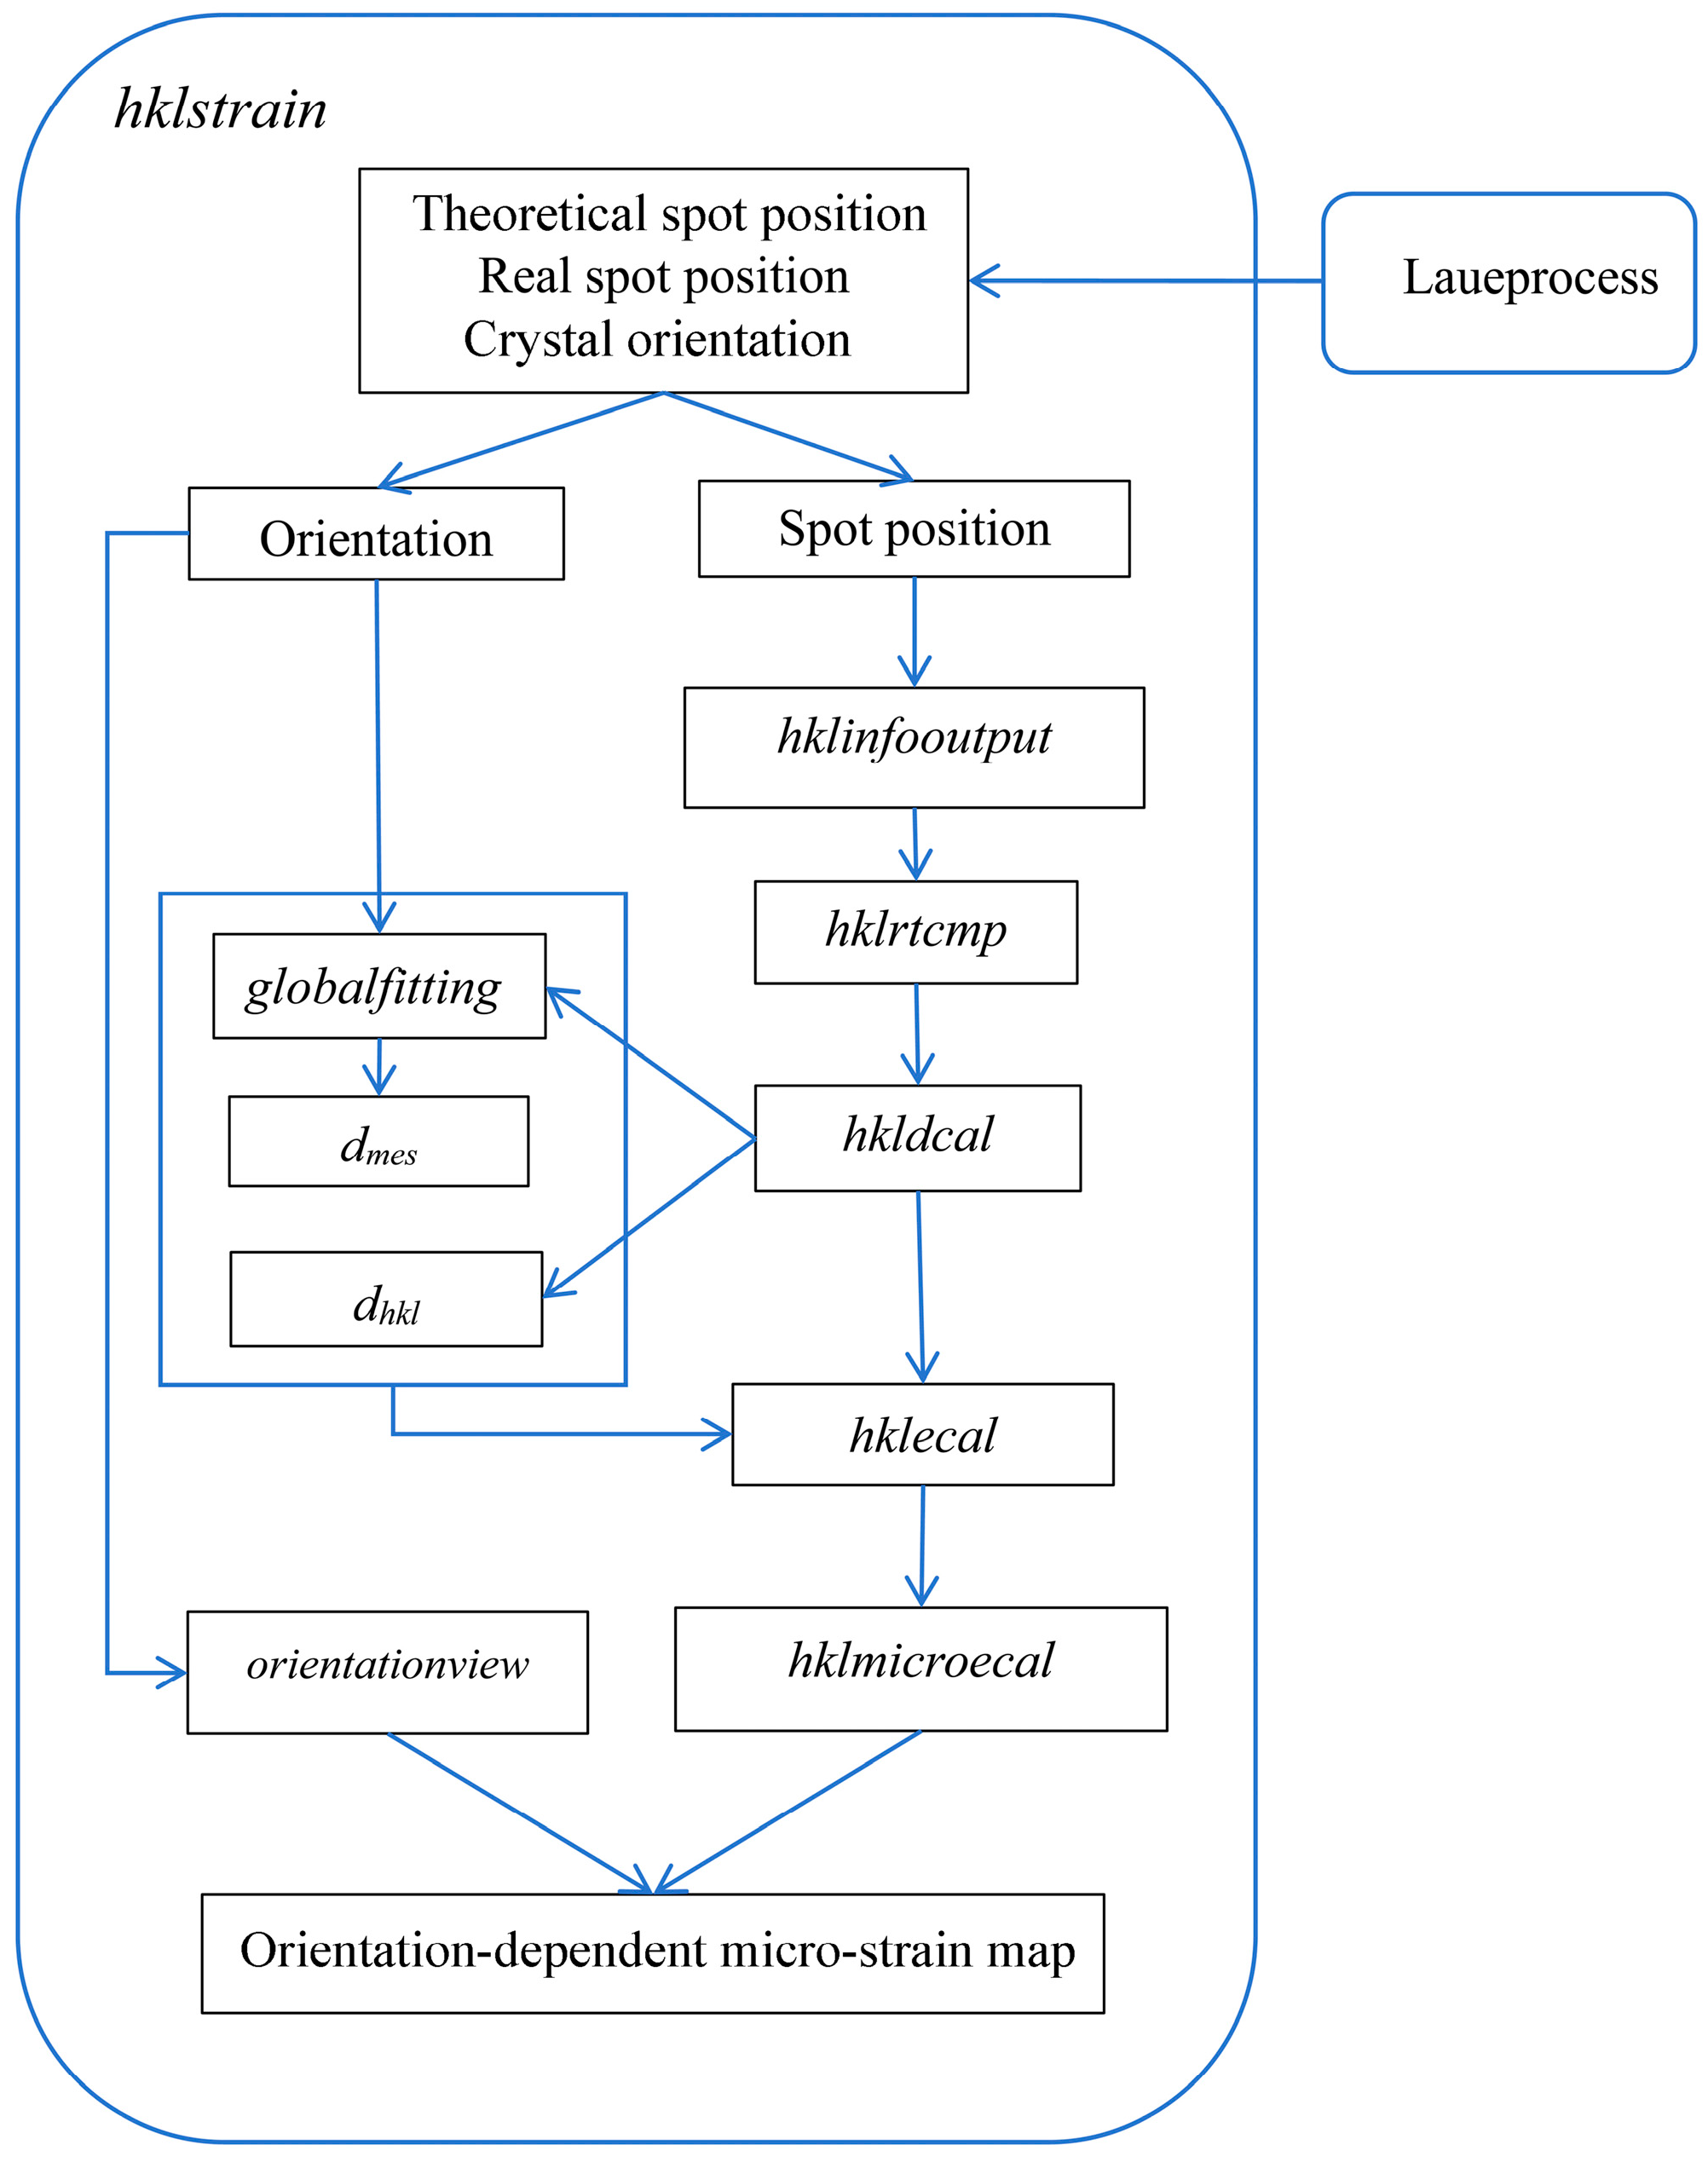
The data processing workflow of hklstrain is shown in Figure 1. Raw diffraction data is preprocessed by the upstream program Laueprocess [42], which exports three datasets to hklstrain: theoretical spot positions, measured real spot positions, and initial crystal orientation parameters. In hklstrain, the data processing workflow is divided into two processing branches: (1) The orientation data is used in globalfitting to calculate the interplanar spacing dmes from deformed lattices, and orientationview is used to represent the orientation of crystalline materials. (2) The spot-position data is applied to hklinfooutput, which exports indexed hkl information; hklrtcmp compares theoretical and experimental spot coordinates, hkldcal computes interplanar distances dhkl, hklecal calculates lattice strain tensors, and hklmicroecal performs micro-strain calculation. The workflow outputs a final orientation-dependent strain map. hklstrain is available in the Supplementary Files in this paper.

2.1. The Principle of Strain Calculation Using Hklstrain

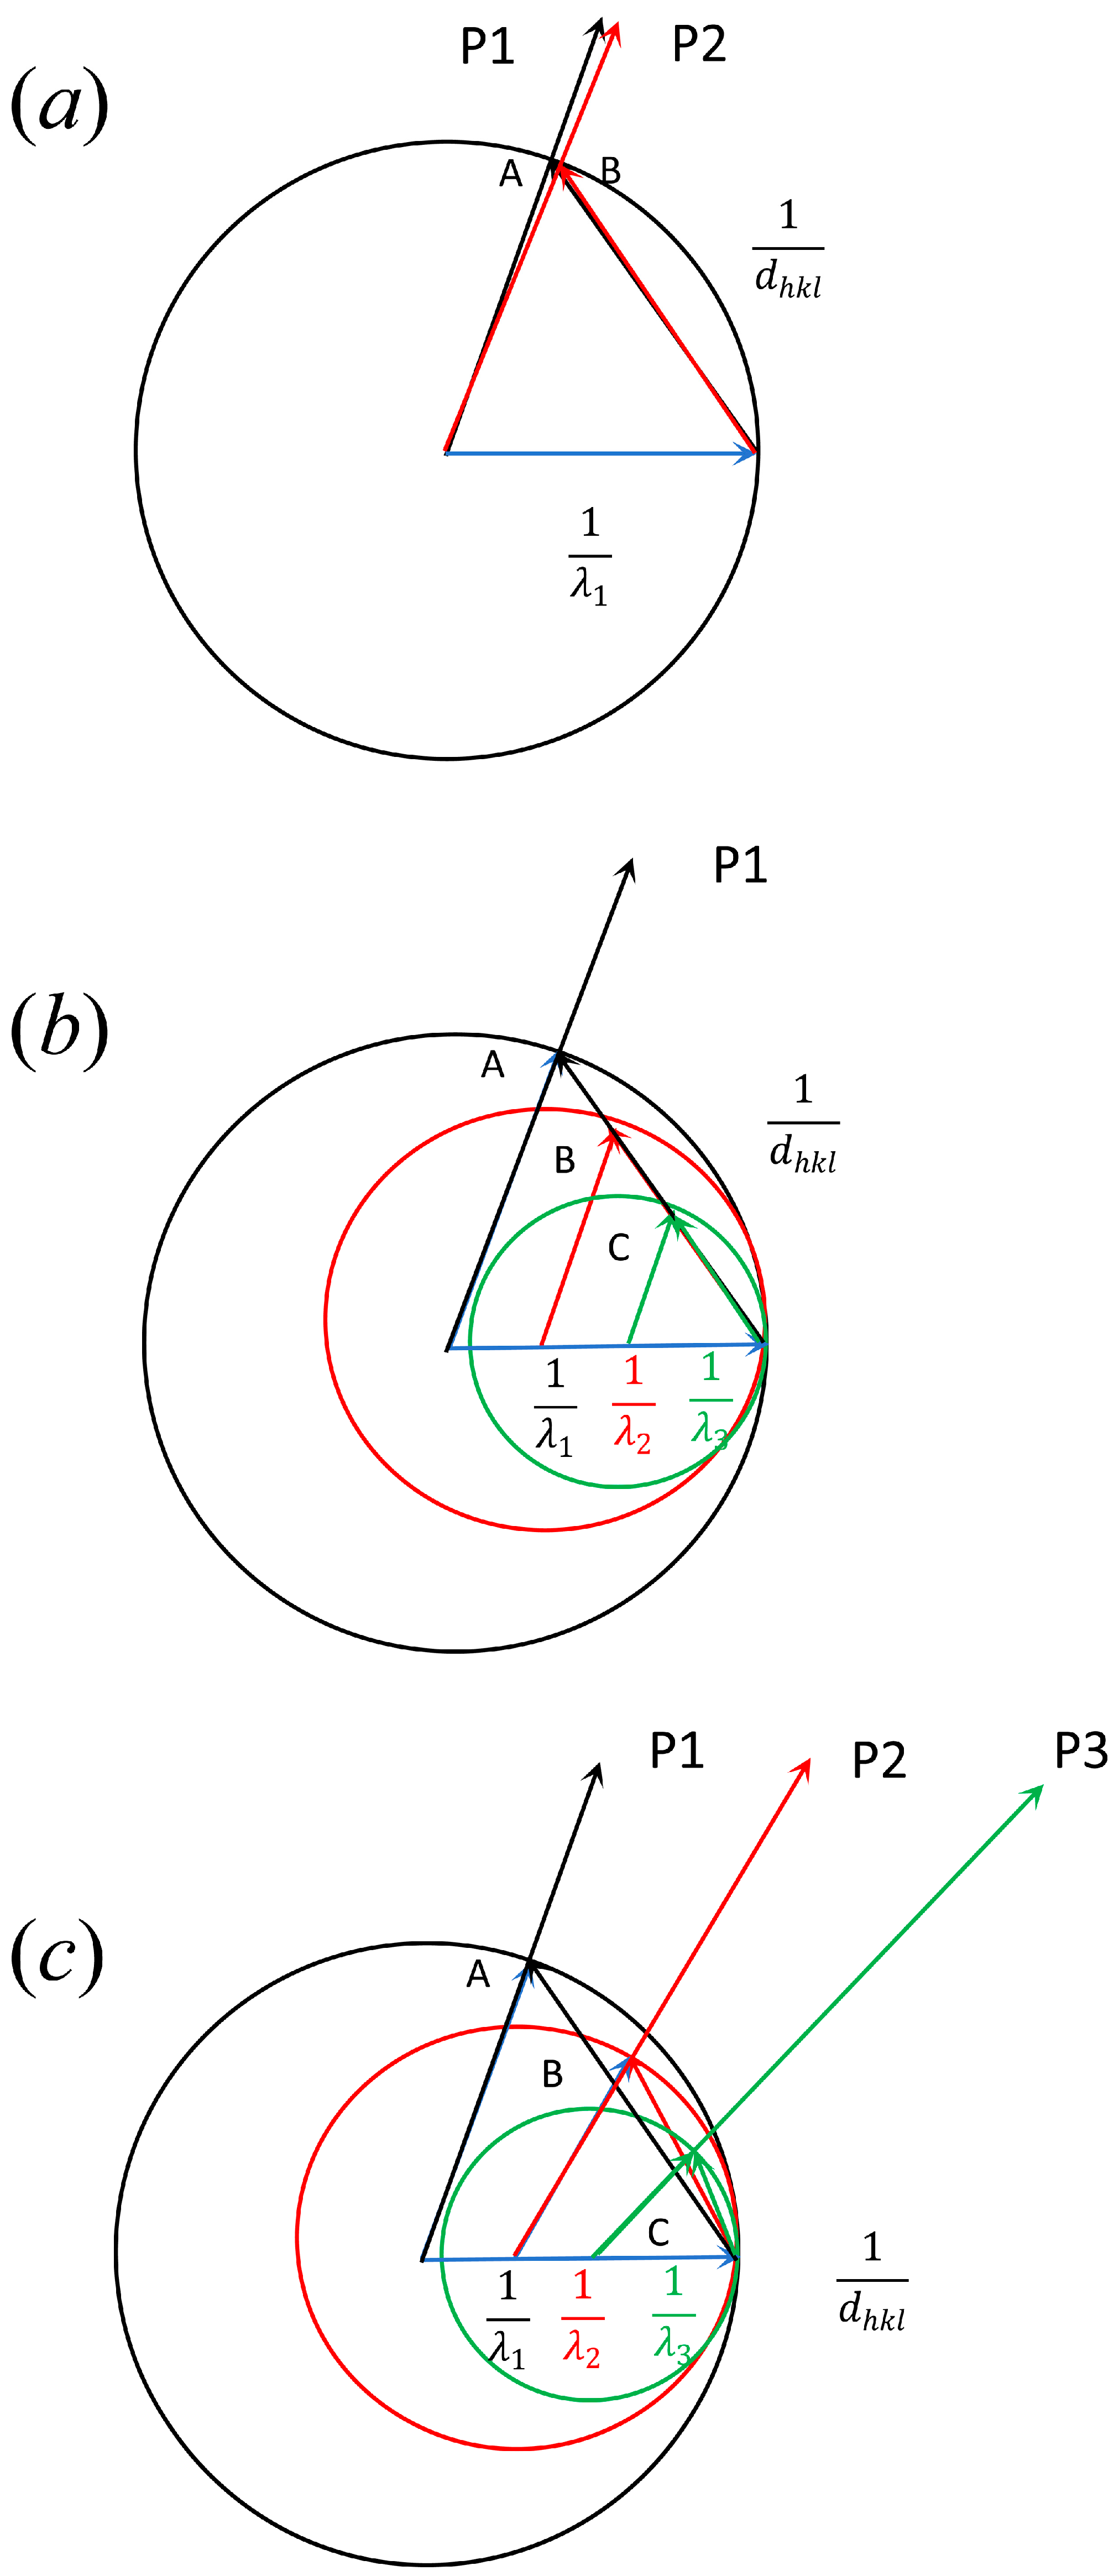
hklstrain using Laue diffraction for strain analysis. Figure 2 shows the difference between Laue diffraction and monochromatic diffraction in strain analysis. Laue diffraction uses a continuous X-ray spectrum, where each Laue spot corresponds to a different wavelength λ for a given hkl reflection.
Figure 2a illustrates diffraction spots drift with monochromatic X-ray diffraction. The sphere radius 1/λ1 is fixed in the Ewald sphere construction; Lattice strain causes the diffraction spot to drift from point A to point B. Using a single fixed wavelength λ, strain measurement is usually performed with the Williamson–Hall (W-H) method [43,44]; it calculates lattice spacing d changes from diffraction angle θ shifts for several spots. However, it requires flat sample surfaces, and strain mapping via θ–2θ scanning is an extremely time-consuming method to get strain mapping information. Figure 2b shows the same diffraction spot position using Laue diffraction; when the unit cell is scaled up or down proportionally, the interplanar spacing will correspondingly increase or decrease. The multiple spheres of radius 1/λ1, 1/λ2, 1/λ3 intersect the same reciprocal point during the lattice strain, so that all diffraction points hit on the same point P1; in this case, Laue diffraction can not be used for strain calculation. However, this kind of scale up or down for all a, b, and c axes should be avoided for the analysis in crystalline materials. Figure 2c shows different diffraction spot positions using Laue diffraction, when the unit cell is non-proportionally changed; the diffraction beam hits on different points P1, P2, and P3. In our work, only non-proportional scaling along the a, b, and c axes is considered, corresponding to elastic micro-strains.
In Laue diffraction, each diffraction spot generally corresponds to a distinct wavelength. To calculate micro-strains, once the wavelength of each spot is known, the associated interplanar spacing can be calculated using the Bragg equation. Nevertheless, measuring the energy of each diffraction spot remains practically difficult at present.
With the energy-dispersive detector, it would be possible to measure the spot energy of Laue diffraction, and then the strain of each diffraction spot can be determined. In BM32 beamline at ESRF, an energy-dispersive point detector (Rontec XFlash 1001, 10 mm2 area, Rontec, Berlin, Germany) was used for strain analysis [37]; subsequently, a two-dimensional energy-dispersive pnCCD detector was used to measure the spot energy for strain calculation [45], but the energy resolution was limited by the electronic noise and the Fano limit of silicon. The energy resolution is only about 136.5 eV at 8040 eV. Obviously, it is difficult to apply such an energy-dispersive detector in BL03HB beamline at SSRF. Therefore, a novel hklstrain algorithm was built for strain calculation at SSRF.
Our hklstrain algorithm calculates the theoretical dhkl information and actual lattice spacing dmes of each matched hkl by comparing the theoretical and measured positions of each diffraction spot. From a single Laue diffraction image, strain ε is determined as Equation (1):
= i = 1 N h k l , i / N = i = 1 N ( d mes , i     d hkl , i ) d hkl , i / N
where i is the i-th matched diffraction spot, and N is the total indexed spots in one Laue diffraction image; εhkl,i represents the micro-strain corresponding to the i-th hkl diffraction spot, and dhkl,i denotes the theoretical or unstrained interplanar spacing for the i-th hkl crystal plane. The unstrained lattice spacing dhkl,i for the diffraction spot is calculated according to its individual hkl Miller indices, based on the ideal lattice parameters of the material without internal strain. dmes,i is the experimentally measured interplanar spacing of the i-th hkl crystal plane. dhkl,i and dmes,i are determined using the hklstrain program.
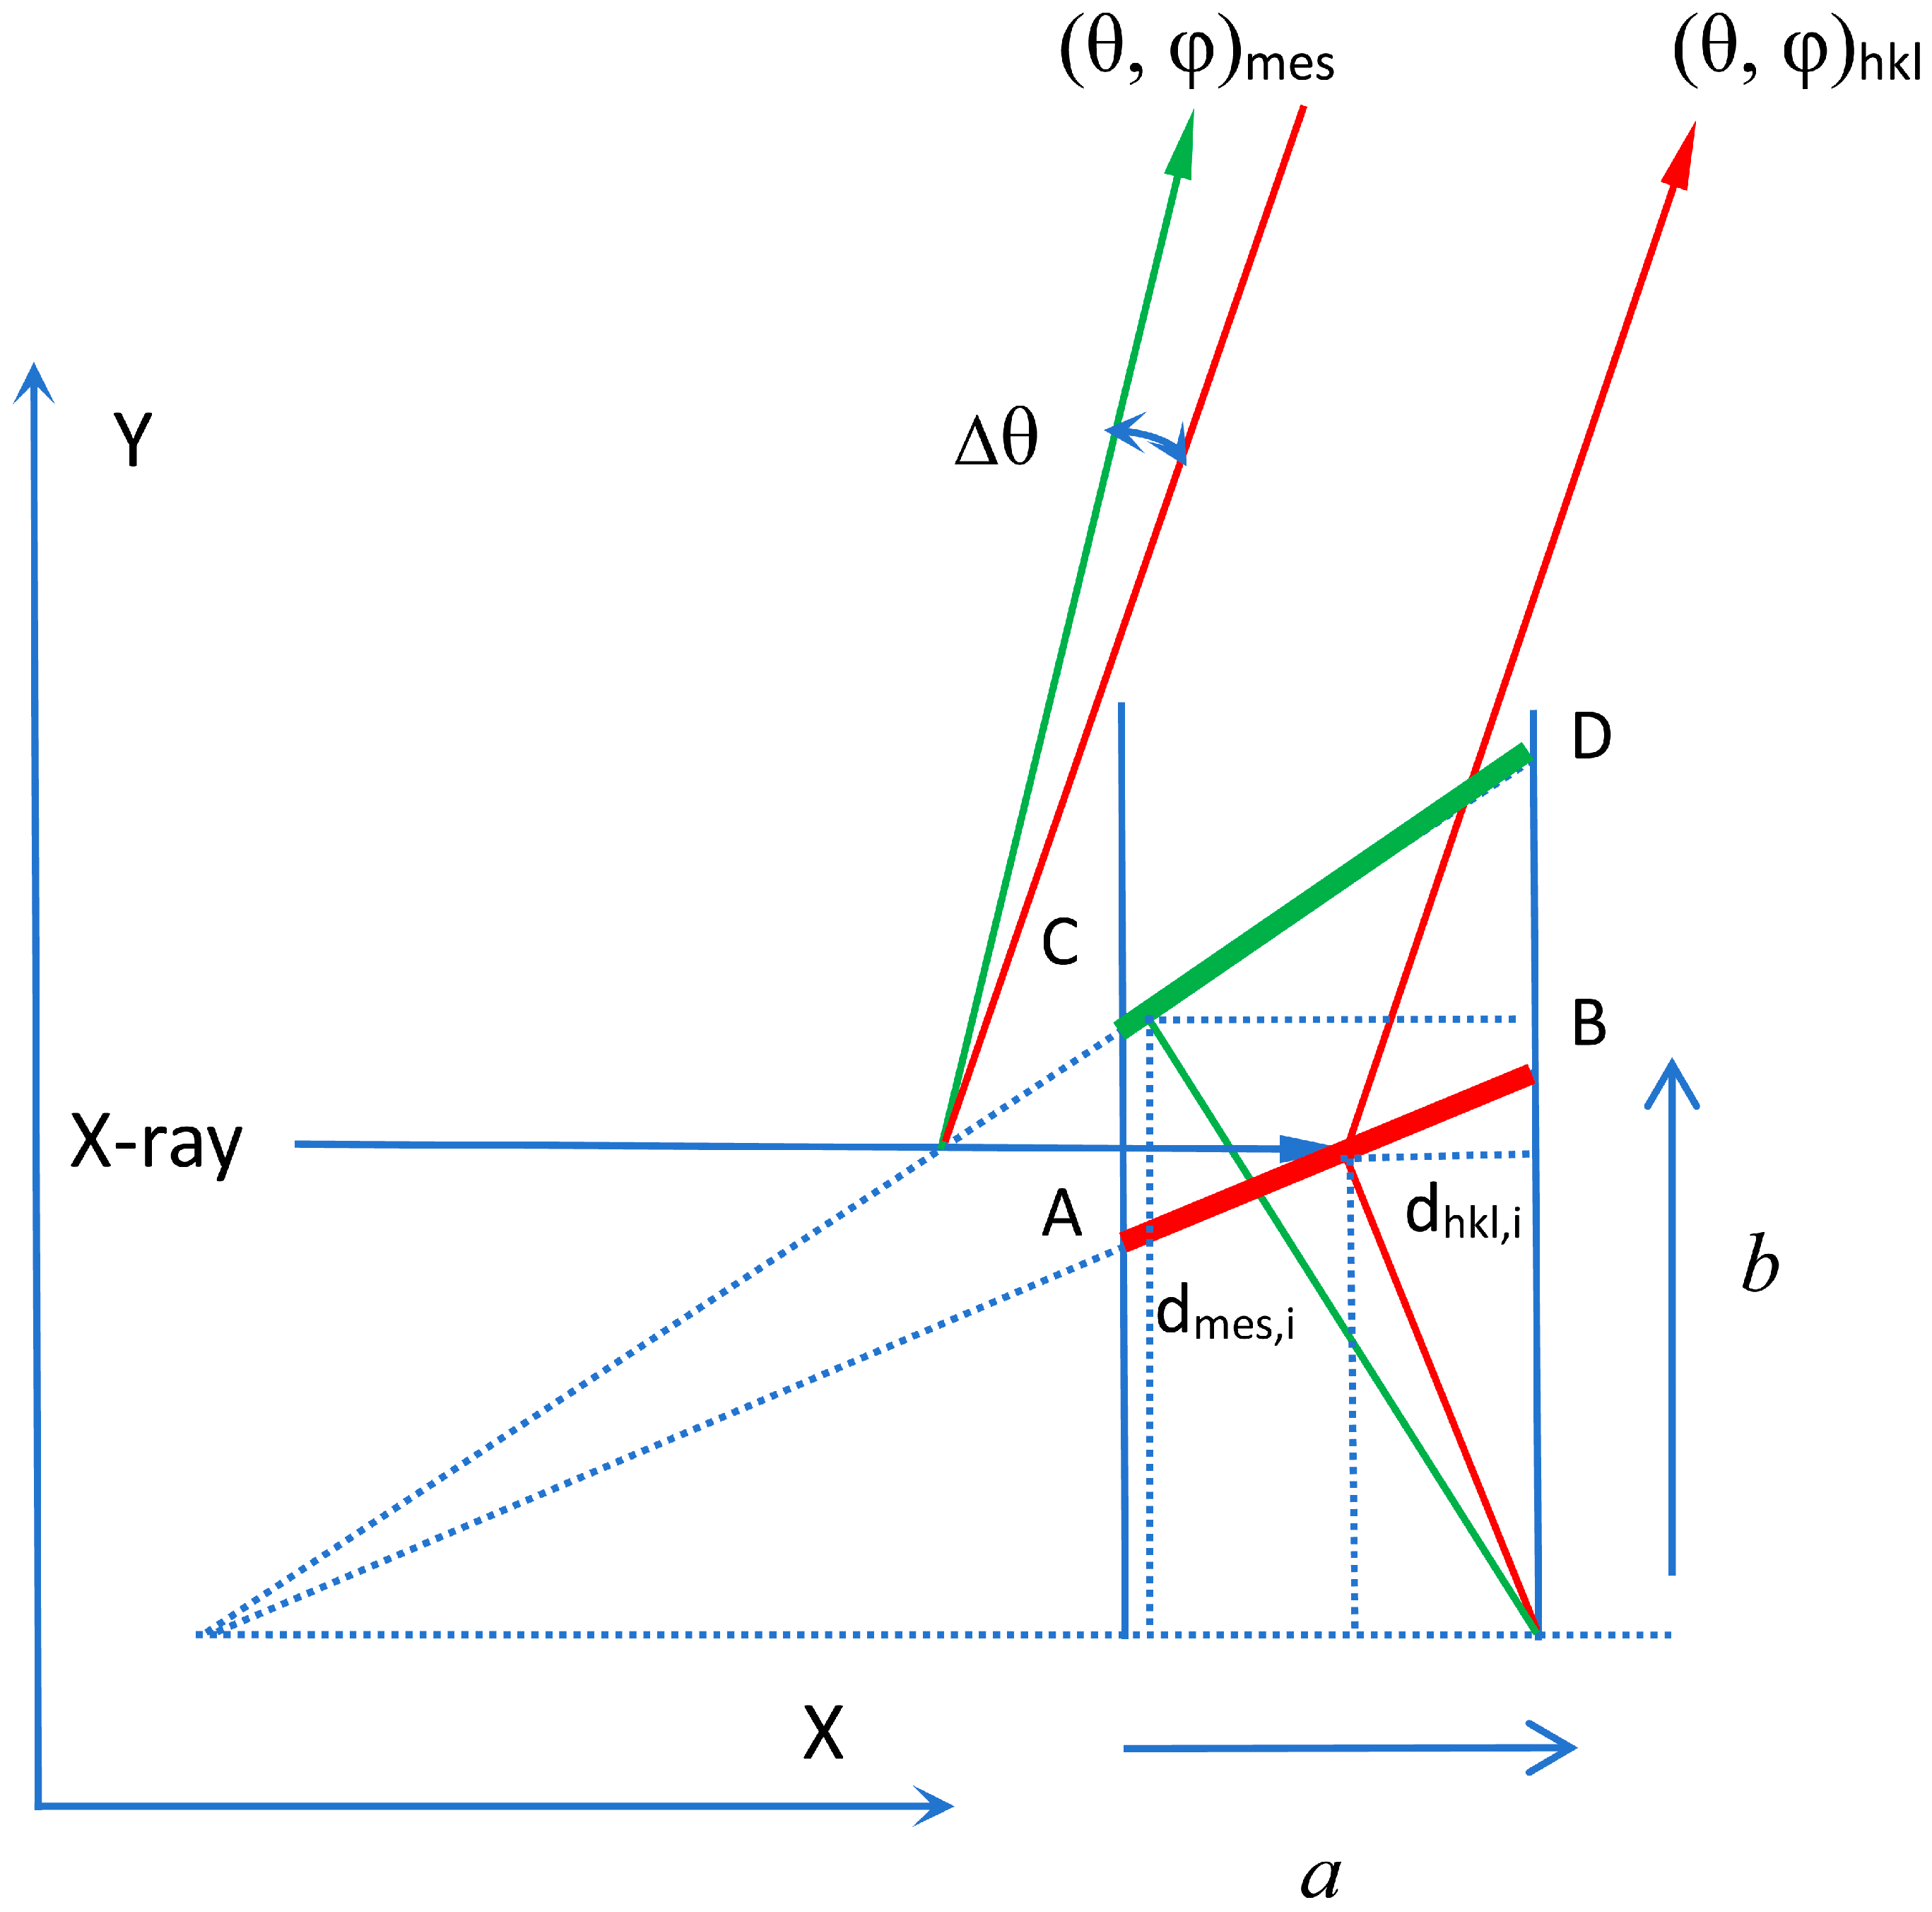
For dmes,i measurement, cell parameters a, b, c, α, β, and γ are considered as changing under the effect of tensile or compressive strain. For cubic, tetragonal, and orthorhombic crystal systems, the angles α, β, and γ remain constant to improve the accuracy. Cell volume is considered unchanged. The interplanar spacing dmes,i is projected onto the beamline XY coordinate system, as shown in Figure 3, which illustrates the geometric deviation between theoretical and strained crystal lattice planes in Laue diffraction. The horizontal incoming beam is represented by X-rays. Red line AB is the projection of the reference baseline for crystallographic plane reflection dhkl,i on the XY-oriented beamline coordinate, while the green line CD stands as a reference baseline for the projection of deformed interplanar spacing dmes,i after elastic lattice tension. The red arrow denotes the theoretical diffraction direction (θ, φ)hkl calculated from ideal lattice parameters, and the green arrow corresponds to the experimentally measured diffraction direction (θ, φ)mes acquired from recorded diffraction spots. The angular Δθ means discrepancy between these two outgoing beams originates from the ideal dhkl,i to measured dmes,i. Cell parameters (a,b) are marked in Figure 3. Correspondingly, Δφ can also be plotted in the YZ beamline coordinate system.
The theoretical diffraction direction (θ, φ)hkl is obtained according to the indexed results, and (θ, φ)hkl is satisfied for the Bragg equation with the wavelength (λ). Here, (θ, φ)mes is considered as X-ray reflection corresponding to (θ, φ)hkl because such reflection is always satisfied in a small range of Δθ and Δφ with a broad-band (wavelength 0.4–2.0 Å) Laue beam. Therefore, (θ, φ)mes is used to fit dmes,i according to the X-ray reflection mechanism (provided in the calc_dvecthetaphi.m file of source code in the Supplementary File), with constraints on the unit-cell volume and the ranges of unit-cell parameters a, b, c, α, β, and γ.
Therefore, dmes,i can be calculated with the numerical optimization algorithms as Equation (2), subject to variation of global unit-cell parameters.
d mes , i   = f   ( a ,   b ,   c ,   α ,   β ,   γ ,   PhiX ,   PhiY ,   PhiZ ,   Δ θ ,   Δ φ )
By substituting the measured and theoretical interplanar spacing into Equation (1), the local strain ε associated with each individual Laue diffraction image can be quantitatively obtained. Total residual RMS( Δ θ ,   Δ φ ) as output from numerical optimization is used to evaluate the fitting performance of Equation (2).

2.2. Micro-Strain Calculation Using Hklstrain

To analyze the micro-orientation in real space, unit normal vector n ^ of the crystal plane (hkl) can be decomposed and expressed as Equation (3),
n ^ = n x n y n z
The strain tensor for each reflection spot can be decomposed into the normal strain components in real space as described by Ortner [46]. Here, εhkl,i is decomposed into εxx, εyy and εzz for each spot, as Equation (4),
ε h kl , i = n ^ T · ε xx ε xy ε xz ε xy ε yy ε yz ε xz ε yz ε zz · n ^
and then decomposed micro-strain components εxx, εyy and εzz can be calculated using the least-squares algorithm for each diffraction image with reflection spots i > 5, and results are expressed as following Equations (5) and (6),
ε xx ε yy ε zz ε xy ε xz ε yz = N hkl , i T N hkl , i 1 N hkl , i T ε hkl , i
where,
N hkl , i = n x 2 n y 2 n z 2 2 n x n y 2 n x n z 2 n y n z
Therefore, micro-strain components εxx, εyy, and εzz are obtained in real space. Notably, for orthorhombic crystal systems, the normal strain components εxx, εyy, and εzz directly represent the tensile or compressive normal strains along the three principal crystallographic directions [100], [010], and [001] in real space, respectively.

2.3. Orientation Classification

From Equation (2), strain calculation is orientation-dependent. However, PhiX, PhiY, and PhiZ are only three Euler angles and cannot fully represent crystal orientation in real space.
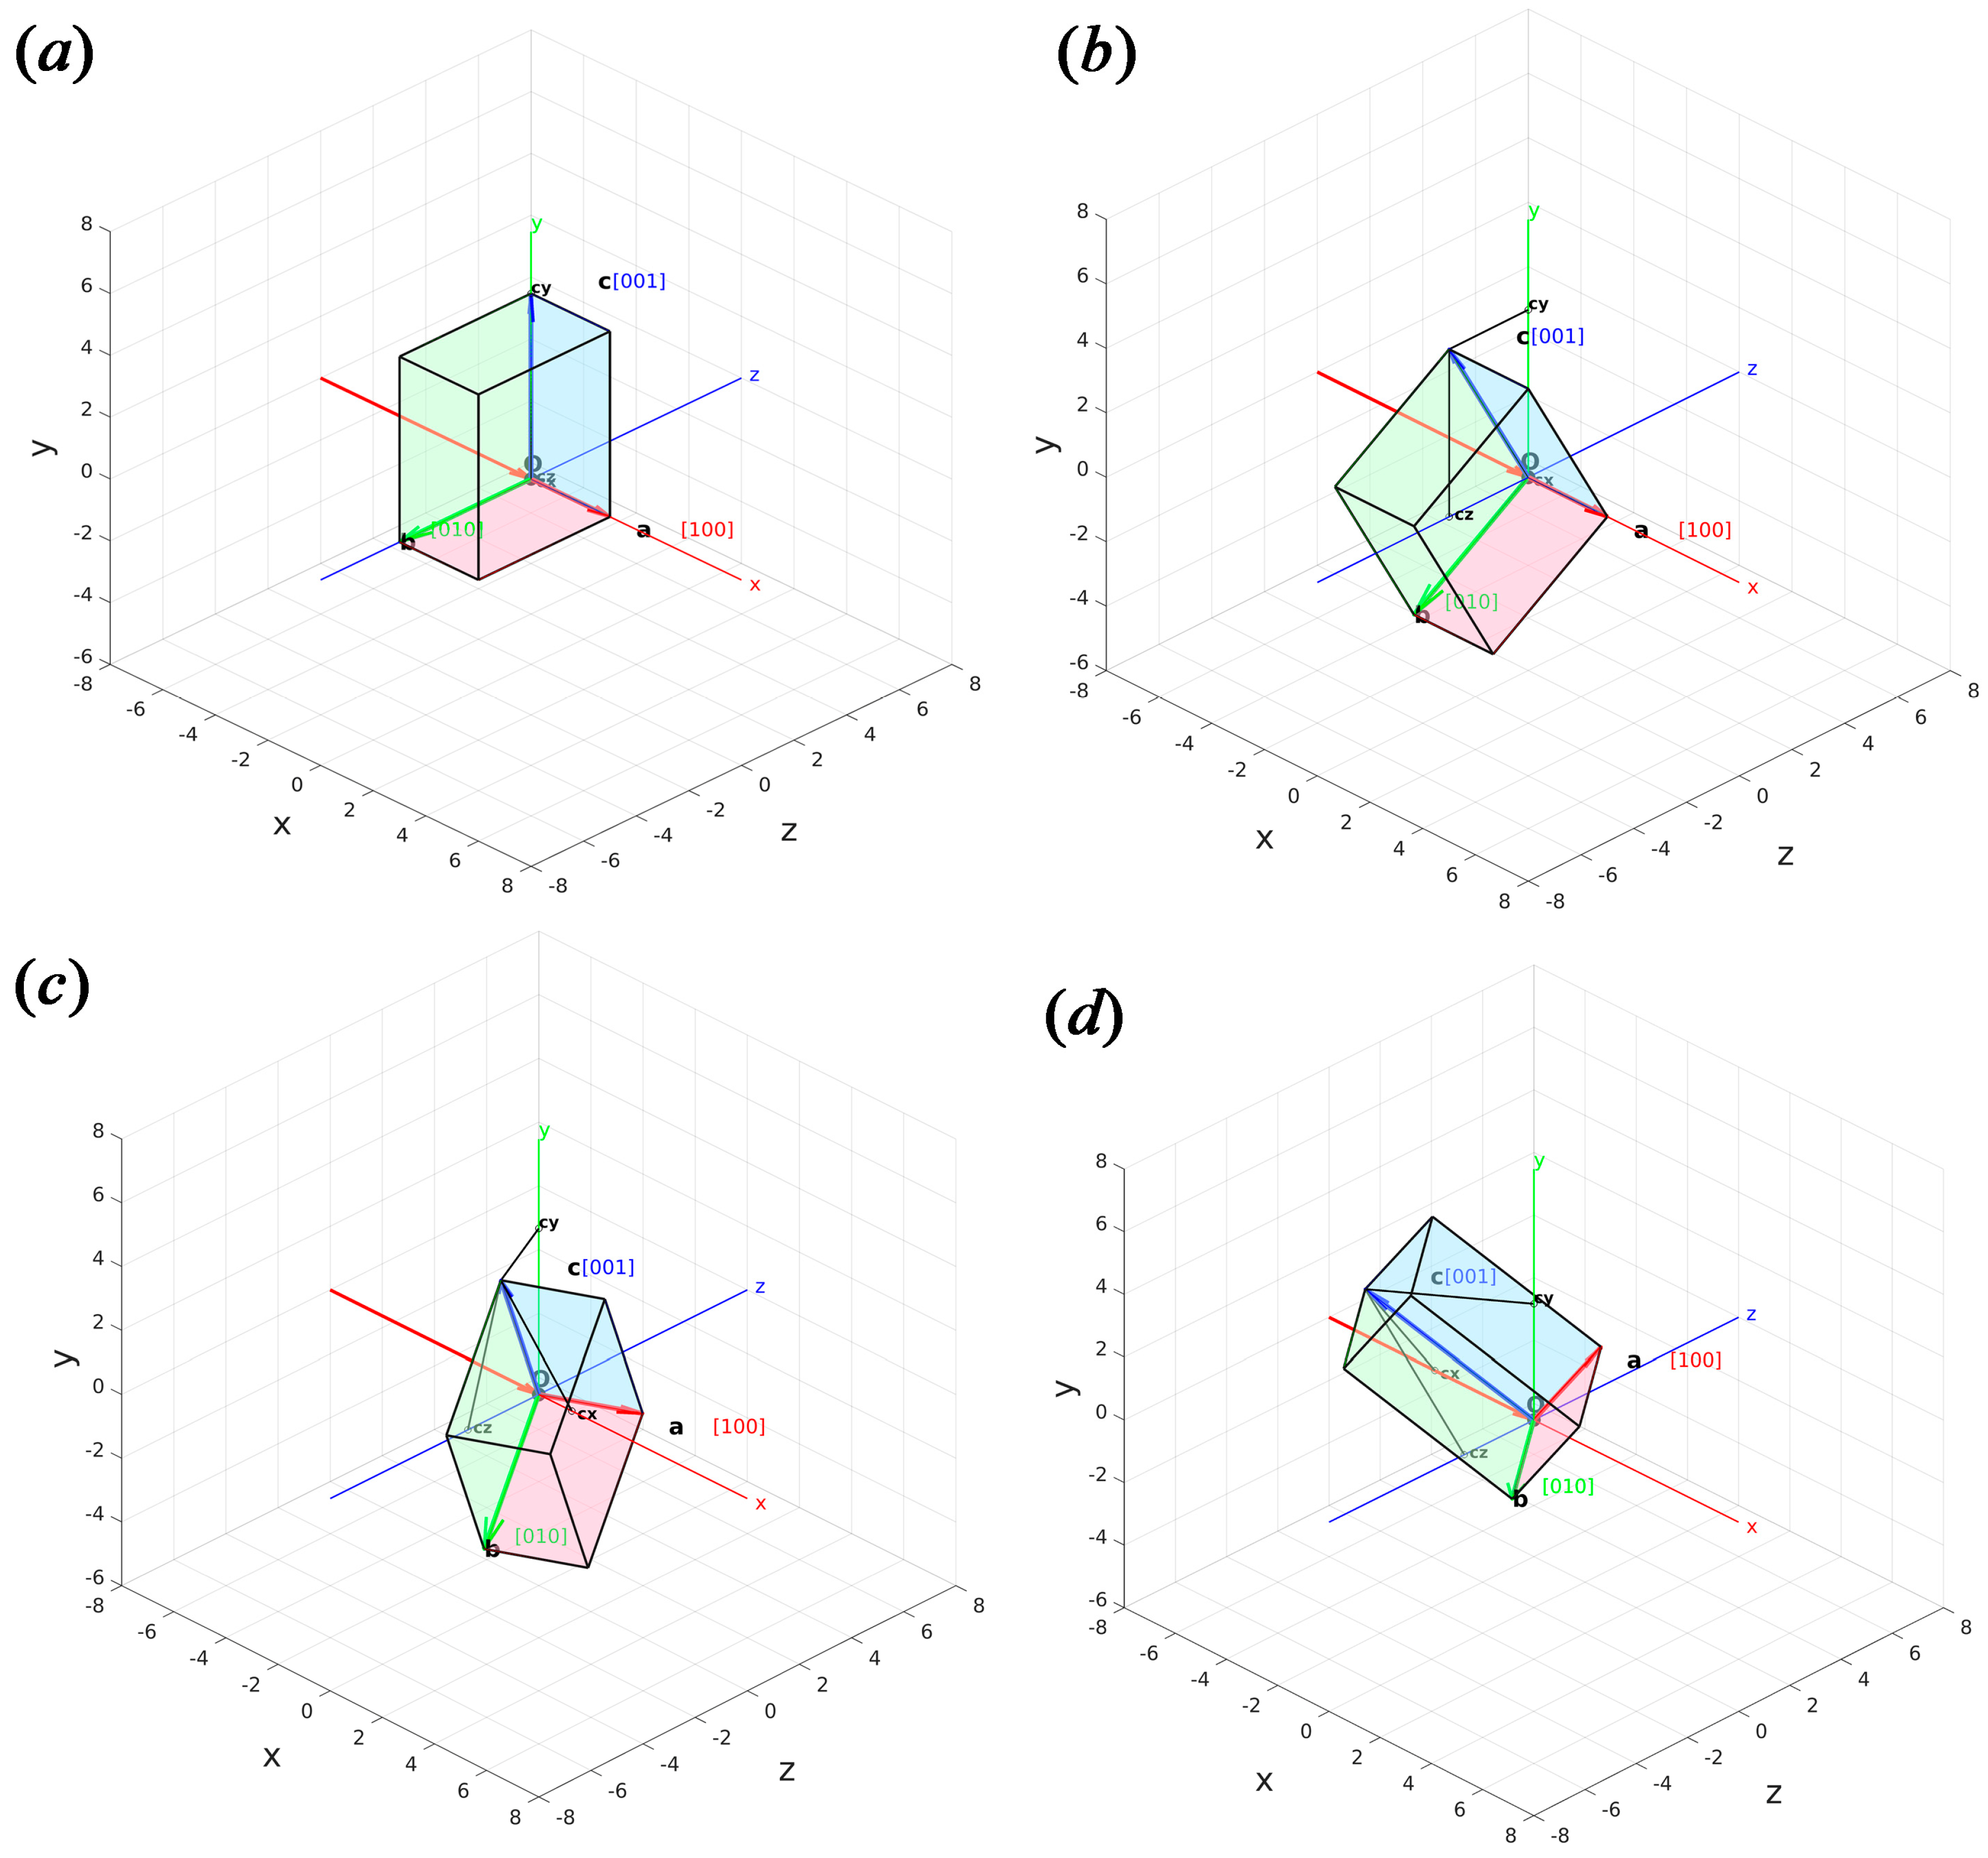
An orientation representation method is proposed for accurate orientation characterization. Figure 4 shows 3D diagrams of an orthorhombic crystal lattice around the beamline coordinate system with X-Y-Z Euler angle rotation in the beamline coordinate. In Figure 4a, the crystal is in its reference state. Figure 4b shows the first rotation step, a counterclockwise rotation (PhiX) around the fixed X-axis. Figure 4c shows the second rotation, a rotation (PhiY) around the fixed Y-axis. Figure 4d presents the final step, a rotation (PhiZ) around the Z-axis.
Our orientation is represented by the interplanar spacing vector after rotation by different rotation angles in real space. It is expressed as Equations (7)–(9),
ORI = [ R ] · d hkl · n ^
n ^ =   n hkl / n hkl
n hkl =   [ A ] T · h k l
where n ^ and n hkl are the unit normal vector and normal vector of the crystal plane (hkl), respectively. d hkl is the interplanar spacing, matrix [A] is a 3 × 3 matrix whose columns represent the direct lattice basis vectors a, b, c in Cartesian coordinates xyz, and [A] is expressed as Equation (10),
[ A ] = a x b x c x a y b y c y a z b z c z
And rotation matrix [R] is used to match the orientation of the actual crystal in the beam position; [R] is expressed as Equation (11),
[ R ] = [ R P h iZ ] · [ R P h iY ] · [ R P h iX ]
with the rotation sequence following the X-Y-Z convention under a right-handed Cartesian coordinate system in the BL03HB beamline at SSRF, and [RPhiX], [RPhiY], and [RPhiZ] are expressed as Equations (12)–(14),
[ R PhiX ] = 1 0 0 0 cos ( ϕ x ) sin ( ϕ x ) 0 sin ( ϕ x ) cos ( ϕ x )
[ R P h iY ] = cos ( ϕ y ) 0 sin ( ϕ y ) 0 1 0 sin ( ϕ y ) 0 cos ( ϕ y )
[ R P h iZ ] = cos ( ϕ z ) sin ( ϕ z ) 0 sin ( ϕ z ) cos ( ϕ z ) 0 0 0 1
PhiX (ϕx), PhiY (ϕy) and PhiZ (ϕz) are the rotation of crystal around the X-, Y-, and Z-axes in reciprocal space, respectively.
ORI [100], ORI [010] and ORI [001] as determined by Equation (7) correspond to the three crystal axes of the crystal, and each of them independently reflects the orientation information of a single crystal axis in the beamline coordinate system.
The orientations of ORI [100], ORI [010], and ORI [001] are classified into different groups with the K-means clustering algorithm, followed by cluster visualization. K-means clustering exhibits outstanding adaptability and efficiency in feature classification [47], making it highly suitable for the automatic grouping of data. Here, the K-means clustering algorithm is adopted to ensure the accuracy and stability of orientation data classification. After the classification is completed, a color mapping scheme is generated to automatically assign an identifiable color to each category. This visual coding method effectively transforms classification results into intuitive graphical representations, allowing researchers to directly observe the classification of orientation data in real space.

3. Application Example

An orthorhombic crystal LaAlO3 (100) is used as a testing example; the unit-cell parameters are used as reported by Hatt [48]. Laue diffraction was used to quantitatively characterize the crystallographic micro-orientation and micro-strain of single-crystal (100) LaAlO3 (Single Crystal Material Inc., Hefei, China). Experiments were carried out in the Laue crystallography beamline BL03HB [49,50]. For crystallographic orientation determination and quantitative strain analysis, conventional two-dimensional area scanning under the fixed geometric angle configuration serves as the sole testing method, with the exposure time as 0.2 s per step. The scan area was 2.8 mm × 2.8 mm from the crystal sample. A standard area detector, Pilatus 2M (Dectrics Inc., Baden, Switzerland), and a five-dimensional sample stage (Kohzu Inc., Kawasaki-shi, Japan) were used with fixed angles set for routine testing. The testing samples were mounted at a 45° angle to the incident X-ray beam, and the area detector was placed perpendicular to the incident X-ray beam, forming a 90° angle with the X-ray path. The sample stage was adjusted carefully to maintain the preset 45° angle between the sample surface and incident X-rays, which guarantees the repeatability and accuracy of subsequent 2D scanning and data analysis.
To compare the performance of hklstrain with other software packages, a nickel-based single-crystal superalloy blade (produced by the Beijing Institute of Aeronautical Materials) and a MgO single crystal (Single Crystal Material Inc., Hefei, China) were used.
The raw Laue diffraction pattern is processed using Laueprocess 3.9 software to extract key information, including measured diffraction spot positions, theoretical spot positions, integrated intensity, Miller indices of spots, and PhiX, PhiY, and PhiZ angles for orientation-dependent micro-strain analysis.

4. Results and Discussion

4.1. Miller Indices Assignment and Validation

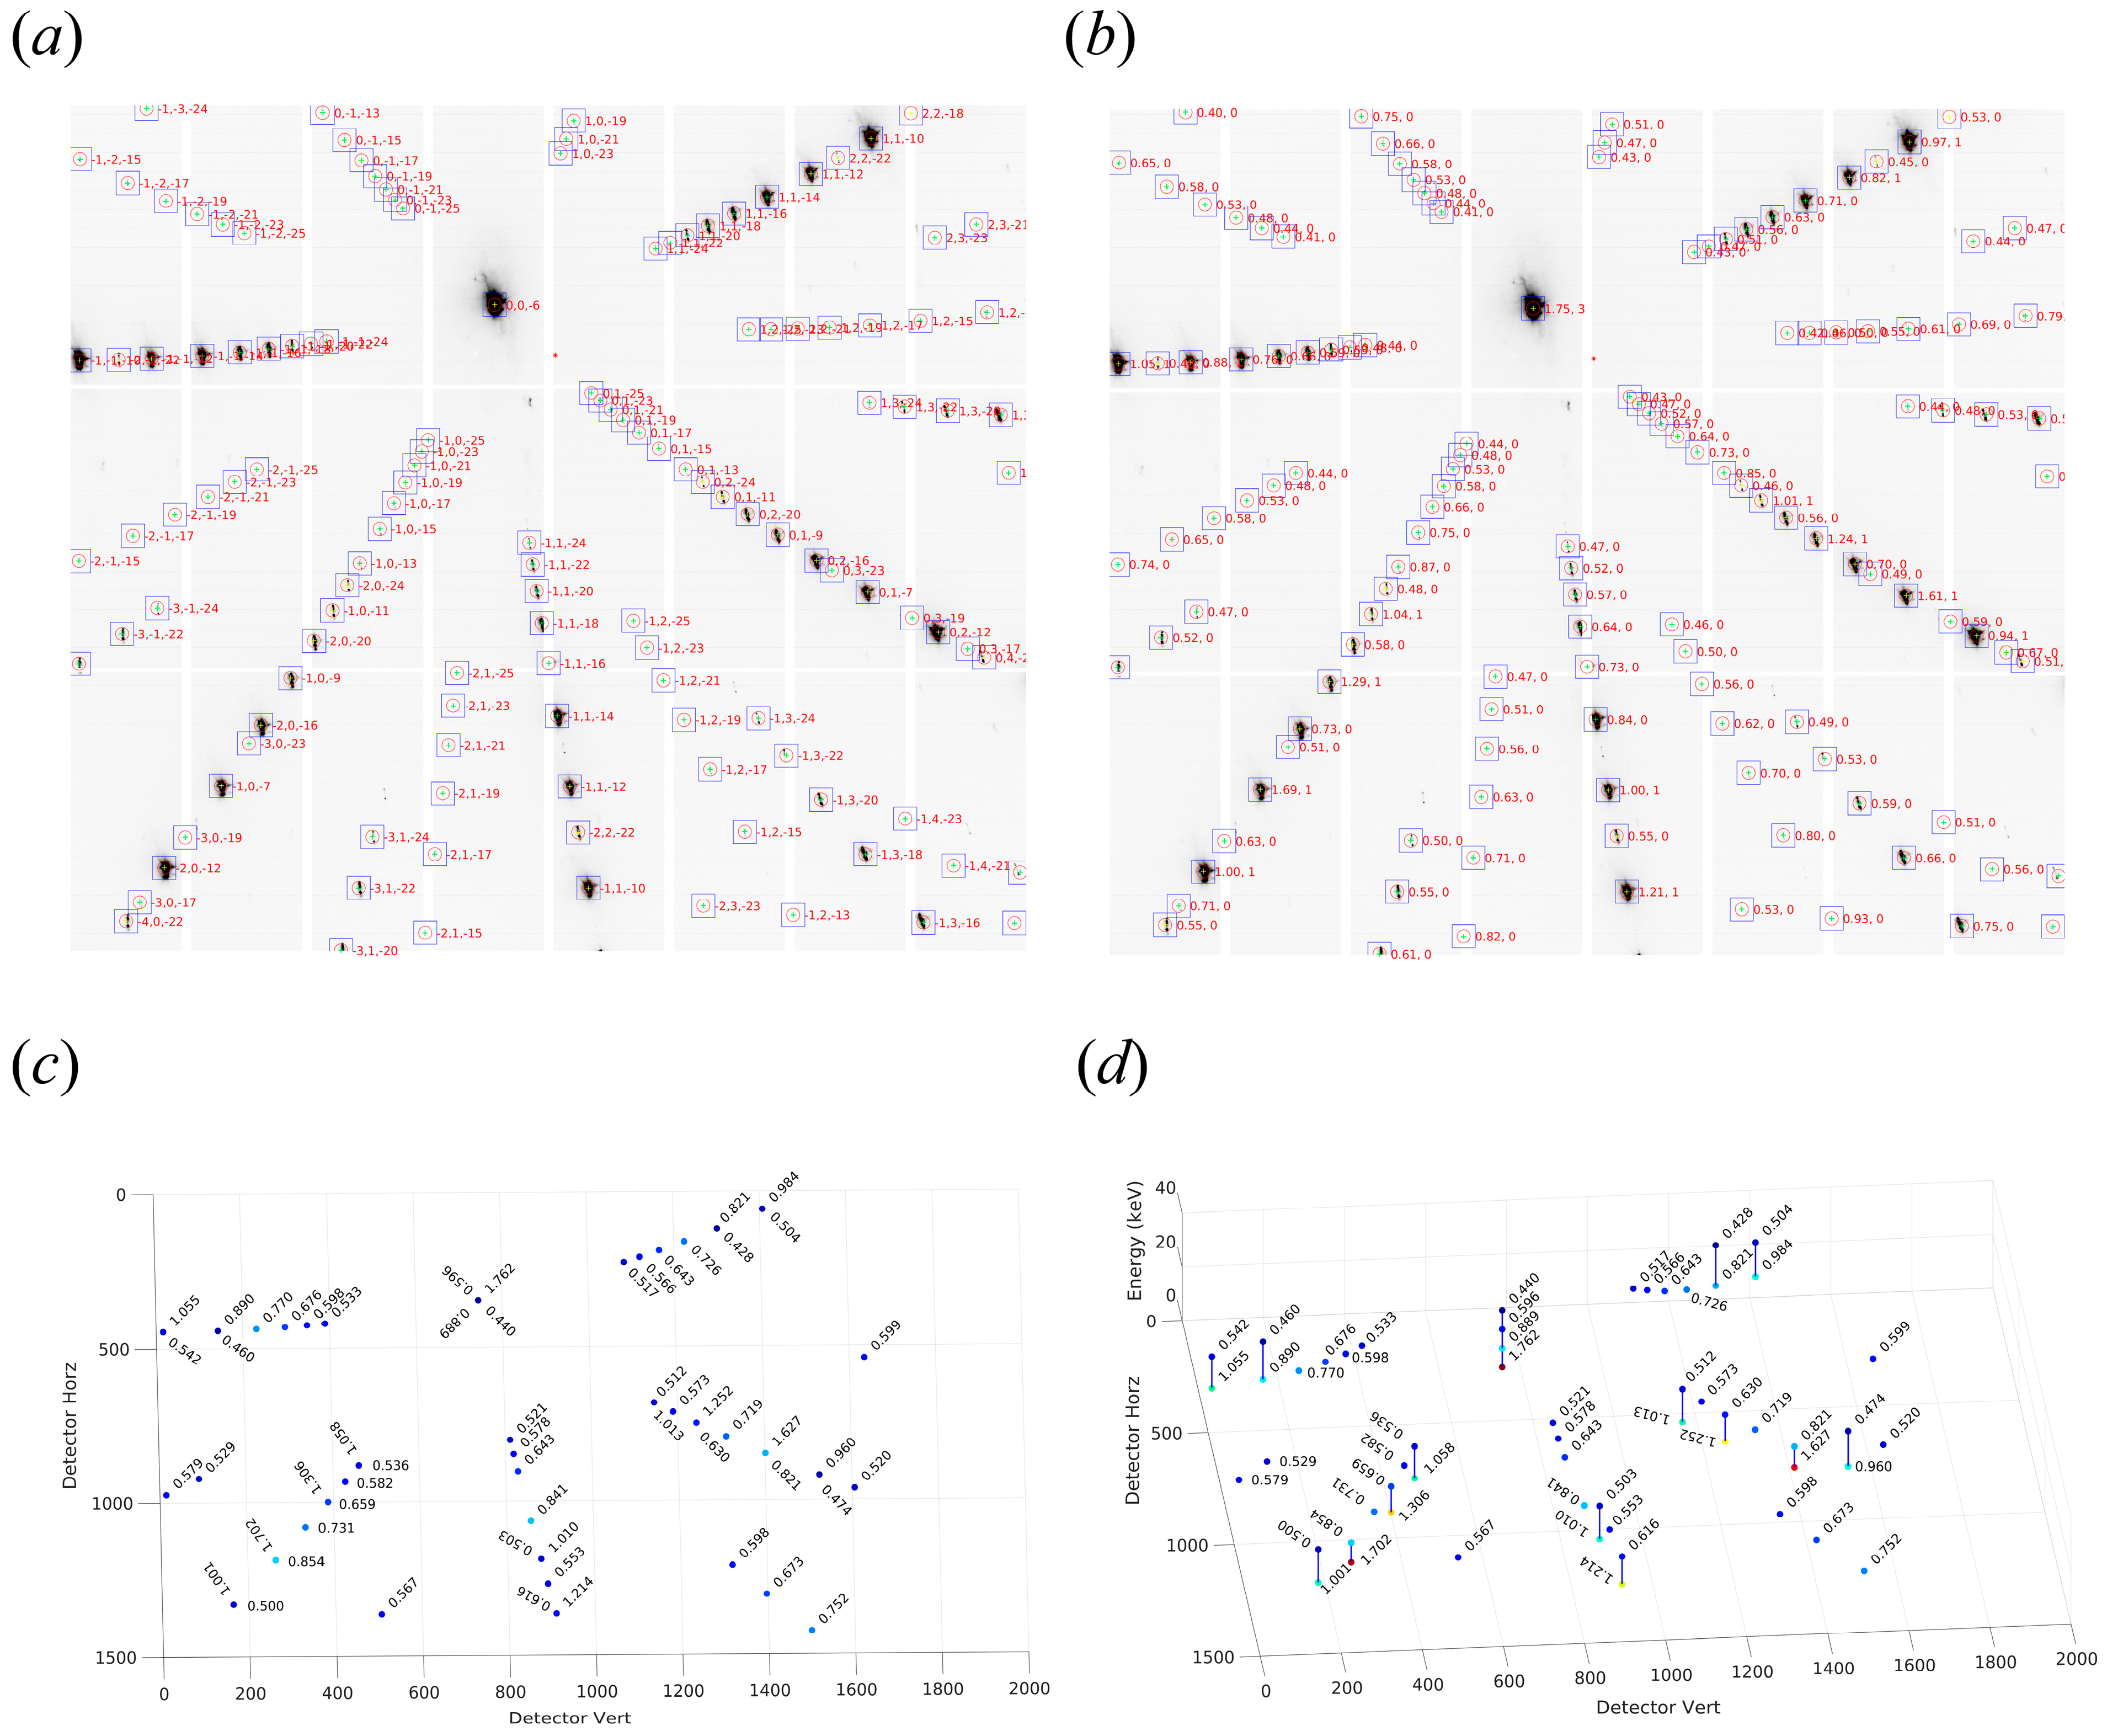
After the single-crystal LaAlO3 (100) was mounted on the sample stage, Laue diffraction experiments were performed using a white beam at the BL03HB Laue crystallography beamline of SSRF. The diffraction pattern exhibits typical Laue diffraction characteristics. The diffraction information for each spot was precisely calculated. Figure 5 presents the complete indexing results of a typical Laue diffraction pattern collected from a (100)-oriented LaAlO3 single crystal, with crystallographic parameters as a 5.36 Å, b 5.37 Å, c 7.56 Å, α 90.0°, β 90.0°, γ 90.0°, and space group No. 74 (Imma). Figure 5a shows the Miller indices (hkl) assignment for all diffraction spots. Each diffraction spot is labeled with its corresponding crystallographic plane.
Figure 5b displays the assignment of X-ray wavelength and Harmonic order indices for each diffraction spot. Figure 5a,b clearly analyze all identifiable diffraction spots, each of which has been accurately indexed and labeled with its corresponding Miller indices (hkl), the specific incident X-ray wavelength, and the Harmonic order indices of each spot, thus providing reliable data for micro-strain analysis.
The theoretical wavelength assignment using hklstrain for each spot was experimentally verified with energy scanning, through the four-crystal monochromator, which was adjusted by systematically varying the angular settings of the channel-cut Si (111) crystals at BL03HB beamline [42,49]; a series of 2500 diffraction images were collected under different wavelengths (between 5 keV and 30 keV, with an energy step of 0.01 keV, resulting in 2500 frames in total). The center wavelength of each spot was determined, as shown in Figure 5c,d. The wavelengths obtained from energy scanning are compared with the theoretical wavelength assignment in Figure 5b from hklstrain. Consistent agreement between Figure 5b,c can be observed; Figure 5d shows the wavelength distribution of high-order harmonics. Our results confirm the theoretical wavelength for all diffraction spots. This procedure is critical not only for validating the theoretical framework of Laue crystallography methodology but also for ensuring accuracy of Miller indices assignments.

4.2. Orientation Classification

PhiX, PhiY, and PhiZ Euler angles, which define sequential rotations around the X-, Y-, and Z-axes of the beamline coordinate system, are unable to truly reflect the specific orientation of crystal axes a, b, and c in real space. The reason lies in their indirect parameterization of spatial orientation rather than a direct description of the axis’ position relative to the beamline coordinate frame system. Using Equation (7), orientation map is plotted and classified with a K-means clustering algorithm (with the number of clusters selected as four, and yielding stable classification across repeated independent runs).
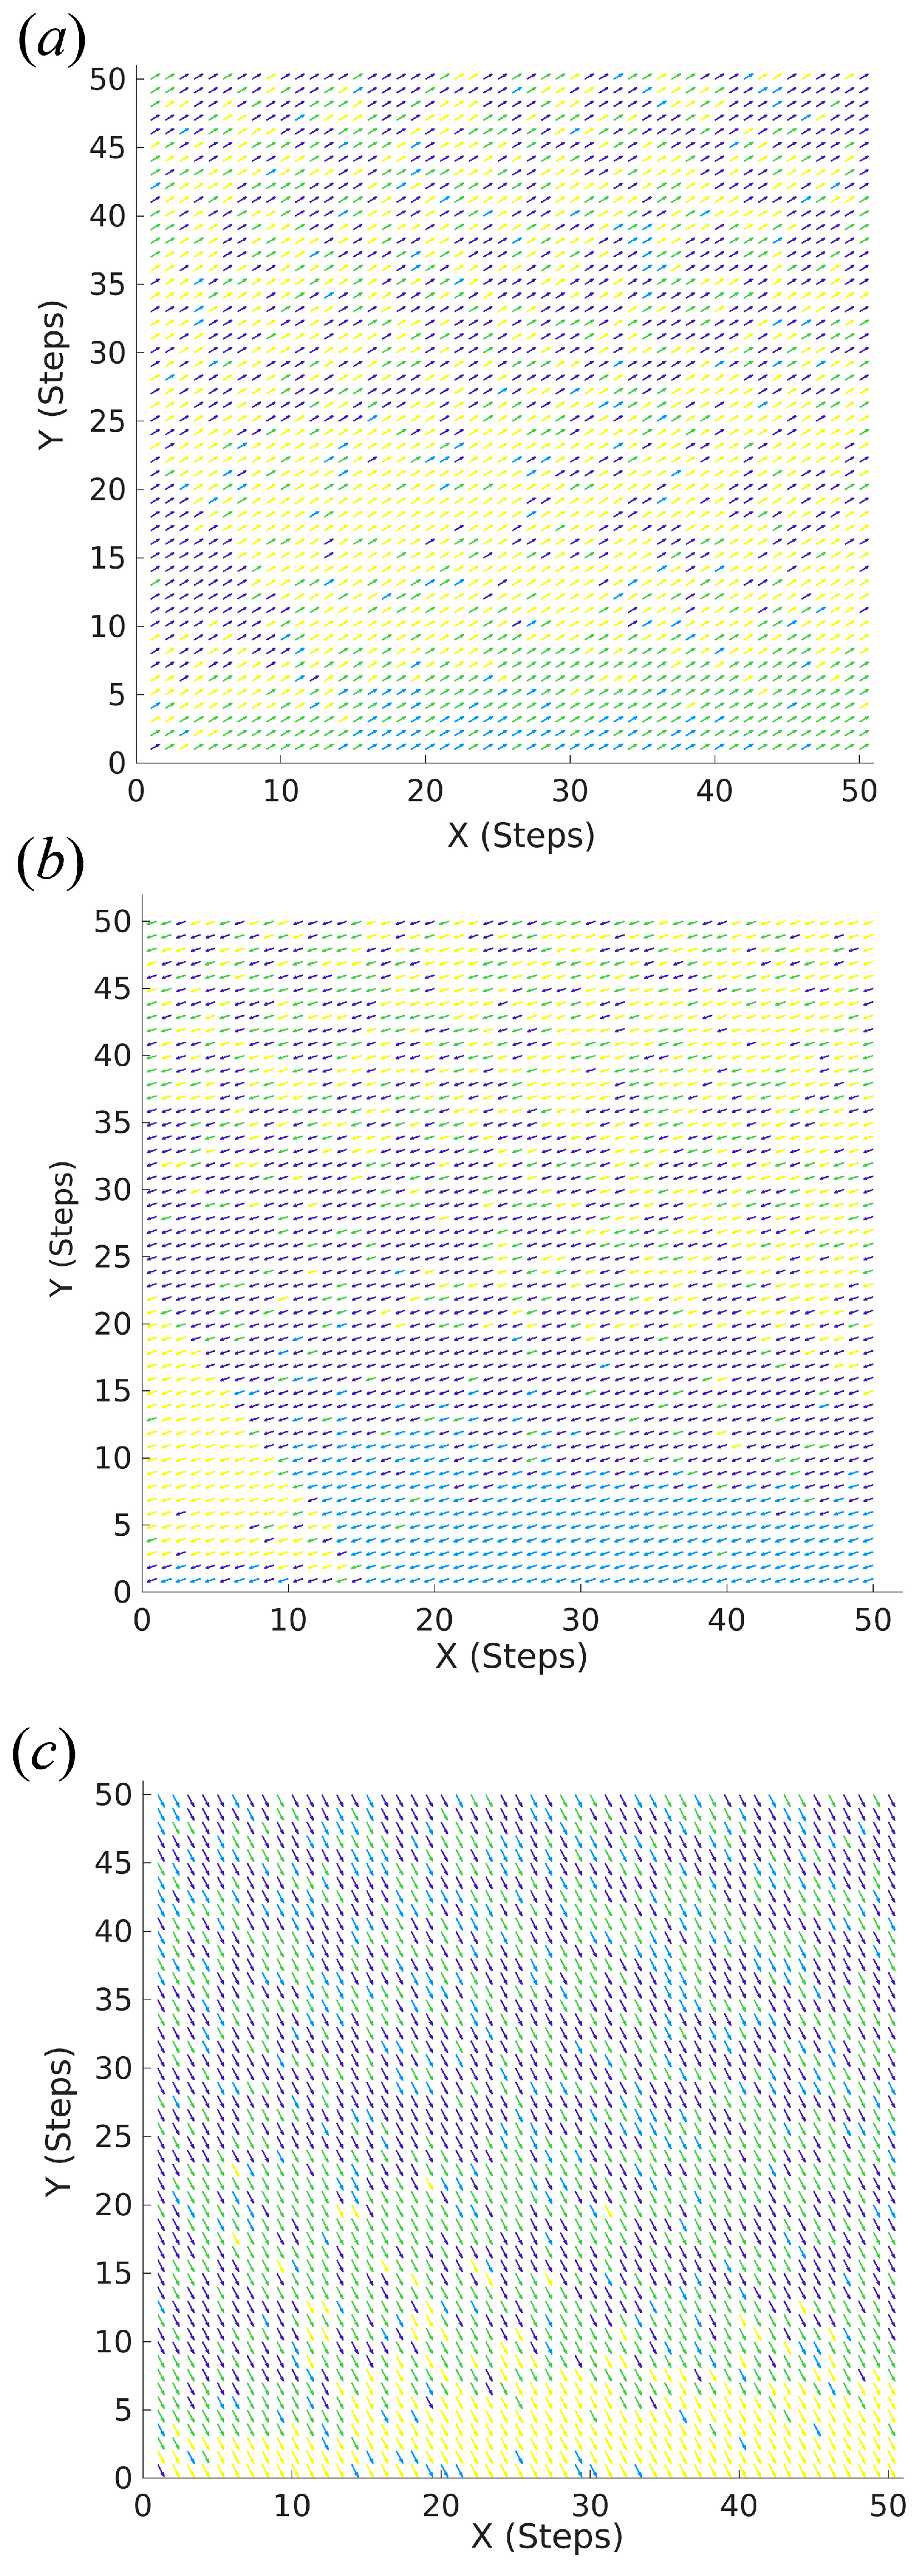
Figure 6 exhibits the three-dimensional orientation distribution maps. These orientation maps intuitively reflect the spatial orientation distribution characteristics of the LaAlO3 (100) single crystal, revealing the micro-orientation differences of the crystal sample.
Figure 6a displays the [100] orientation factor ORI [100] distribution, where the magnitude and direction of the arrow bar show the crystallographic axis orientation in the mapping. The color gradient reveals distinct clustering microstructural domains; regions of orientation are clustered in the central and the lower-left and lower-edge regions, indicating localized texture gradients and potential strain effects.
Figure 6b illustrates the [010] orientation factor ORI [010] distribution, which displays a clear gradient. The orientation variation is observed in the lower-left corner. This gradient indicates a directional variation in the [010] axis alignment, likely induced by processing conditions such as mechanical deformation. This confirms that the overall spatial heterogeneity is primarily presented by the [010] orientation variation.
Figure 6c shows the [001] orientation distribution ORI [001], which exhibits a nearly uniform, homogeneous pattern across most of sample’s area, demonstrating that the [001] crystallographic direction remains nearly constant throughout the mapped region, with minimal spatial fluctuation, suggesting low strain along this axis.

4.3. Micro-Strain Analysis

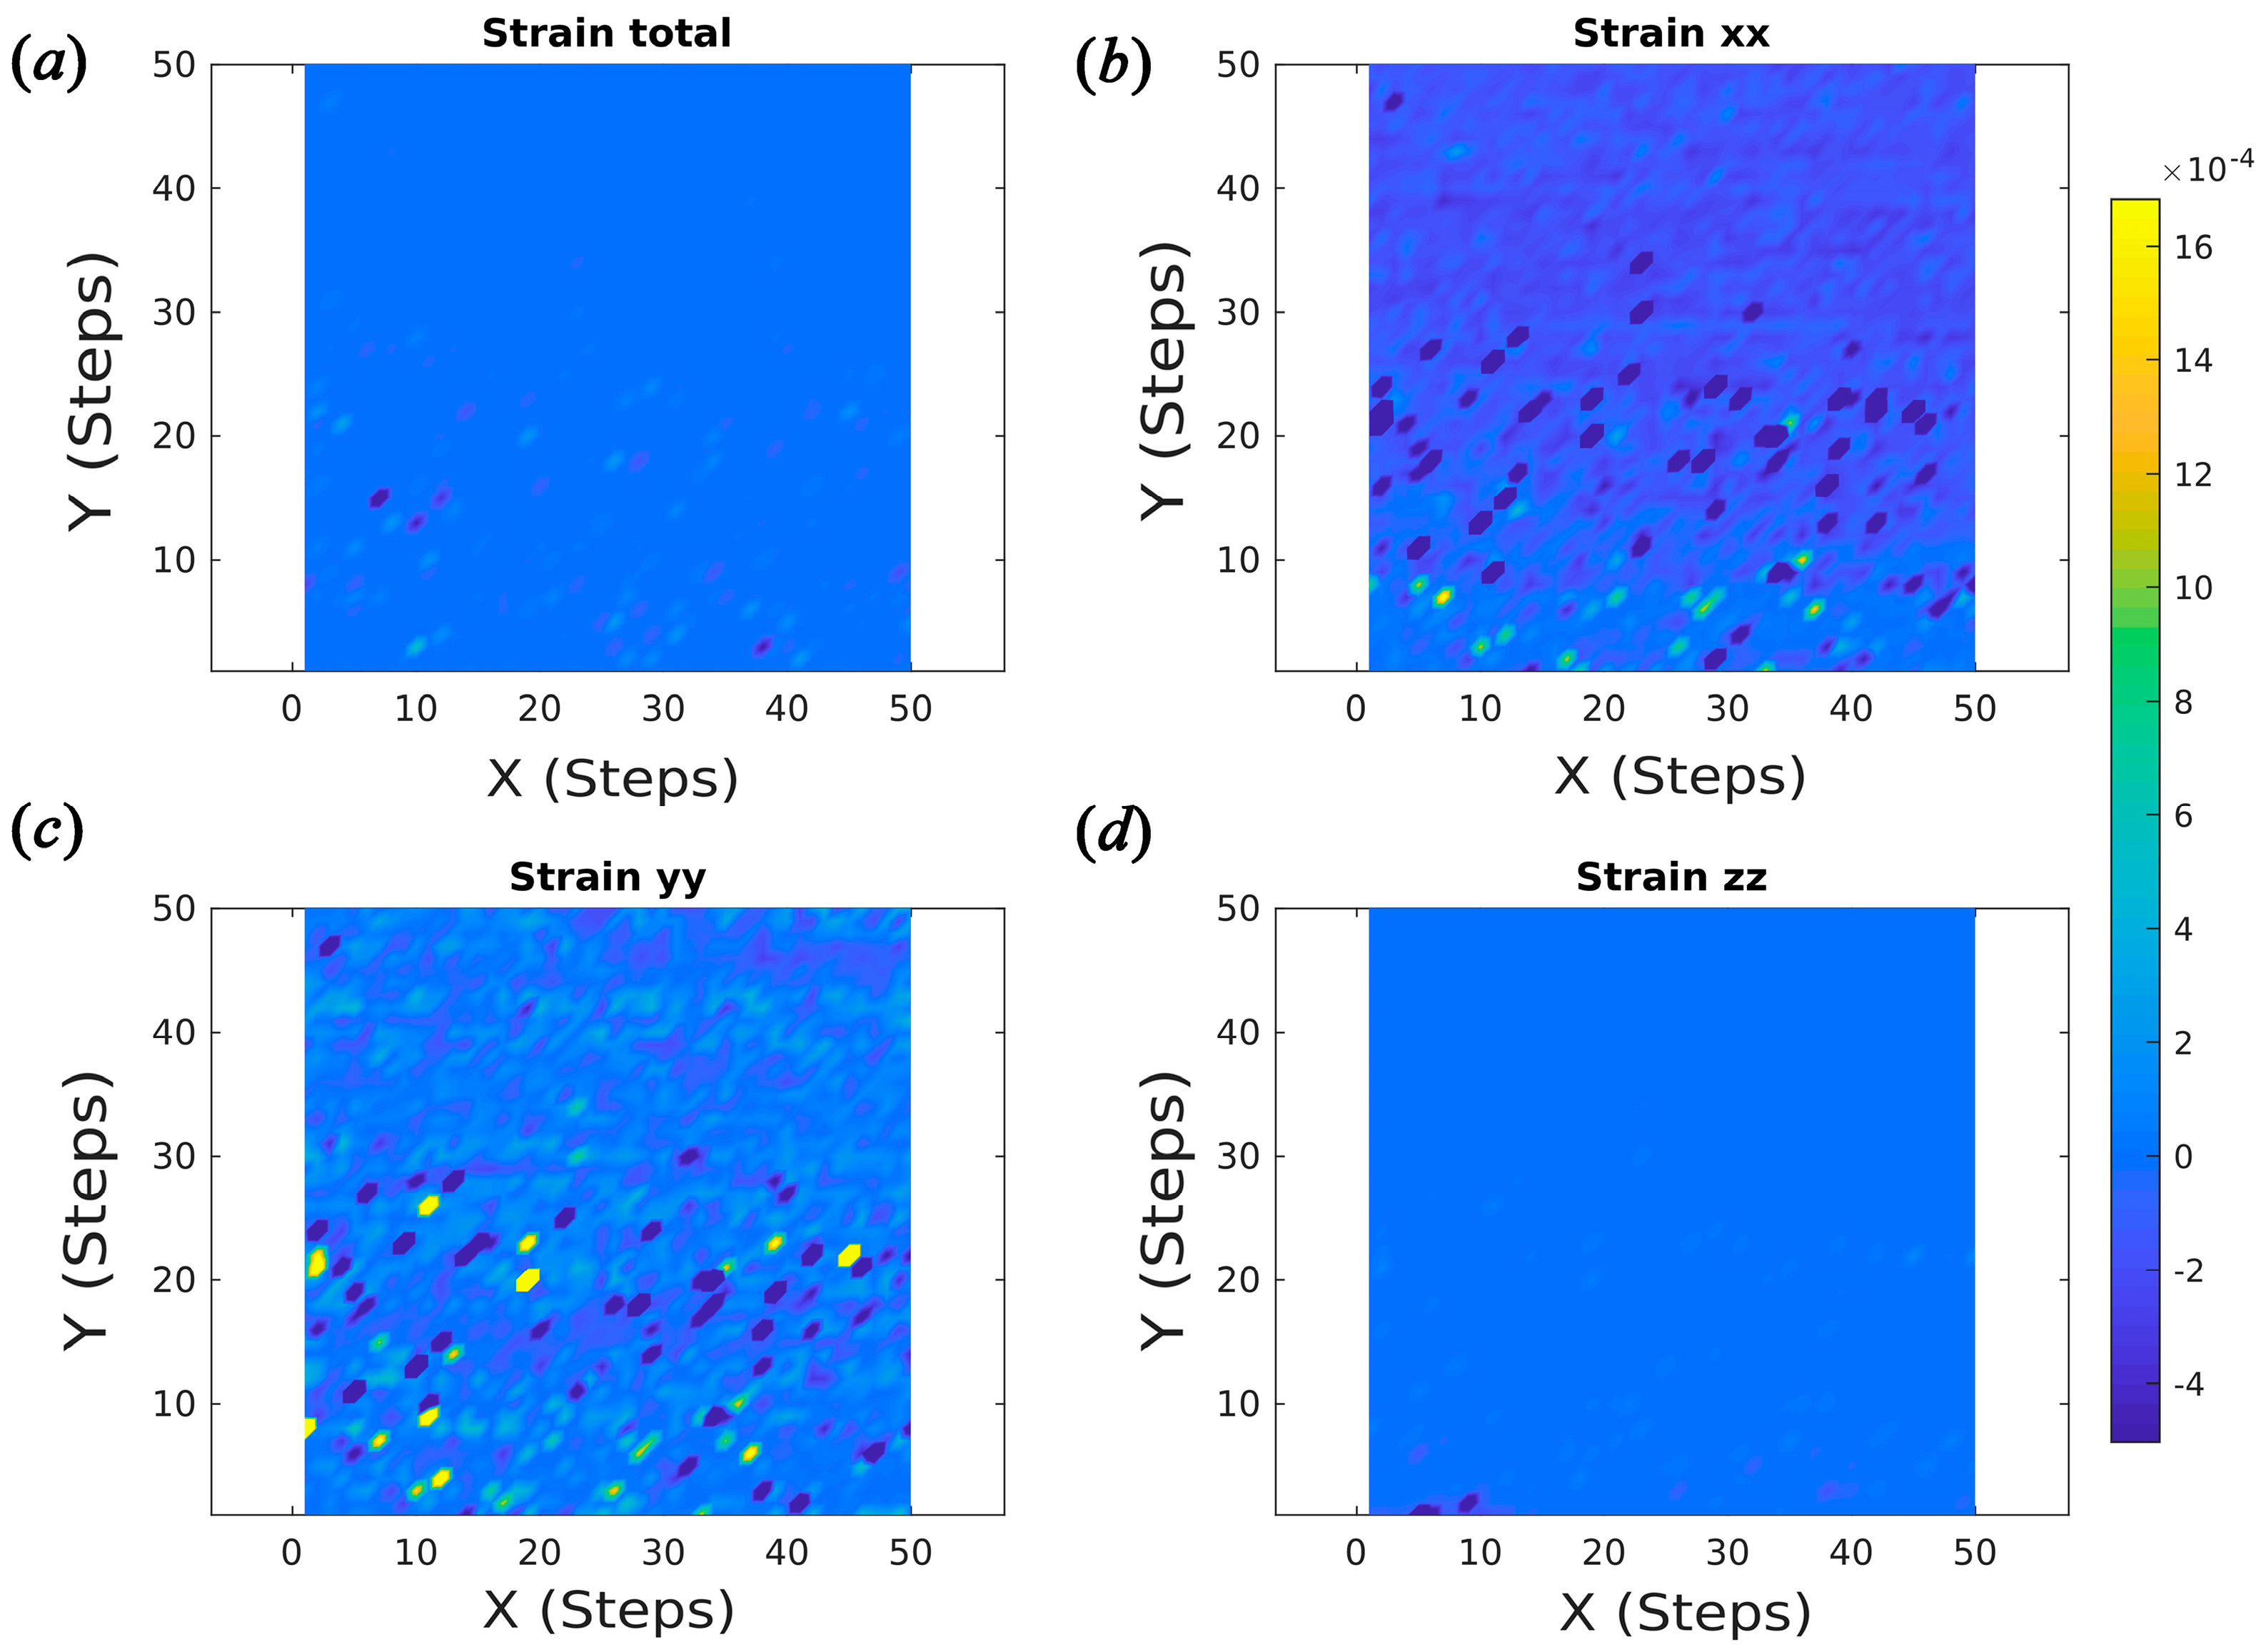
To describe the orientation-depended strain map in real space is more practical than in reciprocal space, as the coordinate scaling and length changes of the a-, b- or c-axis and a*-, b*- or c*-axis follow an inverse proportional relationship. Here, strain ε and micro-strain εxx, εyy, and εzz as calculated in real space using the Equations (4)–(6) are shown in Figure 7. Unlike the behavior of thin films or 2D materials, it presents a comprehensive three-dimensional micro-strain distribution of the LaAlO3 (100) single crystal, where negative values denote compressive strain, and positive values indicate tensile strain. The color gradient transitions from yellow (near-zero strain) to deep blue (maximum compressive strain), enabling direct visual comparison of micro-strain magnitude and spatial distribution.
Figure 7a illustrates the overall strain field of the sample. The dominant uniform blue confirms that the vast majority of the material exhibits near-zero total strain, as determined by Equation (1), indicating a globally stable, minimally deformed microstructure of the LaAlO3 (100) single crystal.
Figure 7b quantifies the micro-strain component along the [100] direction (Strain_xx map). Regions of moderate compressive strain are clearly visible in the central portion of the map (X_step, 1~45, Y_step, 10~30). These localized strain bands indicate compressive stress concentrated along the [100]-axis, which likely arises from post-processing residual stresses. The peripheral regions of the sample remain nearly strain-free, demonstrating that [100]-directional strain is confined to specific microstructural domains rather than being a global phenomenon. Sparse, isolated deep blue speckles scattered in the map represent localized strain concentrations, which are consistent with sparse misorientation distribution regions (Figure 6a).
Figure 7c displays the micro-strain component along the [010] direction (Strain_yy map). Similar to the Strain_xx map, localized tensile strains are observed, but with a distinct spatial distribution; the highest strain concentrations are concentrated in the lower-left quadrant (X_step, 1~20, Y_step, 1~30). This spatial pattern reveals that [010]-directional tensile strain is localized in a separate microstructural domain, with a higher magnitude than [100]-directional strain, indicating a directional mechanical response driven by the processing-induced stress fields.
Figure 7d characterizes the micro-strain component along the [001] direction. The map is uniformly blue, confirming that the strain component along the [001] direction is negligible across the sample scanning area. This critical observation demonstrates that the most measurable micro-strain in the crystal is confined to the [100] and [010] directions, with no significant deformation along the [001] direction, which is consistent with a nearly uniform, homogeneous pattern [001] orientation distribution ORI [001].
The LaAlO3 (100) single crystal exhibits no significant strain, appearing uniform and undeformed as a whole. However, when its deformation behavior is resolved and analyzed along three orthogonal [100], [010], [001] directions, distinct strain components can be observed. This indicates that even without an overall strain response, directional differences exist in internal deformation. Such characteristics are observed through directional decomposition using our hklstrain algorithm.
Collectively, our method enables non-destructive analysis of orientation and strain distribution in LaAlO3 single crystals with hklstrain. These strain maps provide a high-resolution, multi-component characterization of the crystal’s micro-strain field, revealing compressive strain with localized hotspots and a low strain direction. This analysis is important for analyzing the functional properties in crystalline materials. As a simple, stable, and easy-to-operate method, hklstrain satisfies the core requirements for orientation-dependent micro-strain analysis of crystalline materials.
In summary, the crystallographic orientation of LaAlO3 is consistent with the distribution of micro-strain. Different orientations correspond to distinct surface atomic arrangements, leading to differences in micro-strain generation, and providing a design guideline for optimizing orientation during manufacturing.

4.4. Compare with Different Methods

The performance of hklstrain is compared with several other software packages: LaueTools, XMAS, XtalCAMP and PYXIS (Table 1). Two crystal samples are used as test samples: one is a Nickle-based superalloy turbine blade for in situ ability testing, and the other is a MgO single crystal for strain resolution testing. The indexing accuracy of both testing samples is 100% using our preprocessing program Laueprocess. However, it failed to index with LaueTools, XMAS, or XtalCAMP/PYXIS (commercial software); therefore, a Green–Lagrange deformation matrix was not generated during the period of sample testing.
With hklstrain, results show that the stain ε of Nickle-based superalloy turbine blade is 0.001395, RMS 0.000895 rad. The stain ε of the MgO single crystal is −0.000221, RMS 0.000019 rad, which can be reproduced using the hklstrain package in the Supplementary File of this paper. hklstrain can reach a strain resolution down to 2 × 10⁻⁴ for a high-quality MgO single crystal; moreover, hklstrain has demonstrated the capability to quantify the micro-strain of an in situ Nickle-based superalloy turbine blade with coatings (Table 1).
In summary, the hklstrain method based on Laue X-ray reflection and a numerical optimization algorithm offers distinct advantages compared with LaueTools and XMAS.

4.5. Further Development

hklstrain is limited to crystalline materials; it is ineffective for strain analysis in non-crystalline materials or amorphous materials, which lack ordered lattices and generate no Laue diffraction signals. For materials with three or more phases (e.g., different cell parameters), overlapping diffraction spots from different phases can affect the spot-matching algorithm. hklstrain is limited to surface and subsurface strain analysis. It can only characterize strain in the top few millimeters of a sample. For thick components, it cannot analyze strain in the internal region. hklstrain’s performance depends on the input diffraction data. If experimental diffraction spots exhibit severe drift and substantial broadening, this may produce false spot positions and strain signals in the hklstrain calculation. Resolving such issues requires manual intervention. The effects of pronounced broadening of diffraction spots will be considered for strain calculation in the further version of hklstrain.

5. Conclusions

A novel open-source hklstrain algorithm was developed and applied at BL03HB of SSRF for micro-strain calculation with the following characteristics:
(1)
Laue X-ray reflection and numerical optimization for dmes measurement.
(2)
hklstrain can be easily adapted to other beamlines or software programs.
(3)
Obtain full micro-strain tensor with only a single Laue diffraction image.
(4)
Utilize all matched Laue diffraction spots for micro-strain evaluation.
(5)
RMS is used for numerical optimization.
(6)
Reach a strain resolution down to 2 × 10⁻⁴.
(7)
Filter out spurious spots, applicable to single-crystal specimens with coatings.
(8)
Detect hkl lattice spacing variation that would be missed by overall Green–Lagrange deformation matrix.
(9)
Link strain data to orientation information, which helps users intuitively identify misorientation hotspots and understand the physical mechanisms of strain generation.

Supplementary Materials

The following supporting information can be downloaded at https://www.mdpi.com/article/10.3390/cryst16090554/s1, Supplementary File S1, hklstrain_win.rar.

Funding

This work was supported by the National Natural Science Foundation of China (Grant No. 32571404), and the key project of the Guangdong Basic and Applied Basic Research Foundation (Grant No. 2023B0303000003).

Data Availability Statement

The data presented in this study are available on request from the corresponding author.

Acknowledgments

The authors thank colleagues at the BL03HB beamline of the SSRF for their support with the beam time.

Conflicts of Interest

The author declares no conflicts of interest.

References

  1. Rickman, J.M.; Lookman, T.; Kalinin, S.V. Materials informatics: From the atomic-level to the continuum. Acta Mater. 2019, 168, 473–510. [Google Scholar] [CrossRef] [Scilit]
  2. Arnaud, A.; Guediche, W.; Remacha, C.; Romero, E.; Proudhon, H. A laboratory transmission diffraction Laue setup to evaluate single-crystal quality. J. Appl. Crystallogr. 2020, 53, 914–926. [Google Scholar] [CrossRef] [Scilit]
  3. Pan, C.; Wang, Z.J.; Gao, X.Y. Automated Orientation and Diffraction Intensity (AODI) Mapping on a Curved Surface. Crystals 2025, 15, 200. [Google Scholar] [CrossRef] [Scilit]
  4. Ding, Q.Q.; Bei, H.B.; Zhao, X.B.; Gao, Y.F.; Zhang, Z. Processing, Microstructures and Mechanical Properties of a Ni-Based Single Crystal Superalloy. Crystals 2020, 10, 572. [Google Scholar] [CrossRef] [Scilit]
  5. Liu, N.H.; Hu, X.X.; Cai, J.Z.; Su, R.R.; Thevamaran, R.; Zhang, H.L.; Perepezko, J.H.; Szlufarska, I. Strain rate effects on shear-band behavior in the Al-Sm system. Acta Mater. 2025, 284, 120632. [Google Scholar] [CrossRef] [Scilit]
  6. Yang, B.B.; Xu, X.; Lunt, D.; Zhang, F.; Atkinson, M.D.; Li, Y.P.; Llorca, J.; Zhou, X.R. Grain size dependence of microscopic strain distribution in a high entropy alloy at the onset of plastic deformation. Acta Mater. 2025, 285, 120682. [Google Scholar] [CrossRef] [Scilit]
  7. Devoe, M.; Tamura, N.; Wenk, H.R. Residual strain orientation in rolled titanium determined with synchrotron X-ray Laue microdiffraction. J. Appl. Crystallogr. 2023, 56, 135–142. [Google Scholar] [CrossRef] [Scilit]
  8. Jiang, Y.M.; Zhang, Z.W.; An, Z.Y.; Pan, X.Y.; Shi, X.M.; Wang, R.A.; Li, J.J.; Chen, C.Z.; Cao, Z.Q.; Xu, Y.; et al. X-Ray Characterization of Semiconductor Materials and Advanced Packaging: A Perspective on Multidimensional Structural Analysis. Crystals 2026, 16, 265. [Google Scholar] [CrossRef] [Scilit]
  9. Cejpek, P.; Motylenko, M.; Rafaja, D. Lattice strain relaxation in thin Mo films grown heteroepitaxially on MgO single crystals. J. Appl. Crystallogr. 2026, 59, 190–205. [Google Scholar] [CrossRef] [Scilit]
  10. Wang, P.F.; Zhao, X.B.; Yue, Q.Z.; Xia, W.S.; Ding, Q.Q.; Bei, H.B.; Gu, Y.F.; Zhang, Y.F.; Zhang, Z. Influence of Strain Amplitude on Low-Cycle Fatigue Behaviors of a Fourth-Generation Ni-Based Single-Crystal Superalloy at 980 °C. Crystals 2023, 13, 686. [Google Scholar] [CrossRef] [Scilit]
  11. Fukuhara, A.; Takano, Y.; Namba, M.; Maki, M. X-Ray Bragg Reflection and Strain Compensation in Silicon-Crystals. J. Appl. Crystallogr. 1980, 13, 31–33. [Google Scholar] [CrossRef] [Scilit]
  12. Chan, K.H.; Huang, X.Y.; Tamura, N.; Chen, X. EPhysics-informed machine learning analysis for nanoscale grain mapping by synchrotron Laue microdiffraction. J. Appl. Crystallogr. 2025, 58, 1880–1886. [Google Scholar] [CrossRef] [Scilit]
  13. Andrei, F.; Dinescu, M.; Ion, V.; Craciun, F.; Birjega, R.; Scarisoreanu, N.D. Impact of Structural Strain in Perovskite Epitaxial Thin Films on Their Functional Properties. Crystals 2023, 13, 1686. [Google Scholar] [CrossRef] [Scilit]
  14. Dolabella, S.; Frison, R.; Chahine, G.A.; Richter, C.; Schulli, T.U.; Tasdemir, Z.; Alaca, B.E.; Leblebici, Y.; Dommann, A.; Neels, A. Real- and -space travelling: Multi-dimensional distribution maps of crystal-lattice strain (ε) and tilt of suspended monolithic silicon nanowire structures. J. Appl. Crystallogr. 2020, 53, 58–68. [Google Scholar] [CrossRef] [Scilit]
  15. Liu, D.Y.; Ding, Q.Q.; Zhou, Q.; Zhou, D.X.; Wei, X.; Zhao, X.B.; Zhang, Z.; Bei, H.B. Microstructure, Mechanical Properties and Thermal Stability of Ni-Based Single Crystal Superalloys with Low Specific Weight. Crystals 2023, 13, 610. [Google Scholar] [CrossRef] [Scilit]
  16. Liu, Y.; Ding, Q.Q.; Wei, X.; Zhang, Y.F.; Zhang, Z.; Bei, H.B. The Microstructures and Mechanical Properties of a Welded Ni-Based Hastelloy X Superalloy. Crystals 2022, 12, 1336. [Google Scholar] [CrossRef] [Scilit]
  17. Al Hassan, A.; Davtyan, A.; Küpers, H.; Lewis, R.B.; Bahrami, D.; Bertram, F.; Bussone, G.; Richter, C.; Geelhaar, L.; Pietsch, U. Complete structural and strain analysis of single GaAs/(In,Ga)As/GaAs core-shell-shell nanowires by means of in-plane and out-of-plane X-ray nanodiffraction. J. Appl. Crystallogr. 2018, 51, 1387–1395. [Google Scholar] [CrossRef] [Scilit]
  18. Zhang, Q.H.; Zhai, Z.; Nie, Z.H.; Harjo, S.; Cong, D.Y.; Wang, M.G.; Li, J.; Wang, Y.D. An in situ neutron diffraction study of anomalous superelasticity in a strain glass NiFeGaCo alloy. J. Appl. Crystallogr. 2015, 48, 1183–1191. [Google Scholar] [CrossRef] [Scilit]
  19. Yue, P.F.; Yang, S.D.; Gao, Y.; Shi, R.H.; Zhang, G.S.; Zhu, Z.Y.; Han, D.; Song, K.X. Progress in Plastic Work-Heat Conversion of Metallic Crystals. Crystals 2025, 15, 164. [Google Scholar] [CrossRef] [Scilit]
  20. Marciszko-Wiackowska, M.; Baczmanski, A.; Apel, D.; Klaus, M.; Genzel, C.; Chemkhi, M.; Saferna, M.; Wierzbanowski, K.; Kawalko, J.; Le Joncour, L.; et al. Angle- and energy-dispersive diffraction used to determine stress evolution in 17-4 PH stainless steel produced by ADAM and subjected to SMAT processing. J. Appl. Crystallogr. 2025, 58, 2049–2065. [Google Scholar] [CrossRef] [Scilit]
  21. Gureva, P.; Kulikov, A.; Mololkin, A.; Fakhrtdinov, R.; Artemev, A.; Demkiv, A.; Pisarevsky, Y.; Marchenkov, N. Local variations of the piezoelectric properties of an LiNb(1−x)TaO crystal. J. Appl. Crystallogr. 2023, 56, 539–544. [Google Scholar] [CrossRef] [Scilit]
  22. Vinel, A.; Grédiac, M.; Balandraud, X.; Blaysat, B.; Jailin, T.; Sur, F. Towards strain gauge 2.0: Substituting the electric resistance routinely deposited on polyimide film by the optimal pattern for full-field strain measurement. Strain 2025, 61, e12488. [Google Scholar] [CrossRef] [Scilit]
  23. Örs, T.; Micha, J.S.; Gey, N.; Michel, V.; Castelnau, O.; Guinebretiere, R. EBSD-assisted Laue microdiffraction for microstrain analysis. J. Appl. Crystallogr. 2018, 51, 55–67. [Google Scholar] [CrossRef] [Scilit]
  24. Yang, D.; Lapington, M.T.; He, G.Z.; Song, K.; Zhang, M.Y.; Barker, C.; Harder, R.J.; Cha, W.; Liu, W.J.; Phillips, N.W.; et al. Refinements for Bragg coherent X-ray diffraction imaging: Electron backscatter diffraction alignment and strain field computation. J. Appl. Crystallogr. 2022, 55, 1184–1195. [Google Scholar] [CrossRef] [Scilit]
  25. Bouscaud, D.; Morawiec, A.; Pesci, R.; Berveiller, S.; Patoor, E. Strain resolution of scanning electron microscopy based Kossel microdiffraction. J. Appl. Crystallogr. 2014, 47, 1699–1707. [Google Scholar] [CrossRef] [Scilit]
  26. Matejová, J.S.; Horák, L.; Minárik, P.; Holy, V.; Grzanka, E.; Domagala, J.; Leszczynski, M. Strain relaxation in InGaN/GaN epilayers by formation of V-pit detects studied by SEM, XRD and numerical simulations. J. Appl. Crystallogr. 2021, 54, 62–71. [Google Scholar] [CrossRef] [Scilit]
  27. Kyutt, R.N.; Ruvimov, S.S.; Argunova, T.S. X-ray triple-crystal diffractometry and transmission electron microscopy characterization of defects in lattice-mismatched epitaxic structures. J. Appl. Crystallogr. 1995, 28, 700–706. [Google Scholar] [CrossRef] [Scilit]
  28. Gong, T.; Chen, L.Q.; Wang, X.Y.; Qiu, Y.; Liu, H.Y.; Yang, Z.X.; Walther, T. Recent Developments in Transmission Electron Microscopy for Crystallographic Characterization of Strained Semiconductor Heterostructures. Crystals 2025, 15, 192. [Google Scholar] [CrossRef] [Scilit]
  29. Zhang, F.G.; Bornert, M.; Petit, J.; Castelnau, O. Accuracy of stress measurement by Laue microdiffraction (Laue-DIC method): The influence of image noise, calibration errors and spot number. J. Synchrotron Radiat. 2017, 24, 802–817. [Google Scholar] [CrossRef] [Scilit]
  30. N’Dohi, A.J.E.; Sonneville, C.; Saidi, S.; Ngo, T.H.; De Mierry, P.; Frayssinet, E.; Cordier, Y.; Phung, L.V.; Morancho, F.; Maher, H.; et al. Micro-Raman Spectroscopy Study of Vertical GaN Schottky Diode. Crystals 2023, 13, 713. [Google Scholar] [CrossRef] [Scilit]
  31. Ungár, T.; Gubicza, J.; Ribárik, G.; Borbély, A. Crystallite size distribution and dislocation structure determined by diffraction profile analysis:: Principles and practical application to cubic and hexagonal crystals. J. Appl. Crystallogr. 2001, 34, 298–310. [Google Scholar] [CrossRef] [Scilit]
  32. Romanitan, C.; Kusko, M.; Popescu, M.; Varasteanu, P.; Radoi, A.; Pachiu, C. Unravelling the strain relaxation processes in silicon nanowire arrays by X-ray diffraction. J. Appl. Crystallogr. 2019, 52, 1077–1086. [Google Scholar] [CrossRef] [Scilit]
  33. Punegov, V. Reciprocal-space mapping calculations of X-ray Laue diffraction in a crystal with thermomigration channels. J. Appl. Crystallogr. 2025, 58, 260–268. [Google Scholar] [CrossRef] [Scilit]
  34. Zhang, Y.B.; Borbély, A. Line profile analysis of energy-scanned Laue microdiffraction peaks using the modified Williamson-Hall and modified Warren-Averbach methods. J. Appl. Crystallogr. 2025, 58, 1428–1438. [Google Scholar] [CrossRef] [Scilit]
  35. Robach, O.; Micha, J.S.; Ulrich, O.; Gergaud, P. Full local elastic strain tensor from Laue microdiffraction: Simultaneous Laue pattern and spot energy measurement. J. Appl. Crystallogr. 2011, 44, 688–696. [Google Scholar] [CrossRef] [Scilit]
  36. Zhang, F.G.; Castelnau, O.; Bornert, M.; Petit, J.; Marijon, J.B.; Plancher, E. Determination of deviatoric elastic strain and lattice orientation by applying digital image correlation to Laue microdiffraction images: The enhanced Laue-DIC method. J. Appl. Crystallogr. 2015, 48, 1805–1817. [Google Scholar] [CrossRef] [Scilit]
  37. Borbély, A. Accurate strain determination from digital image correlation of Laue diffraction spots. J. Appl. Crystallogr. 2015, 48, 1614–1616. [Google Scholar] [CrossRef] [Scilit]
  38. Li, Y.; Chen, K.; Dang, X.F.; Zhang, F.Y.; Tamura, N.; Ku, C.S.; Kang, H.J.; Wenk, H.R. XtalCAMP: A comprehensive program for the analysis and visualization of scanning Laue X-ray micro-/nanodiffraction data. J. Appl. Crystallogr. 2020, 53, 1392–1403. [Google Scholar] [CrossRef] [Scilit]
  39. Kou, J.W.; Chen, K. PYXIS: An integrated software package for synchrotron micro/nanodiffraction data analysis. J. Appl. Crystallogr. 2024, 57, 539–551. [Google Scholar] [CrossRef] [Scilit]
  40. Pedersen, P. Axisymmetric analytical stiffness matrices with Green-Lagrange strains. Comput. Mech. 2005, 35, 227–235. [Google Scholar] [CrossRef] [Scilit]
  41. Li, W.; Wang, Y.; Chen, C.; Sun, L. Nonlinear wavefield characteristics of seismic translation and rotation in small-strain deformation from moment tensor simulations. Nonlin. Process. Geophys. 2025, 32, 489–501. [Google Scholar] [CrossRef] [Scilit]
  42. Wang, Z.J.; Pan, C.; Yu, L.; He, B.C.; Su, Z.H.; Zhang, W.Z.; Wang, S.S.; Sun, B.; Wen, W.; Gao, X.Y.; et al. Laueprocess: A software package for processing Laue diffraction data. J. Appl. Crystallogr. 2025, 58, 1496–1510. [Google Scholar] [CrossRef] [Scilit]
  43. Ungar, T.; Revesz, A.; Borbely, A. Dislocations and grain size in electrodeposited nanocrystalline Ni determined by the modified Williamson-Hall and Warren-Averbach procedures. J. Appl. Crystallogr. 1998, 31, 554–558. [Google Scholar] [CrossRef] [Scilit]
  44. Motevalizadeh, L.; Tahani, M. A Phenomenological Study of Chromium Impurity Effects on Lattice Microstrains of SnO Nanoparticles Prepared Using Sol-Gel Technique. Crystals 2023, 13, 919. [Google Scholar] [CrossRef] [Scilit]
  45. Abboud, A.; Kirchlechner, C.; Keckes, J.; Nurdan, T.C.; Send, S.; Micha, J.S.; Ulrich, O.; Hartmann, R.; Strueder, L.; Pietsch, U. Single-shot full strain tensor determination with microbeam X-ray Laue diffraction and a two-imensional energy-dispersive detector. J. Appl. Crystallogr. 2017, 50, 901–908. [Google Scholar] [CrossRef] [Scilit]
  46. Ortner, B. On the Selection of Measurement Directions in 2nd-Rank Tensor (Eg Elastic Strain) Determination of Single-Crystals. J. Appl. Crystallogr. 1989, 22, 216–221. [Google Scholar] [CrossRef] [Scilit]
  47. Ikotun, A.M.; Ezugwu, A.E.; Abualigah, L.; Abuhaija, B.; Heming, J. K-means clustering algorithms: A comprehensive review, variants analysis, and advances in the era of big data. Inform. Sci. 2023, 622, 178–210. [Google Scholar] [CrossRef] [Scilit]
  48. Hatt, A.J.; Spaldin, N.A. Structural phases of strained LaAlO driven by octahedral tilt instabilities. Phys. Rev. B 2010, 82, 195402. [Google Scholar] [CrossRef] [Scilit]
  49. Wang, Z.J.; Wang, S.S.; Su, Z.H.; Yu, L.; Wang, Y.Z.; Sun, B.; Wen, W.; Gao, X.Y. BL03HB: A Laue microdiffraction beamline for both protein crystallography and materials science at SSRF. Nucl. Sci. Tech. 2024, 35, 119. [Google Scholar] [CrossRef] [Scilit]
  50. Tai, R.Z.; Zhao, Z.T. Overview of SSRF phase-II beamlines. Nucl. Sci. Tech. 2024, 35, 137. [Google Scholar] [CrossRef] [Scilit]
Figure 1. Data processing workflow of hklstrain.
Crystals 16 00554 g001
Figure 2. Schematic diagram for the comparison between Laue diffraction and mono-beam diffraction in micro-strain analysis. (a) Mono-beam diffraction. (b,c) Laue diffraction. A, B, C represent the reciprocal-lattice points with the same Miller indices (hkl).
Crystals 16 00554 g002
Figure 3. Schematic diagram for dmes measurement using globalfitting with hklstrain. Laue X-ray reflection and numerical optimization are used for dmes determination.
Crystals 16 00554 g003
Figure 4. Schematic diagram for beamline coordinate system and rotation of a-, b-, and c-axes of an orthorhombic crystal system. (a) Crystal in the beamline coordinate system. (b,c,d) The crystal axes are rotated about the beamline X, Y, and Z axes through angles PhiX, PhiY, and PhiZ, respectively. The Cartesian coordinates cx, cy, cz for the crystal [001] direction are shown in (ad).
Crystals 16 00554 g004
Figure 5. Indexing results of Laue diffraction of LaAlO3 (100) single crystal with crystallographic parameters a 5.36 Å, b 5.37 Å, c 7.56 Å, α 90.0°, β 90.0°, γ 90.0°, and space group (Imma). (a) Miller indices (hkl) for each spot, (b) wavelength and number of high-order harmonics for each spot, (c) top-view wavelength distribution chart of center diffraction spots using a four-bounce crystal monochromator and Pilatus 2M detector, (d) side-view wavelength distribution chart; each spot is labeled with center wavelength according to the energy scanning.
Crystals 16 00554 g005
Figure 6. Orientation classification of LaAlO3 single crystal: (a) ORI [100], (b) ORI [010], (c) ORI [001] distribution map.
Crystals 16 00554 g006
Figure 7. Micro-strain mapping of LaAlO3 single crystal. (a) The total strain ε map, (b) micro-strain εxx map in [100]-axis direction, (c) micro-strain εyy map in [010]-axis direction, (d) micro-strain εzz map in [001]-axis direction. Average RMS for strain analysis: 0.000154 (rad), step size: 50 μm × 50 μm.
Crystals 16 00554 g007
Table 1. Comparison of strain analysis software packages.
Comparison of Micro-Strain Calculation Software Packages
hklstrainLaueToolsXMASXtalCAMP/PYXIS
Strain definitionLattice spacing variationGreen–Lagrange deformation matrix
Core algorithmLaue X-ray reflection and numerical optimizationOrientation refinement
Open-sourceYesYesNoNo
Indexing accuracy for testing images100%FailedFailedNot-available
RMS (rad) for evaluationYesNoNo-
Nickle-based superalloy turbine blades ε 0.001395
RMS 0.000895 (rad)
---
MgO single crystal ε −0.000221
RMS 0.000019 (rad)
---
Disclaimer/Publisher’s Note: The statements, opinions and data contained in all publications are solely those of the individual author(s) and contributor(s) and not of MDPI and/or the editor(s). MDPI and/or the editor(s) disclaim responsibility for any injury to people or property resulting from any ideas, methods, instructions or products referred to in the content.