Article

Microstructure Modification and Property Enhancement of Al-0.5Fe Alloy via Equimolar La/Ce Co-Doping: Mechanisms and Composition-Dependent Effects

Electric Power Research Institute of Guangxi Power Grid Co., Ltd., Nanning 530023, China
*
Author to whom correspondence should be addressed.
Crystals 2026, 16(9), 553; https://doi.org/10.3390/cryst16090553
Submission received: 23 July 2026 / Revised: 19 August 2026 / Accepted: 20 August 2026 / Published: 25 August 2026
(This article belongs to the Special Issue Microstructure Characterization and Design of Advanced Alloys)

Abstract

The effects of equimolar La/Ce co-doping (0–0.4 wt.% of each element) on the microstructure, mechanical properties, and electrical conductivity of the Al-0.5Fe (8176) conductor alloy were investigated in the as-cast, cold-drawn, and annealed (300 °C, 2 h) states. La/Ce additions refine the as-cast eutectic cells and modify the detrimental Al13Fe4 intermetallic from coarse plate-like to fine spheroidal particles. At 0.3 wt.% La + 0.3 wt.% Ce (0.3LC), the annealed wire reaches a peak elongation of 16.7% (+42.7% relative to the rare-earth-free alloy), while its electrical conductivity rises from 59.87 to 61.81% IACS. The conductivity increase is explained by a solute-scavenging mechanism: La and Ce bind Fe and Si impurities into stable Al-RE intermetallics, reducing solute-induced electron scattering in the α-Al matrix. At the same time, thermally stable Al-RE dispersoids pin subgrain boundaries during annealing, retard recrystallization, and preserve the fine-grained structure that benefits ductility. Both effects originate from the same RE addition. This coupled scavenging–pinning pathway breaks the usual trade-off between conductivity and ductility and defines an optimal composition range for high-performance Al-Fe conductor alloys.

1. Introduction

Aluminum alloys are widely used in power transmission, aerospace, and rail transportation because of their corrosion resistance, high specific strength, and manufacturability [1,2,3,4]. Among them, Al-Fe-based alloys (such as the 8176 grade with a nominal composition of Al-0.5Fe) are extensively used in power transmission conductors due to their high electrical conductivity and low cost. However, Fe additions promote the formation of coarse iron-rich intermetallic phases (e.g., Al13Fe4), which reduce plasticity and increase brittleness and thus restrict their use in high-strength applications [5,6,7,8].
Rare-earth (RE) additions can mitigate these challenges. Lanthanum (La), with a large atomic radius difference from Fe (0.187 nm versus 0.126 nm), tends to segregate at phase interfaces and grain boundaries; the induced lattice distortion inhibits the directional growth of iron-rich phases and transforms their morphology from acicular to spheroidal or short rod-like, reducing stress concentration [9]. Liao et al. [10] showed that Ce suppresses static lattice distortion in the aluminum solid solution, thereby extending the electron mean free path. Li et al. [11] reported that La/Ce and La/Er co-doping improves the performance of Al-Mg-Si alloys: La/Ce co-doping increased the tensile strength by 28.4% relative to La-monodoped alloys (reaching 223 MPa), while La/Er co-doping reached an electrical conductivity of 52.35% IACS, and ternary La/Ce/Er co-doping was suggested as a route to further balance strength and conductivity for overhead conductors [12]. Many studies have shown that RE doping improves the mechanical properties of aluminum alloys, and Sc, La, Er, Ce, Y, and Yb are commonly used [13]. Moderate La additions (below 0.3 wt.%) substantially improve ultimate tensile strength and fracture elongation while limiting conductivity loss and cost [14,15,16,17,18,19,20,21,22,23,24]. Three mechanisms are generally recognized: (1) modification—RE segregation at grain boundaries refines dendritic structures and inhibits the precipitation of Fe-rich phases [25,26]; (2) alloying—RE elements dissolve in the matrix or form intermetallic phases, strengthening the alloy through solid-solution and precipitation mechanisms [27,28]; and (3) purification—RE elements combine with hydrogen, oxygen, and sulfur in the melt to form high-melting-point compounds (e.g., REH2, RE2S3, RE2O2S), reducing the harm from gas porosity and inclusions [13,29,30].
However, the effects of La/Ce co-doping in Al-Fe conductor alloys remain poorly understood. Previous studies have mainly addressed single rare-earth additions, other alloy systems, or isolated property improvements. For the closely related 8176 (Al-0.5Fe) alloy, minor La additions alone were shown to modify the Al-Fe intermetallic and improve the strength–conductivity combination [31], and La and Ce were found to differ distinctly in their effects on the electrical conductivity of dilute aluminum alloys [19]; in Al-Mg-Si alloys, La/Ce co-doping outperformed La mono-doping in tensile strength [11]. Whether equimolar La/Ce co-doping of the 8176 conductor alloy follows these single-RE pathways or provides a distinct one has not been established, and the coupled influence of La/Ce on Fe-rich intermetallic evolution, solute redistribution, recrystallization after wire processing, and the resulting conductivity–ductility balance has not been systematically clarified. The question is also of direct industrial relevance: 8176 is a standard overhead-conductor grade, and a co-doped composition such as 0.3 wt.% La + 0.3 wt.% Ce can be trial-produced with existing master-alloy practice without modifying the wire-processing route.
We therefore investigate whether La/Ce co-doping provides a distinct microstructural pathway that mitigates the conventional trade-off between mechanical performance and electrical conductivity. We propose a “solute scavenging–dislocation pinning” framework: equimolar La/Ce co-doping is expected to (i) scavenge Fe/Si impurities from the α-Al matrix into stable Al-RE intermetallics, reducing electron scattering (purification pathway), and (ii) form thermally stable Al-RE dispersoids that pin dislocations and subgrain boundaries and retard recrystallization during annealing (pinning pathway). The equimolar La/Ce ratio was selected because La and Ce have nearly identical chemical behavior (electronegativity 1.10 vs. 1.12; atomic radii 0.188 vs. 0.182 nm), which ensures consistent scavenging and pinning effects while avoiding the compositional complexity of unequal additions. To test this framework, we combine microstructural characterization (OM, SEM-EDS, XRD, EBSD) with tensile and conductivity measurements on an industrially relevant Al-0.5Fe (8176) alloy in the cast, drawn, and annealed states. This establishes the relationships among grain refinement, Fe-rich phase modification, RE-rich particle formation, recrystallization resistance, and the conductivity–ductility balance and identifies an effective composition window for the design of high-performance Al-Fe conductor alloys.

2. Experimental Materials and Methods

2.1. Alloy Preparation

This study employed an Al-0.5Fe (wt.%) base alloy system. Five alloys were prepared by adding different contents of La/Ce mixed rare earth: Al-0.5Fe, Al-0.5Fe-0.1La-0.1Ce, Al-0.5Fe-0.2La-0.2Ce, Al-0.5Fe-0.3La-0.3Ce, and Al-0.5Fe-0.4La-0.4Ce, designated 0LC, 0.1LC, 0.2LC, 0.3LC, and 0.4LC, respectively (Table 1). Industrial-grade pure aluminum (99.7 wt.% purity, Guangxi Guangtou New Materials Co., Ltd., Nanning, China) was used as the matrix, and Al-10Fe, Al-10La, and Al-20Ce master alloys served as raw materials (Guangxi Guosheng Rare Earth New Material Co., Ltd., Chongzuo, China). The alloys were melted in a box resistance furnace. Pure aluminum was first melted at 750 °C; the master alloys were then added sequentially, and the melt was stirred continuously for 5 min to promote compositional uniformity. Subsequently, 0.5 wt.% hexachloroethane (C2Cl6, Shanghai Aladdin Biochemical Technology Co., Ltd., Shanghai, China) was added for degassing and refining. After settling and removal of surface dross, the melt was held at 750 °C for 30 min and then poured at 750 °C into a graphite mold preheated to 200 °C, yielding air-cooled round ingots 16 mm in diameter. The ingots were radially sectioned at their midpoint to produce 5 mm thick sections for metallographic and microstructural analysis. The remaining material was processed by room-temperature extrusion and cold drawing into wires 2 mm in diameter. Specimens 100 cm in length were cut from each wire and annealed at 300 °C for 2 h.
Standard processing of 8xxx-series conductor alloys commonly includes a homogenization step to spheroidize the Fe-rich phases and reduce microsegregation. This step was omitted here for two reasons. First, at the low Fe content of 8176 (0.5 wt.%), the intermetallic volume fraction is small and the phases are already comparatively fine in the as-cast state, so the subsequent room-temperature extrusion and multi-pass cold drawing (total area reduction > 98%) fragment them mechanically to an extent comparable to thermal spheroidization. Second, direct processing of 8176 from the as-cast state without homogenization has been demonstrated previously [32] and reflects simplified industrial practice for dilute conductor alloys. The influence of homogenization on the RE-containing alloys will be addressed in future work.

2.2. Tensile Testing

Room-temperature uniaxial tensile tests were performed on a SUNS microcomputer-controlled electronic universal testing machine in accordance with ASTM E8/E8M [33]. Wire specimens with a gauge length of 250 mm were tested at a constant crosshead speed of 20 mm/min, corresponding to a nominal strain rate of approximately 1.3 × 10⁻³ s−1.

2.3. Electrical Conductivity

Electrical conductivity was measured using a double-arm bridge method, with results expressed as % IACS (International Annealed Copper Standard).

2.4. Microstructural Characterization

Specimens for optical microscopy (OM, Olympus YS600, Tokyo, Japan) and scanning electron microscopy (SEM, Zeisss Sigma 300, Jena, Germany) were prepared using standard metallographic procedures, including grinding with SiC paper (500–4000 grit) and polishing with diamond suspensions. SEM analysis was conducted on a equipped with an energy-dispersive X-ray spectrometer (EDS, Oxford Instruments Xplore 30, Buckinghamshire, UK); Elemental distributions were assessed by EDS spectrum imaging (area mapping), which serves as the primary basis for the discussion of chemical redistribution in this work; EDS point analyses were carried out on at least three particles per alloy for corroboration only, and the reported compositions are semi-quantitative. X-ray diffraction (XRD, BRUKER AXS GMBH D8 ADVANCE, AXS GmbH, Karlsruhe, Germany) characterization was performed on a Rigaku D/MAX 2500V diffractometer (Cu Kα radiation, 40 kV) at a scanning rate of 3°/min. Because the volume fraction of RE-rich phases in the investigated composition range is low (<1 vol.%), these phases lie below the XRD detection limit; XRD was therefore used solely to confirm the α-Al solid solution and to track lattice-parameter changes, whereas identification of the intermetallic phases relied on SEM-EDS, which offers higher spatial resolution and sensitivity for trace phases. All XRD patterns presented in this revision were re-measured on the five actual alloys of this study.
EDS mapping and point analysis were performed on the as-cast and annealed specimens because these two states capture the critical chemical redistribution steps: solidification-driven segregation in the as-cast condition and precipitation-driven partitioning after annealing. Cold drawing fragments the existing phases mechanically without measurably changing their composition, so EDS of the drawn wires would largely duplicate the as-cast information and was therefore not pursued.
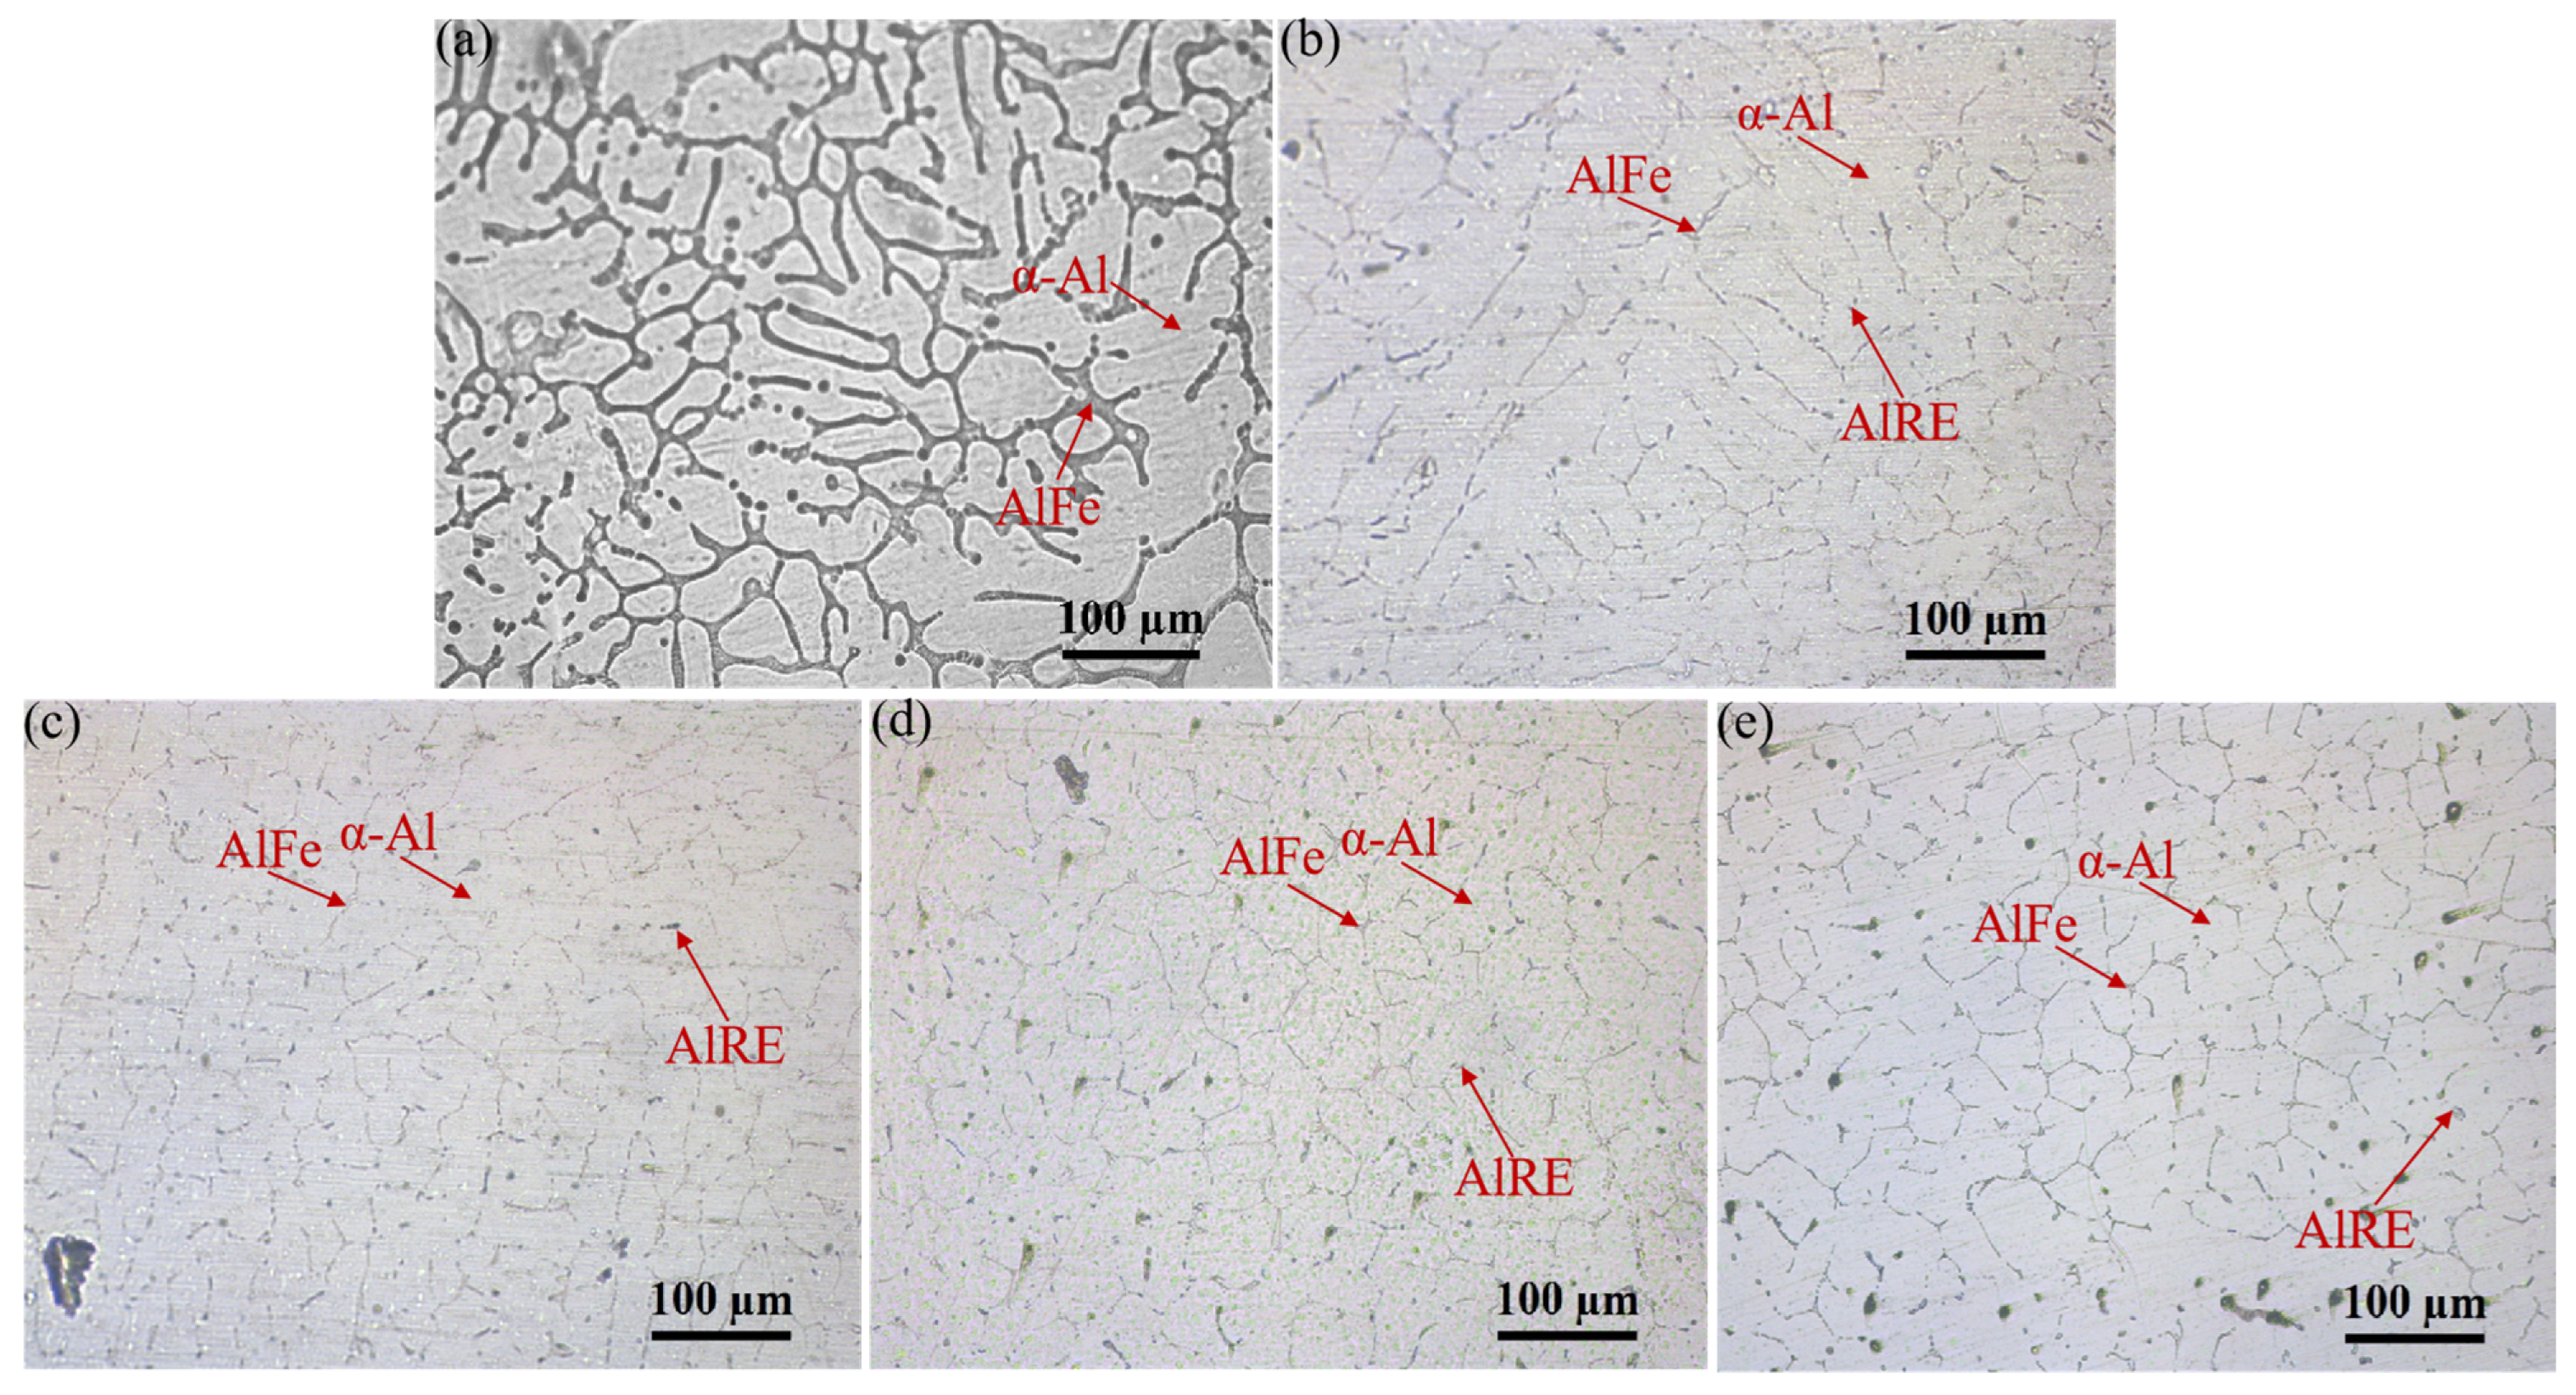
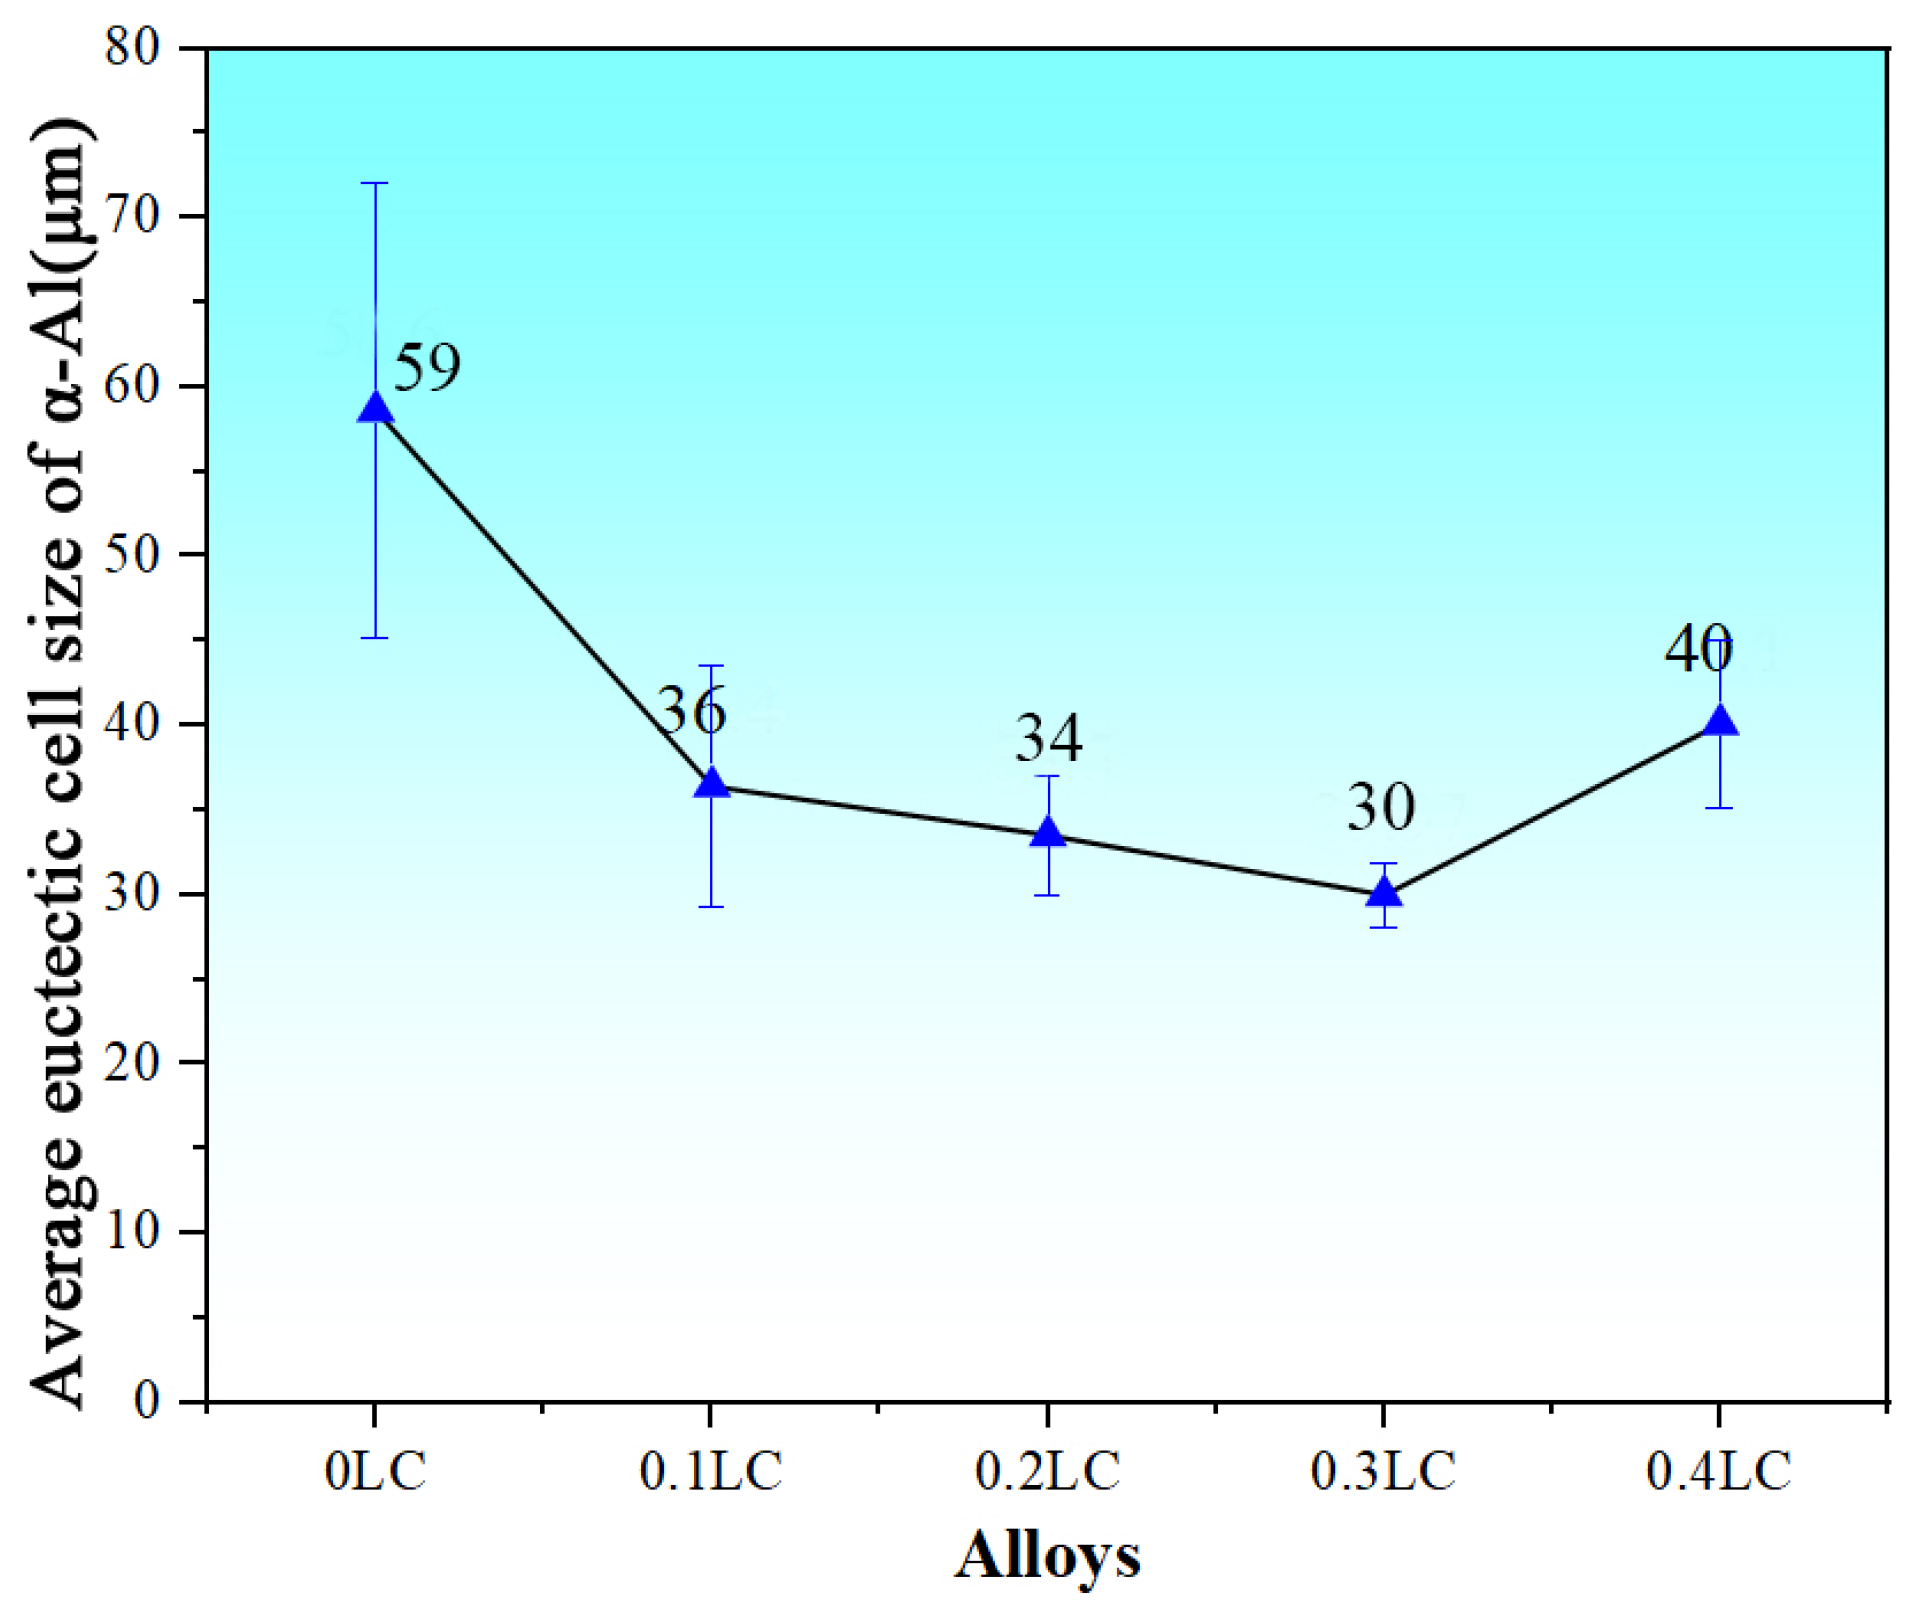
Eutectic cell size estimation from OM images. In as-cast Al-Fe alloys, the Al-Fe intermetallics form at the boundaries of eutectic cells rather than at true α-Al grain boundaries, because a single α-Al grain generally contains several eutectic cells (Figure 1). The boundary networks resolved by OM therefore delineate eutectic cells, and the sizes in this research are eutectic cell sizes measured by the linear intercept method along the Al-Fe-decorated boundaries. This method becomes increasingly unreliable at higher La/Ce contents—where the Al-Fe phases are refined and spheroidized and no longer trace continuous boundaries—so the OM-derived values (Figure 2) are reported as relative trends rather than absolute values. The true as-cast grain size would require anodizing in Barker’s reagent with polarized-light observation, which was not available in this study. For reference, the grain sizes of the annealed 0LC and 0.3LC wires were measured independently by electron backscatter diffraction (EBSD; Section 3.3); these values characterize the deformed-and-annealed microstructure and are not directly comparable with the as-cast eutectic cell sizes.

2.5. EBSD Analysis

EBSD (Oxford Instruments NordlysMax2 with software kit AZtec 3.0, UK) specimens were prepared from the annealed 0LC and 0.3LC wires by electropolishing in a perchloric acid–ethanol electrolyte (1:9 by volume). EBSD maps were acquired using a Nordlys detector with a step size of 0.54 µm at an operating voltage of 20 kV and were analyzed with AZtec software (Oxford Instruments AZtec 3.0, UK). Grains were reconstructed from the orientation maps using the standard AZtec grain-detection procedure; high-angle grain boundaries (HAGBs) were defined as misorientations of 15° or greater, and low-angle grain boundaries (LAGBs) as misorientations between 2° and 15°. Kernel average misorientation (KAM) maps were computed from the local misorientation between each pixel and its neighbors, and the grain-size distributions of the two alloys were plotted using identical bin widths and axis ranges to allow direct comparison.

2.6. Statistical Analysis

Mechanical properties and electrical conductivity values are reported as mean ± standard deviation (SD) of three valid specimens per alloy.

3. Results and Discussion

3.1. Microstructure of the As-Cast Alloys

Figure 1 and Figure 2 present optical micrographs and the corresponding eutectic cell size estimates for the cast alloys. The base 0LC alloy shows the coarsest structure (estimated cell size ≈ 59 µm); progressive refinement is observed up to 0.3LC (≈34 µm at 0.2LC and ≈30 µm at 0.3LC). As noted in Section 2.4, these values are semi-quantitative estimates that describe a relative trend rather than absolute cell sizes. The estimated cell size of 0.4LC (≈40 µm) is unreliable because the Al-Fe phases are too fragmented and spheroidized to trace continuous boundaries (Figure 1e).
The refinement trend is attributed to the limited solubility of RE elements in α-Al: excess RE combines with alloying elements (Fe, Si) to form intermetallic compounds [34], which impede cell-boundary migration [35,36] and may serve as heterogeneous nucleation sites. The base-alloy microstructure consists of coarse dendritic gray Al-Fe phases distributed along the eutectic cell boundaries (Figure 1a). With increasing RE addition, the Al-Fe phases are refined, the cells become smaller and more uniform, and Al-RE phases precipitate within the cell interiors (Figure 1b–e).
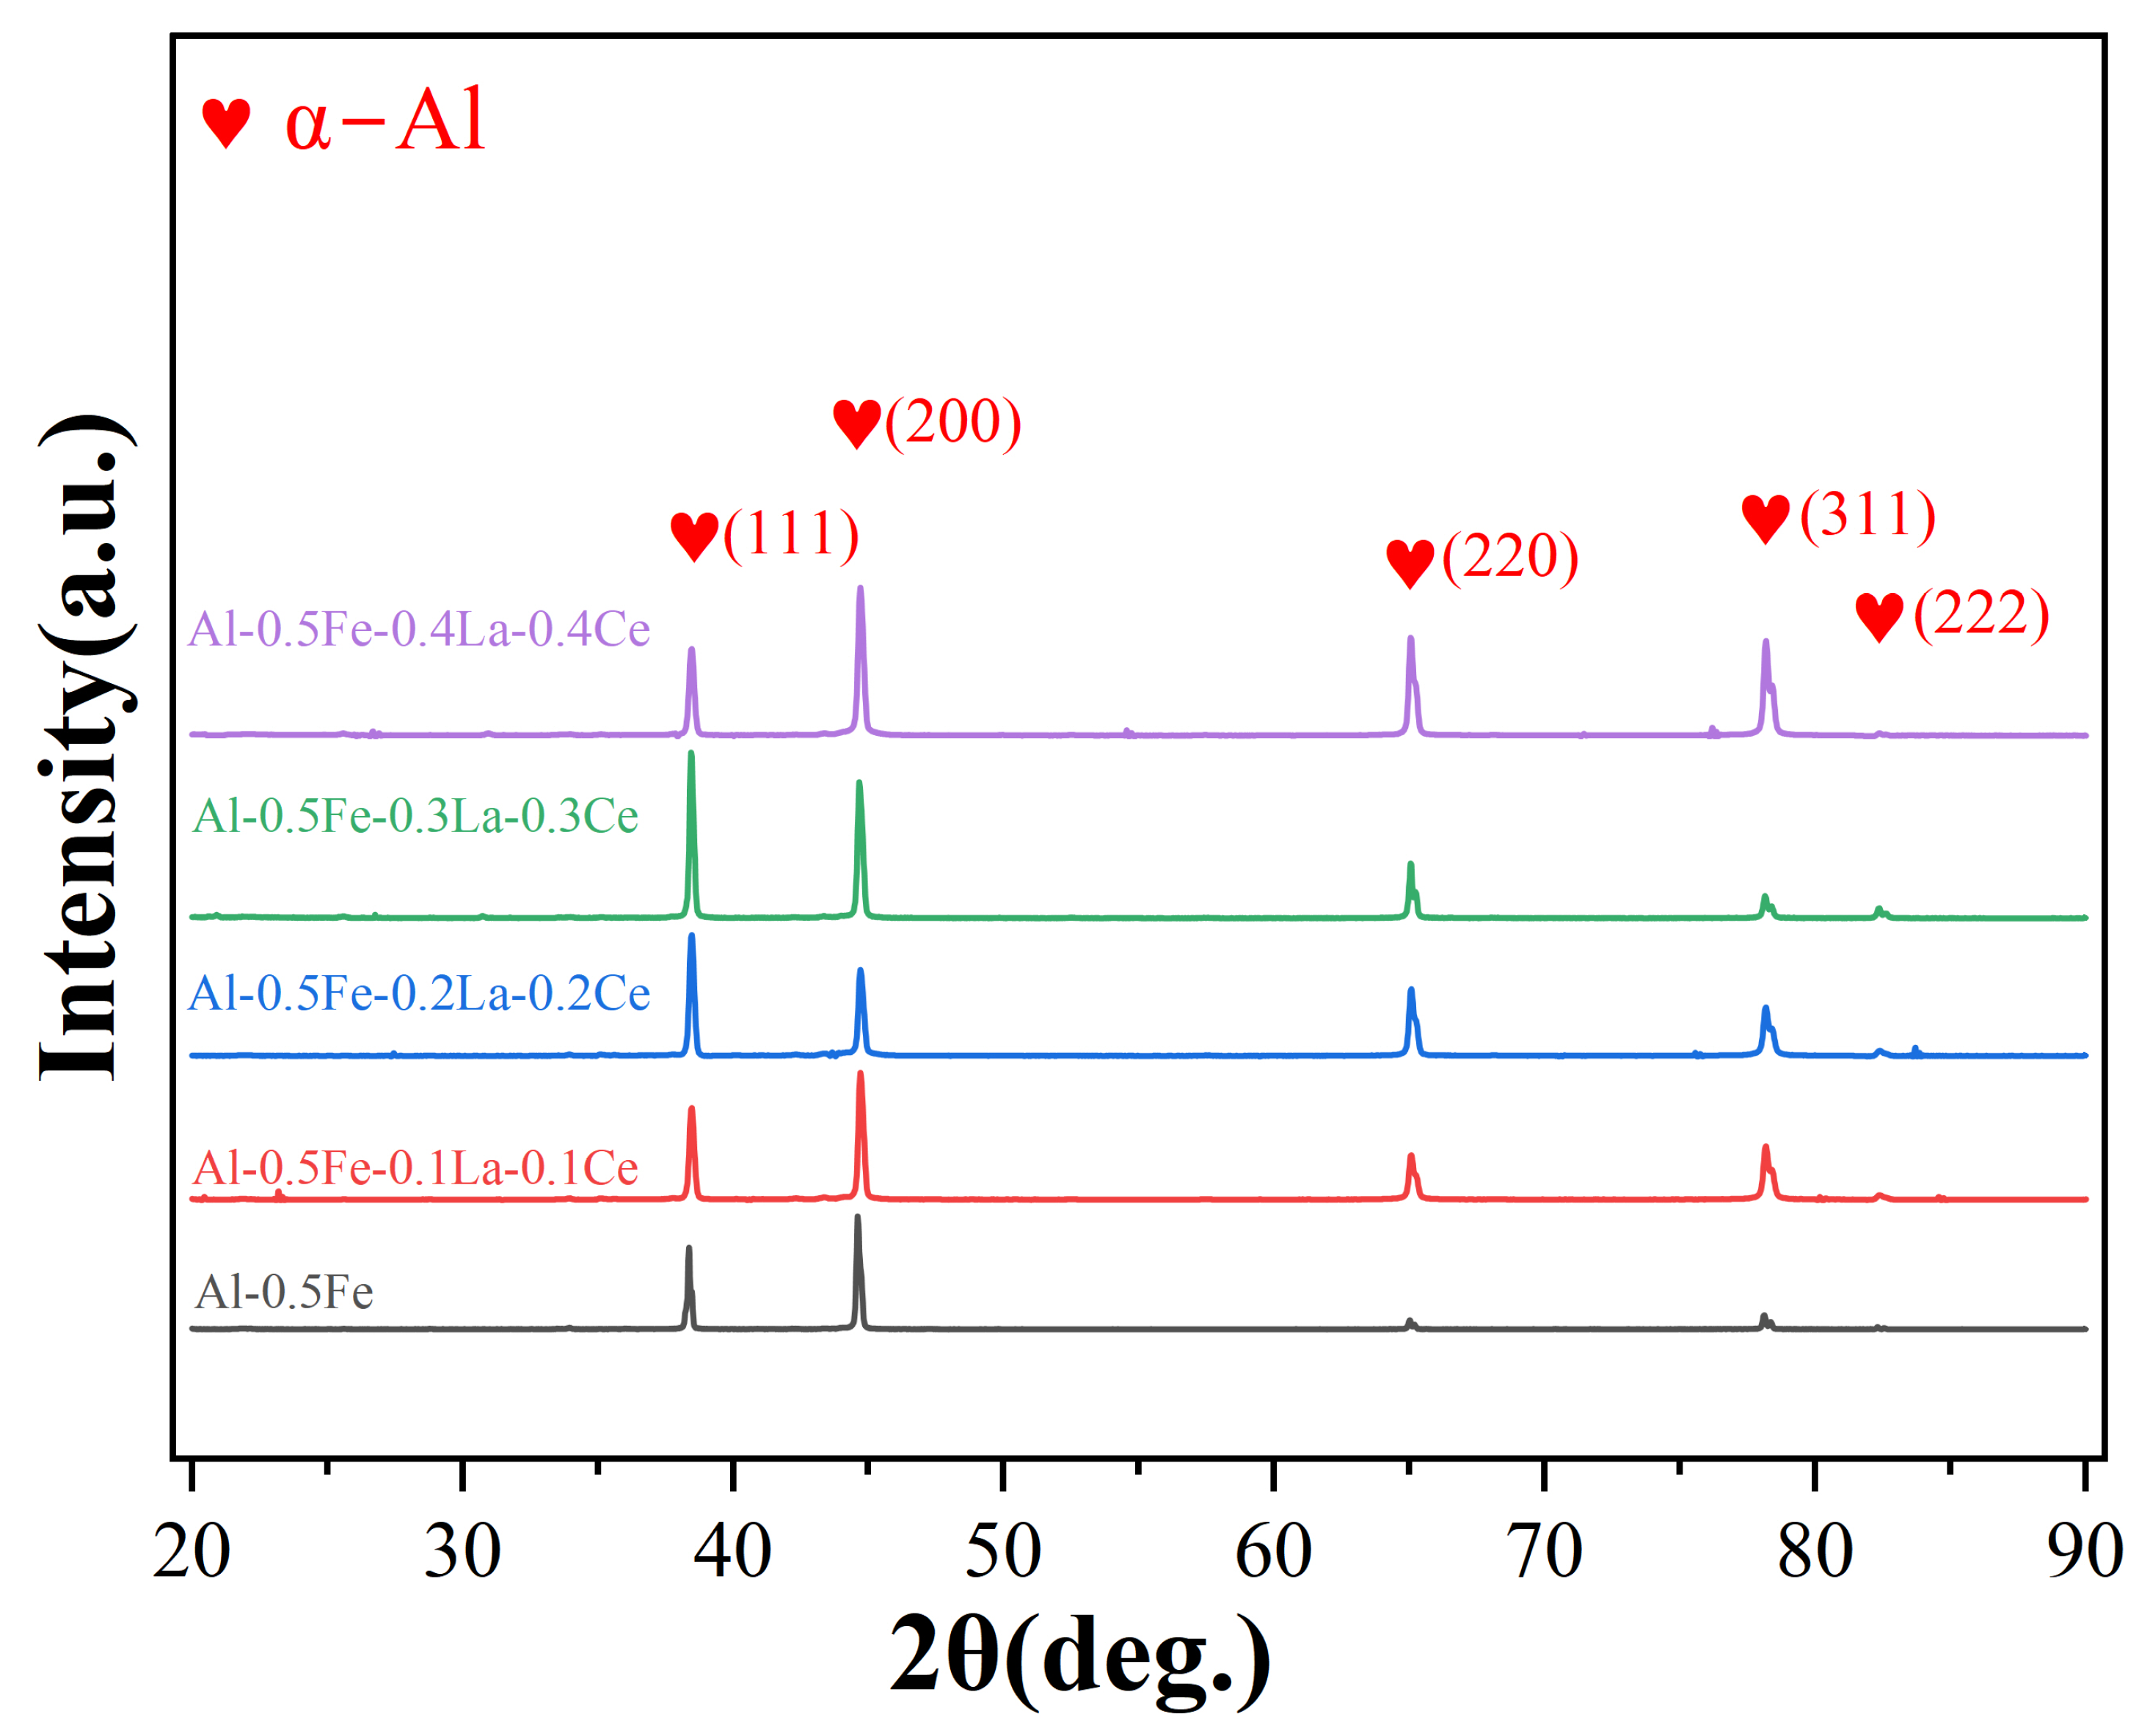
Figure 3 shows the XRD patterns of all five alloys, re-measured for this revision. For every composition, only diffraction peaks of the α-Al solid solution are observed; no peaks attributable to Al-Fe or Al-RE intermetallic phases are detectable, because their volume fractions (<1 vol.%) lie below the detection limit of the instrument. Accordingly, no specific RE-rich phase designations (e.g., Al11La3, Al11Ce3, Al4Ce) are assigned in this work; the presence, morphology, and composition of these phases are established by SEM-EDS (see Section 3.3 and Section 3.4), which provides far higher sensitivity for trace phases. In the magnified (111) region (Figure 3, inset), the peak position shifts systematically to higher 2θ with increasing La/Ce content, indicating lattice contraction. The lattice parameters calculated from Bragg’s law are a = 4.0565 Å for 0LC and a = 4.0532 Å for 0.3LC, the latter approaching that of pure aluminum (a0 = 4.0494 Å). The lattice parameters of all five alloys, derived from the (111) peak positions, are summarized in Table 2. This contraction is consistent with the precipitation of supersaturated solute atoms (Si, Fe) out of the α-Al matrix upon La/Ce addition; its connection to the conductivity improvement is discussed in Section 3.4.
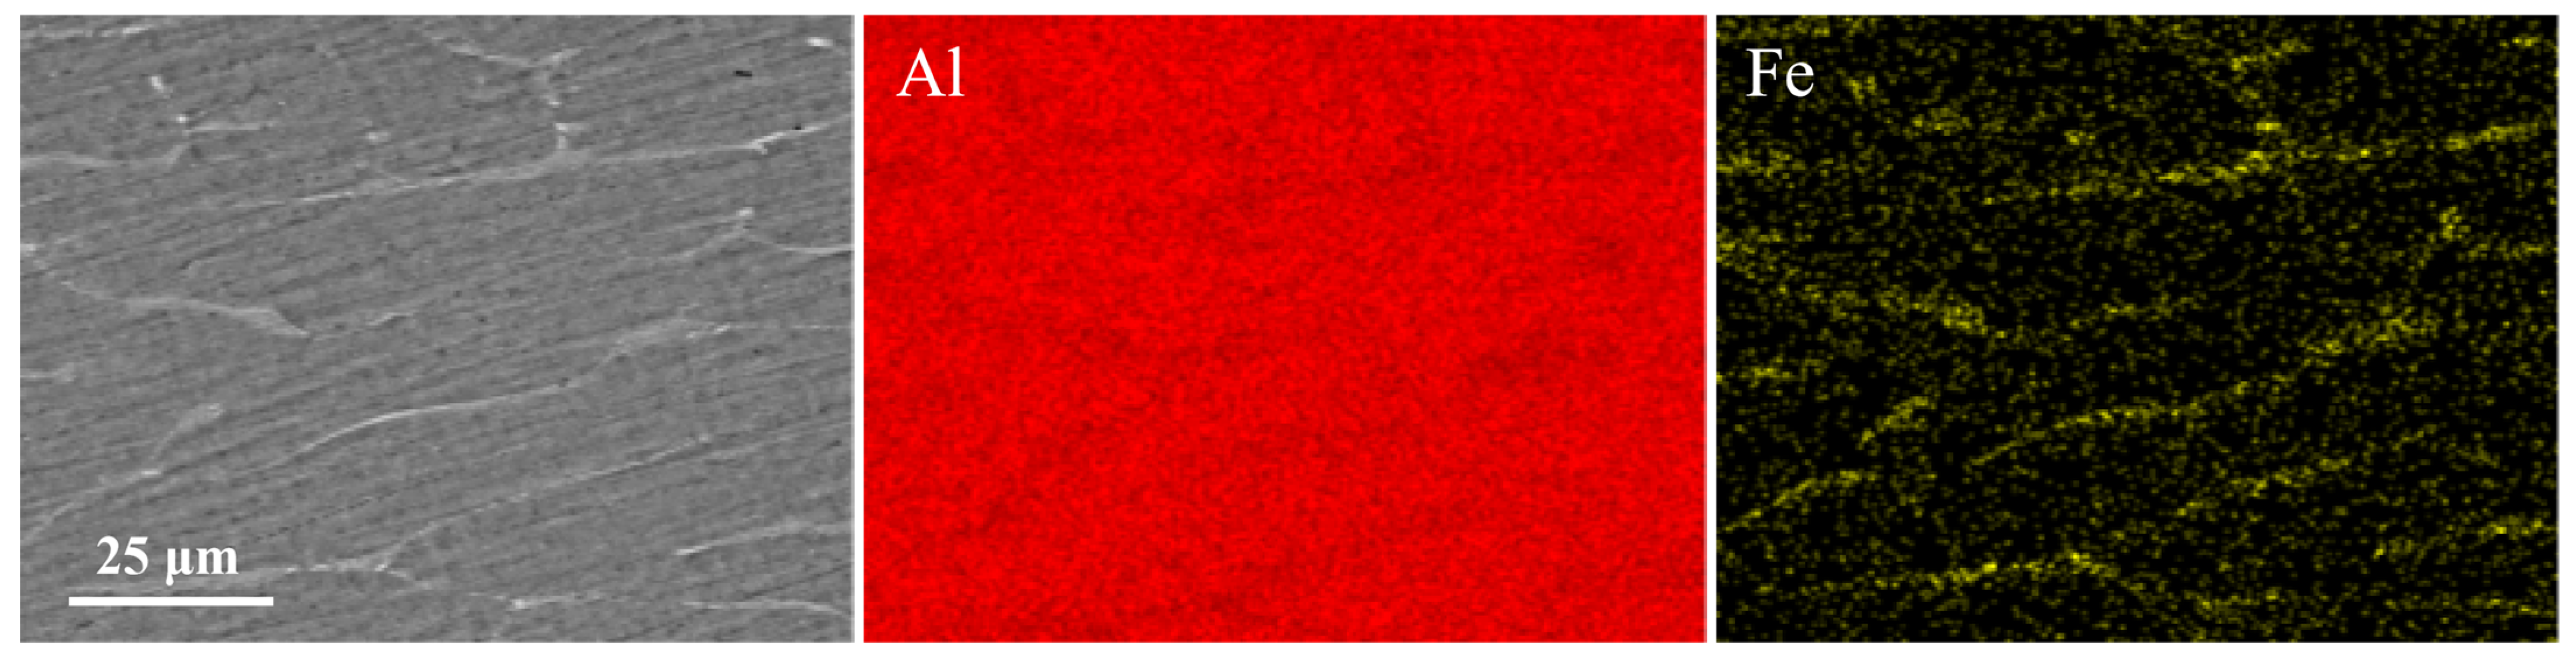
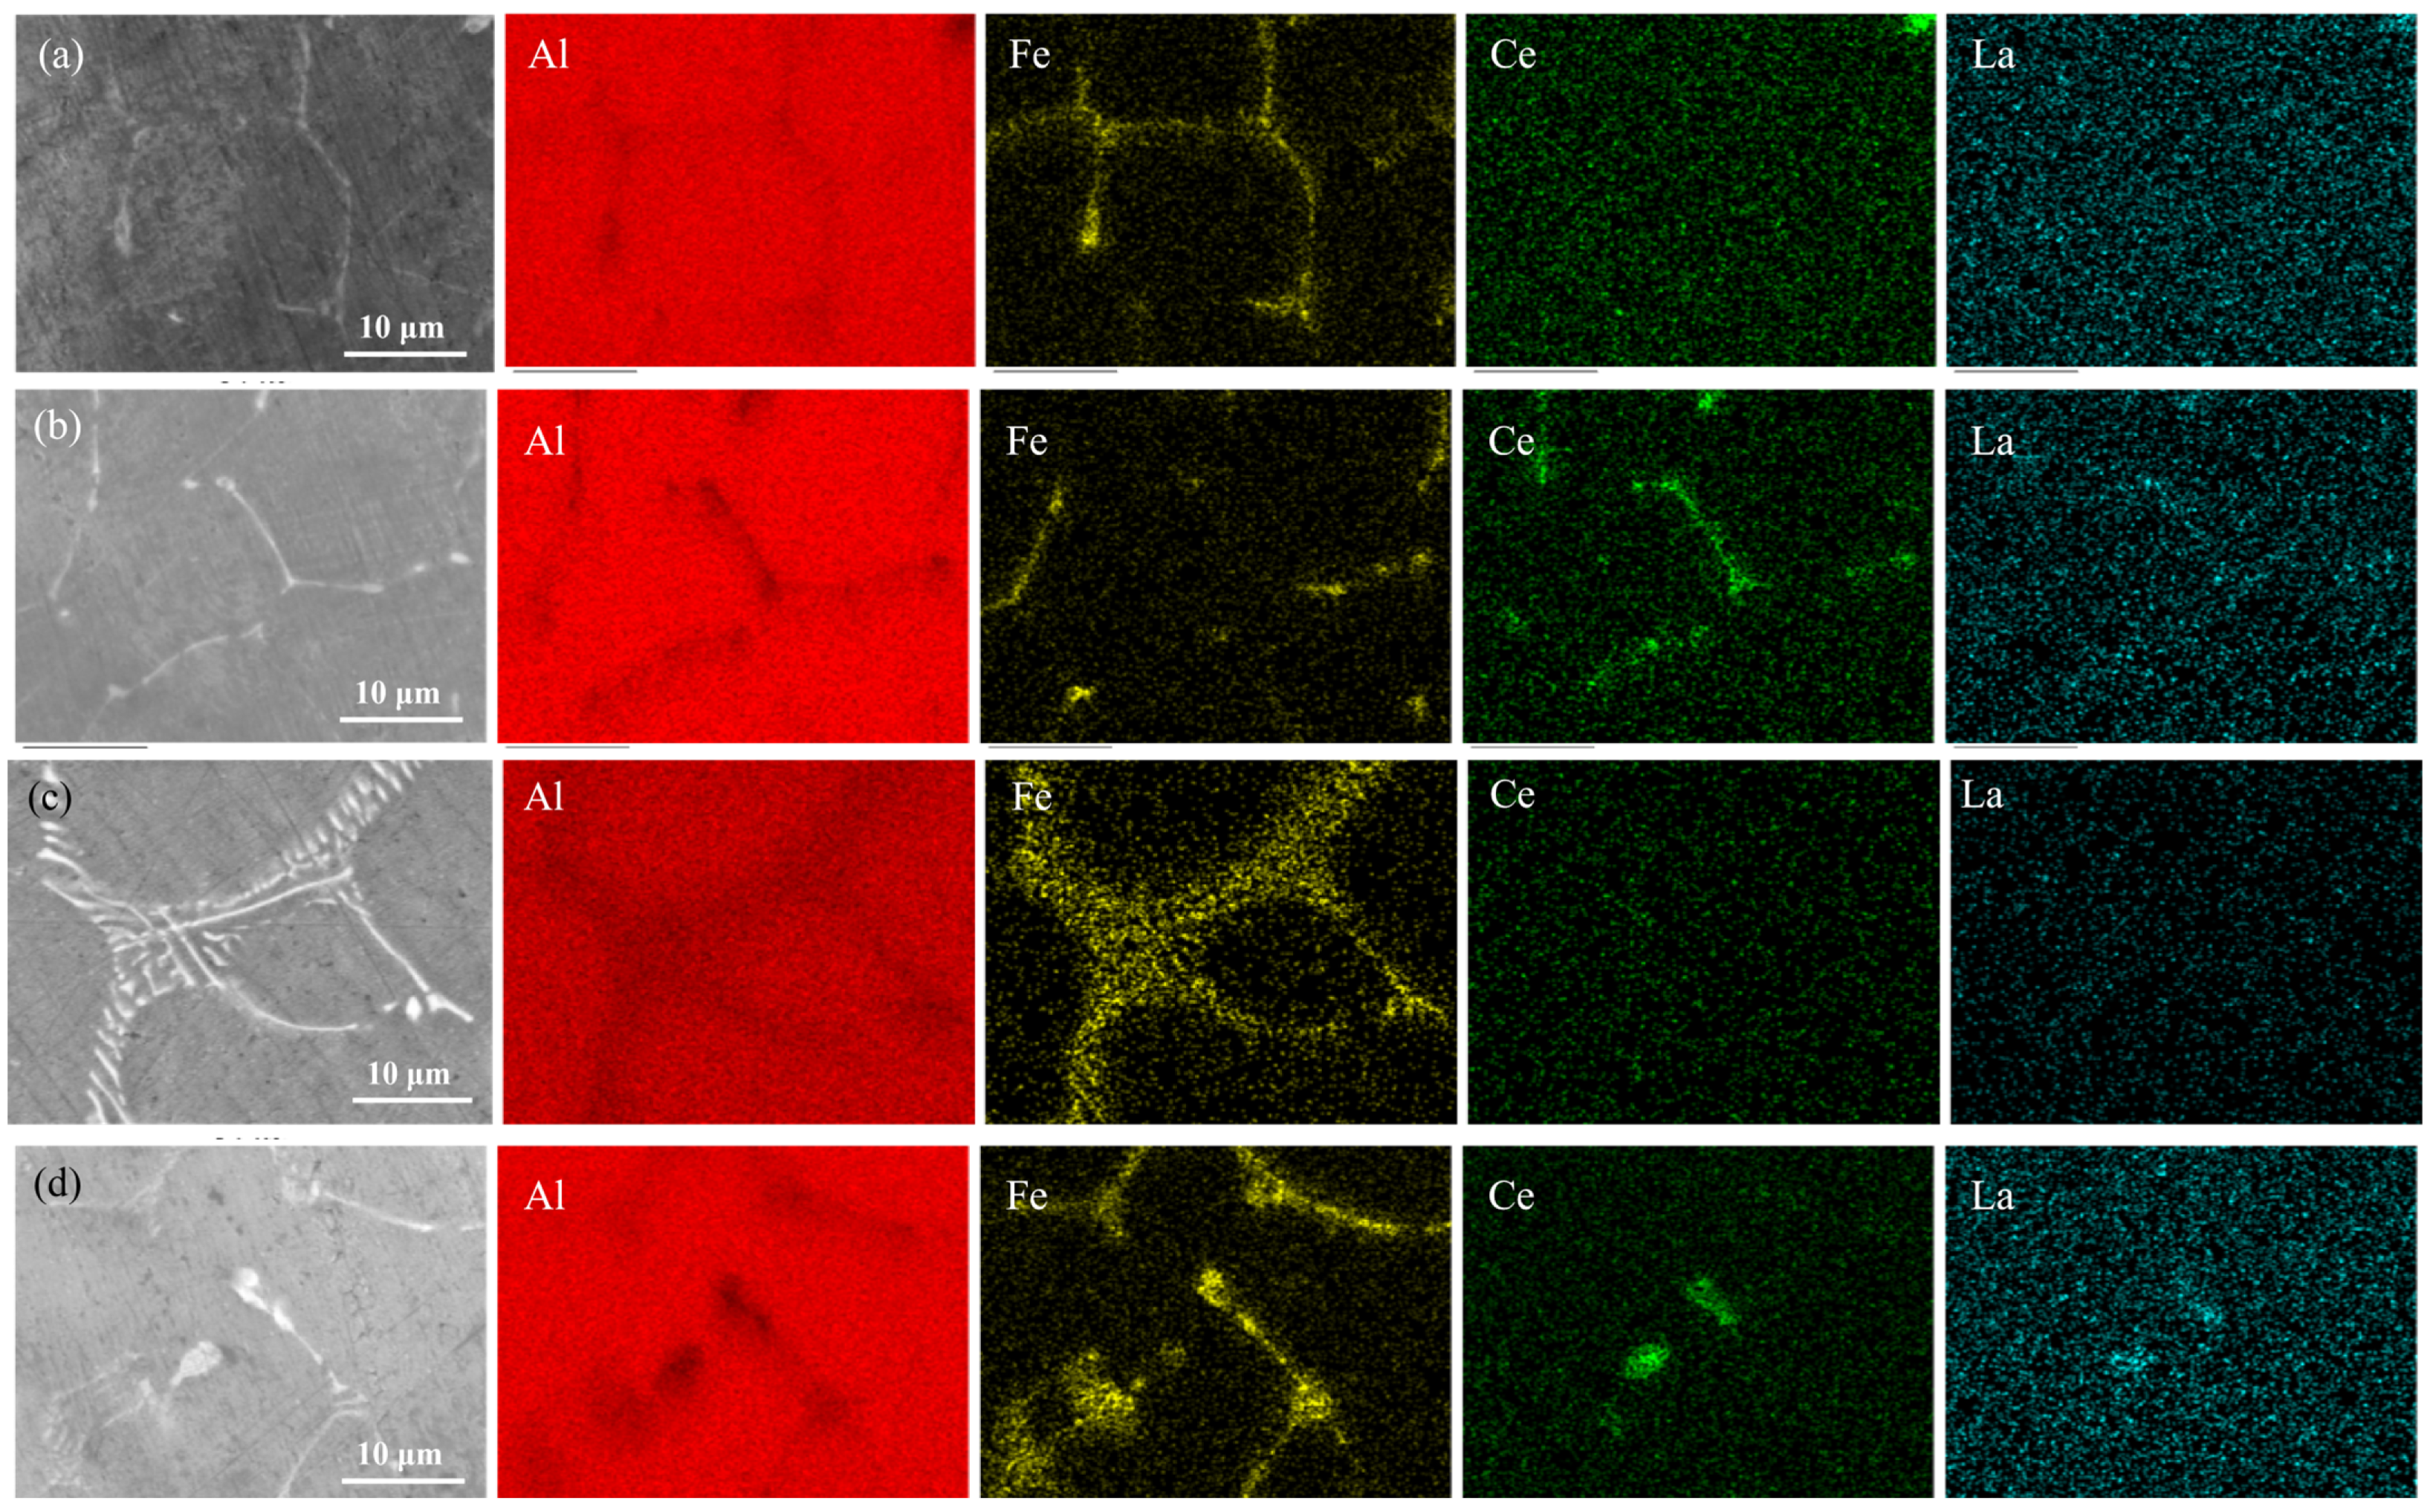
Figure 4 presents the as-cast 0LC alloy and Figure 5 presents all four La/Ce-containing alloys (0.1LC–0.4LC), comparing the elemental distributions obtained by EDS spectrum imaging. In the rare-earth-free alloy (Figure 4), the Fe signal forms a nearly continuous network that coincides with the coarse plate-like Al-Fe phase along the α-Al boundaries, confirming that iron is concentrated in an interconnected intermetallic skeleton. After La/Ce co-doping (Figure 5), the Fe-enriched region is confined to a narrower, partially fragmented trace, indicating that the continuous Al-Fe network has been broken up rather than merely shifted. The La and Ce maps show a fine, relatively uniform dispersion of both elements in the same field, with no coarse RE-rich aggregates detectable at this scale. Because the La and Ce additions are small (0.1–0.4 wt.% each) and their equilibrium solid solubility in α-Al is extremely low [36], the corresponding signals in the maps are intrinsically weak and may locally fall below the detection limit of EDS; where detectable, La and Ce are co-located with Fe at the eutectic cell boundaries, consistent with the reported tendency of La and Ce to segregate to boundary regions together with Fe in dilute aluminum alloys [19,37]. Together with the OM observations in Figure 1, these maps provide direct evidence that equimolar La/Ce co-doping fragments the detrimental Fe-rich network into fine, isolated particles in the as-cast state.
The lattice contraction is already close to saturation at 0.1LC (Δa between 0.1LC and 0.4LC ≤ 0.0005 Å), which is consistent with the very low equilibrium solubility of La and Ce in α-Al: the maximum solid solubility of Ce in aluminum is only about 0.05 wt.% at the eutectic temperature [36], and that of La is comparably small. Even allowing for non-equilibrium solute trapping during mold casting, the α-Al matrix accommodates very few RE atoms. Consequently, 0.1 wt.% La + 0.1 wt.% Ce already suffices to precipitate most of the supersaturated Fe and Si from solid solution; further RE additions mainly increase the amount of Al-RE intermetallic particles without extracting appreciably more solute—a scavenging saturation effect. The lattice parameter therefore approaches that of pure Al at 0.1LC and remains nearly constant thereafter. This interpretation is corroborated by the EDS maps (Figure 4 and Figure 5), which show Fe already redistributed into discrete particles at 0.3LC.
It is further noted that the relative intensity of the (200) reflection exceeds that of (111) in the 0.3LC pattern, whereas (111) is the strongest reflection of randomly oriented FCC aluminum. This inversion indicates a solidification texture in which the <100> direction—the preferred dendrite growth direction in FCC metals [38]—aligns preferentially with the heat-flow direction of the graphite mold. The stronger texture in the RE-containing alloys is attributed to RE enrichment ahead of the solid–liquid interface, which increases constitutional undercooling and stabilizes directional dendritic growth. Similar intensity inversions between the (200) and (111) reflections have been reported in as-cast dilute Al–Ce alloys and in other cast aluminum alloys, where directional heat extraction during mold casting produces a pronounced <100> solidification texture [39,40].

3.2. Mechanical and Electrical Properties

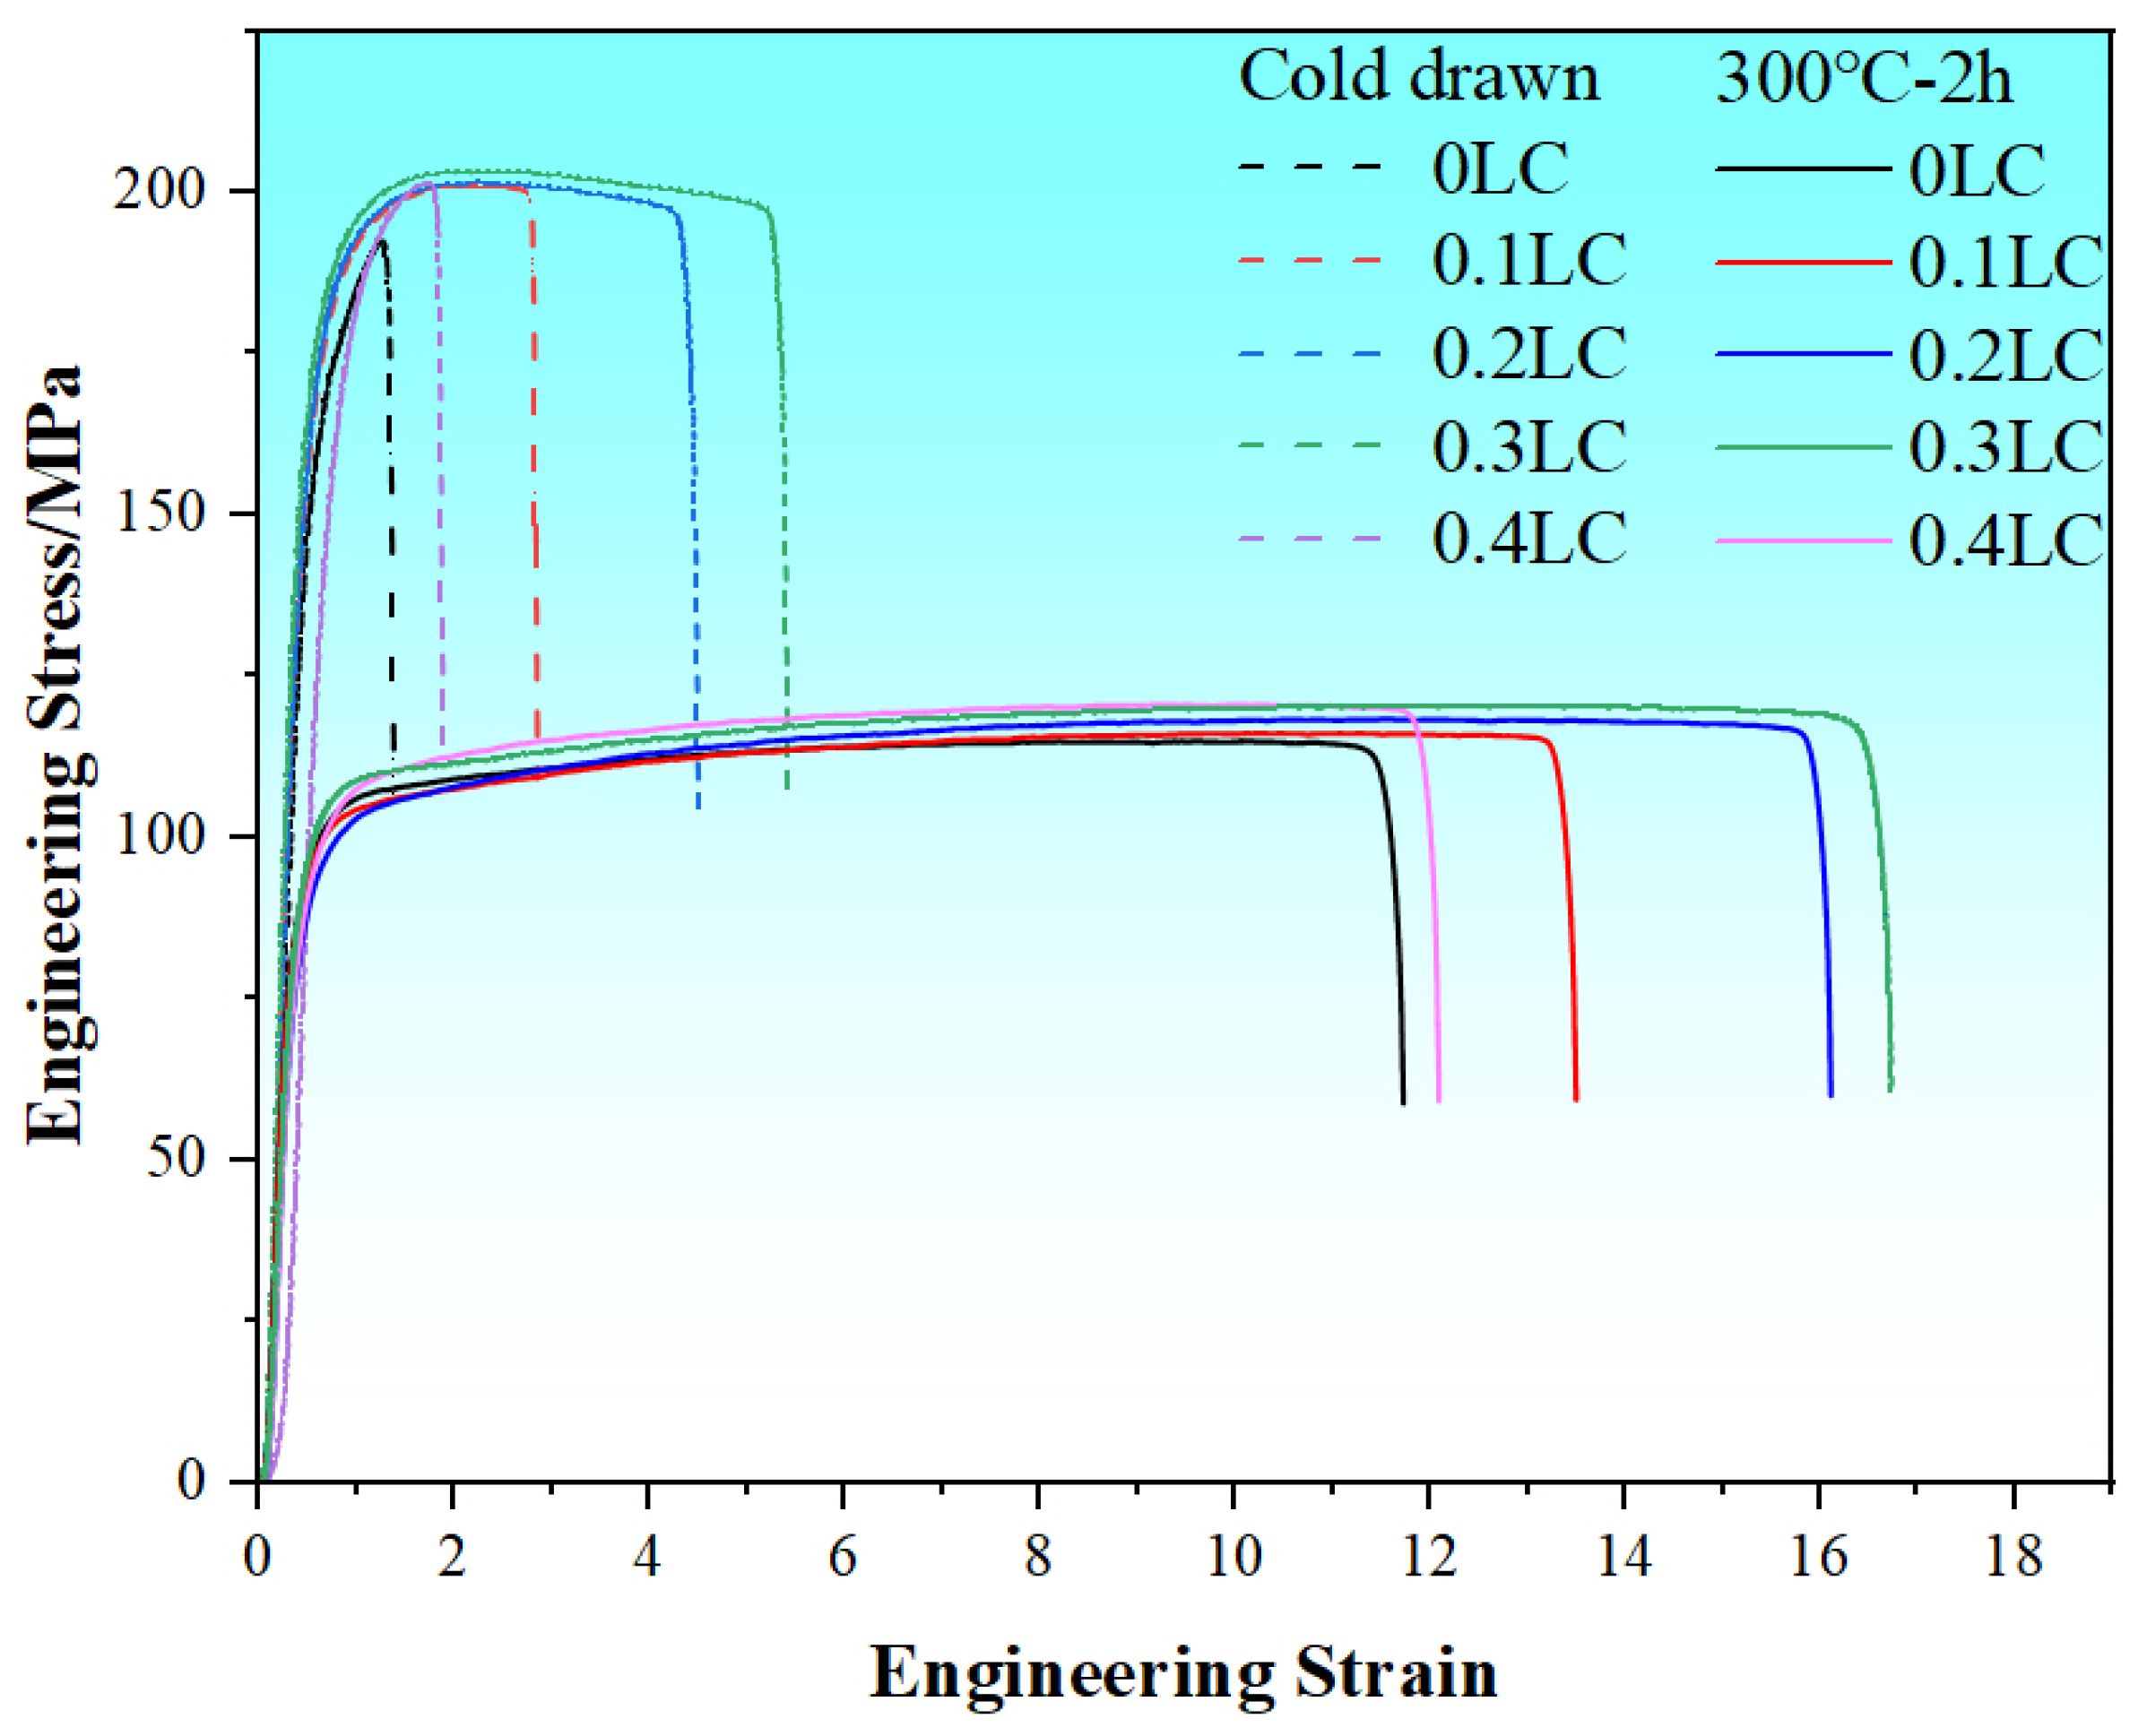
Figure 6 and Table 3 summarize the tensile properties of the five alloys in the cold-drawn condition and after annealing at 300 °C for 2 h. La/Ce doping increases the ultimate tensile strength (UTS) and yield strength (YS) in both states. Elongation first increases and then decreases with increasing La/Ce content: in the annealed state, the peak elongation of 16.7% is achieved at 0.3LC, a 42.7% improvement over the rare-earth-free alloy (11.7%), while UTS is maintained at 120 ± 4 MPa. At 0.4LC, both strength and elongation decline, which is attributed to coarse, brittle Al-RE intermetallic particles that act as stress-concentration sites. For comparison, La/Ce co-doping in Al-Mg-Si alloys was reported to raise the tensile strength by 28.4% relative to La-monodoped alloys [11]; the 42.7% elongation gain obtained here at essentially constant strength compares favorably with reported single-RE and co-doped systems.
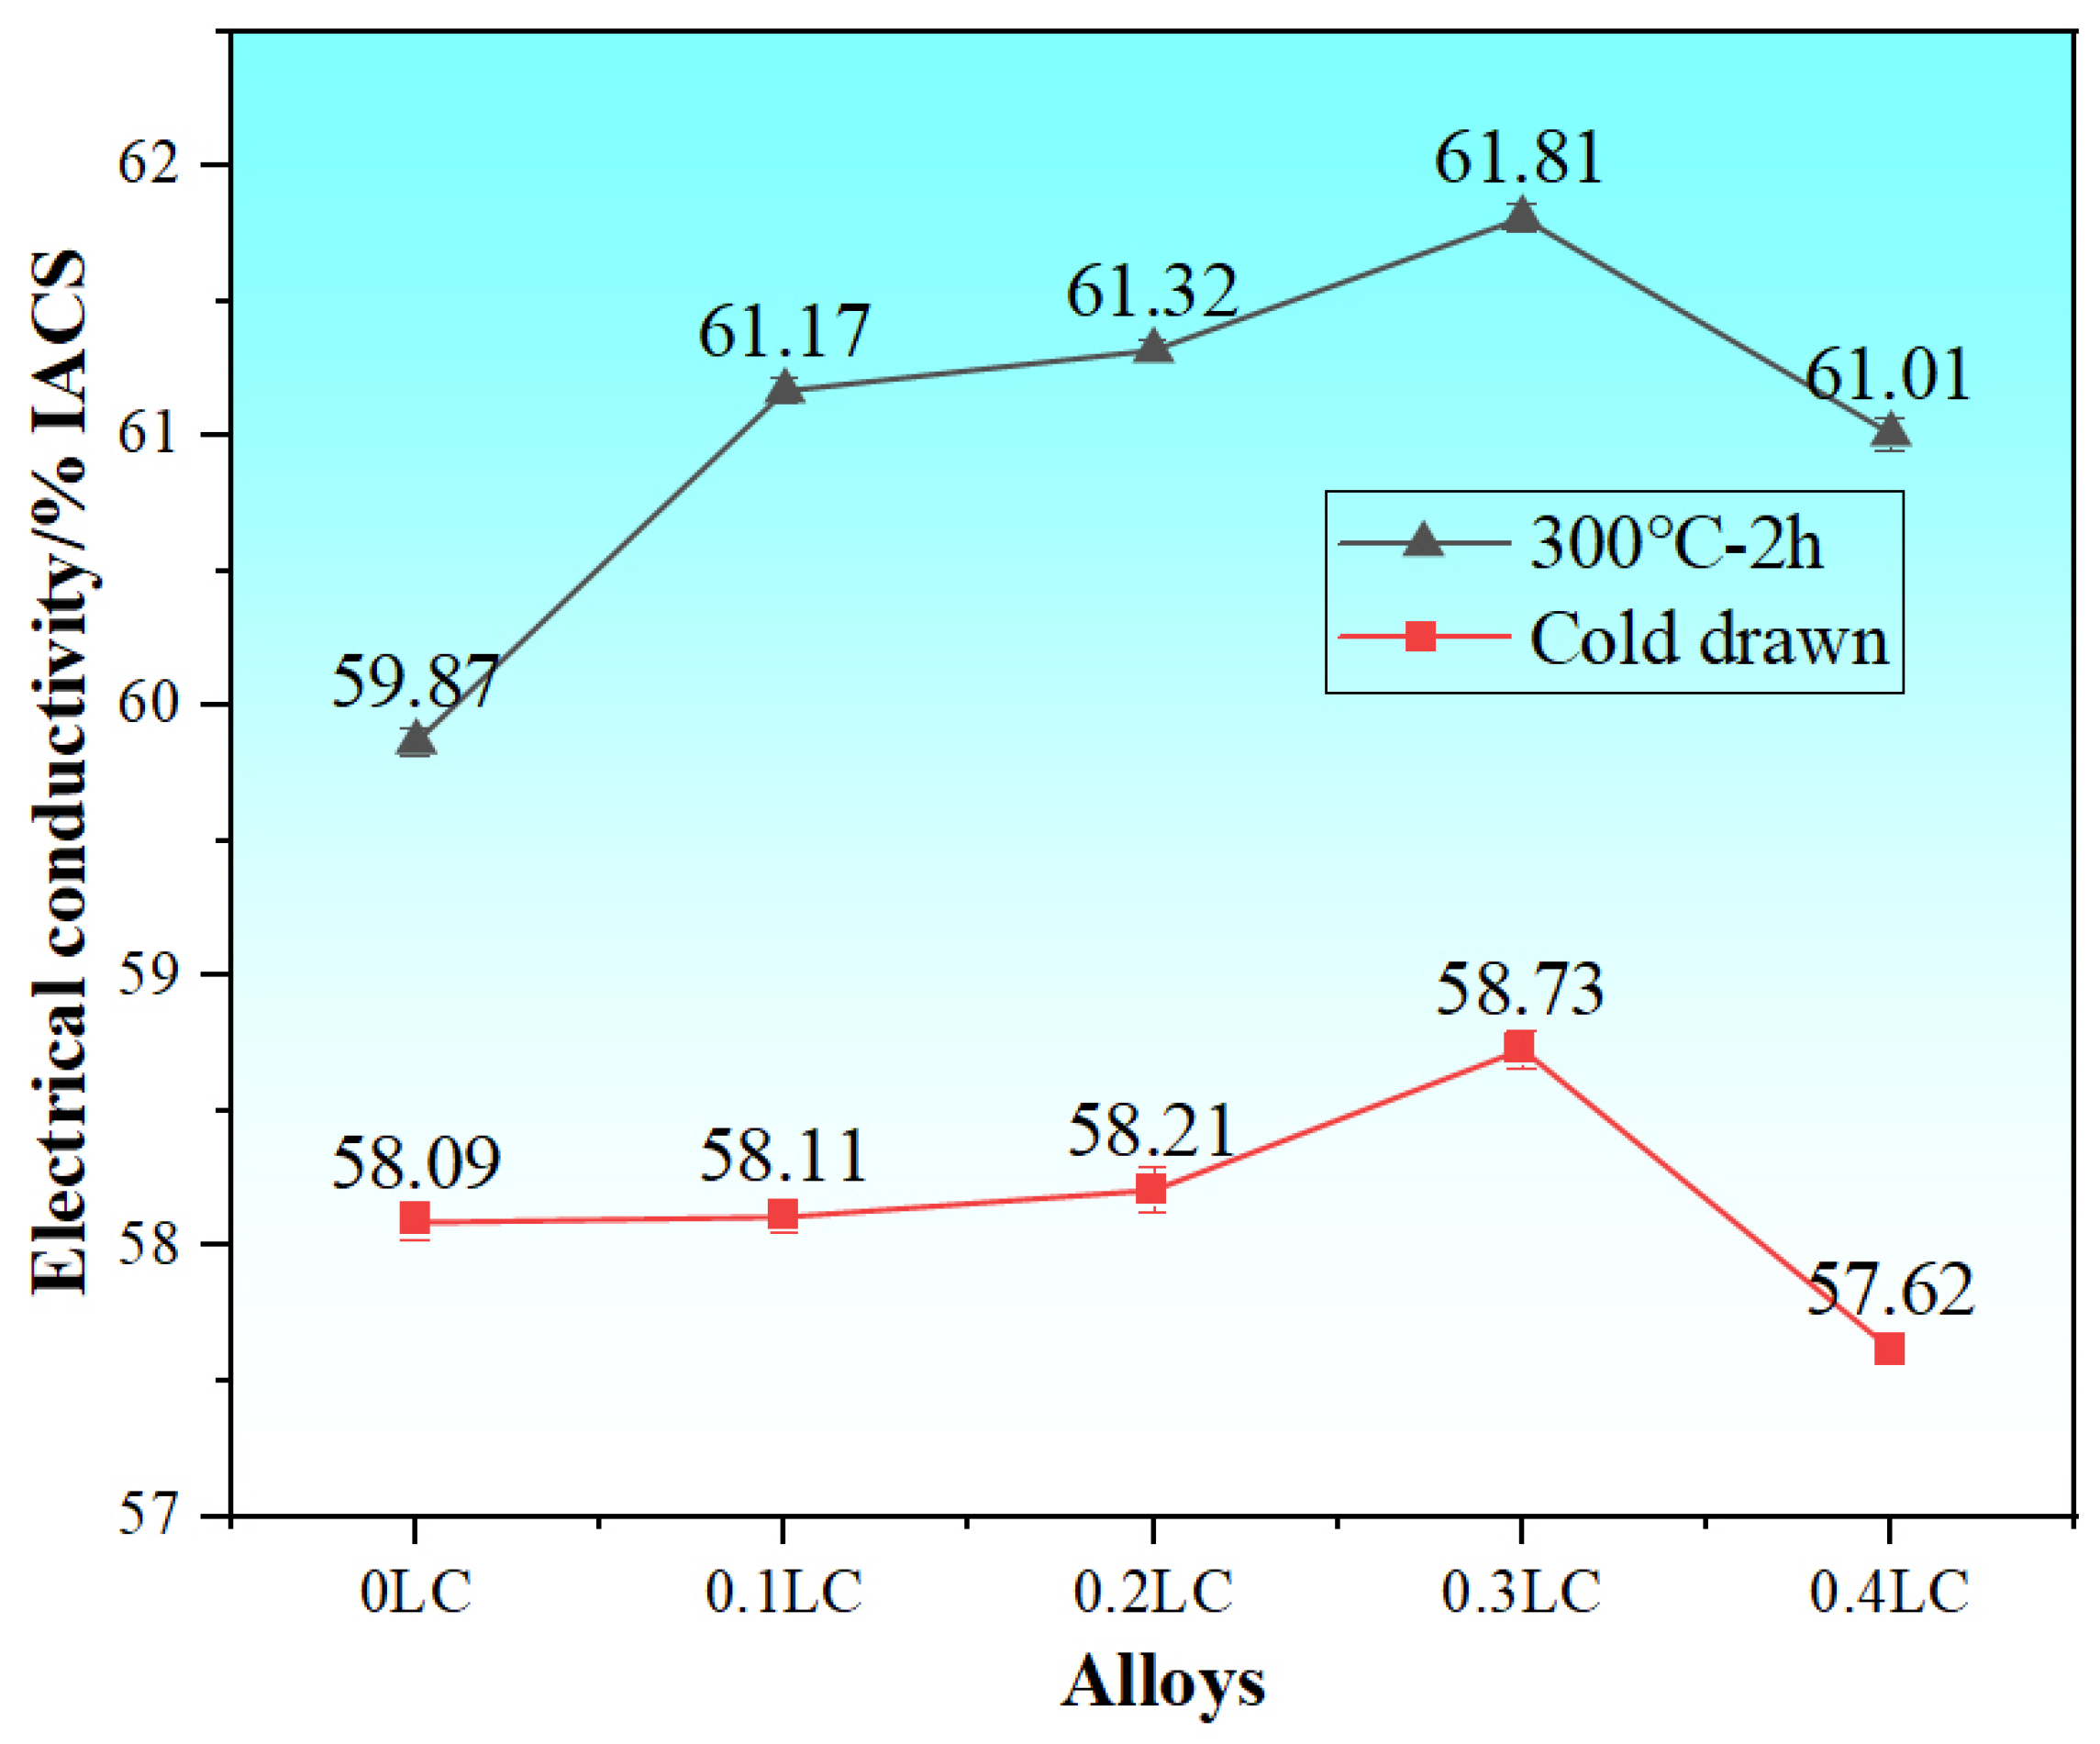
The electrical conductivity (EC) of the annealed wires follows the same initial-increase-then-decrease trend (Figure 7). The base 8176 alloy exhibits 59.87% IACS; with 0.3 wt.% La + 0.3 wt.% Ce the EC rises to 61.81% IACS, an improvement of 1.94% IACS. At 0.4LC the conductivity decreases. Because the scavenging effect already saturates near 0.1LC (Section 3.1), the additional RE at 0.4LC cannot further reduce the solute content of the matrix; instead, part of the excess La and Ce remains dissolved in α-Al and acts as an additional source of solute scattering, while the increased volume fraction of coarse, brittle Al-RE intermetallics (Figure 8e) further disrupts the conduction path [19]. Both effects offset the scavenging benefit and account for the conductivity loss at 0.4LC. The same competition between purification and particle coarsening also explains the loss of ductility at 0.4LC and defines an optimal composition window at 0.3LC (discussed further in Section 3.4).

3.3. Effect of La/Ce Co-Doping on the Mechanical Properties of the Alloy

In Al-Fe alloys, iron-rich intermetallic phases act as preferential sites for crack initiation, elevating the material’s brittleness during tensile deformation. RE additions modify the morphology, size, and distribution of these detrimental phases through the formation of Al-RE eutectic structures, which shifts the solidification behavior and refines the eutectic cells. Grain refinement by RE elements is ascribed to two mechanisms: (i) high-melting-point Al-RE intermetallics acting as potent nucleation sites for α-Al, and (ii) segregation of the larger RE atoms (La: 0.188 nm; Ce: 0.182 nm; cf. Al: 0.143 nm) at grain boundaries, which hinders grain growth. By inhibiting the diffusion of impurity elements (Fe, Si) in the aluminum matrix, these RE-enriched atomic segregation layers at the grain boundaries and α-Al/Al-Fe interfaces lower the solute concentration in the liquid phase and diminish the thermal gradient between dendrite tips and roots, thereby suppressing dendritic growth. The enhanced mechanical properties are principally attributed to RE-induced grain refinement, supported by Ce’s high reactivity, which breaks up iron-rich phase clusters, and by the favorable interfacial characteristics of the second-phase particles within the α-Al matrix [41].
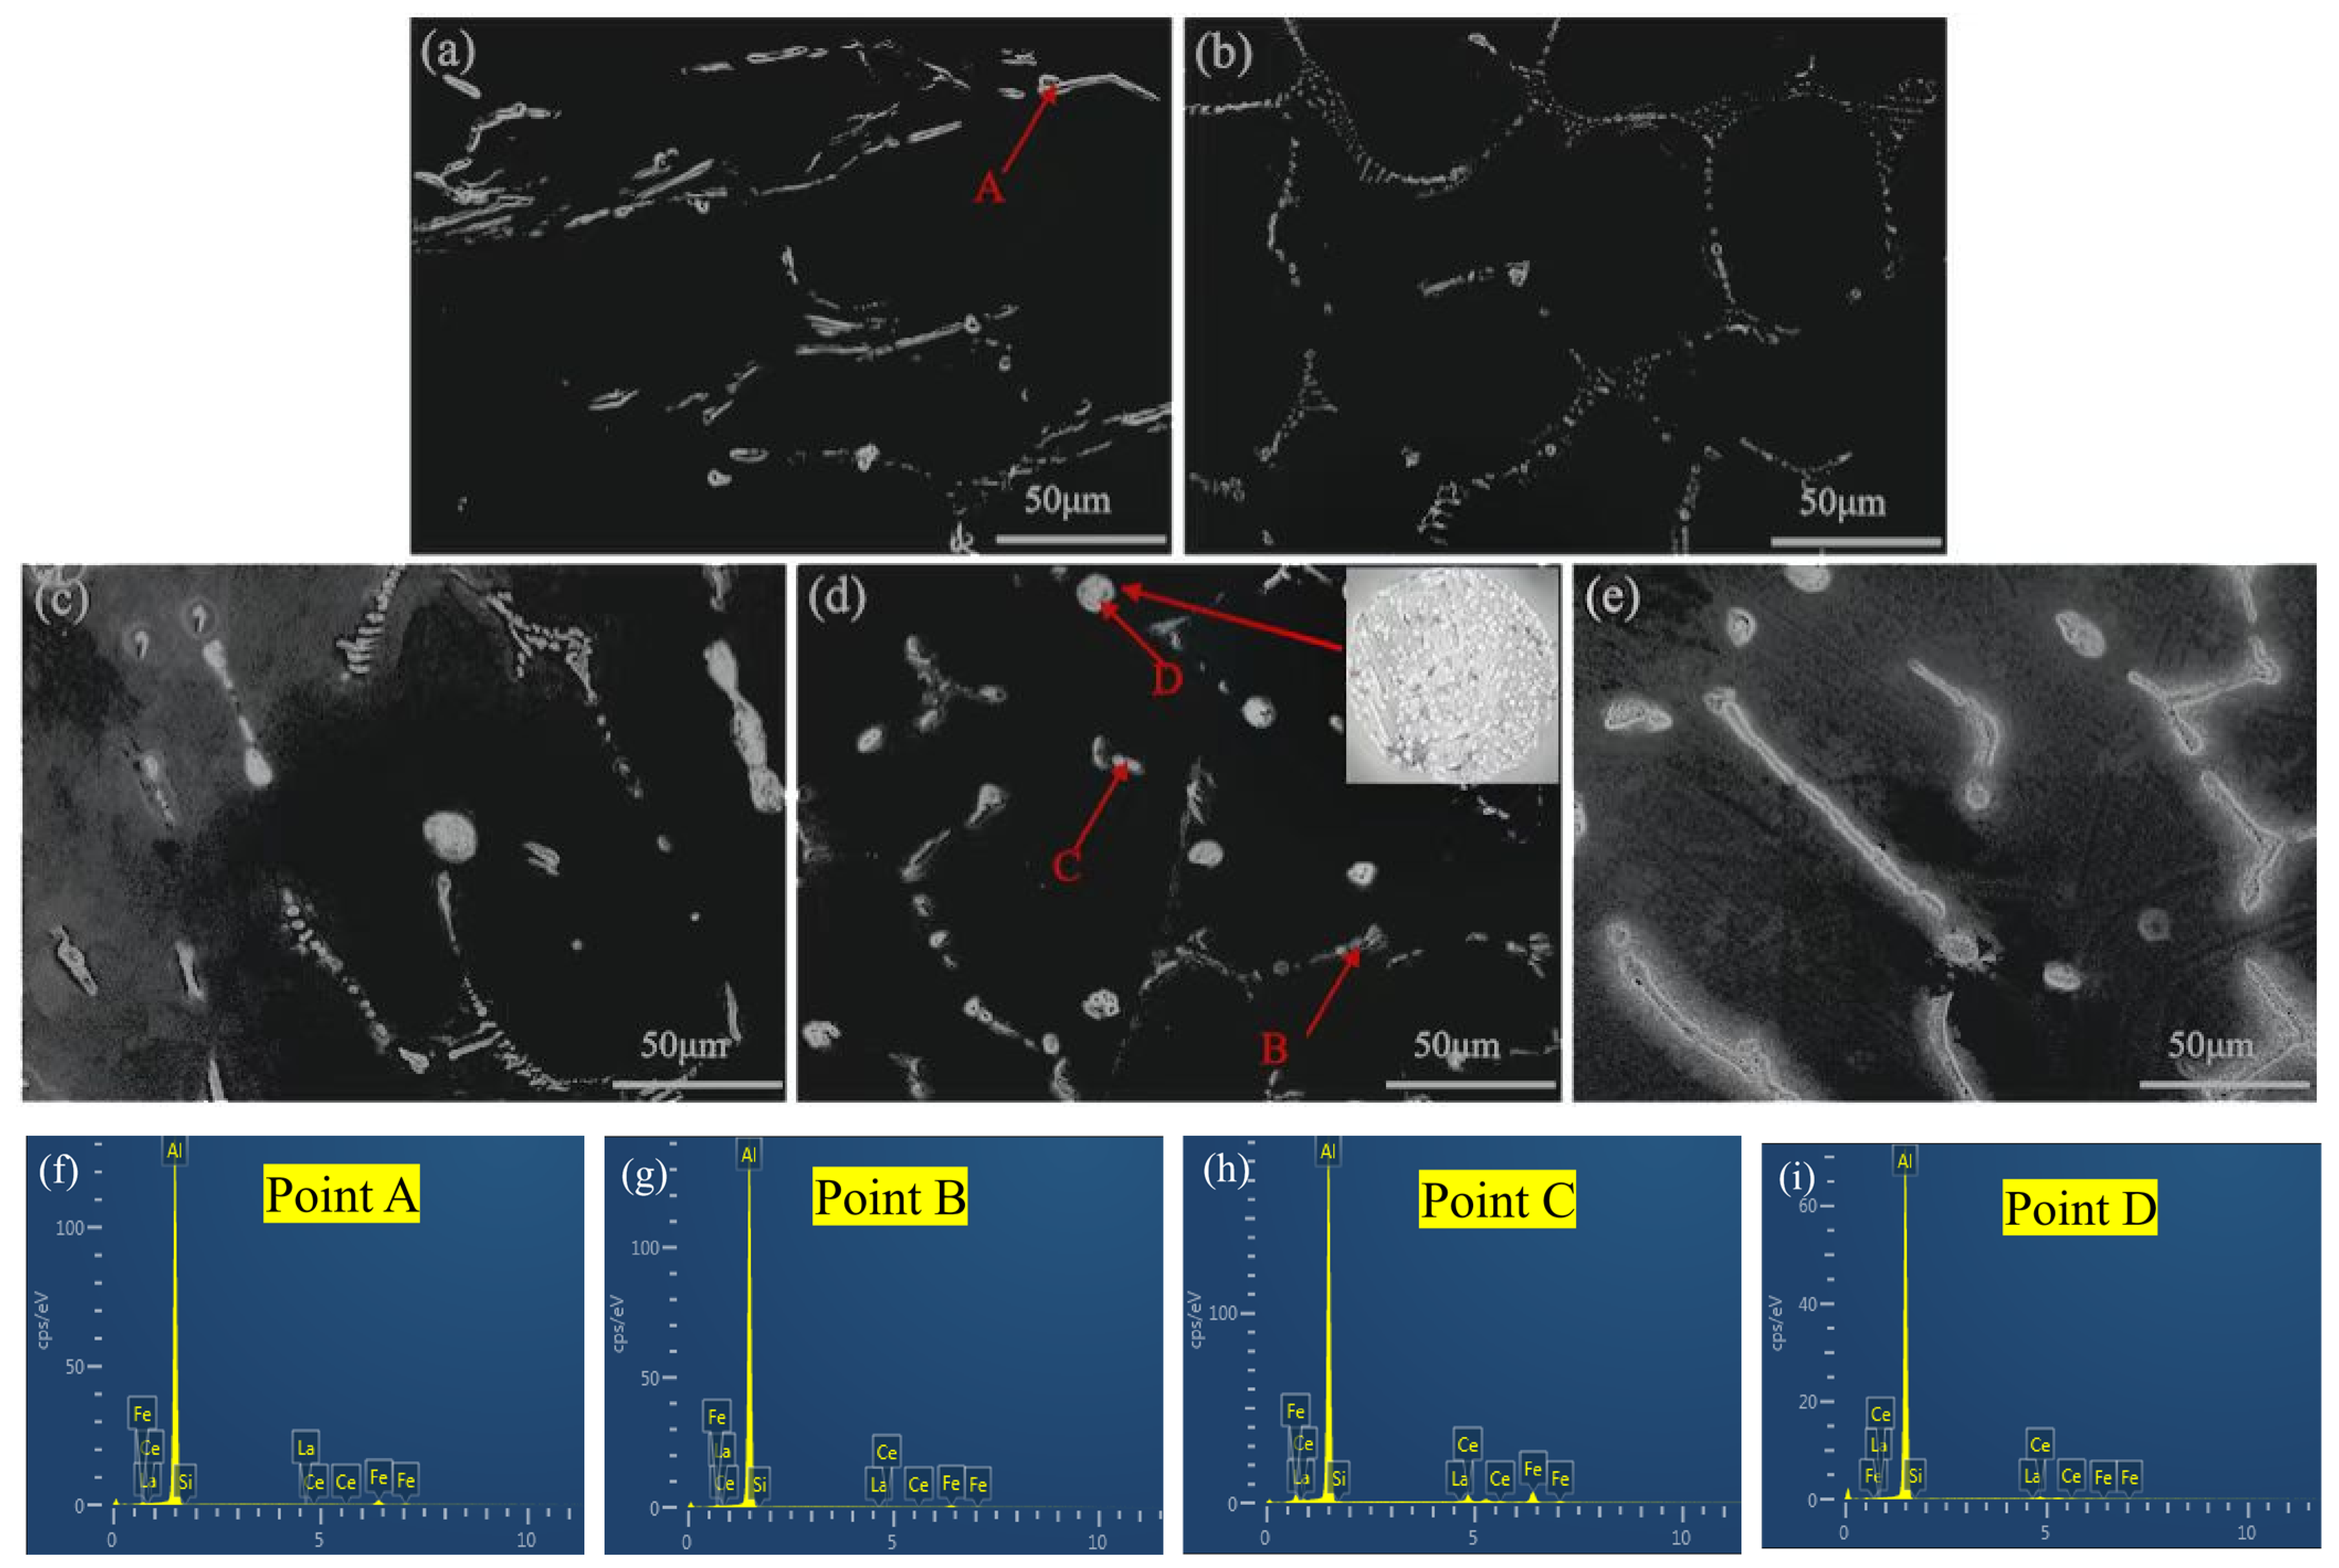
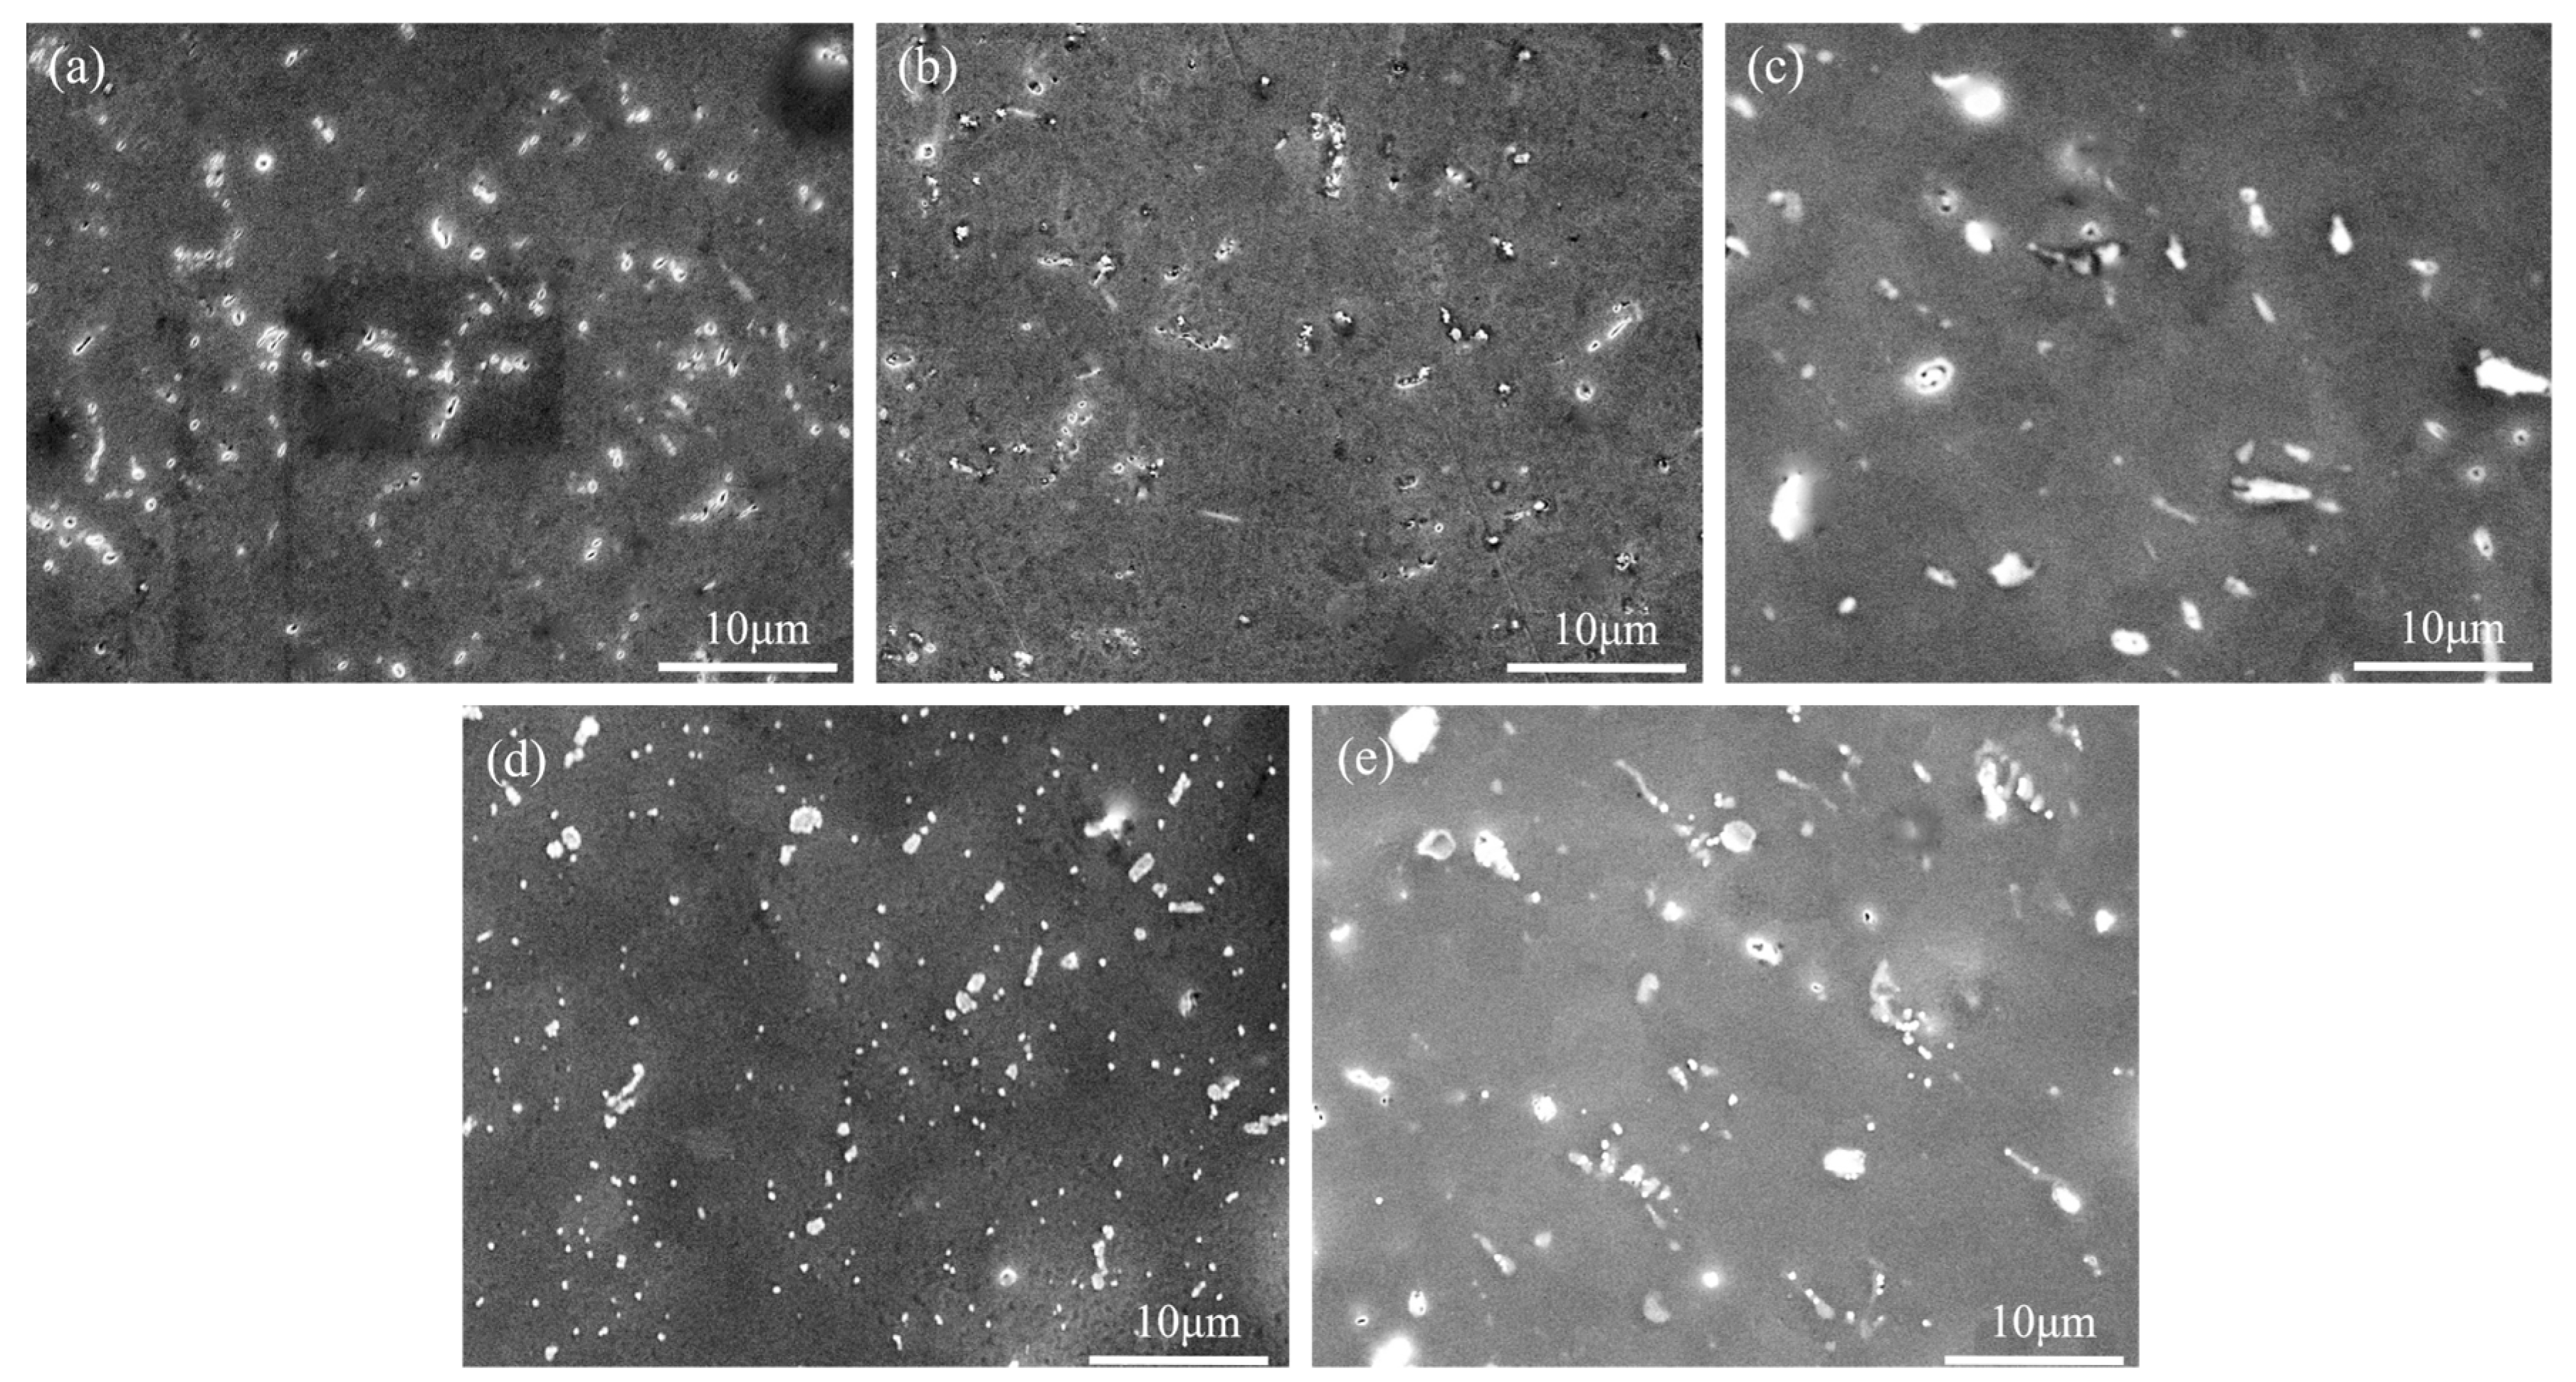
SEM examination (Figure 8) reveals that the Al-Fe phase in 0LC exhibits a feather-like morphology. La/Ce additions break this phase into short rod-like or strip-like precipitates distributed along grain boundaries, together with a sparse dispersion of spherical Al-RE particles within the grains (Figure 8d). The spherical particles exhibit a layered structure with a high degree of interconnectivity. The interfacial mismatch between Al-RE phases and the α-Al matrix is below 5%, so they can serve as heterogeneous nucleation substrates for α-Al and refine the grain structure [42]. In line with current best practice for SEM-EDS, the chemical redistribution discussed in this work is established by spectrum imaging (elemental mapping; Figure 4 and Figure 5), whereas the point analyses in Figure 8f–i are retained only as semi-quantitative corroboration of individual particles and represent local compositions rather than the bulk alloy; given the approximately 1 at.% accuracy limit of SEM-EDS, these values are not used for any quantitative conclusion. The absence of detectable La/Ce in 0.1LC (Figure 8g) reflects the sparseness of RE-rich particles at this low addition level, while the particle-to-particle variation at 0.3LC and 0.4LC reflects the compositional heterogeneity of the intermetallics and the beam position within coarse particles. For the 0.2LC–0.4LC alloys, the spectra confirm the co-existence of La and Ce with Fe and Si within the same particles.
La/Ce co-doping shows a distinct co-precipitation tendency in aluminum alloys: La and Ce initially co-segregate at preferential sites within the α-Al lattice before forming a single co-precipitated phase [11]. This behavior can be explained by electronegativity differences. The electronegativity values of Al, Fe, La, Ce, and Si are 1.61, 1.83, 1.10, 1.12, and 1.90, respectively, and a greater difference generally promotes intermetallic compound formation. La and Ce participate in the formation of multimetallic compounds with Fe and Si (Figure 8f–i); because the electronegativity differences between these element pairs are all below 1.7, their chemical bonds are predominantly covalent. The formation of RE-rich phases indicates that La and Ce preferentially bind Fe and Si impurities into more stable intermetallic compounds, which provides the microstructural basis of the scavenging pathway proposed in Section 1. Because La and Ce co-segregate and co-precipitate as bonded clusters, they interact with Fe atoms as coherent atomic ensembles rather than as isolated atoms [11]. Whether this constitutes true synergy—a combined effect exceeding the sum of the individual effects—cannot be determined from the present equimolar series alone; the required single-RE control experiments are identified as future work (Section 4).
Figure 9 shows the SEM morphologies of the La/Ce co-doped alloy wires after annealing at 300 °C for 2 h. An appropriate La/Ce addition promotes the precipitation of fine granular secondary phases (Figure 9d); such finely dispersed particles contribute to grain refinement and matrix strengthening. In both cold-drawn and annealed conditions, the La/Ce-containing alloys outperform the rare-earth-free alloy. During extrusion and drawing, the coarse intermetallics are fragmented into fine, dispersed particles that strengthen the alloy by impeding dislocation glide and grain-boundary migration; the Al-RE dispersoids additionally contribute to precipitation hardening. The strength decrease after annealing is mainly attributed to recovery and recrystallization—dislocation rearrangement and annihilation, nucleation of recrystallized grains, and subsequent grain growth; after 2 h at 300 °C, the alloy retains a partially deformed microstructure, and strain hardening remains the primary source of residual strength.
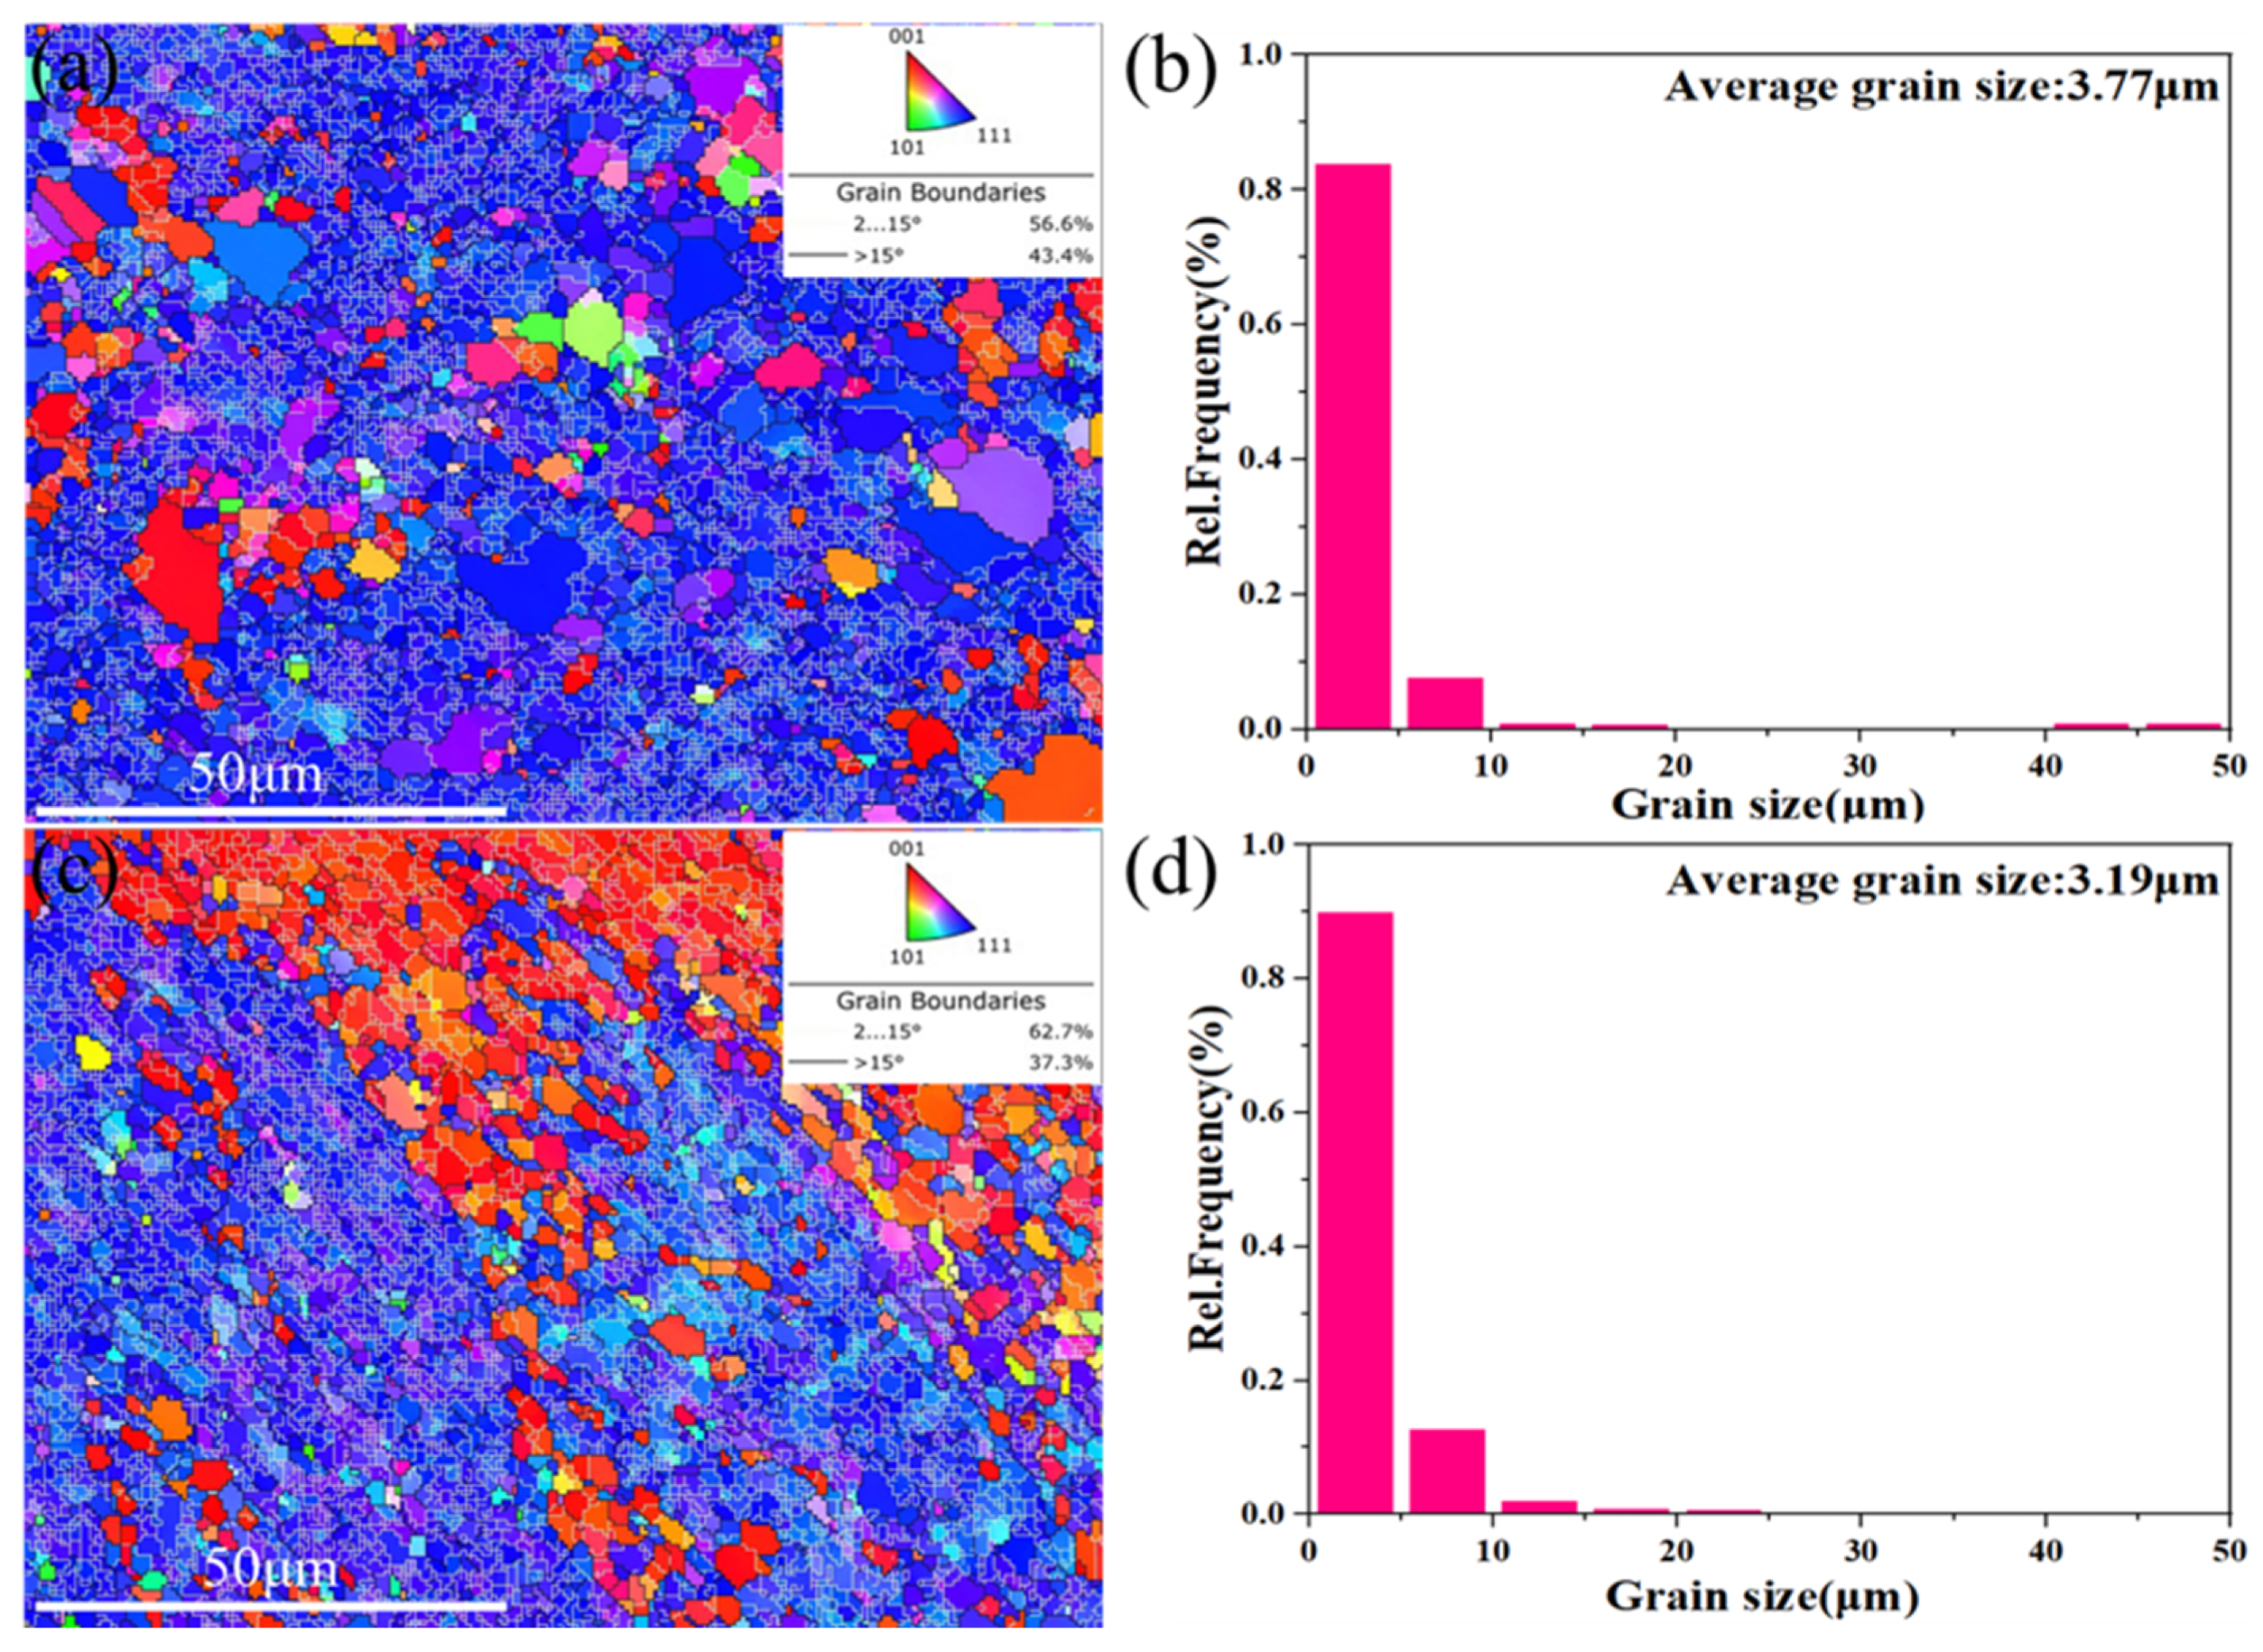
EBSD analysis of the annealed wires (Figure 10) shows that La/Ce additions improve microstructural homogeneity after annealing. HAGBs were defined as misorientations of 15° or greater and LAGBs as misorientations between 2° and 15°; the white lines in the grain-boundary maps represent LAGBs and the black lines represent HAGBs. The LAGB fraction increases from 56.6% (0LC) to 62.7% (0.3LC). Local microstructural heterogeneity in partially recrystallized aluminum typically introduces a variation of several percentage points in the LAGB fraction measured at different locations [42,43], so this difference is interpreted as a trend rather than a statistically resolved quantity. Its significance rests instead on the convergence of independent observations from the same maps: the rare-earth-free alloy exhibits abnormal grain growth after annealing, whereas the La/Ce-doped alloy retains a finer and more uniform structure together with a higher LAGB fraction and a higher average KAM (Figure 11). The consistent direction of all three indicators supports resistance to recrystallization in 0.3LC, in line with the observed strength retention after annealing. Such resistance to recrystallization is typical of RE-microalloyed aluminum alloys, in which thermally stable RE-bearing dispersoids exert strong Zener pinning on grain and subgrain boundaries [44,45].
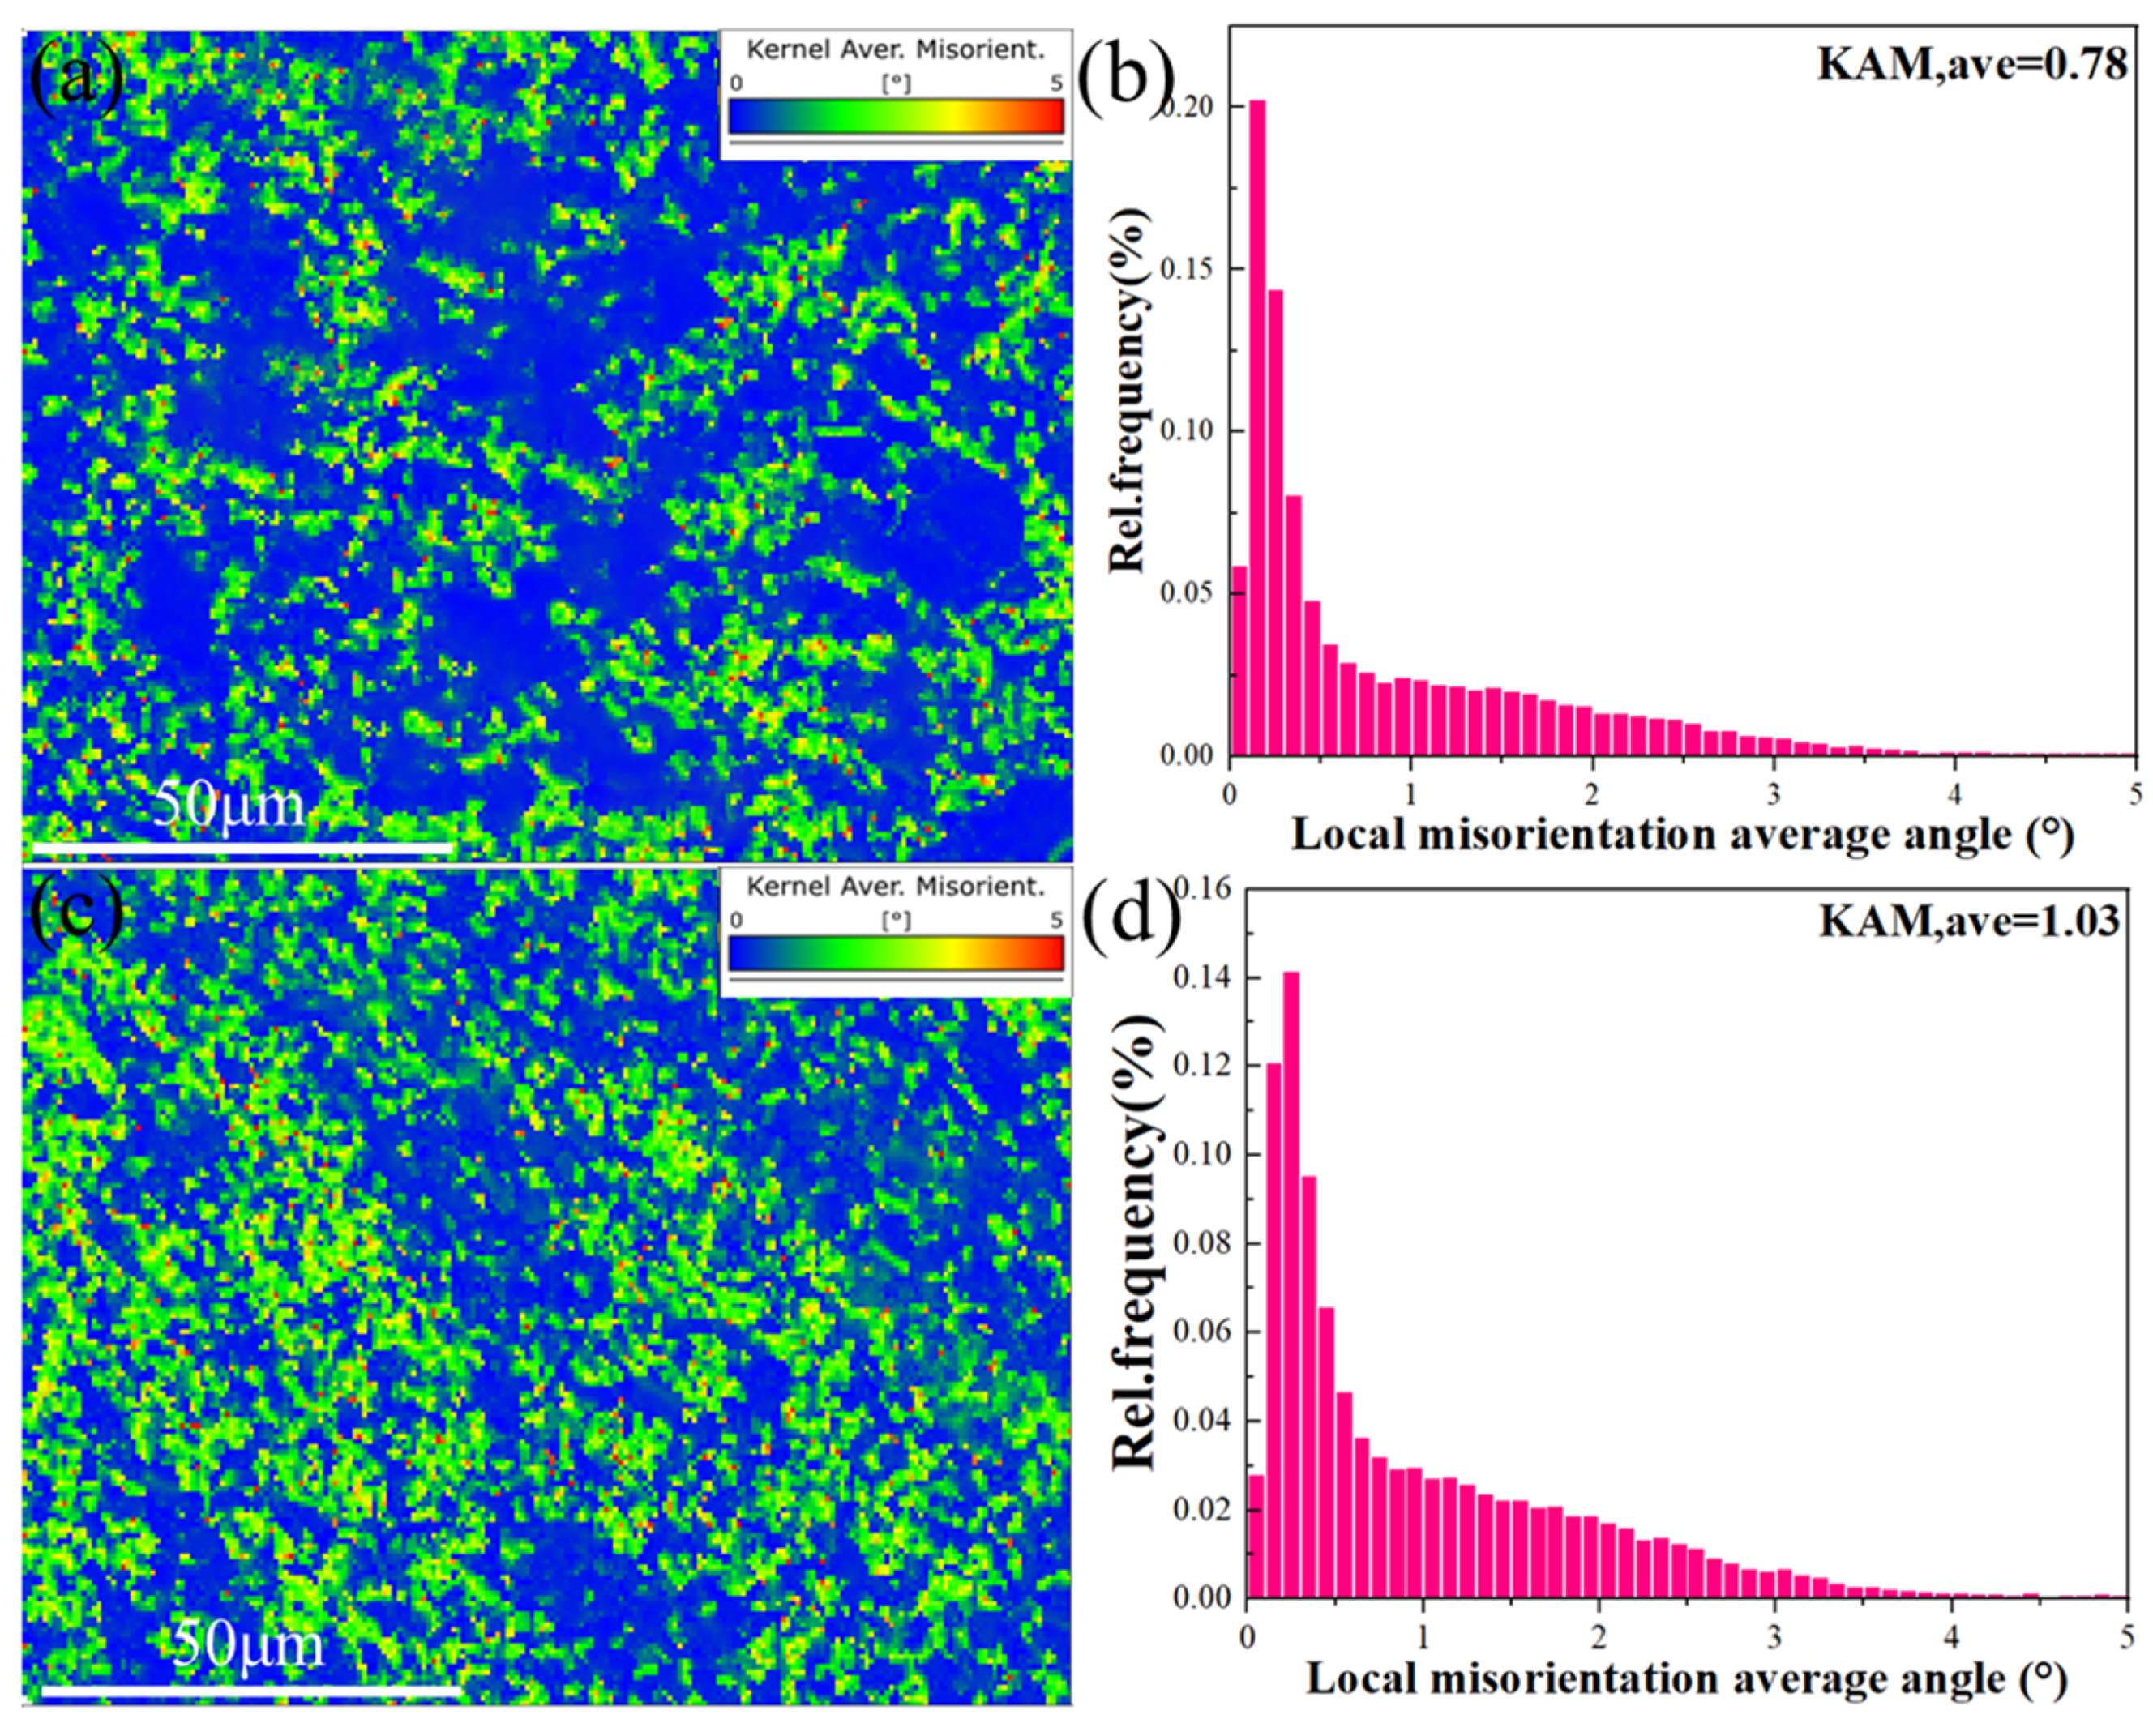
KAM maps (Figure 11) are consistent with this finding: the average KAM is 0.78° for 0LC and 1.03° for 0.3LC. The higher average KAM in 0.3LC indicates greater retention of local misorientation after annealing, consistent with delayed recovery and recrystallization. The KAM values are subject to the same local heterogeneity and are therefore interpreted together with the grain-boundary statistics rather than as stand-alone evidence [42,43]. Direct observation of particle–dislocation interactions requires TEM, which is beyond the scope of this study. Nevertheless, the co-occurrence of fine Al-RE dispersoids in SEM (Figure 9d), the increased LAGB fraction in EBSD (Figure 10), and the elevated KAM values (Figure 11) supports the interpretation that Al-RE particles stabilize the substructure through Zener pinning, in agreement with established mechanisms in Al-RE systems [14,22,34,44,45]. Thus, the strength increase from La/Ce co-addition mainly arises from precipitation strengthening by RE-rich phases, while the improved elongation arises primarily from the spheroidization and refinement of the Al-Fe phase.
The dual-pathway mechanism by which La/Ce co-doping enhances the property balance of the Al-0.5Fe alloy can be summarized as follows. In the purification pathway (I), La and Ce bind Fe and Si impurities into stable Al-RE intermetallics, which lowers the solute concentration in the α-Al matrix and thus reduces electron scattering; the resulting conductivity increase is consistent with the small but systematic lattice contraction observed by XRD (Figure 3) and by the redistribution of Fe and Si into discrete particles in the EDS maps (Figure 12 and Figure 13). In the pinning pathway (II), fine Al-RE dispersoids formed during annealing pin dislocations and subgrain boundaries, retard recrystallization, and preserve the fine-grained, spheroidized structure that benefits strength and ductility, as evidenced by the higher LAGB fraction and KAM values of 0.3LC (Figure 10 and Figure 11). The two pathways are not independent: the same RE addition that scavenges solutes (pathway I) also forms the pinning dispersoids (pathway II). At 0.3LC the two effects are optimally balanced, so that conductivity and ductility reach their maxima together; at 0.4LC the excess RE remains partly in solid solution and forms a larger volume fraction of coarse intermetallics, which raises both solute and interfacial scattering and embrittles the matrix, so that both properties decline [19].

3.4. Effect of La/Ce Co-Doping on Alloy Conductivity

The electrical resistivity of metallic materials is governed by electron scattering mechanisms, primarily arising from precipitate phases, crystalline defects, impurities, and solute atoms in solid solution. For 8176 aluminum alloy, the overall resistivity can be quantitatively described by the following relationship [31]:
ρ = ρ A l p u r e + ρ p r e c i p i t a t e s + C v Δ ρ vac + L d i s l o Δ ρ dislo + S G B Δ ρ G B + i C s o l u i Δ ρ s o l u i
Among these, ρ A l p u r e = 2.655 × 1 0 8 Ω · m is the resistivity of pure aluminum without lattice defects, while ρ p r e c i p i t a t e s is the resistivity induced by the precipitation phase. In this study, the amount of precipitates is negligible and can be disregarded. Δ ρ vac , Δ ρ dislo , Δ ρ G B , and Δ ρ s o l u i are constants. C v is the vacancy concentration, L d i s l o is the dislocation density, S G B is the proportion of grain boundaries per unit volume, which can be approximately written as 6/d, where d is the average grain size. C s o l u i is the solute concentration in the matrix. Δ ρ vac = 26 n   Ω · m / a t . % , Δ ρ dislo = 2.7 × 10 25 Ω · m 3 , Δ ρ G B = 2.6 × 10 16 Ω · m 2 . Previous estimates suggest the vacancy concentration in highly deformed aluminum alloys is approximately 10 3 % [46,47]. However, even with such a high vacancy concentration in the as-cast 8176 aluminum alloy, the resulting increase in resistivity is ~ 2.6 × 10 11 Ω · m , only ~0.1% of pure Al. Thus, the vacancy effect is negligible. The value of S G B Δ ρ G B reflects the influence of grain boundaries. The calculation results are shown in Table 4. S G B Δ ρ G B is smaller than the resistivity of pure Al, indicating that the grain-boundary contribution is small and that the additional grain boundaries introduced by trace La/Ce additions have a negligible adverse effect on resistivity. According to previous studies [46,48,49], the dislocation density of the 1100 wrought aluminum alloy is approximately 4 × 10 12   m 2 , while aluminum alloys processed through severe plastic deformation techniques can achieve dislocation densities as high as 10 14   m 2 . By examining the computational results from Jiang et al. [31] on the contribution of dislocation pairs with densities of 4 × 10 12   m 2 and 10 14   m 2 to resistivity, it is evident that the contribution of dislocations with densities of 4 × 10 12   m 2 and 10 14   m 2 to the resistivity of pure aluminum is approximately 0.04% and 0.1% of the pure aluminum resistivity, respectively. Furthermore, the dislocation density of the as-cast 8176 aluminum alloy should be less than 4 × 10 12   m 2 . Therefore, the contribution of dislocations to the increase in resistivity can be neglected.
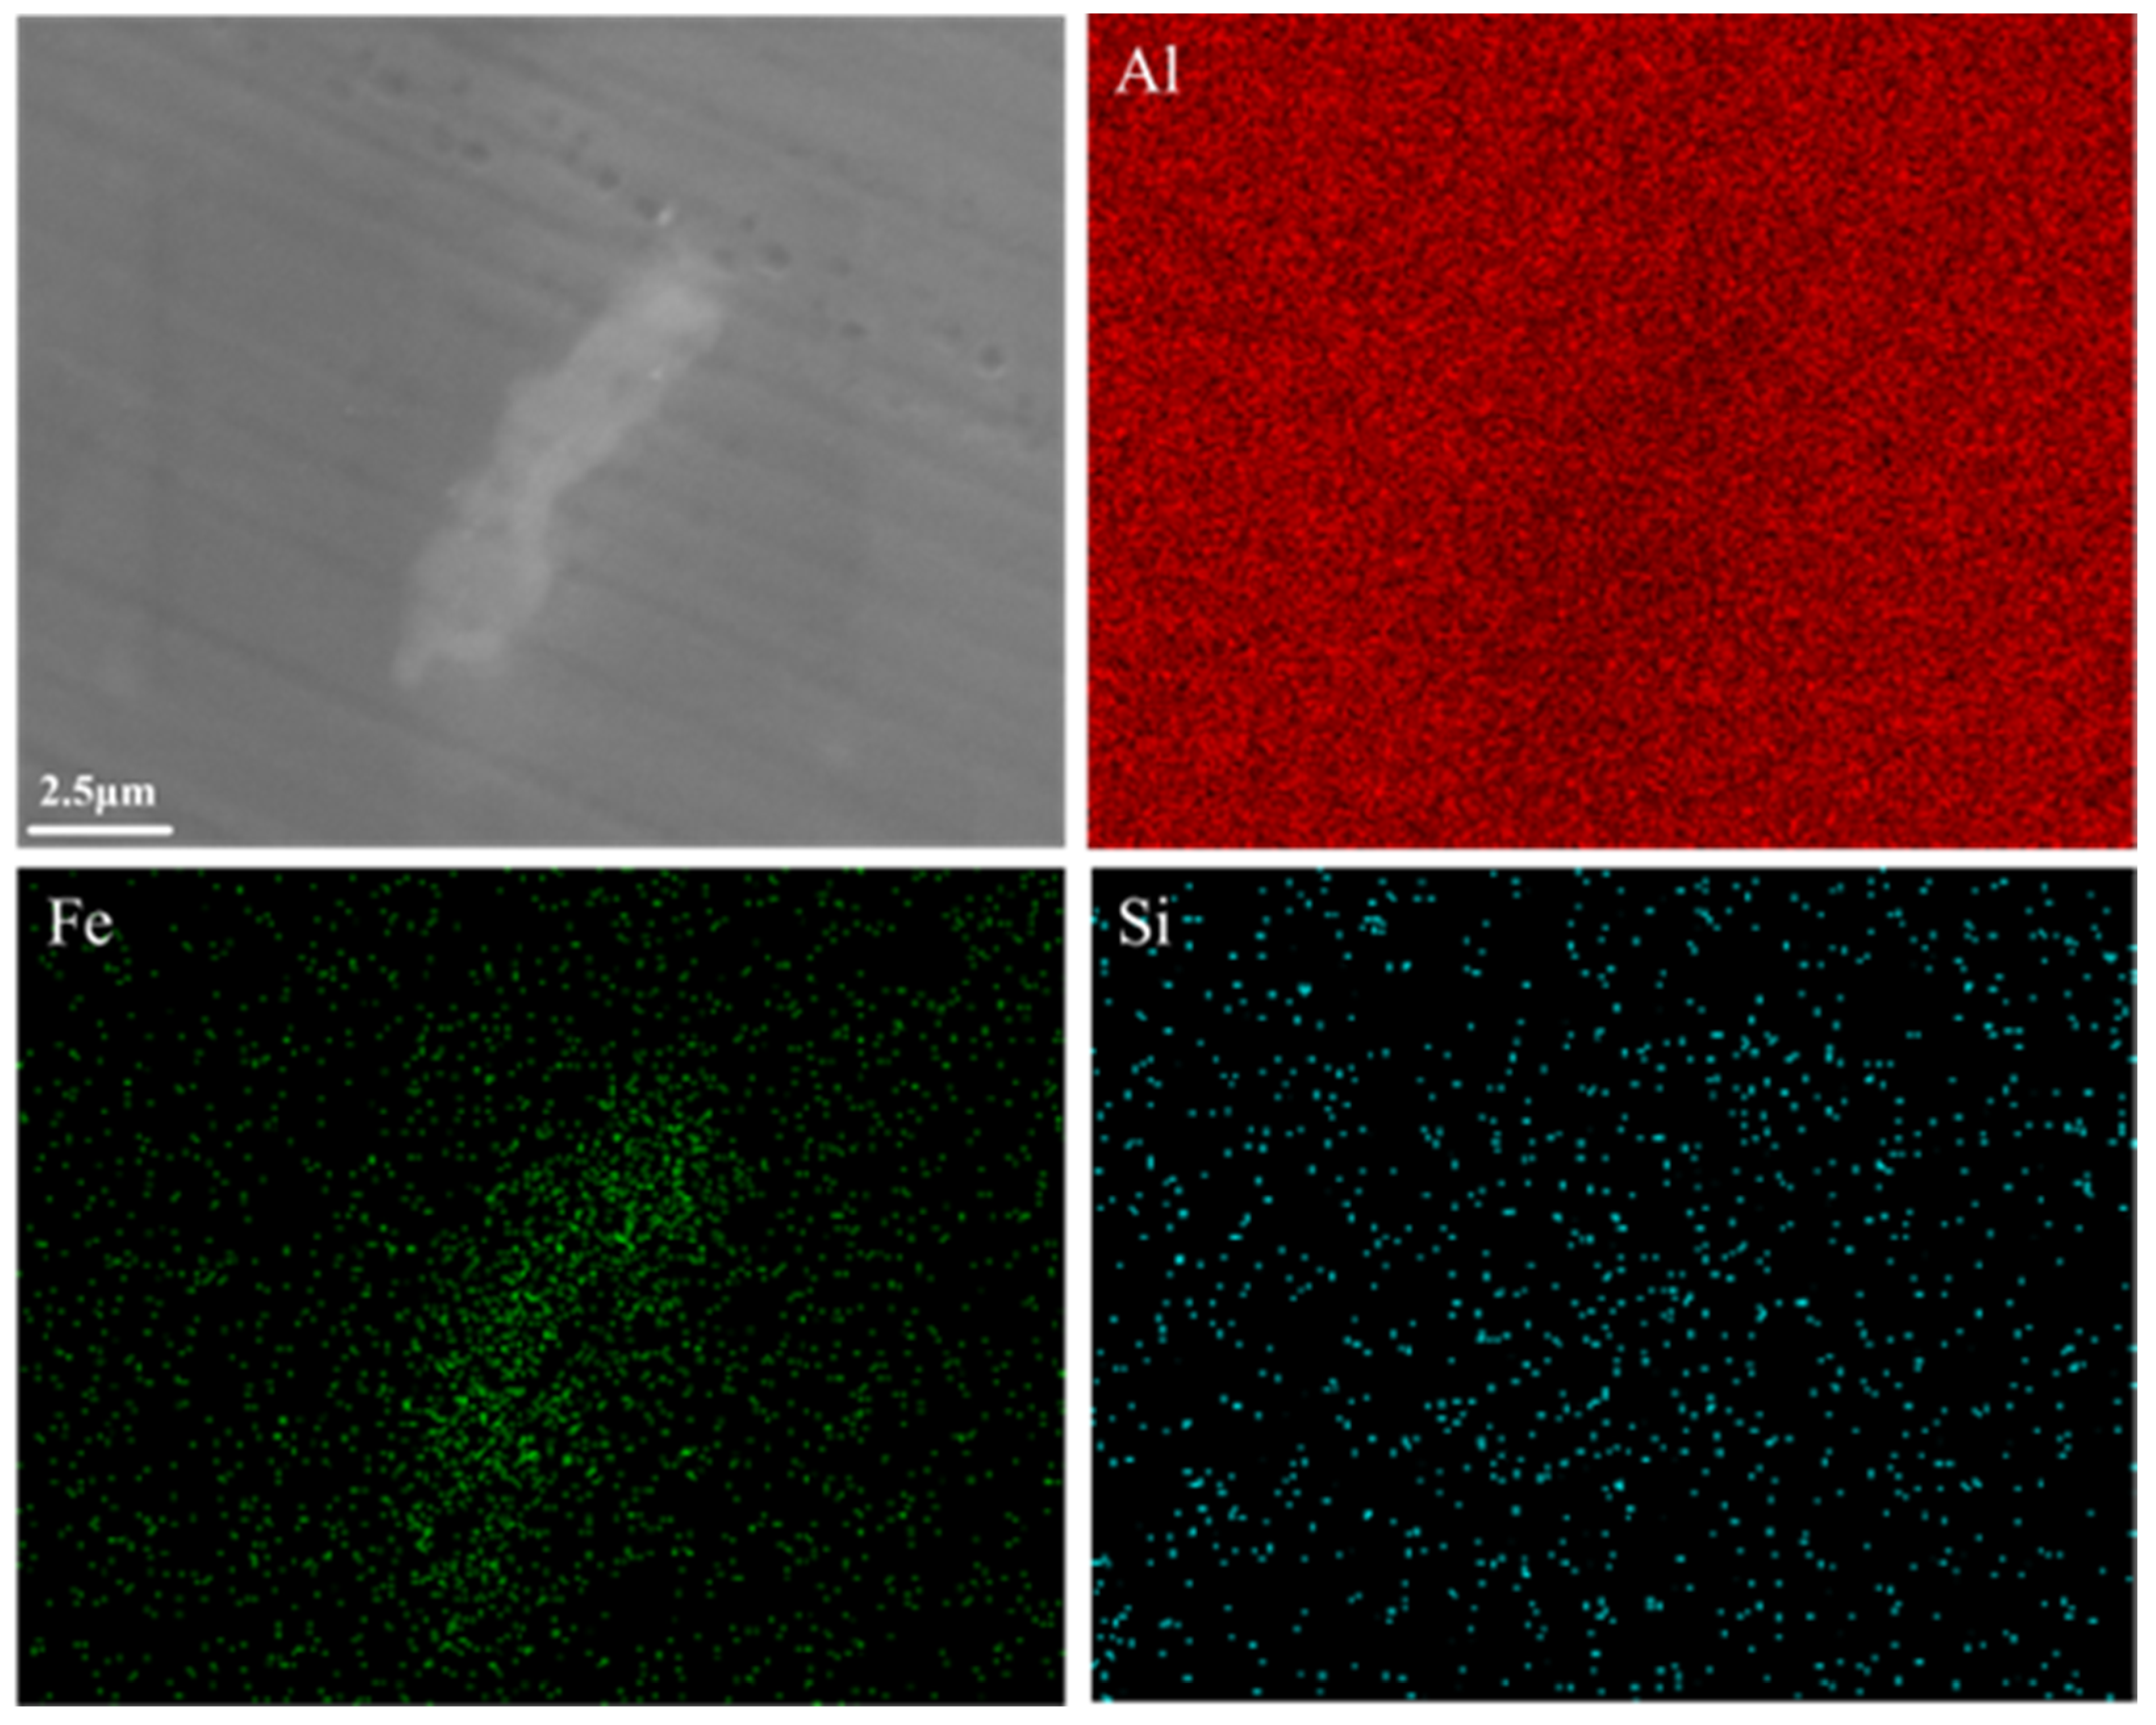
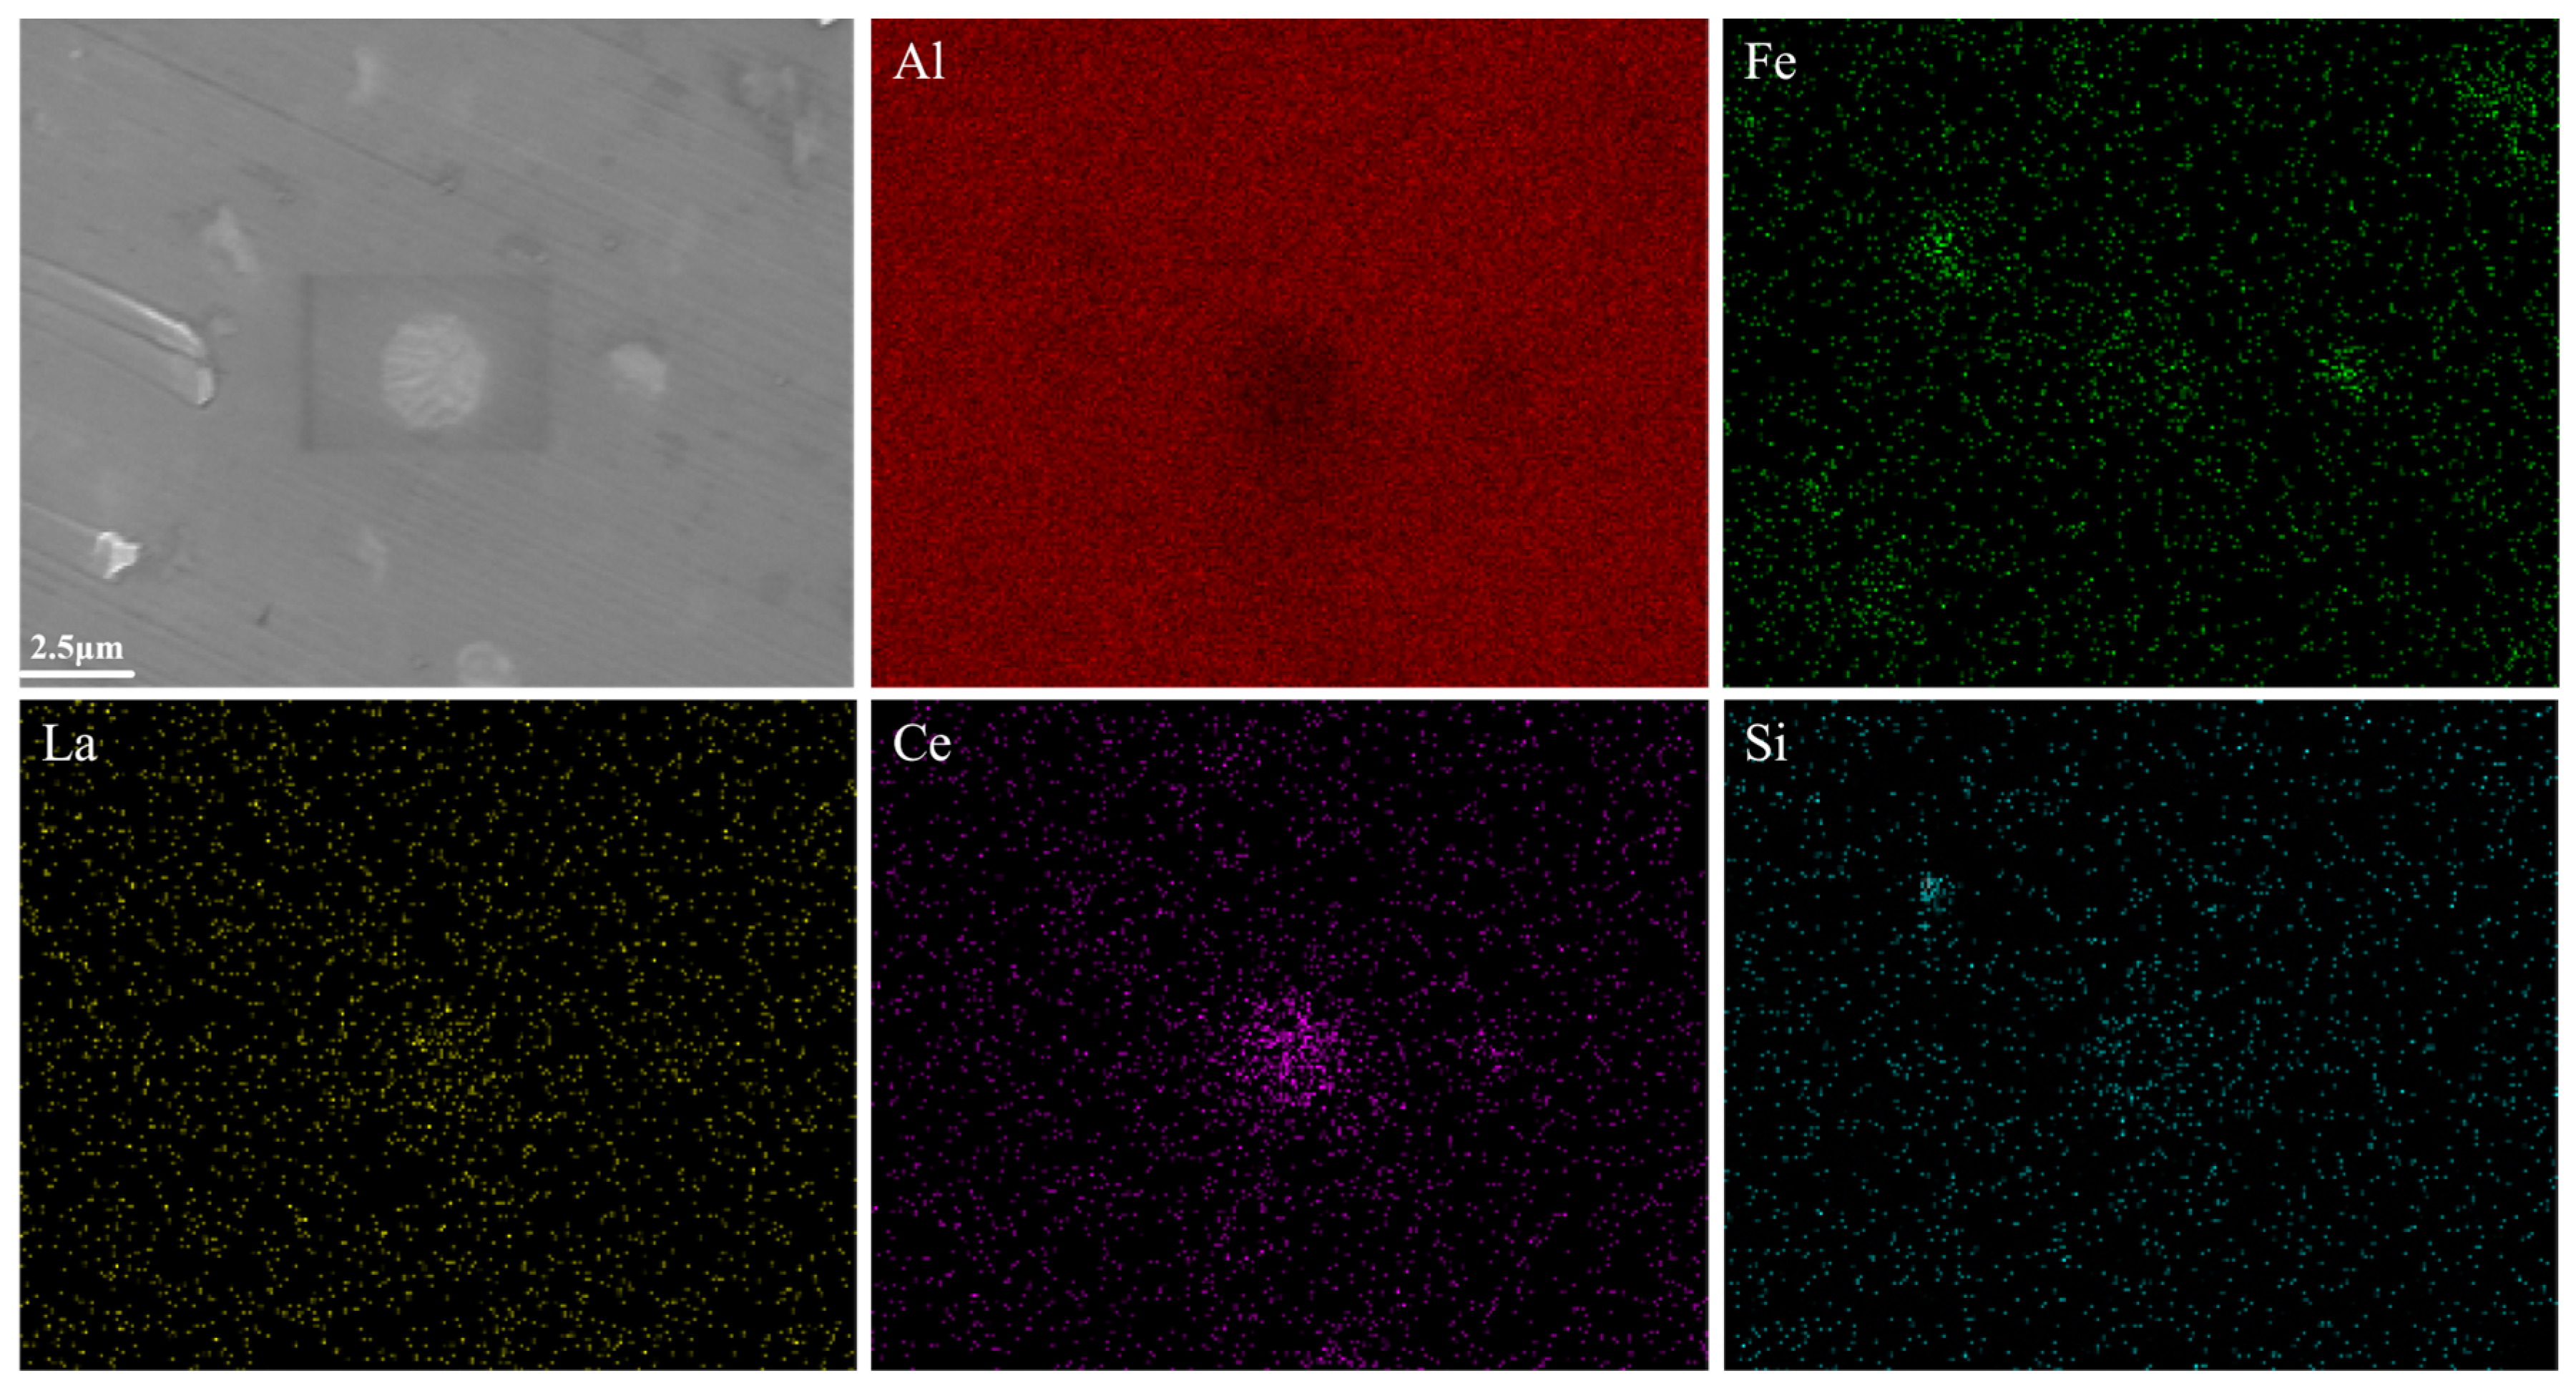
EDS elemental mapping of the annealed wires (Figure 12 and Figure 13) shows that, upon La/Ce addition, Si and Fe are redistributed into discrete particles rather than remaining uniformly dispersed, consistent with the solute precipitation indicated indirectly by the XRD lattice contraction. It should be noted that the as-cast maps presented in Section 3.1 (Figure 4 and Figure 5) cover Al, Fe, La and Ce but not Si; the involvement of Si in the scavenging process is therefore inferred solely from the annealed-wire maps (Figure 12 and Figure 13), in which the Si signal coincides spatially with the Fe-rich particles. The two mapping sets are complementary, and no claim regarding Si is made on the basis of Figure 4 and Figure 5. The solute content within the α-Al grains was not measured directly (e.g., by EPMA); the reduction in dissolved Fe and Si is inferred from two independent observations: the contraction of the α-Al lattice parameter toward that of pure Al (Section 3.1), which in dilute aluminum alloys scales with the total solute content, and the redistribution of Fe and Si from a continuous network into discrete particles in the EDS maps. The same indirect approach—lattice parameter combined with elemental mapping—has previously been used to assess solute depletion by rare-earth additions in 8176 and related dilute aluminum alloys [10,19,31]. Owing to their high chemical reactivity, La and Ce preferentially form stable intermetallic compounds or RE-rich phases with impurities such as Fe and Si, considerably lowering their solubility in the α-Al matrix and reducing the scattering of conduction electrons by solute atoms—the core of the scavenging mechanism. RE elements also contribute to melt purification by reacting with O, H, and S to form high-melting-point compounds such as RE2O3, REH2, and RE2S3. La/Ce doping refines the α-Al grains; although grain boundaries are themselves scattering sites, refinement produces a more uniform microstructure and is accompanied by refinement and spheroidization of the Al-Fe phase (Figure 8), which mitigates the obstruction to electron flow caused by coarse, irregular boundaries. It should be emphasized that finer particles do not scatter electrons more weakly: at a constant phase volume fraction, a finer dispersion presents a larger total particle–matrix interfacial area and increases interfacial scattering [31,46]. The conductivity improvement therefore does not arise from reduced particle scattering; it arises from the dominant reduction in solute scattering as dissolved Fe and Si are transferred into the Al-RE intermetallics. The spheroidization contributes indirectly by breaking the coarse, interconnected Al-Fe network into isolated particles and restoring a more continuous conduction path through the α-Al matrix. Finally, as shown by Liao et al. [10], Ce (and potentially La) may further enhance conductivity by suppressing static lattice distortion in the aluminum solid solution and by modifying the electronic band structure to increase the number of effective charge carriers.
EDS mapping was limited to the 0LC and 0.3LC alloys, which bound the composition series: 0LC contains no rare earth, and 0.3LC exhibits the strongest scavenging response. The underlying mechanism—formation of Al-RE intermetallics that withdraw Fe and Si from solid solution—is identical across the series; only the extent of intermetallic formation varies with the RE content. Endpoint mapping of this kind has been used to establish redistribution behavior in previous studies of rare-earth-modified dilute aluminum alloys [19,31]. Extending the maps to the intermediate compositions and to the cold-drawn state is left to future work.
For conductor applications, the relevant design criterion is the combination of conductivity with strength and ductility—conventionally expressed through the conductivity–strength product (EC × UTS) together with the elongation—rather than any single property. On this basis the annealed 0.3LC alloy reaches an EC × UTS product of ≈ 7.42 × 10³%IACS·MPa (61.81% IACS × 120 MPa), about 9% above that of the base alloy (59.87% IACS × 114 MPa ≈ 6.83 × 10³% IACS·MPa), while its elongation of 16.7% is the highest in the series; at 0.4LC both conductivity and ductility degrade as the Al-RE particles coarsen. The optimal composition window (0.3 wt.% La + 0.3 wt.% Ce) thus provides a direct design guideline for industrial implementation.

4. Conclusions

This study investigated how equimolar La/Ce co-doping (0–0.4 wt.% of each element) modifies the microstructure, mechanical properties, and electrical conductivity of the Al-0.5Fe (8176) alloy across the as-cast, cold-drawn, and annealed (300 °C, 2 h) states, to mitigate the long-standing trade-off between conductivity and ductility in Al-Fe conductor materials. The main findings are as follows.
(1) Microstructural modification. La/Ce co-doping refines the as-cast eutectic cells (estimated from ≈59 µm at 0LC to ≈30 µm at 0.3LC by OM of the cell-boundary Al-Fe network; these are eutectic cell sizes, not true grain sizes) and transforms the brittle Al13Fe4-type Al-Fe phase from a coarse plate-like to a fine spheroidal morphology—an effect attributed to Al-RE intermetallics acting as heterogeneous nucleation sites and growth-inhibiting agents. XRD of the actual alloys resolves only α-Al peaks; the RE-rich phases (<1 vol.%) are below the detection limit and are instead identified by SEM-EDS.
(2) Mechanical enhancement. The optimal addition of 0.3 wt.% La + 0.3 wt.% Ce increases the elongation of the annealed wire from 11.7% to 16.7% (+42.7%) while maintaining the ultimate tensile strength at 120 ± 4 MPa. Excessive addition (0.4LC) produces coarse, brittle Al-RE particles that degrade both strength and ductility.
(3) Conductivity improvement. The annealed 0.3LC alloy reaches 61.81% IACS versus 59.87% IACS for the base alloy (+1.94% IACS). The improvement is attributed to the scavenging of Si and Fe solutes from the α-Al matrix into Al-RE intermetallics, as evidenced by the EDS elemental redistribution (Figure 12 and Figure 13); the systematic lattice contraction toward pure Al (Δa ≈ 0.0033 Å for 0.3LC) is consistent with this interpretation, against a modest adverse grain-boundary contribution.
(4) Thermal stability. After annealing, 0.3LC retains a higher LAGB fraction (62.7% vs. 56.6%) and a higher average KAM (1.03° vs. 0.78°) than 0LC—observations consistent with Zener pinning of dislocations and subgrain boundaries by thermally stable Al-RE dispersoids, which retards recovery and recrystallization.
(5) Limitations and outlook. The present study is limited to a single heat-treatment condition (300 °C for 2 h) and a single La/Ce equimolar ratio; the characterization is ex situ, and long-term service performance of the conductor (e.g., creep and thermal cycling) was not evaluated. Future work will examine single-RE (La-only and Ce-only) control alloys at the same total rare-earth content to isolate the co-doping effect, employ transmission electron microscopy to directly observe particle–dislocation interactions, and extend the range of annealing conditions to establish the processing window.

Author Contributions

S.D.: writing—original draft, conceptualization, funding acquisition, investigation; J.Z.: methodology, formal analysis; M.B.: writing—review and editing; X.Z.: software, data curation; H.C.: supervision, project administration. Y.H.: validation; J.P.: writing—review and editing. All authors have read and agreed to the published version of the manuscript.

Funding

The authors declare that this study received funding from Guangxi Natural Science Foundation Project (AB24010232), Science and Technology Project of Guangxi Power Grid Co., Ltd. (Project No. GXKJXM20240132, GXKJXM20240134). The funder had the following involvement with the study: research direction design, data discussion, manuscript writing and review, and the decision to submit it for publication.

Data Availability Statement

The original contributions presented in this study are included in the article. Further inquiries can be directed to the corresponding author.

Acknowledgments

The authors thank Guangxi University for technical support.

Conflicts of Interest

All authors are employed by the Electric Power Research Institute of Guangxi Power Grid Co., Ltd. The authors declare that the research was conducted in the absence of any commercial or financial relationships that could be construed as a potential conflict of interest.

References

  1. Takata, N.; Minamihama, K.; Miyawaki, T.; Cheng, Y.; Xu, Y.; Wang, W.; Kim, D.; Suzuki, A.; Kobashi, M.; Kato, M. Design of high-performance sustainable aluminum alloy series for laser additive manufacturing. Nat. Commun. 2025, 16, 11105. [Google Scholar] [CrossRef] [Scilit]
  2. Wu, B.; Shang, S.; Cai, L.; Tang, H.; Lei, B.; Xu, Z. Rare earth elements in cast aluminum alloys: Microstructural control and performance enhancement. J. Rare Earths 2025, 44, 1994–2009. [Google Scholar] [CrossRef] [Scilit]
  3. Li, Q.; Wang, J.; Suleiman, Z.M.; Miao, Y.; Wu, X.; Hou, Q.; Yang, X.; Li, Z.; Li, Y. AI assisted design of high thermal conductivity Al-Fe-Ni-Mg alloys. J. Alloys Compd. 2025, 1036, 181839. [Google Scholar] [CrossRef] [Scilit]
  4. Doty, H.W.; El-Hadad, S.; Samuel, E.; Samuel, A.M.; Samuel, F.H. The influence of rare earth metals on the microstructure and mechanical properties of 220 and 356.1 alloys for automotive industry. Materials 2025, 18, 941. [Google Scholar] [CrossRef] [Scilit]
  5. Yan, H.; Xie, G.; Tian, W.-P.; Hu, W. Advance in Rare Earth Aluminium Alloy Research. Yunnan Metall. 2012, 41, 65–68. [Google Scholar]
  6. Sun, Y.; Tian, W.; Hu, M. Research Progress in the Effect of Rare Earths on Mechanical Properties of Aluminum Alloys. Nonferrous Metal. Mater. Eng. 2019, 40, 55–60. [Google Scholar]
  7. Zou, Z.; Xie, Z.; Chen, Z.; Yang, K. The role and research progress of rare earth in aluminum alloys. Mech. Electr. Technol. 2012, 4, 117–120. [Google Scholar]
  8. Wu, X.; Sun, M.; Hong, L.; Wen, S.; Wei, W.; Gao, K.; Rong, L.; Xiong, X.; Huang, H.; Nie, Z. Er-containing microalloyed aluminum alloys: A review. J. Mater. Sci. 2024, 59, 9685–9696. [Google Scholar] [CrossRef] [Scilit]
  9. Liu, Y.; Yu, Z.; Zhang, M.; Feng, Q.; Zhang, D.; Gao, P.; Li, C. The influence of the combined addition of La–Ce mixed Rare Earths and Sr on the microstructure and Mechanical properties of AlSi10MnMg Alloy. Metals 2024, 14, 1050. [Google Scholar] [CrossRef] [Scilit]
  10. Liao, H.C.; Liu, Y.; Lü, C.L.; Wang, Q.G. Mechanisms for Ce-induced remarkable improvement of conductivity in Al alloys. J. Mater. Res. 2017, 32, 566–574. [Google Scholar] [CrossRef] [Scilit]
  11. Li, D.Q.; Cai, S.L.; Gu, J.; Liu, S.C.; Si, J.J. Co-doping of La/Ce and La/Er induced precipitation strengthening for designing high strength Al-Mg-Si electrical conductive alloys. Mater. Today Commun. 2023, 36, 106666. [Google Scholar] [CrossRef] [Scilit]
  12. Wang, J.; Li, F. Effect of Sm+Er and Heat Treatment on As-Cast Microstructure and Mechanical Properties of 7055 Aluminum Alloy. Materials 2023, 16, 4846. [Google Scholar] [CrossRef] [Scilit]
  13. Lei, Z.; Wen, S.; Huang, H.; Wei, W.; Nie, Z. Grain refinement of aluminum and aluminum alloys by Sc and Zr. Metals 2023, 13, 751. [Google Scholar] [CrossRef] [Scilit]
  14. Wang, M.L.; Wei, W.; Shi, W.; Zhou, X.R.; Wen, S.P.; Wu, X.L.; Gao, K.Y.; Rong, L.; Qi, P.; Huang, H.; et al. Synergistic effect of Al3(Er, Zr) precipitation and hot extrusion on the microstructural evolution of a novel Al-Mg-Si-Er-Zr alloy. J. Mater. Res. Technol. 2023, 22, 947–957. [Google Scholar] [CrossRef] [Scilit]
  15. Jiang, H.X.; Zheng, Q.J.; Song, Y.; Li, Y.Q.; Li, S.X.; He, J.; Zhang, L.L.; Zhao, J.Z. Influence of minor La addition on the solidification, aging behaviors and the tensile properties of Al-Mg-Si alloys. Mater. Charact. 2022, 185, 111750. [Google Scholar] [CrossRef] [Scilit]
  16. Barkov, R.Y.; Mikhaylovskaya, A.; Yakovtseva, O.A.; Loginova, I.S.; Prosviryakov, A.S.; Pozdniakov, A. Effects of thermomechanical treatment on the microstructure, precipitation strengthening, internal friction, and thermal stability of Al-Er-Yb-Sc alloys with good electrical conductivity. J. Alloys Compd. 2021, 855, 157367. [Google Scholar] [CrossRef] [Scilit]
  17. Bi, J.; Lei, Z.L.; Chen, Y.B.; Chen, X.; Tian, Z.; Qin, X.K.; Liang, J.W.; Zhang, X.R.; Al, E.O. Effect of Al3(Sc,Zr) and Mg2Si precipitates on microstructure and tensile properties of selective laser melted Al-14.1Mg-0.47Si-0.31Sc-0.17Zr alloy. Intermetallics 2020, 123, 106822. [Google Scholar] [CrossRef] [Scilit]
  18. Jiang, S.Y.; Wang, R.H. Grain size-dependent Mg/Si ratio effect on the microstructure and mechanical/electrical properties of Al-Mg-Si-Sc alloys. J. Mater. Sci. Technol. 2019, 35, 1354–1363. [Google Scholar] [CrossRef] [Scilit]
  19. Zhang, Y.L.; Wei, F.; Mao, J.; Niu, G.D. The difference of La and Ce as additives of electrical conductivity aluminum alloys. Mater. Charact. 2019, 158, 109963. [Google Scholar] [CrossRef] [Scilit]
  20. Li, Q.L.; Li, B.Q.; Li, J.B.; Zhu, Y.Q.; Xia, T.D. Effect of yttrium addition on the microstructures and mechanical properties of hypereutectic Al-20Si alloy. Mater. Sci. Eng. A—Struct. Mater. Prop. Microstruct. Process. 2018, 722, 47–57. [Google Scholar] [CrossRef] [Scilit]
  21. Shi, Z.M.; Wang, Q.; Zhao, G.; Zhang, R.Y. Effects of erbium modification on the microstructure and mechanical properties of A356 aluminum alloys. Mater. Sci. Eng. A—Struct. Mater. Prop. Microstruct. Process. 2015, 626, 102–107. [Google Scholar] [CrossRef] [Scilit]
  22. Pozdniakov, A.V.; Barkov, R.Y. Microstructure and mechanical properties of novel Al-Y-Sc alloys with high thermal stability and electrical conductivity. J. Mater. Sci. Technol. 2020, 36, 1–6. [Google Scholar] [CrossRef] [Scilit]
  23. Bai, J.; Gao, M.; Wang, C.; Pei, J.; Yang, L.; Guan, R. Role of Er element and two-stage heat treatment in a rheo-extruded Al–Sc–Zr alloy: Balance strength and electrical conductivity. Mater. Des. 2025, 260, 115096. [Google Scholar] [CrossRef] [Scilit]
  24. Chen, W.; Huang, C.; Duan, S.; Guo, J.; Du, J. Synergistic improvement of strength and conductivity of 6101 alloy with high Fe content modified by trace Sr and Er. J. Mater. Res. Technol. 2025, 39, 4344–4354. [Google Scholar] [CrossRef] [Scilit]
  25. Ding, W.W.; Zhao, X.Y.; Chen, T.L.; Zhang, H.X.; Liu, X.X.; Cheng, Y.; Lei, D.K. Effect of rare earth Y and Al-Ti-B master alloy on the microstructure and mechanical properties of 6063 aluminum alloy. J. Alloys Compd. 2020, 830, 154685. [Google Scholar] [CrossRef] [Scilit]
  26. Xu, C.; Xiao, W.L.; Hanada, S.; Yamagata, H.; Ma, C.L. The effect of scandium addition on microstructure and mechanical properties of Al-Si-Mg alloy: A multi-refinement modifier. Mater. Charact. 2015, 110, 160–169. [Google Scholar] [CrossRef] [Scilit]
  27. Mahmoud, M.G.; Mosleh, A.O.; Mohamed, M.S.; El-Moayed, M.H.; Khalifa, W.; Pozdniakov, A.V.; Salem, S. The impact of Ce-containing precipitates on the solidification behavior, microstructure, and mechanical properties of Al-6063. J. Alloys Compd. 2023, 948, 169805. [Google Scholar] [CrossRef] [Scilit]
  28. Sharma, V.K.; Kumar, V.; Joshi, R.S. Investigation of rare earth particulate on tribological and mechanical properties of Al-6061 alloy composites for aerospace application. J. Mater. Res. Technol. 2019, 8, 3504–3516. [Google Scholar] [CrossRef] [Scilit]
  29. Koprowski, P.; Lech-Grega, M.; Wodzinski, L.; Augustyn, B.; Boczkal, S.; Ozóg, M.; Uliasz, P.; Zelechowski, J.; Szymanski, W. The effect of low content additives on strength, resistivity and microstructural changes in wire drawing of 1xxx series aluminium alloys for electrical purposes. Mater. Today Commun. 2020, 24, 101039. [Google Scholar] [CrossRef] [Scilit]
  30. Liu, W.C.; Li, J.; Yuan, H.; Yang, Q.X. Effect of recovery on the recrystallization texture of an Al-Mg alloy. Scr. Mater. 2007, 57, 833–836. [Google Scholar] [CrossRef] [Scilit]
  31. Jiang, H.X.; Li, S.X.; Zhang, L.L.; He, J.; Zheng, Q.J.; Song, Y.; Li, Y.Q.; Zhao, J.Z. The influence of rare earth element lanthanum on the microstructures and properties of as-cast 8176 (Al-0.5Fe) aluminum alloy. J. Alloys Compd. 2021, 859, 157804. [Google Scholar] [CrossRef] [Scilit]
  32. Zheng, X.; Zhang, J.; Lai, Y.X.; Hu, X.J.; Chen, Z.Q.; Xiang, X.M.; Chen, J.H. Microstructure changes and enhanced properties of an automotive AlMgSi alloy improved by micro-alloying La-addition. Mater. Charact. 2022, 194, 112331. [Google Scholar] [CrossRef] [Scilit]
  33. ASTM E8/E8M-25; Standard Test Methods for Tension Testing of Metallic Materials. ASTM International: West Conshohocken, PA, USA, 2025.
  34. Jiang, H.X.; Li, S.X.; Zheng, Q.J.; Zhang, L.L.; He, J.; Song, Y.; Deng, C.K.; Zhao, J.Z. Effect of minor lanthanum on the microstructures, tensile and electrical properties of Al-Fe alloys. Mater. Des. 2020, 195, 108991. [Google Scholar] [CrossRef] [Scilit]
  35. Pandee, P.; Gourlay, C.M.; Belyakov, S.A.; Patakham, U.; Zeng, G.; Limmaneevichitr, C. AlSi2Sc2 intermetallic formation in Al-7Si-0.3Mg-xSc alloys and their effects on as-cast properties. J. Alloys Compd. 2018, 731, 1159–1170. [Google Scholar] [CrossRef] [Scilit]
  36. Kurz, W.; Fisher, D.J. Fundamentals of Solidification, 4th ed.; Trans Tech Publications: Bäch, Switzerland, 1998. [Google Scholar]
  37. Li, S.X.; Jiang, H.X.; Li, Y.Q.; Zhang, L.L.; Sun, H.; He, J.; Jiang, H.C.; Zhao, J.Z. Influence of rare earth cerium on the microstructures and performances of Al-Fe alloy. Sci. China Technol. Sci. 2023, 66, 3317–3327. [Google Scholar] [CrossRef] [Scilit]
  38. Humphreys, F.J.; Hatherly, M. Recrystallization and Related Annealing Phenomena, 2nd ed.; Elsevier: Amsterdam, The Netherlands, 2004. [Google Scholar]
  39. Sun, Y.; Hung, C.; Hebert, R.J.; Fennessy, C.; Tulyani, S.; Aindow, M. Eutectic microstructures in dilute Al-Ce and Al-Co alloys. Mater. Charact. 2019, 154, 269–276. [Google Scholar] [CrossRef] [Scilit]
  40. Roy, S.; Allard, L.F.; Rodriguez, A.; Watkins, T.R.; Shyam, A. Comparative evaluation of cast aluminum alloys for automotive cylinder heads: Part I—Microstructure evolution. Metall. Mater. Trans. A 2017, 48, 2529–2542. [Google Scholar] [CrossRef] [Scilit]
  41. Lin, G.J.; Li, L.; Jia, X.J.; Wang, X.; Yuan, Z.T.; Zhang, G.X.; Zhan, Y.; Shan, Q.; Li, Z.L. Influence of cerium and yttrium addition on strength and electrical conductivity of pure aluminum alloys. J. Rare Earths 2024, 42, 600–611. [Google Scholar] [CrossRef] [Scilit]
  42. Schwartz, A.J.; Kumar, M.; Adams, B.L.; Field, D.P. (Eds.) Electron Backscatter Diffraction in Materials Science, 2nd ed.; Springer: Berlin/Heidelberg, Germany, 2009. [Google Scholar]
  43. Czerwinski, F. Cerium in aluminum alloys. J. Mater. Sci. 2020, 55, 24–72. [Google Scholar] [CrossRef] [Scilit]
  44. Li, Z.; He, Y.; Peng, M.; Ye, X.; Wang, J.; Xiao, D.; Huang, L.; Liu, W. Systematic screening of rare-earth microalloying in Al-0.2Zr alloy: Secondary-phase formation and recrystallization. J. Alloys Compd. 2026, 1060, 187349. [Google Scholar] [CrossRef] [Scilit]
  45. Kotov, A.D.; Mochugovskiy, A.G.; Mosleh, A.O.; Kishchik, A.A.; Rofman, O.V.; Mikhaylovskaya, A.V. Microstructure; superplasticity, and mechanical properties of Al–Mg–Er–Zr alloys. Mater. Charact. 2022, 186, 111825. [Google Scholar] [CrossRef] [Scilit]
  46. Sauvage, X.; Bobruk, E.V.; Murashkin, M.Y.; Nasedkina, Y.; Enikeev, N.A.; Valiev, R.Z. Optimization of electrical conductivity and strength combination by structure design at the nanoscale in Al–Mg–Si alloys. Acta Mater. 2015, 98, 355–366. [Google Scholar] [CrossRef] [Scilit]
  47. Hou, J.P.; Li, R.; Wang, Q.; Yu, H.Y.; Zhang, Z.J.; Chen, Q.Y.; Ma, H.; Wu, X.M.; Li, X.W.; Zhang, Z.F. Three principles for preparing Al wire with high strength and high electrical conductivity. J. Mater. Sci. Technol. 2019, 35, 742–751. [Google Scholar] [CrossRef] [Scilit]
  48. Arsenault, R.J.; Shi, N. Dislocation generation due to differences between the coefficients of thermal expansion. Mater. Sci. Eng. 1986, 81, 175–187. [Google Scholar] [CrossRef] [Scilit]
  49. Mao, Q.; Coutris, N.; Rack, H.; Fadel, G.; Gibert, J. Investigating ultrasound-induced acoustic softening in aluminum and its alloys. Ultrasonics 2020, 102, 106005. [Google Scholar] [CrossRef] [Scilit]
Figure 1. Optical microscope (OM) images of cross-sections of cast Al-0.5Fe alloys with different La/Ce co-doping levels (0–0.4 wt.%): (a) Al-0.5Fe (0LC), (b) Al-0.5Fe-0.1La-0.1Ce (0.1LC), (c) Al-0.5Fe-0.2La-0.2Ce (0.2LC), (d) Al-0.5Fe-0.3La-0.3Ce (0.3LC), (e) Al-0.5Fe-0.4La-0.4Ce (0.4LC).
Crystals 16 00553 g001
Figure 2. Average eutectic cell size of cast Al-0.5Fe alloys with different La/Ce co-doping levels (0–0.4 wt.%).
Crystals 16 00553 g002
Figure 3. XRD patterns for Al-0.5Fe alloys co-doped with La/Ce.
Crystals 16 00553 g003
Figure 4. SEM micrograph and corresponding EDS elemental maps (Al, Fe) of the as-cast 0LC alloy.
Crystals 16 00553 g004
Figure 5. SEM micrographs and corresponding EDS elemental maps (Al, Fe, La, Ce) of the as-cast La/Ce-containing alloys: (a) 0.1LC, (b) 0.2LC, (c) 0.3LC, (d) 0.4LC.
Crystals 16 00553 g005
Figure 6. Engineering stress–strain diagrams of different alloy wires after cold drawing and annealing at 300 °C for 2 h.
Crystals 16 00553 g006
Figure 7. The electrical conductivity of various alloy wires after cold drawing and annealing at 300 °C for 2 h.
Crystals 16 00553 g007
Figure 8. SEM morphologies of as-cast Al-0.5Fe alloys with La/Ce co-doping: (a) 0LC, (b) 0.1LC, (c) 0.2LC, (d) 0.3LC, (e) 0.4LC (red arrows marked the EDS analysis locations). (fi) EDS point analysis results corresponding to the marked locations. All BSE micrographs in (ae) were acquired under identical imaging conditions; post-acquisition brightness and contrast were adjusted uniformly across the entire field of view for visual consistency only. No selective contrast enhancement was applied, and the relative phase contrast remains as recorded.
Crystals 16 00553 g008
Figure 9. SEM morphological images of La/Ce co-doped Al-0.5Fe alloy wires after annealing at 300 °C for 2 h: (a) 0LC, (b) 0.1LC, (c) 0.2LC, (d) 0.3LC, (e) 0.4LC.
Crystals 16 00553 g009
Figure 10. The electron backscatter diffraction (EBSD) orientation imaging maps, grain boundary distribution diagrams, and grain size statistics of the 0LC and 0.3LC alloy wires after annealing. (a) presents the grain boundary (GB) distribution map of the 0LC alloy, while (b) shows the corresponding grain size distribution histogram; (c) displays the grain boundary distribution map of the 0.3LC alloy, and (d) illustrates the corresponding grain size distribution histogram.
Crystals 16 00553 g010
Figure 11. KAM maps of the 0LC and 0.3LC alloy wires after annealing at 300 °C for 2 h. (a) KAM map of the 0LC alloy; (b) corresponding average KAM value; (c) KAM map of the 0.3LC alloy; (d) corresponding average KAM value.
Crystals 16 00553 g011
Figure 12. EDS elemental mapping of the 0LC alloy wire after annealing at 300 °C for 2 h.
Crystals 16 00553 g012
Figure 13. EDS elemental mapping of the 0.3LC alloy wire after annealing at 300 °C for 2 h.
Crystals 16 00553 g013
Table 1. Elemental Content (wt.%) of the Five Alloy Samples in This Study.
NamingTarget CompositionsFeLaCeSiAl
0LCAl-0.5Fe0.5000.048699.45
0.1LCAl-0.5Fe-0.1La-0.1Ce0.50.10.10.048699.25
0.2LCAl-0.5Fe-0.2La-0.2Ce0.50.20.20.048699.05
0.3LCAl-0.5Fe-0.3La-0.3Ce0.50.30.30.048698.85
0.4LCAl-0.5Fe-0.4La-0.4Ce0.50.40.40.048698.65
Table 2. Lattice parameters of the five alloys calculated from the α-Al (111) peak positions.
AlloyLattice Parameter a (Å)
0LC4.0565
0.1LC4.0529
0.2LC4.0531
0.3LC4.0532
0.4LC4.0531
Table 3. Tensile properties of the as-drawn and 300 degree-annealed samples.
AlloyCold-DrawnAnnealed at 300 °C for 2 h
UTS (MPa)YS (MPa)El (%)UTS (MPa)YS (MPa)El (%)
0LC193 ± 3150 ± 81.3 ± 0.6114 ± 290 ± 511.7 ± 0.5
0.1LC201 ± 1167 ± 52.8 ± 0.9116 ± 191 ± 513.5 ± 0.2
0.2LC201 ± 3168 ± 34.5 ± 0.4118 ± 294 ± 316.1 ± 0.1
0.3LC203 ± 2173 ± 45.4 ± 0.2120 ± 4100 ± 216.7 ± 0.2
0.4LC201 ± 3161 ± 21.8 ± 0.3120 ± 292 ± 512.0 ± 0.4
Table 4. Contribution of grain boundaries to the electrical resistivity of the 0LC and 0.3LC alloys.
AlloysContribution of Grain Boundaries ( S G B Δ ρ G B ,   Ω · m )
0LC 4.13 × 10 10
0.3LC 4.89 × 10 10
Disclaimer/Publisher’s Note: The statements, opinions and data contained in all publications are solely those of the individual author(s) and contributor(s) and not of MDPI and/or the editor(s). MDPI and/or the editor(s) disclaim responsibility for any injury to people or property resulting from any ideas, methods, instructions or products referred to in the content.