Article

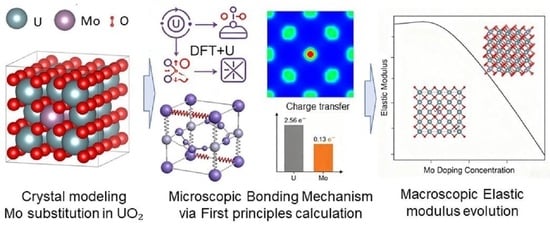
First-Principles Investigation: Effects of Molybdenum Substitution on the Elastic Properties of Uranium Dioxide

1
School of Metallurgy and Power Engineering, Chongqing University of Science and Technology, Chongqing 401331, China
2
Nuclear Power Institute of China, Chengdu 610005, China
3
School of Mechanical Engineering, Chongqing Sanxia University of Science and Technology, Chongqing 404100, China
4
College of Materials Science and Engineering, Chongqing University, Chongqing 400044, China
*
Authors to whom correspondence should be addressed.
These authors contributed equally to this work.
Crystals 2026, 16(6), 378; https://doi.org/10.3390/cryst16060378 (registering DOI)
Submission received: 10 April 2026 / Revised: 29 May 2026 / Accepted: 3 June 2026 / Published: 5 June 2026
(This article belongs to the Section Inorganic Crystalline Materials)

Abstract

Uranium dioxide (UO2) is the standard fuel in light water reactors, but improving its mechanical performance is essential for achieving higher burnups. This study employs first-principles density functional theory with the DFT + U approach to investigate the effect of molybdenum (Mo) substitution on the elastic properties of UO2. Supercell models with Mo concentrations from 3.125 to 9.375 at.% are constructed, and elastic constants are calculated using the stress–strain method, complemented by Bader charge and charge density analyses. The results reveal a non-monotonic concentration-dependent behavior: at 3.125 at.% Mo, the shear and Young’s moduli increase by ~16% and ~14%, respectively, indicating significant stiffening; at higher concentrations (6.25 and 9.375 at.%), both moduli decrease, leading to softening of UO2 lattice. Bader charge analysis shows that Mo loses only 0.13 electrons (vs. 2.56 for U) and the Mo–O bond is much shorter than the U–O bond; this is evidence of covalent bonding between Mo and O atoms that acts as local strengthening centers at low doping. The softening at higher concentrations is attributed to increased lattice distortion and enhanced bond delocalization, supported by changes in Cauchy pressure, Debye temperature, and Vickers hardness. The calculated elastic modulus and hardness of pure UO2 are in good agreement with previously reported experimental data. For Mo-doped UO2 systems, this work establishes a quantitative composition–property relationship, providing a theoretical reference for future experimental investigations.

1. Introduction

Uranium dioxide (UO2) has been the workhorse fuel material in commercial nuclear power generation for decades [1,2]. Its widespread adoption is attributed to a favorable combination of properties, including a high melting point (2865 °C) [3], stability in its fluorite crystal structure (Fm-3m), and good compatibility with fuel rod cladding materials [4,5]. In the complex environment of a nuclear reactor, fuel pellets are subjected to extreme conditions such as high temperature gradients, intense neutron irradiation, and the accumulation of solid and gaseous fission products. These factors induce microstructural changes, internal stresses, and dimensional instabilities, which can ultimately limit the fuel’s performance and burnup [6]. Therefore, continuous efforts are directed towards developing fuel materials with enhanced stability and mechanical integrity.
One effective approach to improving material properties is through alloying or doping with selected elements. The addition of solute atoms can modify defect energetics, grain boundary strength, and intrinsic mechanical properties [7,8]. For instance, the addition of zirconium has been explored to improve the corrosion resistance and irradiation stability of UO2-based fuels [6]. Previous first-principles studies have shown that Zr doping reduces the lattice parameter and formation energy of UO2 and alters its elastic constants. Notably, with increasing Zr concentration, the bulk modulus is increased, while the shear modulus shows an initial decrease followed by an increase at higher doping levels, affecting the material’s ductility as indicated by the B/G ratio. Similarly, the effects of fission products like lanthanum (La) and dysprosium (Dy) on UO2’s elastic properties have been investigated, revealing a general trend of decreasing bulk modulus with increasing dopant concentration [9]. These studies underscore the significant role of solute elements in tailoring fuel properties.
Molybdenum (Mo) is a prominent metallic fission product generated during the nuclear fission of U-235 fuel nuclei [10]. Unlike other U fission products, including gaseous Xe/Kr nuclides and brittle precipitated phase elements such as Ba and Zr that form separate phases or gas bubbles, Mo exhibits appreciable solubility in UO2 under high-temperature neutron irradiation conditions inside reactor cores [11,12]. The solid-solution of Mo in the UO2 matrix is therefore not merely an academic exercise but a scenario relevant to high-burnup fuel [13]. Understanding how Mo atoms interact with the UO2 lattice and modify its fundamental mechanical properties is essential for predicting fuel behavior during reactor operation [14]. While extensive first-principles studies have been conducted on the elastic and thermodynamic properties of pure UO2 and other uranium oxides like γ-UO3 and α-U3O8, and on advanced fuels like U3Si2 [15], a detailed investigation focusing on the elastic property changes in UO2 due to Mo is still lacking.
Elastic constants are the fundamental descriptors of a crystal’s response to small strains and are directly linked to its mechanical stability, stiffness, anisotropy, and interatomic bonding [16]. From the elastic constant tensor, key engineering parameters such as the bulk modulus (resistance to volume change), shear modulus (resistance to shape change), Young’s modulus (stiffness), and Poisson’s ratio (lateral strain response) can be derived [17]. These parameters are critical inputs for fuel performance codes that model thermo-mechanical behavior. Furthermore, analyzing the electronic structure, such as changes in the density of states and charge density distribution, can provide atomistic insights into the bonding characteristics that govern the elastic response.
In this work, a comprehensive first-principles DFT study on the elastic properties of Mo-doped UO2 was presented. The primary objectives are as follows: (1) to calculate the complete set of independent elastic constants for pure and Mo-containing UO2 supercells using the stress–strain approach; (2) to evaluate the derived macroscopic elastic moduli (B, G, E, ν) and assess the impact of Mo on mechanical strength and ductility; (3) to analyze the elastic anisotropy introduced by the solute; and (4) to correlate the observed mechanical changes with modifications in the electronic structure, specifically the Mo–O and U–O bonding interactions. This study aims to fill a knowledge gap and reveal how the technologically relevant fission product Mo modulates the elastic properties of the UO2 fuel matrix at the atomic scale.

2. Computational Methods

2.1. DFT Framework and Parameters

All density functional theory calculations were performed using the Vienna Ab initio Simulation Package (VASP.6.3.0) [18,19]. The ion–electron interactions were treated with the projector-augmented wave (PAW) method. For uranium (U), the valence electron configuration included 6s26p65f36d17s2, accounting for its complex electronic structure. For molybdenum (Mo), the valence electrons were 4p64d55s1, and for oxygen (O), 2s22p4. Although the electron correlation effect of U 5f states is weaker than that of light actinides, standard local density approximation (LDA) or generalized gradient approximation (GGA) functionals still suffer from self-interaction error and fail to correctly predict the electronic and structural properties of UO2 [4,20]. Therefore, the DFT + U formalism with an on-site Coulomb repulsion term is essential to obtain reliable structural and electronic properties. Thus, the Perdew–Burke–Ernzerhof (PBE) version of GGA [21] combined with a Hubbard U correction (PBE + U), a method successfully applied to UO2 and other uranium oxides, was adopted in this work. The effective U value for uranium was set to 4.5 eV, with an exchange parameter J of 0.54 eV, as these values have been experimentally validated [22]. The PAW pseudopotentials used for U (PAW_PBE U 06Sep2000) and Mo (PAW_PBE Mo_sv 02Feb2006) both include scalar relativistic effects by default. The U-J parameter of 3.0 eV for Mo 4d orbitals adopted in this work is a classic and widely used parameter in transition metal oxide systems. This value comes from the electronic structure and optical properties study of β-RbSm(MoO4) by Reshak [23] and magnetic interactions calculation of RE2Mo2O7 by Solovyev [24].
A plane-wave kinetic energy cutoff of 500 eV was used to ensure convergence of total energies. Brillouin zone integration was carried out using Γ-centered Monkhorst-Pack k-point meshes. For the primitive cell of UO2, an 18 × 18 × 18 mesh was employed. For the larger supercells used in doping studies, the k-point density was kept comparable, ensuring a k-point density of 0.02 × 2π/Å for convergence [25]. All structures were fully relaxed until the forces on each ion were less than 0.02 eV/Å and the total energy change was below 1 × 10⁻⁵ eV/atom.
It should be noted that while the ground state of UO2 is antiferromagnetic, its Néel temperature is only ~30 K [26]. Under reactor operating temperatures, UO2 is paramagnetic and exhibits no long-range magnetic order. Therefore, the non-magnetic model that preserves the high symmetry has been employed in this work. This approach has also been adopted in prior studies of UO2 [27,28] and yields structural and elastic parameters that are in good agreement with the experiment. This approximation suppresses local 5f moments and correlation effects; it is used solely to preserve cubic symmetry for elastic constant calculations, not as a precise description of the paramagnetic electronic structure.

2.2. Supercell Modeling of Mo

Pure UO2 crystallizes in the fluorite structure (space group Fm-3m) with a lattice constant of approximately 5.47 Å [29,30]. U atoms occupy the face-centered cubic positions, and O atoms occupy all the tetrahedral interstitial sites. To investigate Mo’s concentration-dependent effects, a 2 × 2 × 2 supercell of the conventional fluorite cubic cell, containing 32 U atoms and 64 O atoms (96 atoms total), was constructed as the base model. And a series of doped configurations by substituting 1, 2, 3, 4, and 5 U atoms with Mo atoms were created. This corresponds to nominal Mo concentrations of approximately 3.125, 6.25, 9.375, 12.5, and 15.625 at. % on the cation sublattice, respectively. Since the calculation of elastic modulus requires a high degree of crystal symmetry, doped atoms have tried to maintain dilute and symmetry in the crystal as much as possible, as shown in Figure 1. This is a common practice for doped system calculations, ensuring the results reflect the intrinsic concentration-dependent law rather than local atomic arrangement effects [31]. Nevertheless, elastic properties of substitutional alloys can be configuration-dependent. The conclusions of this work are valid for the specific symmetric arrangements studied; different Mo distributions may yield quantitatively different moduli, and the non-monotonic trend should be confirmed with broader configurational sampling in future work. The formation enthalpy H f for each doped system was calculated to assess thermodynamic stability using the following formula [32]:
H f = E M o : U O 2 E U O 2 n E M o + n E U / 96
where E M o : U O 2 and E U O 2 are the total energies of the doped and pure supercells, and n represents the number of substituted Mo atoms. The chemical potentials E M o and E U of elemental Mo and U were derived from optimized pure bulk metallic structures. It should be noted that these reference chemical potentials differ from the chemical states of U and Mo ions in the UO2 lattice; thus, the obtained formation enthalpy is an approximate value. The geometry of each doped supercell was fully relaxed without any symmetry constraints, allowing the lattice vectors and internal atomic positions to adjust to the presence of the Mo solutes.

2.3. Calculation of Elastic Constants and Moduli

The elastic constants (Cᵢⱼ) define the linear relationship between applied strain and the resulting stress in a crystal. For a cubic crystal like pure UO2, there are three independent elastic constants: C11, C12, and C44. However, the introduction of a substitutional Mo atom breaks the cubic symmetry of the supercell. Even if the average structure appears cubic, the local distortion and the lowered symmetry mean the supercell must be treated as having lower symmetry (e.g., tetragonal or orthorhombic), which possesses more independent elastic constants. In this work, we treated the relaxed Mo-doped supercell in its actual symmetry and calculated the full 6 × 6 elastic constant matrix.
The elastic constants were calculated using the efficient stress–strain method as implemented in VASP.6.3.0. For each strain pattern, the internal coordinates were relaxed under the fixed strained lattice, and the resulting stress tensor was computed. Once the elastic constant matrix is obtained, the macroscopic elastic moduli for polycrystalline aggregates can be estimated using the Voigt–Reuss–Hill (VRH) averaging scheme [33]. The Voigt (upper) and Reuss (lower) bounds for the bulk modulus (B) and shear modulus (G) are calculated from the elastic constants. The Hill average is the arithmetic mean of the Voigt and Reuss bounds, providing a reliable estimate:
B H   = B V +   B R / 2
G H = ( G V + G R ) / 2
The Young’s modulus (E) and Poisson’s ratio (ν) are then derived from B and G using standard isotropic relations:
E   = 9 B G / 3 B   +   G
ν = ( 3 B 2 G ) / ( 2 ( 3 B + G ) )
The degree of elastic anisotropy can be quantified using several indices [34]. The universal anisotropic index A U is defined as Formula (6), where B V , B R , G V , and G R are the Voigt and Reuss bounds for bulk and shear moduli, respectively. Additionally, the percent anisotropies in bulk A B and shear A G moduli are defined as Formula (7) and Formula (8). These indices provide complementary information about directional dependence of elastic response.
A U = 5   G V / G R + B V / B R 6
A B = ( B V B R ) / ( B V + B R ) × 100 %
A G = ( G V G R ) / ( G V + G R ) × 100 %
The Vickers hardness (Hv) is an empirical indicator of a material’s resistance to plastic deformation. Two widely used models [35,36] based on elastic moduli are employed here: the Chen’s model H V C [37] and the Tian’s model H V T [38].
H V C   =   2 k 2 G 0.585 3
H V T   =   0.92 k 1.137 G 0.708
where, k is the Pugh’s ratio, and k = G / B .

3. Results and Discussion

3.1. Structural Properties and Thermodynamics Stability

The relaxed lattice constant for pure UO2 calculated with the PBE + U method was found to be 5.539 Å, which is in excellent agreement with the experimental value of 5.47 Å [30]. It is worth noting that in other calculation results, the a, b, and c values of UO2 are not exactly equal [4,9], which is because they have set antiferromagnetism. However, this inequality will alter the space group of the crystal, thereby affecting the calculation process of the elastic modulus. Furthermore, the observed a, b, and c values in the experiment are equal. Therefore, antiferromagnetism was not set in this work.
Upon introducing a Mo atom, the supercell undergoes a slight decrease. Husainy et al. [39] investigate the behavior of Mo in UO2 ± x and found that the lattice parameter decreases with the addition of Mo. Lopes et al. [40] investigated the UO2 microstructural evolutions induced by Ni, Mo, and W dopants for intentional forensics, whereas the Mo and W systems caused grain size reduction at all concentrations. The volume reductions of around 0.93% for U31Mo1O64 are also observed in Huang et al.’s work [20]. This contraction may be attributable to the smaller ionic radius of Mo4+ compared to U4+ and indicates a stronger, more covalent interaction between Mo and its neighboring oxygen atoms. The Mo–O bond length is calculated to be approximately 2.3 Å, which is notably shorter than the U–O bond length of ~2.4 Å in pure UO2, as shown in Figure 2. In addition, the introduction of Mo atoms may also cause changes in the space group in this work. For instance, the space group of U29Mo3O64 and U28Mo4O64 might be P4/mmm.
The formation energy of Mo substitutional defects in U–O system was calculated, and the results reveal that the incorporation of a single Mo atom into the lattice is an exothermic process under stoichiometric conditions, as shown in Figure 3. The calculated formation energies show that Mo substitution at U sites is energetically favorable, with a negative formation energy of –3.925 eV for a single Mo atom. This is consistent with recent DFT + U calculations by Malakkal et al. [41], who also reported negative formation energies for Mo in UO2, confirming that Mo readily incorporates into the U sublattice under reducing conditions. Furthermore, such a formation energy range implies that Mo can achieve appreciable solubility in the U–O matrix under the non-equilibrium in-pile conditions. The strong Mo–O chemical bonds formed in the lattice can generate a negative energy gain, which partially offsets the lattice strain energy induced by Mo doping. Notably, the variation trend of formation energy with the increase in Mo content clearly demonstrates a critical limit for Mo solid solubility: the formation energy increases continuously as the number of Mo atoms rises from 1 to 5, indicating that substitution becomes progressively less favorable with increasing Mo content under the static 0 K conditions considered. A rigorous solubility limit cannot be determined from these data without considering configurational and vibrational entropy, oxygen non-stoichiometry, or competing secondary phases. Y.K. Ha et al. [11] adopted a dry chemical method to prepare UO2 pellets with Mo contents ranging from 0 to 15 mol% and found that the maximum solubility of Mo in UO2 was 4 mol%. However, Husainy et al. [39] suggest the solubility threshold of Mo in UO2 is undoubtedly way lower than that suggested by Ha et al. [11] of 4 mol% Mo.

3.2. Elastic Constants

It is important to note that the elastic property calculations in this work are performed for systems with up to three Mo atoms (Mo3, 9.375 at. %). This upper limit is set for several reasons. Firstly, as indicated by the trend of formation energy in Table 1 and the lattice parameter evolution, the solid solution of Mo in UO2 becomes progressively less favorable with increasing concentration. The formation energy increases monotonically, suggesting that substitution becomes less favorable with increasing Mo content. The Mo3 system, with a concentration of 9.375 at. %, may therefore be near the boundary of a thermodynamically stable solid solution, as shown in Figure 3b. Beyond this concentration, the system may tend to form secondary phases, for which a simple substitutional solid-solution model would be inadequate. Secondly, the structural analysis reveals a reduction in symmetry for the Mo3 system, which transitions from a cubic to a tetragonal lattice. Higher Mo concentrations are expected to induce even more severe lattice distortion and potentially further symmetry reduction, making the calculation and interpretation of elastic constants increasingly complex. Therefore, to maintain consistency within the solid-solution model and to ensure the reliability of the calculated elastic constants, this study focuses on the concentration regime up to Mo3. This range adequately captures the transition from a dilute, strengthening regime (Mo1) to a regime where lattice distortion and softening begin to dominate (Mo2 and Mo3), providing a comprehensive picture of Mo’s influence on the elastic properties of UO2 within its solubility limit.
The calculated independent elastic constants for pure UO2 and Mo-doped supercells are listed in Table 2. For pure cubic UO2 (space group Fm-3m), our calculated C11, C12, and C44 values are 378.99 GPa, 103.43 GPa, and 54.46 GPa, respectively. These values align well with previous DFT + U studies and are in reasonable agreement with experimental data, which typically reports C11 around 345–396 GPa, C12 around 115–140 GPa, and C44 around 59–72 GPa [4,28]. For the Mo-doped supercells, the elastic constants exhibit a strong dependence on both concentration and symmetry. At low doping levels, Mo1 and Mo2, the systems retain cubic symmetry (space groups Pm-3m and Im-3m, respectively), and three independent constants are sufficient. However, at a doping concentration of Mo3, the symmetry reduces to tetragonal (space group P4/mmm), necessitating six independent constants: C11, C12, C13, C33, C44, and C66.
The introduction of Mo leads to significant and non-monotonic changes in the elastic constants. For the Mo1-doped system, C44 increases dramatically by approximately 46% compared to pure UO2, indicating a substantial increase in shear resistance. However, for the Mo2-doped system, C44 decreases to a value even lower than that of pure UO2. This non-monotonic behavior suggests that the elastic response is highly sensitive to the distribution and interaction between Mo atoms. For the Mo3-doped system, which exhibits tetragonal symmetry, the shear constants C44 and C66 are both significantly reduced. This indicates that, once a critical concentration is reached, the local lattice distortion and symmetry breaking can lead to a softening of the shear modes. The Born mechanical stability criteria for Mo3-doped system are fully satisfied: C11 = 362.26 GPa > 0, C33 = 335.30 GPa > 0, C44 = 35.30 GPa > 0, C66 = 25.88 GPa > 0; C11−|C12| = 245.16 GPa > 0; C11 + C33−2C13 = 161.06 GPa > 0; 2 (C11 + C12) + C33 + 4C13 = 1562.28 GPa > 0. The stability criteria for the elastic constants are satisfied for all systems, confirming their mechanical stability [42].

3.3. Macroscopic Elastic Moduli and Anisotropy

Using the Voigt–Reuss–Hill (VRH) averaging scheme, the bulk modulus (B), shear modulus, Young’s modulus, and Poisson’s ratio were derived and are presented in Figure 4. For pure UO2, our calculated B, G, and E are 195.29 GPa, 79.81 GPa, and 210.73 GPa, respectively, with a Poisson’s ratio of 0.32. These values are consistent with the ranges reported in the literature from both computations and experiments [4,28,43,44,45,46,47].
The influence of Mo on the macroscopic moduli is complex and concentration-dependent. For the Mo1-doped system, the G and E increase by approximately 16% and 14%, respectively, compared to pure UO2. This significant enhancement indicates that a small amount of Mo (3.125 at. %) can effectively stiffen the UO2 matrix, primarily due to the shorter and more directionally bonded Mo–O interactions acting as local reinforcement. The bulk modulus remains almost unchanged. Consequently, the B/G ratio decreases from 2.45 to 2.11. According to Pugh’s criterion [48] (B/G > 1.75 indicates ductility), both pure and Mo1-doped UO2 are classified as ductile materials. However, the reduction in B/G and Poisson’s ratio suggests that the material becomes less ductile and more resistant to plastic flow with the addition of Mo, consistent with a more covalent character.
In contrast, for the Mo2-doped and Mo3-doped systems, both G and E decrease significantly compared to pure UO2, indicating a softening of the material at higher Mo concentrations. This trend correlates with the decrease in shear constants C44 and C66 observed in Table 2. The B/G ratio increases to 3.12 and 3.52, respectively, which, while still indicating overall ductility, suggests that the material’s response to shear deformation is markedly altered. This softening at higher concentrations may be attributed to the increased lattice distortion, the onset of symmetry reduction, and the possible formation of Mo–Mo interactions that weaken the overall network of strong Mo–O bonds.
The calculated anisotropic indices are presented in Figure 5. Pure UO2 in its cubic form is elastically isotropic, reflected in the A U , A B and A G  values, which are very close to zero. The introduction of Mo induces anisotropy. For the cubic Mo1-doped system, the universal anisotropic index A U  is 0.18, indicating a slight but measurable directional preference. Anisotropy becomes more pronounced in the Mo2-doped system and is even larger for the tetragonal Mo3-doped system. The shear anisotropy, A G , increases from 0.2% in pure UO2 to 3.6% in Mo1-doped UO2 and to 19.5% in Mo2-doped UO2. This indicates that, while the distortion from isolated Mo atoms is localized, it imparts a detectable directional preference to the elastic response. For the Mo3-doped system, anisotropy is even more significant, reflecting the lower symmetry of the crystal structure. This induced anisotropy could influence micro-crack initiation and propagation paths in a polycrystalline fuel containing Mo solutes; this should be considered in multi-scale fuel performance models.

3.4. Electronic Structure and Bonding Analysis

To elucidate the microscopic origin of the observed elastic behavior, we calculated the charge density and performed Bader charge analysis for both pure and Mo1-doped UO2. These methods provide visual and quantitative insights into charge transfer and bonding modifications induced by Mo doping, while Bader analysis offers quantitative charge transfer information.
Figure 6 shows the total charge density maps of pristine UO2 and Mo-substituted UO2 reveal the electronic structure changes upon doping. In the pristine phase, all U atomic sites exhibit uniform, square-shaped charge density distributions with consistent green intensity, reflecting the highly symmetric cubic lattice and isotropic 5f electron localization of U atoms. The interstitial O sites remain as low-charge-density blue regions, characteristic of the predominantly ionic U–O bonding.
Upon substituting a central U atom with Mo, two distinct electronic changes are observed. The Mo center displays a dramatic increase in charge density (evident from the red-to-orange color gradient, approaching the maximum value of the color scale), indicating strong electron localization around the Mo nucleus. This enhanced charge density arises from the distinct valence electronic configuration of Mo compared to U, leading to a more compact, covalently bonded electron distribution between Mo and neighboring O atoms. Further, the surrounding U atoms retain nearly identical charge density magnitudes (green intensity) as in the pristine phase, but their electron cloud shape evolves from regular squares to irregular polygons. This symmetry reduction reflects long-range electronic and structural perturbations from the Mo dopant, which distort the cubic lattice and reorient the anisotropic 5f electron clouds of neighboring U atoms, without altering their total electron count. Notably, the interstitial O regions remain uniformly blue across both phases, confirming that the O 2p electronic states are largely unaffected by doping, preserving the ionic character of the U–O bonding network in the host lattice.
Bader charges provide a qualitative measure of charge transfer and bond ionicity, and the results are summarized in Figure 7. The PAW pseudopotentials used in this work treat U with 14 valence electrons, Mo with 12 valence electrons, and O with 6 valence electrons. These initial valence electron counts are essential for interpreting net charge transfer. For pure UO2, the average Bader charge on U is +11.44 |e|, corresponding to a net loss of approximately 2.56 electrons per U atom. The O atoms carry an average charge of –7.28 |e|, indicating a net gain of about 1.28 electrons. This charge transfer is consistent with the predominantly ionic nature of the U–O bond, as visually observed in the charge density maps.
Upon Mo substitution, the Mo atom exhibits a Bader charge of +11.87 |e|, corresponding to a net loss of only 0.13 electrons from its initial 12 valence electrons. Such limited charge transfer, combined with the significantly shorter Mo–O bond length (2.268 Å vs. 2.399 Å for U–O), may facilitate enhanced localized bonding character. This finding corroborates the high charge density observed around the Mo center in the charge density maps. The neighboring O atoms around Mo show slightly more negative charges (approximately –7.30 |e|) compared to the average in pure UO2, further indicating enhanced electron density around the Mo–O bonds. The Bader charges for U and O in this work fall within the ranges reported by Malakkal et al. [41] for UO2 (11.31–11.41 |e| for U and 7.26–7.30 |e| for O).
The U atoms adjacent to the Mo impurity exhibit slight variations in their Bader charges from +11.39 |e| to +11.47 |e| compared to the pure system. This minor fluctuation, despite the significant distortion of their electron cloud shapes observed in the charge density maps, confirms that the perturbation is primarily geometric and orbital-reorientated in nature, rather than involving substantial charge transfer. The total electron count on neighboring U atoms remains nearly unchanged, consistent with the green intensity observed in Figure 7b.
The combined evidence from charge density visualization and Bader charge analysis provides a clear microscopic picture. The Mo–O bond exhibits enhanced directional bonding compared to the predominantly ionic U–O bond. These potentially strengthened directional interactions act as local “hard spots” that resist bond bending and stretching under shear deformation. This may explain the increased shear modulus and Young’s modulus observed for the Mo1-doped system, as well as the reduction in Cauchy pressure—all consistent with enhanced localized bonding. At higher Mo concentrations (Mo2 and Mo3), the lattice distortion becomes more severe, and interactions between Mo atoms may weaken the overall network of strong bonds, resulting in the observed softening.
Cauchy pressure [49] is an empirical auxiliary indicator of the nature of atomic bonding in cubic crystals. A positive Cauchy pressure is typically associated with non-directional bonding, while a negative value suggests directional, covalent bonding. For pure UO2, the Cauchy pressure is positive, which is close to the ionic character of the U–O bond, as shown in Figure 8. Upon Mo doping, the Cauchy pressure for the Mo1-doped system decreases to 38.3 GPa. This reduction, moving towards a less positive value, may suggest an increased covalent contribution to the bonding, which aligns with the strong Mo–O hybridization observed in the electronic structure analysis. In contrast, for the Mo2- and Mo3-doped systems, the Cauchy pressure increases dramatically to 86.4 GPa and 81.8 GPa, respectively. This sharp increase may indicate a relatively enhanced bond delocalization at higher Mo concentrations, reflecting a weakening of the covalent network formed at low doping levels. This delocalization is likely driven by increased lattice distortion, symmetry reduction, and the emergence of more metallic or ionic interactions between atoms. These changes provide a plausible explanation for the observed softening in these systems.
The Kleinman parameter describes the relative ease of internal atomic displacements in response to bond bending or stretching [50]. A lower Kleinman parameter value (<0.5) indicates that bond stretching dominates, while a higher Kleinman parameter value (>0.5) suggests that bond bending is more significant. Pure UO2 has a Kleinman parameter of 0.49, which is close to the threshold, suggesting a balanced contribution. For Mo1-doped UO2, Kleinman parameter increases to 0.58, implying that bond bending becomes more dominant. This is consistent with the introduction of a smaller, more covalent Mo atom that may induce local distortions, making the lattice more accommodating to angle changes. For the Mo2-doped system, Kleinman parameter further increases to 0.69, indicating that bond bending plays an even more significant role. This could be a contributing factor to the observed softening, as a system that deforms more readily through bond bending may exhibit a lower resistance to shear. For the Mo3-doped system, the Kleinman parameter decreases to 0.56, possibly due to the symmetry reduction and reorganization of bonding networks.

3.5. Thermal Properties and Vickers Hardness

The P-wave modulus represents the resistance to longitudinal deformation and is directly related to the longitudinal wave velocity [51]. For the Mo1-doped system, the P-wave modulus increases compared to pure UO2, indicating a stiffening of the lattice and a faster propagation of the elastic waves. This is consistent with the observed increase in Young’s and shear moduli. In contrast, for Mo2- and Mo3-doped systems, these values decrease, reflecting the softening at higher Mo concentrations. The average wave velocity follows the same trend, which in turn influences the Debye temperature. The Debye temperature is a fundamental parameter that correlates with the strength of interatomic bonding, lattice vibrations, and thermal conductivity [52]. A higher Debye temperature generally indicates stronger bonding and higher thermal conductivity. The calculated Debye temperature for pure UO2 is 379.0 K, which is in reasonable agreement with experimental and previous computational values. Upon doping with a single Mo atom, Debye temperature increases to 410.0 K. This significant increase provides strong evidence that the introduction of Mo enhances the overall lattice rigidity, which can be attributed to the shorter and more directional Mo–O bonding compared to U–O. However, for Mo2- and Mo3-doped systems, Debye temperature drops to 345.4 K and 325.2 K, respectively, indicating that, at higher concentrations, the lattice is effectively softened. This non-monotonic behavior mirrors the trends observed for the shear modulus and underscores the complex, concentration-dependent nature of Mo’s influence on UO2.
As shown in Figure 9, both models yield consistent trends. Zacharie-Aubrun et al. [53] summarized the Vickers hardness of unirradiated UO2 reported by previous scholars, finding that it ranges from 6.0 GPa to 10.0 GPa, which is in good agreement with the results calculated in this work. For the Mo1-doped system, the hardness increases from approximately 7.4 GPa to 9.7 GPa, correlating with the enhanced shear modulus and Debye temperature. This increase further confirms that the enhanced directional Mo–O bonding effectively hinders plastic deformation. Conversely, for Mo2- and Mo3-doped systems, the hardness drops sharply to about 4.8 GPa and 3.8 GPa, respectively, mirroring the observed softening. This decrease can be attributed to the increased lattice distortion, symmetry reduction, and the enhanced bond delocalization at higher Mo concentrations.

4. Conclusions

In this work, we have systematically investigated the influence of Mo substitution for U atoms on the elastic properties of UO2 using first-principles DFT + U calculations. By constructing supercell models with Mo concentrations from 3.125 at. % to 9.375 at. % and employing a stress–strain method, we obtained elastic constants, derived polycrystalline moduli, and analyzed the underlying electronic structure. The key findings are as follows:
  • Mo substitution induces local lattice contraction due to the smaller ionic radius of Mo4+ and the formation of shorter, stronger Mo–O bonds. Negative formation energies for low Mo concentrations indicate that doping is energetically favorable, but substitution becomes less favorable with increasing Mo content.
  • The influence of Mo on elastic moduli is non-monotonic. At Mo1, the shear modulus (G) and Young’s modulus (E) increase by approximately 16% and 14%, respectively, indicating a pronounced stiffening effect. At Mo2-doped and Mo3-doped UO2, both G and E decrease significantly, leading to material softening.
  • The initial stiffening at low Mo concentration arises from enhanced directional Mo 4d–O 2p bonds, supported by a reduction in Cauchy pressure, an increase in Debye temperature, and a corresponding increase in Vickers hardness. The subsequent softening at higher concentrations is attributed to increased lattice distortion, symmetry reduction, and enhanced bond delocalization, as evidenced by the sharp increase in Cauchy pressure, decrease in Debye temperature, and drop in hardness to approximately 3.8–4.8 GPa.

Author Contributions

Conceptualization, T.P. and X.W.; methodology, T.C.; software, A.T.; formal analysis, H.X. and J.S.; writing—original draft preparation, H.X. and H.L.; writing—review and editing, T.C. and P.P.; funding acquisition, J.S. and P.P. All authors have read and agreed to the published version of the manuscript.

Funding

This work was supported by the Stable Support Project (Grant No. WDZC-2023-01-01-02), and the Youth Talent Fund of the Nuclear Power Institute of China (Grant No. KJCX-2024-QNRC-18).

Data Availability Statement

The original contributions presented in this study are included in the article. Further inquiries can be directed to the corresponding authors.

Acknowledgments

During the preparation of this manuscript, the authors used DeepSeek-R1 (2026) for grammar and spelling checking. The authors have reviewed and edited the output and take full responsibility for the content of this publication.

Conflicts of Interest

The authors declare no conflicts of interest.

References

  1. Goodson, M.; Noble, G.; Li, L.; Cai, L.; Pavlov, T.; Munro, T. Review of Thermal Gap Conductance Models and Measurement Approaches Toward an Understanding Beyond UO2 and Zirconium-Alloy Interfaces. Int. J. Thermophys. 2025, 46, 112. [Google Scholar] [CrossRef]
  2. Ge, Z.; Yan, D.; Lei, P.; Yun, D. A Comprehensive Review of High Burn-Up Structure Formation in UO2: Mechanisms, Interactions, and Future Directions. Nanomaterials 2025, 15, 325. [Google Scholar] [CrossRef]
  3. Koivuranta, S. Gamma Spectrometry and Gamma and X-Ray Tomography of Nuclear Fuel. Master’s Thesis, Lappeenranta University of Technology, Lappeenranta, Finland, 2009. [Google Scholar]
  4. Huang, Z.; Ma, L.; Zhang, J.; Zhou, Q.; Yang, L.; Wang, H. First-principles study of elastic and thermodynamic properties of UO2, γ-UO3 and α-U3O8. J. Nucl. Mater. 2022, 572, 154084. [Google Scholar] [CrossRef]
  5. Szuta, M. Total surface area change of Uranium dioxide fuel in function of burn-up and its impact on fission gas release during neutron irradiation for small, Intermediate and High Burn-up. In Proceedings of the 9th International Conference on WWER Fuel Performance, Modelling and Experimental Support, Burgas, Bulgaria, 17–24 September 2011. [Google Scholar]
  6. Lei, Y.; Huang, H.; Yu, C.; Yang, J.; Liu, Y. Effect of Zr-doping on Structure and Mechanical Properties of UO2 by First-principles Calculations. J. Mater. Sci. Eng. 2014, 32, 126–153. [Google Scholar] [CrossRef]
  7. Chen, T.; Yuan, Y.; Wang, J.; Wu, J.; Wang, B.; Chen, X.; Moelans, N.; Wang, J.; Pan, F. Features and classification of solid solution behavior of ternary Mg alloys. J. Magnes. Alloys 2025, 13, 2522–2539. [Google Scholar] [CrossRef]
  8. Chen, T.; Gao, Q.; Yuan, Y.; Li, T.; Xi, Q.; Liu, T.; Tang, A.; Pan, F. Coupling physics in machine learning to investigate the solution behavior of binary Mg alloys. J. Magnes. Alloy 2022, 10, 2817. [Google Scholar] [CrossRef]
  9. Vazhappilly, T.; Kumar Pathak, A. A first principle based study on the mechanical and thermal properties of UO2: Effect of La and Dy fission product concentrations. Comp. Mater. Sci. 2020, 185, 109933. [Google Scholar] [CrossRef]
  10. Alharbi, F.; Ragnauth, H.; Abram, T.; Turner, J. Fabrication of UO2–Mo composite fuel pellets with enhanced thermal conductivity by using wet mixing. J. Nucl. Mater. 2026, 623, 156440. [Google Scholar] [CrossRef]
  11. Ha, Y.; Kim, J.; Park, Y.; Park, S.; Song, K. Behaviors of molybdenum in UO2 fuel matrix. Nucl. Eng. Technol. 2011, 43, 309–316. [Google Scholar] [CrossRef]
  12. Denecke, M.A.; Petersmann, T.; Marsac, R.; Dardenne, K.; Vitova, T.; Prüßmann, T.; Borchert, M.; Bösenberg, U.; Falkenberg, G.; Wellenreuther, G. XANES characterization of UO2/Mo(Pd) thin films as models for ϵ-particles in spent nuclear fuel. J. Phys. Conf. Ser. 2013, 430, 012113. [Google Scholar] [CrossRef]
  13. Kim, D.; Kim, D.; Oh, J.; Jeon, S.; Kim, K.; Kim, J.; Yang, J. Enhanced Radial Thermal Conductivity of UO2 Fuel Pellets with Molybdenum Microplates. In Proceedings of the TopFuel 2018 Conference, Prague, Czech Republic, 30 September–4 October 2018; Available online: https://www.euronuclear.org/archiv/topfuel2018/fullpapers/TopFuel2018-A0060-fullpaper.pdf (accessed on 9 April 2026).
  14. Frazer, D.; Jadernas, D.; Bolender, N.; Madden, J.; Giglio, J.; Hosemann, P. Elevated temperature microcantilever testing of fresh U-10Mo fuel. J. Nucl. Mater. 2019, 526, 151746. [Google Scholar] [CrossRef]
  15. Gong, H.; Xiao, H.; Wu, H.; Meng, F.; Ren, Q.; Liao, Y.; Zhang, G. The comparable structural, elastic anisotropic and thermophysical properties of advanced U–Si fuel to baseline UO2: A DTF method. Eur. Phys. J. B 2022, 95, 121. [Google Scholar] [CrossRef]
  16. Hadi, M.; Dahlqvist, M.; Christopoulos, S.-R.; Naqib, S.; Chroneos, A.; Islam, A. Chemically stable new MAX phase V2 SnC: A damage and radiation tolerant TBC material. RSC Adv. 2020, 10, 43783–43798. [Google Scholar] [CrossRef]
  17. Wang, K.; Xiang, H.; Xu, L.; Feng, A.; Qu, S.; Wang, H.; Chen, D. The Effect of Nb Doping on the Properties of Ti-Al Intermetallic Compounds Using First-Principles Calculations. Materials 2024, 17, 358. [Google Scholar] [CrossRef]
  18. Kresse, G.; Hafner, J. Ab initio molecular dynamics for liquid metals. Phys. Rev. B 1993, 48, 558–561. [Google Scholar] [CrossRef] [PubMed]
  19. Kresse, G.; Furthmüller, J. Efficient iterative schemes for ab initio total-energy calculations using a plane-wave basis set. Phys. Rev. B 1996, 54, 11169–11186. [Google Scholar] [CrossRef]
  20. Huang, Z.; Ma, L.; Zhang, J.; Zhou, Q.; Yang, L.; Wang, H. A first-principles simulation study on solubility of La, Nd, Zr and Mo in UO2 and U3O8. J. Nucl. Mater. 2025, 603, 155414. [Google Scholar] [CrossRef]
  21. Perdew, J.P.; Burke, K.; Ernzerhof, M. Generalized gradient approximation made simple. Phys. Rev. Lett. 1996, 77, 3865. [Google Scholar] [CrossRef]
  22. Yamazaki, T.; Kotani, A. Systematic Analysis of 4f Core Photoemission Spectra in Actinide Oxides. J. Phys. Soc. Jpn. 1991, 60, 49–52. [Google Scholar] [CrossRef]
  23. Reshak, A.H. Electronic structure and optical properties of β-RbSm(MoO4)2 from spin polarization calculations DFT+U. Mater. Chem. Phys. 2017, 192, 260–267. [Google Scholar] [CrossRef]
  24. Solovyev, I. Magnetic interactions in transition-metal oxides. arXiv 2003, arXiv:cond-mat/0305668. [Google Scholar] [CrossRef]
  25. Wang, V.; Xu, N.; Liu, J.; Tang, G.; Geng, W. VASPKIT: A user-friendly interface facilitating high-throughput computing and analysis using VASP code. Comput. Phys. Commun. 2021, 267, 108033. [Google Scholar] [CrossRef]
  26. Jaime, M.; Saul, A.; Salamon, M.; Zapf, V.S.; Harrison, N.; Durakiewicz, T.; Lashley, J.C.; Andersson, D.A.; Stanek, C.R.; Smith, J.L.; et al. Piezomagnetism and magnetoelastic memory in uranium dioxide. Nat. Commun. 2017, 8, 99. [Google Scholar] [CrossRef]
  27. Sanati, M.; Albers, R.; Lookman, T.; Saxena, A. Elastic constants, phonon density of states, and thermal properties of UO2. Phys. Rev. B Condens. Matter Mater. Phys. 2011, 84, 014116. [Google Scholar] [CrossRef]
  28. Varshney, D.; Shriya, S. Pressure and temperature dependent elastic, mechanical and thermodynamical properties of nuclear fuel: UO2 and UN2. J. Nucl. Mater. 2013, 440, 344–365. [Google Scholar] [CrossRef]
  29. Behera, R.K.; Deo, C.S.; Xu, H. Effect of the substitution of f-electron elements on the structure and elastic properties of UO2. J. Nucl. Mater. 2013, 433, 504–513. [Google Scholar] [CrossRef]
  30. Nandi, C.; Phatak, R.; Shafeeq, M.; Kesari, S.; Rao, R.; Prakash, A. Phase relations and lattice parameter trends in Nd3+−substituted UO2 system under reducing and oxidizing conditions. J. Nucl. Mater. 2023, 579, 154396. [Google Scholar] [CrossRef]
  31. Debernardi, A. First principles simulations of microscopic mechanisms responsible for the drastic reduction of electrical deactivation defects in Se hyperdoped silicon. Phys. Chem. Chem. Phys. 2021, 23, 24699–24710. [Google Scholar] [CrossRef]
  32. Chen, T.; Yuan, Y.; Mi, X.; Wu, J.; Tang, A.; Wang, J.; Moelans, N.; Pan, F. Interaction of elements in dilute Mg alloys: A DFT and machine learning study. J. Mater. Res. Technol. 2022, 21, 4512–4525. [Google Scholar] [CrossRef]
  33. Pathak, A.; Sankarasubramanian, R. First-principle calculations of Co2MSi (M = Cr, Mn, Fe) Heusler alloys. J. Appl. Res. Technol. 2022, 20, 355–368. [Google Scholar] [CrossRef]
  34. Ranganathan, S.I.; Ostoja-Starzewski, M. Universal elastic anisotropy index. Phys. Rev. Lett. 2008, 101, 055504. [Google Scholar] [CrossRef]
  35. Balasubramanian, K.; Khare, S.V.; Gall, D. Valence electron concentration as an indicator for mechanical properties in rocksalt structure nitrides, carbides and carbonitrides. Acta Mater. 2018, 152, 175–185. [Google Scholar] [CrossRef]
  36. Wang, M.; Zhou, Y.; Chen, T.; Yang, H.; Tan, J.; Chen, X.; Pan, F. Tailoring the structure, mechanical, electronic, and thermodynamic properties of Al8Mn5 by doping Ti atom with different atomic site configurations. J. Mater. Res. Technol. 2023, 26, 4469–4482. [Google Scholar] [CrossRef]
  37. Chen, X.; Niu, H.; Li, D.; Li, Y. Modeling hardness of polycrystalline materials and bulk metallic glasses. Intermetallics 2011, 19, 1275–1281. [Google Scholar] [CrossRef]
  38. Tian, Y.; Xu, B.; Zhao, Z. Microscopic theory of hardness and design of novel superhard crystals. Int. J. Refract. Met. Hard Mater. 2012, 33, 93–106. [Google Scholar] [CrossRef]
  39. Husainy, M.; Szenknect, S.; Podor, R.; Le Goff, X.; Kaczmarek, T.; Moisy, P.; Dacheux, N. Speciation and chemical behavior of molybdenum in uranium dioxide samples prepared by hydroxide precipitation. J. Nucl. Mater. 2024, 596, 155075. [Google Scholar] [CrossRef]
  40. Lopes, D.A.; Ulrich, T.; Kercher, A.; Bronikowski, M.; Samperton, K.; Scott, S.; Wellons, M.; Green, G.; Spano, T.; Harp, J.; et al. UO2 microstructural evolutions induced by Ni, Mo, and W dopants for intentional forensics. J. Nucl. Mater. 2025, 614, 155885. [Google Scholar] [CrossRef]
  41. Malakkal, L.; Zhou, S.; Mishra, H.; Bachhav, M.; Ke, J.H.; Jiang, C.; He, L.; Biswas, S. Xenon–metal pair formation in UO2 investigated using DFT + U. J. Appl. Phys. 2025, 137, 155001. [Google Scholar] [CrossRef]
  42. Gusev, A.I.; Sadovnikov, S.I. Conditions of elastic mechanical stability and elastic properties of crystal structures with different symmetry. Phys. Solid State 2022, 64, 671–675. [Google Scholar] [CrossRef]
  43. Gong, B.; Frazer, D.; Yao, T.; Hosemann, P.; Tonks, M.; Lian, J. Nano- and micro-indentation testing of sintered UO2 fuel pellets with controlled microstructure and stoichiometry. J. Nucl. Mater. 2019, 516, 169–177. [Google Scholar] [CrossRef]
  44. Gong, B.; Frazer, D.; Shaffer, B.; Lim, H.C.; Hosemann, P.; Peralta, P. Micro-cantilever beam experiments and modeling in porous polycrystalline UO2. J. Nucl. Mater. 2021, 557, 153210. [Google Scholar] [CrossRef]
  45. Kurosaki, K.; Saito, Y.; Uno, M.; Yamanaka, S. Characterization of simulated burnup fuel by nanoindentation. J. Nucl. Mater. 2006, 350, 203–207. [Google Scholar] [CrossRef]
  46. Schneider, C.; Fayette, L.; Zacharie-Aubrun, I.; Blay, T.; Sercombe, J.; Favergeon, J.; Chevalier, S. Study of the hardness and Young’s modulus at the fuel-cladding interface of a high-burnup PWR fuel rod by nanoindentation measurements. J. Nucl. Mater. 2022, 560, 153511. [Google Scholar] [CrossRef]
  47. Henry, R.; Zacharie-Aubrun, I.; Blay, T.; Tarisien, N.; Chalal, S.; Iltis, X.; Gatt, J.-M.; Langlois, C.; Meille, S. Irradiation effects on the fracture properties of UO2 fuels studied by micro-mechanical testing. J. Nucl. Mater. 2020, 536, 152179. [Google Scholar] [CrossRef]
  48. Pugh, S.F. XCII. Relations between the elastic moduli and the plastic properties of polycrystalline pure metals. Lond. Edinb. Dublin Philos. Mag. J. Sci. 1954, 45, 823–843. [Google Scholar] [CrossRef]
  49. Senkov, O.N.; Miracle, D.B. Generalization of intrinsic ductile-to-brittle criteria by Pugh and Pettifor for materials with a cubic crystal structure. Sci. Rep. 2021, 11, 4531. [Google Scholar] [CrossRef]
  50. Kleinman, L. Deformation Potentials in Silicon. I. Uniaxial Strain. Phys. Rev. 1962, 128, 2614–2621. [Google Scholar] [CrossRef]
  51. Ullah, W. Effects of Fault Zones and Hydrothermal Alteration on the Physical Properties of Crystalline Rocks. Master’s Thesis, Aalto University, Espoo, Finland, 2025. [Google Scholar]
  52. Naher, M.I.; Naqib, S.H. An ab-initio study on structural, elastic, electronic, bonding, thermal, and optical properties of topological Weyl semimetal TaX (X = P, As). Sci. Rep. 2021, 11, 5592. [Google Scholar] [CrossRef]
  53. Zacharie-Aubrun, I.; Henry, R.; Blay, T.; Brunaud, L.; Gatt, J.M.; Noirot, J.; Meille, S. Effects of irradiation on mechanical properties of nuclear UO2 fuels evaluated by Vickers indentation at room temperature. J. Nucl. Mater. 2021, 547, 152821. [Google Scholar] [CrossRef]
  54. Kurosaki, K.; Saito, Y.; Muta, H.; Uno, M.; Yamanaka, S. Nanoindentation studies of UO2 and (U,Ce)O2. J. Alloys Compd. 2004, 381, 240–244. [Google Scholar] [CrossRef]
  55. Spino, J.; Cobos-Sabate, J.; Rousseau, F. Room-temperature microindentation behaviour of LWR-fuels, part 1: Fuel microhardness. J. Nucl. Mater. 2003, 322, 204–216. [Google Scholar] [CrossRef]
  56. Xiao, H.; Wang, X.; Long, C.; Chen, H. Effect of burnup on the mechanical properties of doped UO2 ceramic pellets using the simfuel technique. J. Nucl. Mater. 2019, 524, 247–255. [Google Scholar] [CrossRef]
Figure 1. Crystal structures of pure UO2 and UO2 with 3.125–15.625% Mo doping. Cyan-blue = U, red = O, lavender-purple = Mo.
Crystals 16 00378 g001
Figure 2. Comparison of Mo–O and U–O bond lengths in Mo-doped UO2 crystal. Cyan-blue = U, red = O, lavender-purple = Mo.
Crystals 16 00378 g002
Figure 3. Pure and Mo-doped UO2 with various doping concentrations of (a) volume and (b) formation enthalpy.
Crystals 16 00378 g003
Figure 4. Calculated macroscopic elastic moduli: (a) B, G and E; (b) ν and B/G.
Crystals 16 00378 g004
Figure 5. Anisotropic indices for pure and Mo-doped UO2.
Crystals 16 00378 g005
Figure 6. Charge density of (a) pure UO2 and (b) Mo1-doped UO2.
Crystals 16 00378 g006
Figure 7. Bader charge of (a) pure UO2 and (b) Mo1-doped UO2. Cyan-blue = U, red = O, lavender-purple = Mo.
Crystals 16 00378 g007
Figure 8. (a) Cauchy pressure and (b) Kleinman parameter for pure and Mo-doped UO2.
Crystals 16 00378 g008
Figure 9. (a) P-wave modulus and Debye temperature for pure and Mo-doped UO2; (b) Vickers hardness measured by Kurosaki et al. [54], Spino et al. [55], Xiao [56] and this work using Chen’s [37] and Tian’s [38] model.
Crystals 16 00378 g009
Table 1. The lattice of pure and Mo-doped UO2 with various doping concentrations.
SystemLattice Parameters (Å)Volume/Formula Unit (Å3)Formation Energy (eV/Atom)Reference
abc
U4O85.4715.4715.47140.939-Exp. [30]
5.5695.5055.56742.667-PBE + U [9]
5.5695.5695.50242.659−3.63PBE + U [4]
5.5395.5395.53942.485−3.716This work
U31Mo1O6411.05711.05711.05742.248−3.925
U30Mo2O6411.02111.02111.02141.833−3.842
U29Mo3O6411.01510.98410.98441.531−3.742
U28Mo4O6410.95410.95410.98041.176−3.66
U27Mo5O6410.93010.93010.93040.805−3.526
Table 2. Calculated elastic constants (Cij; in GPa).
SystemCrystal SystemC11C12C13C33C44C66
Pure UO2Cubic378.99103.43 54.46
Mo1-dopedCubic351.50116.37 78.87
Mo2-dopedCubic353.08145.16 54.27
Mo3-dopedTetragonal362.26117.10 335.3035.3025.88
Disclaimer/Publisher’s Note: The statements, opinions and data contained in all publications are solely those of the individual author(s) and contributor(s) and not of MDPI and/or the editor(s). MDPI and/or the editor(s) disclaim responsibility for any injury to people or property resulting from any ideas, methods, instructions or products referred to in the content.

