Article

Numerical Simulation and Experimental Study on the Influence of Scanning Strategy on Stress–Strain Behavior of GH3536 in Laser Powder Bed Fusion

by
Suli Li
1,
Yiming Xiao
1,
Ruiting Hu
2,
Fusen Mei
1,
Yang Li
1 and
Zhen Chen
2,*
1
College of Mechanical Engineering, Xi’an University of Science and Technology, Xi’an 710054, China
2
Key Laboratory of Manufacturing System Engineering, Xi’an Jiaotong University, Xi’an 710049, China
*
Author to whom correspondence should be addressed.
Crystals 2026, 16(3), 170; https://doi.org/10.3390/cryst16030170
Submission received: 6 February 2026 / Revised: 24 February 2026 / Accepted: 26 February 2026 / Published: 28 February 2026

Abstract

High residual stresses significantly impact component performance during laser powder bed fusion (L-PBF) of GH3536 alloy. This study systematically investigates the effects of five scanning strategies (X-Scan, XY-Scan, R67, CB90, CB67) on residual stresses and deformation behavior in laser powder bed fusion-formed GH3536 high-temperature alloy. This is achieved by establishing a thermomechanically coupled mesoscale finite element model and combining it with experimental validation. The model was developed on the ANSYS APDL platform using a sequential coupling algorithm. It comprehensively considered melting latent heat, material nonlinearity, and dead-body element technology. While ensuring computational accuracy, significant computational efficiency gains were achieved through geometric scaling and reasonable simplifications (e.g., neglecting evaporation effects and assuming material isotropy). Results indicate that the 67° interlayer rotational scanning (R67) significantly reduces residual stresses, attributed to the breaking of thermal accumulation symmetry by asymmetric scanning. Component deformation is primarily governed by thermal stresses, with simulation results showing less than 10% deviation from experimental measurements. Despite the model’s medium-to-small scale and omission of size effects, its predicted trends highly correlate with X-ray diffraction measurements, validating its reliability for scan strategy optimization. Electron backscatter diffraction (EBSD) analysis further examined grain size and orientation differences at the microstructural level under the R67 strategy, revealing a more refined grain structure and KAM values. This provides theoretical support for L-PBF forming of nickel-based high-temperature alloys.

1. Introduction

Laser powder bed fusion (L-PBF) enables the integral fabrication of complex components through layer-by-layer powder spreading, selective laser melting, and metallurgical bonding [1,2,3,4]. The core process involves the successive lowering of the forming platform, powder deposition via a recoater, and laser-induced melting of the powder bed according to sliced model data. The resulting molten pool rapidly solidifies under extreme thermal gradients (up to 106 K/m), forming a metallurgical bond with the underlying layer [5,6,7]. However, localized high heat input and repeated thermal cycling during the process generate significant residual thermal stresses, which can lead to defects, warpage, and interlayer delamination. Consequently, the management of thermal stress remains a critical challenge in the L-PBF process [8].
GH3536, a nickel-based superalloy reinforced with Cr and Mo, exhibits excellent high-temperature strength and corrosion resistance in the range of 650–1000 °C, making it a promising candidate for aerospace applications [9,10,11]. Nevertheless, the presence of Cr- and Mo-rich strengthening phases, combined with the alloy’s inherently low plasticity and the buildup of thermal stress during processing, significantly increases the difficulty of L-PBF fabrication [12,13,14,15]. Therefore, optimization of process parameters is essential to mitigate thermal stress and improve forming quality [16,17,18].
In the laser powder bed fusion (L-PBF) of GH3536 superalloy, existing studies have primarily focused on mitigating residual stress through the optimization of static process parameters, such as laser energy density [19,20,21,22,23,24]. The main strategies include controlling the laser energy density to stabilize the molten pool (e.g., Arash Nikniazi et al. [20] limited the energy density to below 114 J/mm3; Hu et al. [21] optimized it within the range of 83.33–200.00 J/mm3) or employing novel scanning strategies such as checkerboard patterning and laser remelting to refine grains (e.g., Dai [19] and Gu et al. [22]). To some extent, these approaches have reduced residual stress by minimizing defects and modifying the microstructure. The study by Lu et al. [23] further correlated process parameters with thermal stress evolution and defect propagation. Hao et al. [24] investigated the influence of five scanning strategies on microstructural characteristics and demonstrated that the R67 scanning strategy yields superior mechanical properties and microstructural uniformity.
In contrast, laser scanning strategies function as dynamic control parameters that more proactively regulate heat accumulation, cooling rates, and the resultant thermomechanical evolution by directly governing the movement path and spatiotemporal distribution of the heat source. As such, they are considered critical for controlling residual stresses and suppressing cracking during L-PBF processes [7,25,26]. Extensive research has demonstrated the substantial influence of various scanning strategies—including partition scanning, line scanning with specific angular increments, and interlayer rotation—on stress distribution and microstructural development across multiple alloy systems, such as Inconel 625 [27], Inconel 718 [28], and Ti-6Al-4V [29,30], and even at the mesoscopic lattice scale [31]. These findings robustly validate the universal regulatory potential of scanning strategies.
Nevertheless, the conclusions drawn from the aforementioned studies are inherently constrained by the constitutive behavior of the specific materials investigated. In this context, numerical simulation plays an indispensable role in predicting part performance, as it not only aids in identifying potential defects but also significantly reduces the cost and time associated with additive manufacturing process optimization [32,33]. For the GH3536 alloy, although macroscopic process–property correlations have been established, numerical simulations have yet to elucidate the micromechanisms by which scanning strategies dynamically influence thermal cycling and stress evolution. This gap limits the optimization and predictive capability of residual stress control strategies.
To address this, the present study transitions the L-PBF simulation workflow from a conventional GUI-dependent approach to a fully codified, parameterized, and automated implementation based on ANSYS Parametric Design Language (APDL). A three-dimensional finite element predictive model is developed for medium-to-small-scale L-PBF forming of GH3536 alloy. A sequential thermomechanical coupling method is employed to simulate temperature fields and thermal stress distributions under five distinct scanning strategies. The model comprehensively accounts for melting enthalpy through the enthalpy method, incorporates a bilinear strain-hardening constitutive model, and utilizes element birth and death technology to substantially reduce computational time while enhancing accuracy. Experimental validation of residual stresses and deformation—conducted using X-ray diffraction (XRD) and micrometer gauge measurements—provides theoretical support for scan strategy optimization and residual stress control in L-PBF processing of GH3536.

2. Experiments and Methods

2.1. Sample Preparation

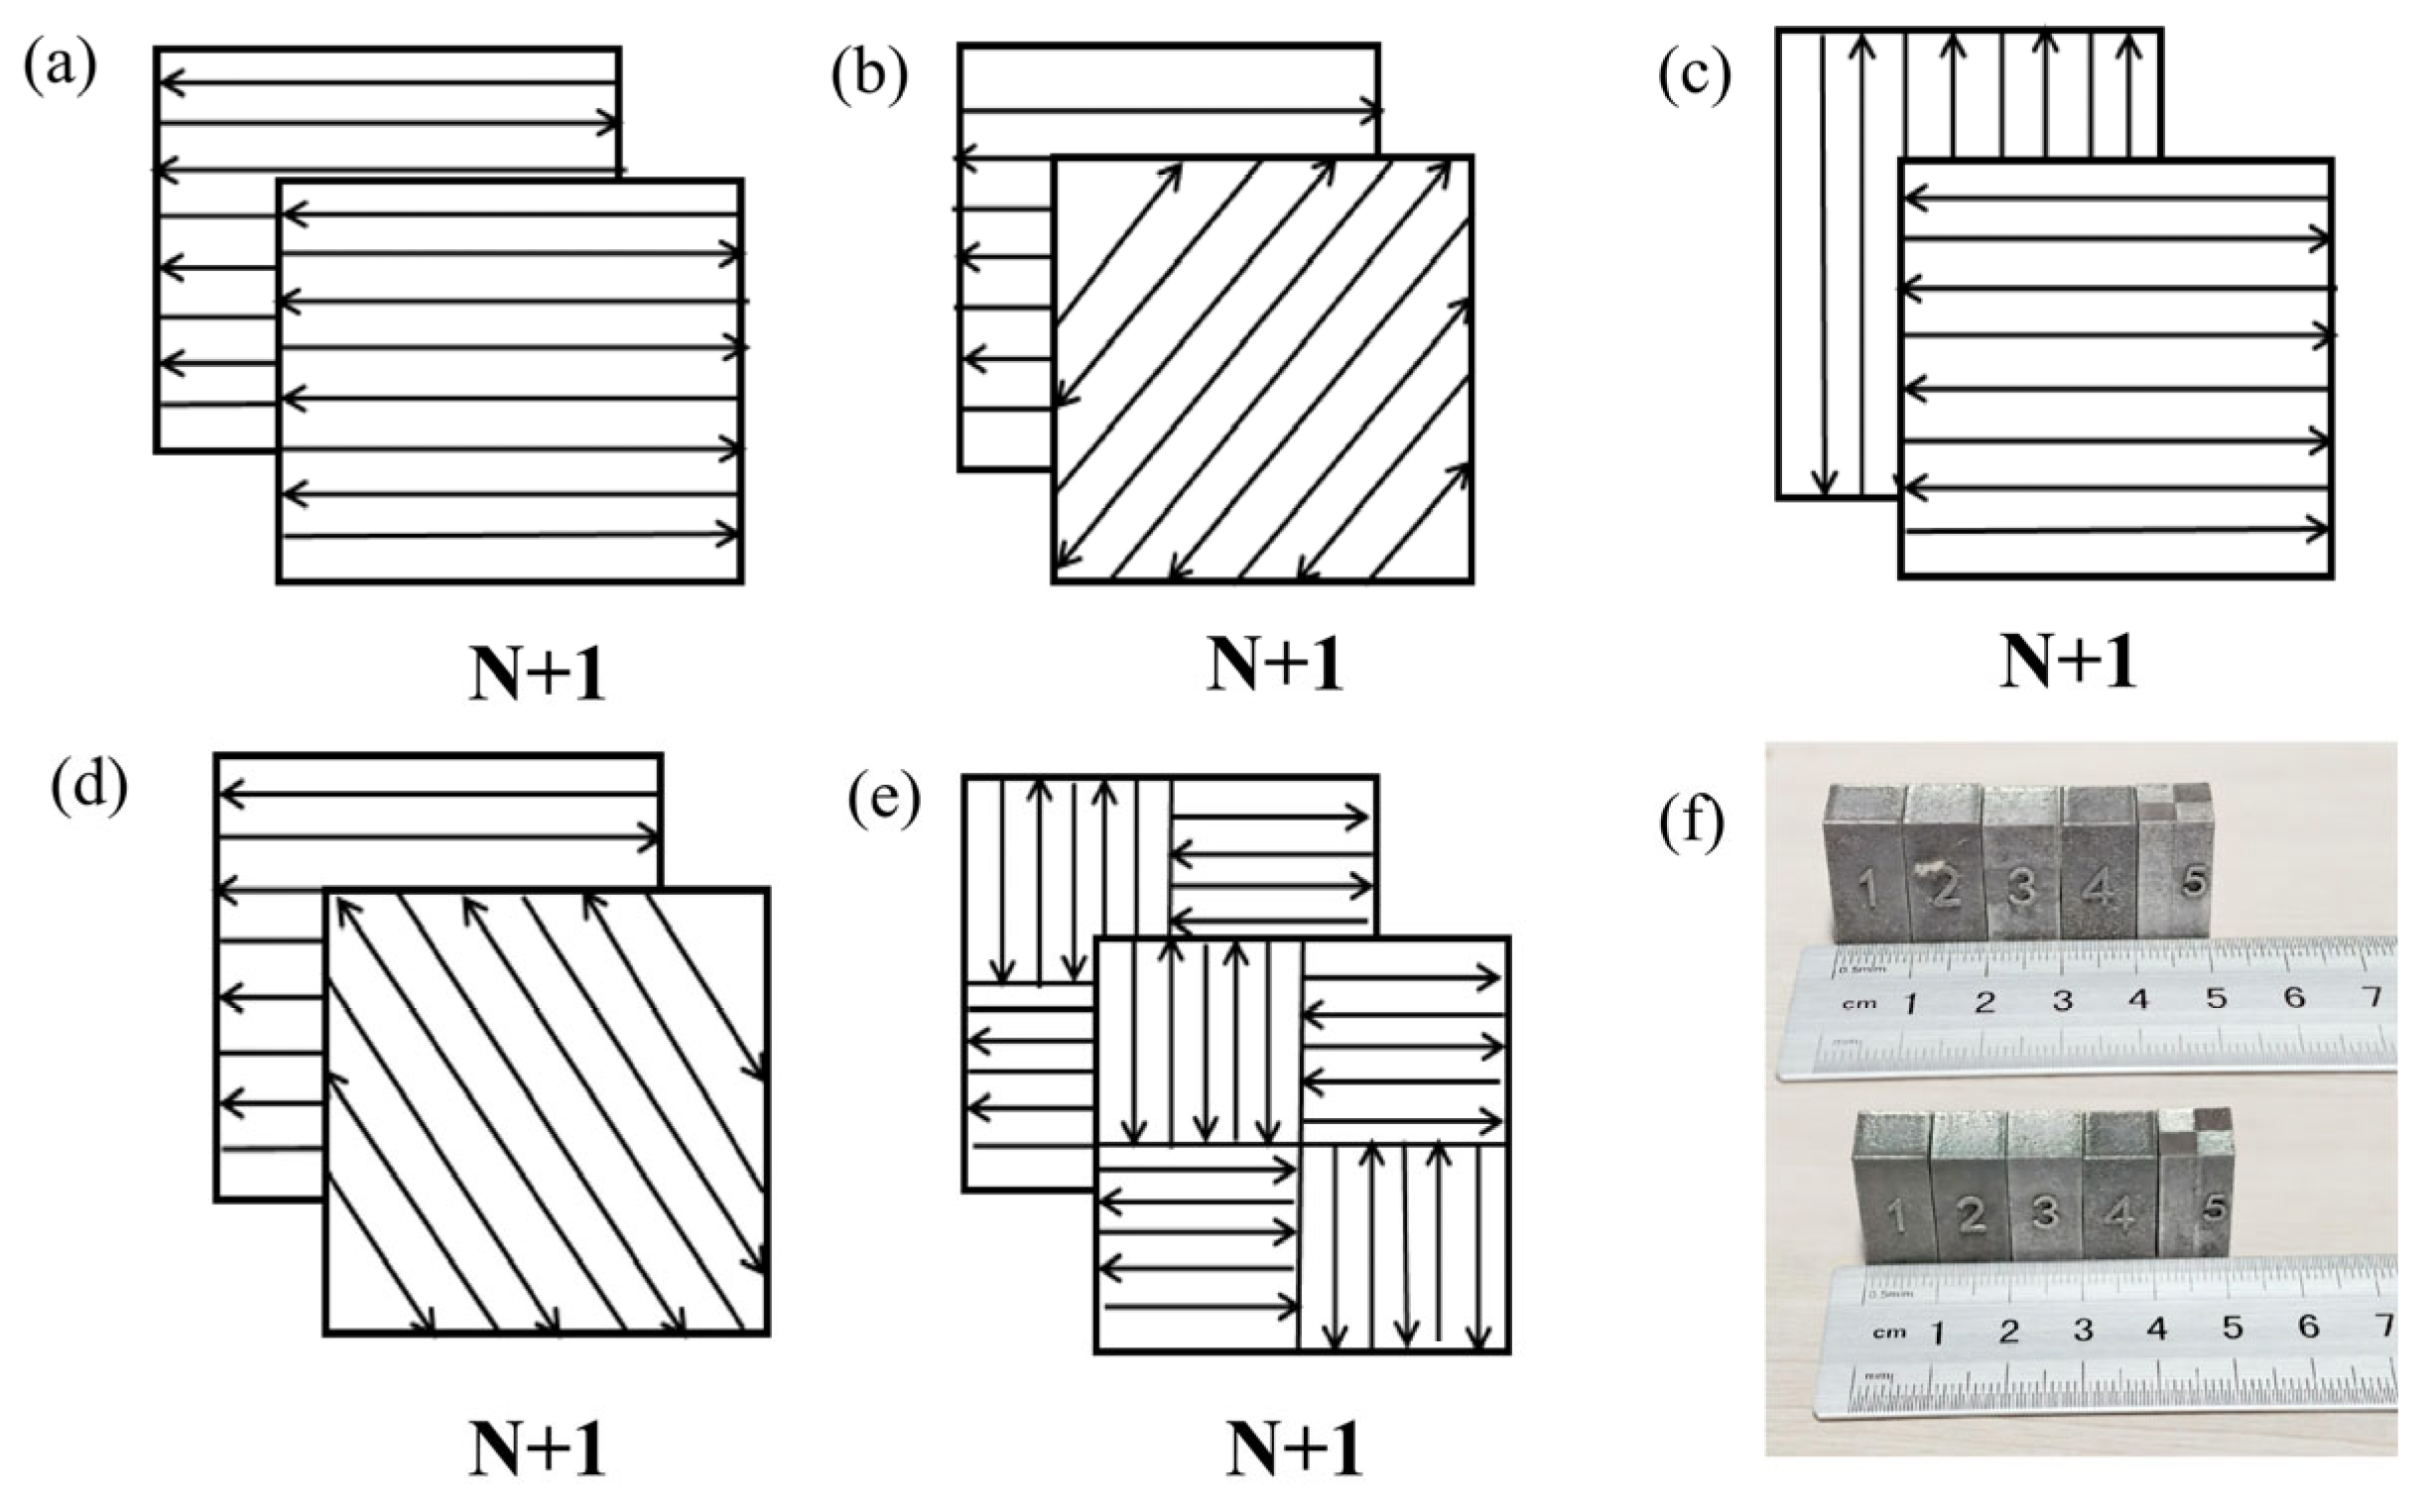
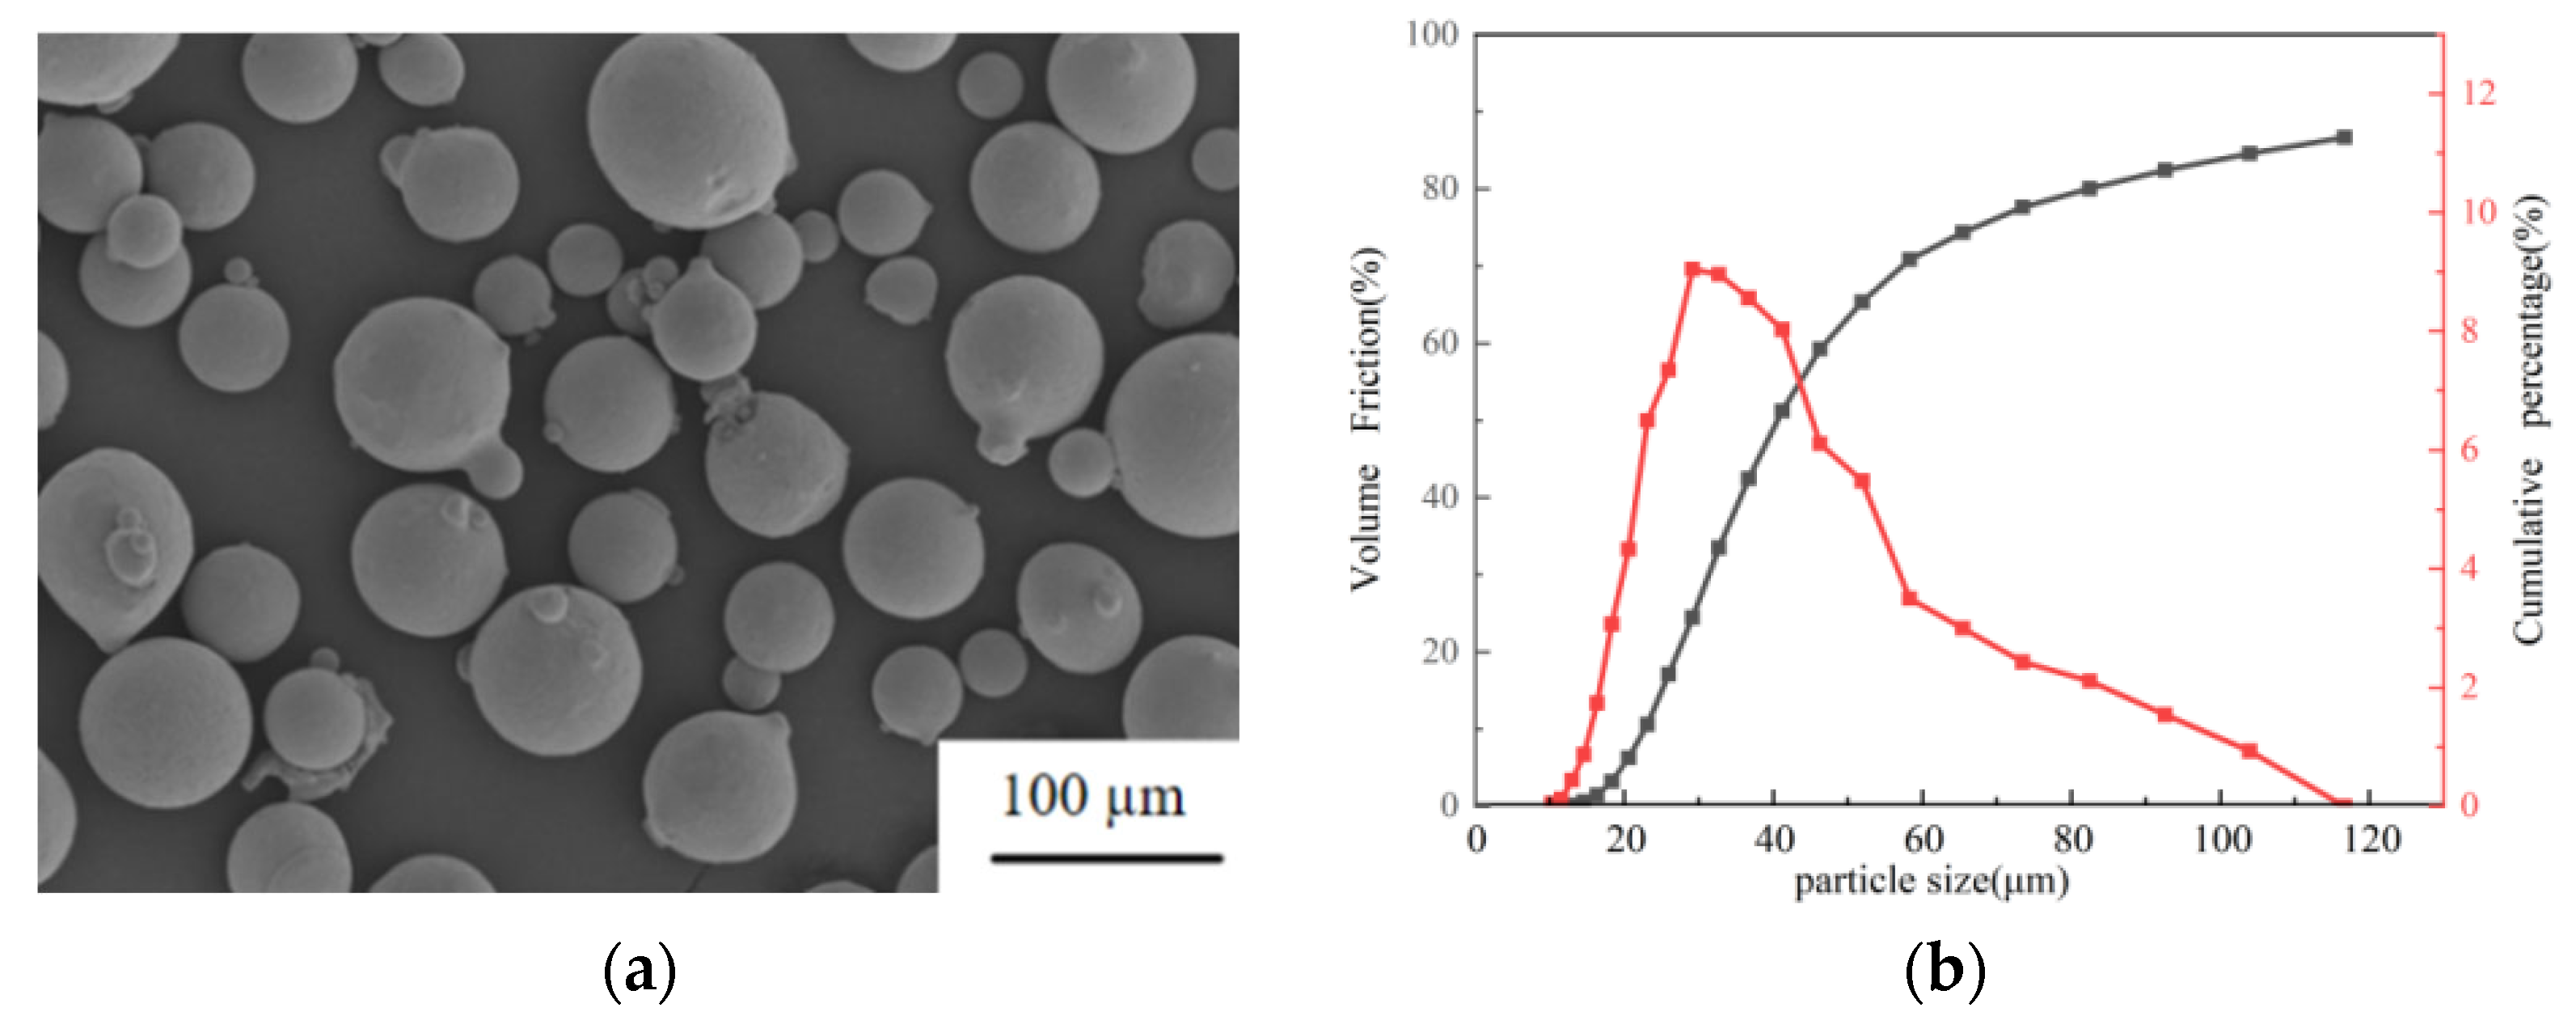
This study utilized near-spherical gas-atomized GH3536 alloy powder (particle size 20–60 μm, composition shown in Table 1 and to prepare LPBF specimens, as depicted in SEM (Xi’an Jiaotong University, Rishima SU8200 Transmitter) images and particle size distribution diagrams in Figure 1a,b. At a substrate temperature of 25 °C, two sets of 10 × 10 × 20 mm3 specimens were fabricated using the S180-S laser powder bed fusion equipment from Chuangrui Laser Technology Co., Ltd. (Xianyang, China). (with five scanning strategies (interlayer rotation 0°, 45°, 90°, 67°, and island rotation 90°), as shown in Figure 2 (designated as X-Scan, XY-Scan, R45, XY-Scan, R67, and CB90, respectively). Each strategy produced to sets of 10 × 10 × 20 mm3 specimens (parameters listed in Table 2), which underwent deformation and residual stress testing. Specimens were analyzed after wire cutting. The printed parts are shown in Figure 2f. The process parameters in Table 2 were determined through preliminary exploration and numerical simulation analysis.

2.2. Residual Stress and Deformation Quantification

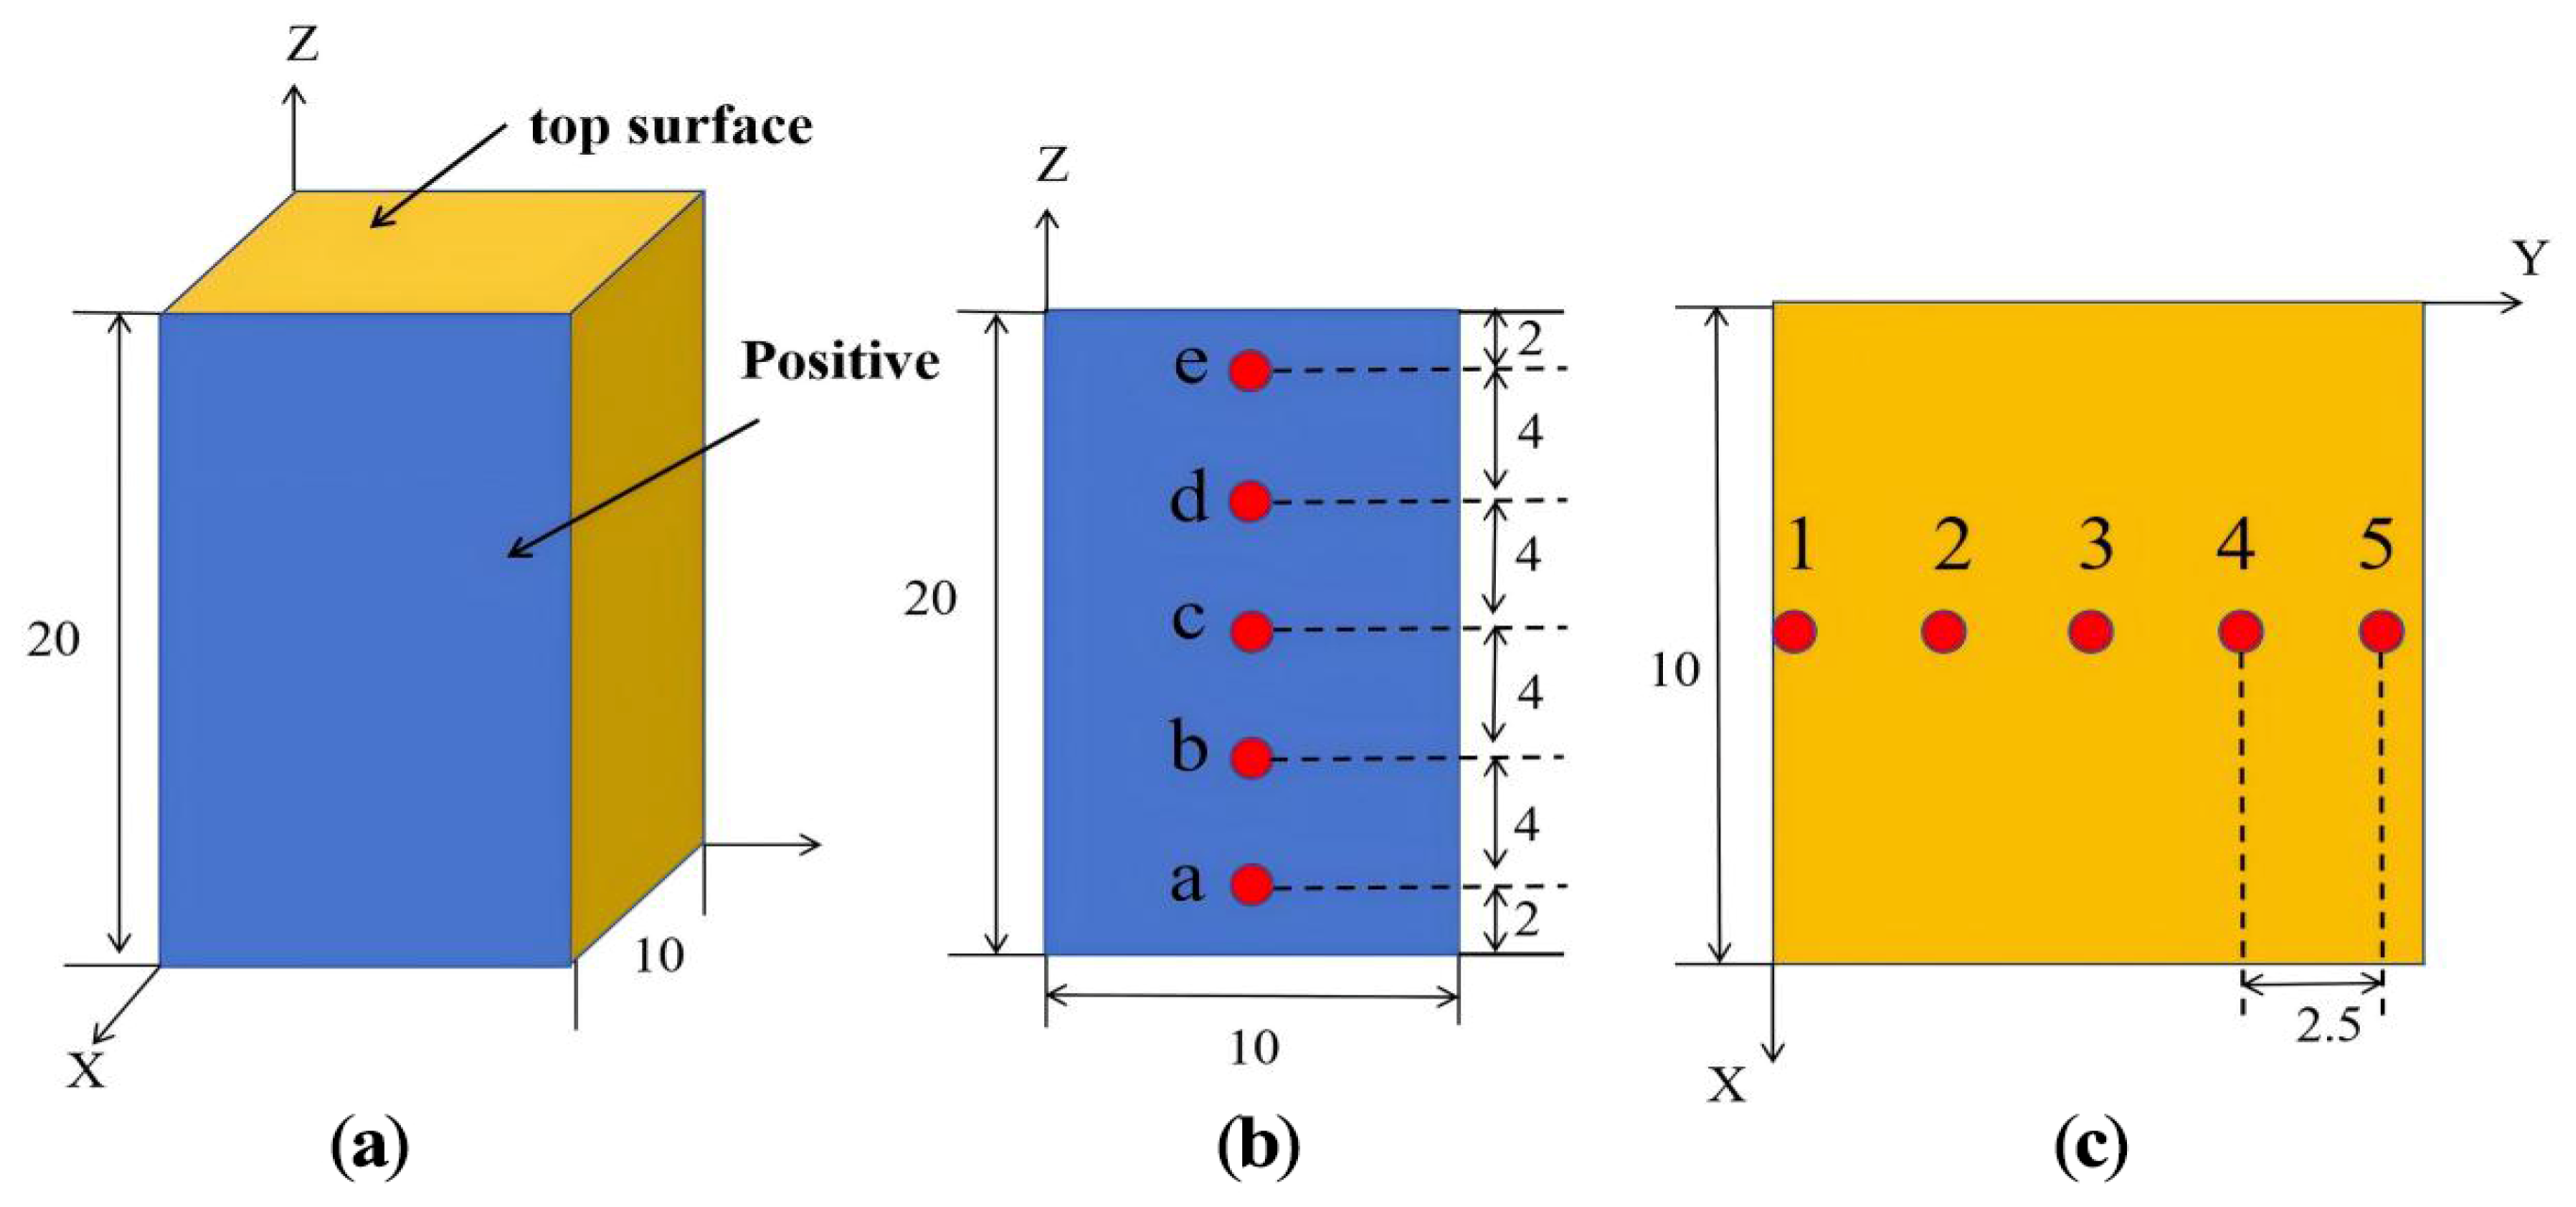
Surface residual stress analysis of ethanol-cleaned carbon steel specimens was conducted using a Proto LXRD MG2000 residual stress testing system operating on the sin2Ψ method. The experimental parameters were as follows: MnKα X-ray source (beam spot diameter: 1 mm), tube voltage: 25 kV, tube current: 20 mA; diffraction plane: {311}; Bragg angle 2θ: 151.88°; β angles: 0°, ±4.30°, ±14.06°, ±19.01°, and ±25.00°. Data acquisition was performed using a single exposure time of 1.0 s with 10 accumulations. Letters a-e in Figure show five points taken along the X-axis of the part, while numbers 1–5 in Figure 3 show five points taken along the Z-axis of the part. The specific point locations are illustrated in Figure 3. Specimen deformation was evaluated by averaging measurements obtained from three distinct positions using a digital micrometer (measuring range: 25–50 mm; accuracy: 0.001 mm).

2.3. Finite Element Model Configuration

2.3.1. Model Assumption

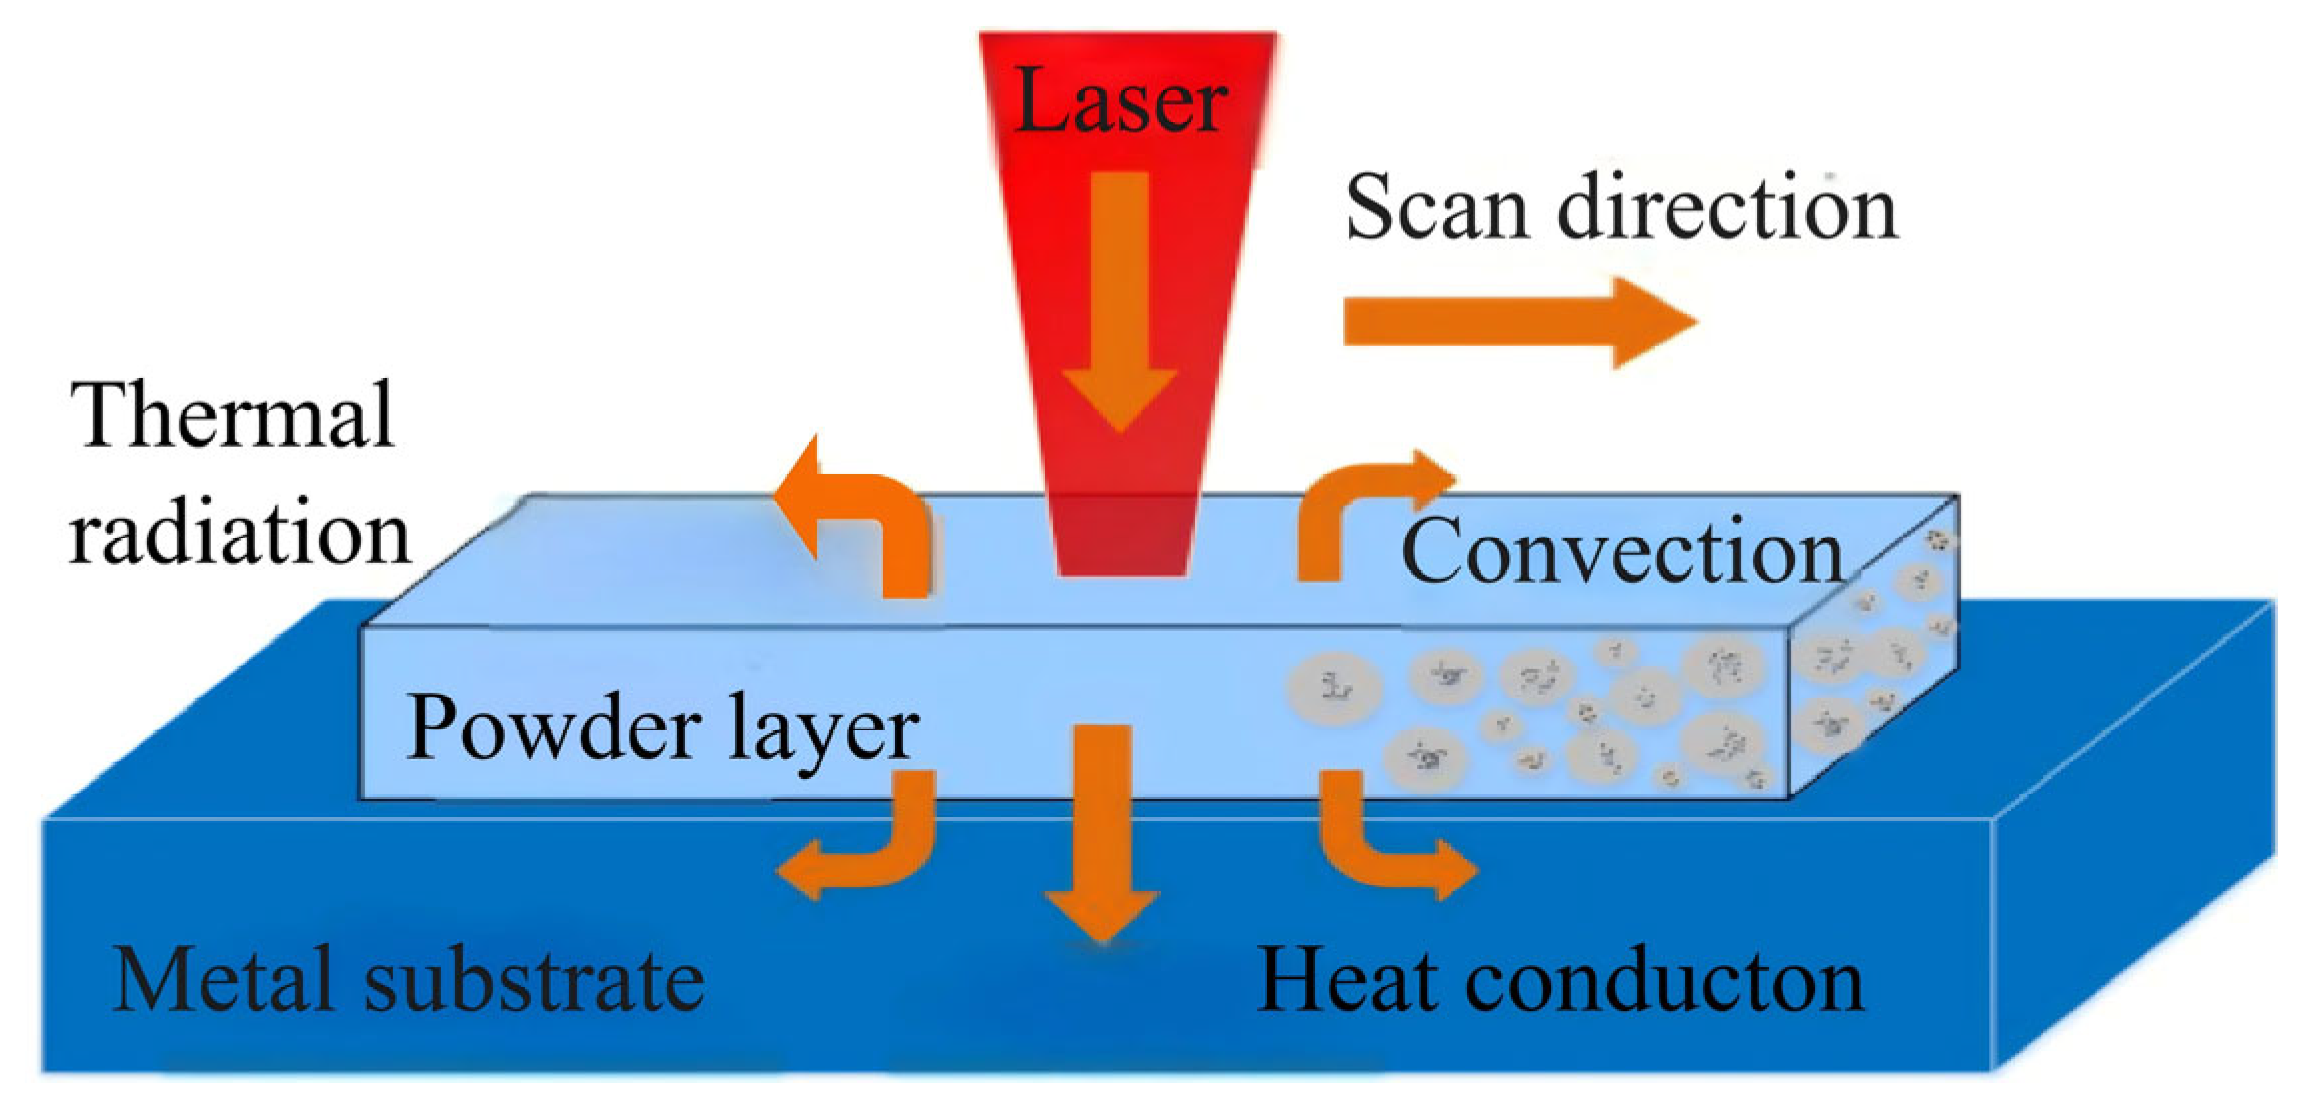
Laser powder bed fusion (L-PBF) is a complex manufacturing process involving intricate factors such as material phase transformations and melt pool dynamics arising from material melting. To streamline computation and enhance workflow efficiency, the geometric scale of the model was reduced. Subsequently, the following assumptions were adopted for the constructed finite element model [34]. The computational domain and its thermal boundary conditions are depicted in Figure 4:
(1)
The vaporization effects of both the substrate and the metal powder are neglected.
(2)
The yielding behavior of the substrate and metal powder adheres to the Von Mises yield criterion.
(3)
The materials of both the substrate and powder are isotropic.
(4)
The influence of variations in laser beam absorptivity is disregarded, with a constant absorptivity value of 0.3 employed.

2.3.2. Thermal Analysis Curve

During the laser powder bed fusion (L-PBF) process, GH3536 powder undergoes rapid melting under the laser irradiation. This phenomenon constitutes a nonlinear transient heat transfer process, wherein the transient temperature distribution is governed by a three-dimensional heat conduction equation [35]:
ρ c p T t = x k x T x + y k y T y + z k z T z
where ρ is the material density, c p is the specific heat capacity, T is the instantaneous temperature, t is time, k x , k y and k z are the thermal conductivities in the X, Y, and Z directions, respectively, and q is the absorbed heat flux within the material. The initial temperature condition for the L-PBF process at time t = 0 is defined by the following expression [7]:
T x , y , z t = 0 = T 0
where T 0 represents the initial temperature. In the absence of substrate preheating, T 0 is set to 20 °C. Under preheated substrate conditions, T 0 is assigned the corresponding preheating temperature.
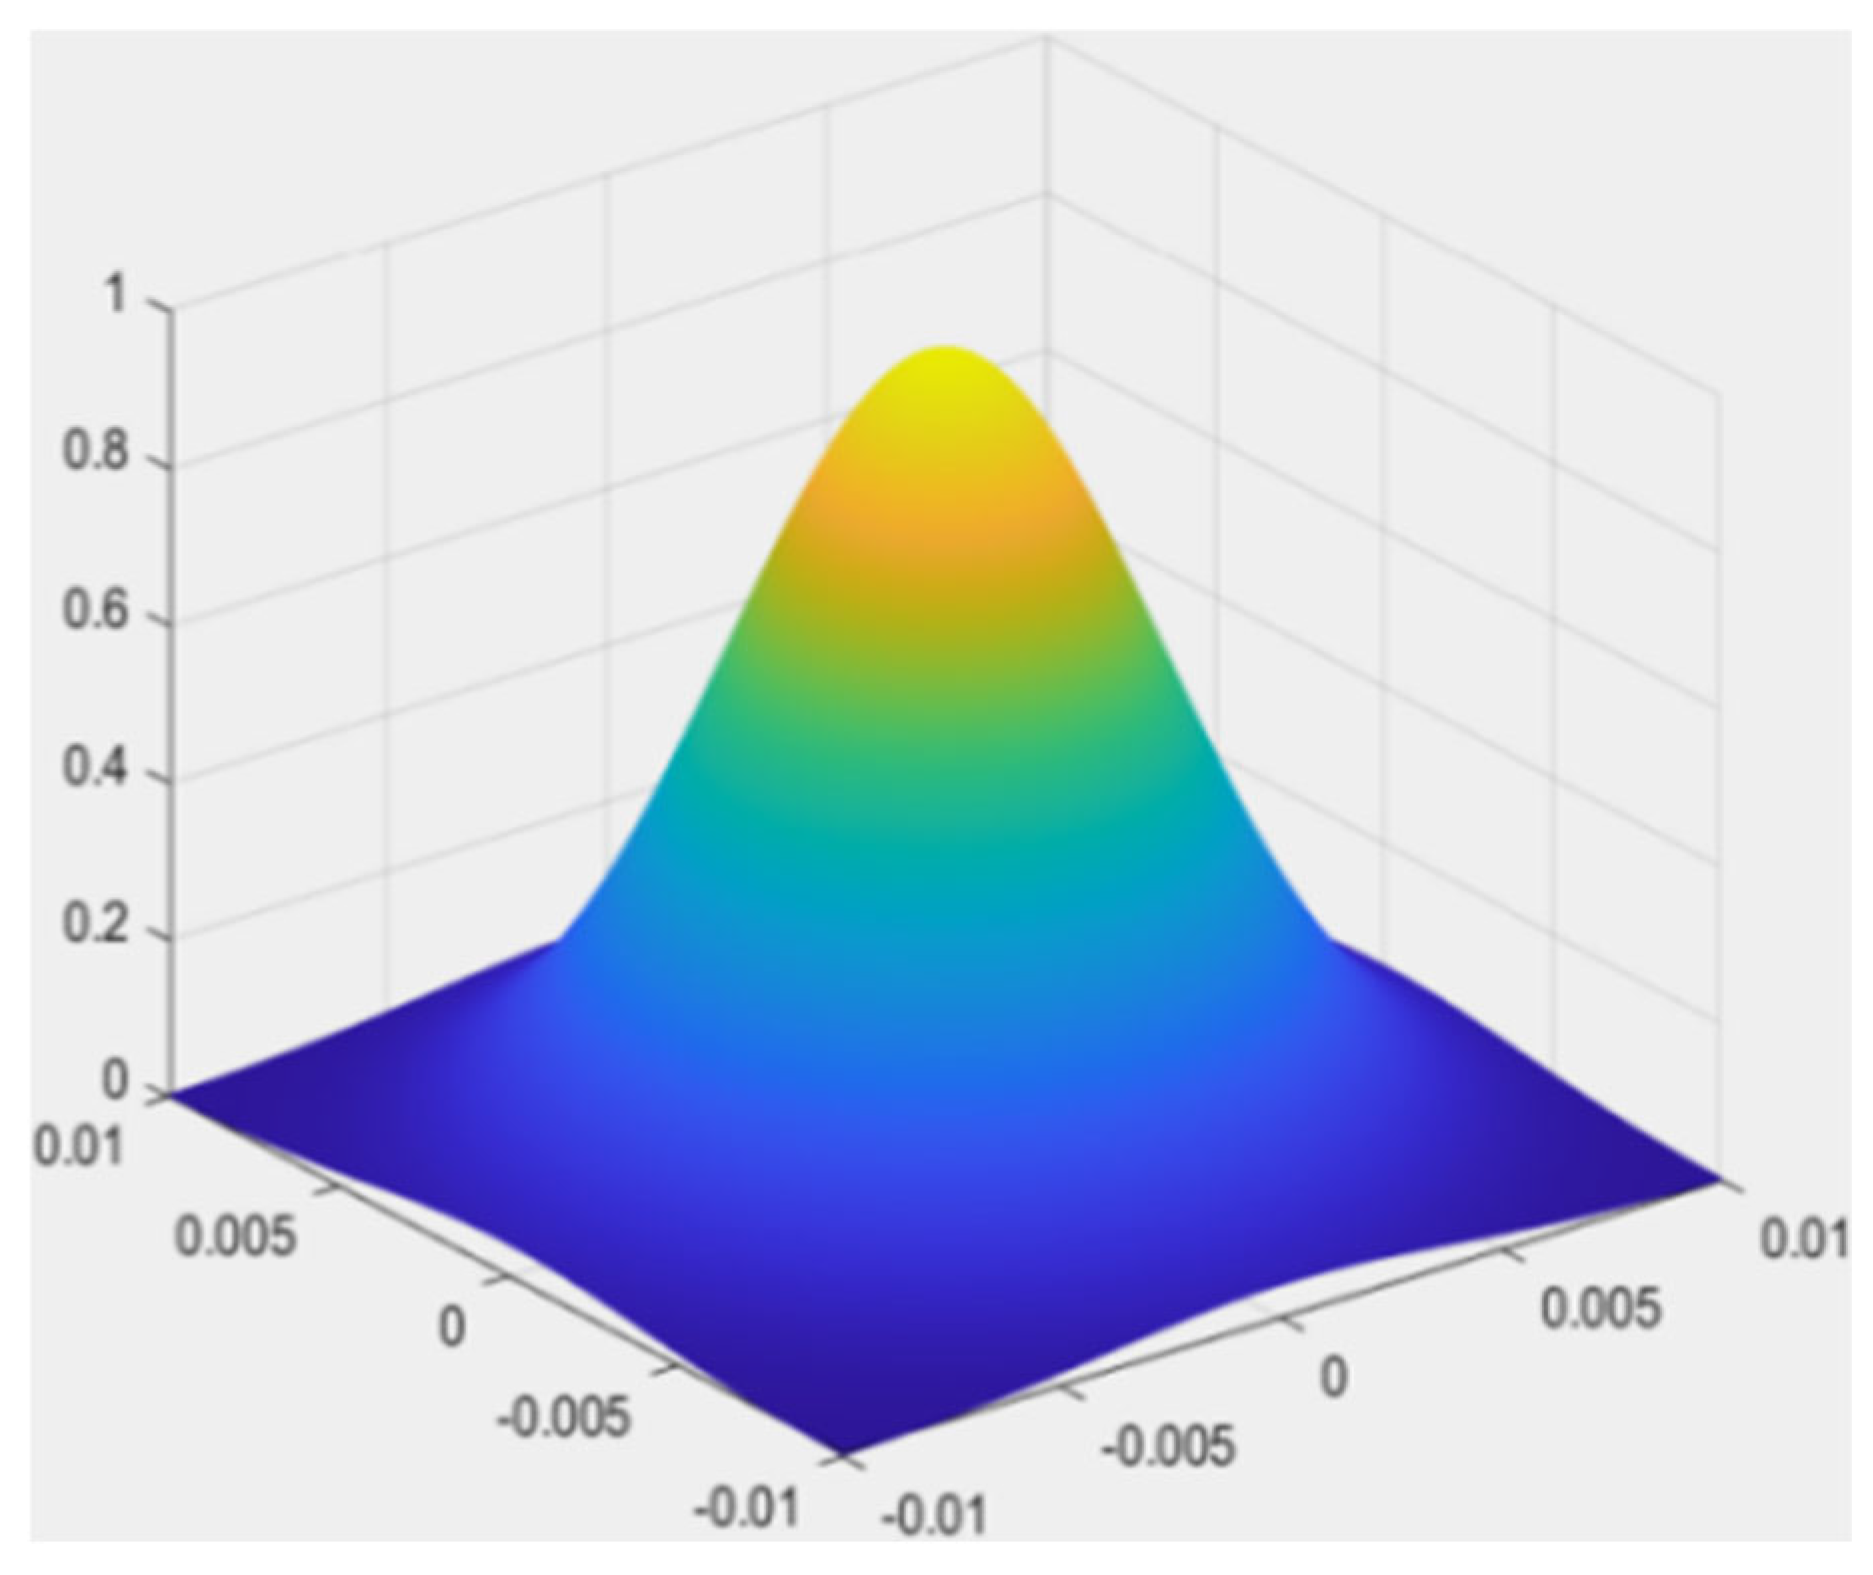
This model adopts the most commonly used Gaussian heat source as shown in Figure 5, which is the most widely used to describe the energy distribution. Its formula is as follows [28,29,31,36]:
q x , y , z , t = 2 A P π r r 2 η exp 2 x 2 + y 2 r 2 exp z η
Here, A represents the laser energy absorption rate of the material, which was obtained from reference [19]. P represents the laser power ( W ) ; r represents the radius of the laser beam (µm) corresponding to the point where the irradiance decreases to 1 / 2 e . η represents the laser penetration depth (µm) of GH3536 powder, and its value can be obtained by referring to references [7,19,30].
The heat transfer in L-PBF simulations encompasses three key mechanisms: conduction to the substrate, convective–radiative heat loss at the surface, and latent heat absorption during phase transition within the melt pool. To enhance computational accuracy, an combined heat transfer coefficient is typically employed to represent these combined effects. The convective heat transfer component can be expressed by the following formulation [31]:
h = h c o n v + ε σ T 2 + T a m b 2 T + T a m b
Here, h is the combination of radiative and convective heat transfer coefficients W / m 2 ° C ; h c o n v is the convective heat transfer coefficient W / m 2 ° C ; ε is the emissivity of the powder bed; σ is the Stefan Boltzmann constant 5.67 × 10 8   W / m 2 ° C 4 .
In the model, the latent heat of fusion was defined to simulate the phase transition in the L-PBF process. It is a function of enthalpy h , density ρ and specific heat ( c ) , and can be expressed as [7]:
H = ρ c T d T
The relationship between the enthalpy H P of powder and the enthalpy H s of solid material is as follows [28,36]:
H p = 1 φ H s

2.3.3. Stress Analysis

During processing, the high energy density induces significant temperature gradients, resulting in substantial thermal stresses and strains. The governing equations for stress and strain are [37]:
ε = D 1 σ + ε t h
ε t h = e × Δ T = e T T r e f
σ = D ε
Here, ε represents the total strain, σ is the strain matrix, D is the stress–strain matrix, ε t h is the thermal strain, e is the coefficient of thermal expansion, and T r e f is the reference temperature.
Generally, the equivalent stress σ , also known as Von Mises stress, is widely used in the application of metal plastic deformation mechanics. The Von Mises yield equivalent stress is defined as [7]:
σ ¯ = 2 2 σ 1 σ 2 + σ 2 σ 3 + σ 3 σ 1
The equivalent stress is defined as where σ 1 , σ 2 , and σ 3 are the principal stresses in three orthogonal directions. When the equivalent stress exceeds the yield point of the material, the material will enter the plastic stage. The relationship between equivalent stress and equivalent strain can be described as:
ε ¯ = 2 2 1 + v ε 1 ε 2 + ε 2 ε 3 + ε 3 ε 1
Among them, ε 1 , ε 2 , and ε 3 are the principal strains in three orthogonal directions, and v is the Poisson’s ratio.
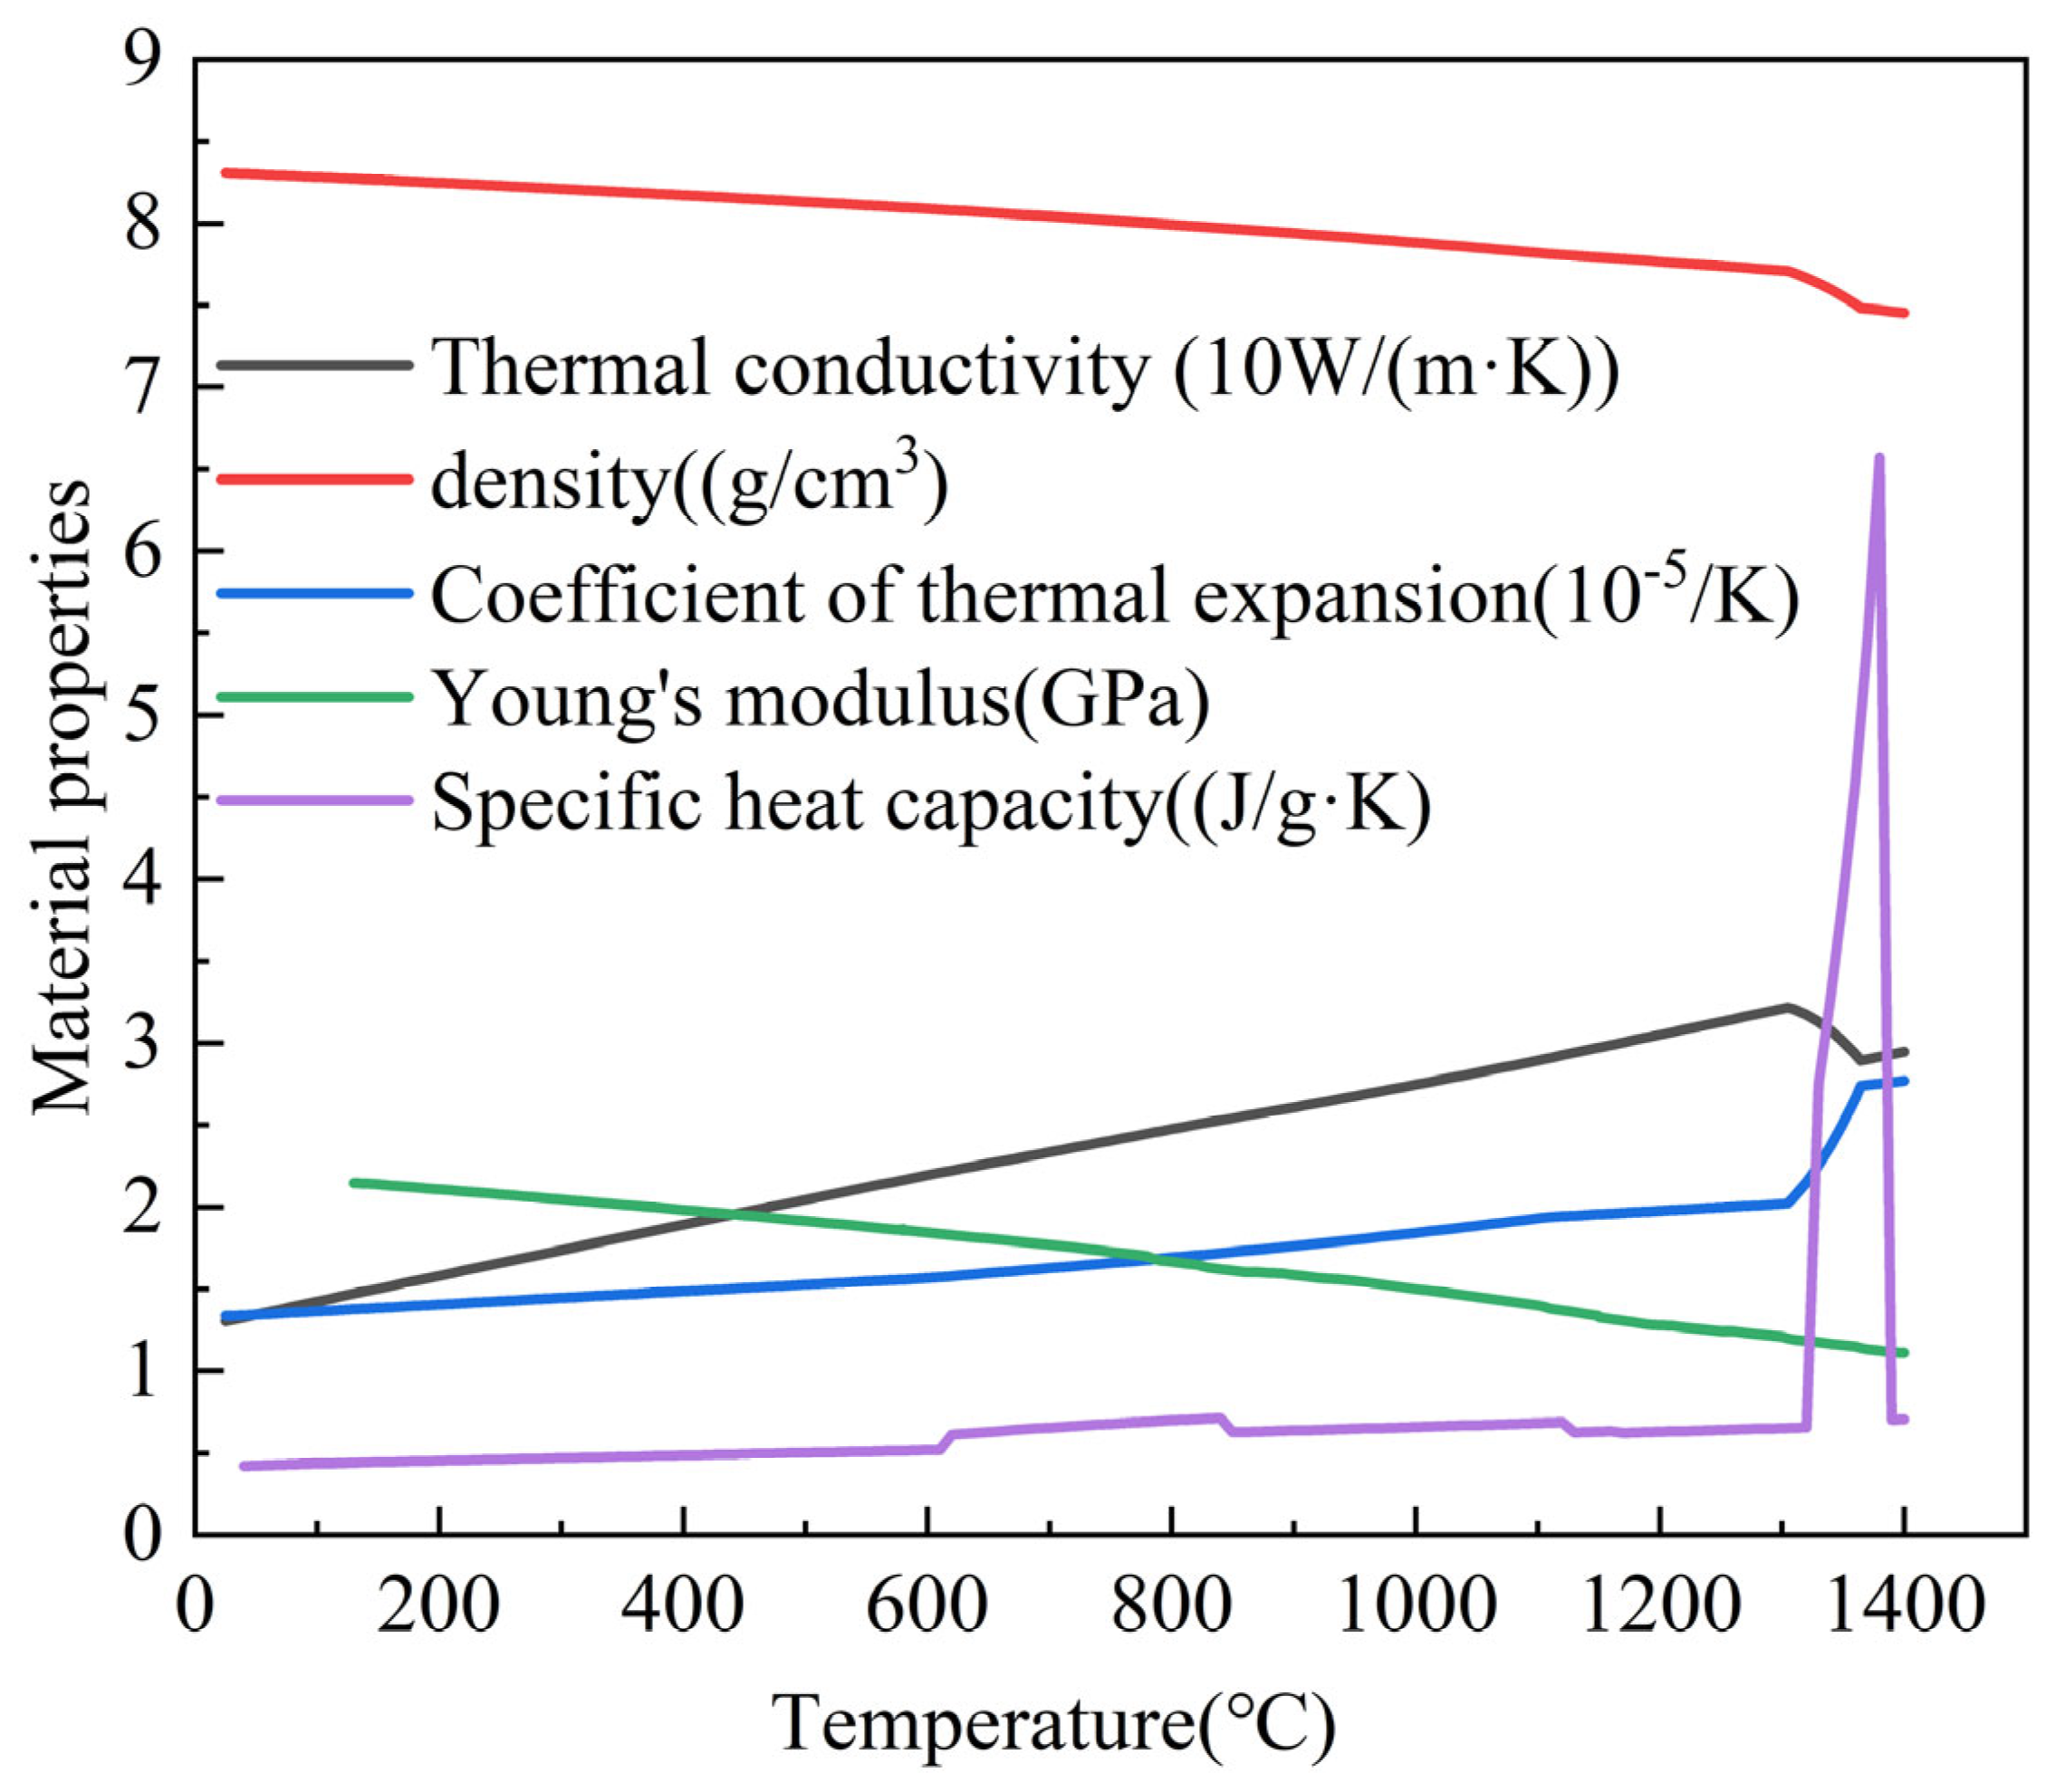
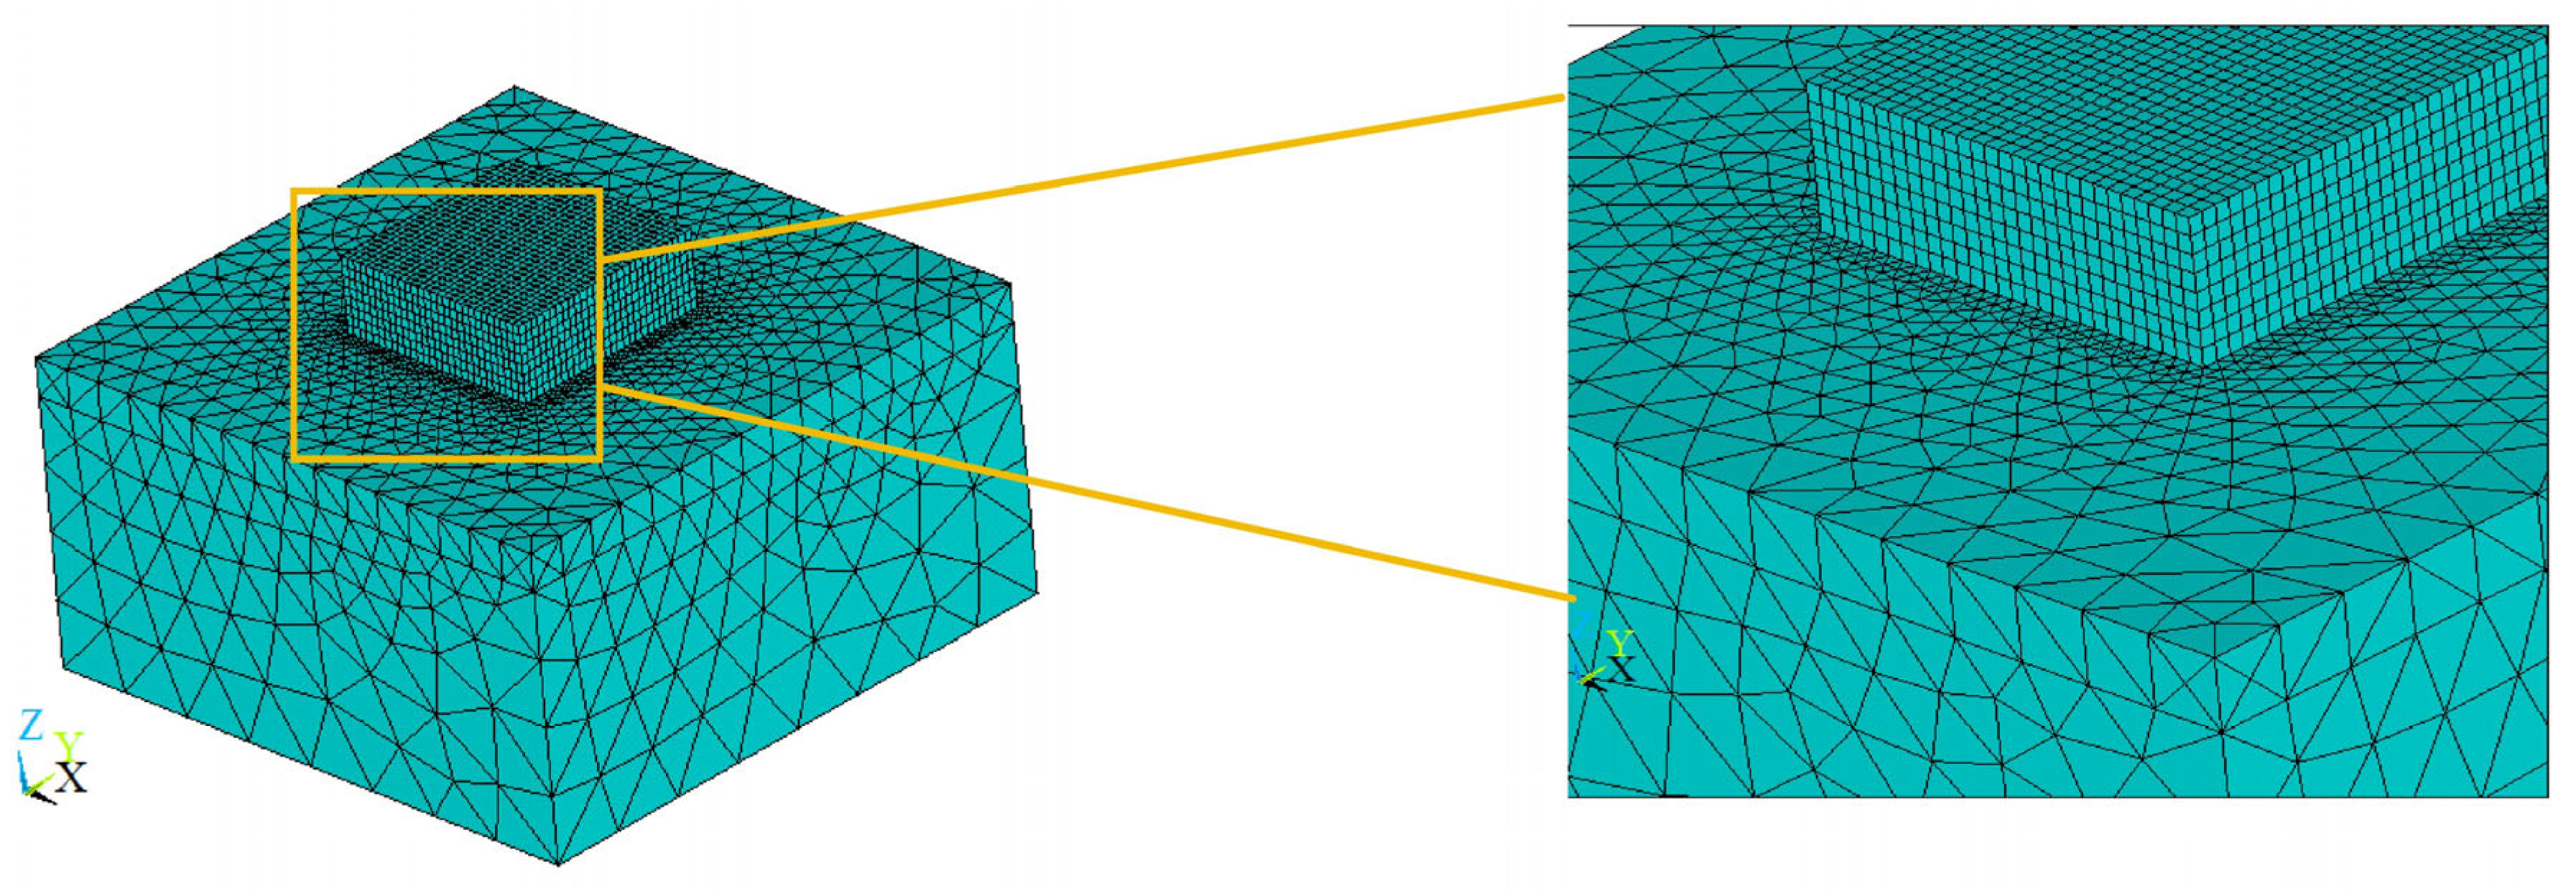
This study constructed a small-scale three-dimensional thermomechanical coupled finite element model using ANSYS 2021 APDL, as shown in Figure 6. Mesh refinement technology was employed to divide the substrate into a fine mesh region (1.56 × 1.56 × 0.1 mm3) and a transition zone mesh region (1.56 × 1.56 × 0.9 mm3), and integrated four layers of 0.03 mm thick powder (0.56 × 0.56 × 0.012 mm3). Multiscale temperature-stress field simulation of the laser powder bed fusion process was achieved using scan cells (0.02 × 0.02 × 0.025 mm3), 8799 nodes, and 13436 SOLID70 thermal elements. A sequential coupling algorithm was employed to separately solve the temperature field (Figure 7: Experimental calibration of thermal parameters for GH3536 alloy and Table 3: Representative material property data.) and stress field. This approach combined constant Poisson’s ratio (0.32) and latent heat effects (2.95 × 10⁶ J/(kg·K) [38]) derived via JMatpro 2023 along with composite boundary conditions and composite boundary conditions (radiation coefficient 0.6 [7], convection coefficient 11.4 W/(m2·K) [39], powder absorption rate 0.26 [7]) significantly improved computational efficiency while maintaining accuracy.

3. Results and Discussion

3.1. Temperature Field Analysis

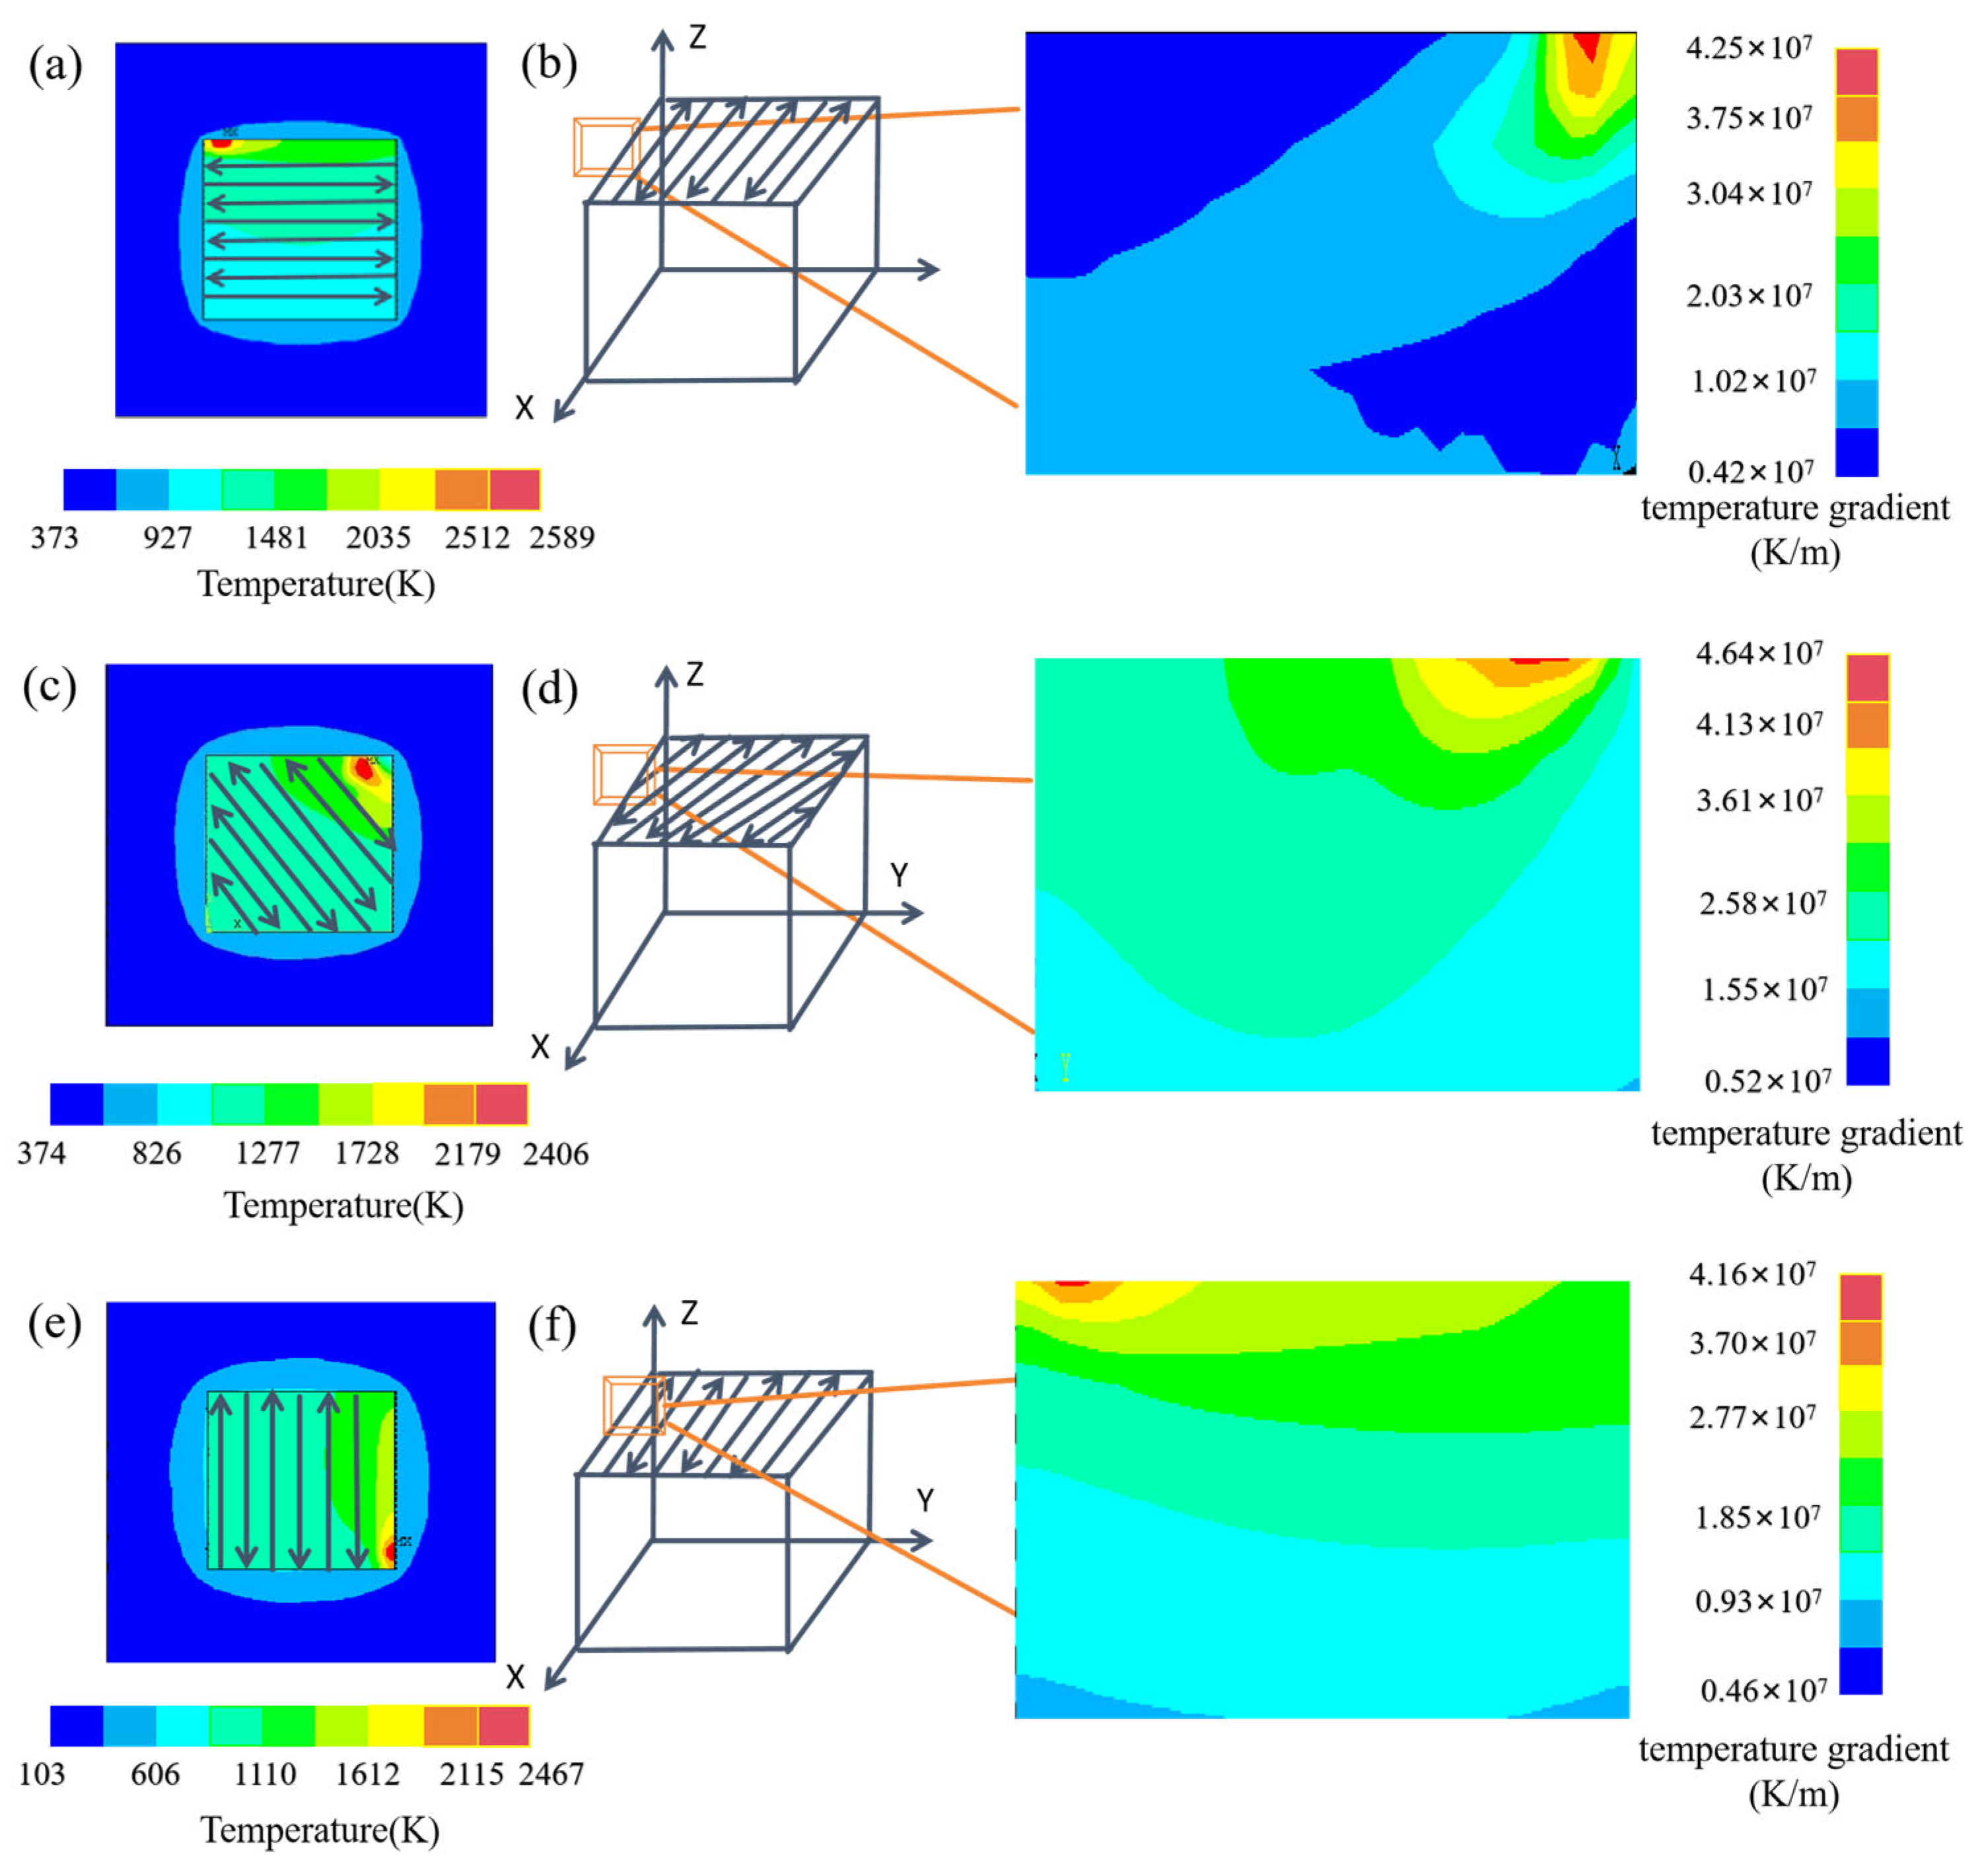
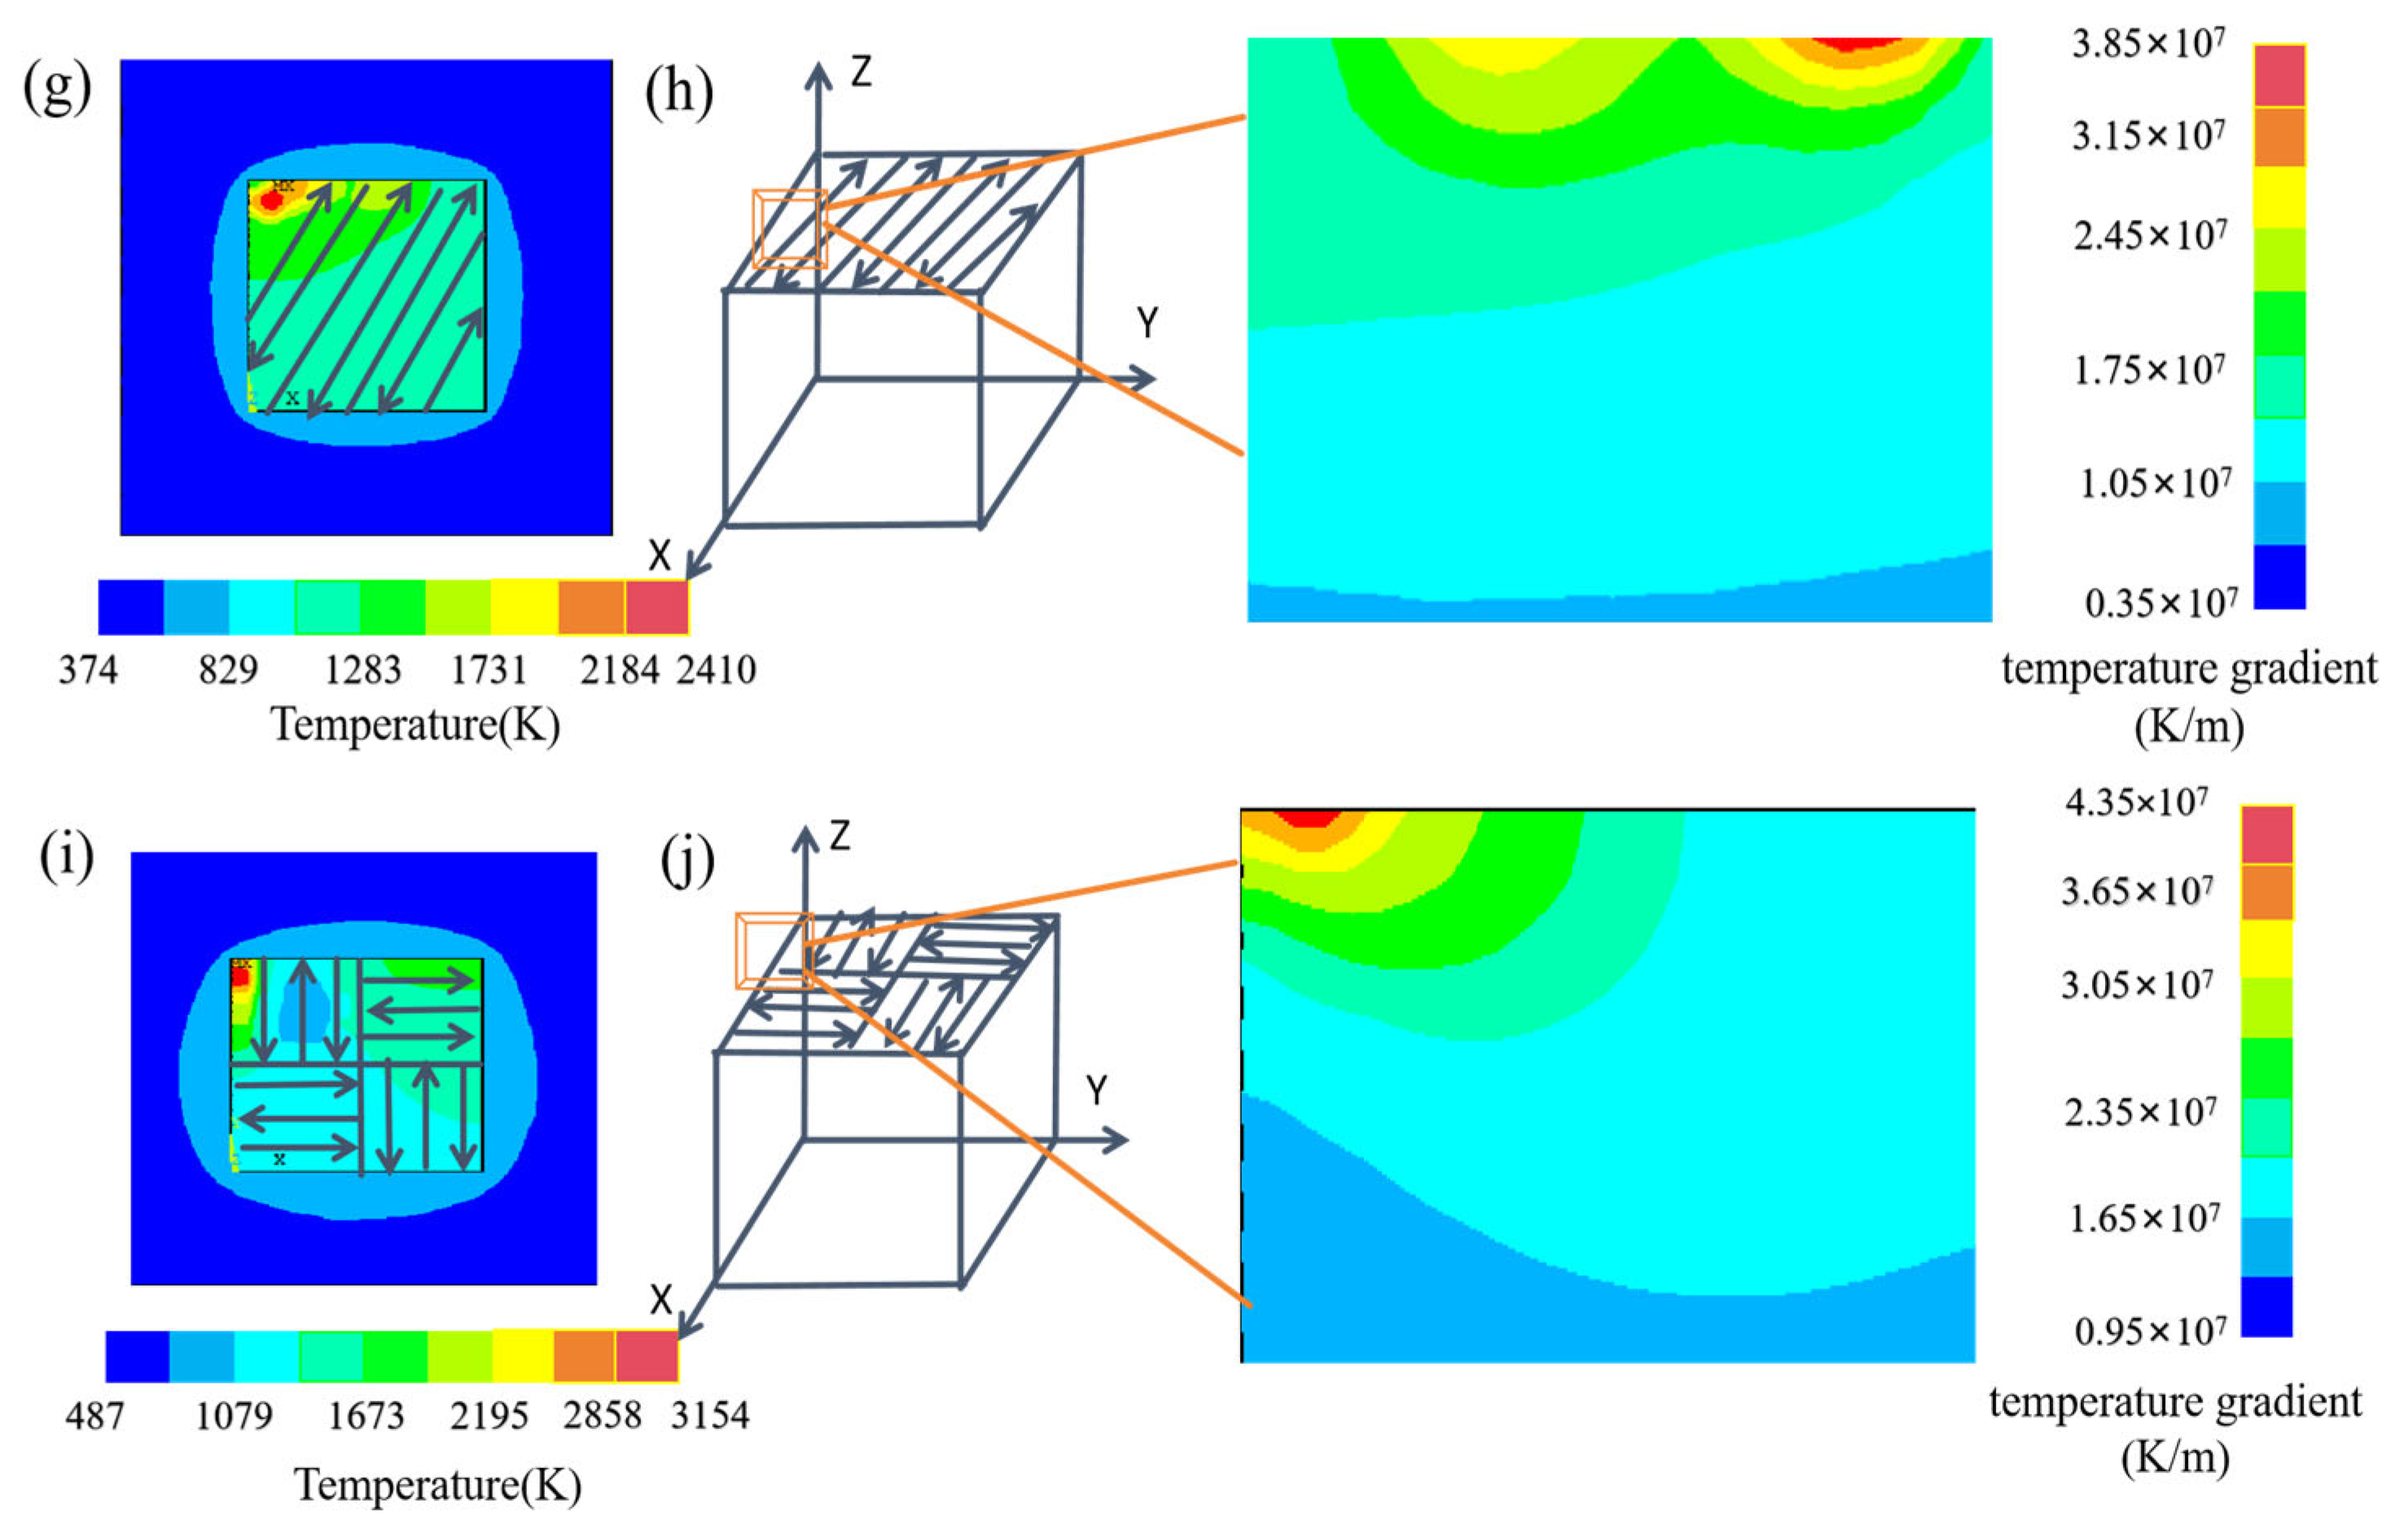
The temperature field and corresponding temperature gradient distribution of the final pass in the fourth layer of the as-fabricated GH3536 alloy under various scanning strategies are illustrated in Figure 8. The figure clearly demonstrates that the scanning strategy exerts a significant influence on the thermal profile. The peak molten pool temperatures recorded for the non-rotation, 45° rotation, 90° rotation, 67° rotation, and island scanning strategies are 2589 K, 2406 K, 2467 K, 2410 K, and 3154 K, respectively (Figure 8a–i). Notably, island scanning yields the highest molten pool temperature. The corresponding temperature gradients for the five strategies are 4.25 × 10⁷ K/m, 4.64 × 10⁷ K/m, 4.16 × 10⁷ K/m, 3.85 × 10⁷ K/m, and 4.35 × 10⁷ K/m, as depicted in Figure 8b–j. As presented in Figure 8j, island scanning partitions the scanned region into multiple discrete islands, each functioning as an independent thermal unit [40]. This configuration results in residual heat accumulation within individual islands, leading to an overall temperature elevation and consequently a higher temperature gradient. In contrast, under the remaining four strategies, the frequent variations in scanning orientation, pattern, and vector length prevent the attainment of the peak temperatures observed in island scanning. The comparable maximum temperatures and thermal gradients noted in Figure 8b (0° interlayer rotation) and Figure 8f (90° interlayer rotation) can be attributed to the unidirectional nature of both scanning paths, whose similarity yields a uniform temperature distribution. As illustrated in Figure 8d,h, the 67° interlayer rotation generates an asymmetric thermal profile, disrupting heat accumulation and resulting in relatively high temperatures accompanied by lower thermal gradients. Conversely, the 45° rotation exhibits a symmetric pattern, inducing repeated thermal overlap in the intersecting zones and producing a uniform yet elevated thermal gradient. In comparison with conventional strategies, such as X-scan and XY-scan, the 67° interlayer rotation scanning demonstrates a lower thermal gradient and a more uniform temperature distribution.
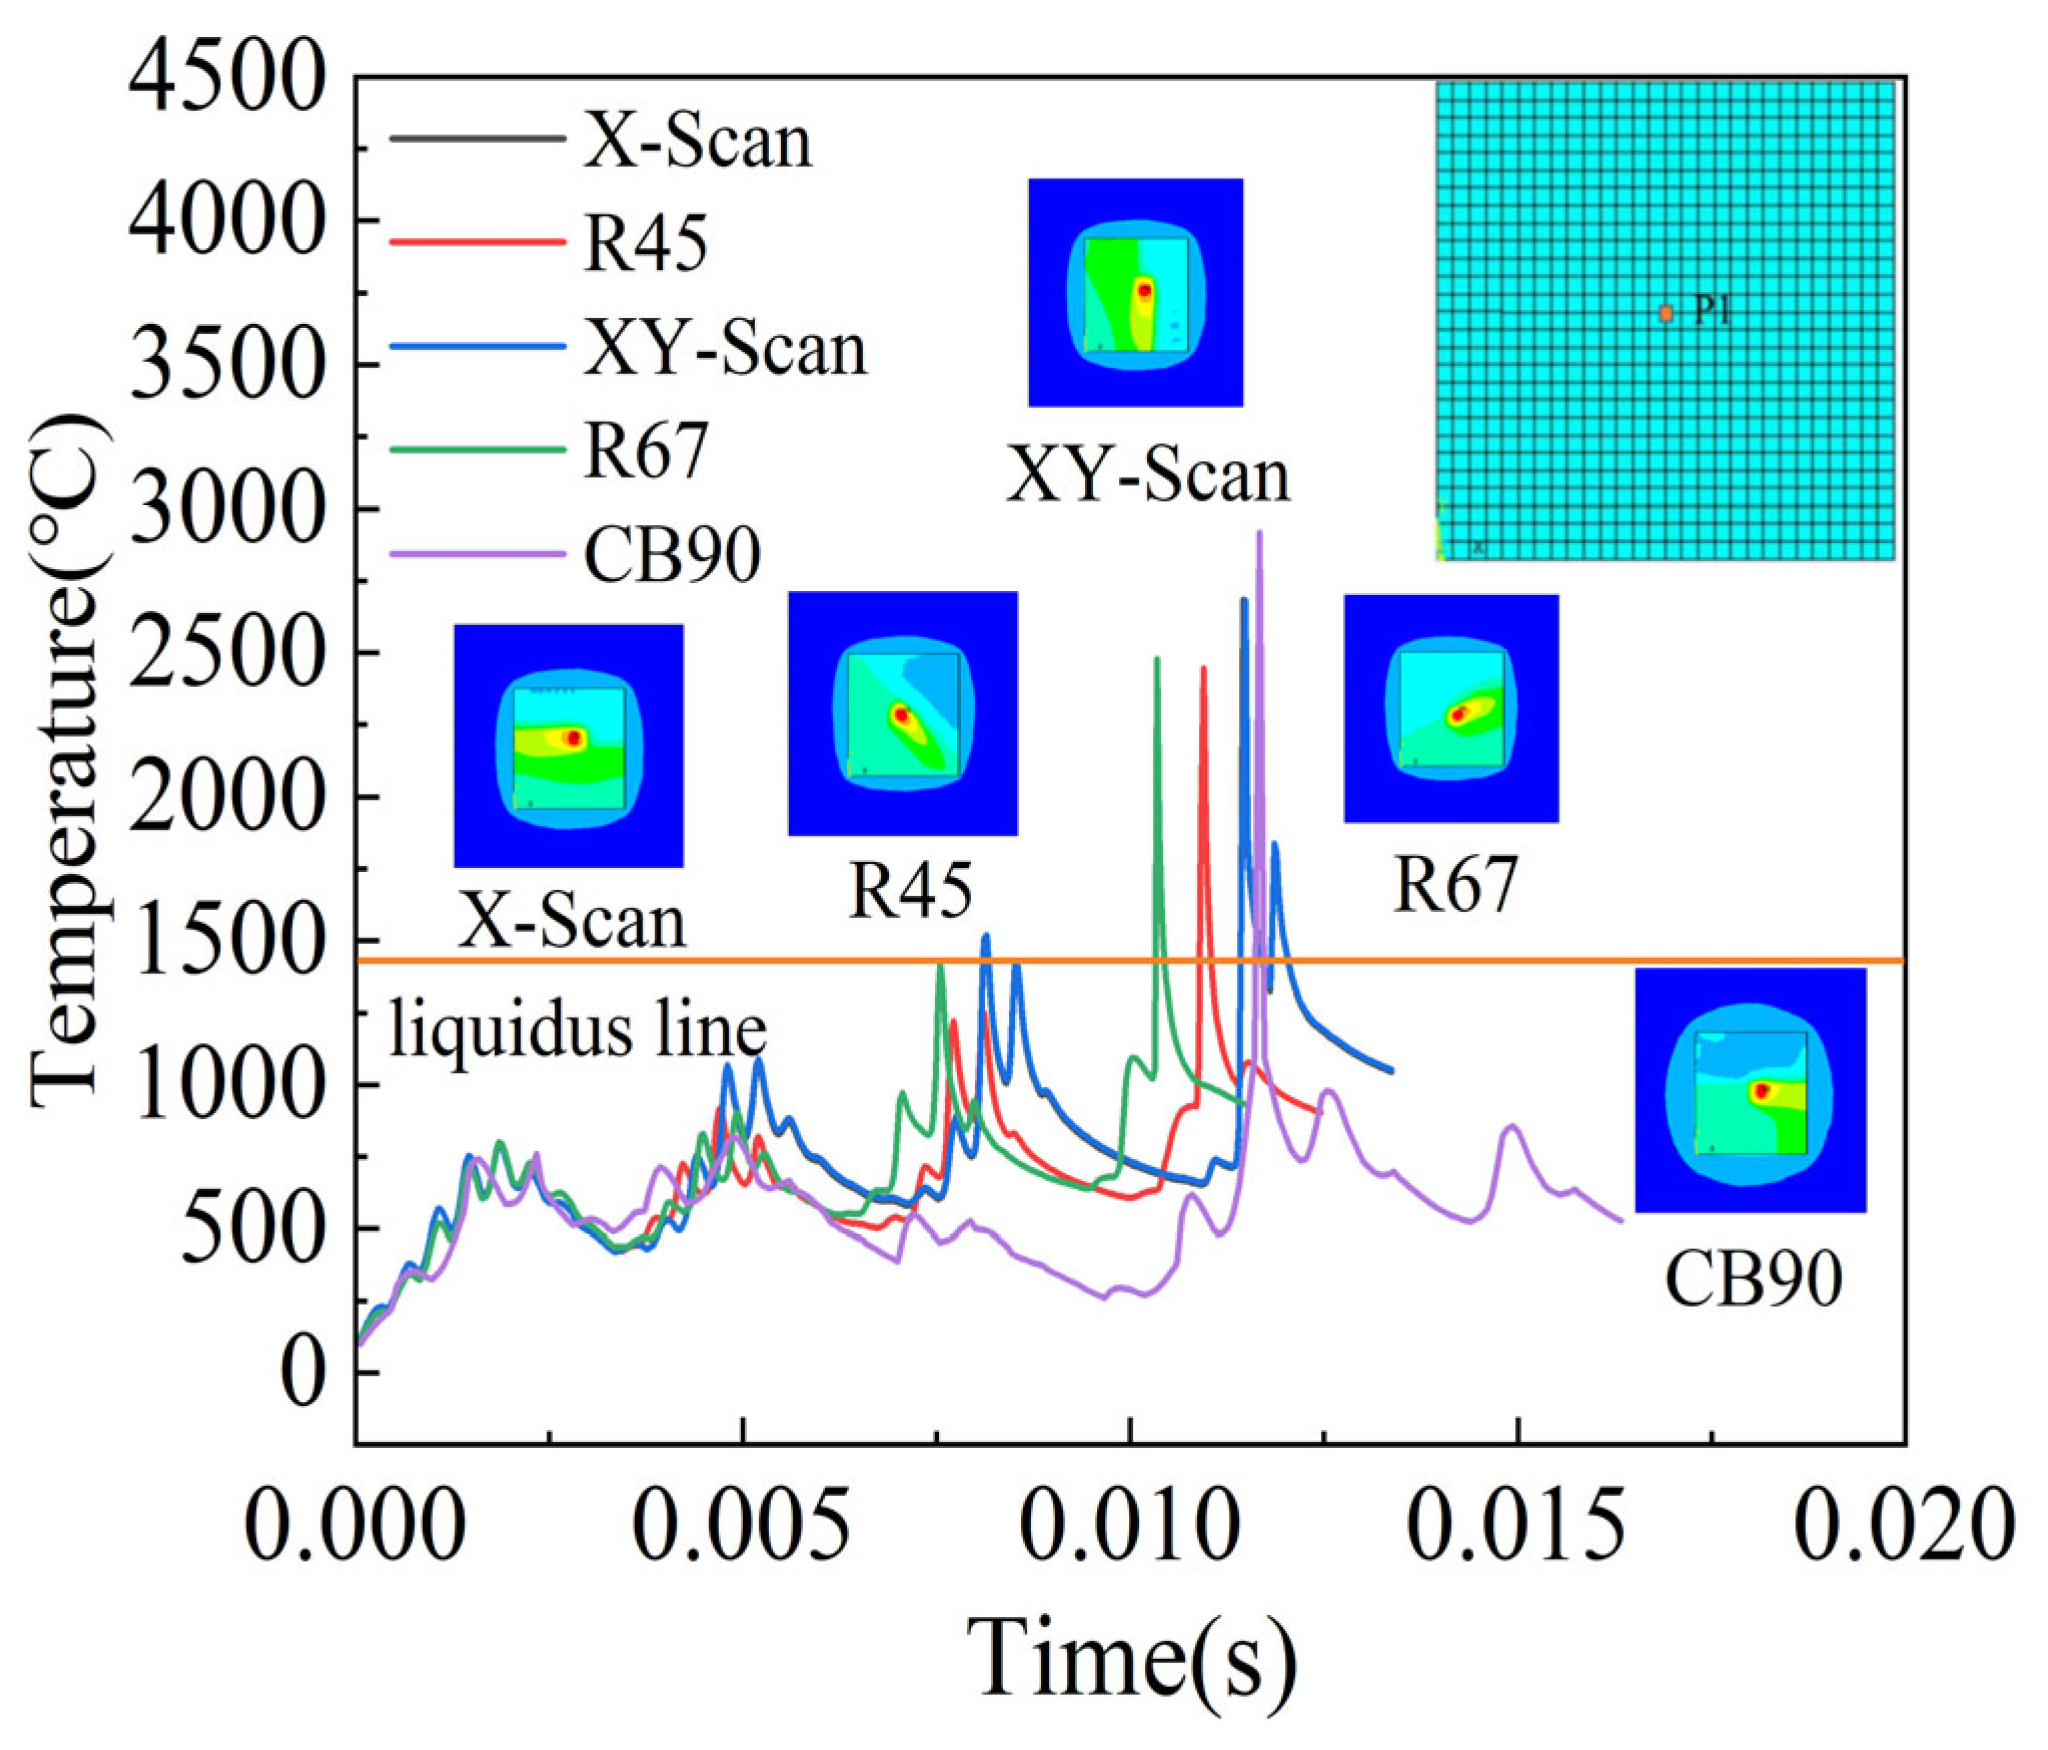
The temperature evolution curves at point P1, located at the midpoint of the final layer, are shown in Figure 9. Due to variations in loading time, the four thermal peaks occur at distinct temporal positions. Nevertheless, the peak magnitudes across the five interlayer rotation angles remain approximately equivalent, with a progressive increase observed over the four layers, attributable to the preheating effect of the previously deposited powder on subsequent layers. The temperature curves for the X-scan and XY-scan strategies exhibit substantial overlap. Both the thermal profiles and the corresponding contour plots indicate peak temperatures of 2684 °C and 2683 °C, respectively. This consistency is primarily governed by the identical rotational passes and elevated energy density during heat source loading, which result in comparable heating and cooling rates. The contour plots reveal maximum temperatures of 2446 °C for the R45 strategy, 2479 °C for R67, and 2920 °C for CB90. The temperature curves further demonstrate that the peak temperature attained under R67 exceeds that of R45. This phenomenon arises from the asymmetric rotational scanning pattern employed in R67, which disrupts thermal equilibrium, prolongs laser exposure at elevated temperatures, and consequently yields higher peak readings. Overall, the R45 and R67 strategies mitigate heat dissipation, thereby producing lower peak temperatures compared to island-based strategies. In contrast, island scanning exhibits significantly higher peak temperatures, resulting from pronounced heat accumulation between adjacent islands and extended laser scanning vectors, which collectively prolong the time required to reach peak temperature and diminish melt pool stability. In summary, scanning strategy exerts a substantial influence on the thermal history of the melt pool. However, analysis of Figure 9 indicates that the R67 strategy, with its comparatively lower temperature gradient, offers a more favorable thermal condition for L-PBF processing of GH3536.

3.2. Stress Field Analysis

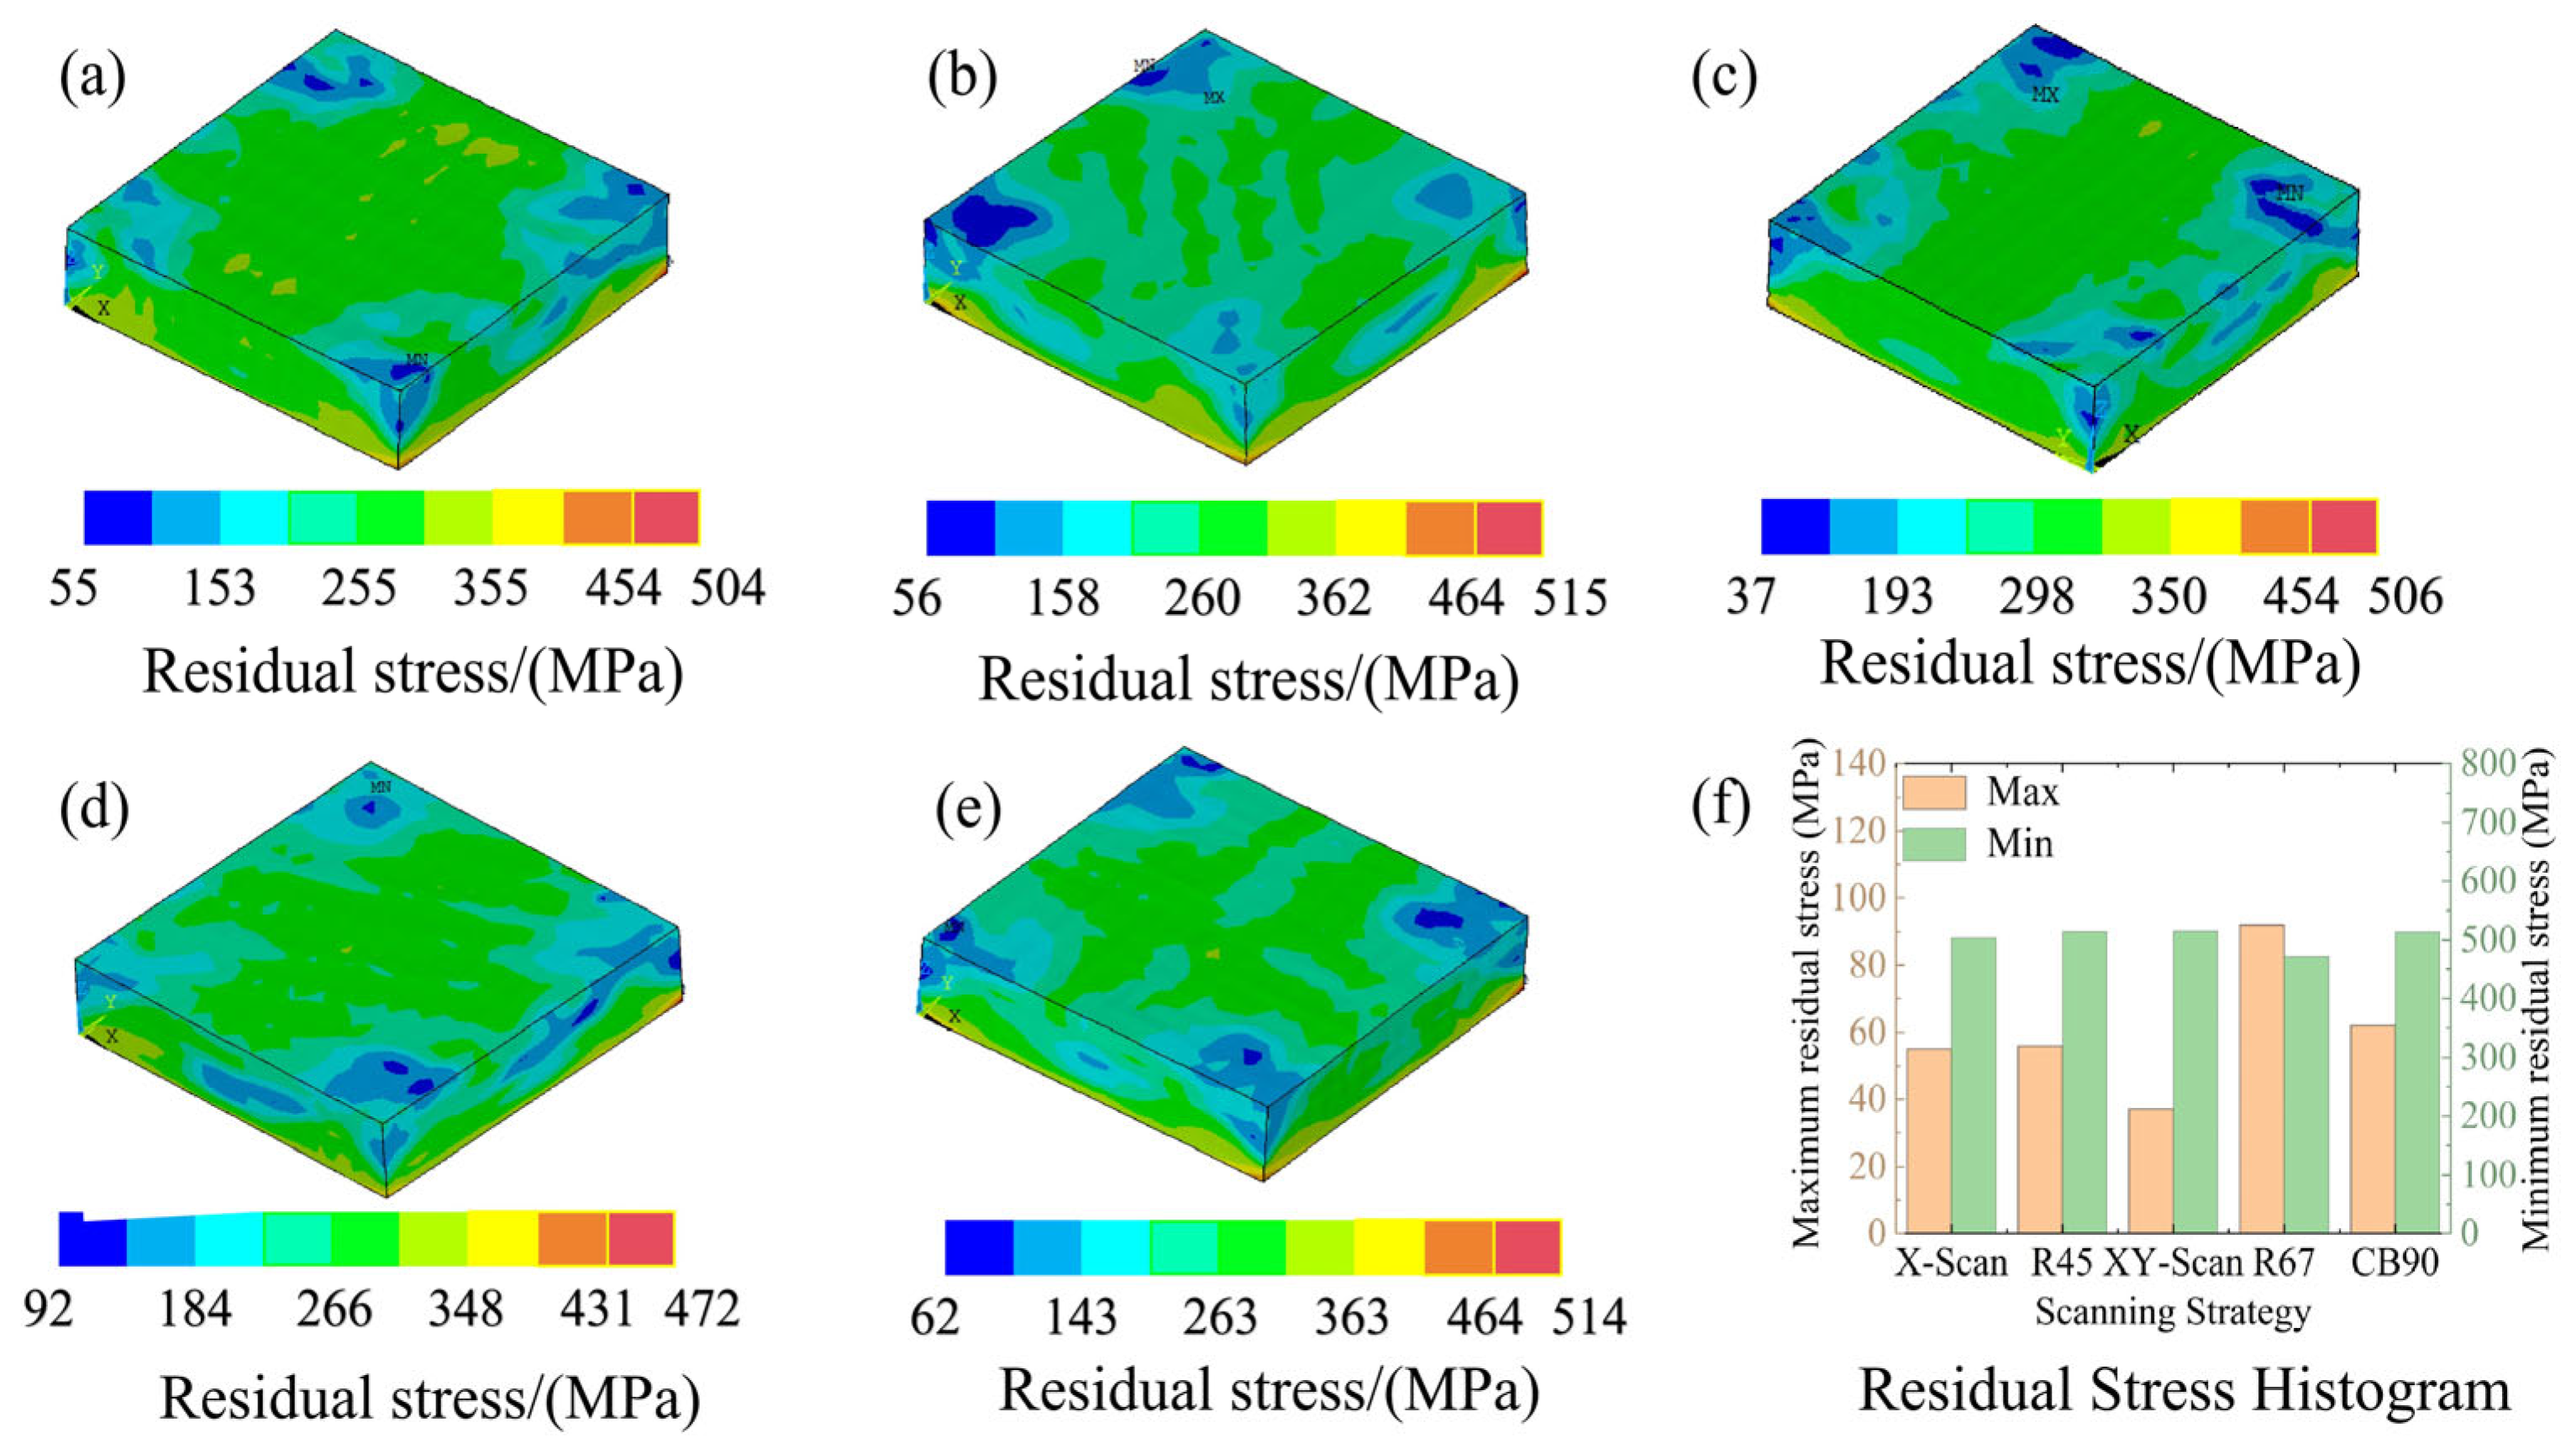
To better understand residual stress accumulation, numerical simulations were conducted. The residual stress contour maps after cooling to 20 °C for five scanning strategies, with residual stress values of 504 MPa, 515 MPa, 506 MPa, 472 MPa, and 514 MPa, respectively, are shown in Figure 10. The minimal residual stress at the four corners of the top layer across all five strategies results from a combination of factors: geometric symmetry enabling more balanced heat input and cooling, boundary heat dissipation effects reducing thermal stress, reduced thermal accumulation at the scan path start/end points, and stress cancelation from multi-directional scanning strategies. R67 effectively disrupts the directional thermal accumulation caused by continuous scanning paths, preventing sustained thermal gradients in specific directions. Compared to conventional angles (e.g., 45°or 90°), the asymmetric R67 strategy more effectively interrupts the periodicity of thermal cycles, reducing localized stress concentrations. CB90 divides large areas into small “islands,” each scanned independently, significantly shortening heat conduction paths and lowering local thermal gradients. Within each island, a 90° rotation further disperses heat source directions, achieving stress compensation at the microscopic level.
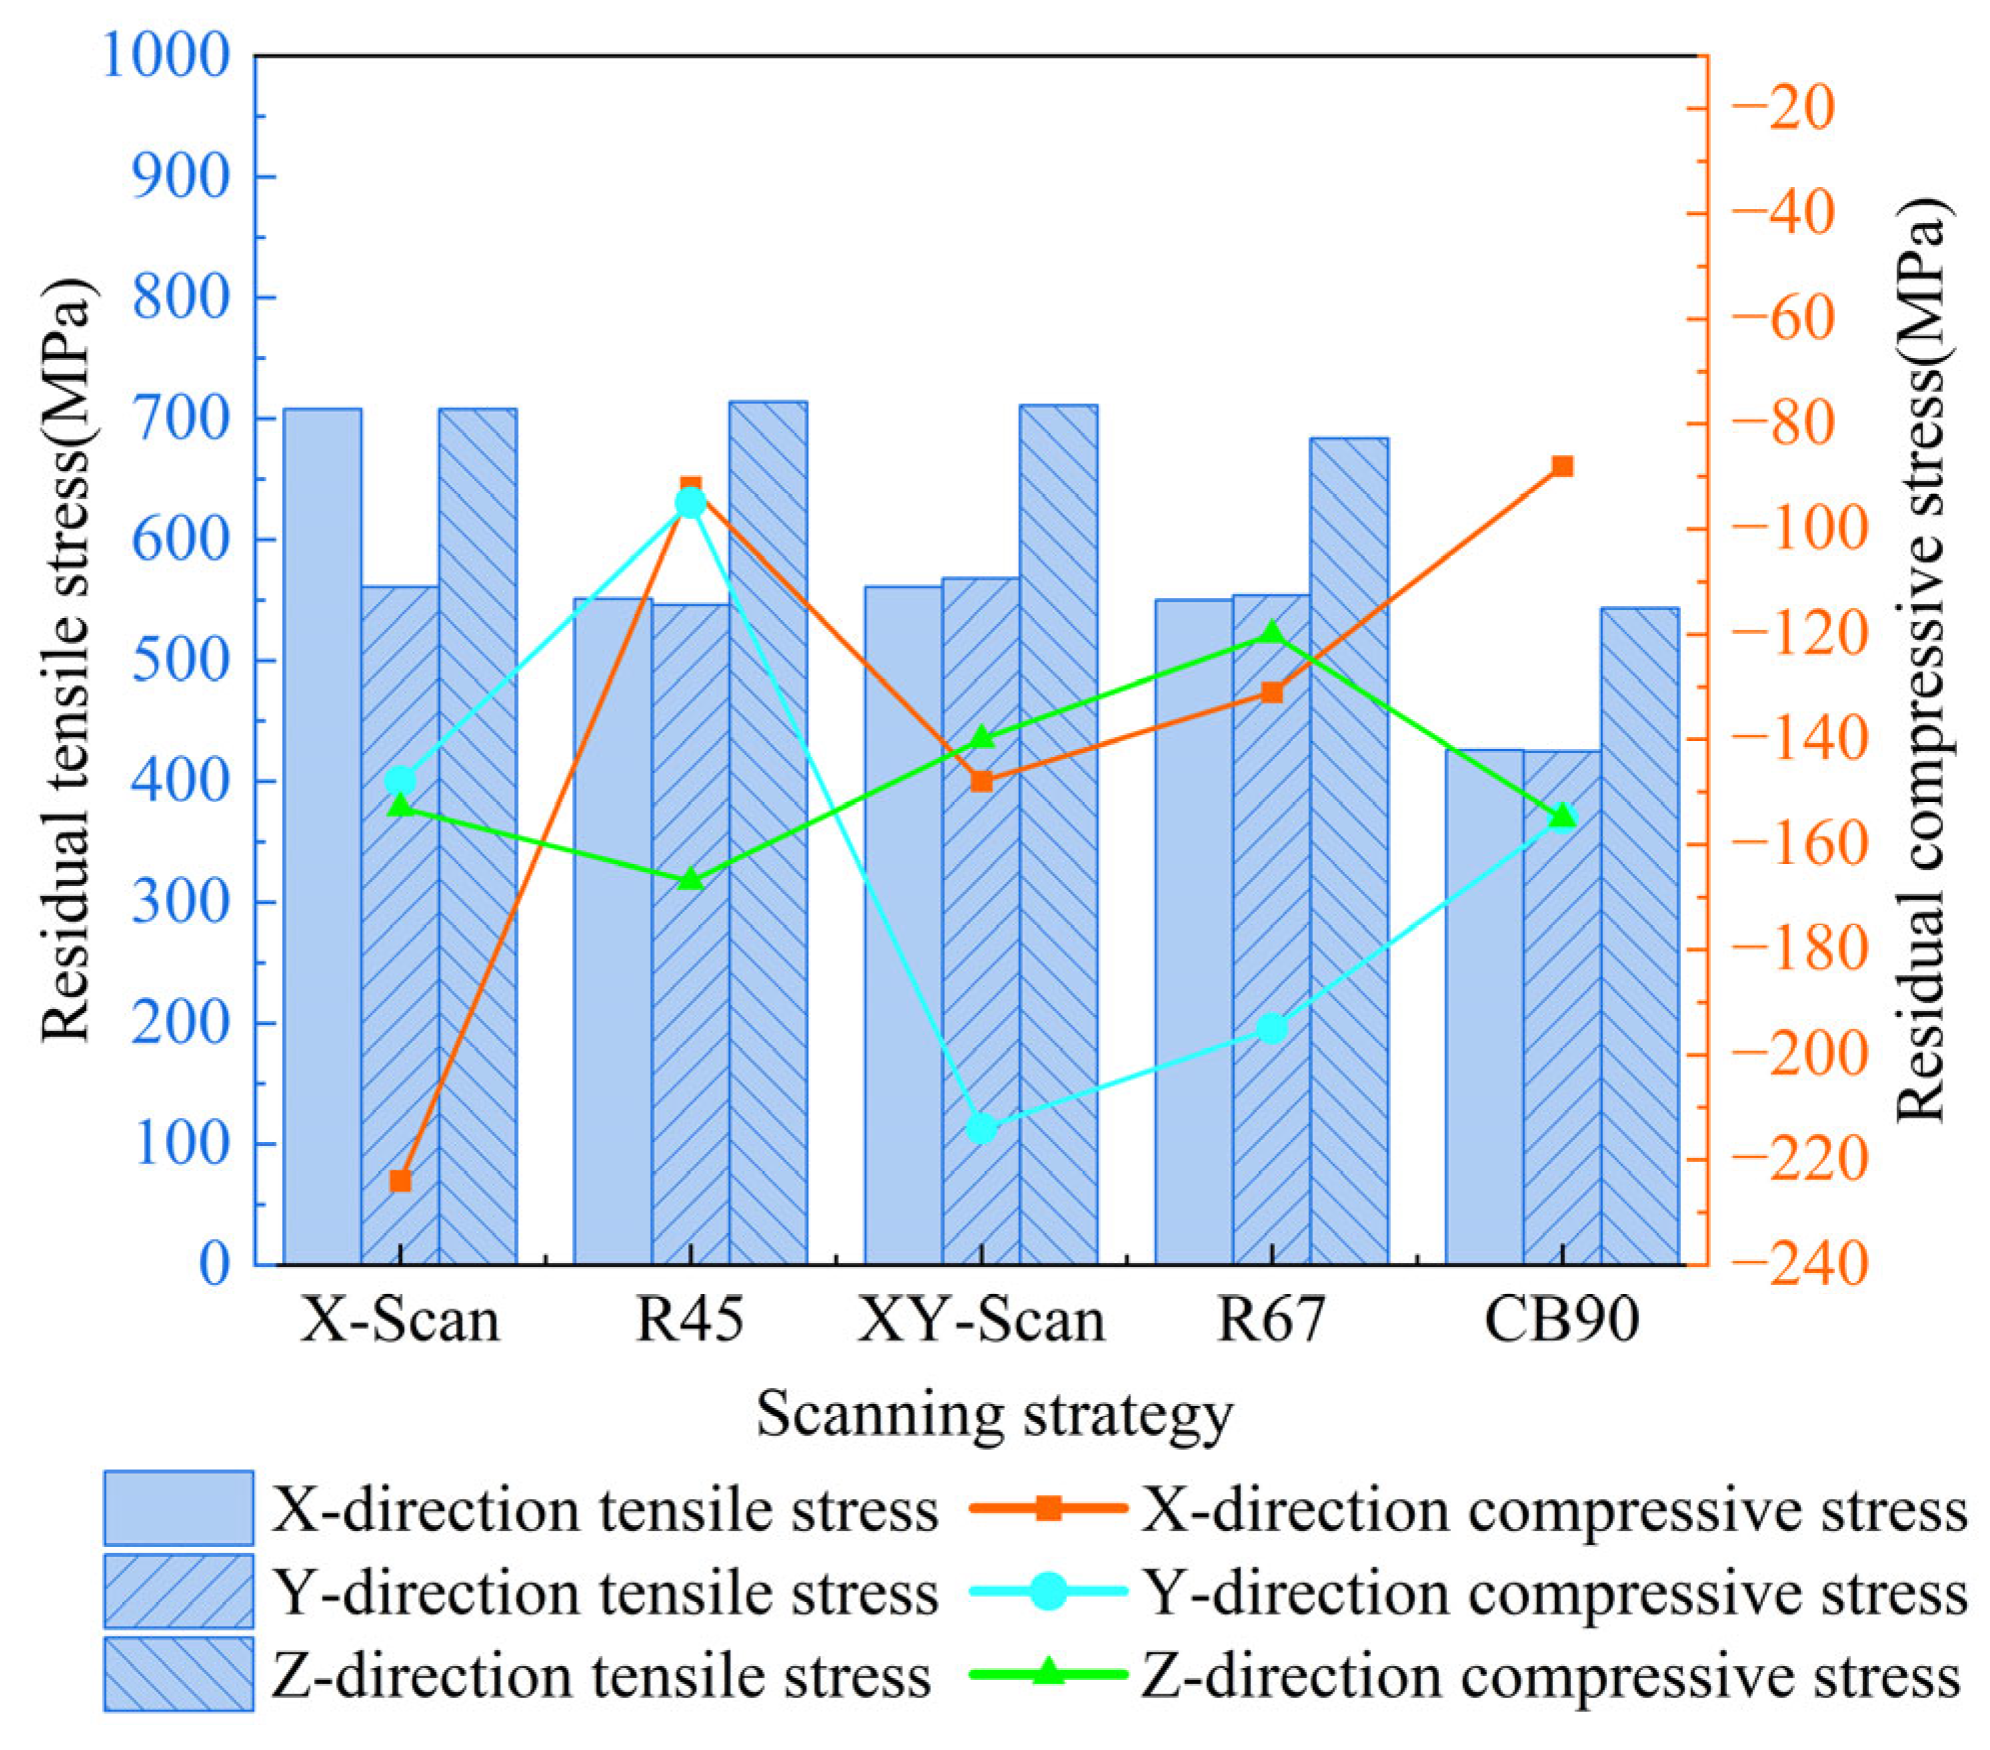
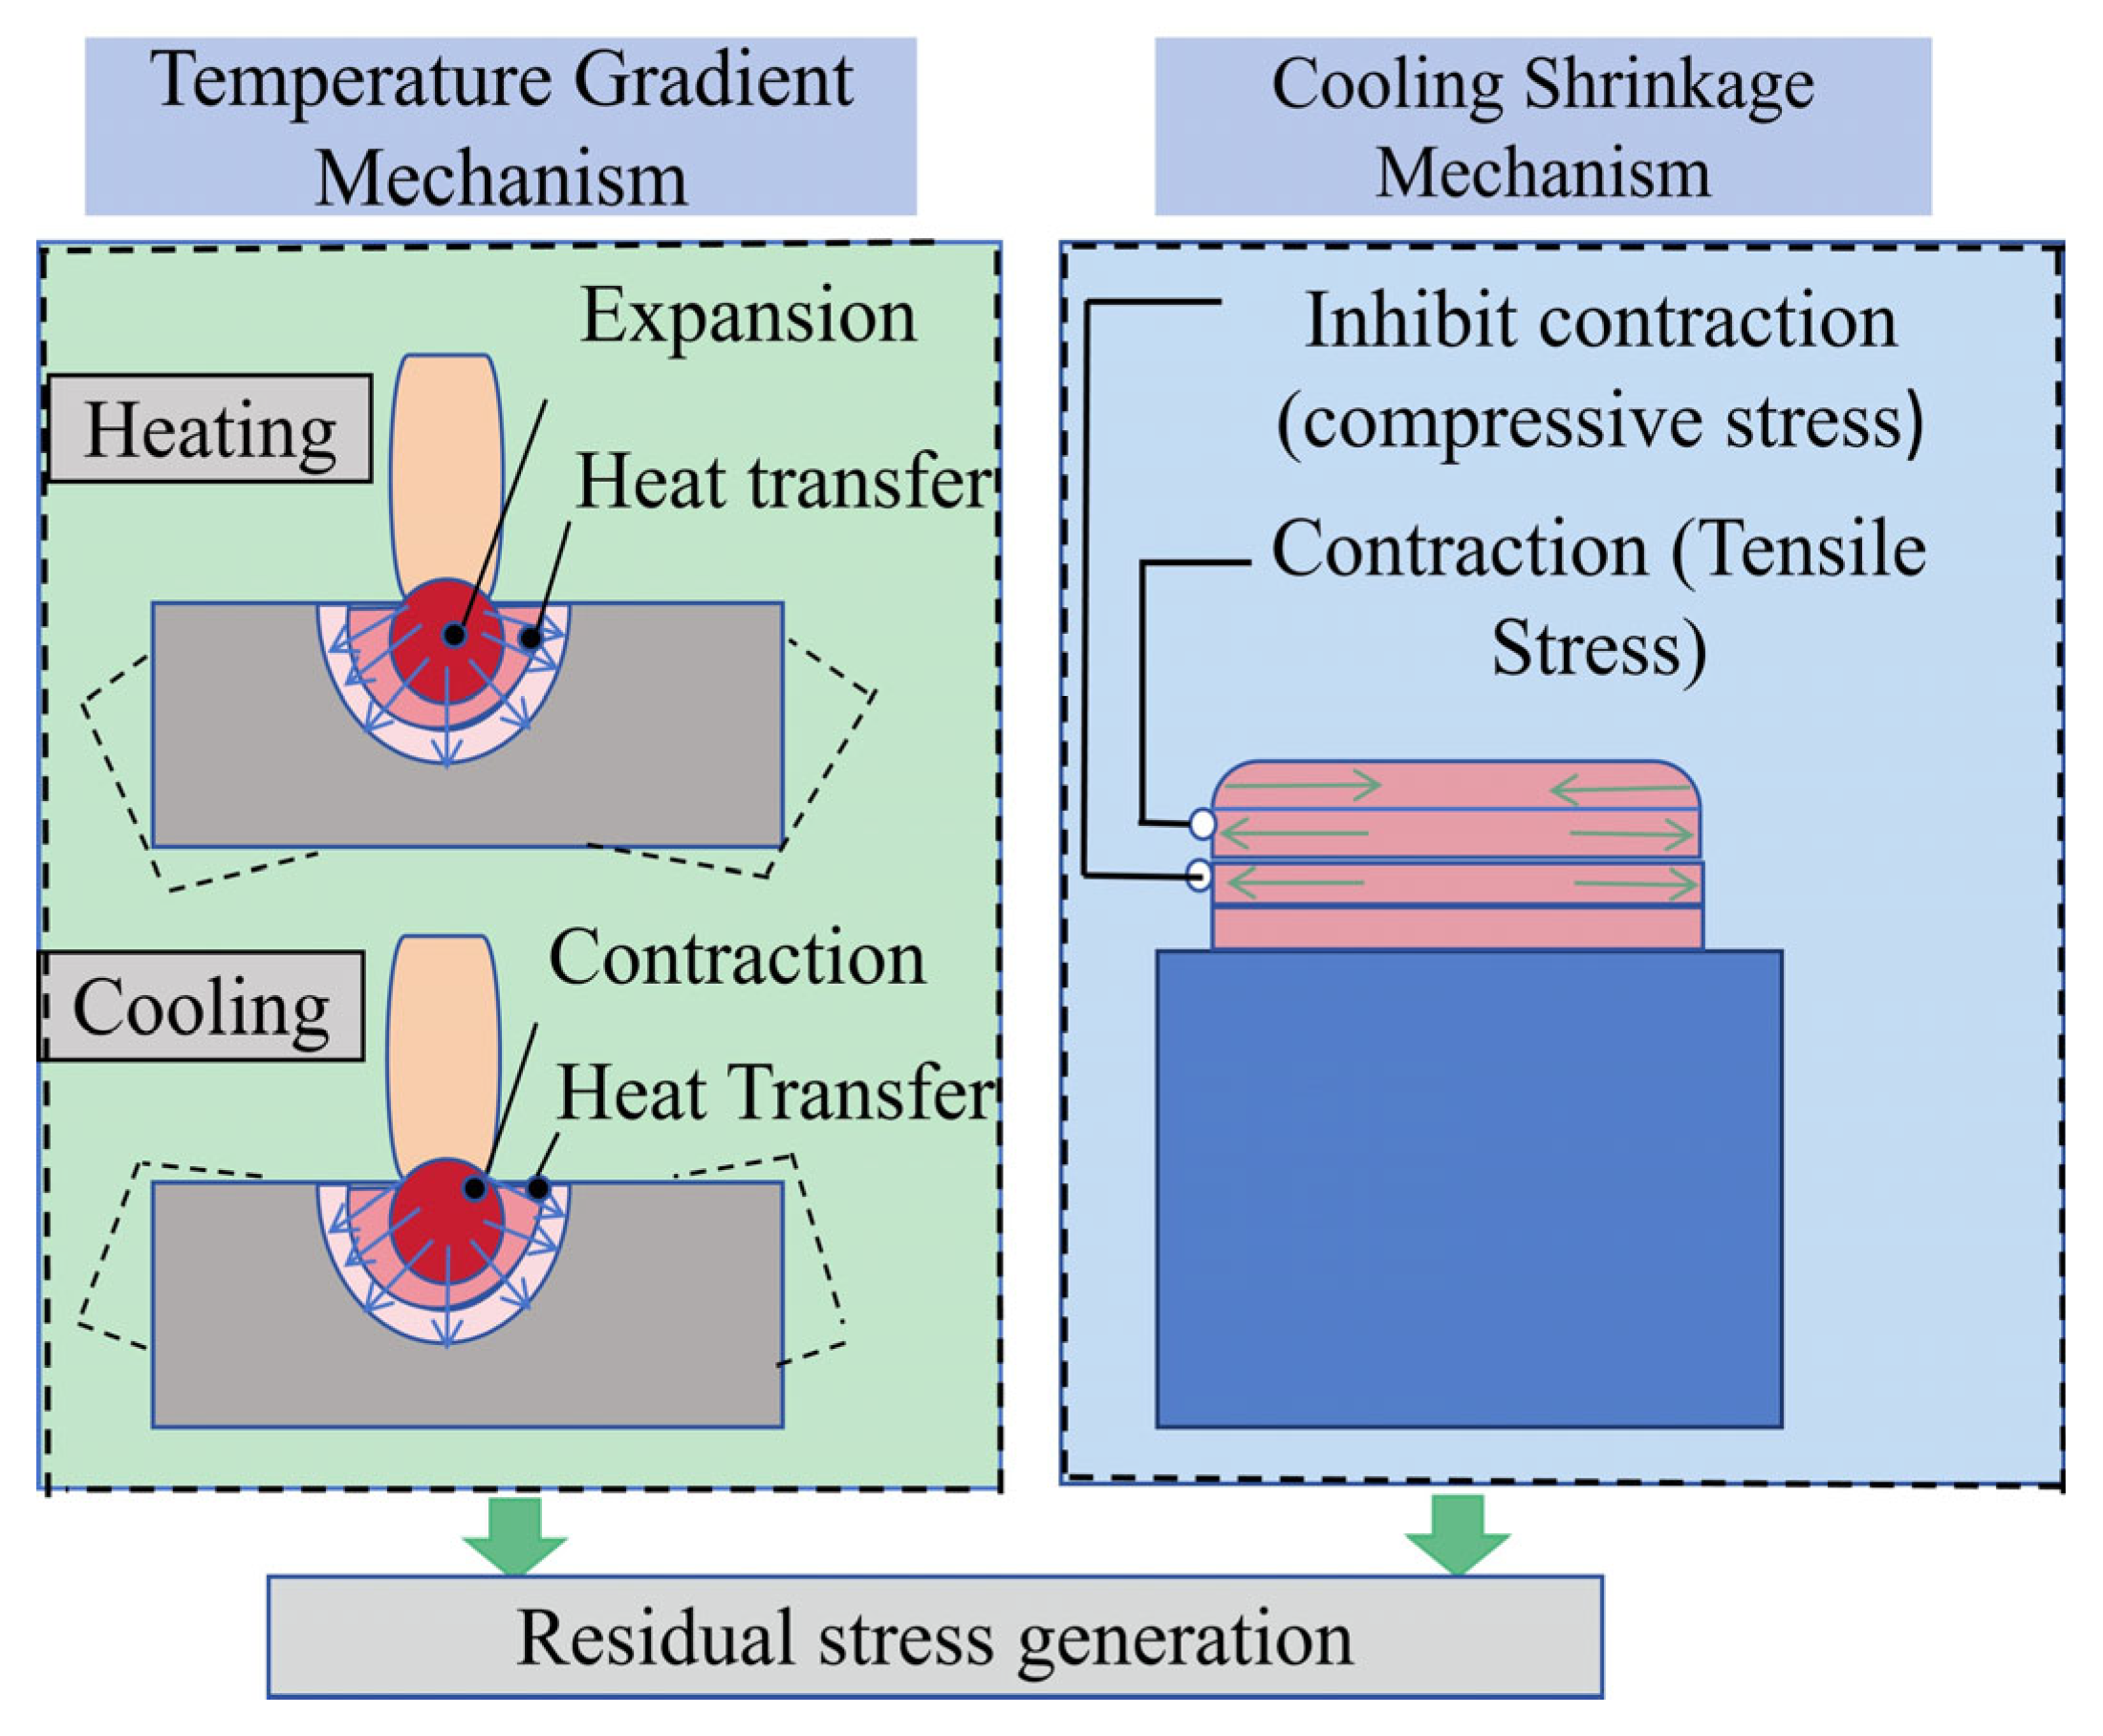
During the printing process, the temperature gradient (TGM) serves as a critical factor governing residual stress development. The residual stress contour maps of the deposited layers under five scanning strategies after cooling to room temperature (Figure 11) reveal a distinct tensile–compressive stress distribution. The line charts indicate that, across all five strategies and three directions, the magnitude of compressive stress is consistently lower than that of tensile stress. Notably, under the X-scan strategy, the stress differential between the X and Y directions reaches 147 MPa, suggesting a pronounced directional dependence of residual stress along the scanning path. In contrast, the residual stress distributions in the X and Y directions remain relatively uniform for the other scanning strategies, with negligible directional differences. This observation suggests that layer rotation strategies are effective in mitigating residual stress anisotropy. Furthermore, both the 67° rotation (R67) and island scanning strategies exhibit relatively low residual stress levels, further underscoring the potential of optimized interlayer rotation schemes for residual stress control in L-PBF-fabricated GH3536 components.
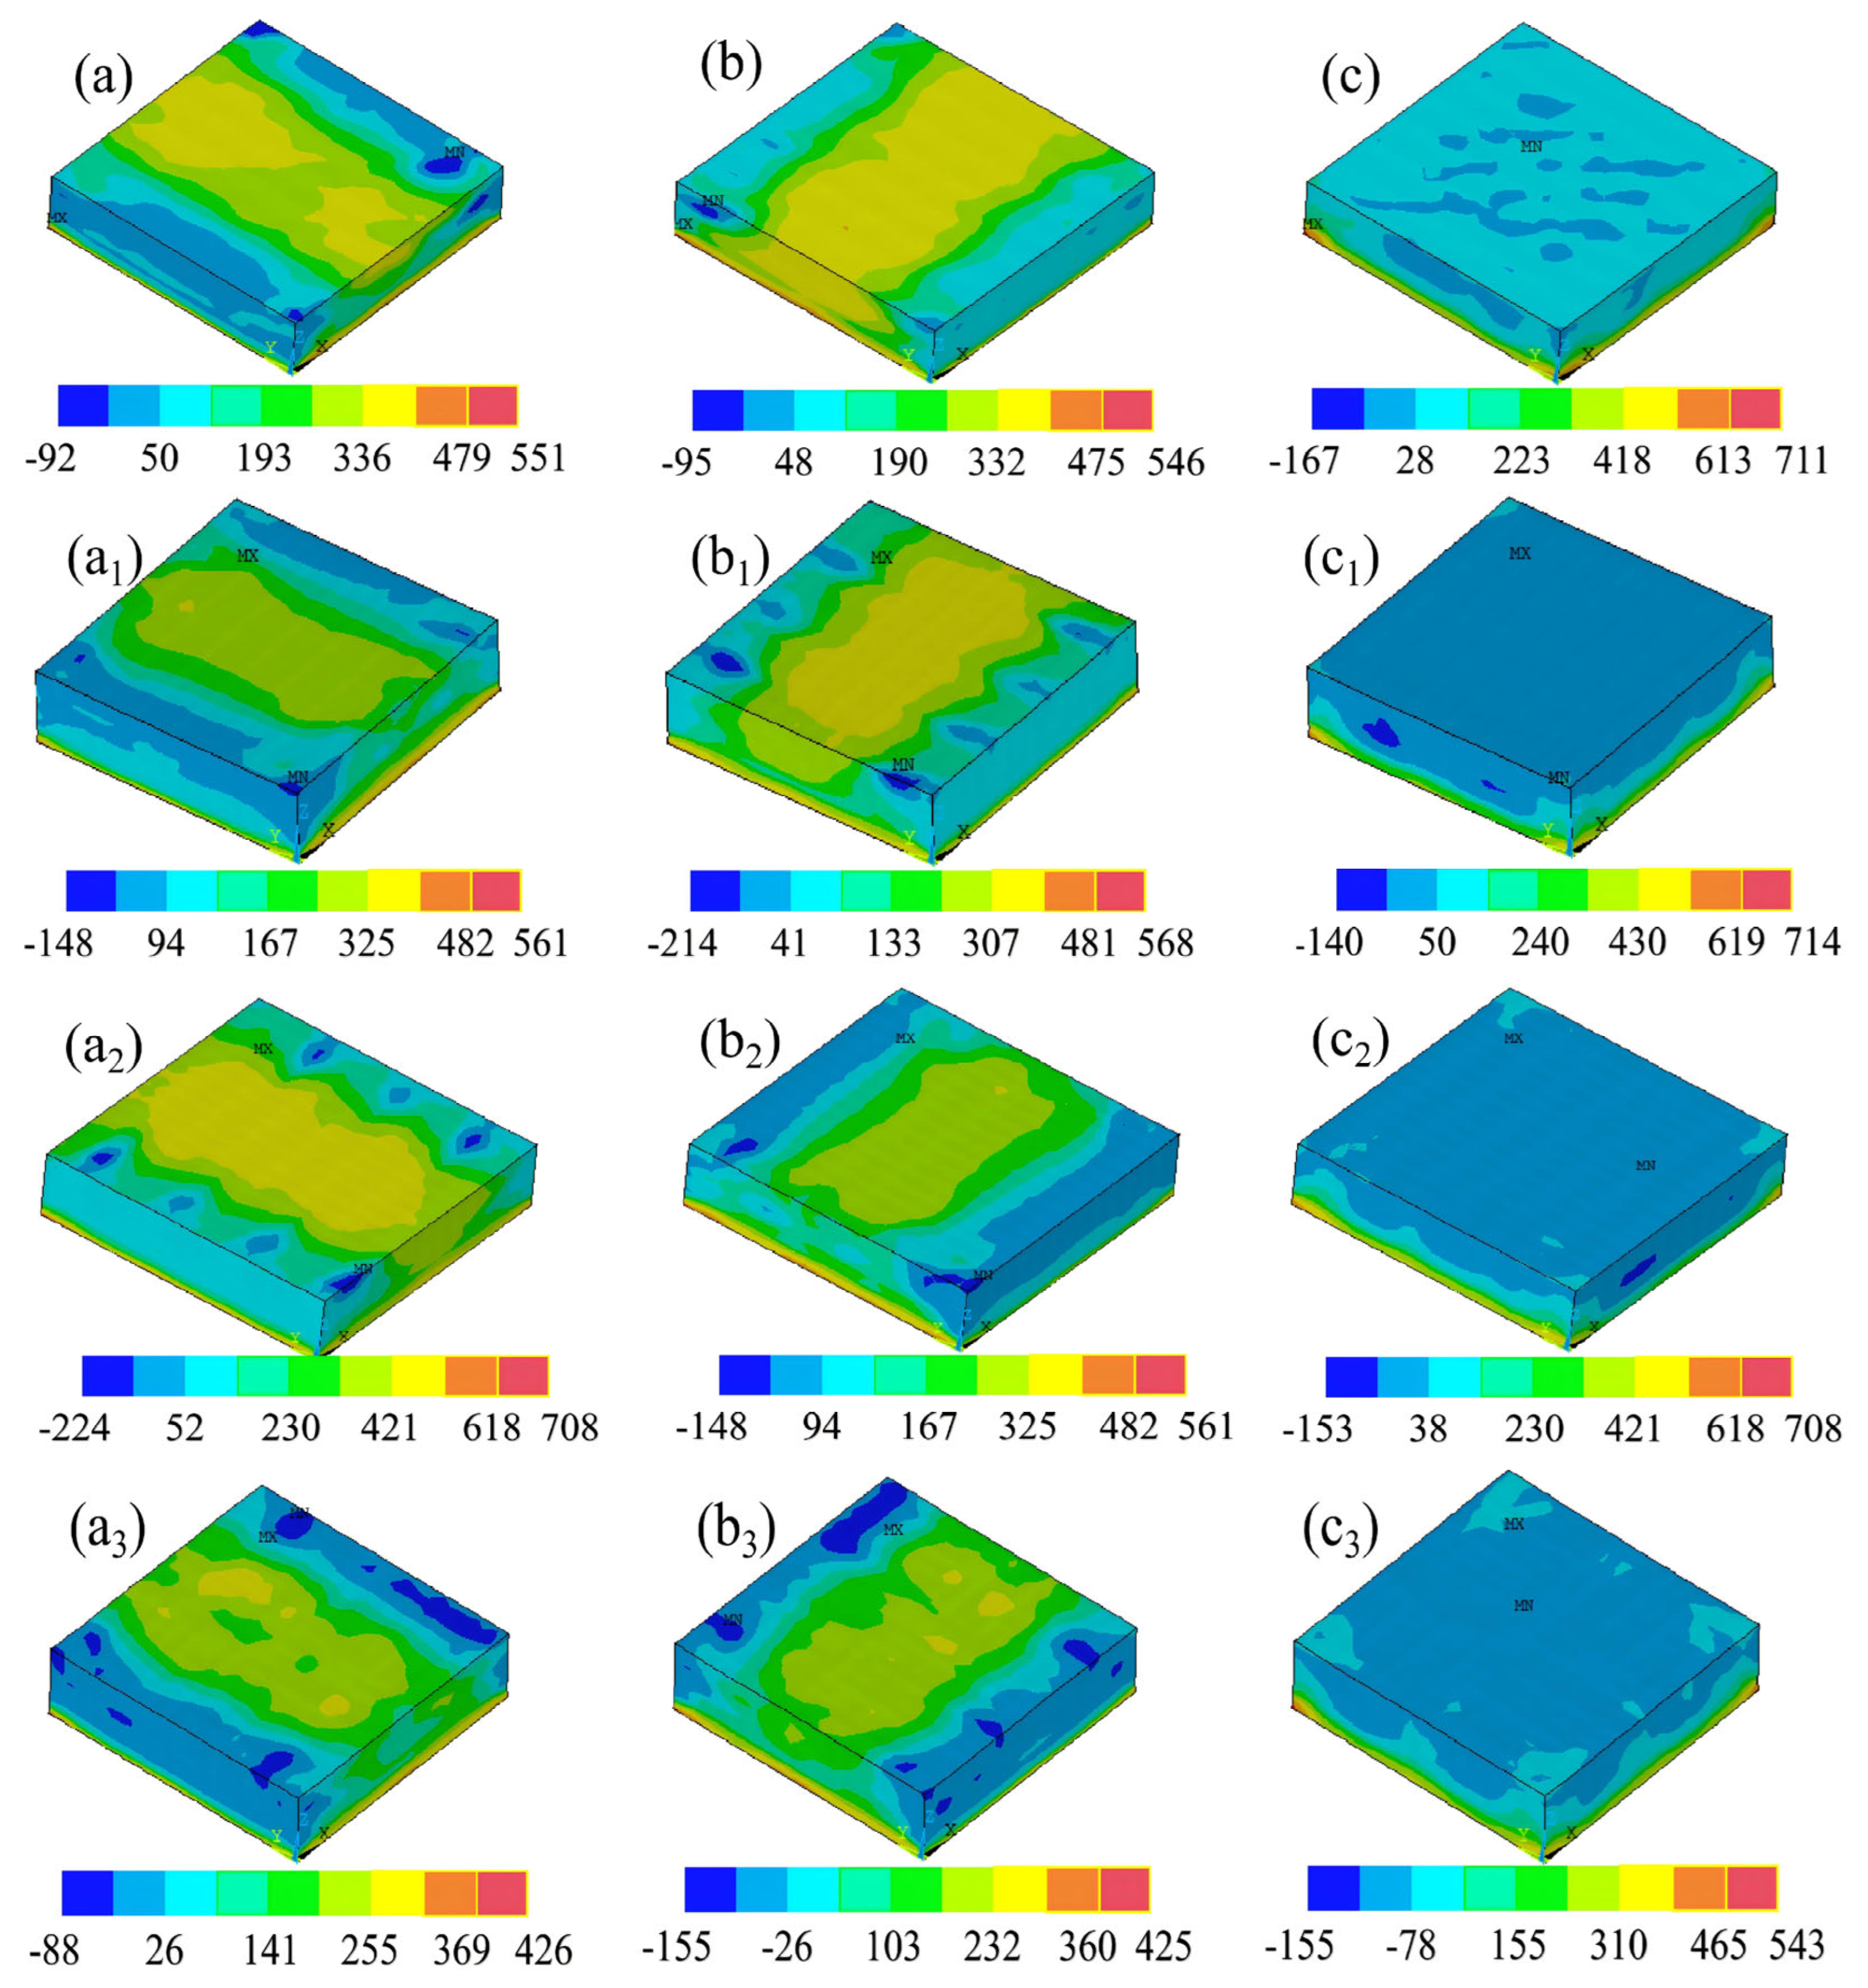
The residual stress contour plots of the deposited layer in three orientations under various scanning strategies are shown in Figure 12. Across all strategies, the maximum tensile stresses in both the X and Y directions are predominantly concentrated near the four corners at the bottom of the deposited layer. Elevated thermal stresses are also observed at the two central points along the X (or Y) direction, with stress magnitudes gradually decreasing toward the center of the layer.
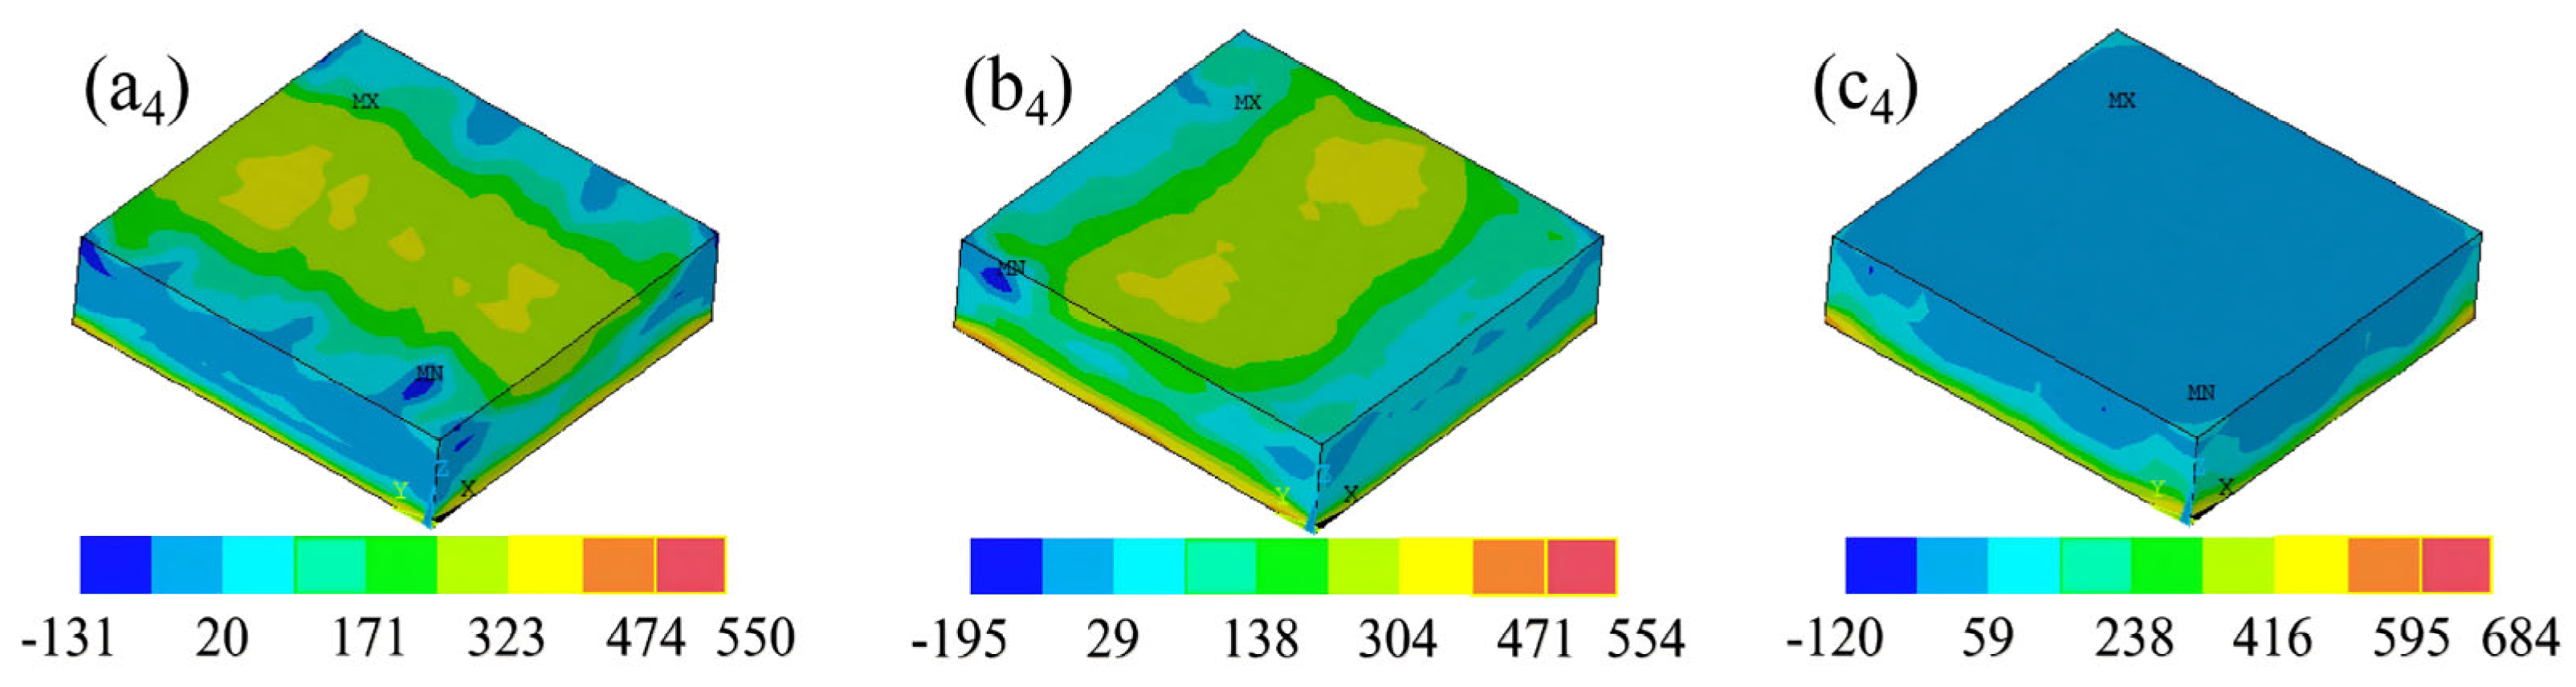
Among the five scanning strategies, the highest thermal stresses are observed in the deposited layers fabricated by XY-Scan (Figure 12a–c) and X-Scan (Figure 12(a2)–(c2)), followed by R45 (Figure 12(a1)–(c1)), R67 (Figure 12(a3)–(c3)), and CB90 (Figure 12(a4)–(c4)). In contrast, residual stresses in the Z-direction are uniformly distributed across all five strategies, with measured values of 711 MPa for X-Scan (Figure 12c), 714 MPa for R45 (Figure 12(c1)), 708 MPa for XY-Scan (Figure 12(c2)), and 684 MPa for CB90 (Figure 12(c3)). During the printing process, the temperature gradient (TGM) serves as a key factor governing residual stress development, manifesting as a characteristic tensile–compressive stress pattern (Figure 13). Under all five strategies, the upper region of the molten pool in the deposited layer experiences the highest cooling rate upon exposure to the atmosphere, leading to significant contraction. Meanwhile, the lower surface remains in a relatively constrained state, resulting in the development of tensile stress. As illustrated in the stress contour maps, the intermediate layers exhibit alternating tensile and compressive stresses, attributable to stress reversal induced by cyclic thermal loading between successive layers. The substrate, owing to its higher rigidity compared to the deposited layer, generates greater tensile stress at the bottom. As indicated in Figure 8g,h, residual stresses in the X and Y directions exhibit enhanced uniformity under the R67 strategy (426 MPa and 425 MPa, respectively), a consequence of the temperature gradient modulation effected by the scanning strategy, while the Z-direction residual stress reaches 543 MPa. Notably, the residual stress values in all three directions remain below the yield strength of GH3536, a finding that contrasts with the results reported by Xie [7] and Chen [28].

3.3. Morphing Analysis

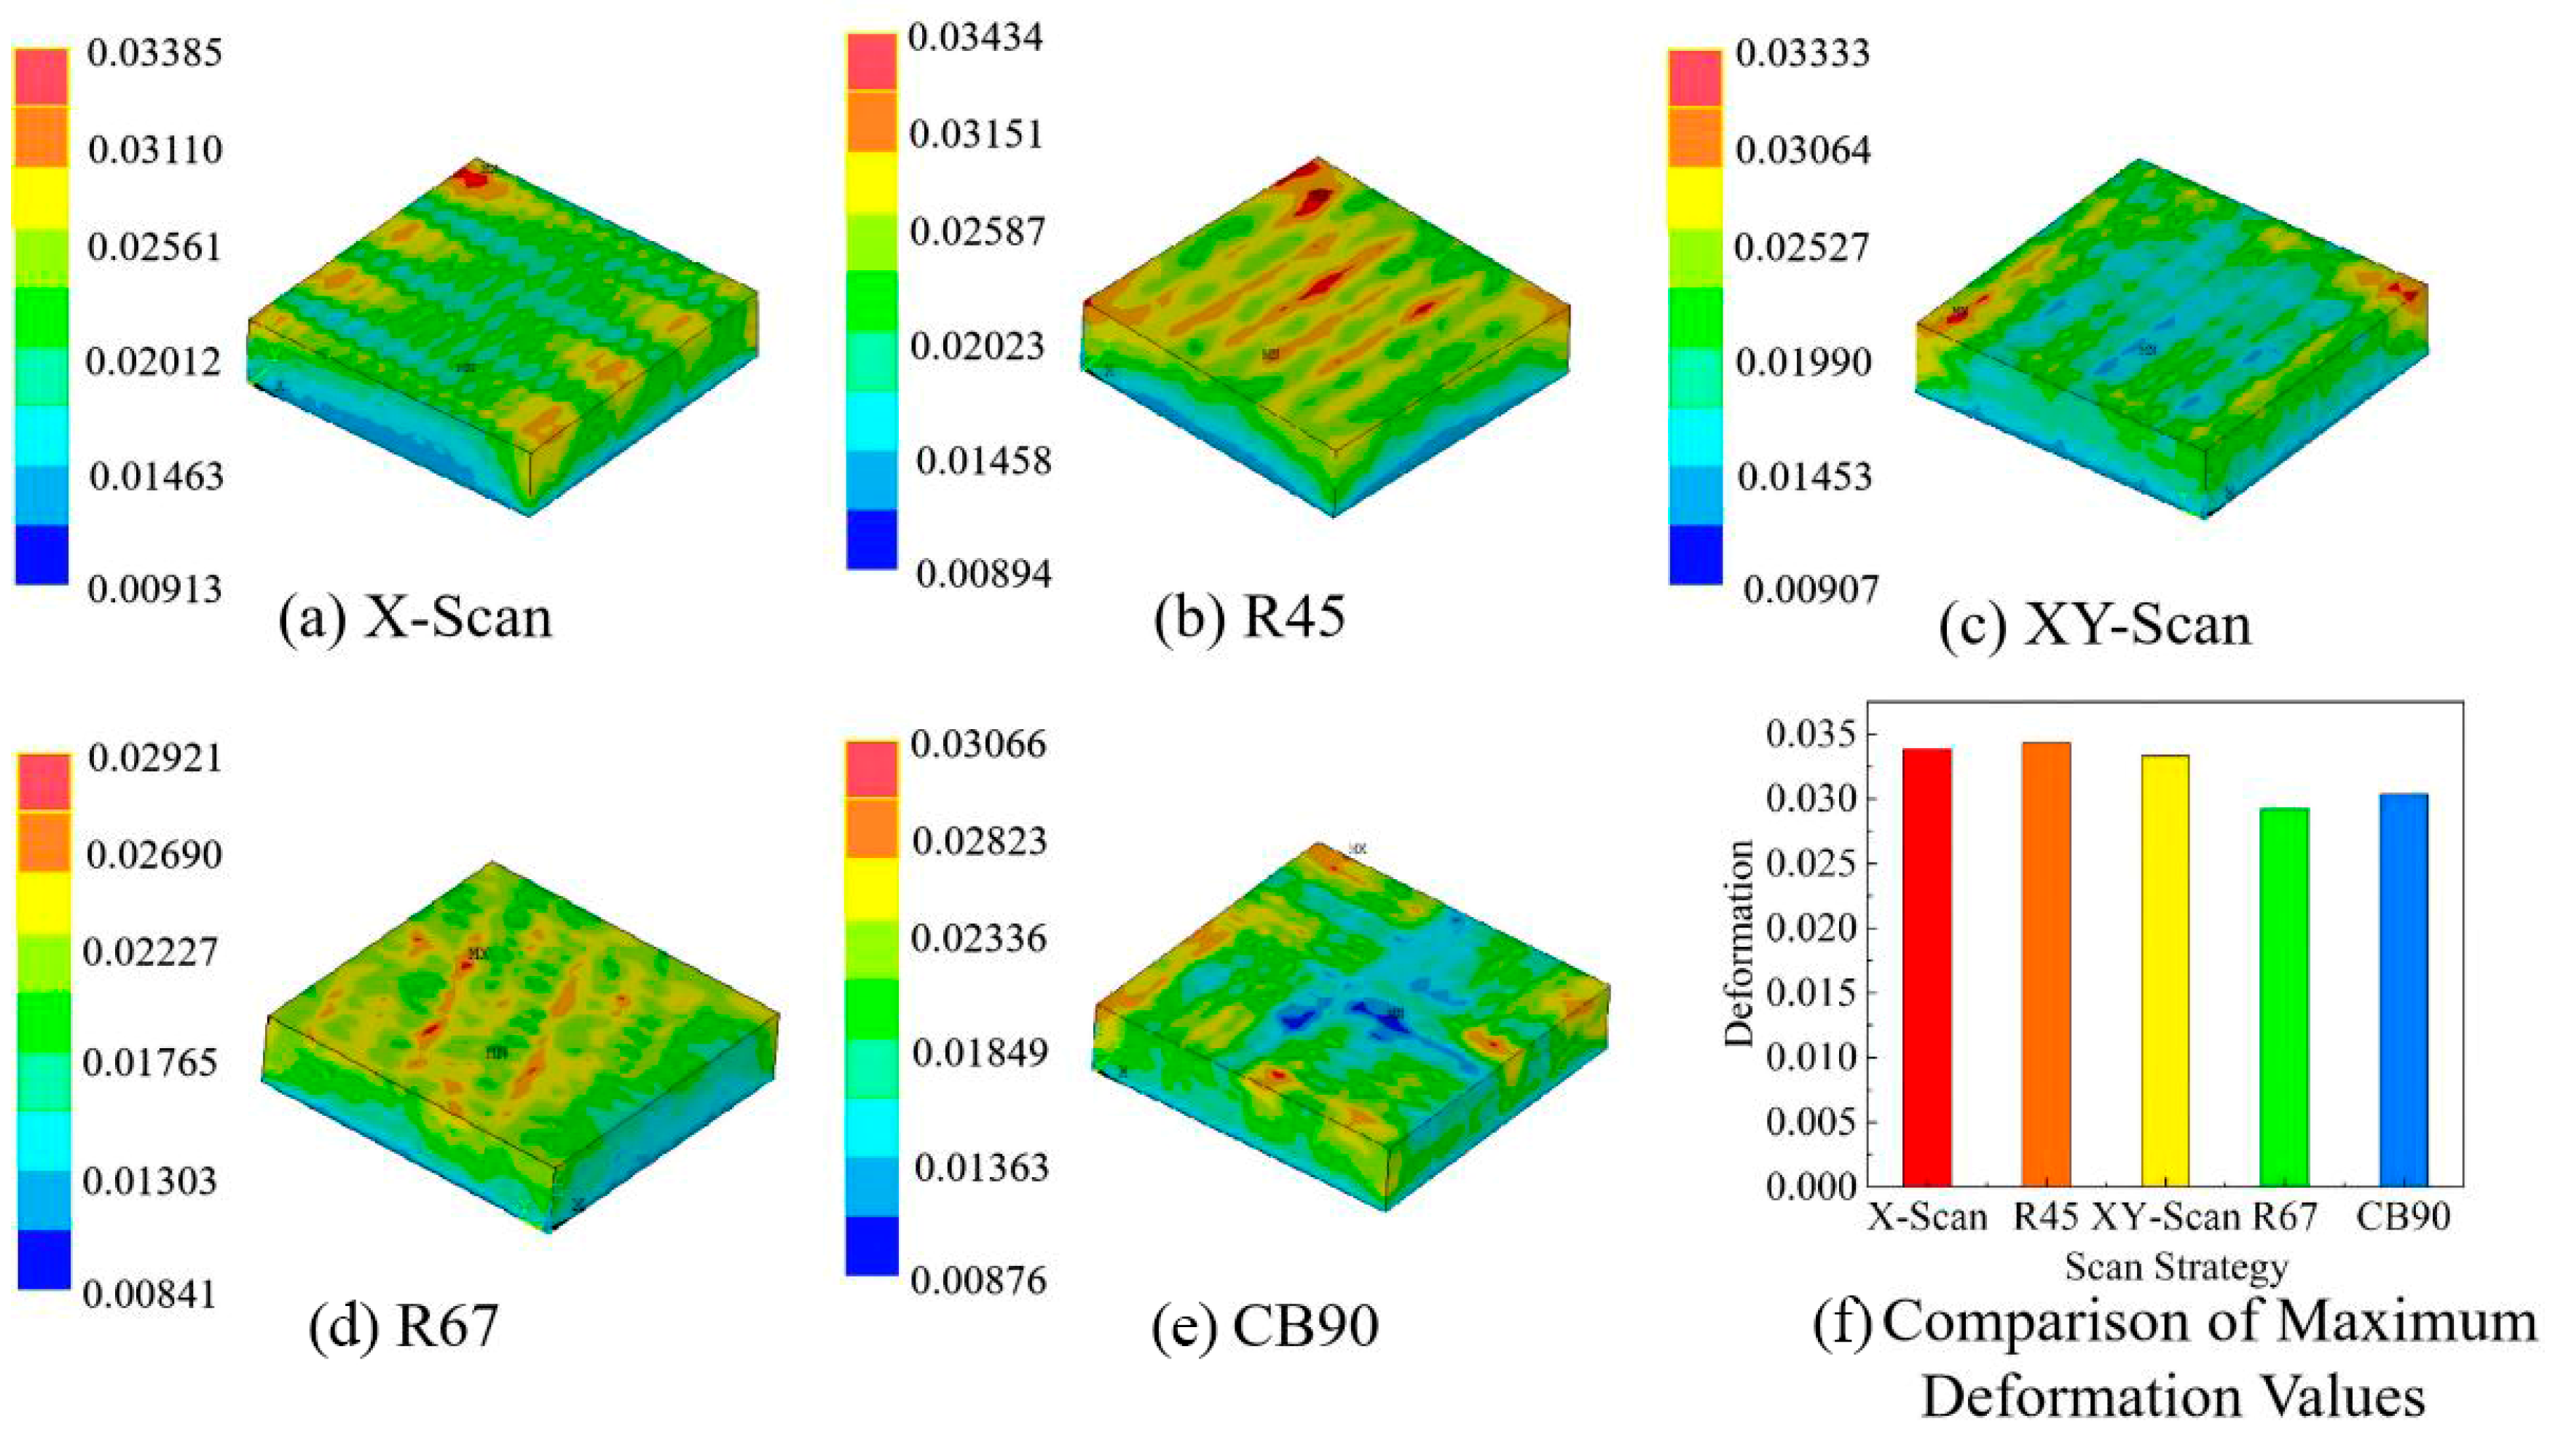
Figure 14 shows the deformation magnitudes and corresponding maximum deflection values for the five scanning strategies after cooling to room temperature (20 °C). For all strategies, the maximum deflection is consistently located in the top deposition zone. The measured maximum deflections for X-scan, R45, XY-scan, R67, and CB90 are 0.03385 mm, 0.03434 mm, 0.03333 mm, 0.02921 mm, and 0.03066 mm, respectively. The greater deformation observed in X-scan and XY-scan can be attributed to the persistent unidirectional heat flow, which promotes significant accumulation of anisotropic thermal stresses. In contrast, R67 exhibits the smallest deformation, a finding closely associated with the asymmetric thermal effects at the melt pool interface during thermal cycling. Island scanning demonstrates reduced deformation due to its halved grating path length relative to other strategies, which results in lower residual heat accumulation, diminished thermal gradients, and consequently mitigated localized deformation. Under the R45 strategy, the maximum deformation is concentrated in the central region. The relatively low deformation levels observed across all five strategies throughout the powder layer stem from the mesoscale nature of the simulation model, which incorporates only four deposited layers within a limited scanning area. Therefore, in practical L-PBF processes, the deformation magnitudes under different scanning strategies are expected to exceed the values reported herein.

3.4. Grain Texture Analysis

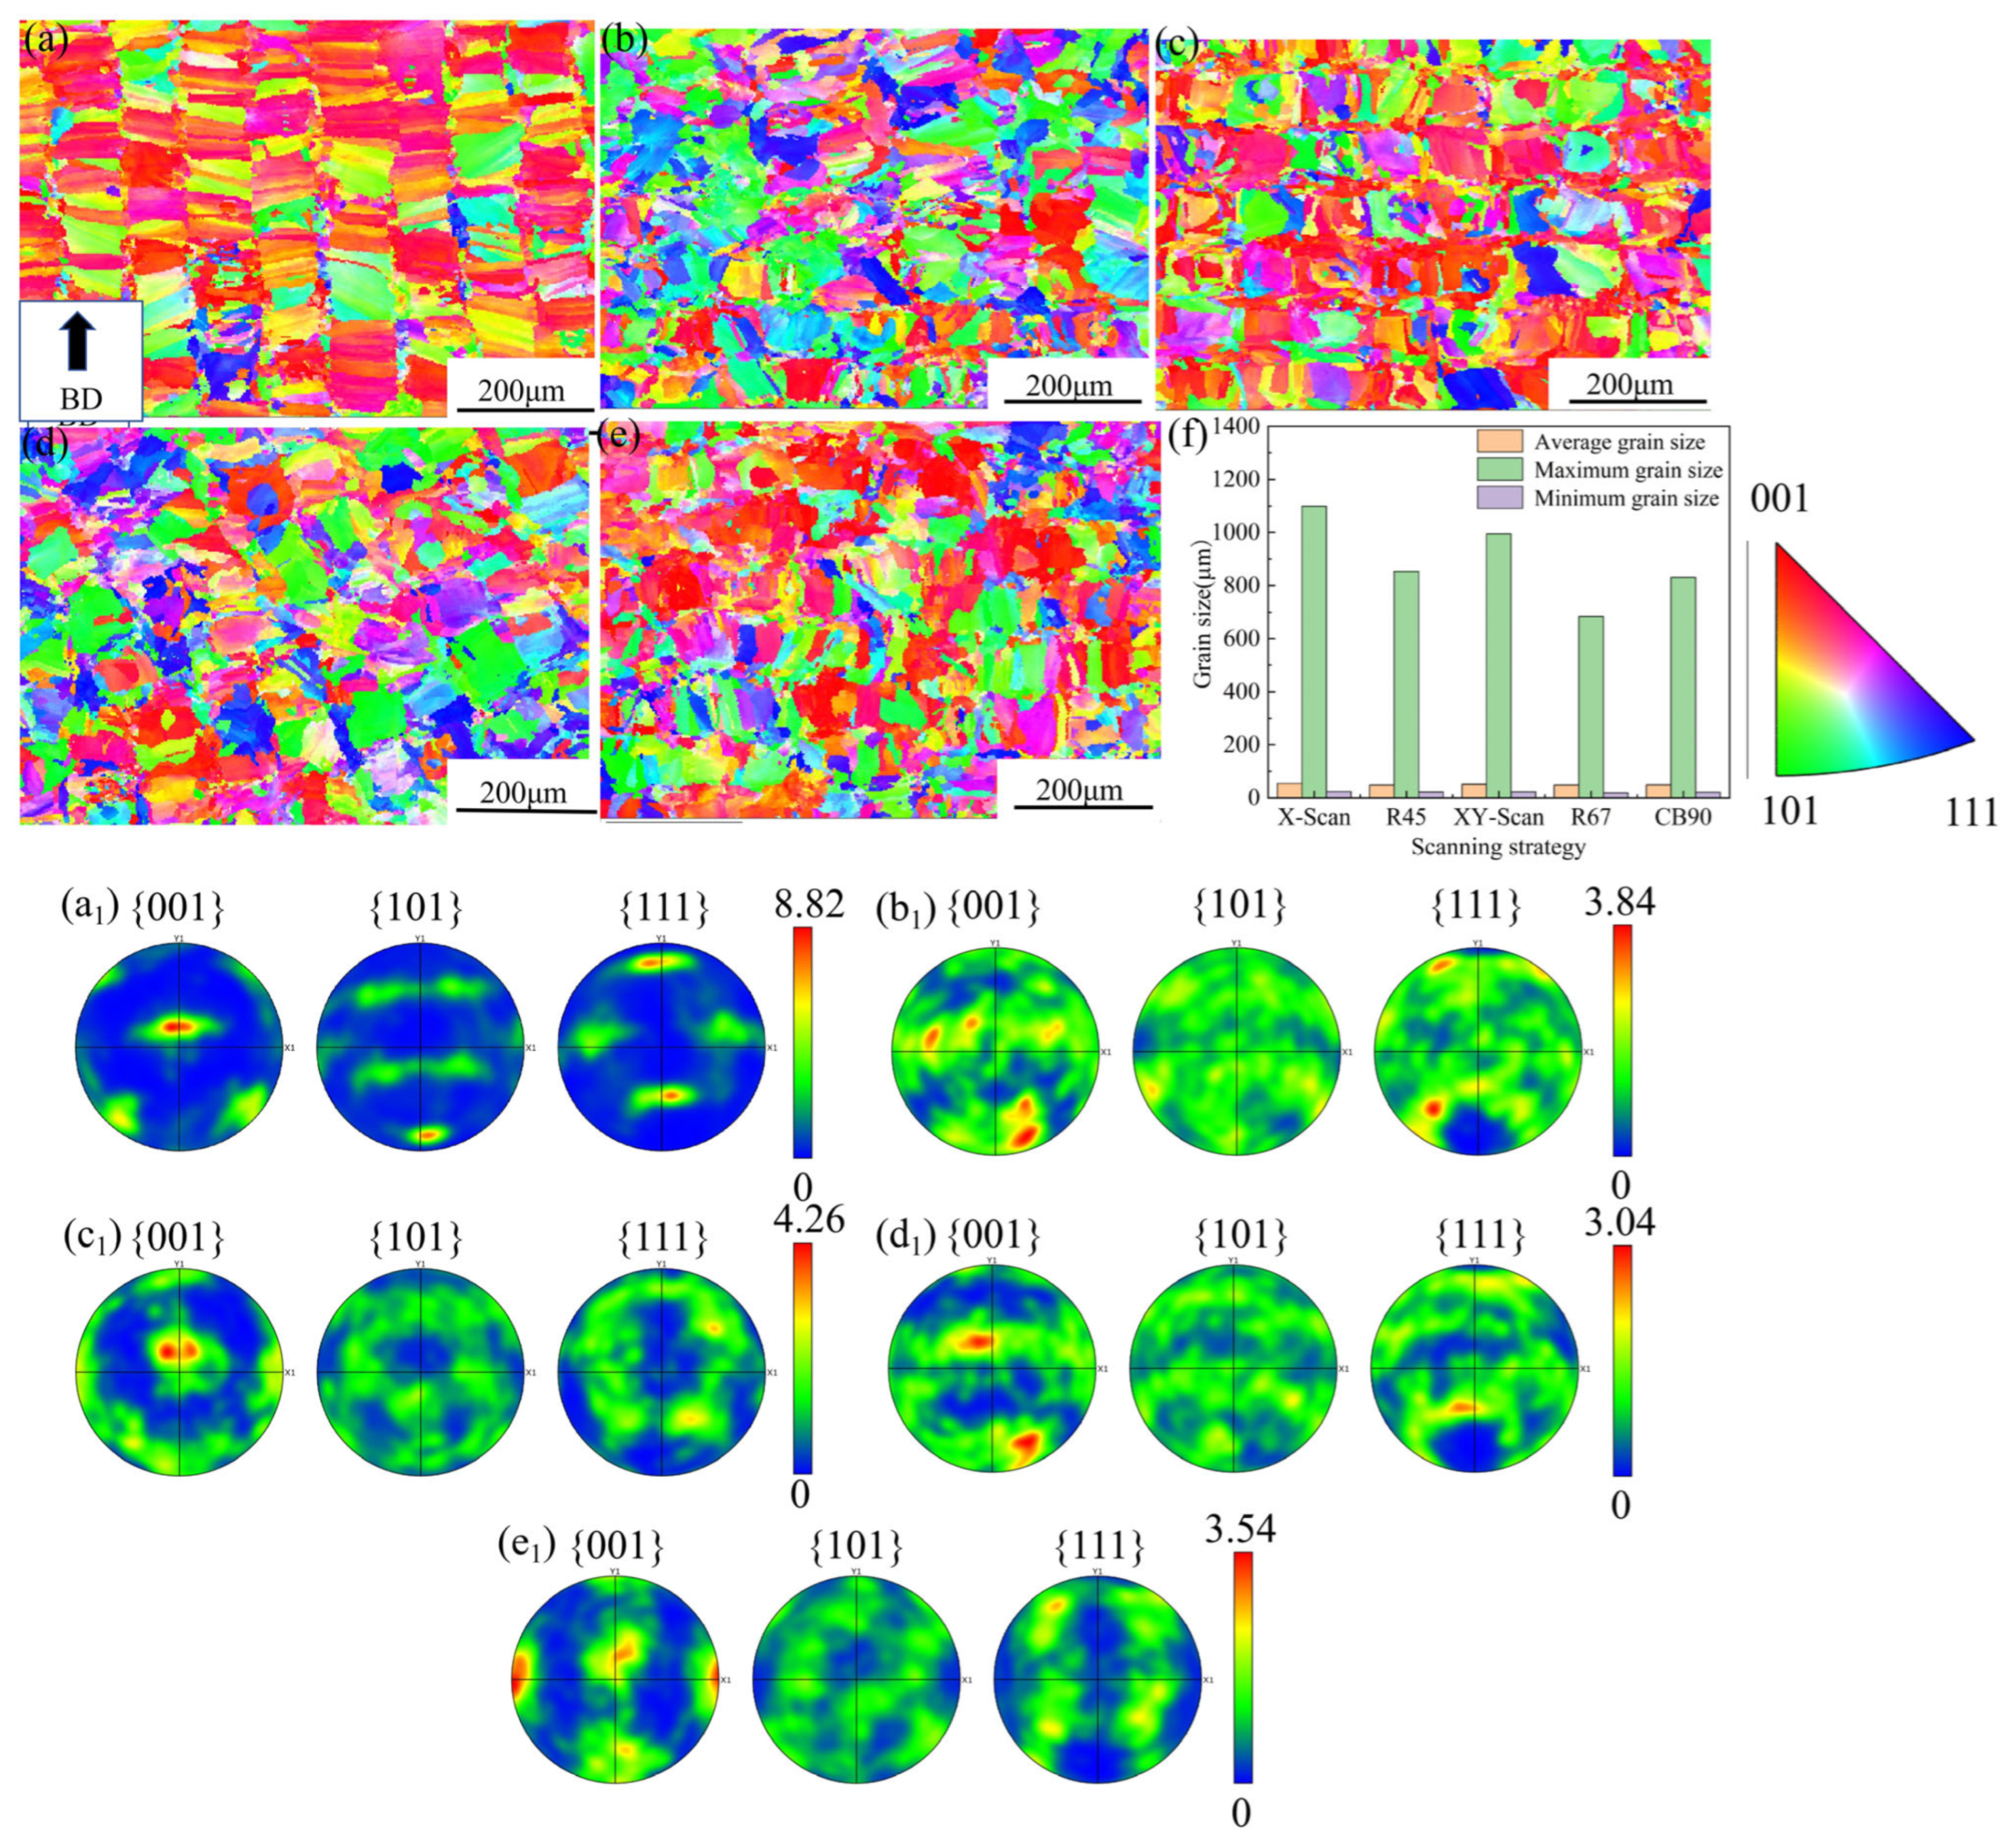
The EBSD and pole figure (PF) analysis of grain evolution and texture characteristics of the GH3536 alloy fabricated under five scanning strategies along the build direction is presented in Figure 15. Grain refinement can indirectly reflect stress uniformity [41]. The X-Scan strategy, characterized by unidirectional heat flow, resulted in the formation of coarse columnar grains with a strong {001}//BD texture. The corresponding {001}, {101}, and {111} pole figures exhibited a maximum texture intensity of 8.84 (Figure 15(a1)), indicating significant residual stress concentration. In contrast, the R45 strategy modified the heat flow path, reducing the maximum texture intensity to 3.84 (Figure 15(b1)), representing a reduction of 56.5%, with a notable weakening of the {110} orientation. Although the XY-Scan strategy employed a 90° interlayer rotation, the texture intensity remained relatively high at 4.26 (Figure 15(c1)), suggesting incomplete alleviation of stress concentration. The R67 strategy, utilizing a 67° non-periodic rotation, proved most effective in disrupting epitaxial growth, resulting in a refined mixed microstructure comprising equiaxed and short columnar grains (the smallest average grain size of 48.98 μm plus and the smallest texture intensity of 3.04). This strategy yielded the lowest overall texture intensity among all conditions, and its correspondingly lower Kernel Average Misorientation (KAM) value and more homogeneous KAM distribution provided quantitative evidence of effectively mitigated micro-scale residual stress. The CB90 island scanning strategy produced a relatively weak bulk texture (texture intensity of 3.54, as shown in Figure 15(e1)); however, localized steep thermal gradients at island boundaries promoted stronger local texture formation. In summary, the R67 strategy, through its 67° interlayer rotation, achieved optimal grain refinement and texture homogenization, effectively reducing residual stress concentration.

3.5. Grain Orientation Difference

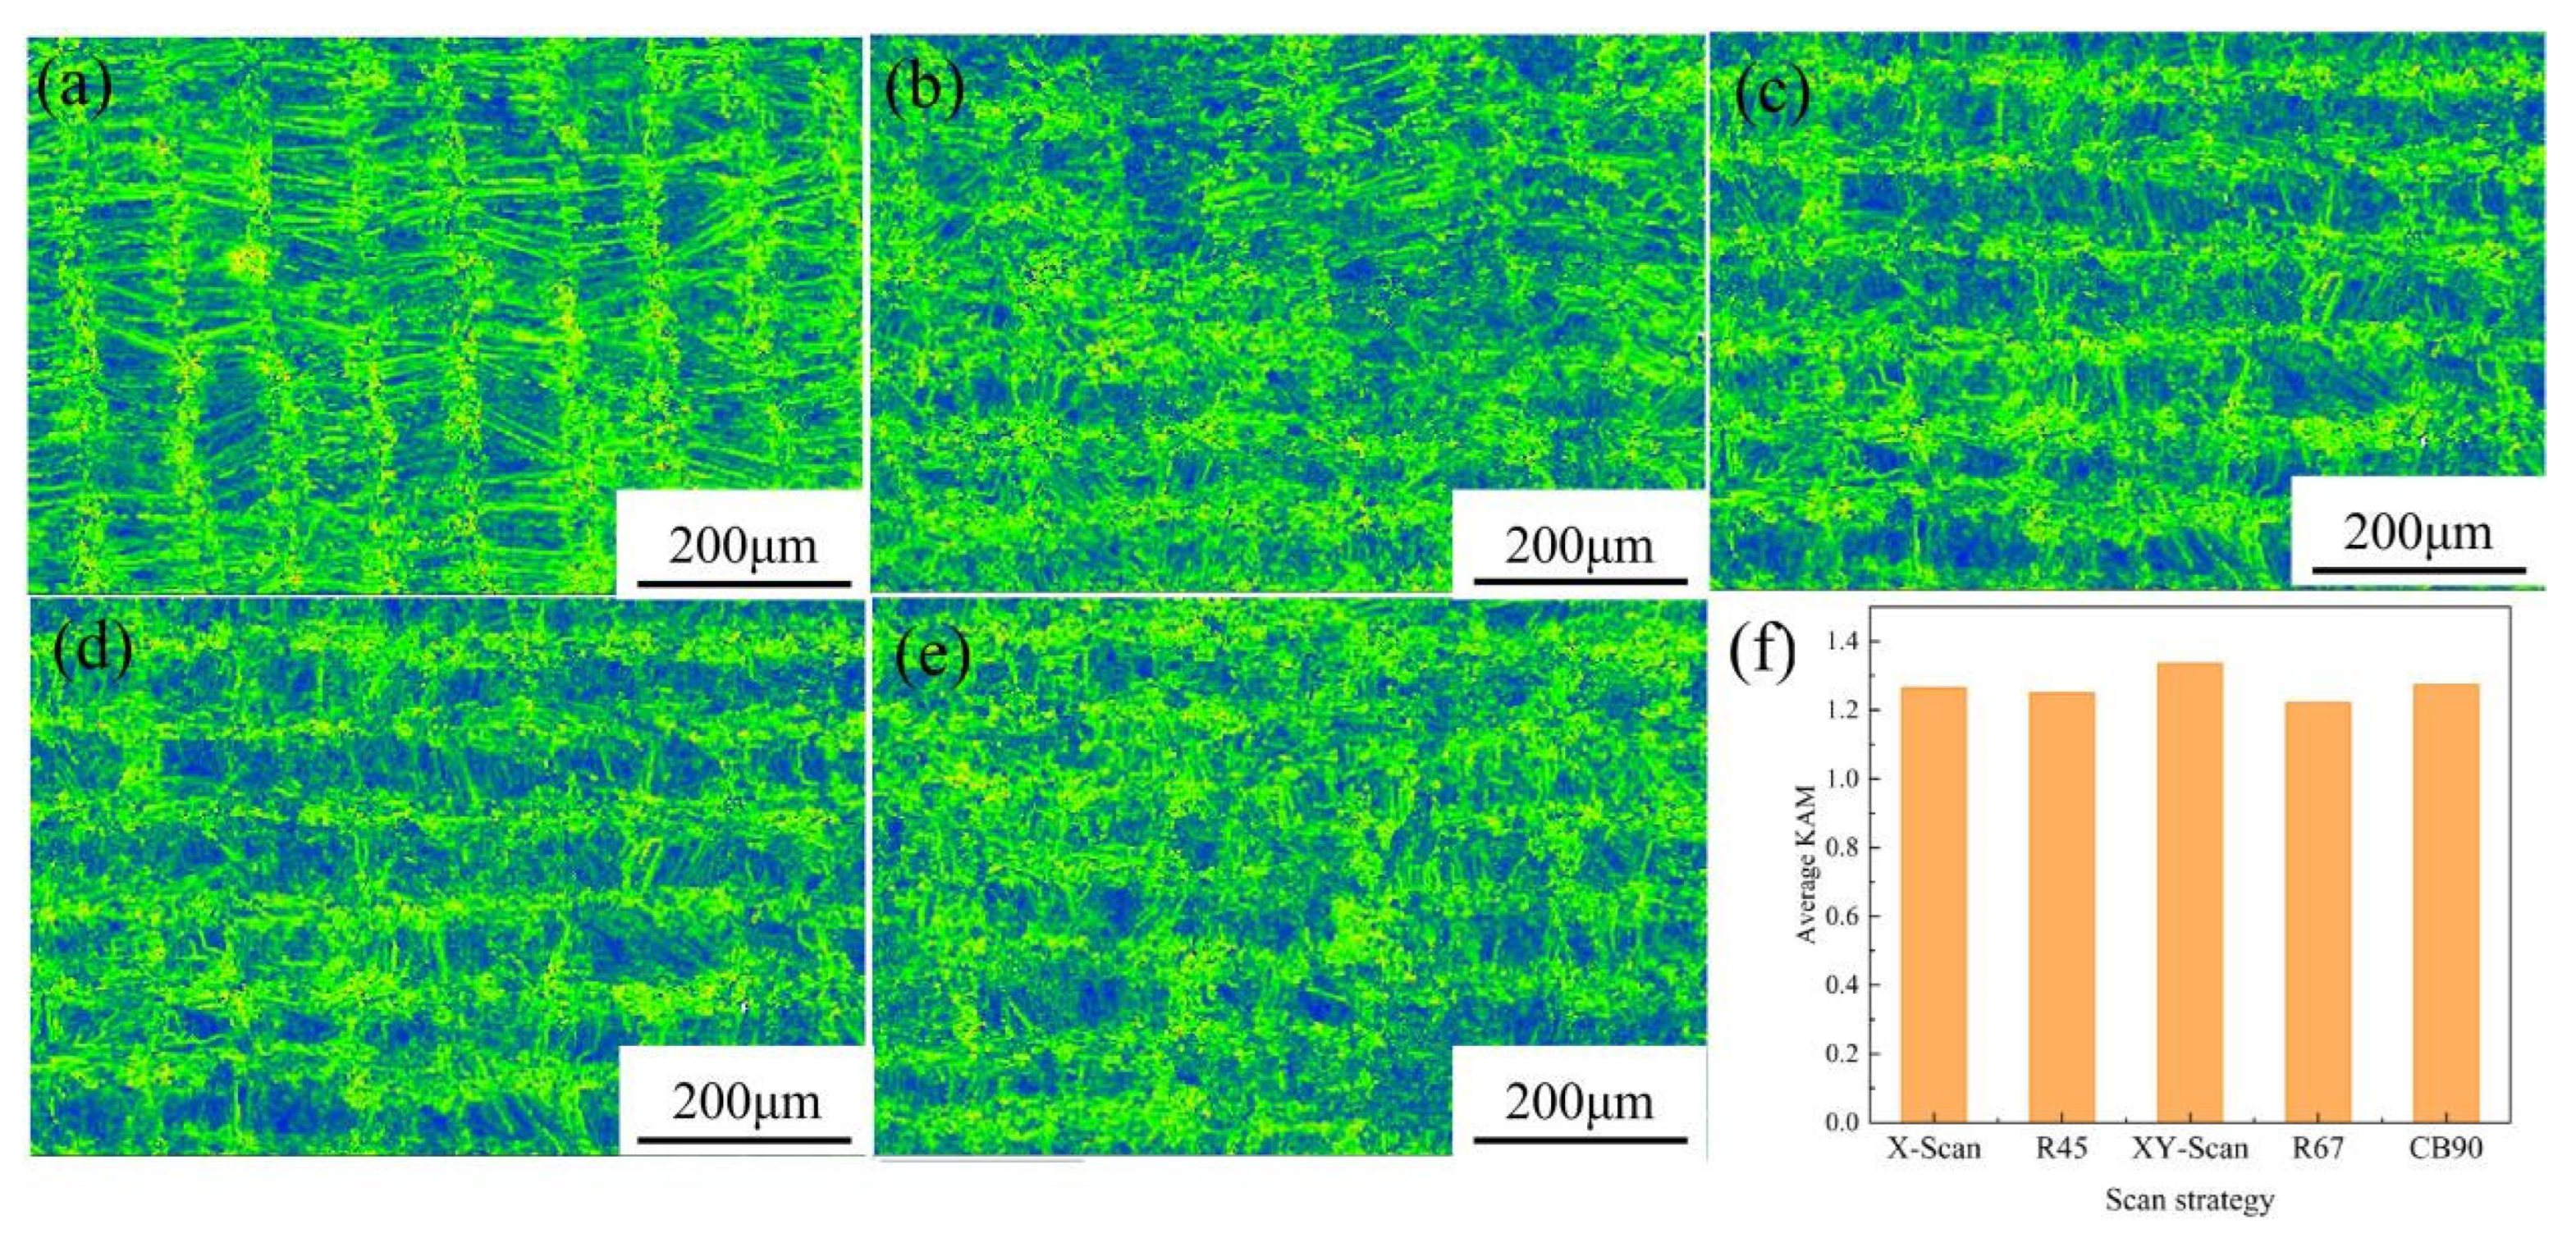
The Kernel Average Misorientation (KAM) distributions corresponding to five scanning strategies are shown in Figure 16. The KAM value reflects the degree of local lattice distortion at the micro-scale, and its magnitude is directly correlated with the level of microscopic residual stress. A higher average KAM indicates greater residual stress [42,43]. The average KAM values for the five strategies are 1.264, 1.249, 1.336, 1.221, and 1.274, respectively. The KAM distribution maps and average statistical results reveal that specimens processed with the interlayer rotation strategy exhibit consistently lower average KAM values than those without rotation. This indicates that interlayer rotation effectively reduces dislocation density. This effect primarily stems from the strategy’s ability to disperse and release accumulated thermal stresses, thereby minimizing dislocation accumulation and micro-level residual stresses between grains. Combined with the grain size analysis in Figure 15, the R67 and CB90 strategies exhibit lower average KAM values, indicating relatively smaller residual stress levels. However, in the island scanning strategy, significant temperature gradients at island boundaries can lead to high local residual stresses. This causes uneven distribution of dislocation density across regions, resulting in higher overall dislocation density. Comprehensive analysis indicates that the KAM distribution in Figure 16d under the R67 strategy exhibits the most uniform spatial distribution. This strategy achieves the best spatial consistency between microscopic residual stress and dislocation density, thereby enhancing the microstructural uniformity of the formed part.

3.6. Experimental Study of Residual Stress

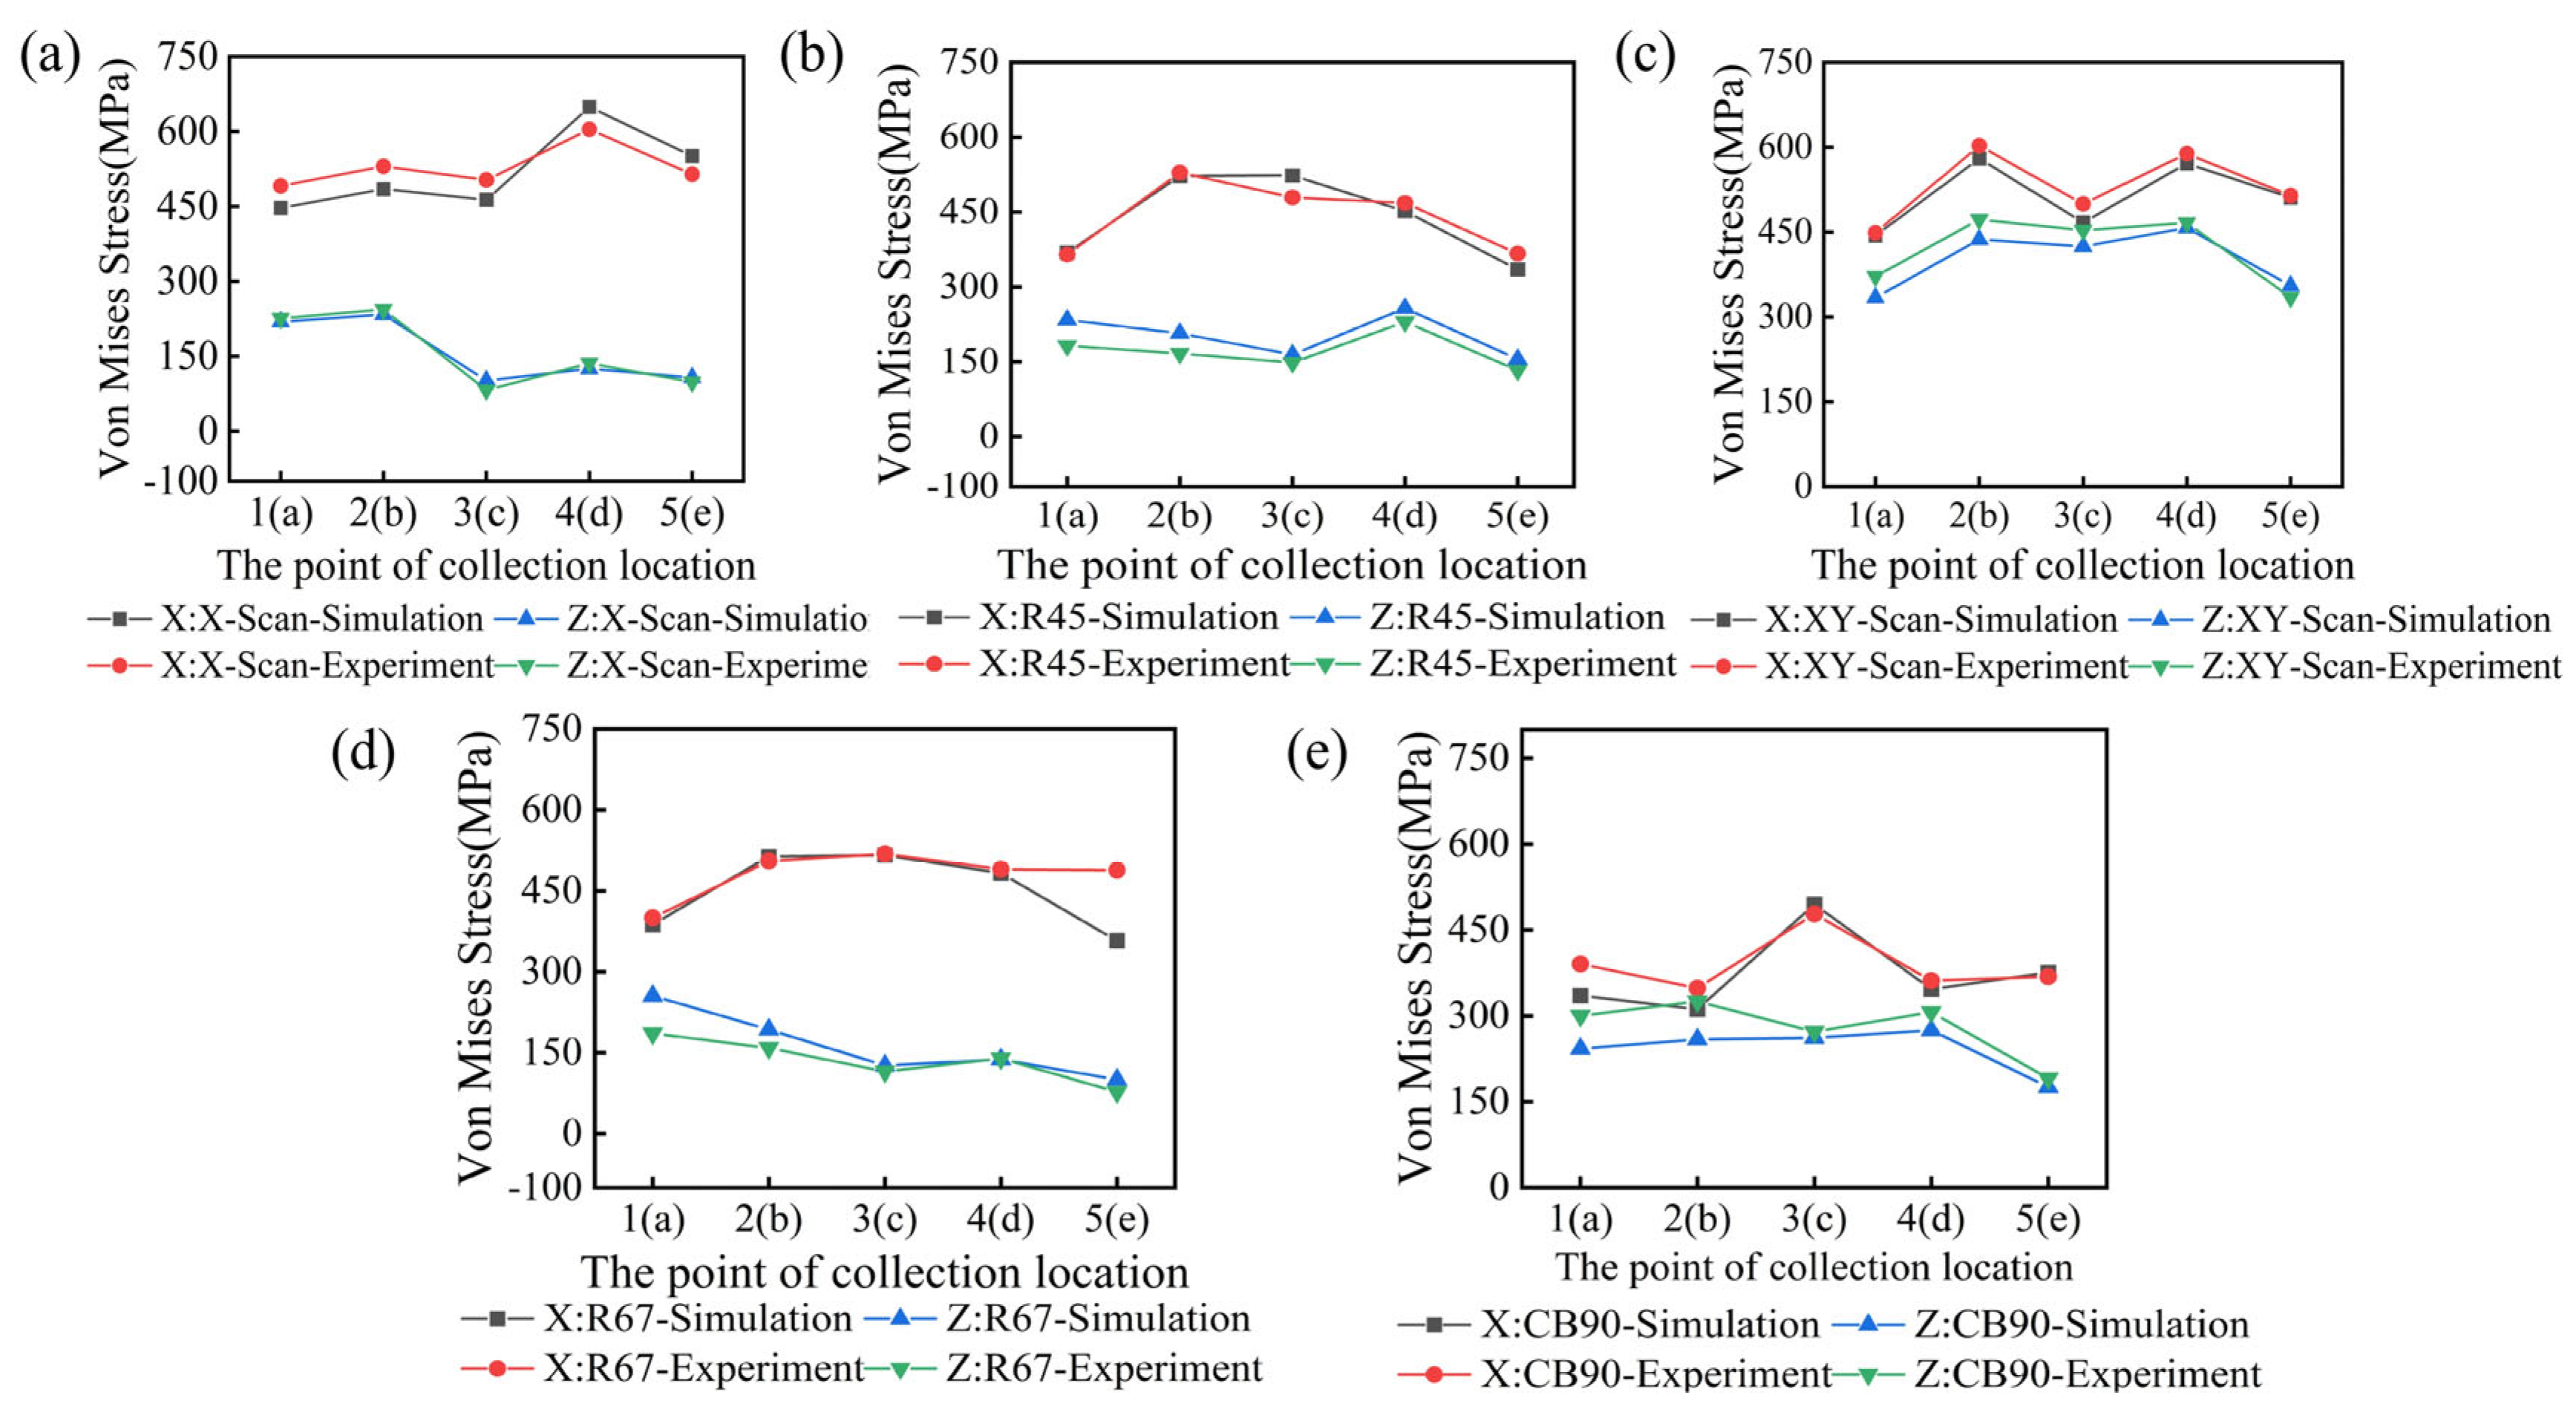
The experimental and numerically simulated residual stresses in the X-direction (σxx) and Z-direction (σzz) for samples fabricated under five scanning strategies (X-scan, R45, XY-scan, R67, and CB90) are presented in Figure 17a–e. In Figure 17a,c, the residual stress trends in both directions are observed to follow a generally consistent pattern. Under the X-scan and XY-scan strategies, the X-direction residual stress follows a trend of initial increase followed by a decrease, with relatively minor fluctuations. These variations arise from the severe thermal stress accumulation at the laser turning points, which induces localized stress perturbations.
As illustrated in Figure 17b, under the R45 strategy, the X-direction residual stress increases rapidly between points 1(a) and 2(b), reaching a peak before gradually declining toward point 5(e). This behavior suggests that the oblique build direction alters the heat flow path, intensifying early-stage stress accumulation, while subsequent cooling proceeds more uniformly. In contrast, the Z-direction residual stresses remain generally low, ranging between 150 and 250 MPa with limited fluctuations. A slight increase observed at point 4(d) may correspond to thermal disturbances or geometric discontinuities encountered during the build process.
In Figure 17d, the X-direction residual stresses are observed to remain consistently high and stable overall. With the exception of a modest decrease at point 5(e), the values at the remaining points are maintained between 450 and 500 MPa. The strong agreement between simulation and experimental results indicates that a larger tilt angle in the build direction facilitates the dispersion of stress concentrations induced by thermal gradients. The simulated Z-direction residual stress exhibits a distinct gradual decline, dropping from 255 MPa to 100 MPa, while the experimental data show a reduction from 186 MPa to 77 MPa. This trend confirms progressive stress relief as the build layer height increases, consistent with experimental observations.
In Figure 17e, the X-direction residual stresses are observed to follow a pronounced upward trajectory from points 1(a) to 3(c) in both simulations and experiments, peaking at point 3(c) before decreasing, thereby forming an overall “peak-shaped” distribution. This pattern likely results from stress concentration in the intermediate region driven by heat input from the molten pool and subsequent cooling gradients. The Z-direction residual stresses exhibit relatively lower values, following a general “plateau-decline” trend. Minimal fluctuations are observed from point 1(a) to 3(c), followed by a marked decrease, indicating lower residual stress levels perpendicular to the build direction, possibly due to interlayer stress relaxation or thermal cycling effects.
In summary, the X-direction residual stresses are generally higher than those in the Z-direction, a trend consistent with the findings reported by Chen [28] and Promoppatum [44]. This anisotropy aligns with the laser scanning path-dominated heat flow direction inherent to L-PBF, wherein the X-direction is more susceptible to stress accumulation. Among the five strategies, CB90 exhibits the most pronounced variation in stress distribution and the highest peak stress, while R45 yields a more gradual stress profile. Notably, R67 demonstrates the smallest stress fluctuations, indicating superior stress uniformity. The simulation results exhibit strong alignment with experimental measurements, with a maximum deviation of approximately 10%, thereby validating the reliability of the numerical model. Furthermore, the lower residual stress levels observed under the R67 strategy establish it as the optimal scanning strategy for L-PBF-fabricated GH3536 components.
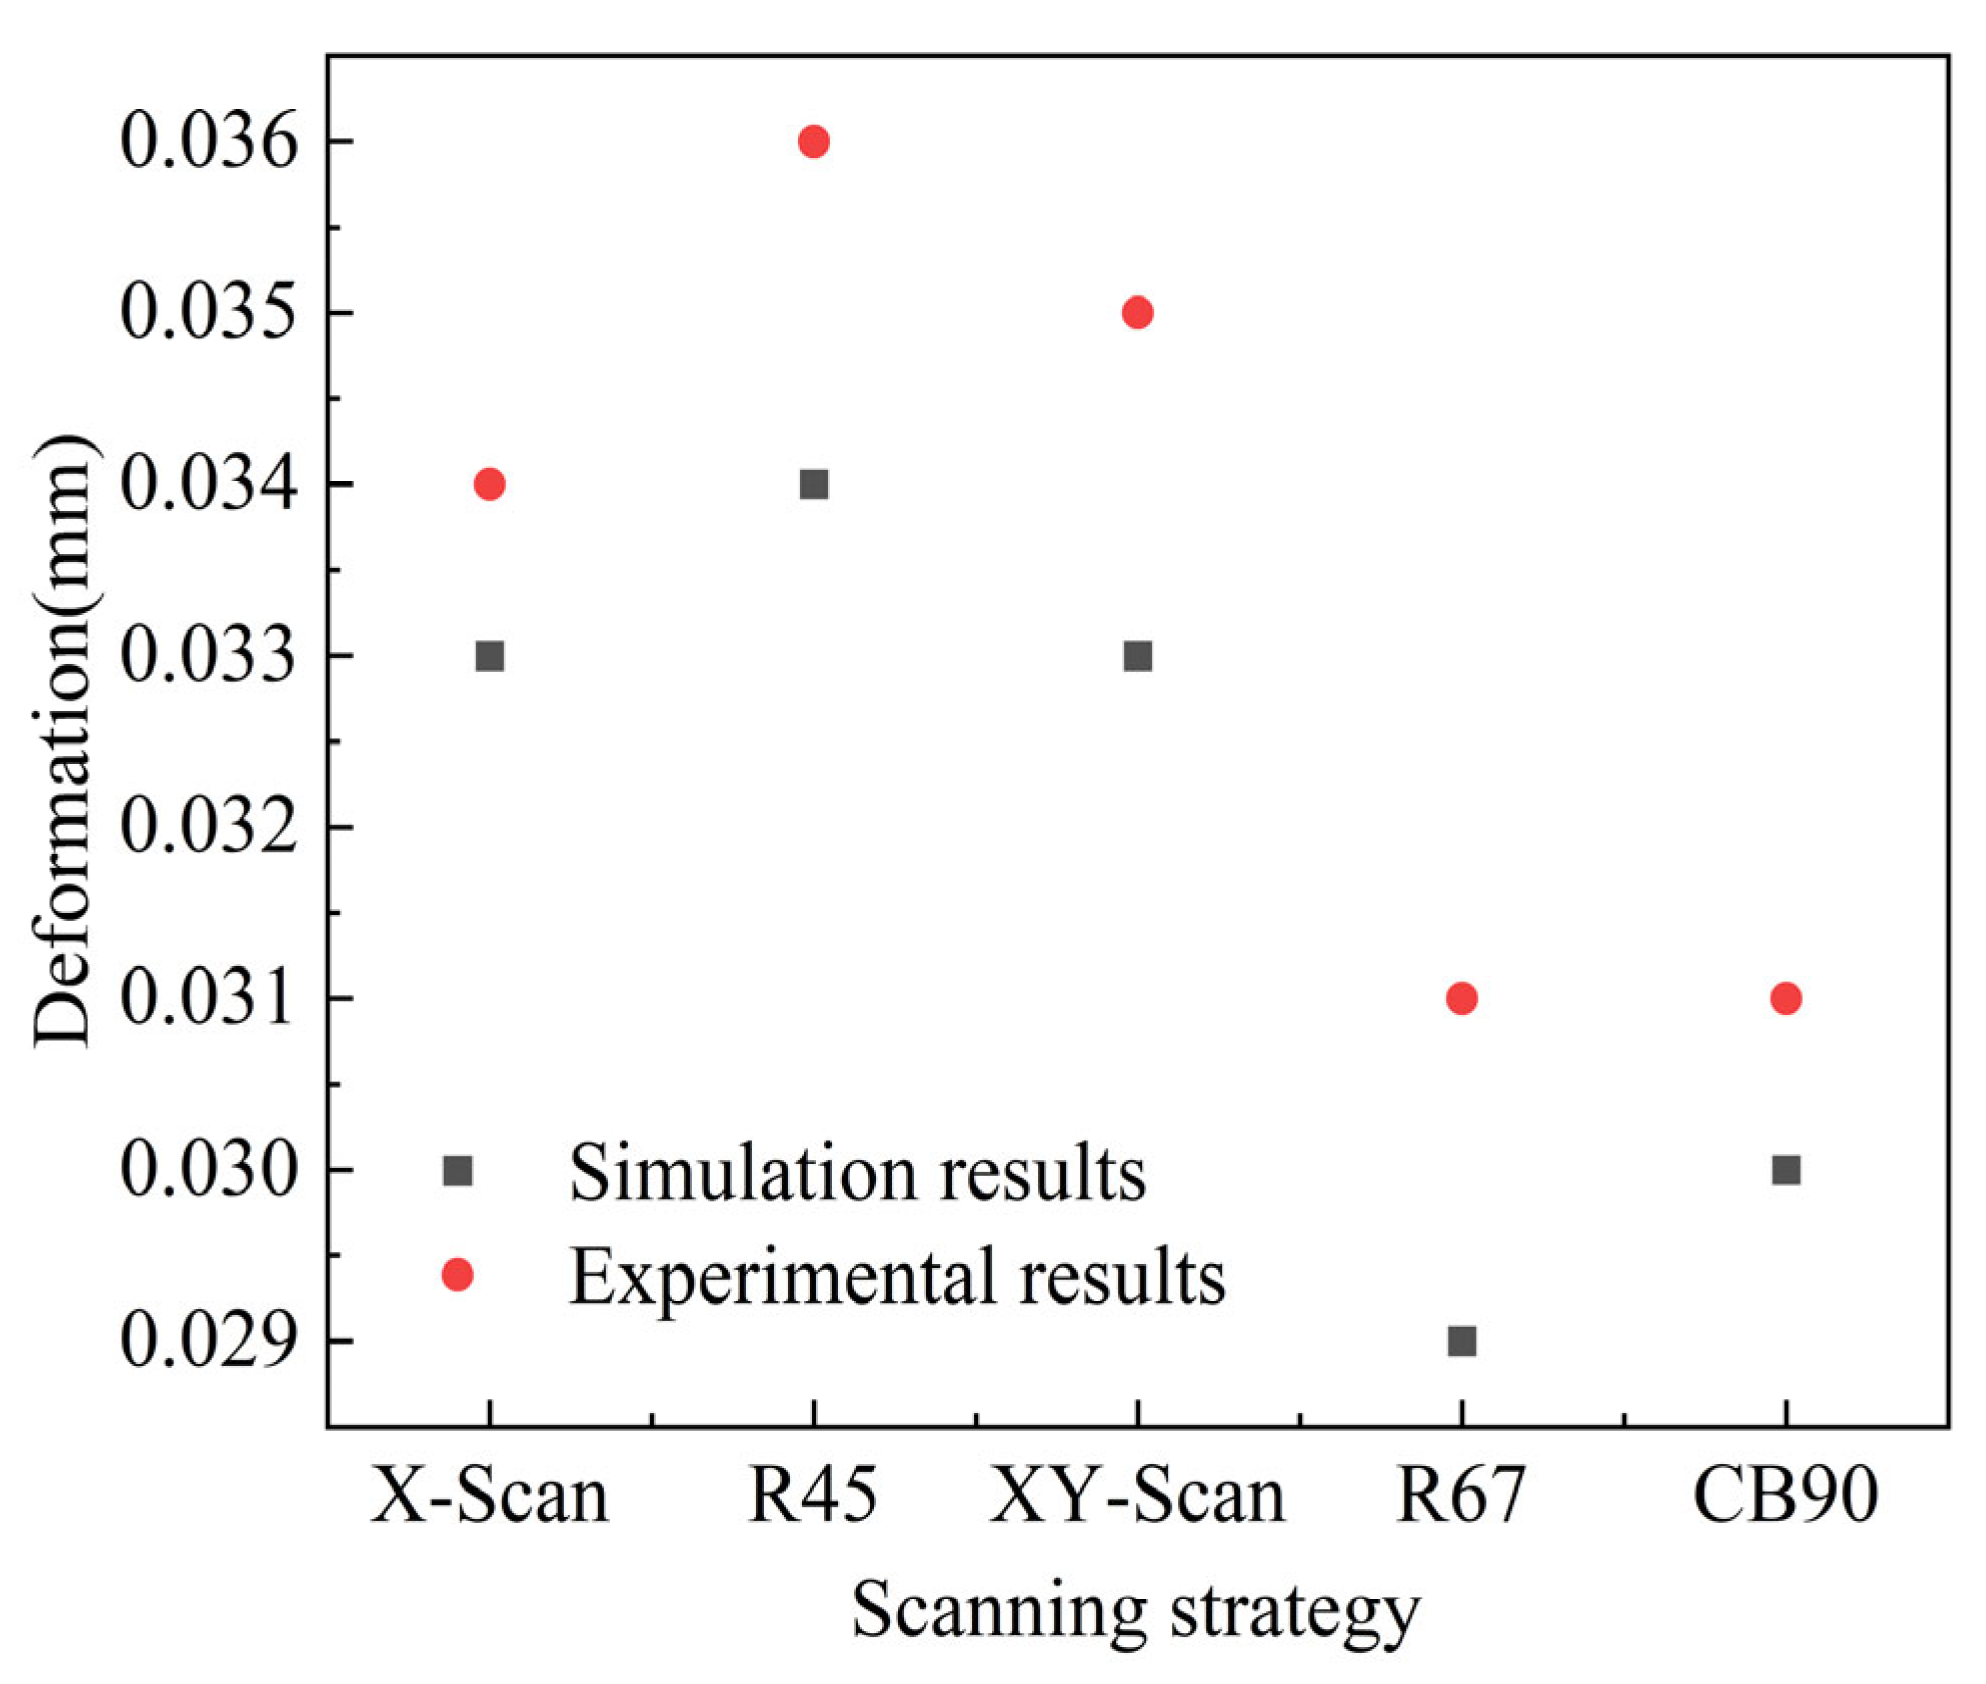
The deformation versus experimental data line charts under different scanning strategies are shown in Figure 18. As seen in the figure, the maximum deformation for R45 in both experiments and simulations is 0.03632 mm and 0.03434 mm, respectively. The primary cause of this maximum deformation is that R45 induces repeated thermal paths every four layers, leading to significant strain peaks and consequently larger deformations. For X-Scan, the simulated and experimental deformations were 0.03391 mm and 0.03385 mm, respectively. XY-Scan yielded 0.03542 mm and 0.03333 mm. R67 and CB90 exhibited lower deformations. R67 reduces residual stress-induced deformation by mitigating temperature gradients caused by scanning angle asymmetry [45]. CB90 reduces deformation caused by residual stresses by increasing the number of islands to minimize temperature gradients. The primary reason experimental values generally exceed simulation results lies in model simplifications and scaling implemented to enhance computational efficiency, leading to relatively underestimated deformation predictions. Given that this study employs mesoscale numerical simulation, the deformation prediction error for the full-scale scaled model is approximately 7.5%, aligning with experimental trends and further validating the model’s reliability.

4. Conclusions

  • Mesoscale simulations indicate that R67 generates a favorable thermal field characterized by high melt pool temperature (2410 K) and low thermal gradient (3.85 × 10⁷ K/m), which enhances melt flowability.
  • Stress distribution exhibits a tensile–compressive pattern across all strategies, with significant stress concentration at the four corner interfaces; R67 reduces residual stress by 472 MPa (8.3%) through optimized thermal history.
  • The R67 scanning strategy yielded the finest grain size (48.98 μm plus), lowest texture intensity (3.04), and smallest average KAM value (1.221°). Compared to the other four strategies, it achieved optimized effects in grain refinement, texture homogenization, and micro-residual stress relief.
  • Experimental XRD results highly correlate with simulated trends, confirming the dominance of residual stress in the X-direction and validating the model’s reliability at small scales. Deformation behavior: The R67 and CB90 strategies reduced deformation by up to 12.7%, with a 7.5% discrepancy between deformation experiments and simulations. This further confirms the model’s accuracy and clarifies the dominant role of thermal stress.

Author Contributions

S.L.: Review and editing, supervision, funding acquisition. Y.X.: Writing—original draft, software, formal analysis. R.H.: Data curation, software, conceptualization. F.M.: Data Curation, supervision. Y.L.: Data curation, supervision. Z.C.: Review and editing, supervision. All authors have read and agreed to the published version of the manuscript.

Funding

This work was funded by the National Key Research and Development Program of China (Grant No. 2023YFB4606401), National Natural Science Foundation of China Project (U24A20115); The 2024 Shaanxi Provincial Department of Education Special Scientific Research Program for Serving Local Areas—Industrialization Cultivation Project (24JC005, 24JC063); Science and Technology Program of Xixian New Area (2022-YXYJ-003), (2022-XXCY-010).

Data Availability Statement

The data presented in this study are available on request from the corresponding author. As the subject matter of this paper is based on data from a National Key R&D Program project, certain portions of the data are confidential.

Conflicts of Interest

The authors declare that they have no known competing financial interests or personal relationships that could have appeared to influence the work reported in this paper.

Correction Statement

This article has been republished with a minor correction to the Funding statement. This change does not affect the scientific content of the article.

References

  1. Khairallah, S.A.; Anderson, A.T.; Rubenchik, A.; King, W.E. Laser powder-bed fusion additive manufacturing: Physics of complex melt flow and formation mechanisms of pores, spatter, and denudation zones. Acta Mater. 2016, 108, 36–45. [Google Scholar] [CrossRef]
  2. Zhao, C.; Parab, N.D.; Li, X.; Fezzaa, K.; Tan, W.; Rollett, A.D.; Sun, T. Critical instability at moving keyhole tip generates porosity in laser melting. Science 2020, 370, 1080–1086. [Google Scholar] [CrossRef] [PubMed]
  3. Wei, Y.; Zhang, Y.; Li, Y.; Ren, Y.; Zhang, S.; Zhang, X.; Chu, X.; Liu, S. Heterogeneous Distribution of Microstructure and Mechanical Properties in M2 High-Speed Steel Fabricated by Laser Powder Bed Fusion. Crystals 2025, 15, 917. [Google Scholar] [CrossRef]
  4. Emdadi, A.; Bolz, S.; Weiß, S. Hot Working of an Fe-25Al-1.5Ta Alloy Produced by Laser Powder Bed Fusion. Crystals 2023, 13, 1335. [Google Scholar] [CrossRef]
  5. Yap, C.Y.; Chua, C.K.; Dong, Z.L.; Liu, Z.H.; Zhang, D.Q.; Loh, L.E.; Sing, S.L. Review of selective laser melting: Materials and applications. Appl. Phys. Rev. 2015, 2, 041101. [Google Scholar] [CrossRef]
  6. DebRoy, T.; Wei, H.L.; Zuback, J.S.; Mukherjee, T.; Elmer, J.W.; Milewski, J.O.; Beese, A.M.; Wilson-Heid, A.; De, A.; Zhang, W. Additive manufacturing of metallic components—Process, structure and properties. Prog. Mater. Sci. 2018, 92, 112–224. [Google Scholar] [CrossRef]
  7. Xie, X.; Zhang, F.; Peng, C.; Yan, X.; Chao, Q.; Li, Y.; Li, R.; Liu, X.; Fan, G. Effect of scan strategy and substrate preheating on crack formation in IN738LC Ni-based superalloy during laser powder bed fusion. Mater. Charact. 2025, 221, 114722. [Google Scholar] [CrossRef]
  8. Pant, P.; Salvemini, F.; Proper, S.; Luzin, V.; Simonsson, K.; Sjöström, S.; Hosseini, S.; Peng, R.L.; Moverare, J. A study of the influence of novel scan strategies on residual stress and microstructure of L-shaped LPBF IN718 samples. Mater. Des. 2022, 214, 110386. [Google Scholar] [CrossRef]
  9. Lai, G.Y. An investigation of the thermal stability of a commercial Ni-Cr-Fe-Mo alloy (hastelloy alloy X). Met. Mater. Trans. A 1978, 9, 827–833. [Google Scholar] [CrossRef]
  10. Abalymov, V.R.; Zhereb, V.P.; Kleimenov, Y.A.; Antonov, M.M. Effect of Heat Treatment on the Structure and Mechanical Properties of Eutectic Silumin Alloyed with Magnesium. Met. Sci. Heat Treat. 2021, 63, 291–296. [Google Scholar] [CrossRef]
  11. Yan, P.; Bai, J.; Yuan, Z.; Wang, S.; Ma, R.; Zheng, J. Constitutive Equation and Hot Deformation Behavior of LPBF-GH3536 Alloy. JOM 2023, 75, 4819–4831. [Google Scholar] [CrossRef]
  12. Iveković, A.; Montero-Sistiaga, M.L.; Vleugels, J.; Kruth, J.-P.; Vanmeensel, K. Crack mitigation in Laser Powder Bed Fusion processed Hastelloy X using a combined numerical-experimental approach. J. Alloys Compd. 2021, 864, 158803. [Google Scholar] [CrossRef]
  13. Guo, C.; Li, G.; Li, S.; Hu, X.; Lu, H.; Li, X.; Xu, Z.; Chen, Y.H.; Li, Q.Q.; Lu, J.; et al. Additive manufacturing of Ni-based superalloys: Residual stress, mechanisms of crack formation and strategies for crack inhibition. Nano Mater. Sci. 2023, 5, 53–77. [Google Scholar] [CrossRef]
  14. Nie, J.; Chen, C.; Liu, L.; Wang, X.; Zhao, R.; Shuai, S.; Wang, J.; Ren, Z. Effect of substrate cooling on the epitaxial growth of Ni-based single-crystal superalloy fabricated by direct energy deposition. J. Mater. Sci. Technol. 2021, 62, 148–161. [Google Scholar] [CrossRef]
  15. Xie, Y.; Teng, Q.; Shen, M.; Zhang, Z.; Wei, Y.; Cai, C.; Wei, Q. The role of overlap region width in multi-laser powder bed fusion of Hastelloy X superalloy. Virtual Phys. Prototyp. 2023, 18, e2142802. [Google Scholar] [CrossRef]
  16. Ostergaard, H.E.; Pribe, J.D.; Hasib, M.T.; Siegmund, T.; Kruzic, J.J. Crack growth in laser powder bed fusion fabricated alloy 718 at 650 °C under static and cyclic loading. Int. J. Fatigue 2025, 193, 108810. [Google Scholar] [CrossRef]
  17. Paraschiv, A.; Matache, G.; Vladut, M. Assessment of Residual Stresses in Laser Powder Bed Fusion Manufactured IN 625. Materials 2024, 17, 413. [Google Scholar] [CrossRef]
  18. Mercelis, P.; Kruth, J. Residual stresses in selective laser sintering and selective laser melting. Rapid Prototyp. J. 2006, 12, 254–265. [Google Scholar] [CrossRef]
  19. Sun, J.; Gu, D.; Huang, G.; Lin, K.; Shi, K.; Yuan, L.; Sun, J.; Zhang, H. Additive manufacturing Hastelloy X with enhanced properties by optimizing strategies. Int. J. Mech. Sci. 2024, 278, 109491. [Google Scholar] [CrossRef]
  20. Jalali, A.; Nikniazi, A.; Gholamzadeh, H.; Yin, S.; Malekan, M.; Ahn, S.Y.; Kim, H.S.; Balogh, L.; Ravkov, L.; Persaud, S.Y.; et al. Hot-Cracking Mitigation and Microcrack Formation Mechanisms in Laser Powder Bed Fusion Processed Hastelloy X and Cantor High Entropy Alloys. Met. Mater. Int. 2024, 30, 1–9. [Google Scholar] [CrossRef]
  21. Hu, J.; Hu, Y.; Lan, C.; Zhang, Q.; Jin, F.; Li, W.; Lin, X.; Huang, W. Cracking mechanism and control of Hastelloy X prepared by laser powder bed fusion. J. Mater. Res. Technol. 2022, 21, 3526–3547. [Google Scholar] [CrossRef]
  22. Dai, K.; He, X.; Zhang, W.; Kong, D.; Guo, R.; Hu, M.; He, K.; Dong, C. Tailoring the microstructure and mechanical properties for Hastelloy X alloy by laser powder bed fusion via scanning strategy. Mater. Des. 2023, 235, 112386. [Google Scholar] [CrossRef]
  23. Lu, J.; Zheng, H.; Ji, X.; Guan, Y.; Wang, Z.; Cheng, J.; Zhang, W. Crack characteristics analysis and mechanisms in GH3536 alloy manufactured by laser powder bed fusion. Eng. Fail. Anal. 2024, 162, 108382. [Google Scholar] [CrossRef]
  24. Hao, M.-S.; Zhou, L.; Wang, K.; Wang, G.; Liang, J.-J.; Li, J.-G. Influence of scanning strategies on microstructure and properties anisotropy of GH3536 alloy formed by laser powder bed fusion. China Foundry 2025, 22, 615–627. [Google Scholar] [CrossRef]
  25. Chauvet, E.; Kontis, P.; Jägle, E.A.; Gault, B.; Raabe, D.; Tassin, C.; Blandin, J.-J.; Dendievel, R.; Vayre, B.; Abed, S.; et al. Hot cracking mechanism affecting a non-weldable Ni-based superalloy produced by selective electron Beam Melting. Acta Mater. 2018, 142, 82–94. [Google Scholar] [CrossRef]
  26. Chen, J.Q.; Lu, H.; Cui, W.; Chen, J.M.; Huang, Y.F. Effect of grain boundary behaviour on ductility dip cracking mechanism. Mater. Sci. Technol. 2014, 30, 1189–1196. [Google Scholar] [CrossRef]
  27. An, K.; Yuan, L.; Dial, L.; Spinelli, I.; Stoica, A.D.; Gao, Y. Neutron residual stress measurement and numerical modeling in a curved thin-walled structure by laser powder bed fusion additive manufacturing. Mater. Des. 2017, 135, 122–132. [Google Scholar] [CrossRef]
  28. Chen, C.; Yin, J.; Zhu, H.; Xiao, Z.; Zhang, L.; Zeng, X. Effect of overlap rate and pattern on residual stress in selective laser melting. Int. J. Mach. Tools Manuf. 2019, 145, 103433. [Google Scholar] [CrossRef]
  29. Cheng, B.; Shrestha, S.; Chou, K. Stress and deformation evaluations of scanning strategy effect in selective laser melting. Addit. Manuf. 2016, 12, 240–251. [Google Scholar] [CrossRef]
  30. Mohanraj, J.; Sahu, J. Numerical prediction of residual stress and distortion for laser powder bed fusion (L-PBF) AM process of Ti-6Al-4V. Simul. Model. Pract. Theory 2025, 140, 103094. [Google Scholar] [CrossRef]
  31. Yin, J.; Zhu, H.; Ke, L.; Hu, P.; He, C.; Zhang, H.; Zeng, X. A finite element model of thermal evolution in laser micro sintering. Int. J. Adv. Manuf. Technol. 2016, 83, 1847–1859. [Google Scholar] [CrossRef]
  32. Kaščák, Ľ.; Varga, J.; Bidulská, J.; Bidulský, R.; Kvačkaj, T. A Review of Simulation Tools Utilization for the Process of Laser Powder Bed Fusion. Materials 2025, 18, 895. [Google Scholar] [CrossRef]
  33. Kascak, L.; Varga, J.; Bidulská, J.; Bidulský, R.; Grande, M.A. Simulation tool for material behaviour prediction in additive manufacturing. Acta Metall. Slovaca 2023, 29, 113–118. [Google Scholar] [CrossRef]
  34. Chai, Q.; Zhang, D.; Zhang, H.; Xing, Y.; Yin, S. Numerical simulation of temperature field and stress field of laser cladding Stellite6. Next Mater. 2025, 7, 100385. [Google Scholar] [CrossRef]
  35. Luo, Z.; Zhao, Y. A survey of finite element analysis of temperature and thermal stress fields in powder bed fusion Additive Manufacturing. Addit. Manuf. 2018, 21, 318–332. [Google Scholar] [CrossRef]
  36. Gu, D.; He, B. Finite element simulation and experimental investigation of residual stresses in selective laser melted Ti–Ni shape memory alloy. Comput. Mater. Sci. 2016, 117, 221–232. [Google Scholar] [CrossRef]
  37. Nickel, A.H.; Barnett, D.M.; Prinz, F.B. Thermal stresses and deposition patterns in layered manufacturing. Mater. Sci. Eng. A 2001, 317, 59–64. [Google Scholar] [CrossRef]
  38. Hussein, A.; Hao, L.; Yan, C.; Everson, R. Finite element simulation of the temperature and stress fields in single layers built without-support in selective laser melting. Mater. Des. 2013, 52, 638–647. [Google Scholar] [CrossRef]
  39. Lam, M.C.; Lim, S.C.; Song, H.; Zhu, Y.; Wu, X.; Huang, A. Scanning Strategy Induced Cracking and Anisotropic Weakening in Grain Texture of Additively Manufactured Superalloys. Addit. Manuf. 2022, 52, 102660. [Google Scholar] [CrossRef]
  40. Jia, H.; Sun, H.; Wang, H.; Wu, Y.; Wang, H. Scanning strategy in selective laser melting (LPBF): A review. Int. J. Adv. Manuf. Technol. 2021, 113, 2413–2435. [Google Scholar] [CrossRef]
  41. Tillmann, W.; Hagen, L.; Luo, W.; Chehreh, A.B. Microstructural Characteristics and Residual Stresses in Arc-Sprayed Cermet Coatings Using Different Carbide Grain Size Fractions. J. Therm. Spray Technol. 2018, 27, 1103–1122. [Google Scholar] [CrossRef]
  42. Wu, H.; Zhang, D.; Yang, B.; Chen, C.; Li, Y.; Zhou, K.; Jiang, L.; Liu, R. Microstructural evolution and defect formation in a powder metallurgy nickel-based superalloy processed by selective laser melting. J. Mater. Sci. Technol. 2020, 36, 7–17. [Google Scholar] [CrossRef]
  43. Rezaei, A.; Kermanpur, A.; Rezaeian, A.; Badrossamay, M.; Foroozmehr, E.; Sadeghi, F.; Han, J.; Park, T.M. Contribution of hot isostatic pressing on densification, microstructure evolution, and mechanical anisotropy of additively manufactured IN718 Ni-based superalloy. Mater. Sci. Eng. A 2021, 823, 141721. [Google Scholar] [CrossRef]
  44. Promoppatum, P.; Uthaisangsuk, V. Part scale estimation of residual stress development in laser powder bed fusion additive manufacturing of Inconel 718. Finite Elem. Anal. Des. 2021, 189, 103528. [Google Scholar] [CrossRef]
  45. Serrano-Munoz, I.; Ulbricht, A.; Fritsch, T.; Mishurova, T.; Kromm, A.; Hofmann, M.; Wimpory, R.C.; Evans, A.; Bruno, G. Scanning Manufacturing Parameters Determining the Residual Stress State in L-PBF IN718 Small Parts. Adv. Eng. Mater. 2021, 23, 2100158. [Google Scholar] [CrossRef]
Figure 1. (a) Scanning electron microscopy (SEM) image revealing the surface morphology of gas-atomized GH3536 powder; (b) particle size distribution (PSD) of the powder.
Crystals 16 00170 g001
Figure 2. Five strategies and a schematic of the printed parts. (a) X-Scan; (b) XY-Scan; (c) R67; (d) CB90; (e) CB67; (f) test print.
Crystals 16 00170 g002
Figure 3. Residual stress test diagram. (a) is the residual stress test surface, (b) is the test distribution point on the front surface of the sample, and (c) is the test distribution point on the top surface of the sample.
Crystals 16 00170 g003
Figure 4. Boundary Model Diagram.
Crystals 16 00170 g004
Figure 5. Gaussian Heat Source Model.
Crystals 16 00170 g005
Figure 6. The mesh division diagram of the GH3536 model.
Crystals 16 00170 g006
Figure 7. The material properties of GH3536.
Crystals 16 00170 g007
Figure 8. Temperature fields of GH3536 fabricated by L-PBF under different scanning strategies: (a) temperature field under the X-scan strategy and (b) corresponding temperature gradient distribution; (c) temperature field under the 45° rotation (R45) strategy and (d) corresponding temperature gradient distribution; (e) temperature field under the XY-scan strategy and (f) corresponding temperature gradient distribution; (g) temperature field under the 67° interlayer rotation (R67) strategy and (h) corresponding temperature gradient distribution; (i) temperature field under the 90° rotation (CB90) strategy and (j) corresponding temperature gradient distribution.
Crystals 16 00170 g008aCrystals 16 00170 g008b
Figure 9. Thermal histories and orientation of the midpoint nodes in the fourth layer under five scanning strategies: island scanning; 45° rotation (R45); 0° rotation (non-rotation); 90° rotation (CB90); 67° rotation (R67). The contours illustrate the temperature distribution at the midpoint of the fourth layer for each respective strategy.
Crystals 16 00170 g009
Figure 10. The contour plots and bar charts of stress distribution under different scanning strategies after cooling to room temperature (20 °C). (a) X-Scan; (b) R45; (c) XY-Scan; (d) R67; (e) CB90; (f) Five Scanning Strategies Stress Histogram.
Crystals 16 00170 g010
Figure 11. The graphs of stress components in X, Y and Z directions under different scanning strategies.
Crystals 16 00170 g011
Figure 12. Residual stress components in the X, Y, and Z directions under various scanning strategies: (ac) X-scan; (a1c1) 45° rotation (R45); (a2c2) XY-scan; (a3c3) 67° rotation (R67); (a4c4) 90° rotation (CB90) (unit: Mpa).
Crystals 16 00170 g012aCrystals 16 00170 g012b
Figure 13. Schematic illustration of the temperature gradient and stress evolution mechanism.
Crystals 16 00170 g013
Figure 14. Deformation clouds and deformation component plots (unit: mm) under different scanning strategies.
Crystals 16 00170 g014
Figure 15. (ae) show the EBSD-reconstructed (f) histogram of grain sizes for the five scanning strategies, (a1e1), PF maps of X-Scan, R45, XY-Scan, R67, and CB90 as-built samples, respectively.
Crystals 16 00170 g015
Figure 16. Grain misorientation obtained with five different strategies: (a) X-Scan, (b) R45, (c) XY-Scan, (d) R67, (e) CB90. (f) Average KAM value under different scanning strategies.
Crystals 16 00170 g016
Figure 17. Comparison of experimental and numerical simulation results for residual stresses in the X and Z directions under five scanning strategies: (a) X-direction scanning strategy (b) 45° interlayer rotation strategy (c) XY-scanning strategy (d) 67° interlayer rotation strategy (e) 90° checkerboard scanning strategy.
Crystals 16 00170 g017
Figure 18. Comparison of cumulative deformation obtained from simulation and experiment under the five scanning strategies.
Crystals 16 00170 g018
Table 1. Chemical Composition of GH3536 Alloy.
IngredientCrFeMoMnSiCNPNi
wt.%21.4518.998.730.450.450.0750.020.006Balance
Table 2. Processing and Numerical Simulation Parameters.
Indexes (Symbol, Unit)Numerical Value
Laser power (P, W)240
Scanning speed (v, mm/s)960
layer thickness (h, μm)30
Scanning spacing (t, μm)80
Table 3. Representative experimental data of material properties for the GH3536 alloy.
Temperature (°C)Material Properties
Thermal Conductivity (10 W/(m·K))Density (g/cm3)Coefficient of Thermal Expansion
(10 × 10−5/K)
Young’s Modulus (GPa)Specific Heat Capacity
(J/g·K)
251.3018.3071.336
1001.4218.2811.3642.1470.421
5002.0448.1301.5271.9140.491
10002.7477.8821.8421.5010.651
13503.0107.5542.5071.1583.286
14002.9457.4552.7701.1120.706
Disclaimer/Publisher’s Note: The statements, opinions and data contained in all publications are solely those of the individual author(s) and contributor(s) and not of MDPI and/or the editor(s). MDPI and/or the editor(s) disclaim responsibility for any injury to people or property resulting from any ideas, methods, instructions or products referred to in the content.