Article

Influence of Isopropanol on Kinetics of Hydrogen Evolution Reaction Examined at Nickel Foam Electrodes in Alkaline Solution


by
Wiktoria Abramczyk
,
Bogusław Pierożyński
*,
Tomasz Mikołajczyk
and
Kazimierz Warmiński
Department of Chemistry, Faculty of Agriculture and Forestry, University of Warmia and Mazury in Olsztyn, Łódzki Square 4, 10-727 Olsztyn, Poland
*
Author to whom correspondence should be addressed.
Crystals 2026, 16(2), 114; https://doi.org/10.3390/cryst16020114
Submission received: 22 December 2025 / Revised: 20 January 2026 / Accepted: 29 January 2026 / Published: 5 February 2026
(This article belongs to the Special Issue Exploring New Materials for the Transition to Sustainable Energy)

Abstract

The current work examines the impact of isopropanol (IPA) on the electrochemical characteristics of nickel foam and Pd-modified Ni foam electrodes in a 0.1 M NaOH medium, with respect to the kinetics of the hydrogen evolution reaction (HER) over the temperature range of 20–40 °C. Comparative HER/IPA examinations are presented for a highly catalytic polycrystalline Pt electrode. Electrochemical impedance spectroscopy (EIS), cyclic voltammetry (CV), and cathodic Tafel polarization experiments were carried out in this work, where the IPA concentrations ranged from 1.0 × 10⁻⁵ to 1.0 × 10⁻³ M. The introduction of small amounts of isopropyl alcohol into the working electrolyte noticeably facilitated the catalytic efficiency of the hydrogen evolution reaction on the surface of Ni foam electrodes. This is most likely related to the fact that IPA molecules undergo partial electrooxidation to acetone (qualitatively confirmed by GC-MS analysis) during initial CV cycling, which is believed to significantly diminish the surface tension phenomenon during the HER, thus promoting hydrogen bubble separation from the electrode surface. It should also be noted that acetone will continuously be produced at the Pt anode, making it essential to consider further migration of (CH3)2CO molecules to the working cell compartment. Most importantly, isopropanol was found not to undergo significant surface electrosorption on the nickel foam-based catalysts, which could otherwise significantly inhibit the hydrogen evolution reaction On the contrary, the presence of IPA in the electrolyte solution seems to have a detrimental effect on the kinetics of both the HER and the UPDH (underpotential deposition of H) processes on the surface of the polycrystalline Pt electrode, which is a superior electrochemical catalyst for HER, but highly susceptible to surface contamination.

1. Introduction

Electrochemical water electrolysis is a critical process for low-impact energy solutions, especially for the production of green H2 using renewable energy sources. Nickel-based catalyst materials are widely employed in alkaline water electrolysis due to their superior electrocatalytic properties and chemical resistance under alkaline conditions. Moreover, the kinetics of water electrolysis (cathodic hydrogen evolution reaction: HER and anodic oxygen evolution reaction: OER) could be substantially influenced by the presence of different organic additives in the working electrolyte. These chemicals might affect the overall efficiency and performance of the electrochemical system, which can be managed by a number of reaction mechanisms [1,2,3,4].
Numerous organic chemicals (for instance, alcohols, ketones, acids, and other compounds) could become adsorbed on the catalyst surface, undergoing potential-dependent electrooxidation and/or electroreduction phenomena [5,6,7,8,9,10,11,12], thereby possibly affecting the rates of the water-splitting process. As a matter of fact, a proper understanding of how to employ organic electrolyte additives could help facilitate the HER rates and thus yield improved performance of green H2 production in the process of alkaline water electrolysis. For instance, acetone, a common organic solvent, has been shown to significantly diminish the electrolyte surface tension through fundamental reinforcement of hydrogen bonding interactions when mixed with H2O molecules [13,14]. Furthermore, recent examinations by Pierożyński et al. at this laboratory have demonstrated [15,16] that the resorcinol ion might have a considerable influence on the kinetics of alkaline water electrolysis at the surface of polycrystalline and Pt(111) single-crystal electrodes.
This article investigates the effect of isopropanol (IPA) on the electrochemical HER behavior of nickel foam and Pd-activated Ni foam electrodes in a 0.1 M NaOH solution. Through examination of cyclic voltammetry (CV), cathodic Tafel polarization, and electrochemical impedance spectroscopy (EIS) characteristics, the authors of this work elucidate how the presence of IPA, ranging from 1.0 × 10⁻⁵ to 1.0 × 10⁻³ M, could influence the kinetics of the hydrogen evolution reaction. In addition, comparative experiments were carried out with a highly catalytic polycrystalline platinum electrode. The obtained results are expected to provide a deeper understanding of IPA’s role in improving the efficiency of the electrochemical HER for enhanced industrial applications within the technology of alkaline water electrolysis.

2. Materials and Methods

A 0.1 M sodium hydroxide solution was prepared using high-purity NaOH pellets delivered by MERCK and ultrapure H2O produced by a Millipore Direct-Q3 UV (Darmstadt, Germany) water purification system with a resistivity of 18.2 MΩ cm. The concentration of IPA (Sigma-Aldrich, Poznań, Poland, 99.5%, ACS Reagent) in the supporting electrolyte ranged from 1.0 × 10⁻⁵ to 1.0 × 10⁻³ M.
All electrochemical experiments were carried out in a typical three-electrode cell, consisting of a nickel foam (MTI Corporation, Richmond, CA, USA, purity: >99.99%, thickness 1.6 mm and a mass of ms = 90.0 mg)/Pd-modified nickel foam (ms = 102.0 mg), as well as a poly-oriented single-crystal Pt sphere electrode with a surface area of 0.62 cm2 (WE), a reversible hydrogen electrode: RHE (HydroFlex®, Biologic, Seyssinet-Pariset, France) as a reference electrode and a coiled Pt wire as a counter electrode (CE). Both platinum electrodes were made from a 1.0 mm diameter, 99.9998% purity Pt wire obtained from Johnson Matthey, Inc. (Chicago, IL, USA). The Pt working electrode was subjected to a typical flame-annealing procedure, followed by quenching in ultrapure water before every new measurement. Information on the preparation of Ni foam working electrodes and all pre-treatments is provided in Reference [2].
All electrochemical tests were performed at room temperature or over the temperature range of 20–40 °C using the Solartron 12,608 W Full Electrochemical System, consisting of a 1260 frequency response analyzer (FRA) and 1287 electrochemical interface (EI) [AMETEK, Leicester, UK]. Both cyclic voltammetry (CV) experiments (carried out at a sweep rate of 50 mV s−1) and electrochemical impedance spectroscopy (EIS) tests were performed. The EIS spectra were recorded over the frequency range from 100 kHz to 0.1 (or 1.0) Hz with an output ac. signal amplitude of 5 mV. The instruments were controlled by ZPlot 3.6a or Corrware 3.6a software for Windows (Scribner Associates, Inc., Southern Pines, NC, USA). The EIS measurements were conducted in triplicate at each electrode potential value. The reproducibility of the impedance results was typically better than 10%. Data analysis was performed by means of ZView 4.1b (CView 3.6a) software package for Windows, where the impedance spectra were fitted using a complex, non-linear, least-squares immittance fitting program, LEVM 6 [17]. In addition, quasi-potentiostatic cathodic polarization experiments (recorded at a scan rate of 0.5 mV s−1) for the HER were performed at all working electrodes.
Acetone qualitative identification in the working solution was performed by means of gas chromatography coupled with mass spectrometry (GC-MS). For this purpose, a Shimadzu GC-MS QP-2020 NX system (Shimadzu, Kyoto, Japan) equipped with a SH-Rxi-5Sil MS 30 m × 0.25 m × 0.25 µm column (Restek, Bellefonte, PA, USA) was used. Helium of 6.0 purity (PGNiG, Warsaw, Poland) served as the carrier gas. A headspace HS-20 dispenser (Shimadzu, Kyoto, Japan) was also used. A 100 mL aliquot of 0.1 M NaOH solution containing 1.0 × 10⁻⁴ M IPA was subjected to continuous electrolysis at Pt clad electrodes, at a current intensity of 50 mA for 1800 s at room temperature. Subsequently, a 5 mL sample of the prepared solution was placed in a 20 mL headspace vial and heated for 15 min at 60 °C under continuous stirring until equilibrium was established. After this time, the headspace gas was automatically injected into the GC-MS system. The GC oven temperature program was as follows: an increase from 30 to 40 °C at a rate of 3 °C min−1, followed by an increase from 40 to 100 °C at a rate of 30 °C min−1. MS parameters were as follows: ion source temperature, 230 °C; interface temperature, 250 °C; acquisition mode, selected ion monitoring (SIM). Ions with mass-to-charge ratios (m/z) of 45 and 58, characteristic of isopropanol and acetone, respectively, were analyzed.

3. Results

3.1. Cyclic Voltammetry

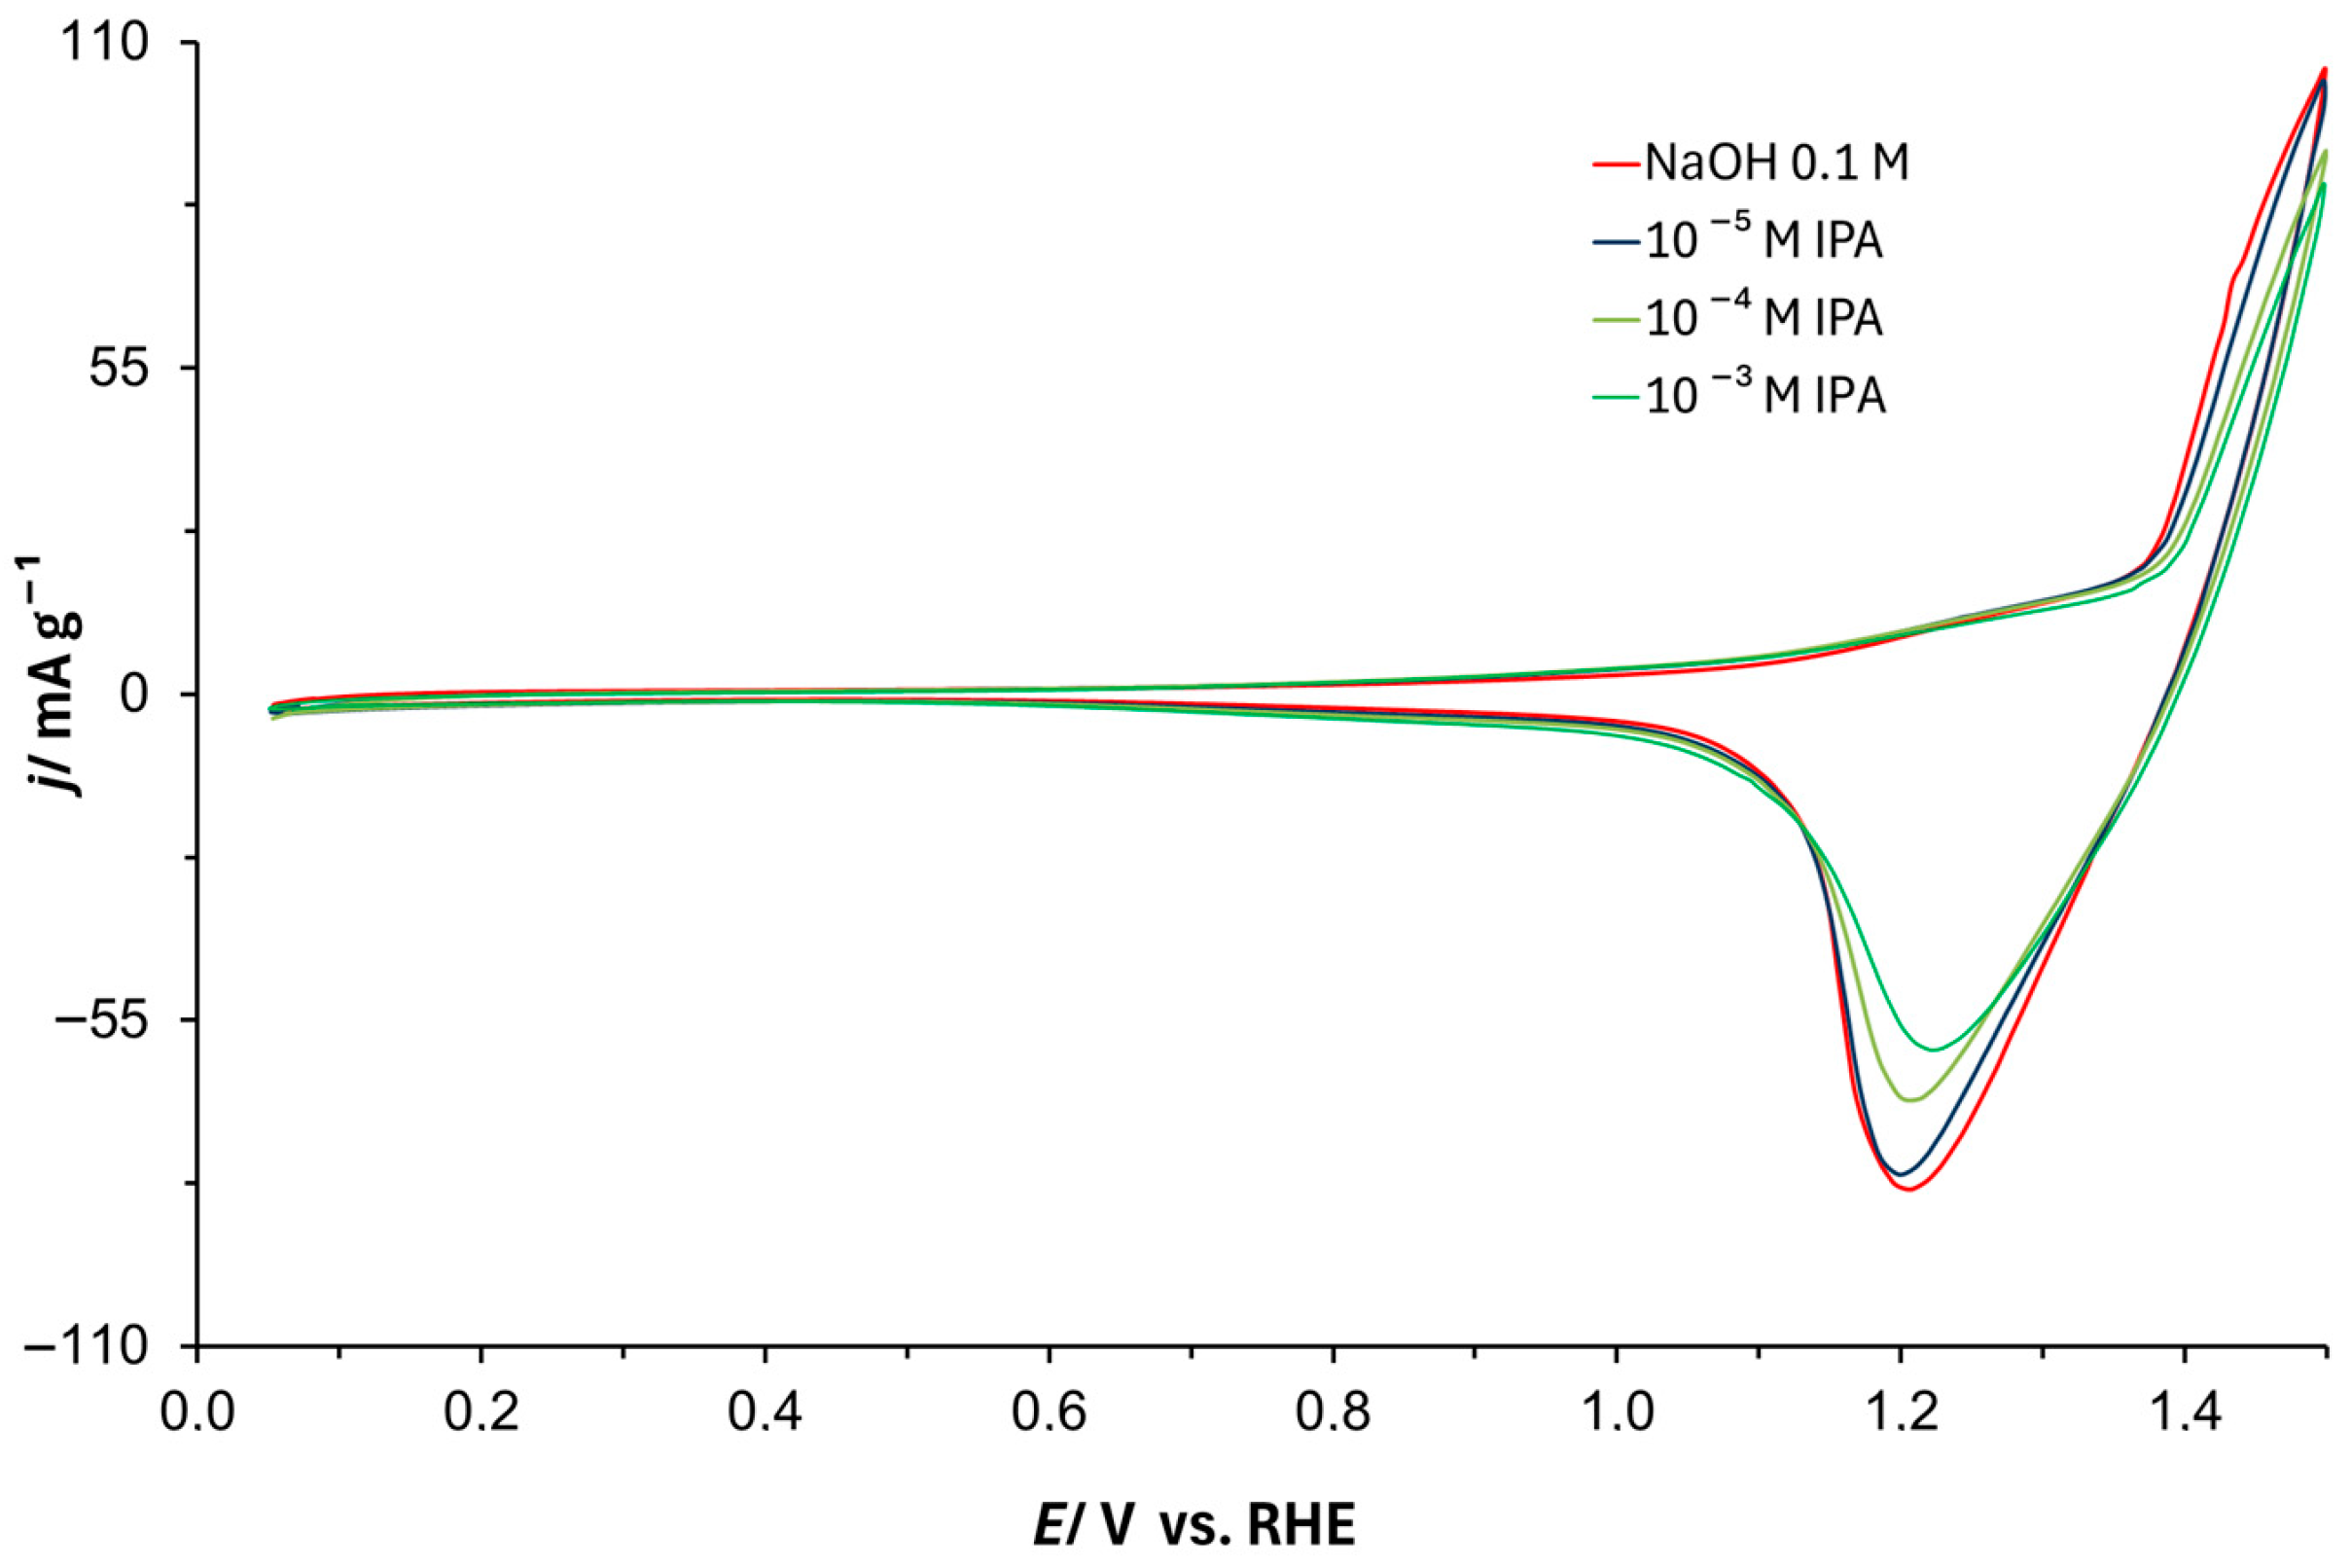
The cyclic voltammetry behavior of nickel foam in 0.1 M NaOH solution, in the absence and presence of isopropanol, at concentrations of 1.0 × 10⁻⁵, 1.0 × 10⁻⁴, and 1.0 × 10⁻³ M, is shown in Figure 1. A broad anodic peak (ca. 1.20–1.35 V vs. RHE) corresponds to the formation of β-NiOOH species from nickel hydroxide, whereas a sharp increase in anodic current at electrode potentials positive to 1.40 V is related to the onset of the oxygen evolution reaction (OER). Subsequently, a broad cathodic peak, centered at approximately 1.20 V, corresponds to the reduction of the previously formed β-NiOOH [18]. As argued by Van Drunen et al. for an analogous experimental system in Reference [18], electrooxidation of IPA was observed over the potential range of approximately 1.35–1.50 V vs. RHE (see Figure 2 there). Although no distinct anodic peak attributable to isopropanol electrooxidation could be identified in Figure 1 within this potential range, this is likely due to the fact that the highest IPA concentration examined in the present work is two orders of magnitude lower than that employed in the referenced study.
Nevertheless, Figure 1 demonstrates that the introduction of isopropanol into the working solution caused a clear concentration-dependent shift in the anodic oxidation feature (1.40–1.50 V) towards more positive potentials. Correspondingly, the broad cathodic reduction peak (ca. 1.10–1.40 V) exhibited a significant reduction in charge, along with a slight anodic shift of the peak center with increasing alcohol concentration. This behavior most likely results from the simultaneous adsorption of isopropanol molecules on the Ni foam surface.
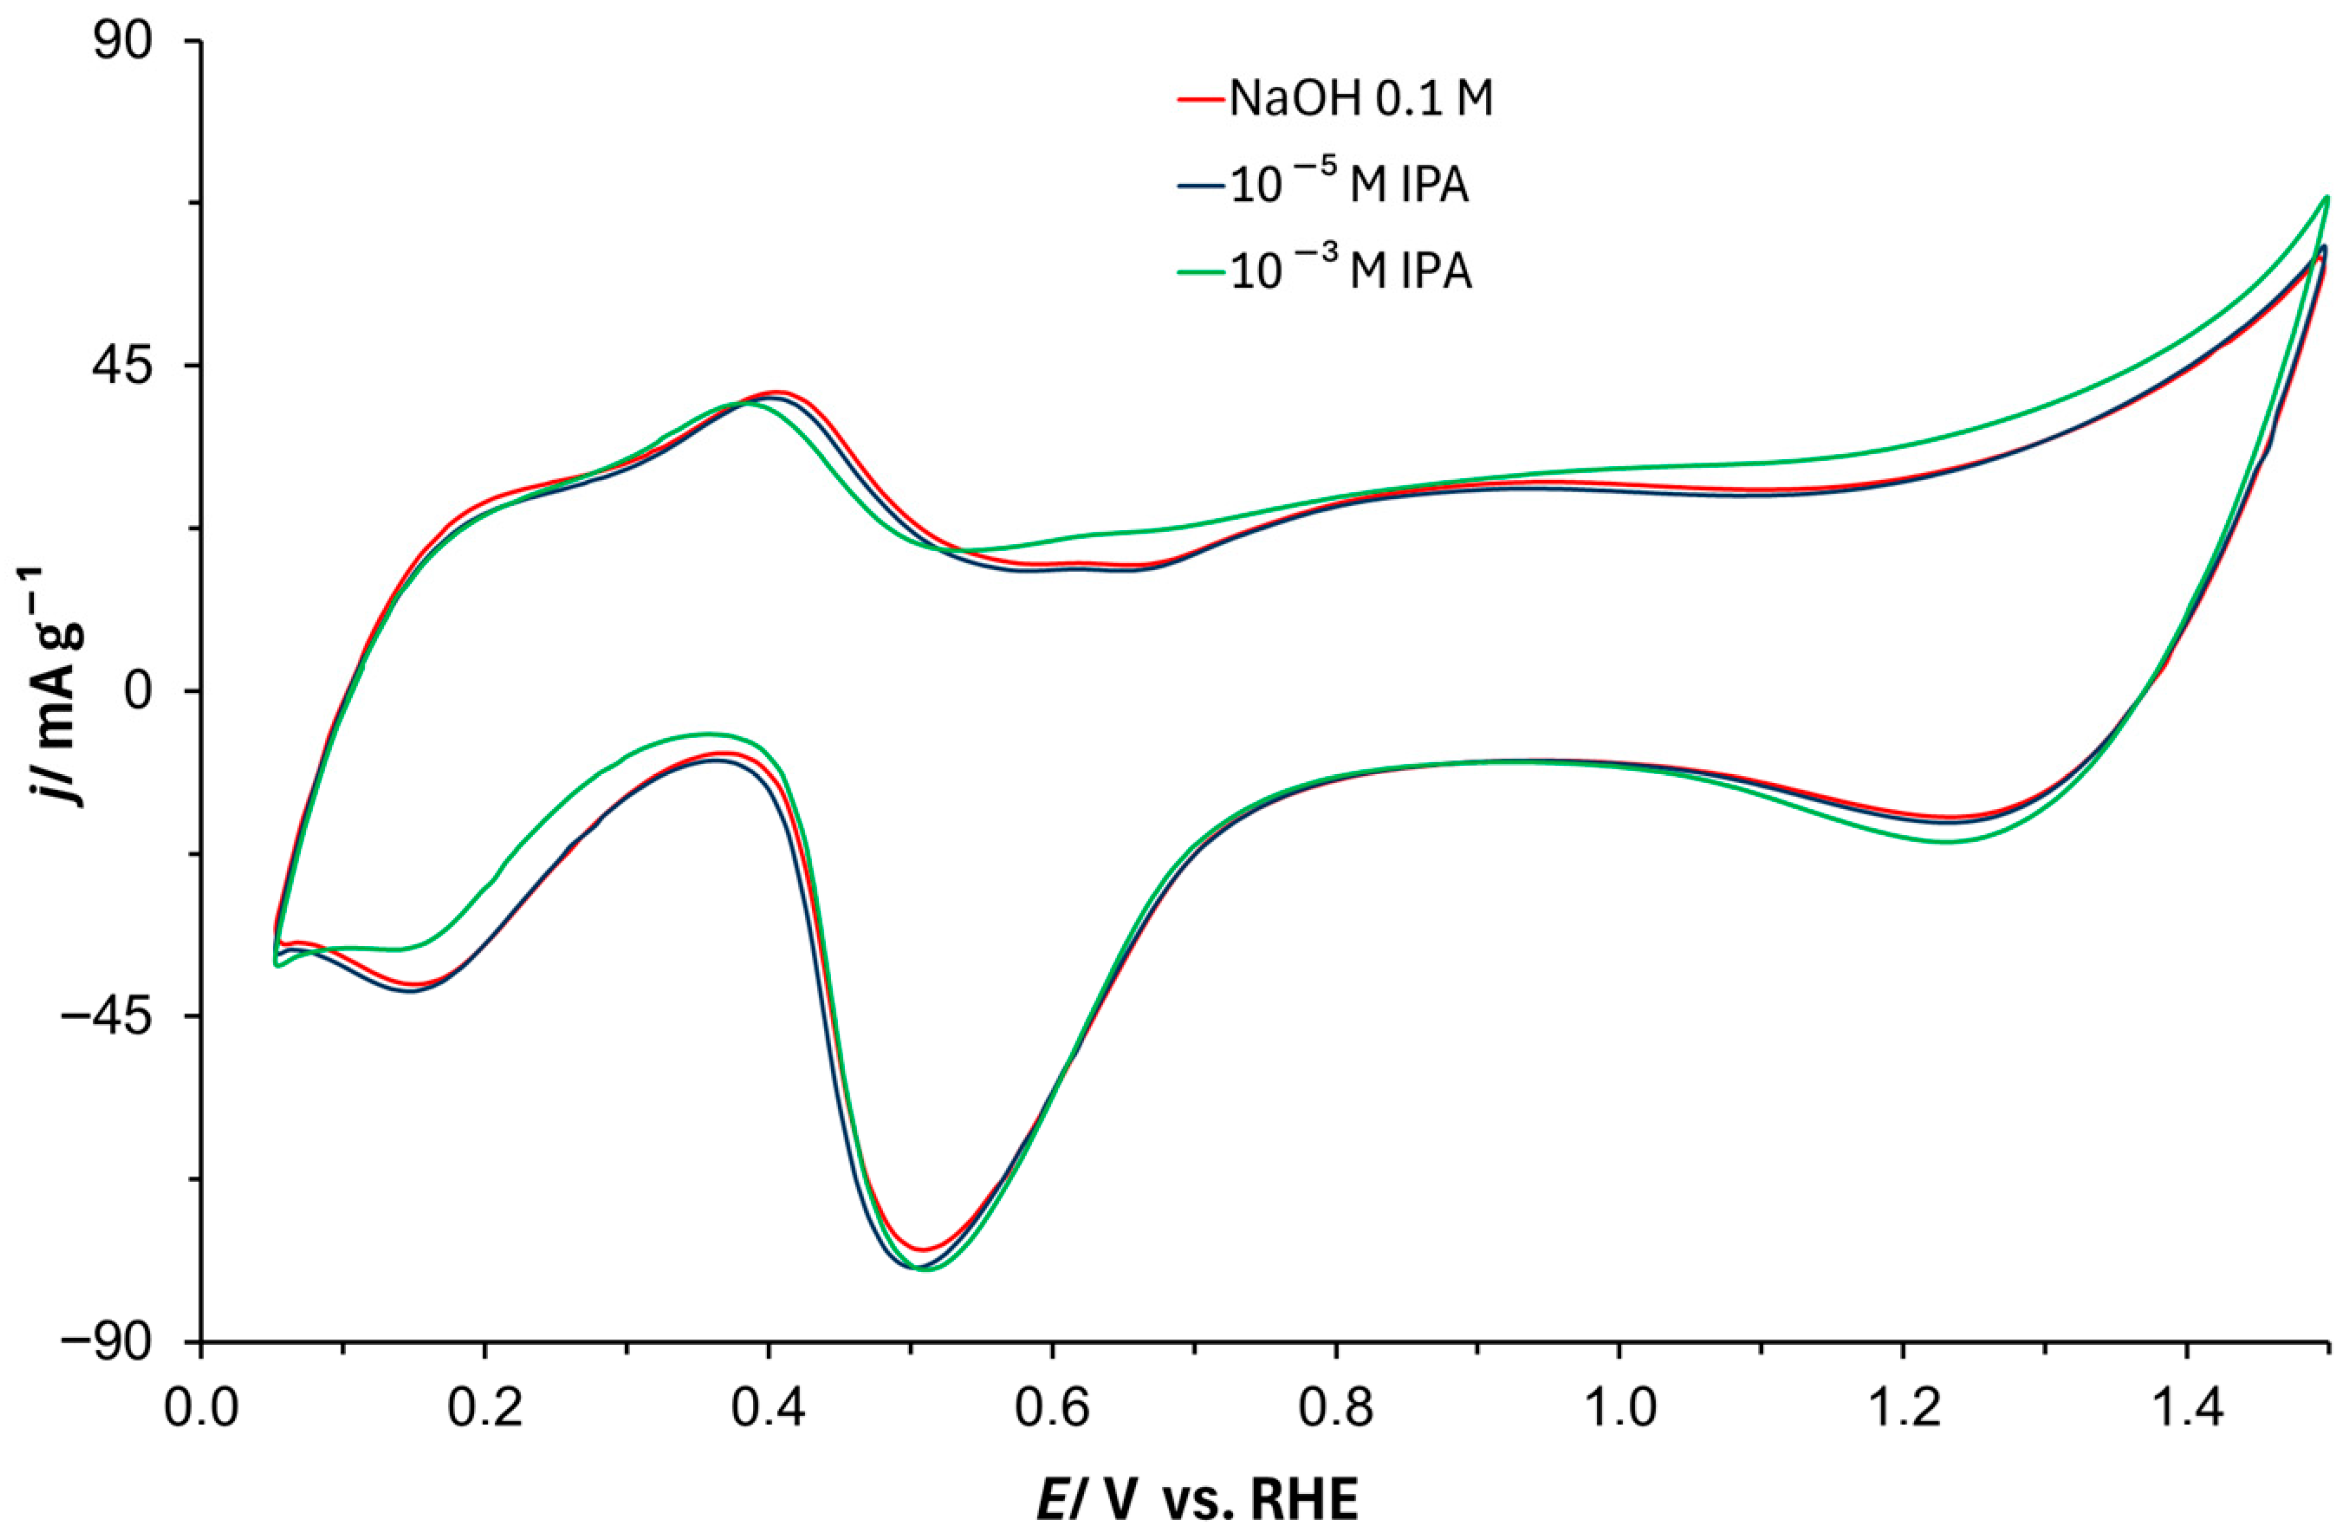
On the other hand, the CV behaviour of the Pd-modified Ni foam electrode is presented in Figure 2 below. The voltammetric feature recorded over the potential range of 0.05–0.30 V can be assigned to the reversible H UPD (hydrogen underpotential deposition) phenomenon, taking place at palladium entities (see, e.g., References [19,20] for details on this process). Moreover, the respective anodic and cathodic peaks, observed over the potential range of 1.00–1.50 V, correspond to the formation and reduction of nickel oxyhydroxide species. An additional cathodic peak, attributed to the reduction of Pd surface oxides (formed at more positive potentials), is observed over the potential range of 0.35–0.75 V vs. RHE [21]. The presence of isopropanol in the working electrolyte, especially at a concentration of 1.0 × 10⁻³ M, results in an increased anodic current density over the potential range of 0.55–1.50 V vs. RHE. This behavior most likely relates to the surface oxidation of isopropanol to acetone (Equation (1)), proceeding both on palladium sites [22], as well as on Ni catalytic centers.
(CH3)2CHOH + 2OH → (CH3)2CO + 2H2O + 2e
Equation (1) catalytic electrooxidation of isopropanol via dehydrogenation to acetone [18,23,24].

3.2. Ac. Impedance Spectroscopy

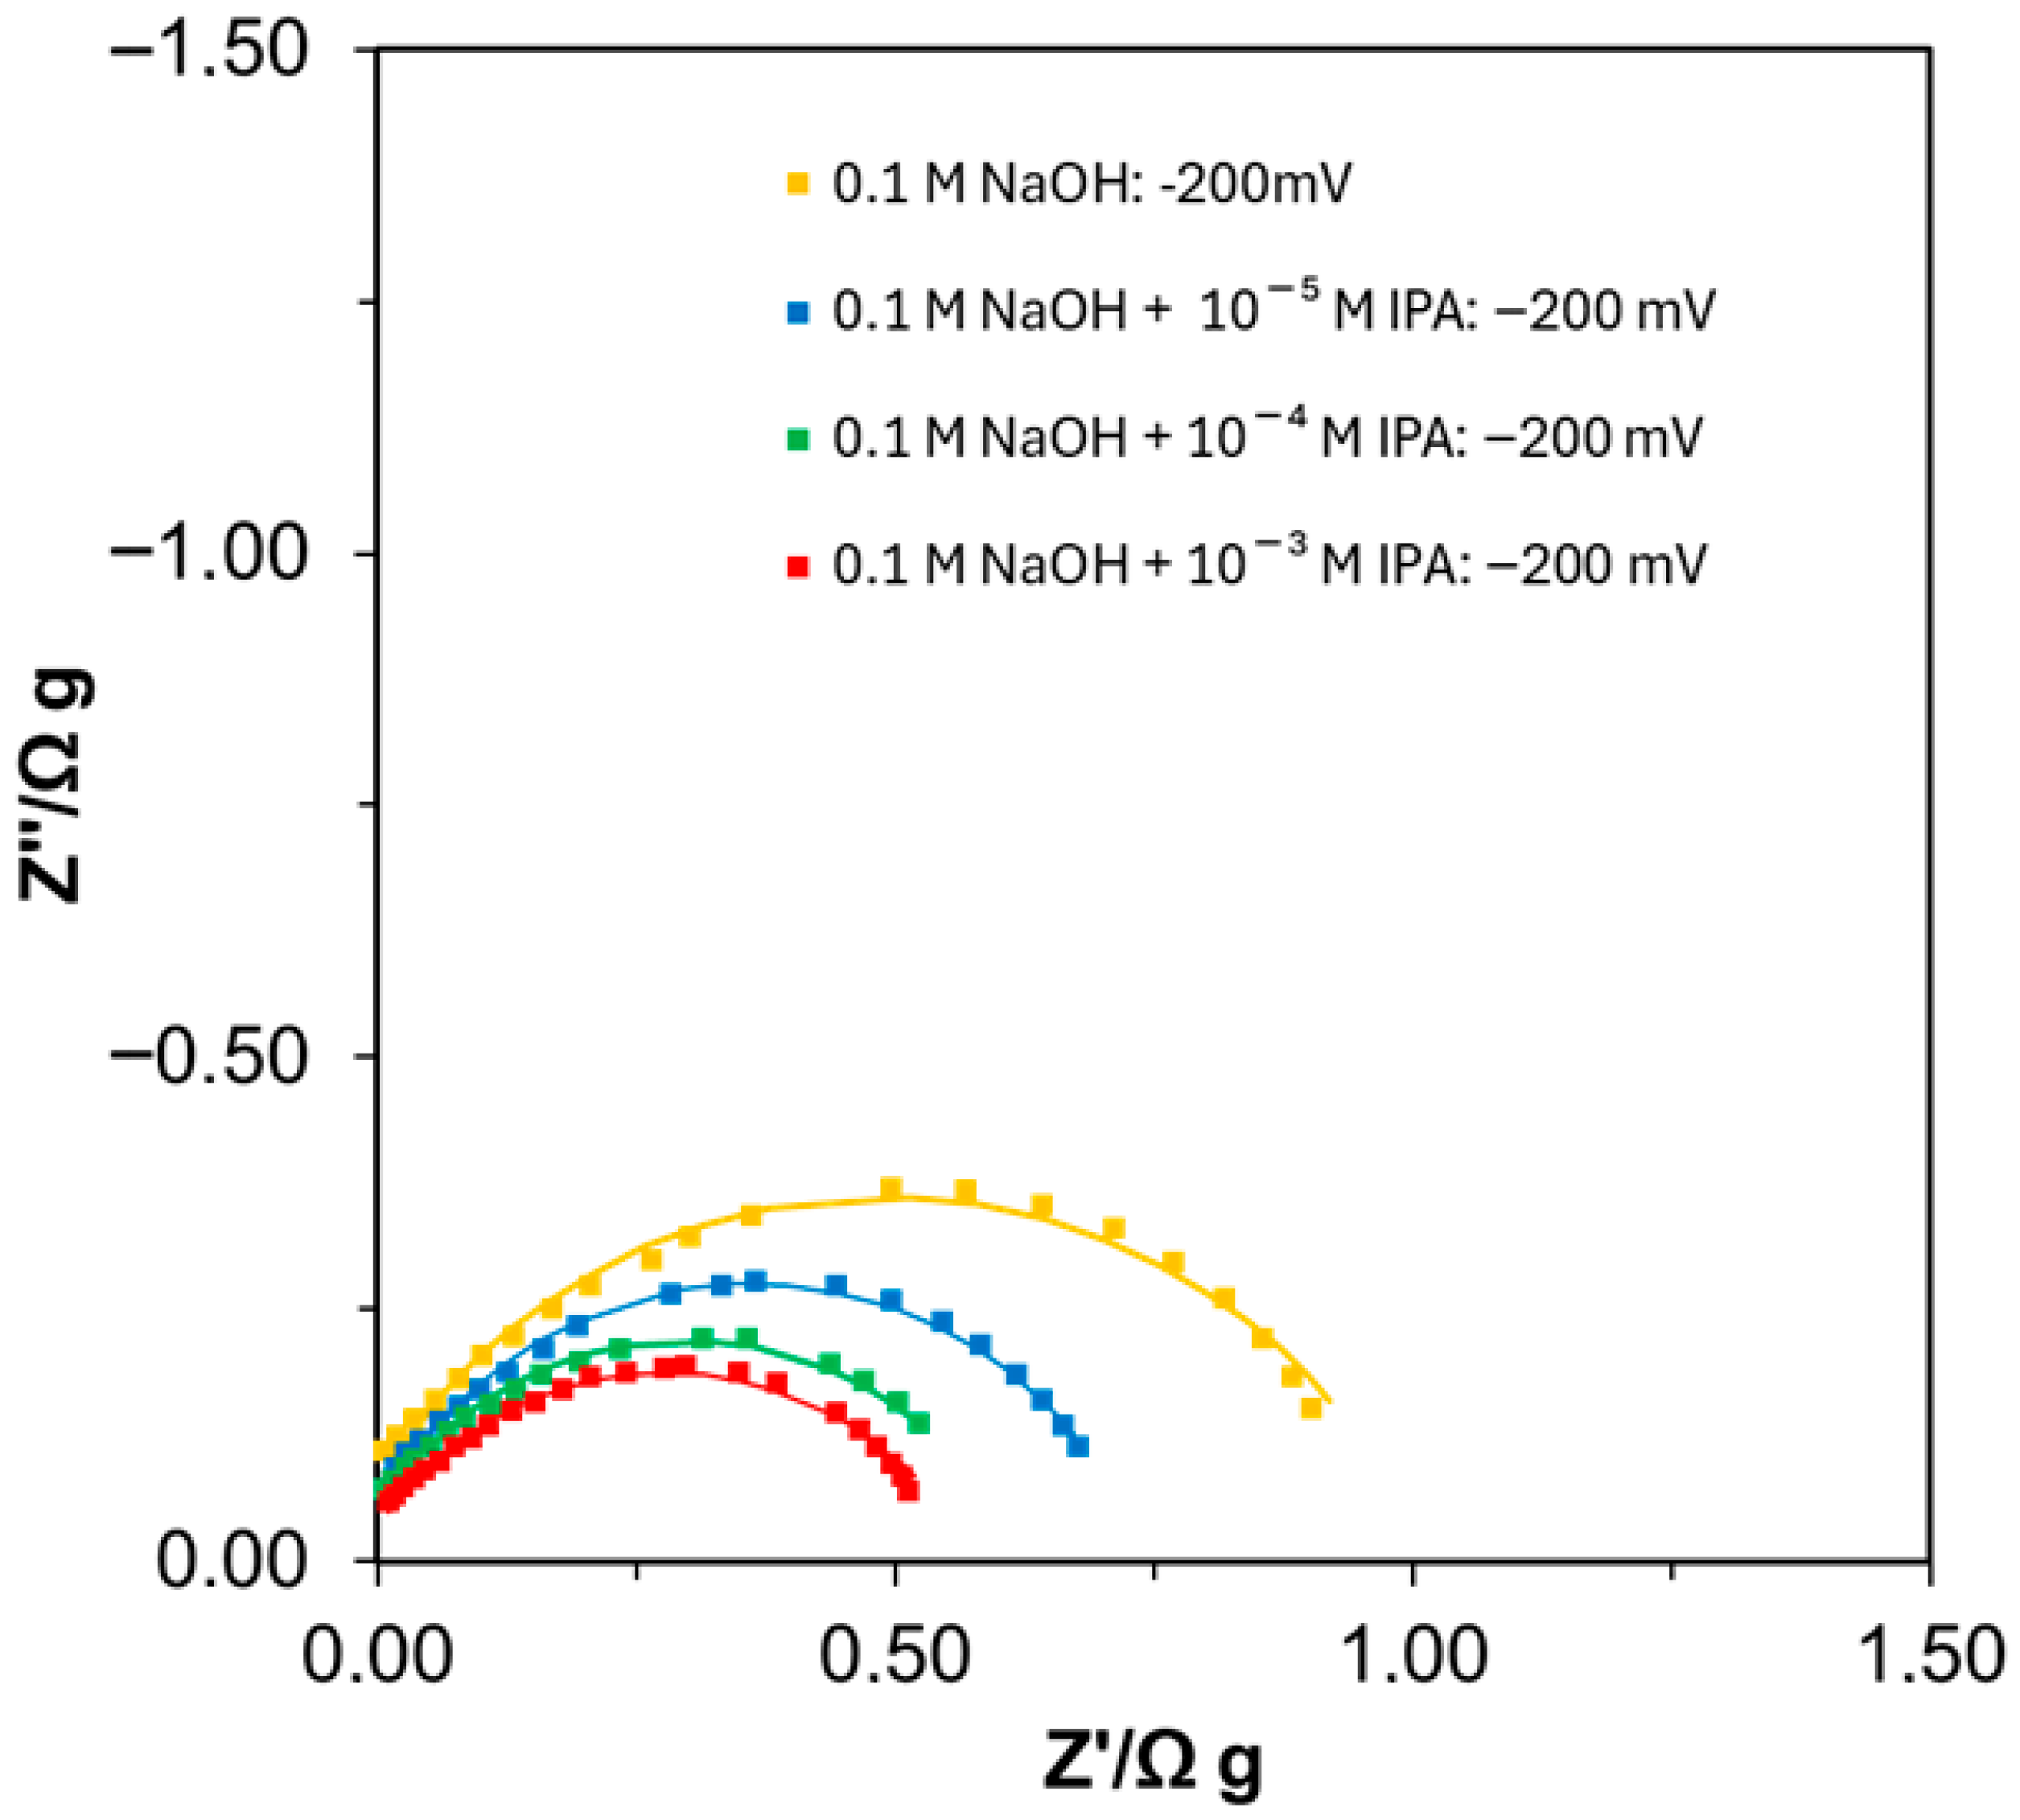
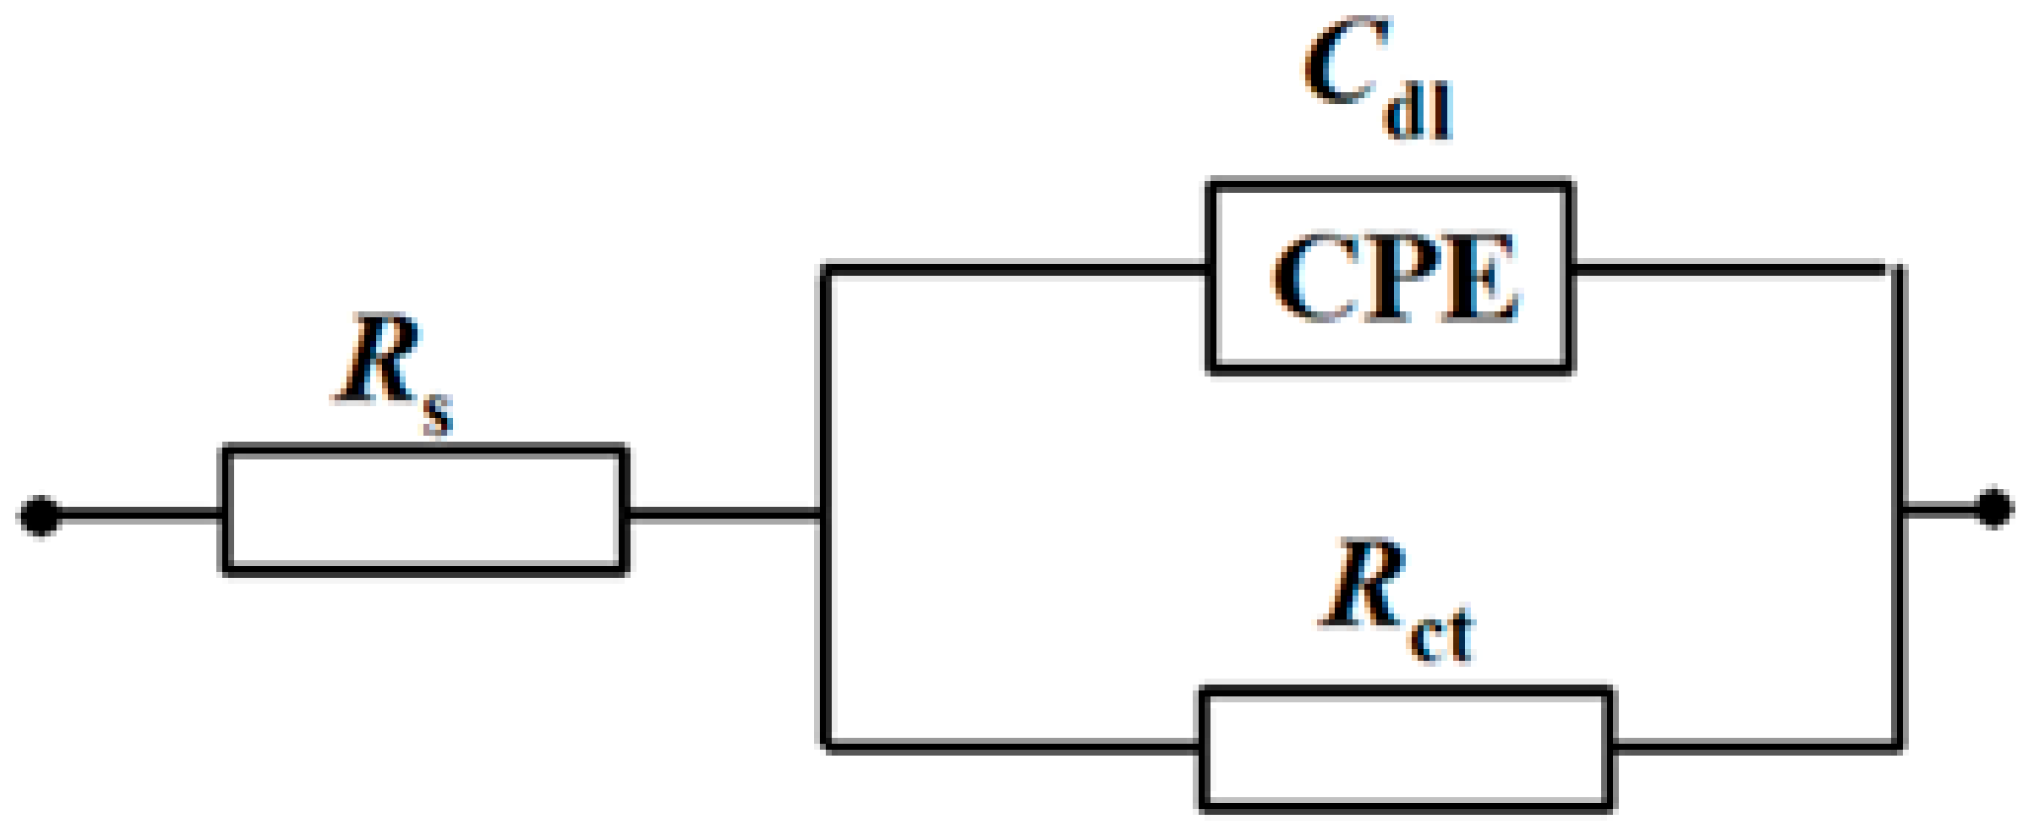
Ac. impedance characterization of the hydrogen evolution reaction on the unmodified Ni foam electrode surface in 0.1 M NaOH, in the absence and presence of isopropanol (at concentrations of: 1.0 × 10⁻⁵, 1.0 × 10⁻⁴, and 1.0 × 10⁻³ M), is shown in Figure 3 and Table 1. The electrochemical impedance spectra recorded for the unmodified Ni foam electrode exhibited single, “depressed” semicircles, corresponding to a single-step charge-transfer reaction, at all investigated potentials within the explored frequency range. Examples of Nyquist impedance plots recorded at an overpotential of 200 mV are shown in Figure 3. The overpotential dependence of the Faradaic charge-transfer resistance (Rct) and double-layer capacitance (Cdl) parameters for the HER at the unmodified nickel foam electrode (derived using a constant phase element, CPE-modified Randles equivalent circuit model shown later in Figure 5) is presented in Table 1. The CPE element was introduced in order to account for capacitance dispersion effects [25,26], manifested by distorted semicircles in the Nyquist plots.
For the cathodically activated Ni foam electrodes [2], the recorded Rct parameter decreased from 13.69 Ω g at −50 mV to 0.25 Ω g at −400 mV vs. RHE. At the same time, the Cdl parameter diminished from 15,716 to 9484 µF·g−1 over the same potential range. This decrease is believed to result from partial blocking of the electrochemically active electrode surface by freshly formed hydrogen bubbles, which can be readily envisaged for the complex porous structure of nickel foam electrodes (see Figure 1 in [2]), particularly at elevated overpotentials. It should also be noted that when the capacitance value of 15,716 µF·g−1 (recorded for an electrode weight of 90.0 mg at −50 mV vs. RHE) is compared with the commonly used literature value of 20 μF·cm−2 for smooth and homogeneous surfaces [27,28], the electrochemically active surface area of the Ni foam electrode can be estimated to be approximately 70.7 cm2. The introduction of IPA into the working electrolyte significantly facilitated charge transfer, as reflected by a substantial reduction in the Rct parameter at initial and intermediate overpotentials, i.e., within the potential range characteristic of activation-controlled kinetics. Hence, at an overpotential of 50 mV, the recorded Rct decreased to 6.26 and 5.14 Ω g for IPA concentrations of 1.0 × 10⁻⁵ and 1.0 × 10⁻⁴ M, corresponding to a reduction in reaction resistance by factors of 2.2 and 2.7, respectively (Table 1). Interestingly, rising reaction resistance observed at the highest IPA concentration of 1.0 × 10⁻³ M (e.g., 7.61 Ω g at −50 mV) is most likely associated with extended co-adsorption of isopropanol molecules on the catalyst surface (see also the Nyquist impedance plots recorded at −200 mV in Figure 3).
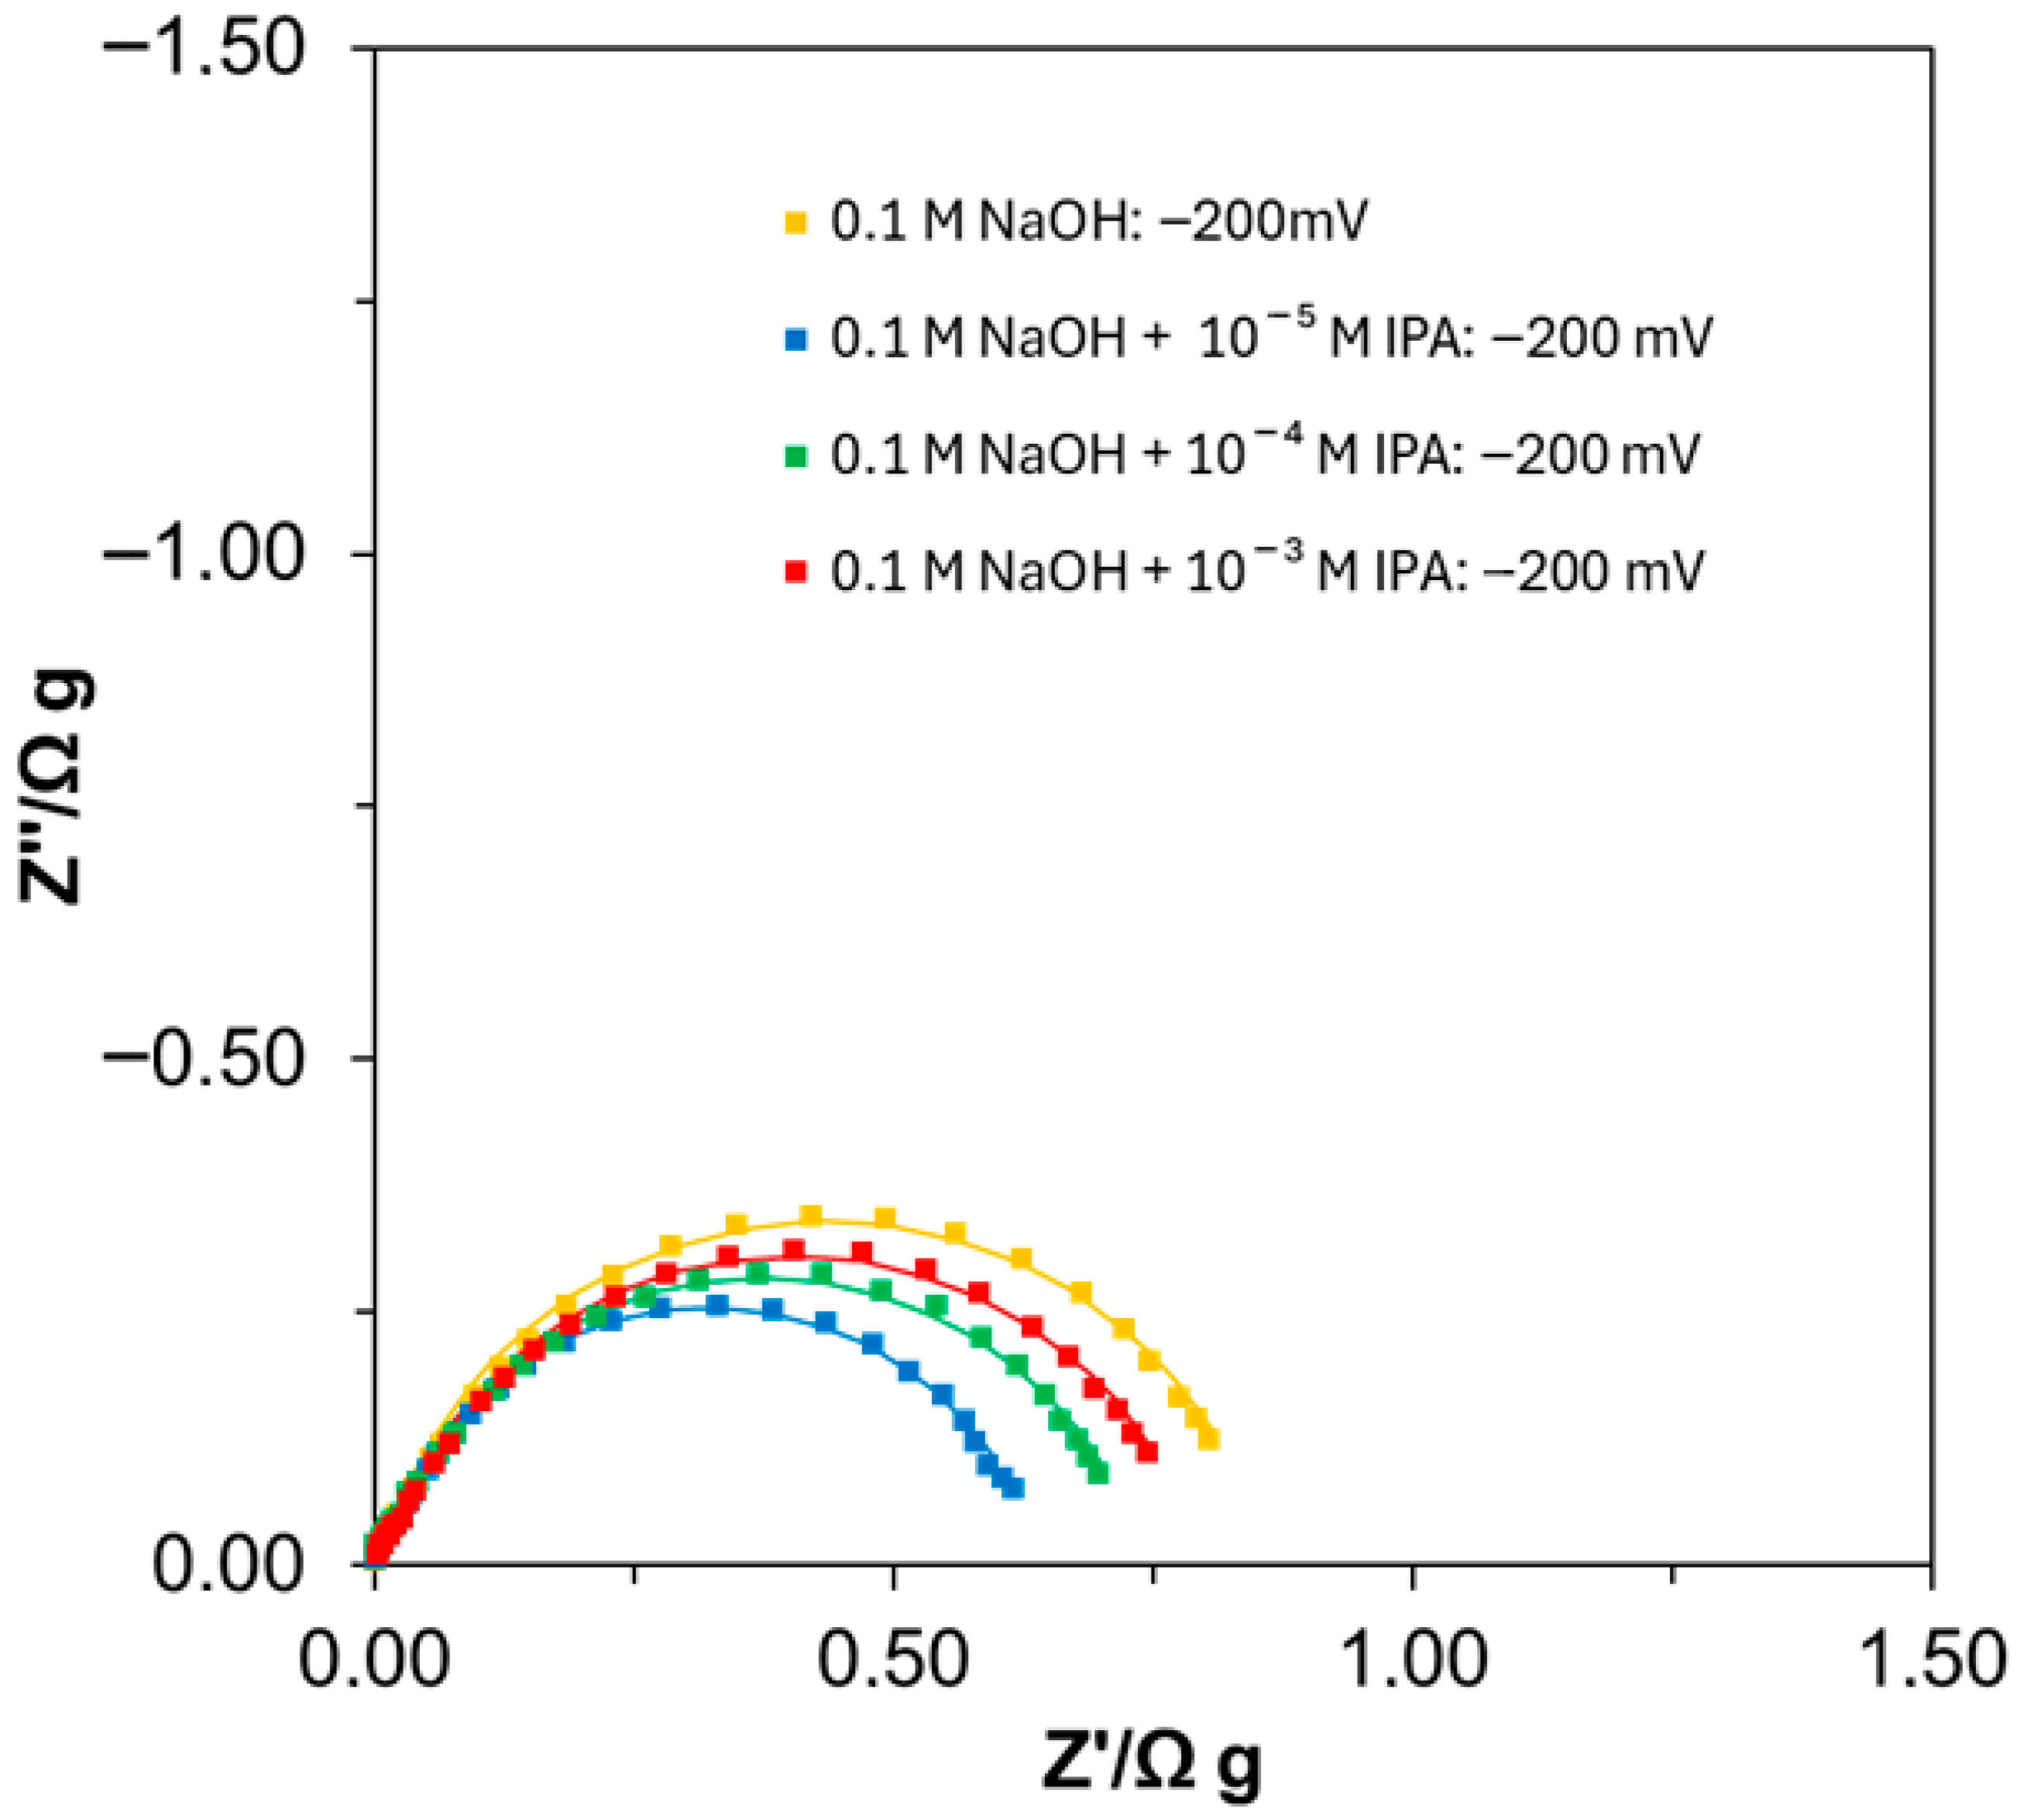
Furthermore, the HER impedance behavior for the Pd-modified Ni foam electrode, under analogous experimental conditions, is illustrated in Table 2 and Figure 4. Firstly, the significant surface modification induced by Pd activation is reflected by a substantial increase (several-fold) in the double-layer capacitance parameter (compare the Cdl values reported in Table 1 with those presented in Table 2). Secondly, a fundamental facilitation of HER kinetics in the presence of palladium is only observed at low overpotential values, i.e., over the potential range from −50 to −150 mV vs. RHE (for all examined IPA concentrations), as can clearly be seen in Table 2. Moreover, increasing the isopropanol concentration may exert a detrimental effect on the HER kinetics examined in this study, as evidenced by the impedance response shown in Figure 4.
Figure 5. Equivalent circuit used to fit the impedance data for the HER, where Rct represents the charge-transfer resistance, and Cdl denotes the CPE-modified double-layer capacitance, connected in series with the uncompensated solution resistance Rs [29].
Crystals 16 00114 g005
Finally, the temperature dependence of the hydrogen evolution reaction in 0.1 M NaOH on the surface of the palladium-activated nickel foam electrode, in the absence and presence of isopropanol, is shown in Table 3 and Table 4, respectively. As expected, the Rct parameter exhibited a significant temperature-dependent decrease with increasing electrolyte temperature from 20 to 40 °C, particularly at low and intermediate overpotentials. Moreover, rising temperature generally led (Table 3) to an augmentation of the recorded double-layer capacitance values. This effect is most likely associated with improved conductivity throughout the complex, porous three-dimensional structure of the nickel foam material (see Figure 1 in [2]). A similar, temperature-driven behavior of the charge-transfer resistance was also observed after the introduction of isopropanol at a concentration of 1.0 × 10⁻⁵ M. However, in this case, the temperature dependence of the Cdl parameter appears less pronounced than in the absence of IPA (Table 4).
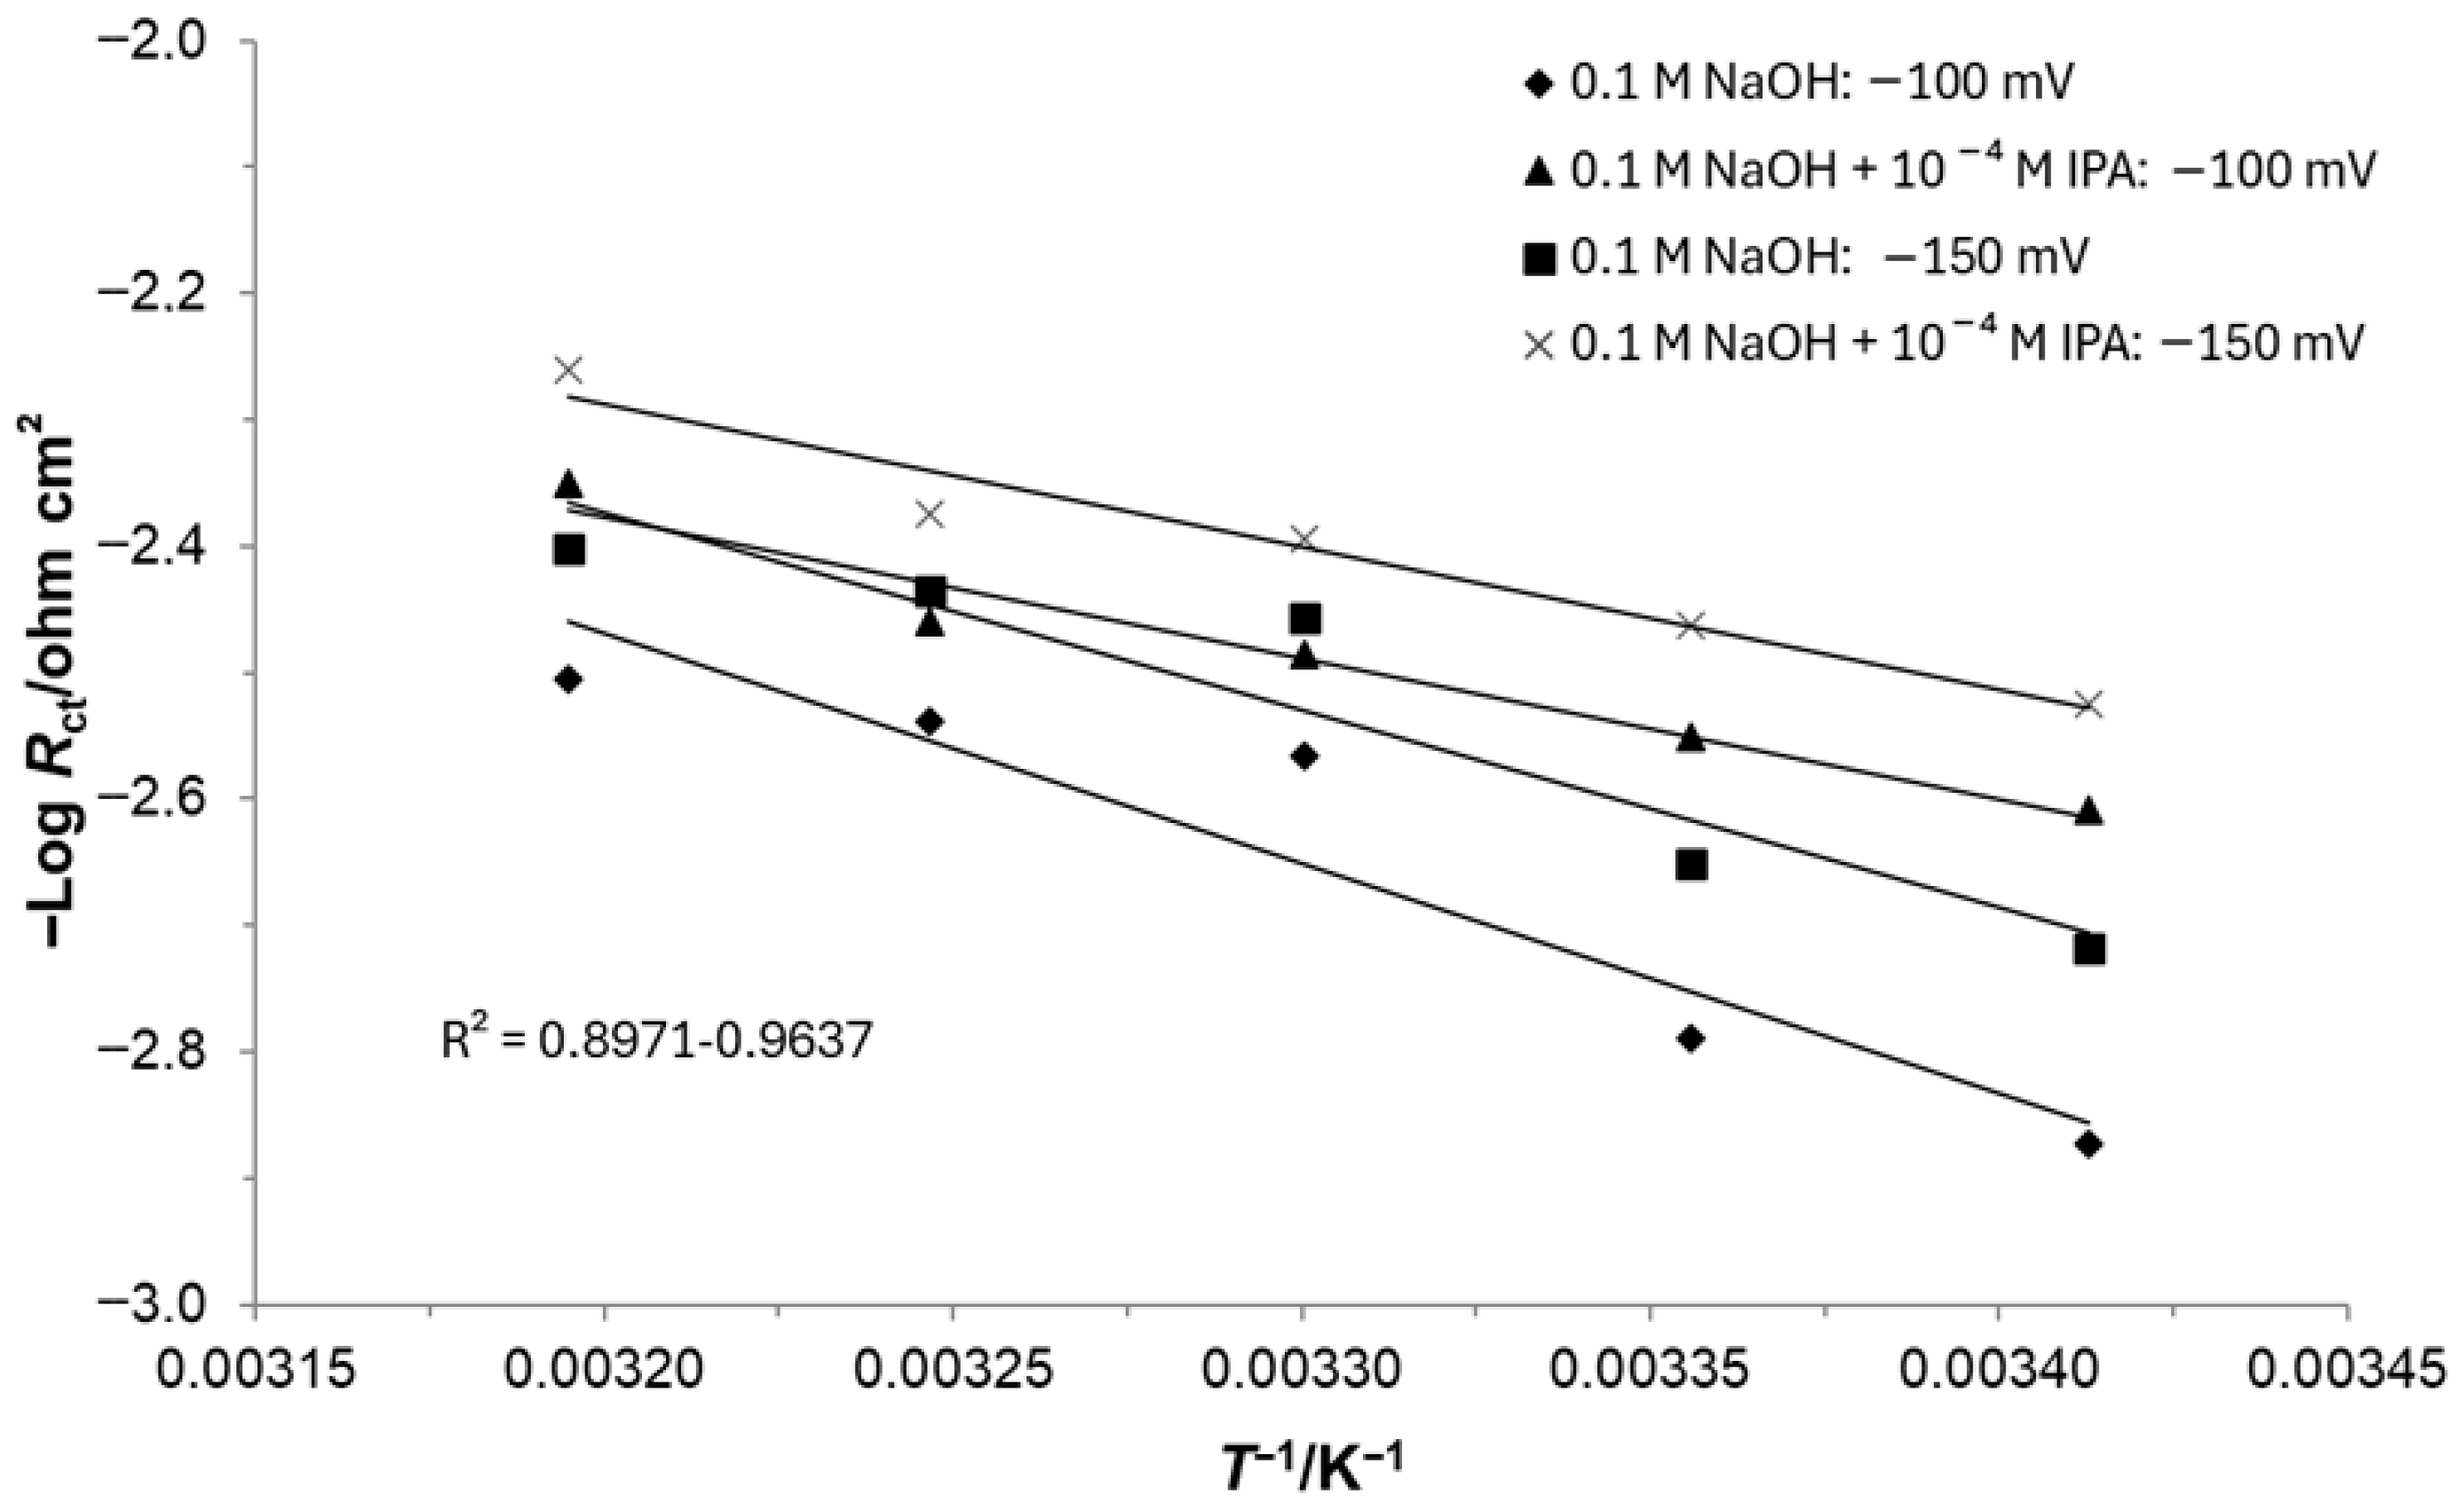
In addition, Figure 6 illustrates an Arrhenius-type relationship between −log Rct and T−1, derived from the impedance results Rct = f(T) obtained at overpotentials of 100 and 150 mV over the temperature range of 20–40 °C for the Pd-activated Ni foam electrode. Thus, the experimentally determined electrochemical activation energies, EA (kJ mol−1) for the HER at the Pd-modified nickel foam (in the absence and presence of 1.0 × 10⁻⁴ M IPA) were found to reach 34.8 and 21.3 kJ mol−1 at −100 mV, and 29.9 and 21.6 kJ mol−1 at −150 mV, respectively. These results demonstrate that the presence of a small amount of isopropanol in 0.1 M NaOH can lead to a substantial reduction in the activation energy of the hydrogen evolution reaction (compare with the EA values reported for analogous catalyst materials in Reference [29].

3.3. HER Characterization by Steady-State Tafel Polarization Curves

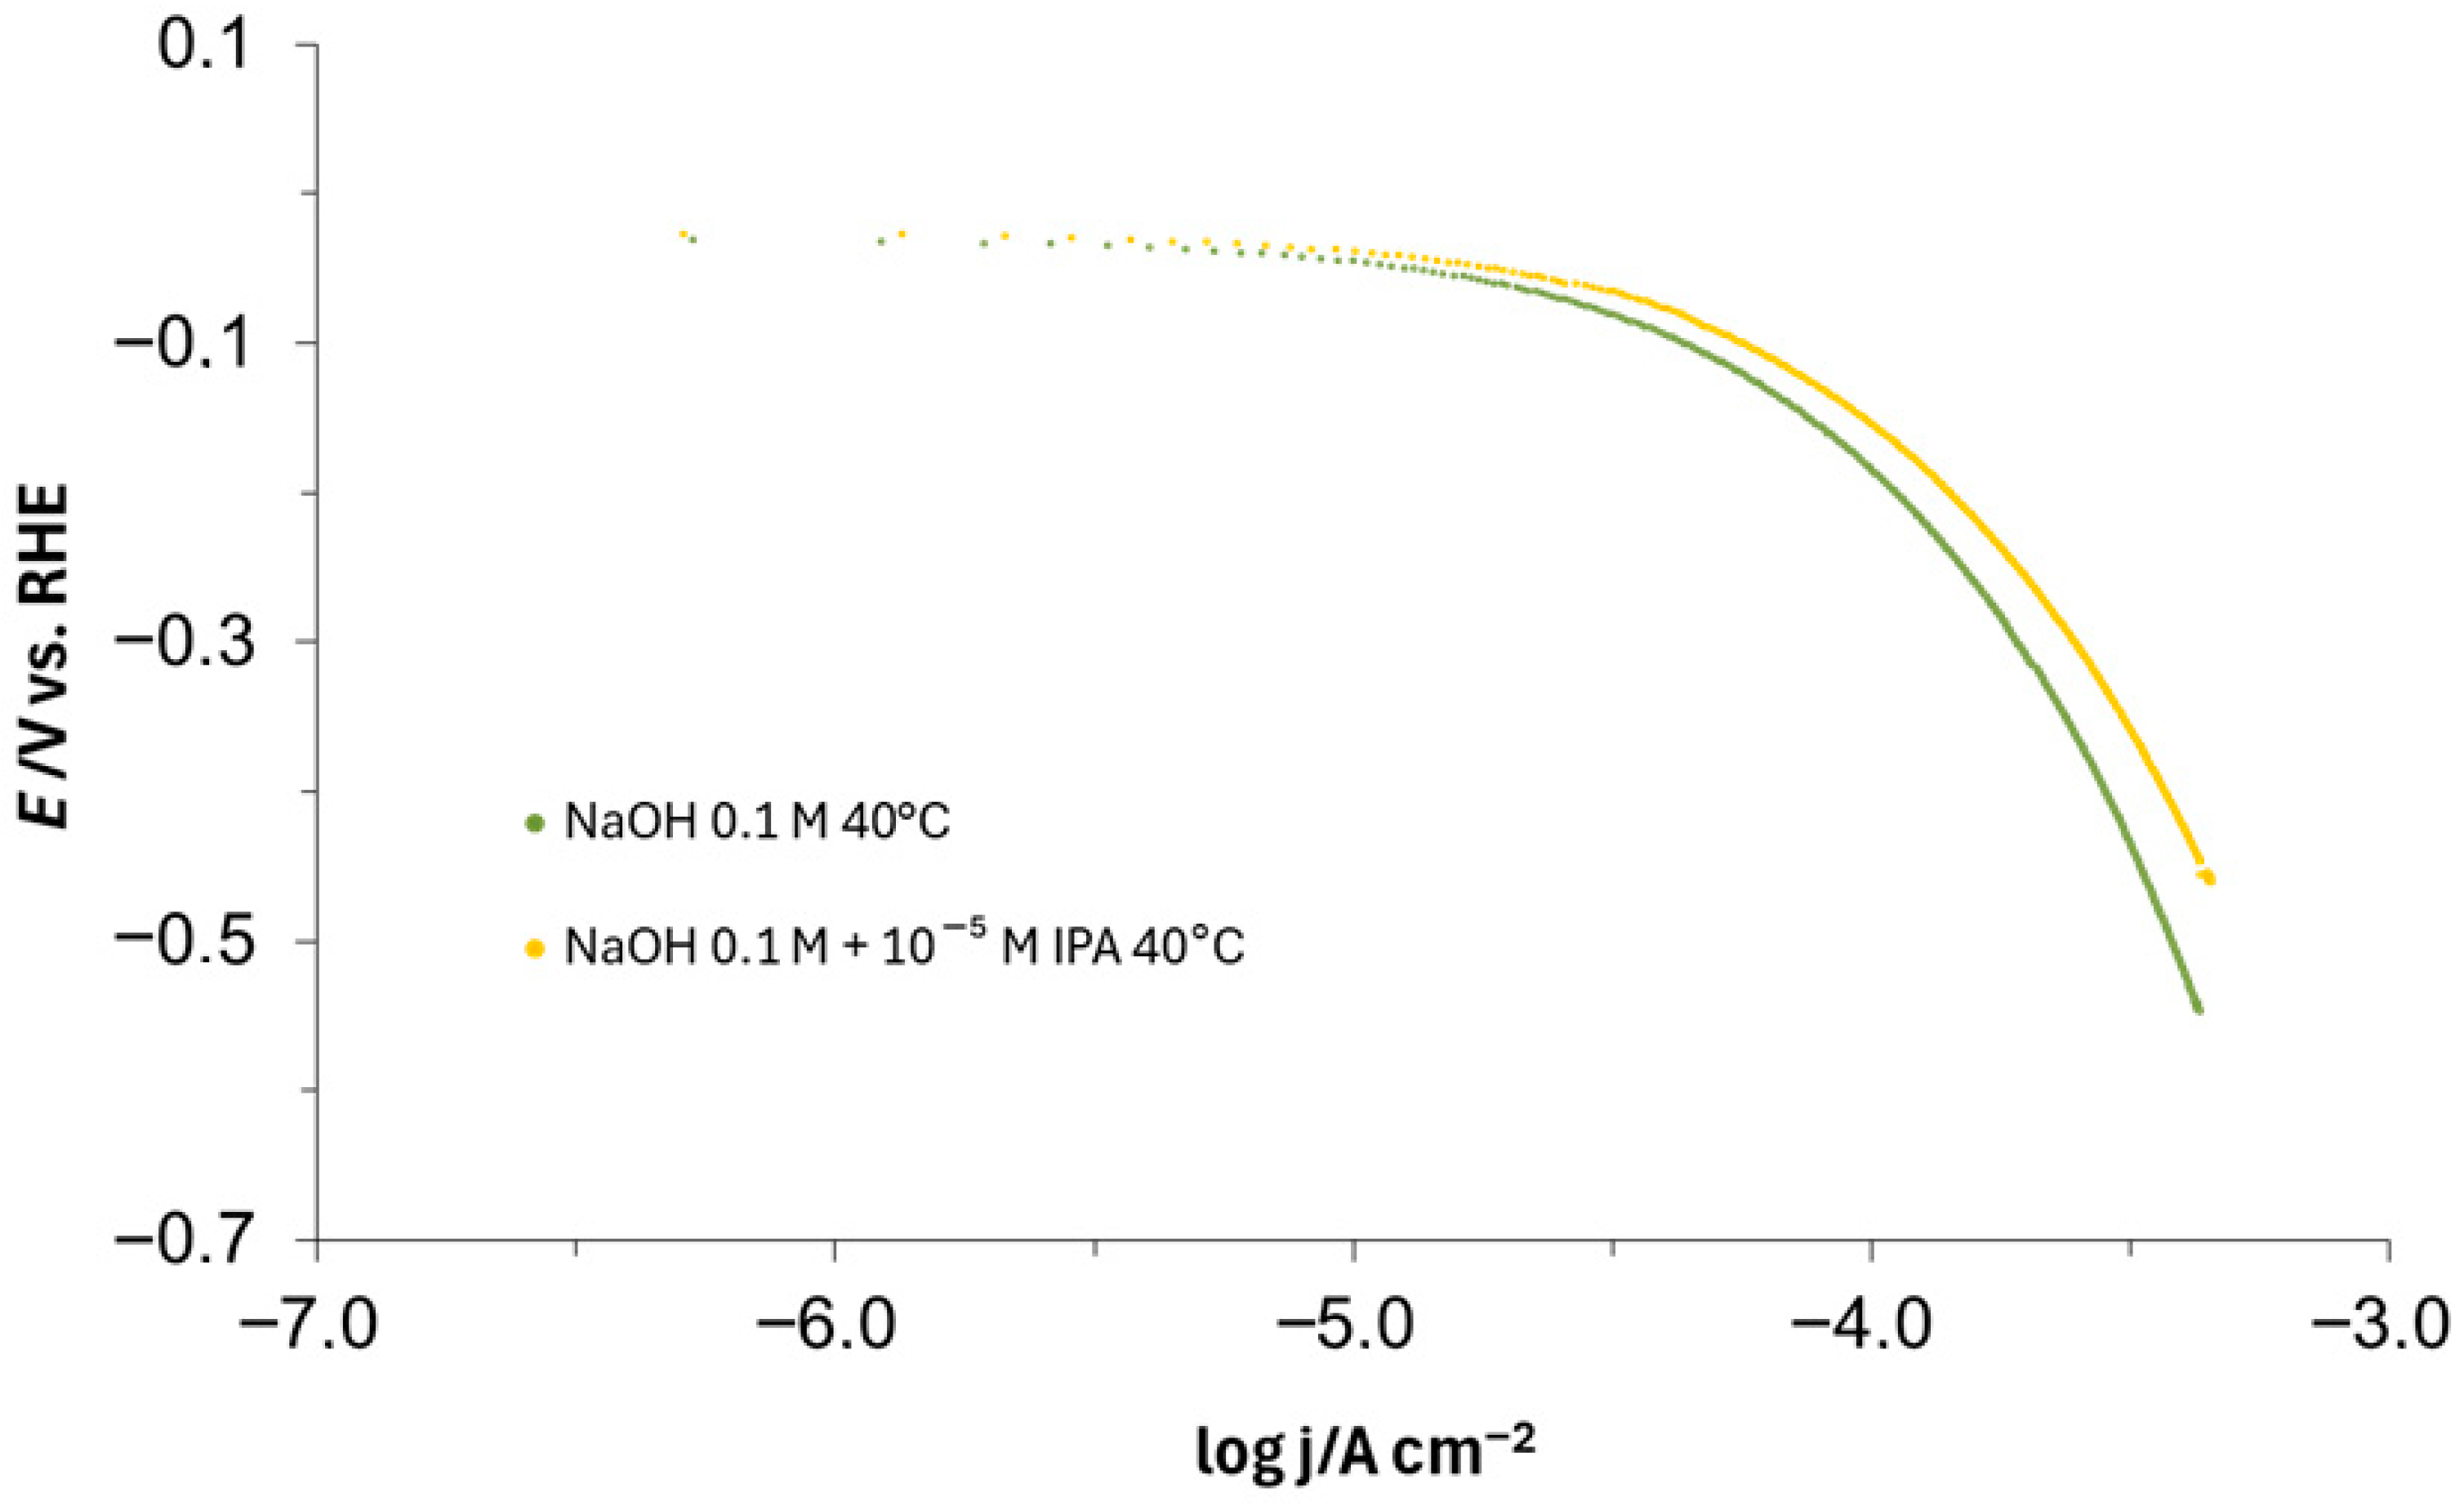
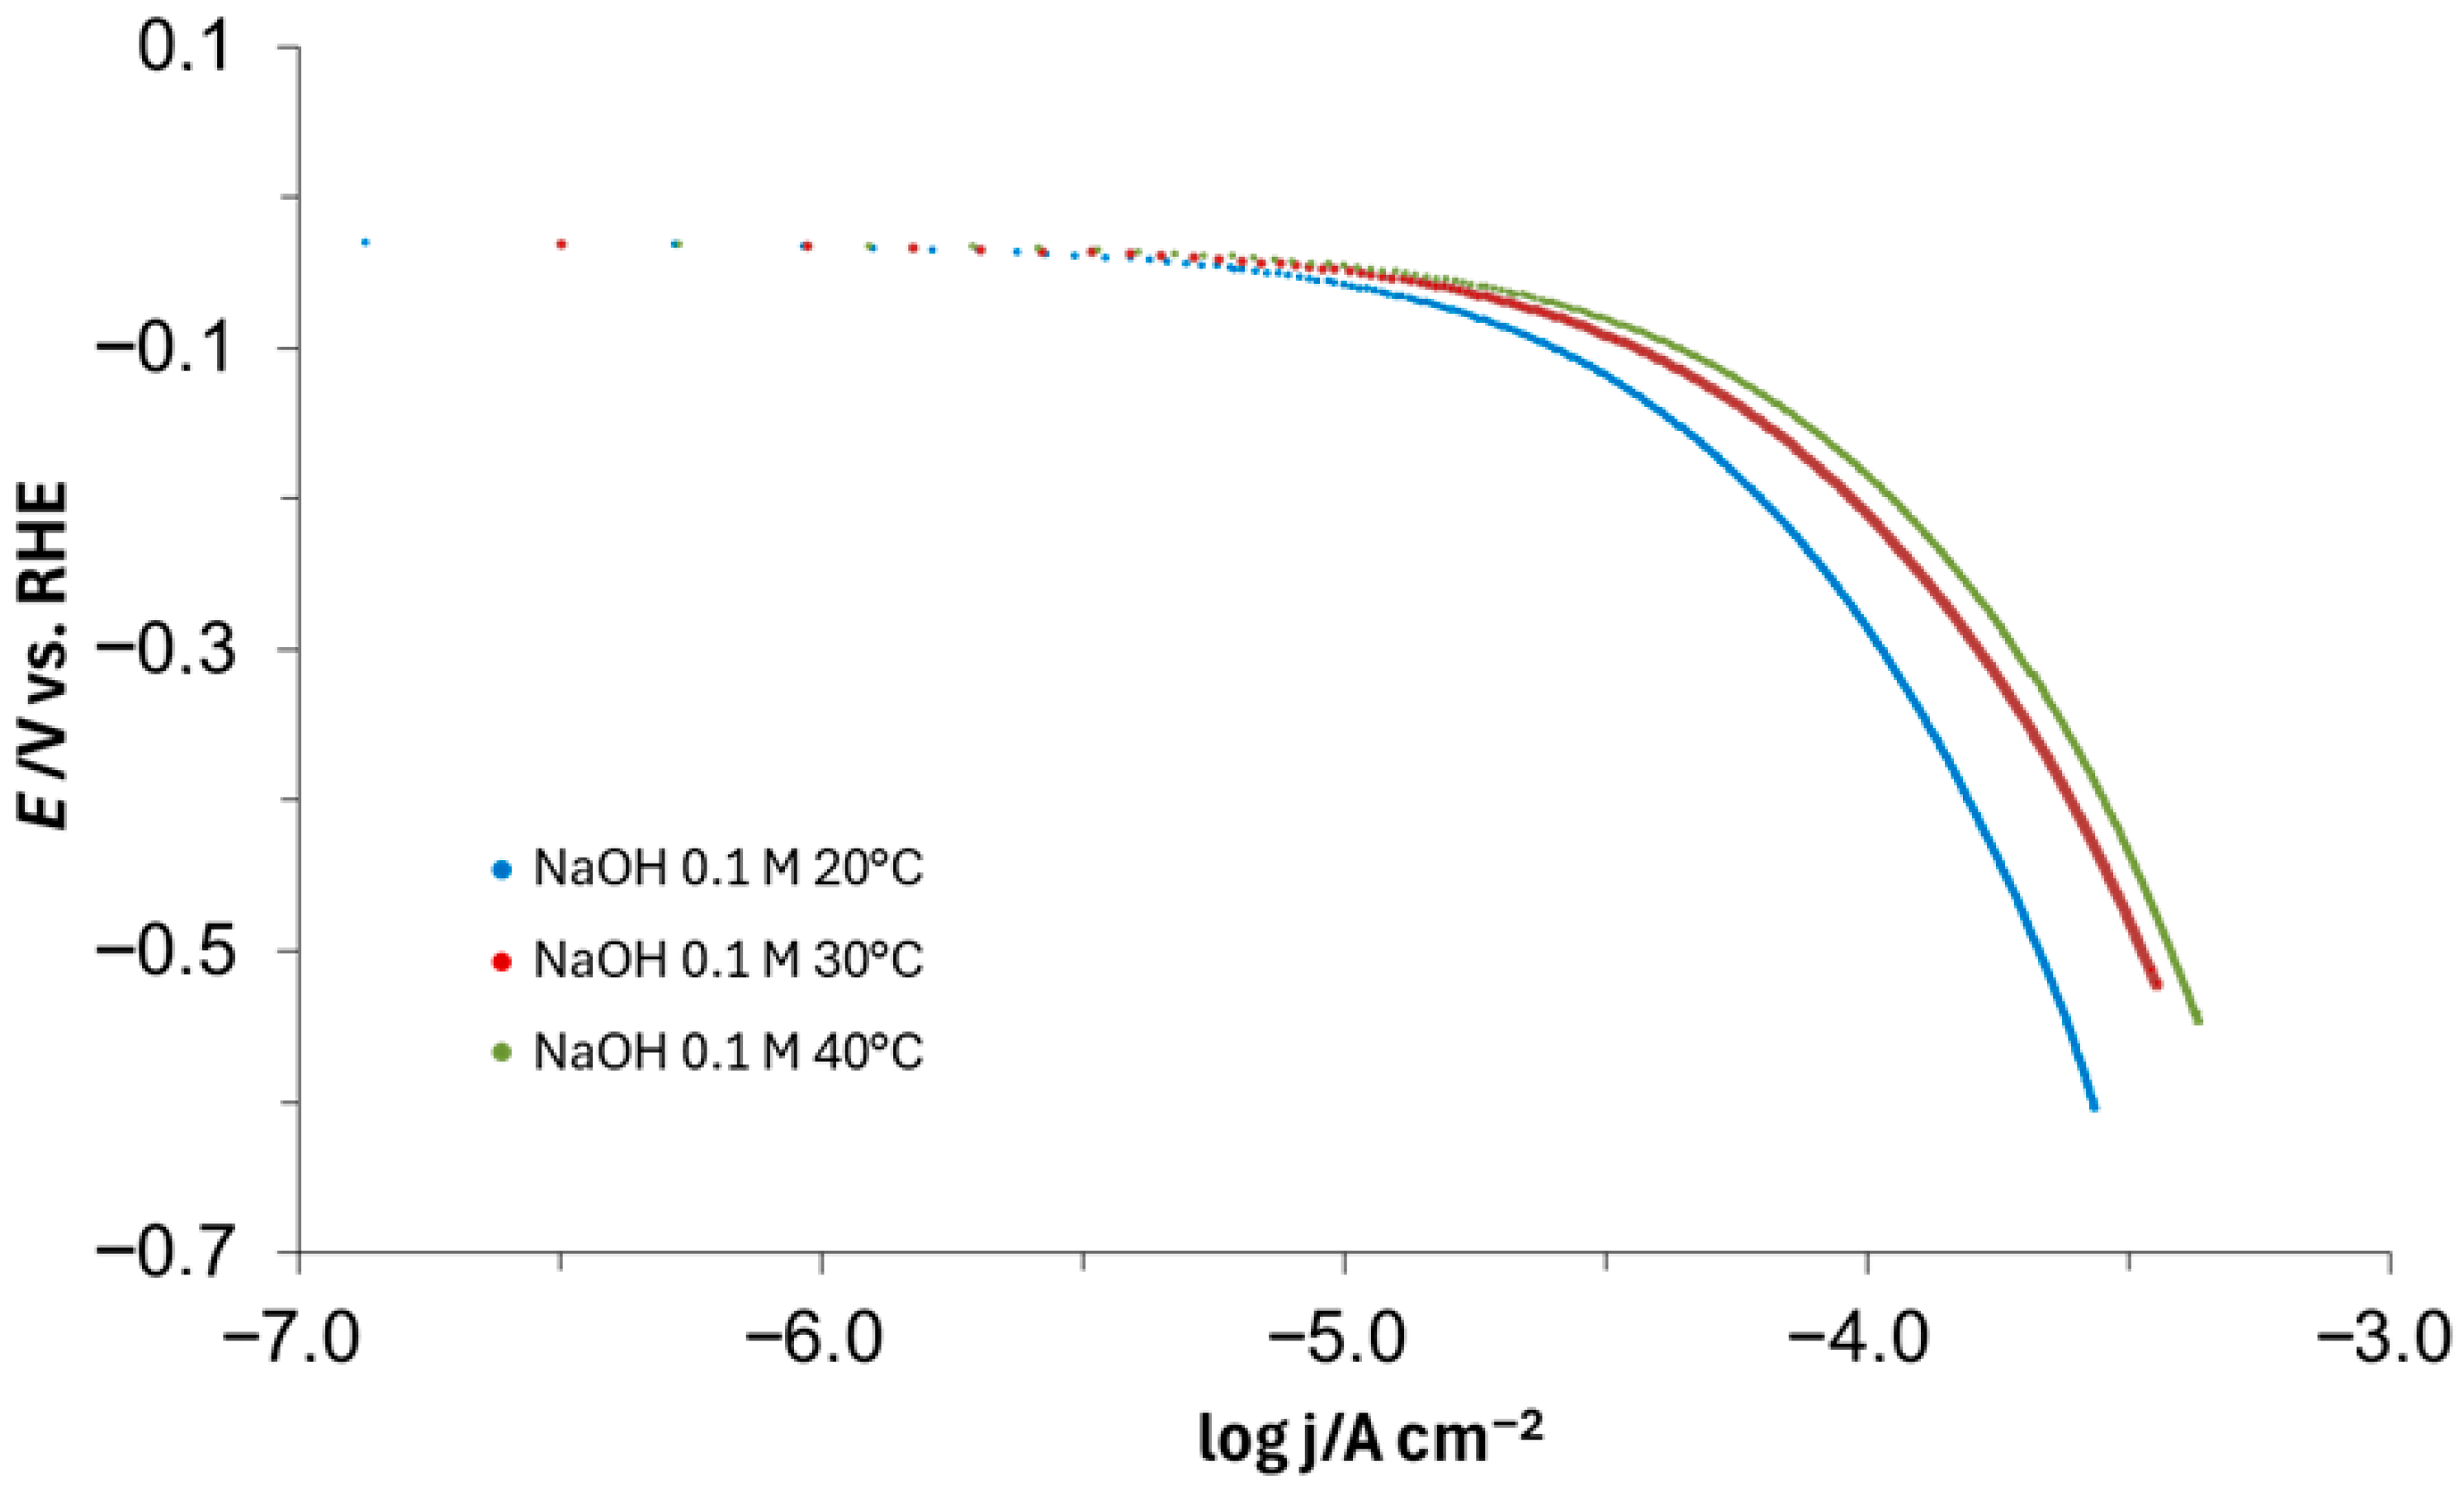
Figure 7 and Figure 8 present the results of supplementary, temperature-dependent, quasi-potentiostatic Tafel polarization experiments, performed on the palladium-activated nickel foam electrodes in contact with 0.1 M NaOH, both in the absence and presence of 1.0 × 10⁻⁵ M isopropanol. Although it was challenging to derive reliable Tafel slopes and exchange current densities due to the absence of well-defined linear Tafel regions, Figure 7 clearly shows that increasing temperature from 20 to 40 °C significantly enhances HER rates on the Pd-modified Ni foam electrode surface. Most importantly, the introduction of isopropanol, at a concentration of 1.0 × 10⁻⁵ M at 40 °C resulted in a further facilitation of the HER kinetics, as explicitly demonstrated in Figure 8.

3.4. Behavior at Polycrystalline Pt Electrode

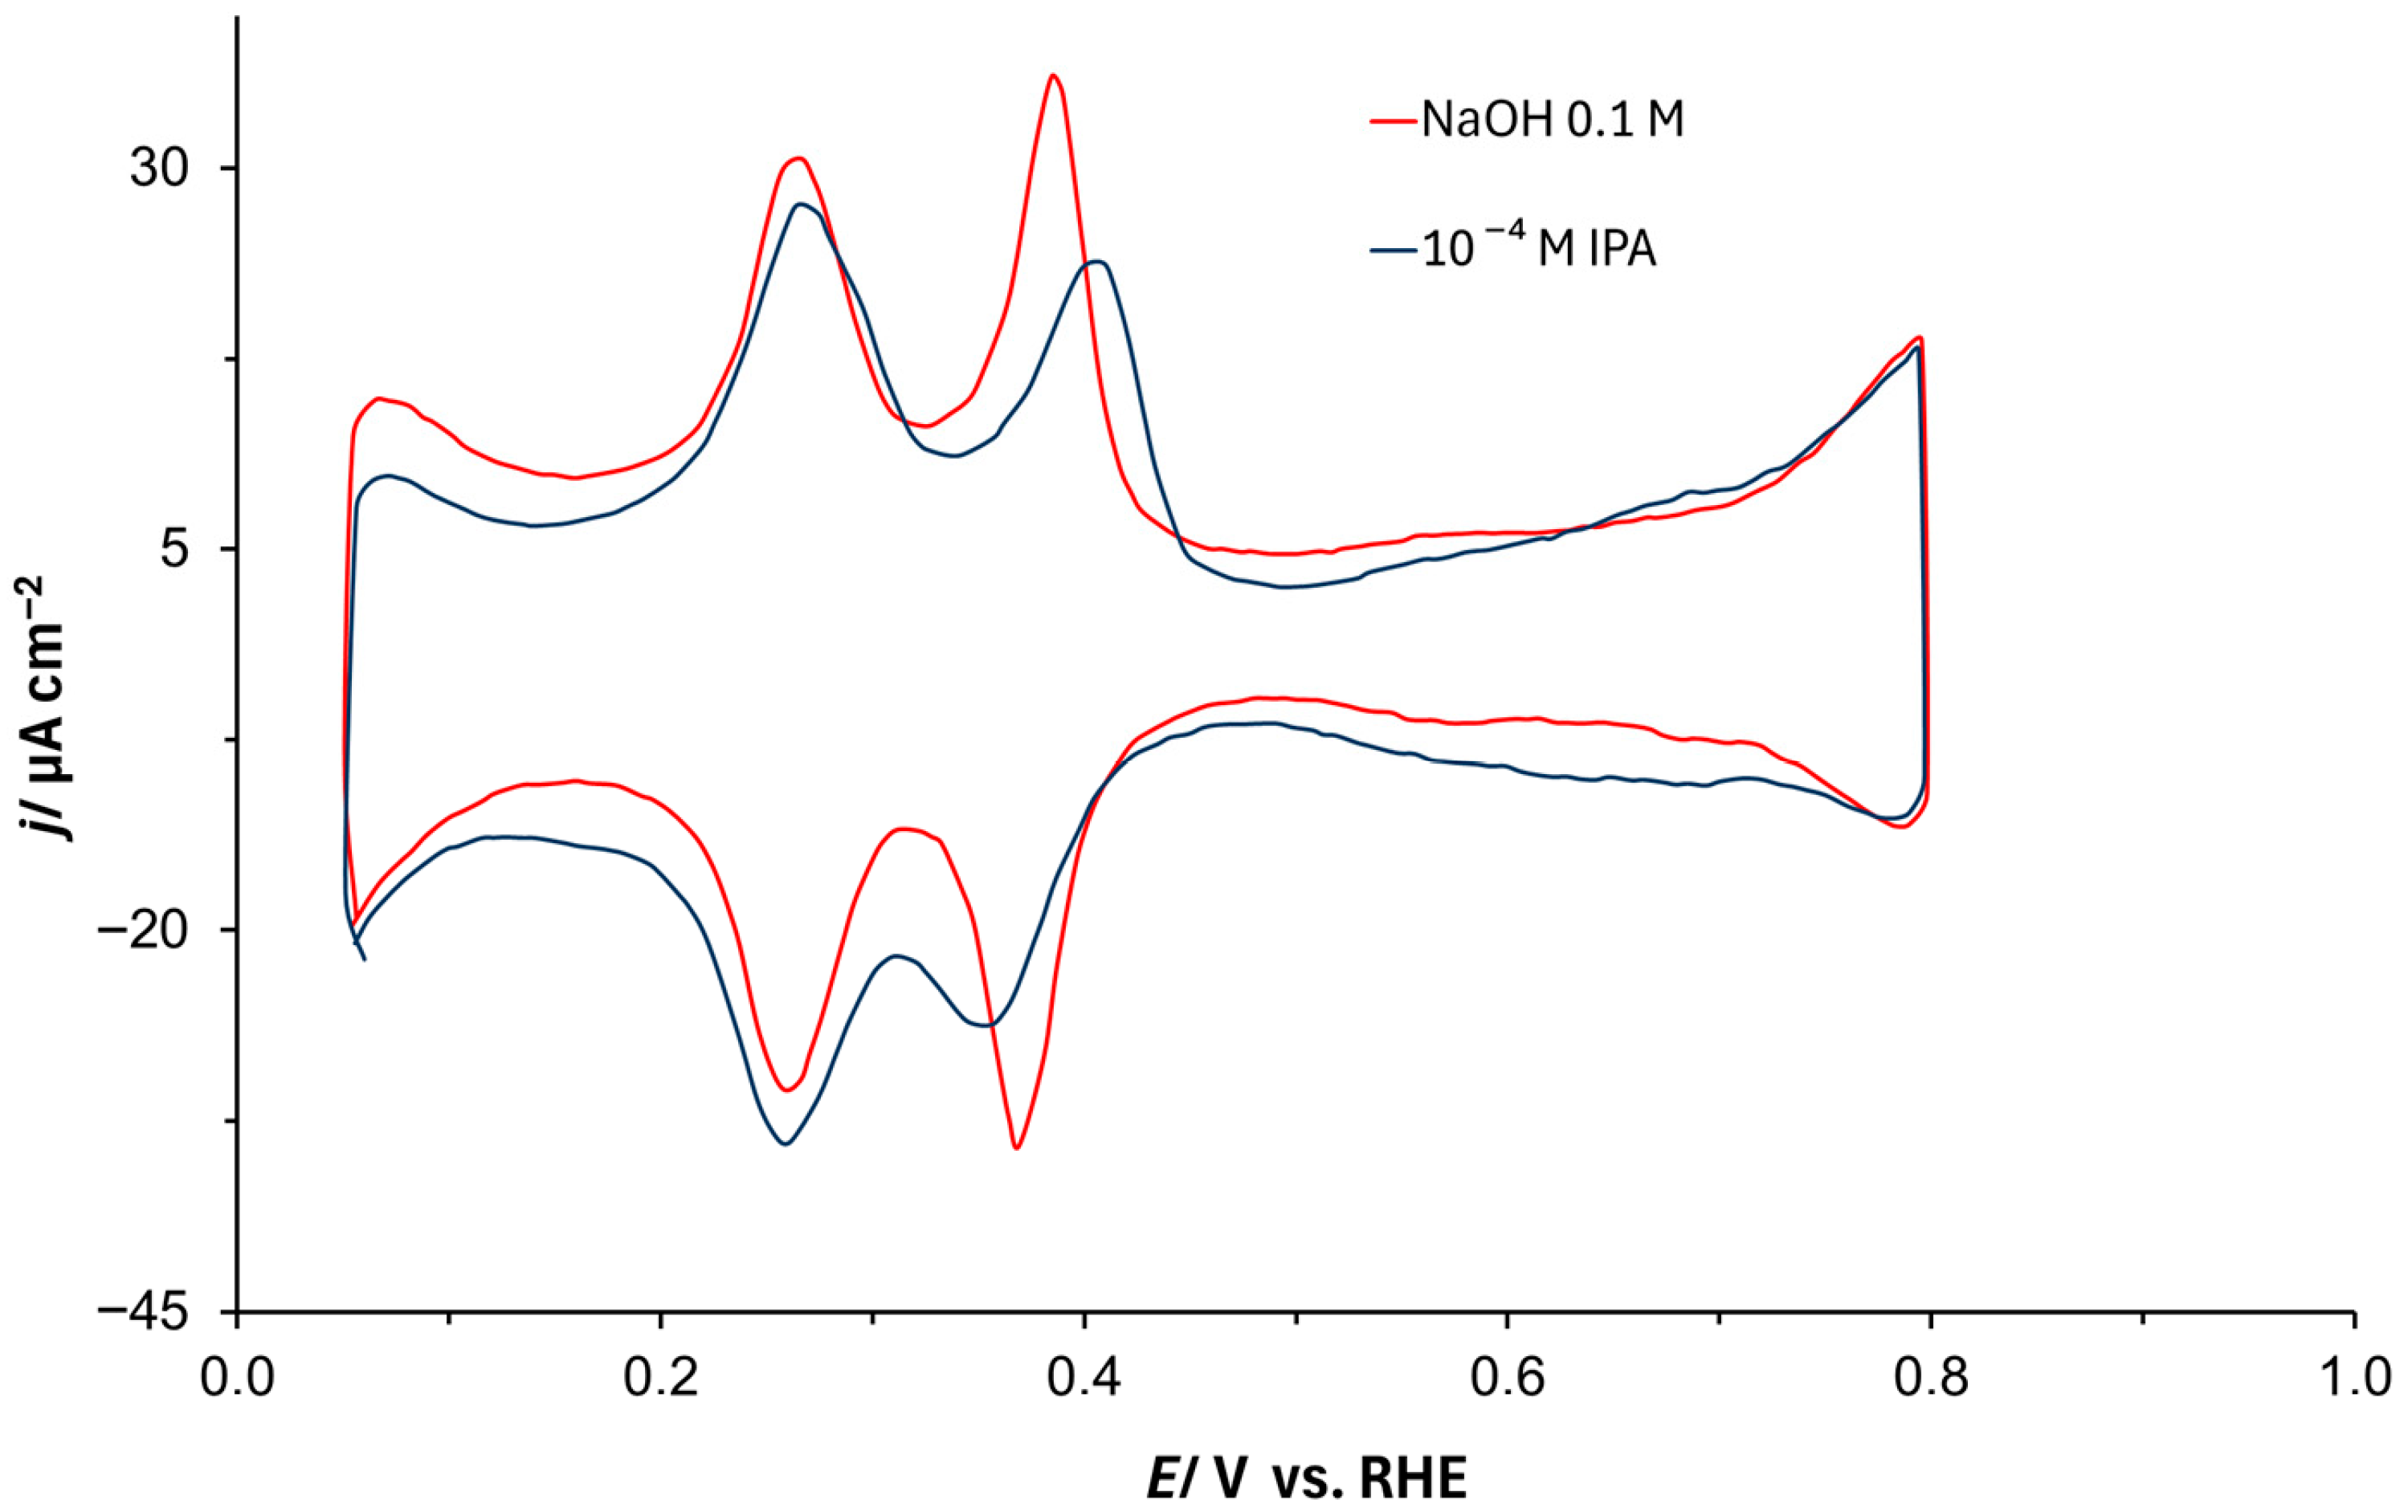
The cyclic voltammetry behavior of the polycrystalline platinum electrode in 0.1 M NaOH solution, in the absence and presence of IPA at a concentration of 1.0 × 10⁻⁴ M, is shown in Figure 9. The cyclic voltammogram recorded in the potential range characteristic of the UPDH region (0.05–0.80 V vs. RHE) exhibits two distinct adsorption states. A reversible peak centered at approximately 0.26 V can be ascribed to reversible hydrogen adsorption on the Pt(110) plane. The second, less reversible anodic peak appears at ca. 0.38 V and corresponds to hydrogen desorption on the Pt(100) plane, in reference to the cathodic hydrogen adsorption peak, centered at about 0.36 V [15]. The introduction of isopropanol at a concentration of 1.0 × 10⁻⁴ M primarily resulted in a reduction in the current-density associated with the characteristic sharp UPDH peaks, without a significant loss of voltammetric charge. This observation may indicate the absence of substantial Pt catalyst poisoning at this isopropanol concentration.
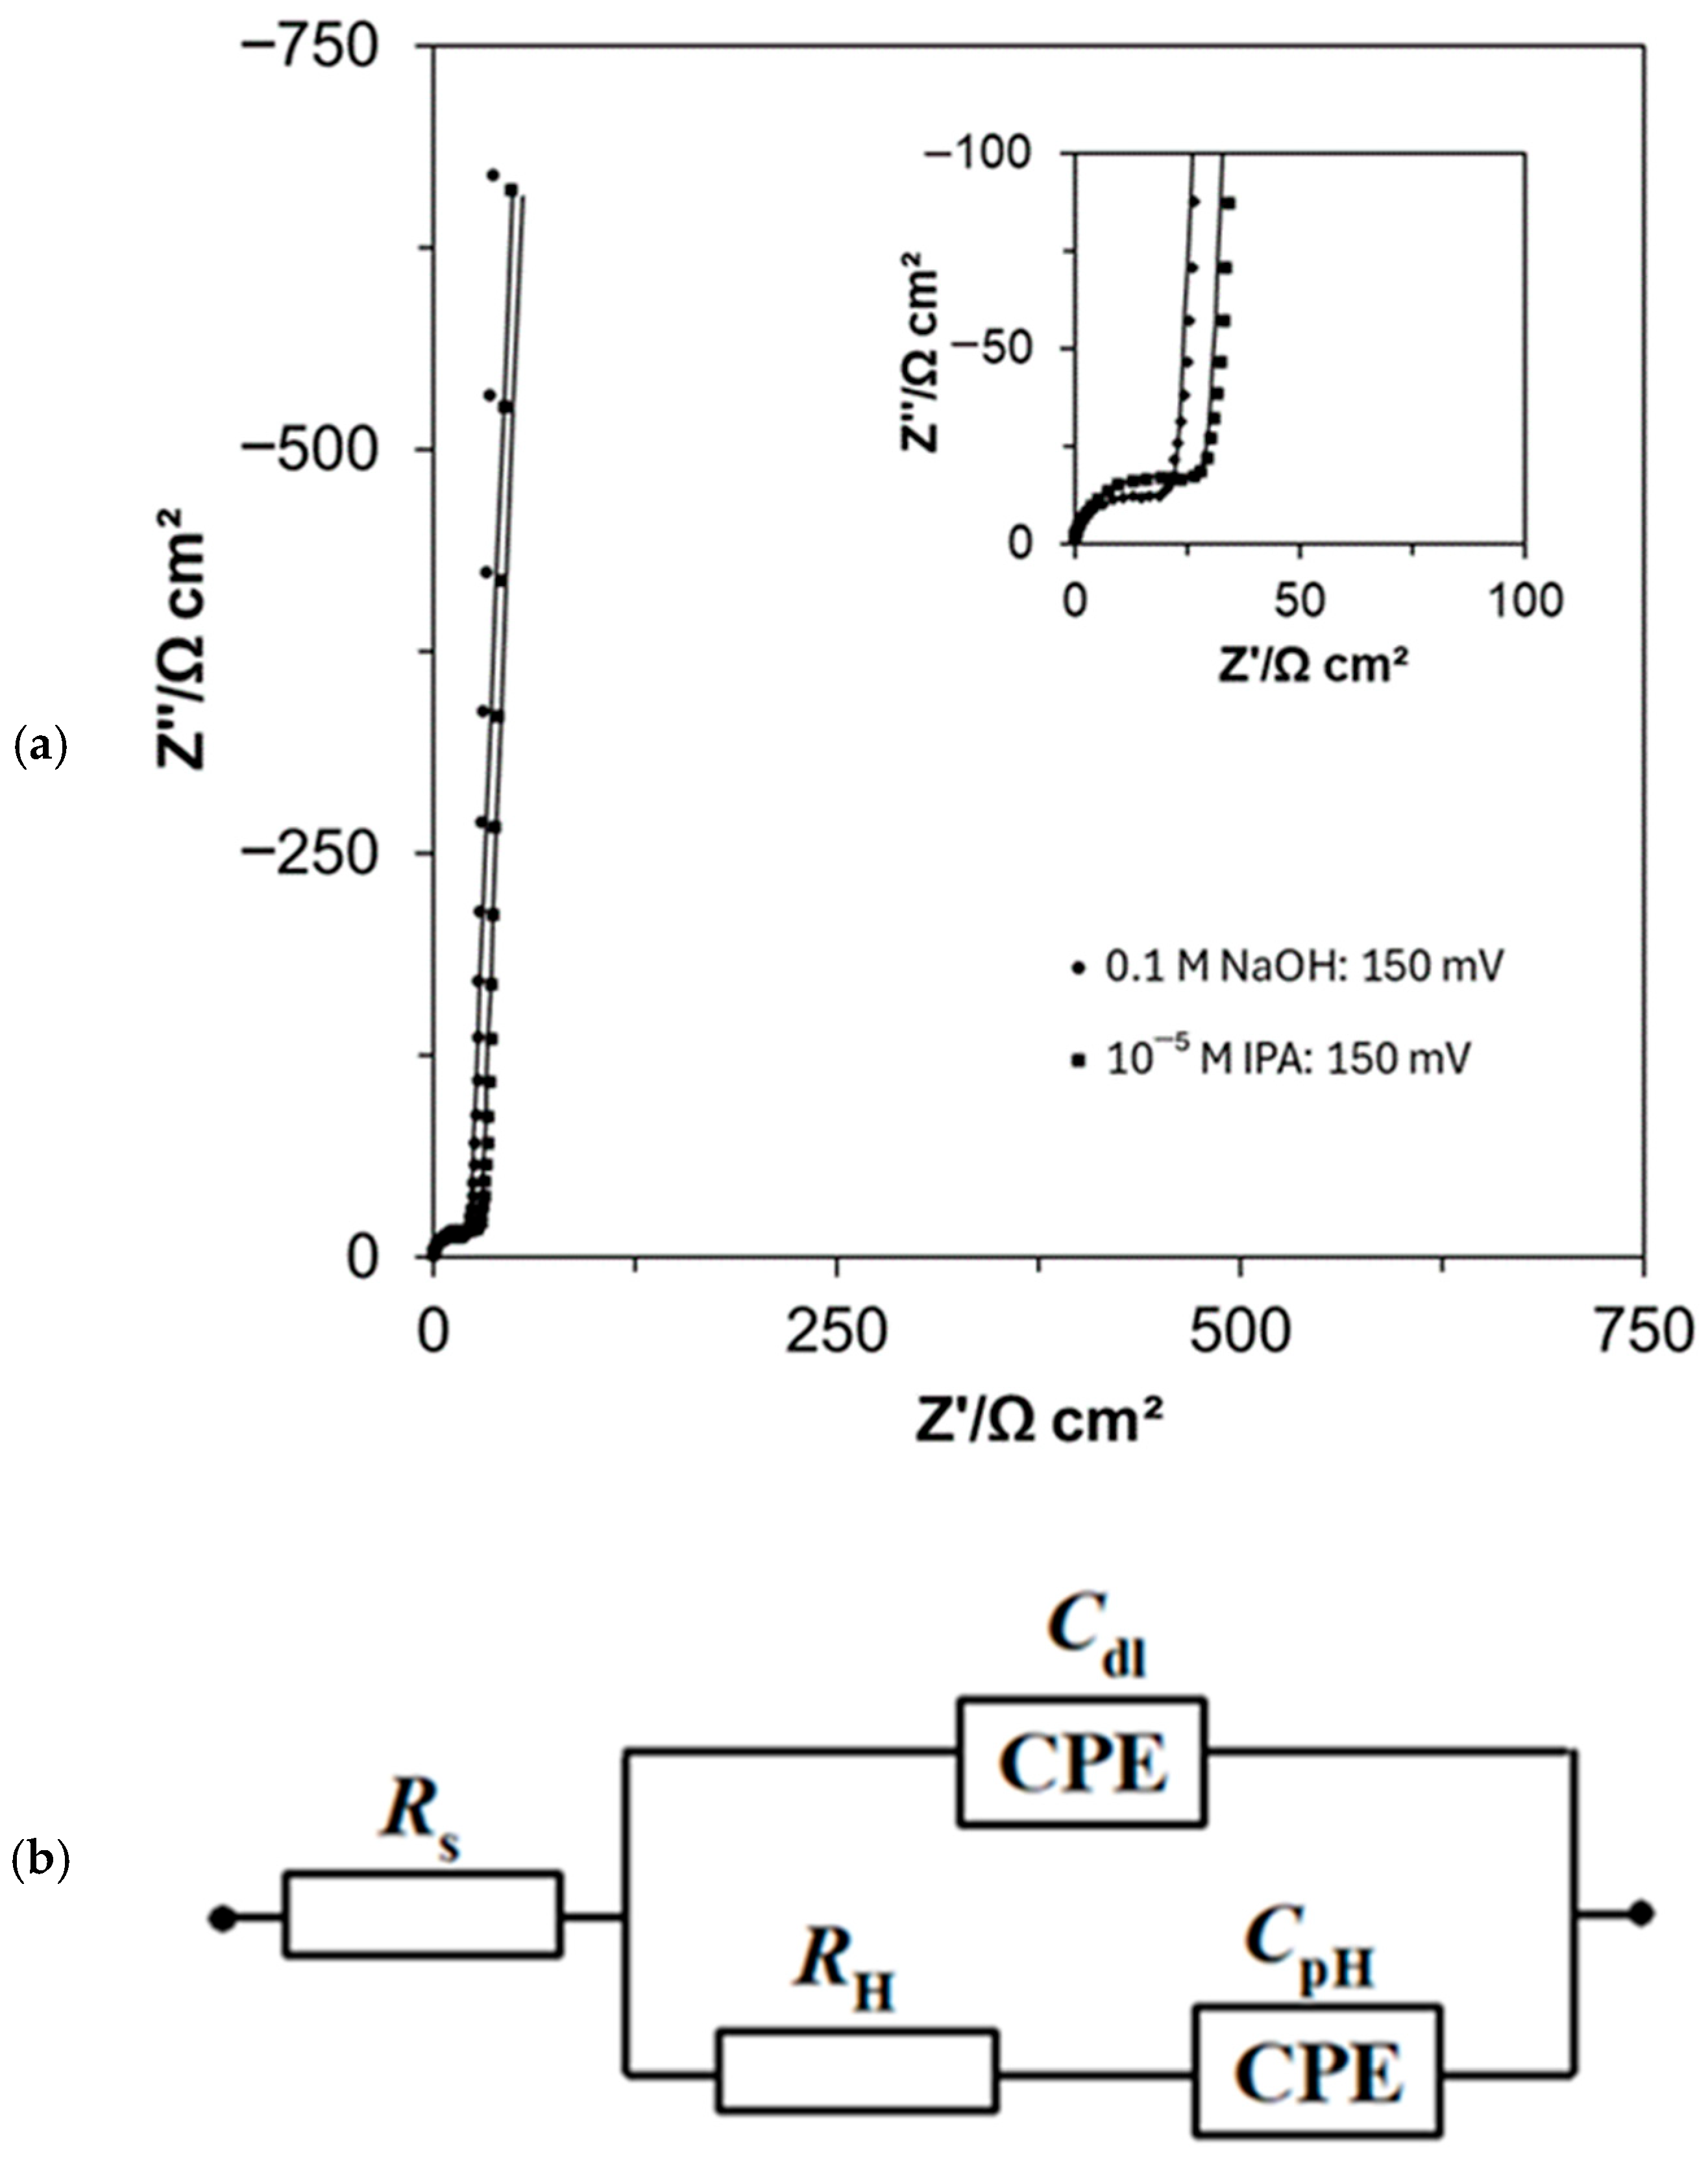
The electrochemical ac. impedance behavior of the polycrystalline platinum electrode in 0.1 M NaOH solution, in the absence and presence of isopropanol, at concentrations of 1.0 × 10⁻⁵, 1.0 × 10⁻⁴, and 1.0 × 10⁻³ M, over the potential ranges characteristic of the UPDH and HER processes, is presented in the Nyquist impedance plots (Figure 10a and Figure 11a) and summarized in Table 5 and Table 6.
The Nyquist impedance plots for the UPDH process are characterized by a semicircle observed over the high and intermediate frequency range throughout the examined potentials (50–300 mV vs. RHE), followed by a vertical line deviating from the ideal 90-degree angle. This behavior arises from capacitance dispersion effects related to electrode surface roughness and inhomogeneity (see, e.g., Ref. [25] for details). The results reported in Table 5 for UPDH kinetics in unmodified 0.1 M NaOH electrolyte are consistent with available literature data [30,31].
Thus, the Faradaic charge-transfer resistance, RH parameter, which is related to the inverse of the UPDH exchange rate, varied between 18.2 Ω cm2 at 50 mV and 63.8 Ω cm2 at 300 mV. The recorded double-layer capacitance, Cdl, parameter values ranged from 18.2 to 118.6 μF cm−2, respectively.
The introduction of isopropanol at a concentration of 1.0 × 10⁻⁵ M caused a significant increase in the RH parameter, with the recorded resistance values reaching 28.8 and 100.2 Ω cm2 at 50 and 300 mV vs. RHE, respectively. This corresponds to an approximately 1.6-fold increase in the Faradaic charge-transfer resistance, at both electrode potentials. Furthermore, the corresponding capacitance parameters (both Cdl and CpH) remained relatively consistent with those obtained in the base electrolyte. The H adsorption pseudocapacitance (CpH) directly reflects changes in the RH resistance, exhibiting a minimum value coinciding with the maximum of the RH resistance at 300 mV. On the other hand, the increase in double-layer capacitance at high electrode potentials suggests a contribution of hydrogen adsorption capacitance to the recorded Cdl values (Table 5).
Figure 10. (a) Nyquist impedance plots for the UPDH process, recorded on the polycrystalline Pt electrode surface at 150 mV vs. RHE in 0.1 M NaOH electrolyte, in the absence and presence of IPA, at the indicated concentration; (b) equivalent circuit used to fit the UPDH spectra, where CpH denotes the CPE-modified Faradaic pseudocapacitance, RH the Faradaic resistance, and Cdl the CPE-modified double-layer capacitance, connected in series with the uncompensated solution resistance Rs [32].
Crystals 16 00114 g010
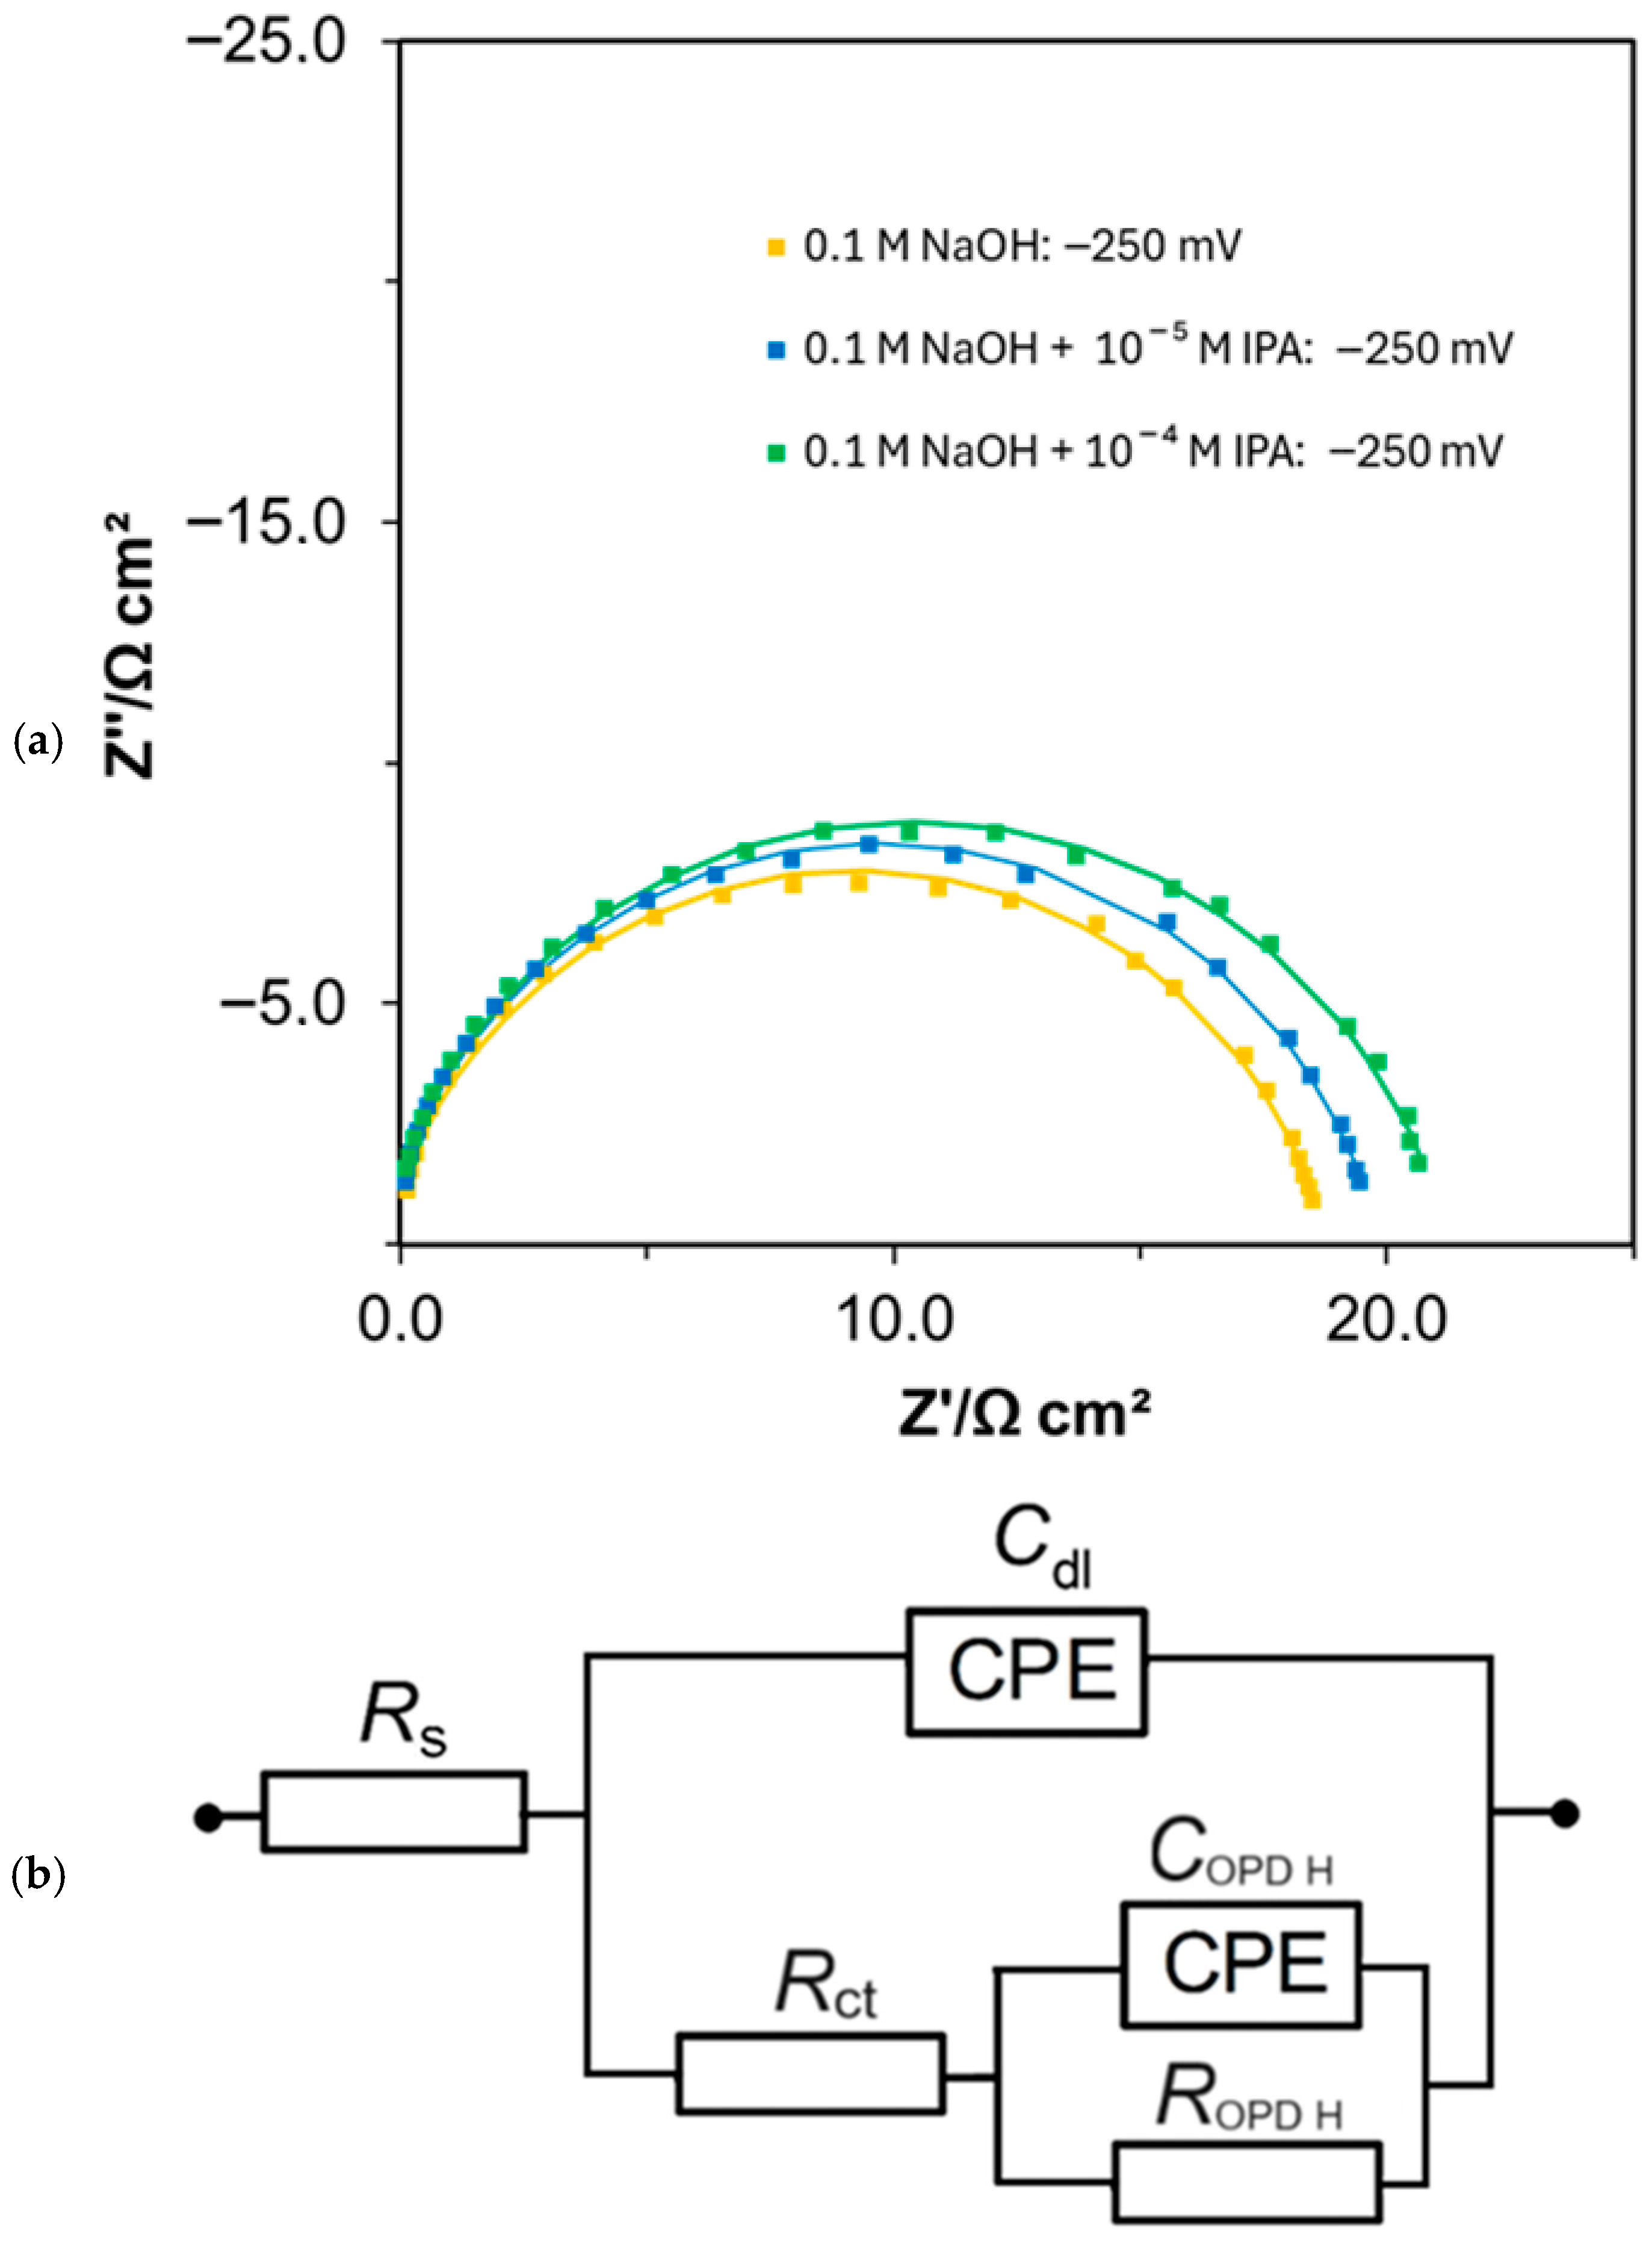
Furthermore, the HER process at the polycrystalline Pt electrode in 0.1 M NaOH, in the absence and presence of IPA, is shown in Figure 11 and Table 6. It is well-established that the HER at Pt electrode surfaces proceeds via more weakly bonded hydrogen species than those involved in the UPDH process, namely, overpotentially deposited (OPD) hydrogen. This behavior is reflected in the presence of two time constants in the Nyquist impedance plots at low overpotentials: the high-frequency response corresponds to the electron charge-transfer process (Rct), whereas the low-frequency component is attributed to modulation of OPD hydrogen coverage (θH) with electrode potential oscillation [33].
For the unmodified NaOH solution (Table 6), the recorded charge-transfer resistance, Rct values decreased from 24.2 Ω cm2 at −50 mV to 9.3 Ω cm2 at −500 mV. The corresponding double-layer capacitance, Cdl, values ranged from 17.7 to 50.3 μF cm−2. Simultaneously, the OPDH resistance parameter (ROPD H) declined from 33.8 Ω cm2 at −50 mV to 10.7 Ω cm2 at −150 mV vs. RHE, while the associated pseudocapacitance values (COPD H) remained close to 300 μF cm−2.
The introduction of isopropanol into the supporting electrolyte resulted in a gradual increase in the Rct parameter. For an IPA concentration of 1.0 × 10⁻⁴ M, the recorded Rct resistance values increased to 33.5 Ω cm2 at −50 mV and to 10.0 Ω cm2 at −500 mV. This detrimental effect corresponds to approximately 1.4-fold and 1.1-fold Rct increases, respectively, and is most likely caused by significant IPA co-adsorption on the Pt surface, particularly at low and moderate cathodic overpotentials (see also the Nyquist impedance plots presented for −250 mV in Figure 11a).
Figure 11. (a) Nyquist impedance plots for the HER recorded on the polycrystalline Pt electrode surface at −250 mV in 0.1 M NaOH, in the absence and presence of IPA at the specified concentrations; (b) Equivalent circuit analogous to that in Figure 5, additionally including a parallel combination of Faradaic pseudocapacitance, COPD H and resistance ROPD H parameters corresponding to overpotentially deposited (OPD) hydrogen species [34].
Crystals 16 00114 g011
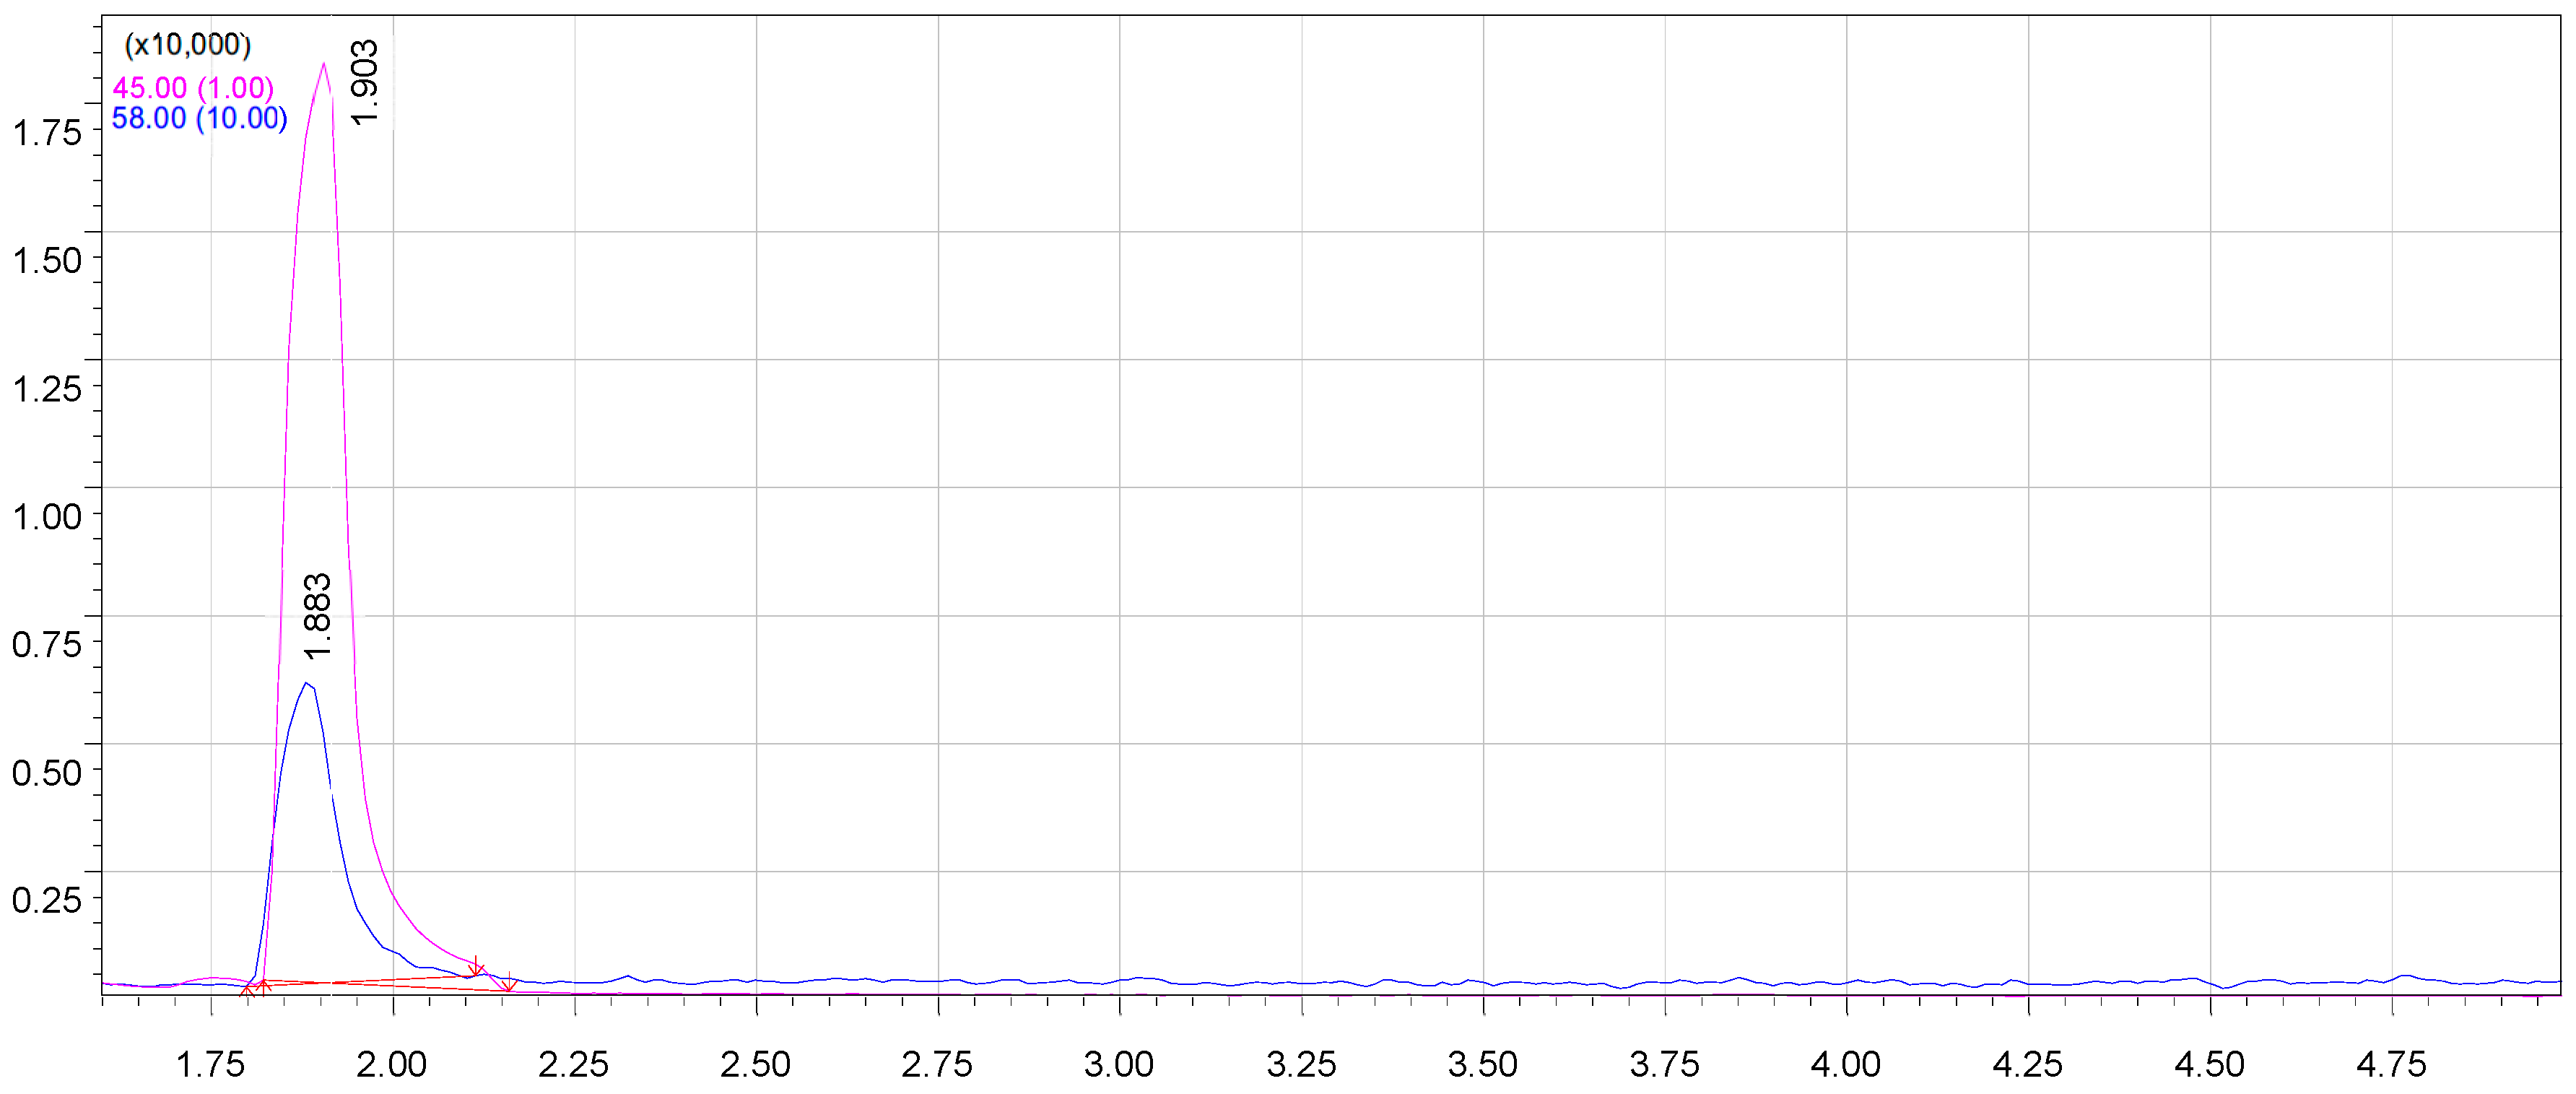
On the basis of GC-MS analysis, it can be concluded that acetone was present in the examined solution, as evidenced by the characteristic molecular ion at m/z = 58. The retention times of acetone and isopropanol were very close (1.883 vs. 1.903 min, respectively). However, the dominant ion in the mass spectrum corresponded to m/z = 45, which enabled the peaks of both compounds to be distinguished (Figure 12).

4. Conclusions

Introduction of small amounts of isopropanol (IPA) within the concentration range from 1.0 × 10⁻⁵ to 1.0 × 10⁻³ M into 0.1 M NaOH supporting electrolyte resulted in a significant facilitation of the hydrogen evolution reaction (HER) kinetics at selected nickel foam-based electrodes, as recorded over the temperature range of 20–40 °C. This effect is presumably related to the partial electrooxidation of IPA to acetone, confirmed by GC-MS analysis, occurring either during the initial cyclic voltammetry activation cycles or continuously at the Pt counter electrode. The produced ketone is believed to reduce the surface tension during the HER, thereby promoting more efficient hydrogen bubble detachment from the electrode surface [31]. Most importantly, isopropanol (with the exception of the highest examined concentration) was found not to undergo significant electrosorption on the Ni foam or the Pd-activated nickel foam catalyst surface, which could otherwise appreciably inhibit the HER through surface site blocking. On the contrary, the presence of IPA in the electrolyte caused a detrimental effect on the kinetics of both the HERand UPDH processes at the polycrystalline Pt electrode, which is well-known for being highly HER active, but also particularly susceptible to surface contamination and catalyst poisoning effects.
The obtained results suggest that simple organic molecules, such as isopropanol, may find potential industrial applications in enhancing the efficiency of alkaline water electrolysis. However, in order to fully understand the mechanistic role of IPA in the HER promotion, further investigations are required, including long-term stability studies and systematic temperature-dependent measurements. Future research activities should also explore the use of other technologically relevant catalyst materials, particularly those based on nickel nanoparticles and nickel-based alloys, which are widely employed in industrial alkaline water electrolysis systems.

Author Contributions

B.P. was a scientific initiator and work coordinator who wrote this manuscript; W.A. ran the experiments under the supervision of B.P. and carried out treatment of all the results; T.M. partly ran the experiments and helped with evaluation of the final version of this manuscript; K.W. ran and performed treatment of the GC-MS experiments. All authors have read and agreed to the published version of the manuscript.

Funding

This work has primarily been financed by the internal research grant no. 30.610.001-110, provided by The University of Warmia and Mazury in Olsztyn.

Data Availability Statement

Data supporting reported results will be available upon request.

Conflicts of Interest

The authors declare no conflicts of interest.

References

  1. Xu, X.; Shao, Z.; Jiang, S.P. High-Entropy Materials for Water Electrolysis. Energy Technol. 2022, 10, 2200573. [Google Scholar] [CrossRef]
  2. Pierozynski, B.; Mikolajczyk, T.; Kowalski, I.M. Hydrogen evolution at catalytically-modified nickel foam in alkaline solution. J. Power Sources 2014, 271, 231–238. [Google Scholar] [CrossRef]
  3. Becker, H.; Murawski, J.; Shinde, D.V.; Stephens, I.E.L.; Hinds, G.; Smith, G. Impact of Impurities on Water Electrolysis: A Review. Sustain. Energy Fuels 2023, 7, 1565–1603. [Google Scholar] [CrossRef]
  4. Barwe, S.; Mei, B.; Masa, J.; Schuhmann, W.; Ventosa, E. Overcoming Cathode Poisoning from Electrolyte Impurities in Alkaline Electrolysis by Means of Self-Healing Electrocatalyst Films. Nano Energy 2018, 53, 763–768. [Google Scholar] [CrossRef]
  5. Wang, H.; Xu, Z.; Lin, W.; Yang, X.; Gu, X.; Zhu, W.; Zhuang, Z. Improving the Water Electrolysis Performance by Manipulating the Generated Nano/Micro-Bubbles Using Surfactants. Nano Res. 2023, 16, 420–426. [Google Scholar] [CrossRef]
  6. Swiegers, G.F.; Terrett, R.N.L.; Tsekouras, G.; Tsuzuki, T.; Pace, R.J.; Stranger, R. The Prospects of Developing a Highly Energy-Efficient Water Electrolyser by Eliminating or Mitigating Bubble Effects. Sustain. Energy Fuels 2021, 5, 1280–1310. [Google Scholar] [CrossRef]
  7. Park, S.; Lohse, D.; Krug, D.; Koper, M.T.M. Electrolyte Design for the Manipulation of Gas Bubble Detachment during Hydrogen Evolution Reaction. Electrochim. Acta 2024, 485, 144084. [Google Scholar] [CrossRef]
  8. Deng, L.; Jin, L.; Yang, L.; Feng, C.; Tao, A.; Jia, X.; Geng, Z.; Zhang, C.; Cui, X.; Shi, J. Bubble Evolution Dynamics in Alkaline Water Electrolysis. eScience 2025, 5, 100353. [Google Scholar] [CrossRef]
  9. Vigier, F.; Coutanceau, C.; Hahn, F.; Belgsir, E.M.; Lamy, C. On the Mechanism of Ethanol Electro-oxidation on Pt and PtSn Catalysts: Electrochemical and in situ IR Reflectance Spectroscopy Studies. J. Electroanal. Chem. 2004, 563, 81–89. [Google Scholar] [CrossRef]
  10. Rizo, R.; Ferre-Vilaplana, A.; Herrero, E.; Feliu, J.M. Ethanol Electro-oxidation Reaction Selectivity on Platinum in Aqueous Media. ACS Sustain. Chem. Eng. 2023, 11, 4960–4968. [Google Scholar] [CrossRef]
  11. Mekazni, D.S.; Arán-Ais, R.M.; Feliu, J.M.; Herrero, E. Understanding the Electrochemical Hydrogenation of Acetone on Pt Single Crystal Electrodes. J. Electroanal. Chem. 2022, 922, 116697. [Google Scholar] [CrossRef]
  12. Bondue, C.J.; Calle-Vallejo, F.; Figueiredo, M.C.; Koper, M.T.M. Structural Principles to Steer the Selectivity of the Electrocatalytic Reduction of Aliphatic Ketones on Platinum. Nat. Catal. 2019, 2, 243–250. [Google Scholar] [CrossRef]
  13. Howard, K.S.; McAllister, R.A. Surface Tension of Acetone-water Solutions Up to Their Normal Boiling Points. AIChE J. 1957, 3, 325–329. [Google Scholar] [CrossRef]
  14. Wu, N.; Li, X.; Liu, S.; Zhang, M.; Ouyang, S. Effect of Hydrogen Bonding on the Surface Tension Properties of Binary Mixture (Acetone-Water) by Raman Spectroscopy. Appl. Sci. 2019, 9, 1235. [Google Scholar] [CrossRef]
  15. Kuczyński, M.; Łuba, M.; Mikołajczyk, T.; Pierożyński, B. The Influence of Resorcinol on the Kinetics of Underpotentially Deposited Hydrogen, Cathodic Hydrogen and Anodic Oxygen Evolution Reactions, Examined at Polycrystalline Pt Electrode in 0.1 M NaOH Solution. Int. J. Hydrogen Energy 2023, 48, 10755–10764. [Google Scholar] [CrossRef]
  16. Pierożyński, B.; Kuczyński, M.; Mikołajczyk, T. Electro-Reactivity of Resorcinol on Pt(111) Single-Crystal Plane and Its Influence on the Kinetics of Underpotentially Deposited Hydrogen and Hydrogen Evolution Reaction Processes in 0.1 M NaOH Solution. Crystals 2024, 14, 545. [Google Scholar] [CrossRef]
  17. Macdonald, J.R. Impedance Spectroscopy, Emphasizing Solid Materials and Systems; John Wiley & Sons: New York, NY, USA, 1987; pp. 1–368. [Google Scholar]
  18. Van Drunen, J.; Napporn, T.W.; Kokoh, B.; Jerkiewicz, G. Electrochemical oxidation of isopropanol using a nickel foam electrode. J. Electroanal. Chem. 2014, 716, 120–128. [Google Scholar] [CrossRef]
  19. Henning, S.; Herranz, J.; Gasteiger, H.A. Bulk-palladium and palladium-on-gold electrocatalysts for the oxidation of hydrogen in alkaline electrolyte. J. Electrochem. Soc. 2015, 162, F178–F189. [Google Scholar] [CrossRef]
  20. Pierozynski, B.; Morin, S.; Conway, B.E. Influence of adsorption of guanidonium cations on H upd at Pt(hkl) surfaces: Lattice-specific anion-mimetic effects. J. Electroanal. Chem. 1999, 7, 30–42. [Google Scholar] [CrossRef]
  21. Verlato, E.; Cattarin, S.; Comisso, N.; Gambirasi, A.; Musiani, M.; Vazquez-Gomez, L. Preparation of Pd-modified Ni foam electrodes and their use as anodes for the oxidation of alcohols in basic media. Electrocatalysis 2012, 3, 48–58. [Google Scholar] [CrossRef]
  22. Santasalo-Aarnio, A.; Kwon, Y.; Ahlberg, E.; Kontturi, K.; Kallio, T.; Koper, M.T.M. Comparison of methanol, ethanol and iso-propanol oxidation on Pt and Pd electrodes in alkaline media studied by HPLC. Electrochem. Commun. 2011, 13, 466–469. [Google Scholar] [CrossRef]
  23. Venus, D.; Marth, A.; Riess, S.; Freiberg, A.T.S.; Brodt, M.; Wensing, M.; Wasserscheid, P.; Thiele, S. The Electrochemical Acetone/Isopropanol Hydrogenation Cycle—An Alternative to Current Hydrogen Storage Solutions. Adv. Energy Mater. 2025, 15, 2403824. [Google Scholar] [CrossRef]
  24. Van Lieshout, F.; Castaneda-Morales, E.; Manzo-Robledo, A.; Morales, D.M. Electrooxidation of alcohols under the operating conditions of industrial alkaline water electrolysis. Ind. Chem. Mater. 2026, 4, 7–32. [Google Scholar] [CrossRef]
  25. Pajkossy, T. Impedance of rough capacitive electrodes. J. Electroanal. Chem. 1994, 364, 111–125. [Google Scholar] [CrossRef]
  26. Conway, B.E.; Pierozynski, B. A.c. impedance behaviour of processes involving adsorption and reactivity of guanidonium–type cations at Pt(100) surface. J. Electroanal. Chem. 2008, 622, 10–14. [Google Scholar] [CrossRef]
  27. Rami, A.; Lasia, A. Kinetics of hydrogen evolution on Ni-Al alloy electrodes. J. Appl. Electrochem. 1992, 22, 376–382. [Google Scholar] [CrossRef]
  28. Chen, L.; Lasia, A. Study of the Kinetics of Hydrogen Evolution Reaction on Nickel-Zinc Alloy Electrodes. J. Electrochem. Soc. 1991, 138, 3321. [Google Scholar] [CrossRef]
  29. Pierozynski, B.; Mikolajczyk, T. On the Temperature Dependence of Hydrogen Evolution Reaction at Nickel Foam and Pd-Modified Nickel Foam Catalysts. Electrocatalysis 2015, 6, 51–59. [Google Scholar] [CrossRef]
  30. Mikolajczyk, T.; Luba, M.; Pierozynski, B.; Smoczynski, L. A Detrimental Effect of Acetonitrile on the Kinetics of Underpotentially Deposited Hydrogen and Hydrogen Evolution Reaction, Examined on Pt Electrode in H2SO4 and NaOH Solutions. Catalysts 2020, 10, 625. [Google Scholar] [CrossRef]
  31. Adamicka, A.; Mikołajczyk, T.; Kuczyński, M.; Pierożyński, B. The influence of acetone on the kinetics of water electrolysis examined at polycrystalline Pt electrode in alkaline solution. Catalysts 2024, 14, 488. [Google Scholar] [CrossRef]
  32. Schouten, K.J.P.; Van der Niet, M.J.T.C.; Koper, M.T.M. Impedance spectroscopy of H and OH adsorption on stepped single-crystal platinum electrodes in alkaline and acidic media. Phys. Chem. Chem. Phys. 2010, 12, 15217–15224. [Google Scholar] [CrossRef] [PubMed]
  33. Barber, J.; Morin, S.; Conway, B.E. Specificity of the kinetics of H2 evolution to the structure of single-crystal Pt surfaces, and the relation between opd and upd H. J. Electroanal. Chem. 1998, 446, 125–138. [Google Scholar] [CrossRef]
  34. Conway, B.E.; Barber, J.; Morin, S. Comparative evaluation of surface structure specificity of kinetics of UPD and OPD of H at single-crystal Pt electrodes. Electrochim. Acta 1998, 44, 1109–1125. [Google Scholar] [CrossRef]
Figure 1. Cyclic voltammograms recorded at the nickel foam electrode surface (second cycle, room temperature), collected in unmodified 0.1 M NaOH electrolyte and in the presence of IPA at concentrations of 1.0 × 10⁻⁵, 1.0 × 10⁻⁴, and 1.0 × 10⁻³ M.
Crystals 16 00114 g001
Figure 2. Cyclic voltammograms recorded at the Pd-activated nickel foam electrode surface (second cycle, room temperature), collected in unmodified 0.1 M NaOH electrolyte and in the presence of IPA, at concentrations of 1.0 × 10⁻⁵ and 1.0 × 10⁻³ M.
Crystals 16 00114 g002
Figure 3. Nyquist impedance plots for the HER recorded on the Ni foam electrode surface at −200 mV in 0.1 M NaOH, in the absence and presence of IPA, at the specified concentrations.
Crystals 16 00114 g003
Figure 4. Nyquist impedance plots for the HER recorded on the Pd-activated Ni foam electrode surface at −200 mV in 0.1 M NaOH, in the absence and presence of IPA, at the specified concentrations.
Crystals 16 00114 g004
Figure 6. Linear Arrhenius plots of −log Rct vs. T−1 for the HER, carried out at the Pd-activated Ni foam electrode in 0.1 M NaOH solution, in the absence and presence of 1.0 × 10⁻⁴ M IPA, at the indicated overpotentials.
Crystals 16 00114 g006
Figure 7. Temperature-dependent quasi-potentiostatic cathodic polarization curves (recorded at 0.5 mV s−1) for the HER on the Pd-activated Ni foam electrode surface in 0.1 M NaOH solution at 20, 30, and 40 °C.
Crystals 16 00114 g007
Figure 8. Quasi-potentiostatic cathodic polarization curves (recorded at 0.5 mV s−1) for the HER on the Pd-activated Ni foam electrode surface in 0.1 M NaOH solution at 40 °C, recorded in the absence and presence of IPA at the indicated concentration.
Crystals 16 00114 g008
Figure 9. Cyclic voltammograms recorded at the polycrystalline Pt electrode surface (second cycle, room temperature) in IPA-free 0.1 M NaOH electrolyte and in the presence of 1.0 × 10⁻⁴ M IPA.
Crystals 16 00114 g009
Figure 12. Chromatogram of the electrolysed test solution (0.1 M NaOH + 1.0 × 10⁻⁴ M IPA). The pink and blue lines correspond to m/z = 45 and 58, representing isopropanol and acetone, respectively. The acetone peak was rescaled by a factor of 10 for improved visibility. The X and Y axes represent retention time (min) and detector signal intensity (proportional to the concentration of present chemicals, correspondingly.
Crystals 16 00114 g012
Table 1. Charge-transfer resistance and double-layer capacitance parameters for the HER on the Ni foam electrode surface in 0.1 M NaOH solution, recorded in the absence and presence of IPA at the indicated concentrations. The values were obtained by fitting the equivalent circuit (Figure 5) to the recorded impedance data (the dimensionless φ parameter of the CPE fluctuated around 0.73; χ2 = 1 × 10⁻⁵–9 × 10⁻⁴).
E/mVRct/Ω gCdl/µF·g−1
0.1 M NaOH
−5013.69 ± 0.4415,716 ± 557
−1003.35 ± 0.0422,791 ± 704
−1501.87 ± 0.0217,060 ± 611
−2001.03 ± 0.0112,012 ± 706
−2500.65 ± 0.0111,041 ± 766
−3000.44 ± 0.019715 ± 787
−3500.33 ± 0.0110,971 ± 1505
−4000.25 ± 0.009484 ± 845
0.1 M NaOH + 10−5 M IPA
−506.26 ± 0.1519,636 ± 791
−1002.53 ± 0.0423,129 ± 957
−1501.29 ± 0.0116,146 ± 854
−2000.78 ± 0.0113,318 ± 652
−2500.55 ± 0.0112,181 ± 1052
−3000.42 ± 0.0110,281 ± 841
−3500.34 ± 0.018701 ± 1294
−4000.29 ± 0.0010,866 ± 973
0.1 M NaOH + 10−4 M IPA
−505.14 ± 0.1427,334 ± 1268
−1002.35 ± 0.0426,046 ± 1336
−1501.12 ± 0.0219,036 ± 1591
−2000.66 ± 0.0113,861 ± 758
−2500.47 ± 0.0111,852 ± 832
−3000.37 ± 0.0010,913 ± 808
−3500.32 ± 0.0111,840 ± 1207
−4000.27 ± 0.0010,439 ± 982
0.1 M NaOH + 10−3 M IPA
−507.61 ± 0.2215,094 ± 808
−1002.48 ± 0.0427,381 ± 1319
−1501.02 ± 0.0117,774 ± 1101
−2000.58 ± 0.0113,032 ± 762
−2500.46 ± 0.0113,041 ± 1148
−3000.37 ± 0.0111,601 ± 971
−3500.32 ± 0.0110,198 ± 1074
−4000.29 ± 0.0111,844 ± 1496
Table 2. Charge-transfer resistance and double-layer capacitance parameters for the HER on the Pd-activated Ni foam electrode surface in 0.1 M NaOH solution, recorded in the absence and presence of IPA at the indicated concentrations. The values were obtained by fitting the equivalent circuit (Figure 5) to the recorded impedance data (the dimensionless φ parameter of the CPE fluctuated around 0.84; χ2 = 6 × 10⁻⁶–7 × 10⁻⁵).
E/mVRct/Ω gCdl/µF·g−1
0.1 M NaOH
−501.27 ± 0.0145,852 ± 1387
−1001.18 ± 0.0144,981 ± 1405
−1501.01 ± 0.0242,682 ± 2010
−2000.86 ± 0.0142,475 ± 1037
−2500.72 ± 0.0141,562 ± 1171
−3000.61 ± 0.0040,498 ± 1126
−3500.54 ± 0.0145,397 ± 3200
−4000.46 ± 0.0042,114 ± 1367
−4500.40 ± 0.0041,768 ± 1741
−5000.36 ± 0.0046,172 ± 2641
0.1 M NaOH + 10−5 M IPA
−500.68 ± 0.0139,881 ± 2084
−1000.66 ± 0.0143,771 ± 1788
−1500.65 ± 0.0140,555 ± 2563
−2000.64 ± 0.0043,191 ± 1050
−2500.58 ± 0.0043,301 ± 1159
−3000.52 ± 0.0142,043 ± 2236
−3500.46 ± 0.0042,063 ± 1430
−4000.41 ± 0.0043,146 ± 1572
−4500.38 ± 0.0149,912 ± 4467
−5000.33 ± 0.0042,675 ± 2406
0.1 M NaOH + 10−4 M IPA
−500.98 ± 0.0144,029 ± 969
−1000.93 ± 0.0144,166 ± 1373
−1500.83 ± 0.0141,461 ± 1123
−2000.73 ± 0.0141,338 ± 1168
−2500.63 ± 0.0139,464 ± 1996
−3000.57 ± 0.0042,261 ± 1204
−3500.49 ± 0.0039,622 ± 1651
−4000.43 ± 0.0041,620 ± 1319
−4500.38 ± 0.0043,095 ± 1519
−5000.34 ± 0.0042,542 ± 1662
0.1 M NaOH + 10−3 M IPA
−501.00 ± 0.0150,448 ± 2007
−1000.99 ± 0.0148,767 ± 1054
−1500.90 ± 0.0147,874 ± 1150
−2000.79 ± 0.0146,702 ± 1180
−2500.68 ± 0.0146,252 ± 1394
−3000.57 ± 0.0046,651 ± 1484
−3500.49 ± 0.0048,048 ± 1854
−4000.42 ± 0.0045,805 ± 1732
−4500.36 ± 0.0047,394 ± 2216
−5000.31 ± 0.0148,851 ± 3858
Table 3. Charge-transfer resistance and double-layer capacitance parameters for the temperature-dependent HER on the Pd-activated Ni foam electrode surface in 0.1 M NaOH solution. The values were obtained by fitting the equivalent circuit (Figure 5) to the recorded impedance data (the dimensionless φ parameter of the CPE fluctuated around 0.84; χ2 = 5 × 10⁻⁶–3 × 10⁻⁵).
E/mVRct/Ω g
20 °C25 °C30 °C35 °C40 °C
−501.58 ± 0.010.91 ± 0.010.75 ± 0.010.65 ± 0.010.58 ± 0.00
−1001.41 ± 0.010.92 ± 0.010.71 ± 0.010.64 ± 0.000.58 ± 0.01
−1501.22 ± 0.010.91 ± 0.010.73 ± 0.010.63 ± 0.000.56 ± 0.00
−2001.06 ± 0.010.85 ± 0.010.70 ± 0.010.60 ± 0.000.54 ± 0.00
−2500.92 ± 0.010.78 ± 0.010.63 ± 0.000.54 ± 0.000.51 ± 0.00
−3000.80 ± 0.010.68 ± 0.000.54 ± 0.000.47 ± 0.000.44 ± 0.00
−3500.69 ± 0.010.61 ± 0.000.48 ± 0.000.40 ± 0.000.39 ± 0.00
−4000.61 ± 0.000.52 ± 0.000.40 ± 0.000.35 ± 0.000.34 ± 0.00
−4500.53 ± 0.000.46 ± 0.000.35 ± 0.000.30 ± 0.000.29 ± 0.00
−5000.46 ± 0.000.42 ± 0.000.30 ± 0.000.27 ± 0.000.26 ± 0.00
Cdl/µF g−1
−5049,475 ± 114258,458 ± 231035,793 ± 138351,736 ± 149353,096 ± 1533
−10043,351 ± 98451,689 ± 126638,698 ± 130547,306 ± 102650,930 ± 1589
−15041,067 ± 91350,458 ± 108840,070 ± 117746,423 ± 140348,185 ± 1370
−20040,102 ± 93749,683 ± 119441,343 ± 120945,336 ± 102247,657 ± 1222
−25039,432 ± 102746,644 ± 135341,436 ± 106442,856 ± 102745,932 ± 1725
−30038,785 ± 110444,854 ± 121339,046 ± 127143,816 ± 123745,501 ± 1576
−35038,691 ± 111944,819 ± 140241,542 ± 145841,485 ± 147342,452 ± 1686
−40039,917 ± 131142,662 ± 164142,307 ± 140842,111 ± 136346,838 ± 2659
−45037,808 ± 143443,559 ± 142244,557 ± 188941,685 ± 158741,643 ± 1670
−50040,176 ± 163146,684 ± 201942,040 ± 189345,586 ± 194845,214 ± 1876
Table 4. Charge-transfer resistance and double-layer capacitance parameters for the temperature-dependent HER on the Pd-activated Ni foam electrode surface in 0.1 M NaOH solution, recorded in the presence of IPA at a concentration of 1.0 × 10⁻⁵ M. The values were obtained by fitting the equivalent circuit (Figure 5) to the recorded impedance data (the dimensionless φ parameter of the CPE fluctuated around 0.81; χ2 = 6 × 10⁻⁶–5 × 10⁻⁵).
E/mVRct/Ω g
30 °C35 °C40 °C
−500.82 ± 0.010.71 ± 0.010.52 ± 0.00
−1000.80 ± 0.010.70 ± 0.010.52 ± 0.00
−1500.74 ± 0.010.64 ± 0.000.47 ± 0.00
−2000.65 ± 0.000.56 ± 0.000.49 ± 0.00
−2500.56 ± 0.000.49 ± 0.000.44 ± 0.00
−3000.46 ± 0.000.41 ± 0.000.37 ± 0.00
−3500.38 ± 0.000.35 ± 0.000.31 ± 0.00
−4000.31 ± 0.000.30 ± 0.000.27 ± 0.00
Cdl/µF g−1
−5051,098 ± 136256,493 ± 143948,673 ± 1944
−10051,466 ± 159956,939 ± 140545,886 ± 1145
−15048,434 ± 129251,303 ± 139144,142 ± 1312
−20043,667 ± 99947,774 ± 141342,126 ± 1173
−25043,207 ± 125546,886 ± 152644,362 ± 1589
−30038,821 ± 119544,583 ± 152042,131 ± 1670
−35042,019 ± 122043,477 ± 195339,773 ± 1234
−40040,451 ± 175244,694 ± 130644,653 ± 1720
Table 5. Charge-transfer resistance and capacitance parameters for the UPDH process on the polycrystalline Pt electrode surface in 0.1 M NaOH solution, recorded in the absence and presence of IPA at the indicated concentration. The values were obtained by fitting the equivalent circuit (Figure 10b) to the recorded impedance data (the dimensionless φ parameters for the CPEs fluctuated between 0.94 and 0.96; χ2 = 2 × 10⁻⁵–3 × 10⁻⁴).
E/mVRH/Ω cm2Cdl/µF cm−2CpH/µF cm−2
0.1 M NaOH
5018.2 ± 0.518.2 ± 3.6380.3 ± 6.4
10027.4 ± 0.529.5 ± 2.8222.2 ± 3.2
15037.6 ± 0.831.9 ± 3.0156.2 ± 3.2
20043.9 ± 0.631.9 ± 1.8162.2 ± 2.1
25031.9 ± 0.461.1 ± 3.4337.4 ± 3.9
30063.8 ± 4.6118.6 ± 17.9193.6 ± 16.4
0.1 M NaOH + 10−5 M IPA
5028.8 ± 0.621.1 ± 2.4426.8 ± 5.9
10037.3 ± 0.428.7 ± 1.6225.2 ± 2.1
15051.0 ± 0.428.8 ± 1.0166.0 ± 1.3
20056.0 ± 0.434.3 ± 0.9172.9 ± 1.2
25049.1 ± 0.457.4 ± 1.9341.5 ± 2.7
300100.2 ± 4.1106.8 ± 7.8233.5 ± 9.0
Table 6. Resistance and capacitance parameters for the HER on the polycrystalline Pt electrode surface in 0.1 M NaOH solution, recorded in the absence and presence of IPA at the indicated concentrations. The values were obtained by fitting the equivalent circuits (Figure 5 and Figure 11b) for the potential range from −50 to −150 mV vs. RHE to the recorded impedance data (the dimensionless φ parameters for the CPEs fluctuated around 0.90 and 0.92; χ2 = 4 × 10⁻⁶–3 × 10⁻⁵).
E/mVRct/Ω cm2Cdl/µF cm−2ROPD H/Ω cm2COPD H/µF cm−2
0.1 M NaOH
−5024.2 ± 0.517.7 ± 1.733.8 ± 0.5327.3 ± 12.2
−10021.8 ± 0.317.9 ± 1.017.3 ± 0.3285.7 ± 10.5
−15019.1 ± 0.618.3 ± 1.810.7 ± 0.6274.5 ± 19.6
−20021.0 ± 0.166.8 ± 2.5
−25019.0 ± 0.154.5 ± 1.7
−30015.2 ± 0.149.2 ± 1.4
−35012.9 ± 0.145.9 ± 1.8
−40011.5 ± 0.147.0 ± 1.7
−45010.1 ± 0.146.9 ± 2.4
−5009.3 ± 0.150.3 ± 5.4
0.1 M NaOH + 10−5 M IPA
−5025.8 ± 0.419.4 ± 1.135.2 ± 0.4286.6 ± 8.0
−10024.9 ± 0.518.3 ± 1.120.2 ± 0.5225.8 ± 8.2
−15025.2 ± 0.820.6 ± 2.011.0 ± 0.8184.5 ± 14.0
−20021.2 ± 0.159.6 ± 1.7
−25020.1 ± 0.152.4 ± 1.4
−30016.6 ± 0.148.2 ± 1.4
−35014.1 ± 0.047.6 ± 1.4
−40012.1 ± 0.047.5 ± 1.7
−45010.1 ± 0.153.1 ± 2.7
−5009.4 ± 0.051.8 ± 1.7
0.1 M NaOH + 10−4 M IPA
−5033.5 ± 0.623.2 ± 1.533.5 ± 0.7261.6 ± 10.6
−10033.5 ± 0.926.0 ± 2.014.4 ± 0.9248.1 ± 20.5
−15028.1 ± 1.029.9 ± 2.86.8 ± 1.0231.5 ± 32.7
−20027.2 ± 0.155.3 ± 1.4
−25021.5 ± 0.150.7 ± 1.5
−30017.2 ± 0.048.3 ± 1.1
−35014.5 ± 0.048.4 ± 1.1
−40012.3 ± 0.052.8 ± 1.4
−45011.1 ± 0.154.1 ± 2.1
−50010.0 ± 0.055.3 ± 1.7
Disclaimer/Publisher’s Note: The statements, opinions and data contained in all publications are solely those of the individual author(s) and contributor(s) and not of MDPI and/or the editor(s). MDPI and/or the editor(s) disclaim responsibility for any injury to people or property resulting from any ideas, methods, instructions or products referred to in the content.