Article

Micro-Arc Coatings with Different Types of Microparticles on Titanium Alloy: Formation, Structure, and Properties

by
Anna V. Ugodchikova
1,
Tatiana V. Tolkacheva
2,
Pavel V. Uvarkin
2,
Margarita A. Khimich
3,
Yurii P. Sharkeev
2,
Alexander D. Kashin
2,
Ivan A. Glukhov
2 and
Mariya B. Sedelnikova
2,*
1
Research Institute of Technical Physics and Automation, 115230 Moscow, Russia
2
Laboratory of Physics of Nanostructured Biocomposites, Institute of Strength Physics and Materials Science of SB RAS, 634055 Tomsk, Russia
3
Laboratory of Nanobioengineering, Institute of Strength Physics and Materials Science of SB RAS, 634055 Tomsk, Russia
*
Author to whom correspondence should be addressed.
Crystals 2025, 15(9), 811; https://doi.org/10.3390/cryst15090811
Submission received: 20 August 2025 / Revised: 8 September 2025 / Accepted: 15 September 2025 / Published: 16 September 2025
(This article belongs to the Special Issue Development of Light Alloys and Their Applications)

Abstract

This study examines the effects of electrolyte composition, specifically the incorporation of dispersed particles, on the properties and formation kinetics of micro-arc oxidation (MAO) coatings on a bioinert titanium alloy. Coatings with particles of β-tricalcium phosphate (CP), wollastonite (CS), and combined coatings containing both types of particles (SP) were obtained. The MAO process was carried out using a Micro-Arc 3.0 unit in pulsed potentiostatic anode mode, with the process voltage ranging from 350 to 500 volts. The surface morphology and internal structure of the coatings were examined using scanning electron microscopy. The elemental composition of the coatings was determined by the EDX method, while the phase composition and fine structure of the coatings were investigated by XRD and TEM methods, respectively. The adhesion properties of the coatings were determined by means of scratch testing. When the MAO process voltage was increased to 500 V, the thickness of CP, CS, and SP coatings increased to 80, 50, and 50 μm, respectively. Notably, SP coatings demonstrated the highest adhesion strength (critical load Lc = 22 N), indicating their potential for use in load-bearing medical implants, where preventing delamination under mechanical stress is critical.

1. Introduction

Titanium and its alloys are gradually replacing stainless steels and Co-Cr-Mo alloys, becoming the most common materials for orthopedic and dental implants. These materials offer a number of advantages, including high mechanical strength, corrosion resistance, and biocompatibility with body tissues [1]. Nevertheless, the TiO2 oxide film formed on the surface of a titanium implant does not possess sufficient electrostatic potential to adsorb protein molecules and thereby initiate the osteointegration processes [2]. In some cases, this results in fibrous tissue formation at the bone–implant interface, subsequent implant loosening, and eventual loss of the implant [3]. In an effort to enhance the biological activity of titanium implants, numerous researchers have put forward a variety of surface modification methods [4,5,6]. Such modification not only enhances the structure of the implant surface, thereby increasing its hydrophilic and bioactive properties [7,8,9,10,11], but also endows the implant surface with specific osteogenic or antibacterial properties [12,13].
Among the various methods of surface modification of titanium implants, electrochemical methods such as electropolymerization, electrophoretic deposition, and electrothermal polarization are particularly prominent [2]. However, the most sophisticated and technologically advanced method of coating the surface of titanium and its alloys is micro-arc oxidation, otherwise referred to as plasma electrolytic oxidation [14,15,16]. The MAO process is carried out at voltages exceeding the breakdown voltage of the dielectric oxide layer. Thus, plasma discharge channels with local temperatures ranging from 2000 to 10,000 K are formed [17]. During the coating growth process, short-term microdischarges are steadily formed across the surface [18]. Unlike conventional anodizing, the peculiarity of the MAO process is that these high-temperature and high-pressure conditions within the discharge channels trigger plasma-chemical reactions, resulting in the synthesis of new phases [19].
Studies have shown that modifying the chemical composition of the electrolyte, substrate material, application time, and electrophysical parameters (e.g., voltage, current density, pulse duration, and pulse repetition rate) makes it possible to obtain coatings with different structures, compositions, and properties [20,21,22,23].
The electrolyte composition plays a pivotal role in MAO coating formation [24,25,26,27,28], since it directly influences the breakdown voltage and final voltage/current density during the MAO process, which determine the coating’s resulting morphology and physicochemical properties [29]. Electrolytes used in MAO can be either true solutions, where all components dissolve completely, or suspensions containing both dissolved and dispersed insoluble particles [30,31]. The most common insoluble components of electrolytes are calcium phosphates, as the compounds closest in mineralogical and chemical composition to bone [32,33,34]. However, recent studies have demonstrated that calcium and magnesium silicates also exhibit high biological activity and activate osseointegration processes [35]. Wollastonite is a calcium silicate CaSiO3 with a chain structure in which silicon–oxygen tetrahedrons are interconnected by their vertices into chains, and the chains are cross-linked by calcium ions [36]. Wollastonite exists in two mineral forms: a low-temperature form, β-wollastonite, and a high-temperature form, α-wollastonite (or pseudowollastonite) [37]. The presence of calcium (Ca2+) and silicon (Si4+) ions in wollastonite (CaSiO3) has been shown to be instrumental in its high activity in the process of biomineralization, specifically the formation of the hydroxyapatite (HA) layer [19,38]. Prior studies were directed towards identifying the formation patterns, examining the structure and properties of coatings with β-TCP and wollastonite particles on the surface of bioresorbable magnesium alloys [19,30,38,39]. The data regarding the MAO process kinetics, specifically the interaction between the magnesium substrate and an electrolyte containing dispersed particles, have been obtained.
The objective of the present study was to examine how the electrolyte composition containing β-TCP and wollastonite particles affects the MAO process on the surface of a bioinert titanium alloy, as well as the formation of morphology, structure, and physico-mechanical properties of coatings.

2. Materials and Methods

2.1. Sample Preparation

The substrates utilized for coating were 10 × 10 × 1 mm Grade 2 titanium plates, which were obtained through electrospark cutting. Titanium samples were subjected to preliminary mechanical treatment, namely grinding with 400 and 600 grit abrasive sandpaper. Subsequently, the samples were subjected to an ultrasonic cleaning process (Elmasonic S, Elma, Germany) in ethanol for a duration of 60 min. This was followed by drying in a desiccator for 30 min at a temperature of 150 °C. Three electrolyte compositions were prepared for experiments on coating deposition by micro-arc oxidation: I—with the addition of β-tricalcium phosphate (β-TCP) particles to obtain calcium phosphate coatings (CP coatings); II—with the addition of wollastonite particles to obtain calcium silicate coatings (CS coatings); and III—with the addition of both types of particles (β-TCP and wollastonite) to obtain hybrid silicate–phosphate coatings (SP coatings) (Table 1). Wollastonite MIVOLL® 05-96 (CJSC GEOKOM, Kaluga, Russia) and tricalcium phosphate CAFOS DB chemical plant “Budenheim” Dr. Oetker (Budenheim, Germany) were used in the work. In addition, water-soluble components such as Na2HPO4·12H2O (LLC “Sigma Track”, Khimki, Russia), NaOH (JSC “Kaustik” Volgograd, Russia), Na2SiO3 (LLC “Sigma Track”, Khimki, Russia), and NaF (LLC “Sigma Track”, Khimki, Russia) were introduced into the electrolyte composition.
The micro-arc oxidation process was conducted on the Micro-Arc 3.0 unit (ISPMS SB RAS, Tomsk, Russia) [39], operating within the anodic potentiostatic mode. The process parameters utilized are outlined below: pulse duration of 100 μs, pulse repetition rate of 50 Hz, and process duration of 10 min. The process voltage was varied in increments of 50 V, ranging from 350 V to 500 V.

2.2. Structural, Morphological, and Mechanical Properties of Coatings

The coatings were examined using scanning electron microscopy (SEM) (LEO EVO 50, Zeiss, Oberkochen, Germany) with an energy dispersive analysis (EDX) attachment (INCA, Oxford Instruments, Abingdon, UK) and transmission electron microscopy (TEM) (JEM-2100, Jeol Ltd., Tokyo, Japan) in “Nanotech” center at ISPMS SB RAS (Tomsk, Russia). Surface roughness was quantified using a Model-296 profilometer (Moscow, Russia) via the Ra parameter, which represents the average roughness value across multiple measurement sections. The phase composition of the coatings was investigated by X-ray phase analysis on a DRON-7 diffractometer (IC Burevestnik, Nizhniy Novgorod, Russia) (“Nanotech” center). Imaging was carried out in the range of angles 2θ = 5–90° with a scanning step of 0.02° in CoKα radiation (λ = 0.17902 nm). The Joint Committee on Powder Diffraction Standards (JCPDS) database was used for phase identification and interpretation of the obtained data. The adhesion strength of the coatings was evaluated using a Revetest RST scratch tester (CSM Instruments SA, Peseux, Switzerland). The device was outfitted with a Rockwell diamond indenter with a radius of 200 µm. The indenter was moved over the specimen surface at a speed of 1 mm/min while the load was linearly increased from 0.5 to 30 N. The length of the scratch was 5 mm, and the loading rate was 5.9 N/min. The laboratory conductometric liquid analyzer “MULTITEST KSL” (JSC SPE “SEMIKO”, Novosibirsk, Russia) was used to measure the specific electrical conductivity of electrolytes. Instrument error was 0.001 S/m. Each measurement was performed at least five times. The temperature of electrolytes was measured and controlled by a thermometric measuring channel included in the analyzer kit. The measurements were carried out at room temperature. The duration of the measurement of specific conductivity was no more than 10 s. The coating thickness was measured using a micrometer LEGIONER EDM-25-0.001 (Legioner, Löningen, Germany) and by analyzing SEM images of the coatings cross-sections.

3. Results and Discussions

3.1. Coating Formation

Wollastonite (CaSiO3), a calcium silicate mineral, is characterized by its chain-like crystal structure [36] (Figure 1a), which gives it its distinctive elongated shape. During the grinding of wollastonite powder and the splitting of larger particles, the formation of small needle-shaped crystals occurs. Natural wollastonite of MIVOLL® 05-96 grade, with an average particle length of 20 μm, was utilized in this study. The β-TCP powder particles, measuring between 2 and 5 μm, exhibit an isometric morphology (Figure 1b).
In previous studies [19], the results of measuring the zeta potential (ζ, mV) of β-TCP and wollastonite particles as a function of the medium’s pH were obtained, and it was found that the absolute value of the zeta potential |ζ| for both types of particles increases with increasing pH. As shown earlier, within the pH range of 8 to 11, β-TCP particles were characterized by a higher absolute zeta potential value than wollastonite particles. In the presented work, alkaline electrolytes with a pH of 11–12 were used (Table 1). At such pH, the ζ values of β-TCP and wollastonite particles reached −47 mV and −43 mV, respectively [19]. High |ζ| implies higher electrophoretic mobility of β-TCP particles compared to wollastonite particles in the electrolyte dispersion medium under the influence of an electric field.
The results of measuring the specific conductivity of the electrolytes (Figure 2a) indicate that electrolyte I, containing β-TCP particles, exhibits a higher value of 2.87 S/m, while electrolyte II, comprising wollastonite particles, demonstrates the lowest specific conductivity of 2.6 S/m. Therefore, it was determined that the incorporation of dispersed particles of β-TCP with elevated modulus of zeta potential into the composition of electrolytes enhances the specific conductivity of electrolytes. The specific conductivity of the electrolyte, in turn, affects the magnitude of the decrease in the potential at which the dielectric coating breakdown occurs [25], which affects the morphological features of the surface, structure, and properties of the coatings. The higher absolute value of zeta potential and, accordingly, higher electrophoretic mobility of β-TCP particles result in their faster diffusion to the coating/electrolyte interface in response to the electric field when compared with wollastonite particles. Furthermore, the isometric shape of β-TCP crystals favors their higher mobility compared to wollastonite particles having an elongated shape.
Thus, β-TCP particles are more actively involved in the formation of a quasicathode (a layer of negatively charged counterions formed at the coating/electrolyte interface). This results in a more substantial accumulation of charge, which in turn impacts the initiation of micro-arc discharges.
The dependences of current density (j, A/cm2) on the duration during the formation of all types of coatings are described by exponential functions (Figure 2b). To investigate how the electrolyte composition affects the current density of the MAO process, the voltage was kept constant at 400 V. Two periods can be conventionally distinguished on the graphs: t1—the period of rapid decrease in current density and t2—the period during which the current density practically does not change. The duration of the t1 period for the CP and SP coating process in electrolytes I and III lasts approximately 125 s, while the duration of this period for the CS coating formation process in electrolyte II is 100 s. At the same time, higher initial values of current density correspond to the MAO processes in electrolytes I and III (0.50 and 0.58 A/cm2, respectively).
Figure 3 presents plots of the current density and coating thickness versus time at a constant process voltage value of 400 V. The growth rate of the coatings is also shown in Figure 3.
The graphs show that higher current densities during the MAO process in electrolytes I and III contribute to a higher coating thickness growth rate υ, μm/s (0.14 and 0.15 μm/s, respectively) (Figure 3a,c). Furthermore, the morphology of the dispersed particles involved in the MAO process is also likely to influence the rate of coating growth. Wollastonite particles having a specific elongated shape are less intensively involved in the combustion regions of micro-arc discharges than β-TCP particles having an isometric shape.

3.2. Morphology, Structure, and Elemental Composition of Coatings

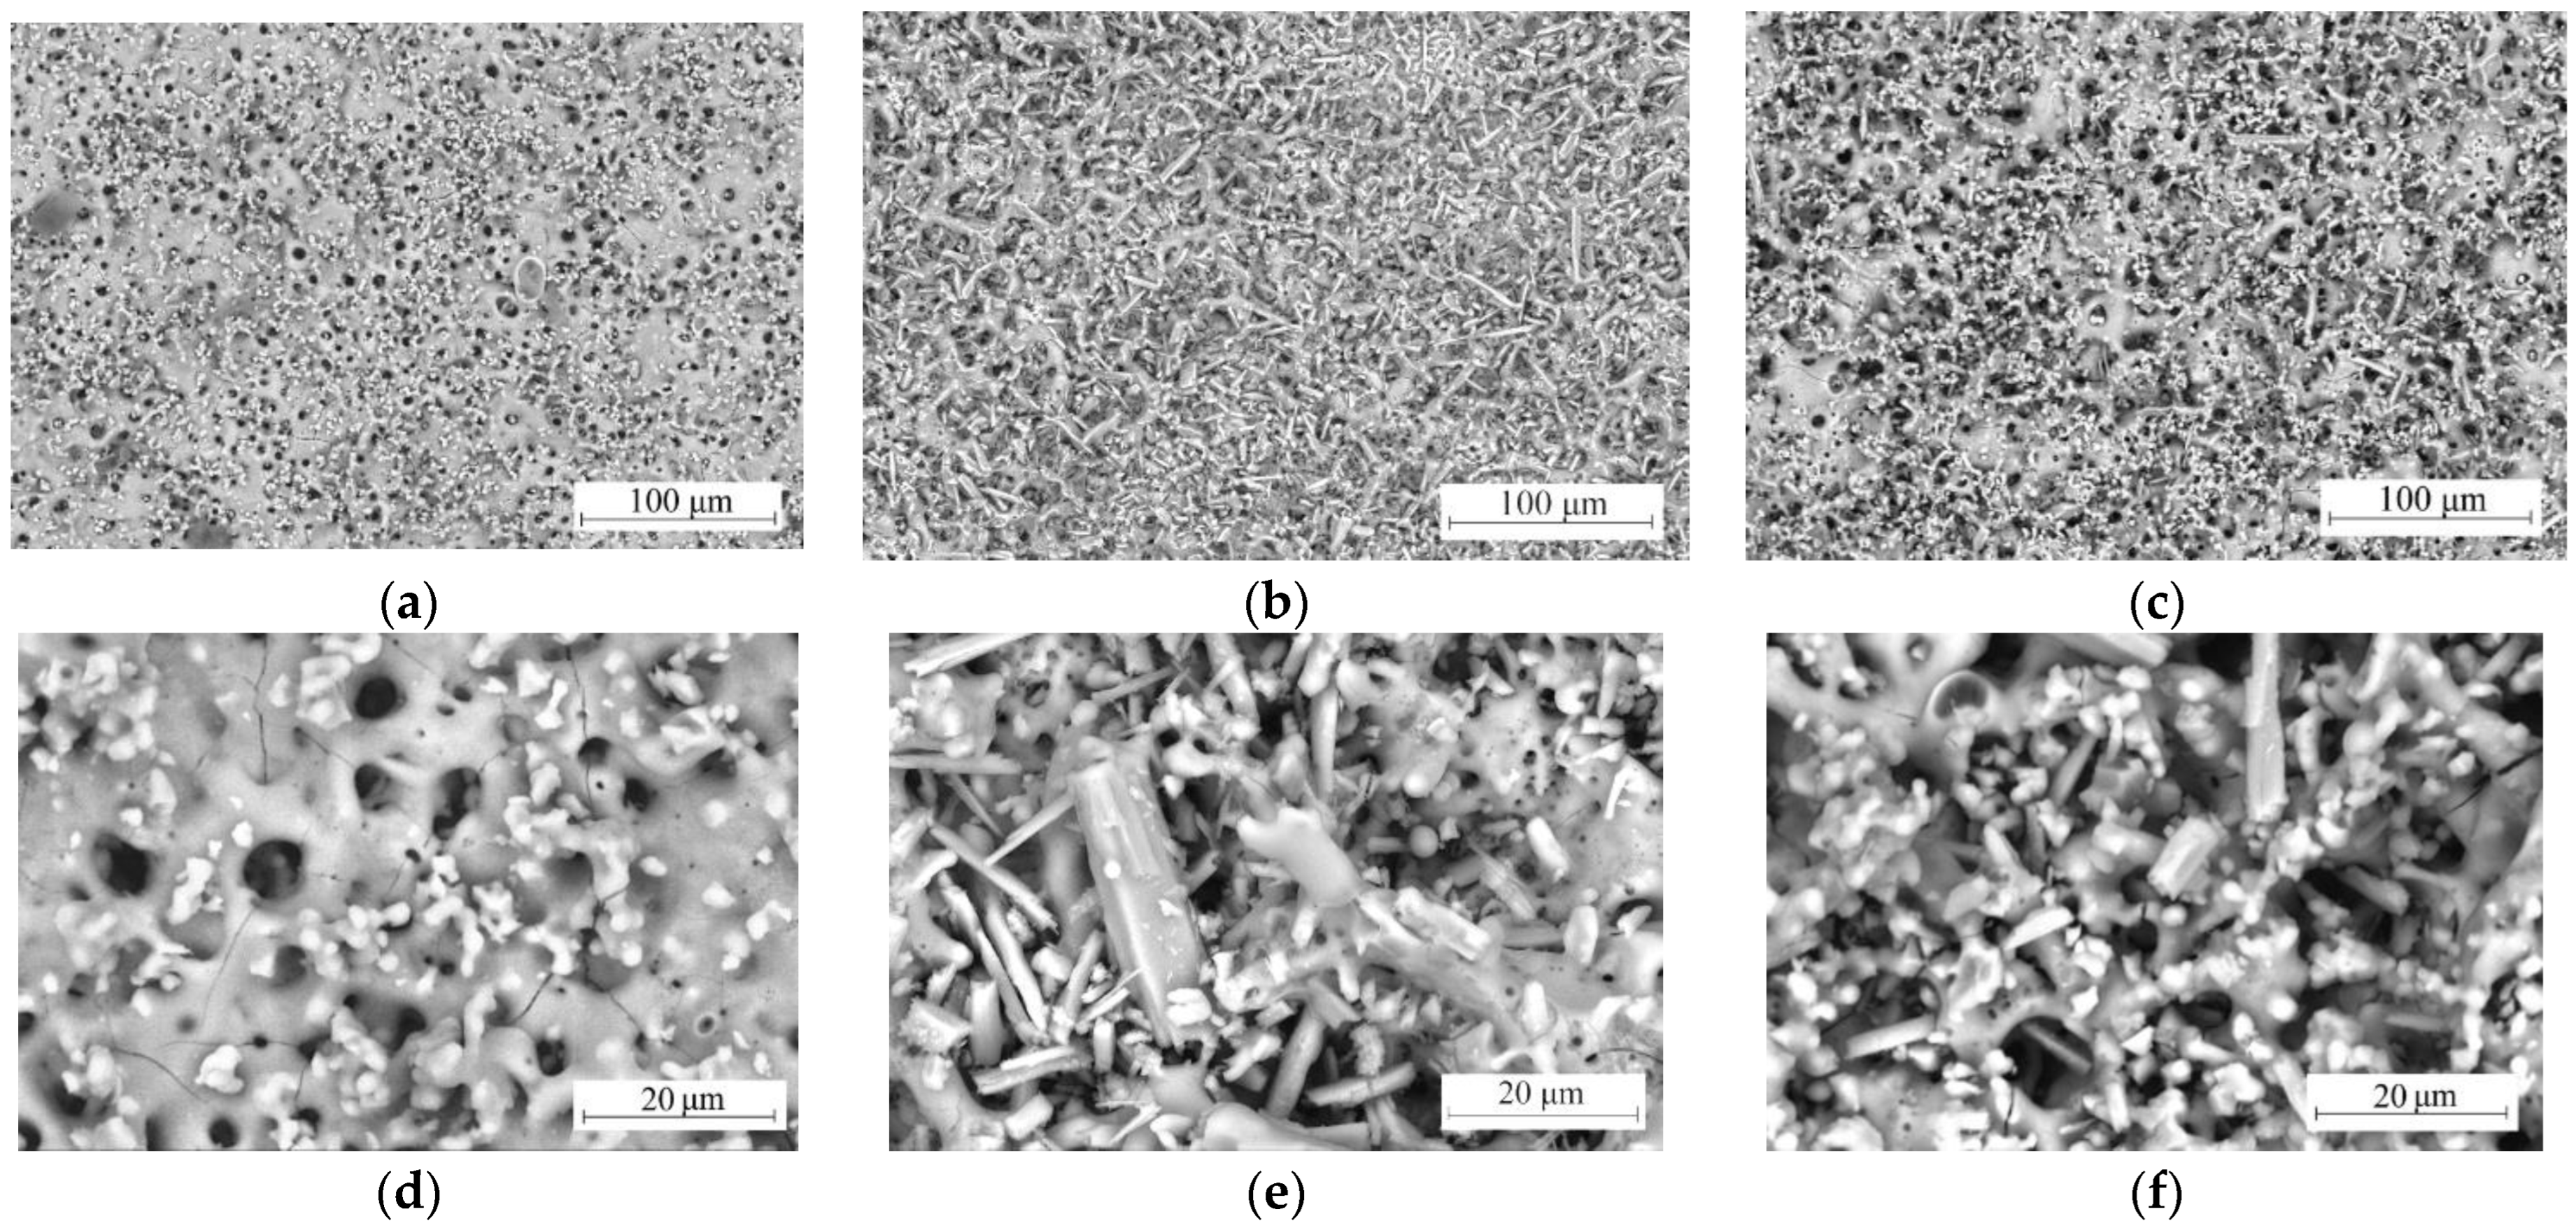
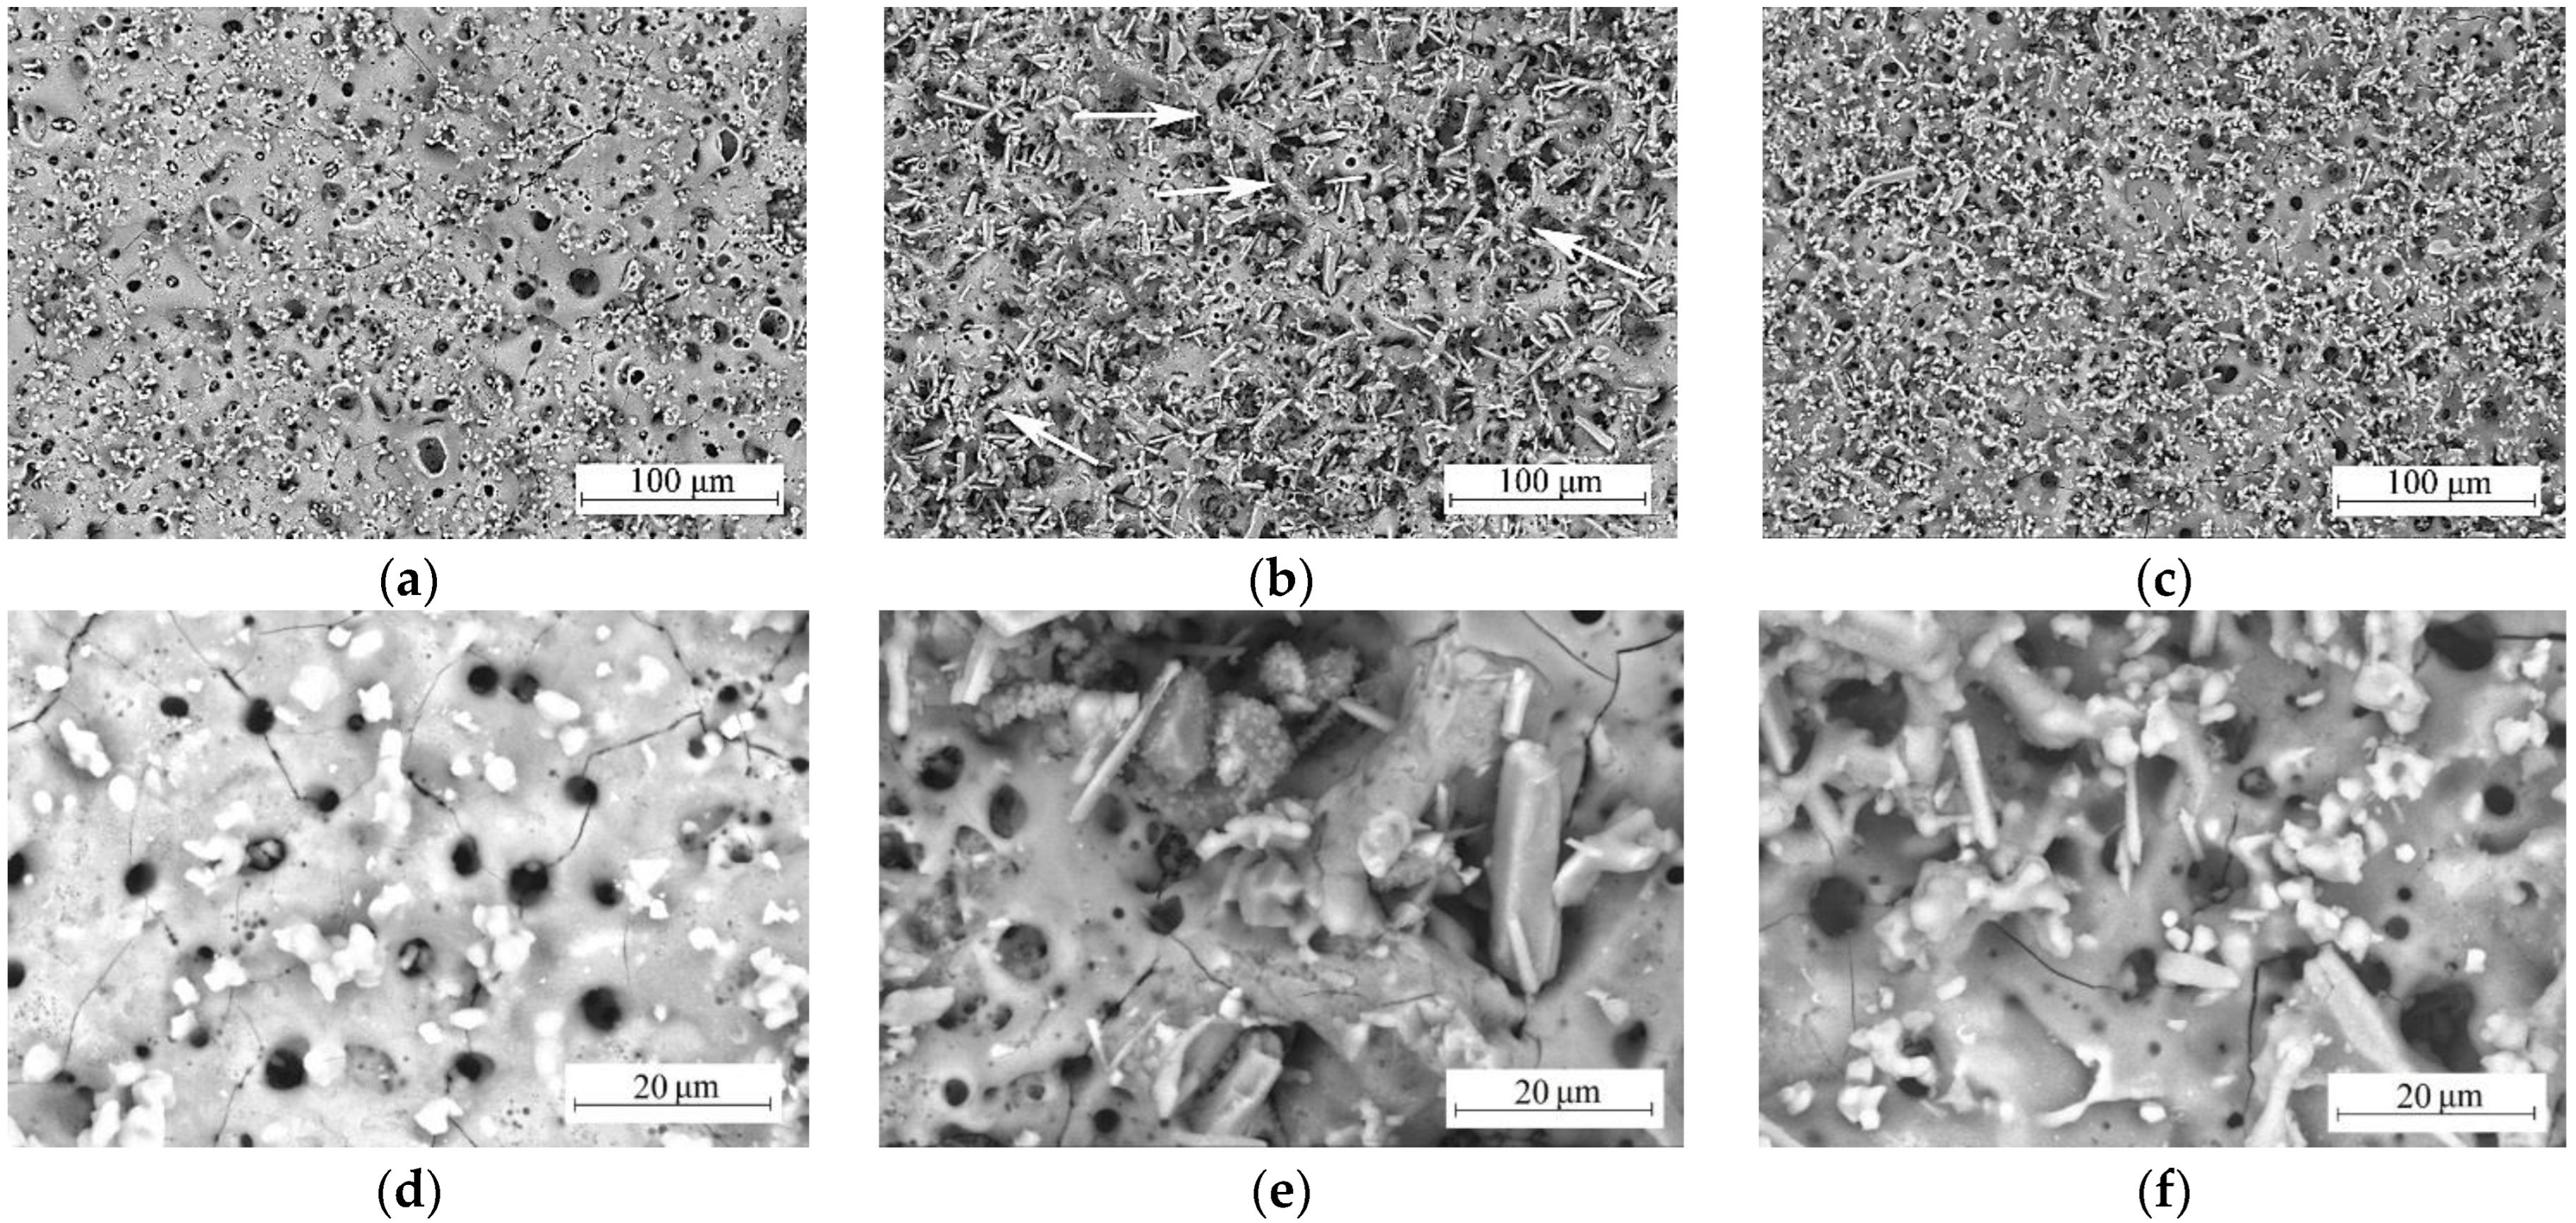
The analysis of the SEM images of the coating surface showed that all coatings have a developed surface morphology with a large number of pores, which is explained by the mechanism of the MAO process (Figure 4 and Figure 5). A close examination of CP coatings formed at voltages of 400 V and 500 V reveals the presence of numerous isometric particles measuring between 3 and 5 μm. These particles exhibit a morphology consistent with that of β-TCP particles.
The surface of CS coatings synthesized at 400 V is represented by a pronounced crystalline layer consisting of needle-shaped microparticles up to 20 µm long, characteristic of wollastonite (Figure 4b,e). At 500 V, more powerful micro-arc discharges promote intensive melting of particles on the surface of CS coatings, as well as their fusion with each other (Figure 5b—indicated by arrows).
Isometric particles similar to β-TCP and elongated particles similar to wollastonite are observed on the surface of SP coatings formed at both 400 V and 500 V (Figure 4c,f and Figure 5c,f). Increasing the voltage from 400 to 500 V leads to a noticeable decrease in the concentration of both types of particles on the surface of all coatings (Figure 5d–f), which is related to the temperature impact of intense micro-arc discharges on the particles.
Figure 6a–c presents the SEM images of the cross-sections of the coatings. It can be noted that the internal structure of the coatings is porous, with a uniform distribution of pores throughout the volume. The evaluation of the elemental composition of the coatings revealed that the elements P and Si were distributed uniformly across the entire thickness of the coatings. Furthermore, the analysis revealed an absence of a gradient in concentrations for these elements, as illustrated in Figure 6d–f.
The increase in Ca content is observed in the direction from the substrate to the surface, which is associated with the growth of coatings and the more intense interaction of dispersed particles from the electrolyte with the formed coating. The more intense the discharges become, the more pronounced this effect is. Conversely, the Ti content exhibits an increase in the opposite direction, from the surface to the substrate.
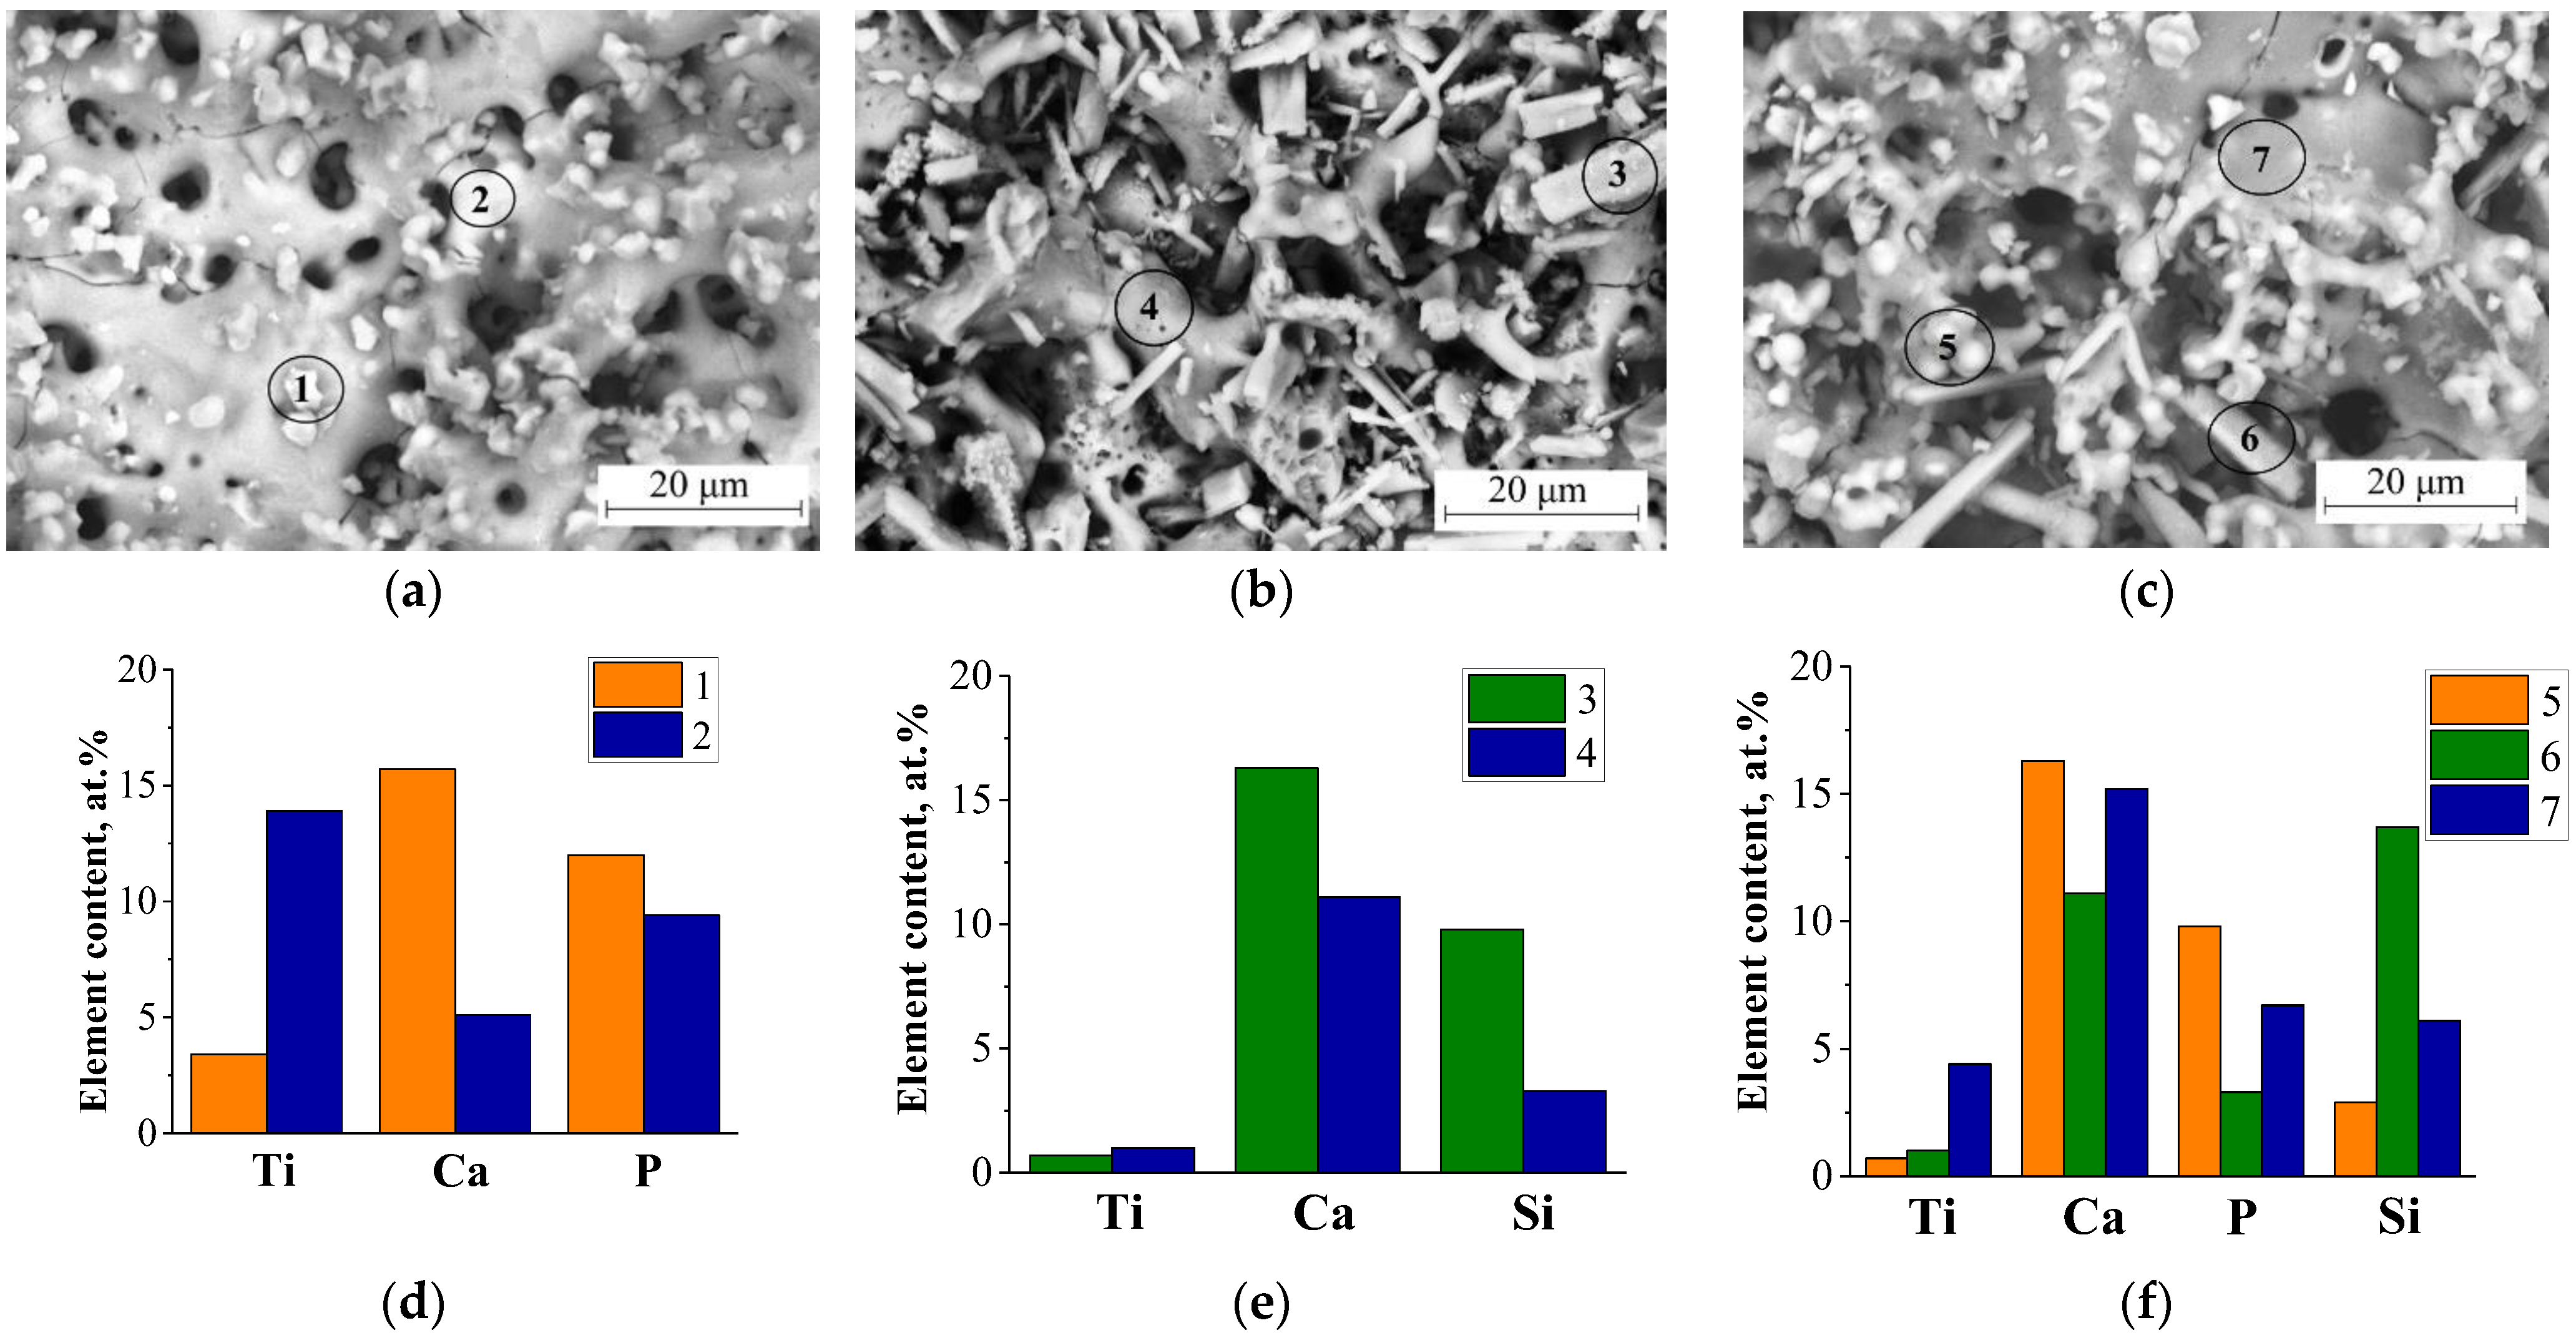
The SEM images of coatings (Figure 7a–c) show regions 1—with isometric particles, 2—without particles (Figure 7a), 3—with needle particles, 4—without particles (Figure 7b), 5—with isometric particles, 6—with needle particles, and 7—without particles (Figure 7c). The results of the study of the elemental composition of the particles on the surface of the coatings (Figure 7d–f) indicate that they correspond to β-TCP and wollastonite, as evidenced by the high content of the elements Ca and P in the case of CP coatings and Ca and Si in the case of SP coatings.
Table 2 presents the chemical element content of each highlighted area in Figure 7a–c.
It is important to note that in the case of SP coatings, P and Si are simultaneously present in both needle-like particles similar to wollastonite and isometric particles similar to β-TCP. Under the influence of high temperatures near the channels of micro-arc discharges, surface diffusion of element P into wollastonite particles and Si into β-TCP particles occurs. Thus, the structure and chemical composition of particles can undergo changes associated with the formation of new phases and compounds.
It was found that the Ca element content on the surface of CS coatings (area 4 in Figure 7b) is almost three times higher than on the surface of CP coatings (area 2 in Figure 7a). Ca is initially present in the electrolyte only as β-TCP (Ca3(PO4)2) and wollastonite (CaSiO3). The high calcium content in CS coatings can be explained by the lower melting point of wollastonite, 1540 °C [40]. In the process of MAO, more intensive melting of wollastonite particles may occur in the nearby regions of the micro-arc discharge channel.

3.3. Phase Composition and Fine Structure of Coatings

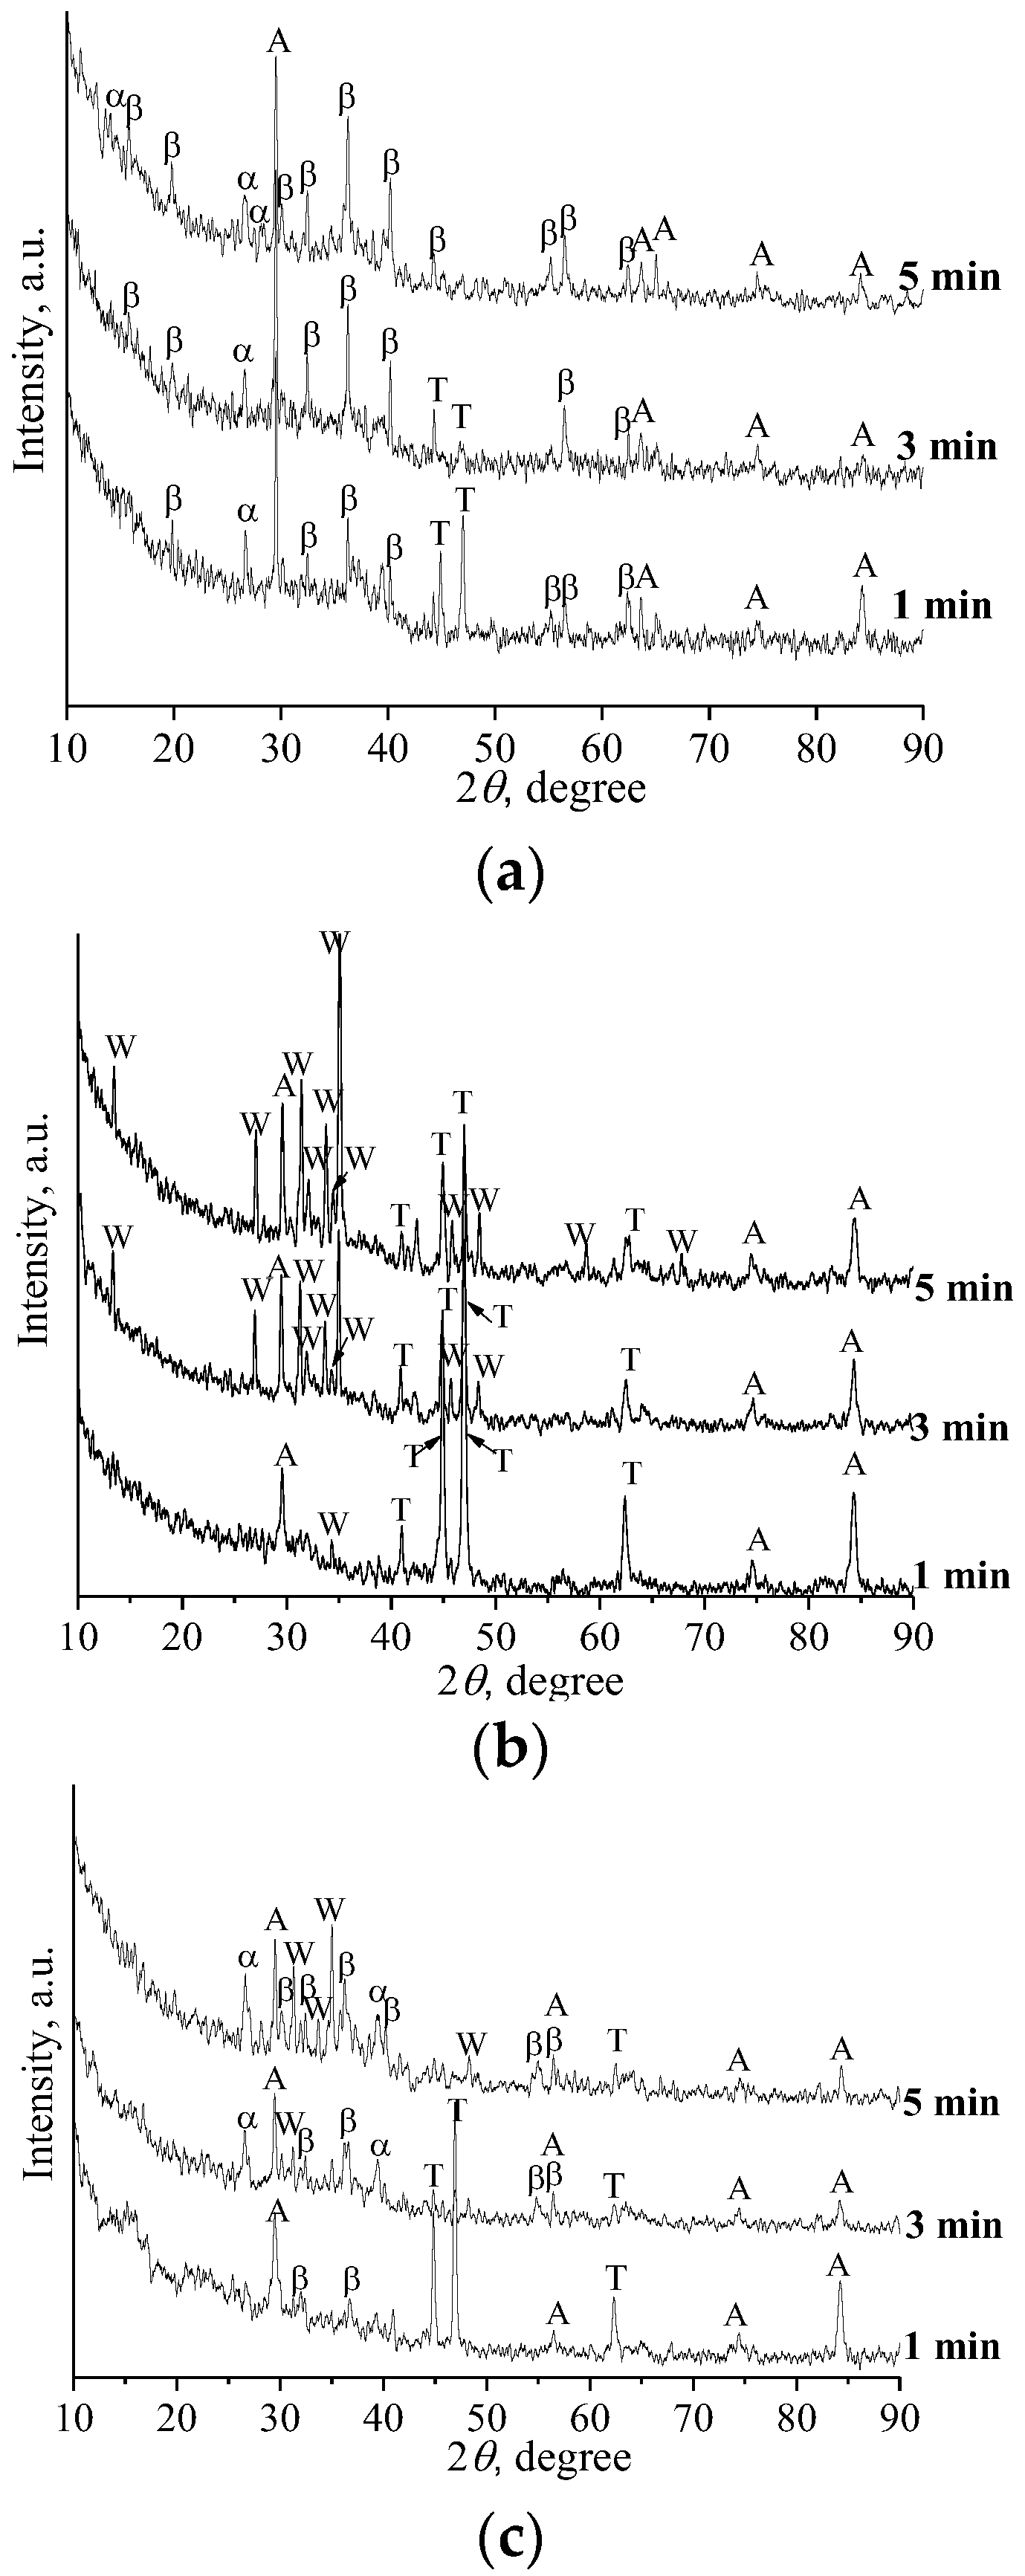
The phase composition of the coatings was analyzed by the X-ray diffraction method. To study the effect of the coating deposition duration on their phase composition, the voltage of the MAO process was maintained constant at 400 V. As indicated by the X-ray phase analysis (Figure 8), it was found that all the synthesized coatings have an amorphous crystalline structure, since the X-ray diffraction patterns of the coatings show both the presence of diffraction maxima indicating the presence of crystalline phases and the presence of diffuse scattering regions in the angle range of 10–45°.
The following were identified as crystalline phases in the coatings: β-TCP (PDF #09-0169), α-TCP (PDF #09-0348), wollastonite (PDF #43-1460), and titanium oxide (TiO2) in anatase modification (PDF #21-1272). In addition, reflections from the α-Ti titanium substrate (PDF #44-1294) were observed in the X-ray diffraction images. The low-temperature β- TCP phase at 1125 °C transforms into α-TCP phase, which is stable in the temperature range of 1150–1470 °C. At temperatures above 1470 °C, the α-TCP phase reversibly transforms into α’-TCP [41]. There are reports that the α’-TCP compound is stable up to the temperature of 1765 °C [41].
In CP coatings, the presence of β-TCP, α-TCP, and TiO2 (anatase) is identified. In CS coatings, the presence of wollastonite and anatase is observed. In SP coatings, β-TCP, α-TCP, wollastonite and anatase are present. More intense and narrower peaks corresponding to α-TCP are observed in the X-ray diffraction patterns of SP coatings compared to CP coatings, indicating a more intense β→α-TCP phase transition. Such a transition can only occur in regions close to the micro-arc discharge channels, where the temperature reaches a value corresponding to the transition, but no melting of the particles has yet occurred. In addition, in the X-ray diffraction patterns of CS coatings, the wollastonite peaks have a higher intensity than for SP coatings. It is important to note that TiO2 is present in the coatings only in the anatase modification, which is metastable [42,43], indicating a short-term temperature impact during the micro-arc discharge process.
In order to understand the mechanism of coating structure formation in the dynamics of the MAO process, X-ray diffraction patterns of the coatings deposited at the MAO process voltage of 400 V for 1, 3, and 5 min were obtained (Figure 8).
The analysis of the X-ray diffraction patterns of CP coatings showed that most of the crystalline phase is formed during the initial minute of the MAO process (Figure 8a). With increasing deposition time, only the intensity of the peaks corresponding to α-, β-TCPs increases, and the intensity of the α-Ti substrate peaks decreases, which is associated with the increase in the thickness of the coatings.
Anatase and substrate material peaks are observed in the CS X-ray diffraction patterns of the coatings obtained at 1 min of the MAO process (Figure 8b). Only one small wollastonite reflex can be seen in the X-ray diffraction pattern. The other wollastonite peaks appear only after 3 min of the deposition process. This is explained by the fact that due to the specific morphology of particles and lower zeta potential value, wollastonite particles diffuse slower to the substrate/oxide layer/electrolyte interface, and in the first period of the MAO process, the coating formation proceeds with the participation of only soluble compounds, which leads to the formation of the oxide layer.
The analysis of X-ray diffraction patterns of SP coatings showed that at 1 min of the process, the first two peaks corresponding to β-TCP appear (Figure 8c). More intensive growth of crystalline compounds is observed after 3 min of the MAO process, which is confirmed by the increase in the number and intensity of the peaks corresponding to β-TCP and wollastonite.
The fine structure of the coatings obtained in all three electrolytes was investigated using transmission electron microscopy. Figure 9 shows light-field and dark-field TEM images of CP coating particle fragments as well as their microdiffraction patterns. The β-TCP and anatase phases are predominantly observed in CP coating fragments (Figure 9b). In dark-field images, their nanocrystallites of 5–10 nm in size can be observed in the reflections of (101) anatase and (214) β-TCP (Figure 9b).

3.4. Physico-Mechanical Properties of Coatings

In this work, the thickness (d, μm) and roughness (Ra, μm) dependences of CP, CS, and SP coatings on the voltage (U, V) of the MAO process were investigated. As illustrated in Figure 10, an increase in voltage is observed to correspond with an increase in thickness and roughness of the coatings, irrespective of the electrolyte type. However, the most prominent thickness increase (from 27 to 80 μm) is observed for CP coatings with the addition of β-TCP microparticles (Figure 10a). The higher value of current density, characteristic for the MAO process with β-TCP particles, is a contributing factor. (Figure 2b). The thicknesses of CP and SP coatings vary from 20 to 50 μm and 40 to 50 μm, respectively (Figure 10b,c). Moreover, it should be noted that the thickness value of CS coatings in the voltage range of 350–450 V varies within 20–40 μm, and only at 500 V increases to 50 μm. However, the highest roughness Ra values correspond to CS coatings (Figure 10b). As the voltage increases from 350 to 500 V in CS coatings, the roughness increases from 3.0 to 5.5 μm, which may be due to the elongated needle shape of the particles contributing to the formation of higher roughness. The wollastonite particles are deposited on the surface and form a rough relief coating, which is also observed in the SEM images (Figure 4 and Figure 5). In the case of CP and SP coatings, the roughness values vary from 2.5 to 4.8 μm and 3.5 to 5 μm, respectively, when varying the MAO process voltage in the range of 350–500 V (Figure 10a,c).
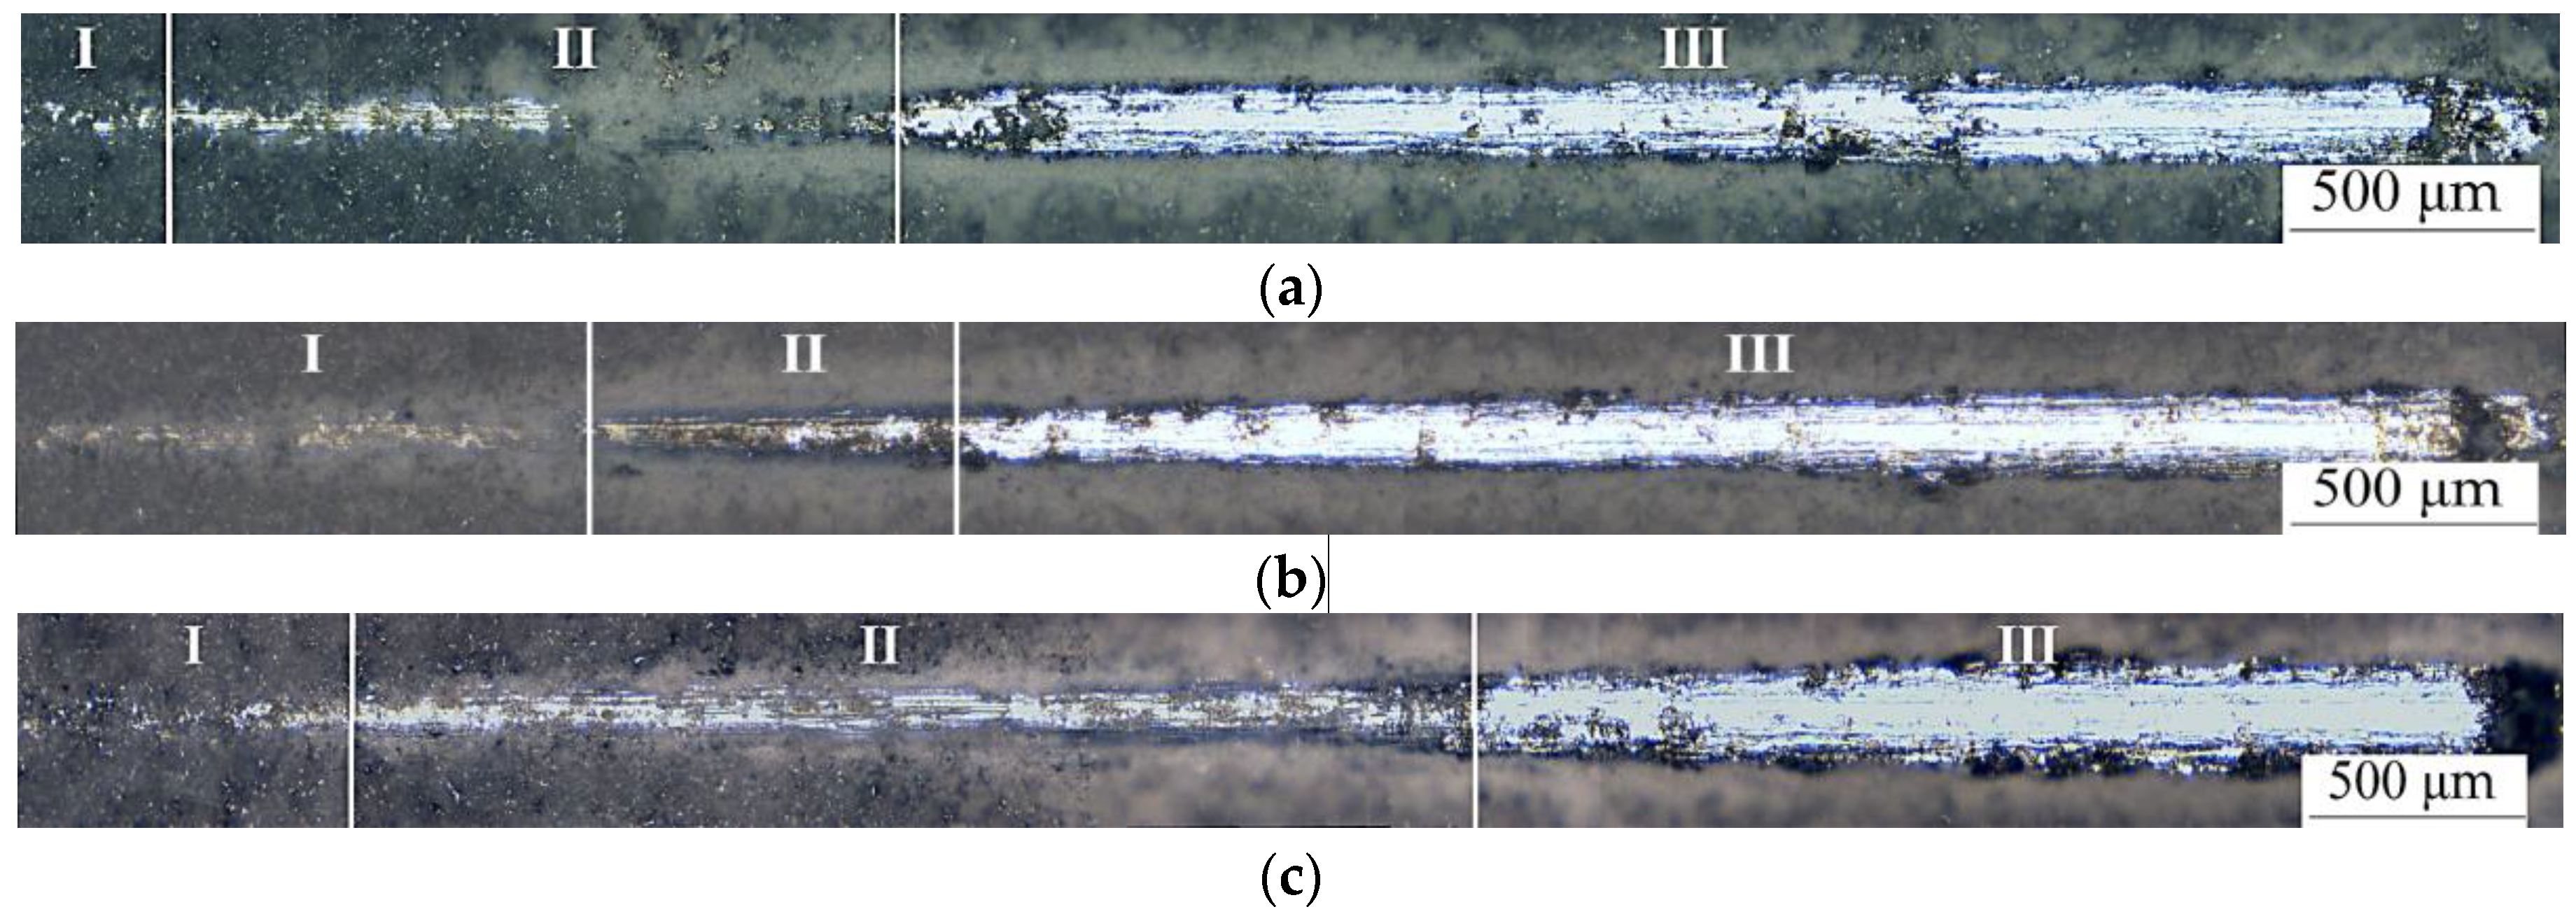
The adhesion strength of the coatings was analyzed by means of scratch testing. Figure 11 shows optical images of scratches formed during scratch testing to evaluate the adhesion strength of all types of coatings formed at 500 V.
In the context of assessing the adhesion strength of a coating, three primary categories of failure can be identified: cohesive, adhesive, and mixed [27]. Section I (Figure 11) characterizes the initial fracture (cracking) of the coating, at which cohesive deformation (fracture of the coating itself) occurs. The boundary between plots I and II corresponds to the coating spalling, which is defined as cohesive–adhesive deformation. The boundary between sections II and III corresponds to the complete detachment of the coating, which is characterized by adhesive-type deformation. The minimum load at which the coating peels from the substrate is denoted as the critical load, Lc.
As a result of analyzing the optical images of the surface of coatings with indenter scratches, it can be noted that CS coatings have the longest section I (Figure 11b). Earlier, it was revealed that CS coatings are characterized by the highest roughness value, which reaches 5.5 μm at the MAO process voltage of 500 V. Presumably, the high roughness of the coatings determines the long-term cohesive deformation. The shortest section III (complete detachment) is observed for the SP coating (Figure 11c). The data of observation of optical images of tracks after scratch testing correlate with the results of determining the critical load withstood by the coating before delamination. It was found that the highest value of critical load, equal to 22 N, is characterized by SP coatings (Figure 12). For CP and CS coatings formed at 500 V MAO process voltage, the critical load values reach 10.0 N and 10.3 N, respectively. At the same time, in the region of low values of MAO process voltage (350–400 V), the critical load for all types of coatings varies in the range of 9–12 N. Increasing the voltage up to 450–500 V does not affect the adhesion strength of CP and CS coatings, while for SP coatings an increase in the critical load up to 16–22 N is observed. This fact can be explained by the presence of two types of particles in the structure and the formation of nanocrystalline phases—α-TCP and HA, which contribute to the cohesive strength of coatings.

4. Conclusions

Coatings were formed on the surface of Grade 2 titanium alloy in electrolytes of different compositions: I (with β-TCP particles)—calcium phosphate coatings (CP), II (with wollastonite particles)—calcium silicate coatings (CS), and III (with β-TCP and wollastonite particles simultaneously)—hybrid silicate–phosphate coatings (SP). β-TCP particles were present on the surface of CP coatings, wollastonite particles were present on the surface of CS coatings, and in SP coatings both particles were present simultaneously.
(1)
The specific conductivity of electrolytes I and III was found to be 2.87 and 2.52 Sm/m, respectively, while the specific conductivity of electrolyte II (with wollastonite particles) took an intermediate value of 2.6 Sm/m. This phenomenon can be explained by the fact that β-TCP particles included in the electrolytes I and III are characterized by a more negative zeta potential value, which enhances their electrophoretic properties.
(2)
It was found that in the medium of electrolytes with higher specific conductivity, the MAO process occurred at higher values of initial current density (0.50 and 0.58 A/cm2, for CP and SP coatings, respectively), and a higher growth rate of coatings was observed (0.14 and 0.15 μm/s for CP and SP coatings, respectively). It is evident that with a higher specific conductivity of the electrolyte, more intense micro-arc discharges take place, and therefore, the rate of coating growth increases.
(3)
The coatings were found to have an amorphous crystalline structure. The following were identified as the main crystalline phases: β-TCP, α-TCP, wollastonite, and TiO2 (anatase).
(4)
Crystallization of calcium phosphate compounds in CP and SP coatings started during the first minute of the MAO process. In CS coatings, only oxide coating was formed during the first minutes of the MAO process, which is explained by the lower mobility of wollastonite particles due to their needle shape and their lower zeta potential value.
(5)
When the voltage of the MAO process was increased to 500 V, the thickness of CP, CS, and SP coatings increased to 80, 50, and 50 μm, respectively, and the roughness of these coatings by Ra parameter increased to 4.8, 5.5 and 5.0 μm, respectively.
(6)
The values of critical load during scratch testing for CP, CS, and SP coatings synthesized at 500 V were 10.0, 10.3, and 22.0 N, respectively. Thus, the combined coatings formed in the electrolyte with the addition of β-TCP and wollastonite particles were characterized by the highest adhesion strength. Therefore, these coatings are the most promising for use in load-bearing medical implants where it is critical to prevent delamination under mechanical loads.

Author Contributions

Conceptualization, M.B.S. and A.V.U.; methodology, M.B.S. and T.V.T.; software, M.A.K., P.V.U., I.A.G. and A.D.K.; validation, M.B.S. and A.V.U.; formal analysis, P.V.U., A.V.U. and I.A.G.; investigation, A.D.K., T.V.T. and I.A.G.; resources, Y.P.S.; data curation, M.A.K., A.D.K. and T.V.T.; writing—original draft preparation, M.B.S. and A.V.U.; writing—review and editing, A.V.U. and A.D.K.; visualization, A.D.K., M.A.K. and P.V.U.; supervision, Y.P.S.; project administration, M.B.S.; funding acquisition, Y.P.S. All authors have read and agreed to the published version of the manuscript.

Funding

The work was performed in accordance with the government research assignment for ISPMS SB RAS, project FWRW-2021-0007.

Data Availability Statement

The original contributions presented in the study are included in the article; further inquiries can be directed to the corresponding author.

Acknowledgments

The authors express their appreciation for the valuable contributions of A.I. Tolmachev from the Institute of Strength Physics and Materials Science SB RAS (Tomsk, Russia) for his assistance in the preparation of experimental materials.

Conflicts of Interest

The authors declare no conflicts of interest.

Abbreviations

The following abbreviations are used in this manuscript:
MAOMicro-arc oxidation
CPCalcium phosphate coating
CSCalcium silicate coating
SPSilicate phosphate coating

References

  1. Zhang, L.C.; Chen, L.Y.; Wang, L.Q. Surface modification of titanium and titanium alloys: Technologies, developments, and future interests. Adv. Eng. Mater. 2020, 22, 1901258. [Google Scholar] [CrossRef]
  2. Xu, J.; Zhang, J.; Shi, Y.; Tang, J.; Huang, D.; Yan, M.; Dargusch, M.S. Surface modification of biomedical Ti and Ti alloys: A Review on current advances. Materials 2022, 15, 1749. [Google Scholar] [CrossRef] [PubMed]
  3. Xiao, M.; Chen, Y.M.; Biao, M.N.; Zhang, X.D.; Yang, B.C. Bio-functionalization of biomedical metals. Mater. Sci. Eng. C Mater. Biol. Appl. 2017, 70, 1057–1070. [Google Scholar] [CrossRef]
  4. Li, Y.Y.; Zou, L.M.; Yang, C.; Li, Y.H.; Li, L.J. Ultrafine-grained Ti-based composites with high strength and low modulus fabricated by spark plasma sintering. Mater. Sci. Eng. A 2013, 560, 857–861. [Google Scholar] [CrossRef]
  5. Liu, C.F.; Lee, T.H.; Liu, J.F.; Hou, W.T.; Li, S.J.; Hao, Y.L.; Pan, H.B.; Huang, H.H. A unique hybrid-structured surface produced by rapid electrochemical anodization enhances bio-corrosion resistance and bone cell responses of beta-type Ti-24Nb-4Zr-8Sn alloy. Sci. Rep. 2018, 8, 6623. [Google Scholar] [CrossRef]
  6. Liu, G.C.; Li, R.Y.; Liang, H.J.; Qin, Y.G. Research advance in the osteointegration of surface bioactive coating on titanium alloys. Chin. J. Tissue Eng. Res. 2017, 21, 969–974. [Google Scholar] [CrossRef]
  7. Mosas, K.K.A.; Chandrasekar, A.R.; Dasan, A.; Pakseresht, A.; Galusek, D. Recent advancements in materials and coatings for biomedical implants. Gels 2022, 8, 323. [Google Scholar] [CrossRef]
  8. Jugowiec, D.; Kot, M.; Moskalewicz, T. Electrophoretic deposition and characterisation of chitosan coatings on near-β titanium alloy. Arch. Metall. Mater. 2016, 61, 657–664. [Google Scholar] [CrossRef]
  9. Wang, W.; Wang, Z.; Fu, Y.; Dunne, N.; Liang, C.; Luo, X.; Liu, K.; Li, X.; Pang, X.; Lu, K. Improved osteogenic differentiation of human amniotic mesenchymal stem cells on gradient nanostructured Ti surface. J. Biomed. Mater. Res. Part A 2020, 108, 1824–1833. [Google Scholar] [CrossRef]
  10. Lin, Q.; Zhou, Y.; Yin, M.; Cheng, Y.; Wei, Y.; Hu, Y.; Lian, X.; Chen, W.; Huang, D. Hydroxyapatite/tannic acid composite coating formation based on Ti modified by TiO2 nanotubes. Colloids Surf. B Biointerfaces 2020, 196, 111304. [Google Scholar] [CrossRef]
  11. Bajda, S.; Liu, Y.; Tosi, R.; Cholewa-Kowalska, K.; Krzyzanowski, M.; Dziadek, M.; Kopyscianski, M.; Dymek, S.; Polyakov, A.V.; Semenova, I.P.; et al. Laser cladding of bioactive glass coating on pure titanium substrate with highly refined grain structure. J. Mech. Behav. Biomed. Mater. 2021, 119, 104519. [Google Scholar] [CrossRef] [PubMed]
  12. Filipović, U.; Dahmane, R.G.; Ghannouchi, S.; Zore, A.; Bohinc, K. Bacterial adhesion on orthopedic implants. Adv. Colloid Interface Sci. 2020, 283, 102228. [Google Scholar] [CrossRef]
  13. Fosca, M.; Streza, A.; Antoniac, I.V.; Vadalà, G.; Rau, J.V. Ion-doped calcium phosphate-based coatings with antibacterial properties. J. Funct. Biomater. 2023, 14, 250. [Google Scholar] [CrossRef] [PubMed]
  14. Abbas, A.; Kung, H.-P.; Lin, H.-C. Effects of electrical parameters on micro-arc oxidation coatings on pure titanium. Micromachines 2023, 14, 1950. [Google Scholar] [CrossRef]
  15. Yasui, T.; Hayashi, K.; Fukumoto, M. Behaviors of micro-arcs, bubbles, and coating growth during plasma electrolytic oxidation of titanium alloy. Materials 2023, 16, 360. [Google Scholar] [CrossRef]
  16. Nahum, E.Z.; Lugovskoy, S.; Lugovskoy, A.; Kazanski, B.; Sobolev, A. The study of hydroxyapatite growth kinetics on CP–Ti and Ti65Zr treated by plasma electrolytic oxidation process. J. Mater. Res. Technol. 2023, 24, 2169–2186. [Google Scholar] [CrossRef]
  17. Hussein, R.O.; Nie, X.; Northwood, D.O.; Yerokhin, A.; Matthews, A. Spectroscopic study of electrolytic plasma and discharging behaviour during the plasma electrolytic oxidation (PEO) process. J. Phys. D Appl. Phys. 2010, 43, 105203. [Google Scholar] [CrossRef]
  18. Matykina, E.; Berkani, A.; Skeldon, P.; Thompson, G.E. Real-time imaging of coating growth during plasma electrolytic oxidation of titanium. J. Electrochim. Acta 2007, 53, 1987–1994. [Google Scholar] [CrossRef]
  19. Sedelnikova, M.; Bakina, O.; Ugodchikova, A.; Tolkacheva, T.; Khimich, M.; Uvarkin, P.; Kashin, A.; Miller, A.; Egorkin, V.; Schmidt, J.; et al. The role of microparticles of β-TCP and wollastonite in the creation of biocoatings on Mg0.8Ca Alloy. Metals 2022, 12, 1647. [Google Scholar] [CrossRef]
  20. Galvis, O.A.; Quintero, D.; Castaño, J.G.; Liu, H.; Thompson, G.E.; Skeldon, P.; Echeverría, F. Formation of grooved and porous coatings on titanium by plasma electrolytic oxidation in H2SO4/H3PO4 electrolytes and effects of coating morphology on adhesive bonding. Surf. Coat. Technol. 2015, 269, 238–249. [Google Scholar] [CrossRef]
  21. Li, Q.; Yang, W.; Liu, C.; Wang, D.; Liang, J. Correlations between the growth mechanism and properties of micro-arc oxidation coatings on titanium alloy: Effects of electrolytes. Surf. Coat. Technol. 2017, 316, 162–170. [Google Scholar] [CrossRef]
  22. Abbas, A.; Wang, T.-Y.; Lin, H.-C. Effects of electrolyte compositions and electrical parameters on micro-arc oxidation coatings on 7075 aluminum alloy. J. Compos. Sci. 2023, 7, 472. [Google Scholar] [CrossRef]
  23. Bykova, A.D.; Markov, M.A.; Kuznetsov, Y.A.; Kravchenko, I.N.; Belyakov, A.N.; Makarov, A.M. Effect of electrolyte composition on the structure and tribological properties of ceramic coatings obtained by micro-arc oxidation. Refract. Ind. Ceram. 2024, 64, 541–549. [Google Scholar] [CrossRef]
  24. Simchen, F.; Sieber, M.; Kopp, A.; Lampke, T. Introduction to plasma electrolytic oxidation—An overview of the process and applications. Coatings 2020, 10, 628. [Google Scholar] [CrossRef]
  25. Fattah-Alhosseini, A.; Keshavarz, M.K.; Molaei, M.; Gashti, S.O. Plasma electrolytic oxidation (PEO) process on cmmercially pure Ti surface: Effects of electrolyte on the microstructure and corrosion behavior of coatings. J. Metall. Mater. Trans. A 2018, 49, 4966–4979. [Google Scholar] [CrossRef]
  26. Sikdar, S.; Menezes, P.V.; Maccione, R.; Jacob, T.; Menezes, P.L. Plasma electrolytic oxidation (PEO) process—Processing, properties, and applications. Nanomaterials 2021, 11, 1375. [Google Scholar] [CrossRef] [PubMed]
  27. Wang, C.; Chen, J.; He, J.; Jiang, J.; Zhang, Q. Effect of electrolyte concentration on the tribological performance of MAO coatings on aluminum alloys. J. Front. Chem. Eng. 2020, 14, 1065–1071. [Google Scholar] [CrossRef]
  28. Fattah-Alhosseini, A.; Molaei, M.; Babaei, K. Influence of electrolyte composition and voltage on the microstructure and growth mechanism of plasma electrolytic oxidation (PEO) coatings on tantalum: A Review. J. Anal. Bioanal. Electrochem. 2020, 12, 517–535. [Google Scholar]
  29. Sandhyarani, M.; Prasadrao, T.; Rameshbabu, N. Role of electrolyte composition on structural, morphological and in-vitro biological properties of plasma electrolytic oxidation films formed on zirconium. J. Appl. Surf. Sci. 2014, 317, 198–209. [Google Scholar] [CrossRef]
  30. Sedelnikova, M.B.; Ugodchikova, A.V.; Uvarkin, P.V.; Chebodaeva, V.V.; Tolkacheva, T.V.; Schmidt, J.; Sharkeev, Y.P. Structural-morphological and adhesive properties of calcium-phosphate coatings formed on a magnesium alloy by micro-arc oxidation in an electrolyte containing disperse particles. Russ. Phys. J. 2021, 64, 830–837. [Google Scholar] [CrossRef]
  31. Kashin, A.D.; Sedelnikova, M.B.; Chebodaeva, V.V.; Uvarkin, P.V.; Luginin, N.A.; Dvilis, E.S.; Kazmina, O.V.; Sharkeev, Y.P.; Khlusov, I.A.; Miller, A.A.; et al. Diatomite-based ceramic biocoating for magnesium implants. Ceram. Int. 2022, 48, 28059–28071. [Google Scholar] [CrossRef]
  32. Awasthi, S.; Pandey, S.K.; Arunan, E.; Srivastava, C. A Review on hydroxyapatite coatings for biomedical application: Experimental and theoretical perspectives. J. Mater. Chem. B 2021, 9, 228–249. [Google Scholar] [CrossRef]
  33. Mamaeva, A.; Kenzhegulov, A.; Panichkin, A.; Abdulvaliyev, R.; Fischer, D.; Bakhytuly, N.; Toiynbaeva, N. Influence of current duty cycle and voltage of micro-arc oxidation on the microstructure and composition of calcium phosphate coating. Coatings 2024, 14, 766. [Google Scholar] [CrossRef]
  34. Molaei, M.; Fattah-alhosseini, A.; Nouri, M.; Nourian, A. Systematic optimization of corrosion, bioactivity, and biocompat-ibility behaviors of calcium-phosphate plasma electrolytic oxidation (PEO) coatings on titanium substrates. Ceram. Int. 2022, 48, 6322–6337. [Google Scholar] [CrossRef]
  35. Sayed, M.; Mahmoud, E.M.; Bondioli, F.; Naga, S.M. Developing porous diopside/hydroxyapatite bio-composite scaffolds via a combination of freeze-drying and coating process. Ceram. Int. 2019, 45, 9025–9031. [Google Scholar] [CrossRef]
  36. Bragg, W.L.; Claringbull, G.F. Crystal Structure of Minerals; Cornell University Press: Ithaca, NY, USA, 1965; Volume 4. [Google Scholar]
  37. Palakurthy, S.; Reddy, K.V.G.; Samudrala, R.K.; Azeem, P.A. In vitro bioactivity and degradation behaviour of β-wollastonite derived from natural waste. Mater. Sci. Eng. C 2019, 98, 109–117. [Google Scholar] [CrossRef]
  38. Sedelnikova, M.B.; Ugodchikova, A.V.; Tolkacheva, T.V.; Chebodaeva, V.V.; Cluklhov, I.A.; Khimich, M.A.; Bakina, O.V.; Lerner, M.I.; Egorkin, V.S.; Schmidt, J.; et al. Surface modification of Mg0.8Ca alloy via wollastonite micro-arc coatings: Significant improvement in corrosion resistance. Metals 2021, 11, 754. [Google Scholar] [CrossRef]
  39. Sedelnikova, M.B.; Mayer, V.V.; Bakina, O.V.; Kashin, A.D.; Uvarkin, P.V.; Khimich, M.A.; Luginin, N.A.; Glukhov, I.A.; Tolkacheva, T.V.; Ugodchikova, A.V.; et al. Antibacterial amorphous-crystalline coatings based on wollastonite and ZnO particles. Crystals 2024, 14, 886. [Google Scholar] [CrossRef]
  40. Osborn, E.F.; Muan, A.; Levin, E.M.; Robbins, C.R.; McMurdie, H.F. Phase Diagrams for Ceramists; American Ceramic Society: Columbus, OH, USA, 1964; p. 598. [Google Scholar]
  41. Brazete, D.; Torres, P.M.C.; Abrantes, J.C.C.; Ferreira, J.M.F. Influence of the Ca/P ratio and cooling rate on the allotropic α↔β-tricalcium phosphate phase transformations. J. Ceram. Int. 2018, 44, 8249–8256. [Google Scholar] [CrossRef]
  42. Kim, S.A.; Hussain, S.K.; Abbas, M.A.; Bang, J.H. High-temperature solid-state rutile-to-anatase phase transformation in TiO2. J. Solid State Chem. 2022, 315, 123510. [Google Scholar] [CrossRef]
  43. Karunadasa, K.S.P.; Manoratne, C.H. Microstructural view of anatase to rutile phase transformation examined by in-situ high-temperature X-ray powder diffraction. J. Solid State Chem. 2022, 314, 123377. [Google Scholar] [CrossRef]
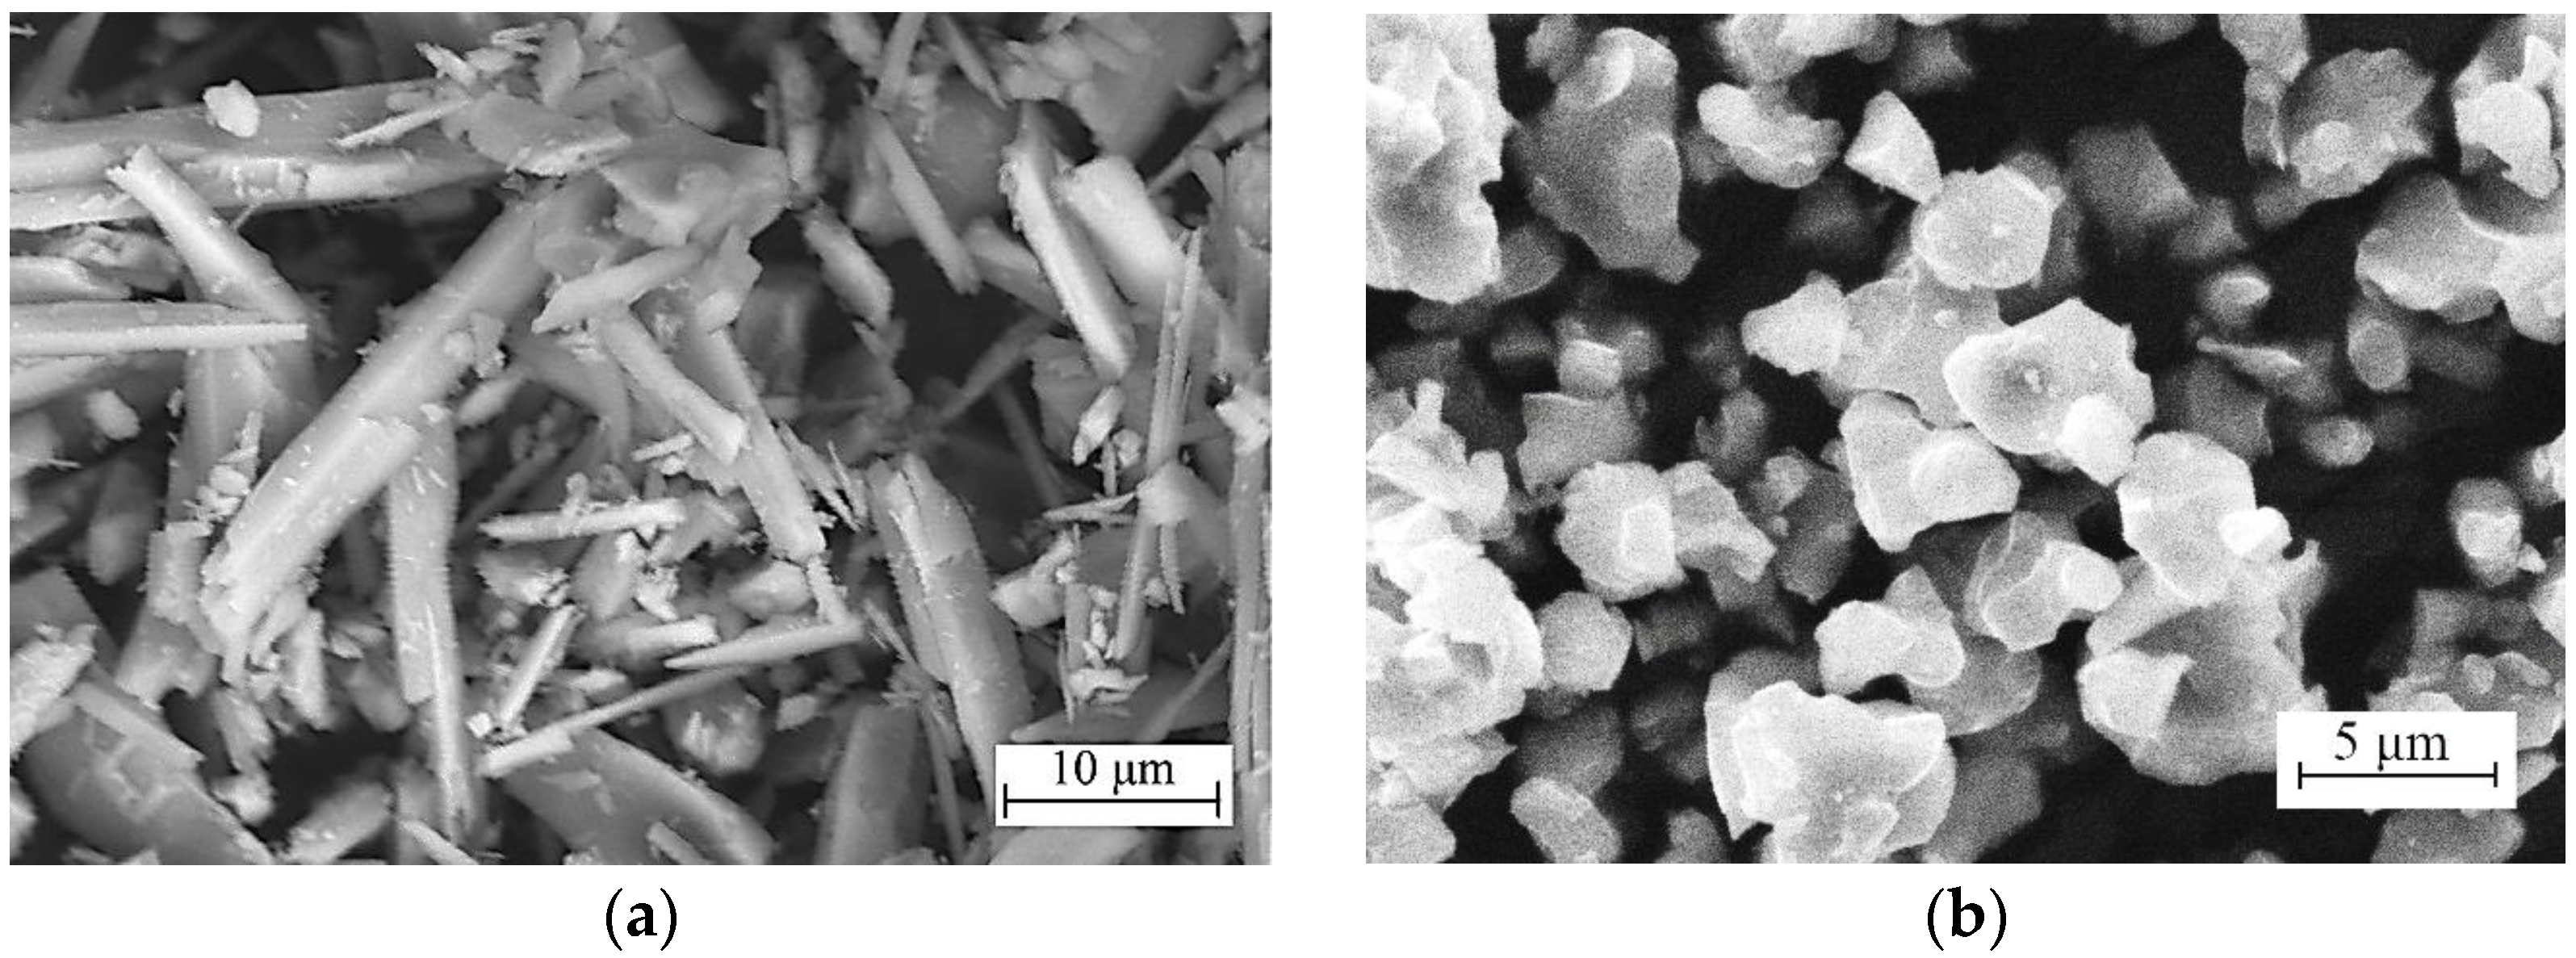
Figure 1. SEM images of wollastonite (a) and β-TCP powders (b).
Crystals 15 00811 g001
Figure 2. Specific electrical conductivity of electrolytes with dispersed particles (a), plots of current density variation during the MAO process at a voltage of 400 V (b).
Crystals 15 00811 g002
Figure 3. Graphs of change in current density of the MAO process and in thickness of CP (a), CS (b), and SP (c) coatings versus time.
Crystals 15 00811 g003
Figure 4. SEM images of CP (a,d), CS (b,e), and SP (c,f) coatings synthesized at 400 V.
Crystals 15 00811 g004
Figure 5. SEM images of CP (a,d), CS (b,e), and SP (c,f) coatings synthesized at 500 V.
Crystals 15 00811 g005
Figure 6. SEM images of coating cross-sections (ac) and distribution of elements over coating cross-sections (df): (a,d)—CP coating, (b,e)—CS coating, (c,f)—SP coating; voltage during MAO process −400 V.
Crystals 15 00811 g006
Figure 7. SEM images with highlighted investigated areas of CP (a), CS (b), and SP (c) coatings; histograms of chemical elements distribution on the surface of CP (d), CS (e), and SP (f) coatings formed at 400 V.
Crystals 15 00811 g007
Figure 8. X-ray diffraction patterns of CP coatings (a), CS coatings (b), and SP coatings (c) formed at 400 V and application times of 1, 3, and 5 min: β—β-TCP, α—α-TCP, W—wollastonite, T—α-Ti, A—anatase (TiO2).
Crystals 15 00811 g008
Figure 9. Bright-field TEM images of particle fragments of CP (a), CS (c), and SP (e) coatings, microdiffraction patterns and dark-field TEM images of particle fragments of CP (b), CS (d), and SP (f) coatings: A—anatase, β—β-TCP, α—α-TCP, W—wollastonite, H—hydroxyapatite.
Crystals 15 00811 g009
Figure 10. Graphs of thickness and roughness of CP (a), CS (b), and SP (c) coatings on titanium alloy versus the MAO process voltage.
Crystals 15 00811 g010
Figure 11. Optical images of scratches: (a) on CP coating, (b) on CS coating, (c) on SP coating, on titanium alloy at MAO voltage of 500 V.
Crystals 15 00811 g011
Figure 12. Dependence of the critical load measured for CP, CS, and SP coatings on the MAO process voltage.
Crystals 15 00811 g012
Table 1. Electrolyte compositions.
CompoundContent in the Electrolyte Composition, g/L
I IIIII
CaSiO3 (wollastonite)9045
β-Ca3(PO4)2 (β-TCP)9045
Na2HPO4·12H2O2010
NaOH101010
Na2SiO352.5
NaF 555
pH111211
Coating designatorCPCSSP
Table 2. Content of chemical elements in highlighted areas of coatings, at. %.
Elements1234567
O 67.8 ± 1.268.4 ± 1.168.1 ± 0.963.7 ± 1.369.2 ± 0.869.0 ± 1.265.4 ± 1.1
Na 1.2 ± 0.13.3 ± 0.90.7 ± 0.034.6 ± 0.74.1 ± 0.41.9 ± 0.65.4 ± 0.9
P12 ± 0.99.4 ± 0.59.3 ± 0.73.3 ± 0.46.0 ± 0.5
Si15.7 ± 0.514.6 ± 0.82.0 ± 0.213.7 ± 0.95.9 ± 0.3
Ca15.7 ± 0.95.1 ± 0.214.7 ± 0.715.7 ± 0.613.5 ± 0.411.1 ± 0.310.1 ± 0.7
Ti3.4 ± 0.213.9 ± 0.80.7 ± 0.092.3 ± 0.11.9 ± 0.081.0 ± 0.057.3 ± 0.6
Coating
designator
CPCSSP
Disclaimer/Publisher’s Note: The statements, opinions and data contained in all publications are solely those of the individual author(s) and contributor(s) and not of MDPI and/or the editor(s). MDPI and/or the editor(s) disclaim responsibility for any injury to people or property resulting from any ideas, methods, instructions or products referred to in the content.