1. Introduction
Turbojet engines are multipart machines with many components operating in harsh environmental conditions. One of the most important engine components is the turbine blades. Turbine blades are exposed to complex forces acting during high working temperatures. The blades’ operating conditions determine, among others, the properties of the material used and the blade’s geometrical design related to combustion gas flow and heat dissipation. Therefore, they must, among others, resist high-temperature creep, fatigue, corrosion, and oxidation during long-term service. Nowadays, for the above reasons, turbine blades are predominantly produced of CMSX-4
® nickel-based superalloys in single-crystalline form [
1,
2,
3,
4,
5].
Most frequently, the Bridgman technique with the vertical temperature gradient and withdrawal rate selected to form an array of dendrites with crystal orientation of [001] nearly parallel to the blade axis is used for the single-crystalline blade production [
6,
7]. The dendrites and interdendritic areas formed during the crystallization mainly consist of the Ni-based primary solid solution of γ-phase and the Ni
3Al-based secondary solid solution of γ′-phase with almost the same crystallographic parameters, e.g., crystal structure and lattice parameter [
1,
8].
The ongoing research is focused, among others, on increasing the strength parameters and durability of the blades, reducing the engine weight, and increasing the combustion temperature in aircraft engines to reduce fuel consumption and increase thrust [
9]. To realize it, the blades must be protected against high temperatures by producing them with cooling bores, allowing heat dissipation. Cooling bores are formed during crystallization by placing ceramic cores in the casting mold [
10,
11,
12].
The crystallization conditions of superalloys containing many alloying elements may differ locally due to local changes in thermal conditions, e.g., crystallization front shape and local crystallization rate [
13,
14]. The presence of cooling bores is also related to the formation of thin-walled areas of the airfoil between the bore surface and the suction or pressure surface, as well as between the surfaces of neighboring holes, further impeding crystallization. Therefore, the dendritic and crystal structure, particularly the dendrites’ morphology, crystal orientation, and the lattice parameters of both main consistent phases (γ′-phase of 70% vol. and γ-phase) should be characterized concerning possible distortions [
8,
15,
16].
The superalloys are anisotropic materials when they are crystallized directionally, and their properties depend on crystal orientation. For example, the resistance to high-temperature creep is very good in the relatively wide range toward the [001] direction [
1,
17,
18,
19]. Therefore, obtaining blades with high structural perfection, good strength, and mechanical properties is related to crystal orientation. Since the highest mechanical loads during operation, such as the centrifugal force, act along the blade axis, it is required that the [001] crystal direction be collinear with this axis [
17,
20,
21,
22]. It was stated that any deviation of the [001] direction from the axis causes deterioration in blade quality [
1,
8]. It is, therefore, essential to determine the crystal orientation of the produced blades and identify even small local changes in the orientation. The determination of the crystal orientation means the measurement of a primary crystal orientation described mainly by the α angle (which defines the deviation of the [001] direction from the main blade axis) and a secondary crystal orientation described by the γ angle (which defines the rotation of the [100] and [010] crystal directions about a chosen reference axis). The local change in the above angles suggests the neighboring areas’ rotation, often leading to the formation of low-angle boundaries [
23,
24].
Many studies with different methods of the superalloy bulks and final machine complex components, such as blades, have been carried out so far, and the results have been published. It is known that the defects mentioned above, which already occur during crystallization, may cause a decrease in the strength of the blade [
25,
26,
27,
28]. It is also known that not all growth defects can be eliminated during subsequent blade processing, e.g., heat treatment. Some defects remain unchanged or are only modified [
29,
30].
It has also been proven that defects that arise in the massive blade root, which crystallizes first, can be inherited by the airfoil, which already crystallizes under steady-state conditions [
31]. Defects in the airfoil can also arise due to physical barriers in the path of dendrite arm growth. Such barriers are most often the surfaces of the casting mold walls [
11,
32].
Previous studies of cored model blades have only included the blade root region [
33]. The dendritic structure has been characterized, and growth defects have been identified. The dendritic structure was not homogeneous in its entire root volume. There were observed differences in the size of dendrite arms and the interdendritic distance, most frequently depending on their location relative to the selector. When a growing dendrite meets the barrier of cooling bores or the mold wall, the growth direction changes, causing structural disorder during the subsequent growth in the root. The subgrains separated by low-angle boundaries were also observed near the cooling bores.
The relationship between the crystal structure, especially the dendritic structure defects, crystal orientation defects, and local changes in the crystal lattice parameter of single-crystalline castings and their mechanical properties is crucial. Creep resistance is essential for turbine blades of jet engines, especially those made of the CMSX-4
® nickel superalloy. Past studies have focused, i.e., on the influence of the perfection of a crystal structure on the creep resistance of Ni-based superalloy castings. Most studies evaluating the structure of single-crystalline Ni-based superalloy castings focus on large-scale analysis. Various factors have been found to influence creep resistance, including the degree of porosity in the castings, the relative volume of the precipitates of strengthening γ′-phase, homogeneity of a primary crystal orientation across the entire casting, heat treatment conditions, and the distance between the primary and secondary dendrite arms. These include measurements in a selected casting fragment using well-known and conventional light or scanning microscopy methods, as well as long-established X-ray methods or computer simulations. Authors use samples in the form of rods, bars, or solid bulk blades without direct correlation to the final complex shape of the cooled blades [
34,
35]. The presented research focused on novel model cored blades with asymmetric grain selector location. It involved preliminary studies of structural perfection at various structural scales that assessed local defects, low-angle boundaries, and elastic deformation of the crystal lattice in relation to the blade’s geometric characteristics. A novel, unique Ω-scan method was used, specifically designed for nickel-based superalloys (especially by diffractometer construction and dedicated software). The method was combined with the classic, but currently less commonly used, X-ray topography method to study the defect structure of single crystals, supplemented by analysis of lattice parameter changes. These methods encompass various scales of structural defects, and the interconnection of their results is a novelty in research methodology.
The presented studies aimed to characterize the dendritic structure defects, orientation defects, and local changes in the crystal lattice parameter in the model cored turbine blades’ airfoils in an as-cast state. The influence of cooling bores on the dendritic growth and the creation of defects in the blade airfoil was also studied. Such characterization will complement the knowledge of the effects occurring during the single-crystallization of cored blades. It may help to modify the manufacturing technology to reduce growth defects at the first production stage.
2. Materials and Methods
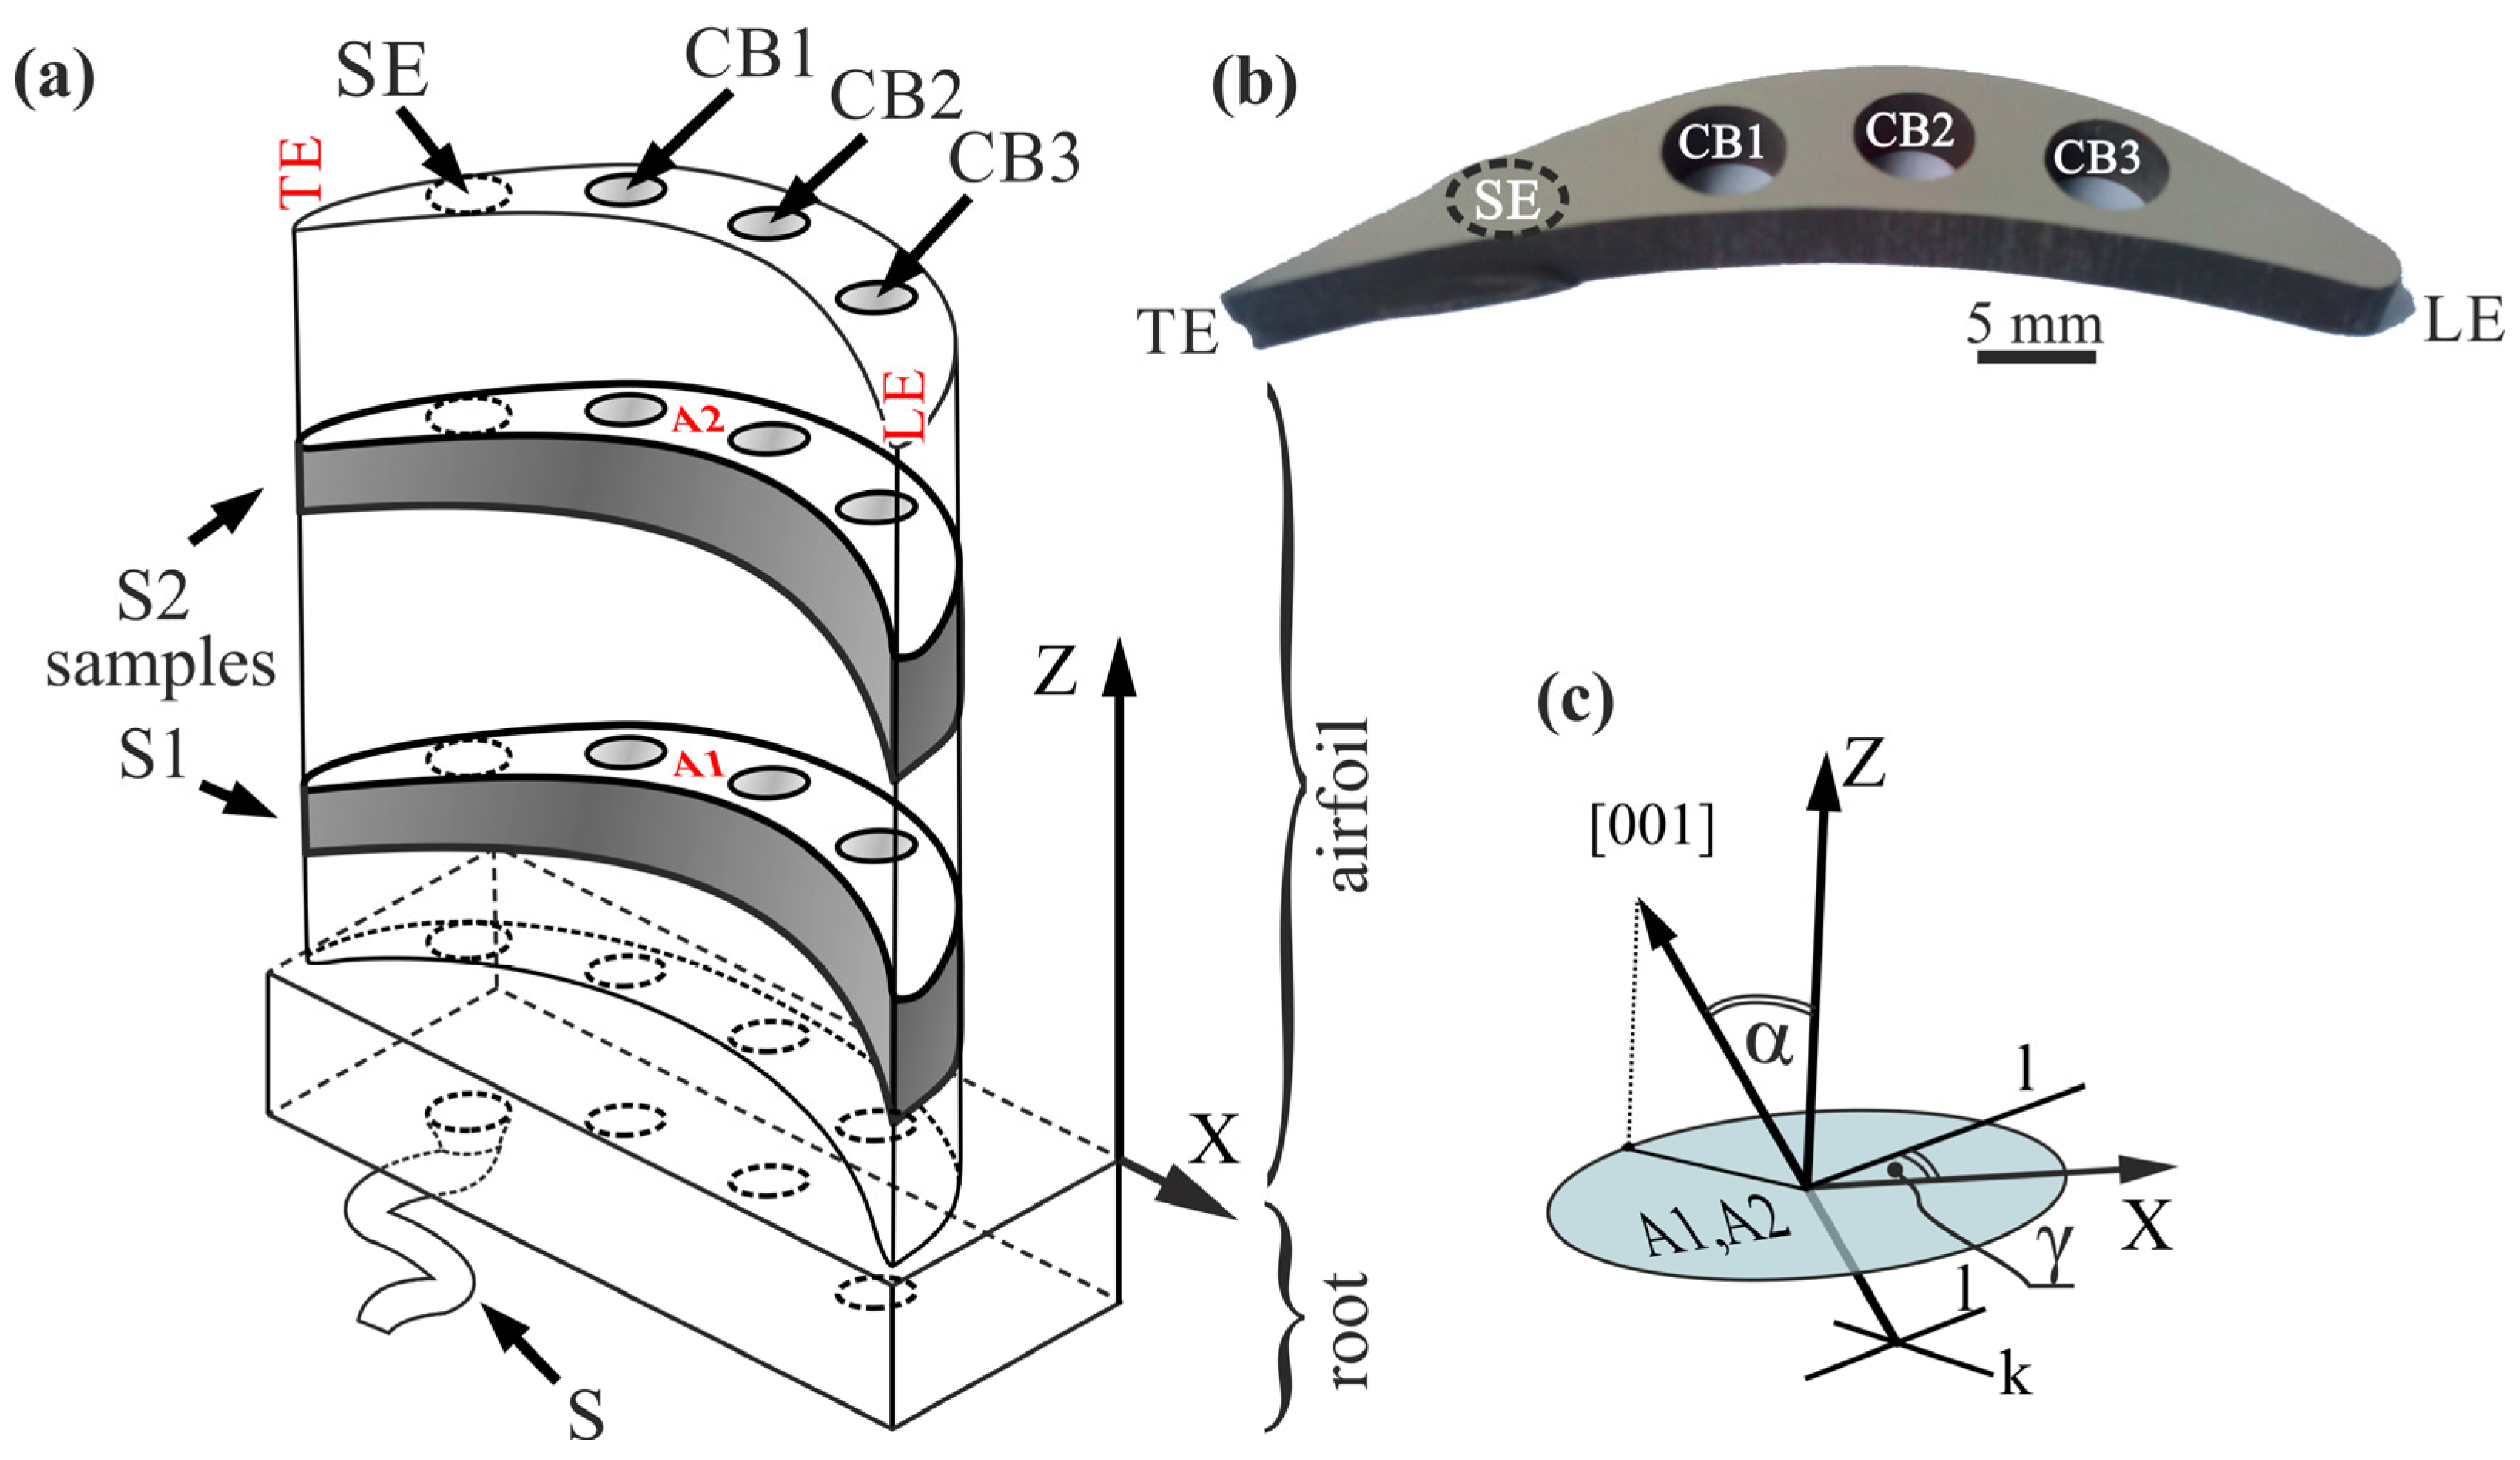
The as-cast cored model blades with a simplified shape shown in
Figure 1a were used for the analysis. The utmost values of the manufactured blade size were approximately 100 mm in height, and 50 mm × 15 mm in the footing of the root. The blades contained three cylindrical cooling bores: CB1, CB2, and CB3, each 5 mm in diameter, arranged along the camber line of the blade. Four single crystalline blade castings were crystallized from commercial nickel-based CMSX-4
® superalloy (nominal chemical composition in wt.%: 5.6 Al, 1.0 Ti, 6.5 Ta, 6.5 Cr, 0.6 Mo, 6.0 W, 9.0 Co, 3.0 Re, 0.1 Hf, less than 0.002 C, and Ni bal.) by the Bridgman method using industrial VIM 2 E-DS/SC furnace by ALD Vacuum Technologies GmbH, Hanau, Germany, with vertical temperature gradient, which is the equipment of the Research and Development Laboratory for Aerospace Materials, Rzeszów University of Technology, Poland. The applied temperature gradient in the furnace ranged from 15 to 17 K/cm, and the pulling-out rate from the high-temperature zone, approximately equal to the average crystallization rate, was 3 mm/min. The raw CMSX-4
® alloy with the liquidus temperature (complete melting) of 1394 °C was melted, and the liquid metal at a temperature of 1520 °C was poured into the ceramic mold. Then the single crystallization started. The required crystal orientation of the [001] parallel to the
Z-axis was realized using a spiral grain selector S connected to the blade via a continuer. The selector S with continuer was located in the area without cooling bores from the trailing edge TE side of the airfoil (
Figure 1a).
The samples for analysis were cut from the airfoils, as presented in
Figure 1a. An example photo of the sample is presented in
Figure 1b. The study was performed on the A1 and A2 type cross-section surfaces near the root–airfoil connection and the blade tip, respectively (
Figure 1a). Microsections were prepared using a standard procedure for nickel-based superalloys [
36] on 3 mm thick samples type S1 and S2 (
Figure 1), cut by electrical discharge machining. Subsequent microsections for measurement were prepared from each sample by grinding and polishing the subsequent lower layers.
Microstructure observations were performed by scanning electron microscopy (SEM) with backscattered electron (BSE) imaging with the use of JSM-6480 JEOL SEM microscope (JEOL Ltd., Tokyo, Japan). The SEM images were taken without surface etching. The microstructure image of the cross-sections was obtained by combining many separate SEM micro-images. Primary dendrite arm spacing (PDAS) measurements were performed for quantitative microstructure analysis using a Nikon EPIPHOT 300, Nikon Co., Tokyo, Japan, metallographic microscope equipped with a digital camera and NIS-Elements-AR v.4.20 image analysis software. Average PDAS values were determined in selected regions of each metallographic section, across a dozen cross-sections prepared for each produced blade. PDAS was calculated based on the equation, where A is the surface of the area marked for analysis and N is the number of dendrite cores in the marked area. The surfaces for PDAS measurements were etched with Marble reagent.
The analyzed surfaces were subjected to back-reflection Laue diffraction to define crystal orientation, lattice symmetry, and single-crystalline perfection. The Laue patterns were recorded from several selected points on the analyzed sections using the X-ray diffractometer Laue system provided by TuR corporation (TuR GmbH, Potsdam, Germany). The X-ray white incident beam of Co radiation was used.
The α and γ angles describing the crystal orientation of the blade airfoils (
Figure 1c) were determined by the Ω-scan method using a dedicated EFG Freiberg Instruments X-ray diffractometer (EFG Freiberg Instruments GmbH, Freiberg, Germany) [
37]. The CuK
α characteristic radiation with the incident beam of 0.8 mm in diameter scanned the analyzed surface point by point with a measurement resolution of 0.5 mm. The results were presented on the angle distribution maps of the analyzed surfaces. The lattice parameter a
0 was also measured, and distribution maps were created using the above-mentioned method. The a
0 values were calculated using dedicated diffractometer software from the diffraction data obtained from the γ′-phase, whose volume fraction is above 70%. The method is of high sensitivity and allows the measurement of slight changes in the α angle of the order of arc minutes despite analyzing large macroscopic surfaces. The mean error of the a
0γ′, as well as the α and γ measurements, was 0.0005 Å and 0.006°, respectively.
It is well known that for single-crystalline turbine blades, any deviation of the [001] crystal direction of the axis
Z (
Figure 1c) causes a decrease in the crystal perfection [
1]. The deviation is described by the α angle, which is the main component of the primary orientation, and the γ angle, which defines the arrangement of the secondary dendrite arms about one chosen reference axis
X (
Figure 1c), e.g., to the edge of the blade root or line connecting LE and TE of the airfoil. Generally, the secondary dendrite arms grow parallel to the crystal directions [100] (
l) and [010] (
k). Relatively high changes in the abovementioned angles often result in the formation of low-angle boundaries (LABs) [
31,
38].
The degree of imperfection or disorder in a crystal structure was analyzed using X-ray diffraction topography. The PANalytical Microfocus diffractometer (Malvern Panalytical B.V., Alamelo, The Netherlands), generating a divergent X-ray beam of characteristic CuK
α radiation with an anode focal spot size of 20 × 20 mm
2 was applied. The topograms were recorded on AGFA Structurix X-ray film. The topograms were obtained using two techniques: with and without coupling oscillations of the X-ray film with the sample. The oscillations occurred about the Bragg angle within ±4° around the
Z-axis. A detailed description of the method is given in [
31,
38,
39].
3. Results
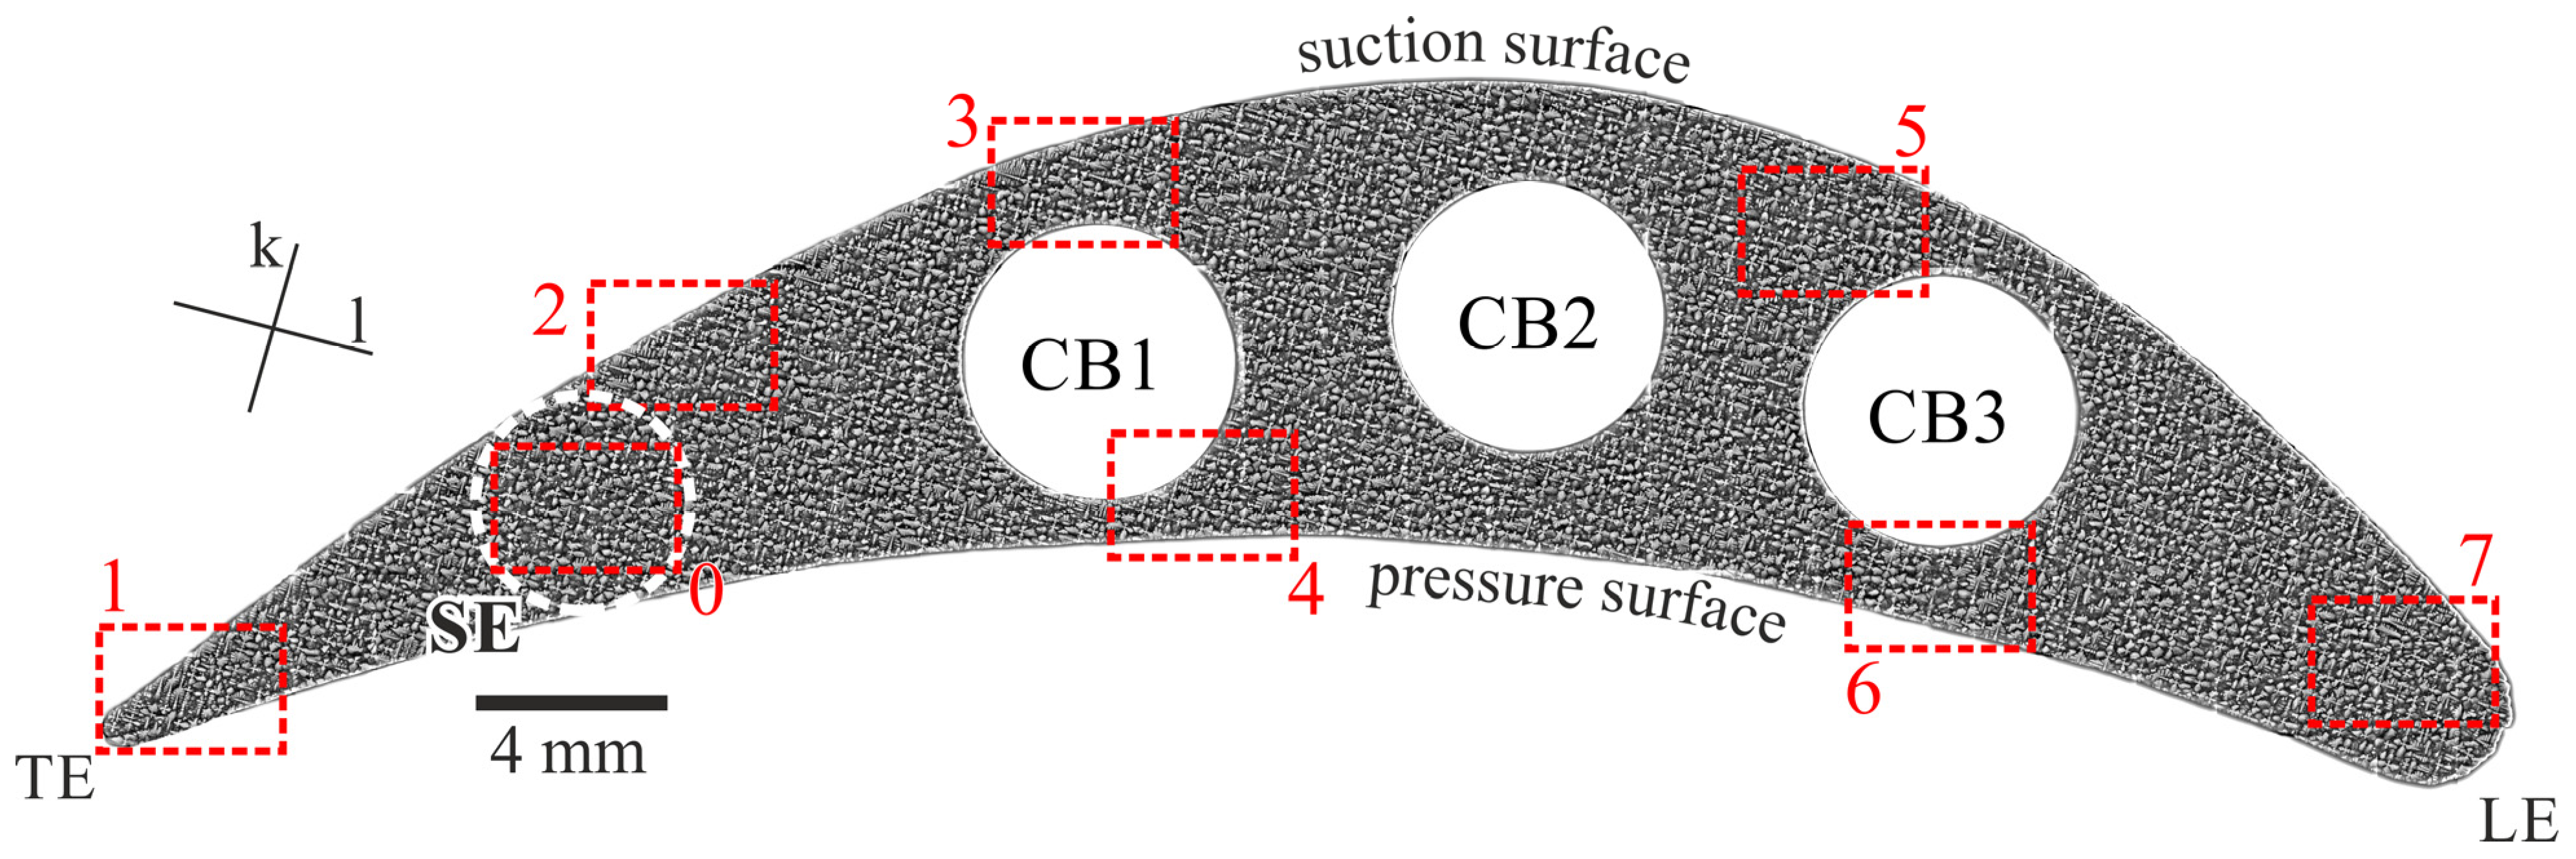
Figure 2 presents the SEM macro-image with the typical microstructure of the analyzed cross-sections. The dendritic structure characteristic of single-crystalline casts made of nickel-based superalloys is visible. The dendrites with secondary arms arranged along orthogonal
k and
l lines parallel to the [100] and [010] crystal directions are observed. In the selector extension (SE) area, which is the cylindrical shape bounded by the projection of the continuer’s perimeter along the
Z-axis into the blade, the dendrites grow directly from the selector, and the microstructure is the least influenced by the mold or bore walls. Several characteristic regions were chosen and marked on the microsection surface (numbered from 0 to 7—
Figure 2) to examine the dendritic structure in detail and determine the possible influence of cooling channels and mold walls on the morphology of the dendrite array.
Region 0 was selected in the SE area, where the dendrite array and morphology should be least distorted. Region 1 was located near the airfoil’s trailing edge (TE), where the mold walls are closer, creating a thin-walled airfoil area. Region 2 was chosen near the mold wall of the suction surface. Regions 3 and 4 were selected in the vicinity of the CB1 close to the suction and pressure surfaces, respectively. Regions 5 and 6 were selected in the vicinity of the CB3 close to the suction and pressure surfaces, respectively. These regions are thin-walled due to the proximity between the channel and mold walls. Region 7 was located near the airfoil’s leading edge (LE), which is the farthest area from the SE.
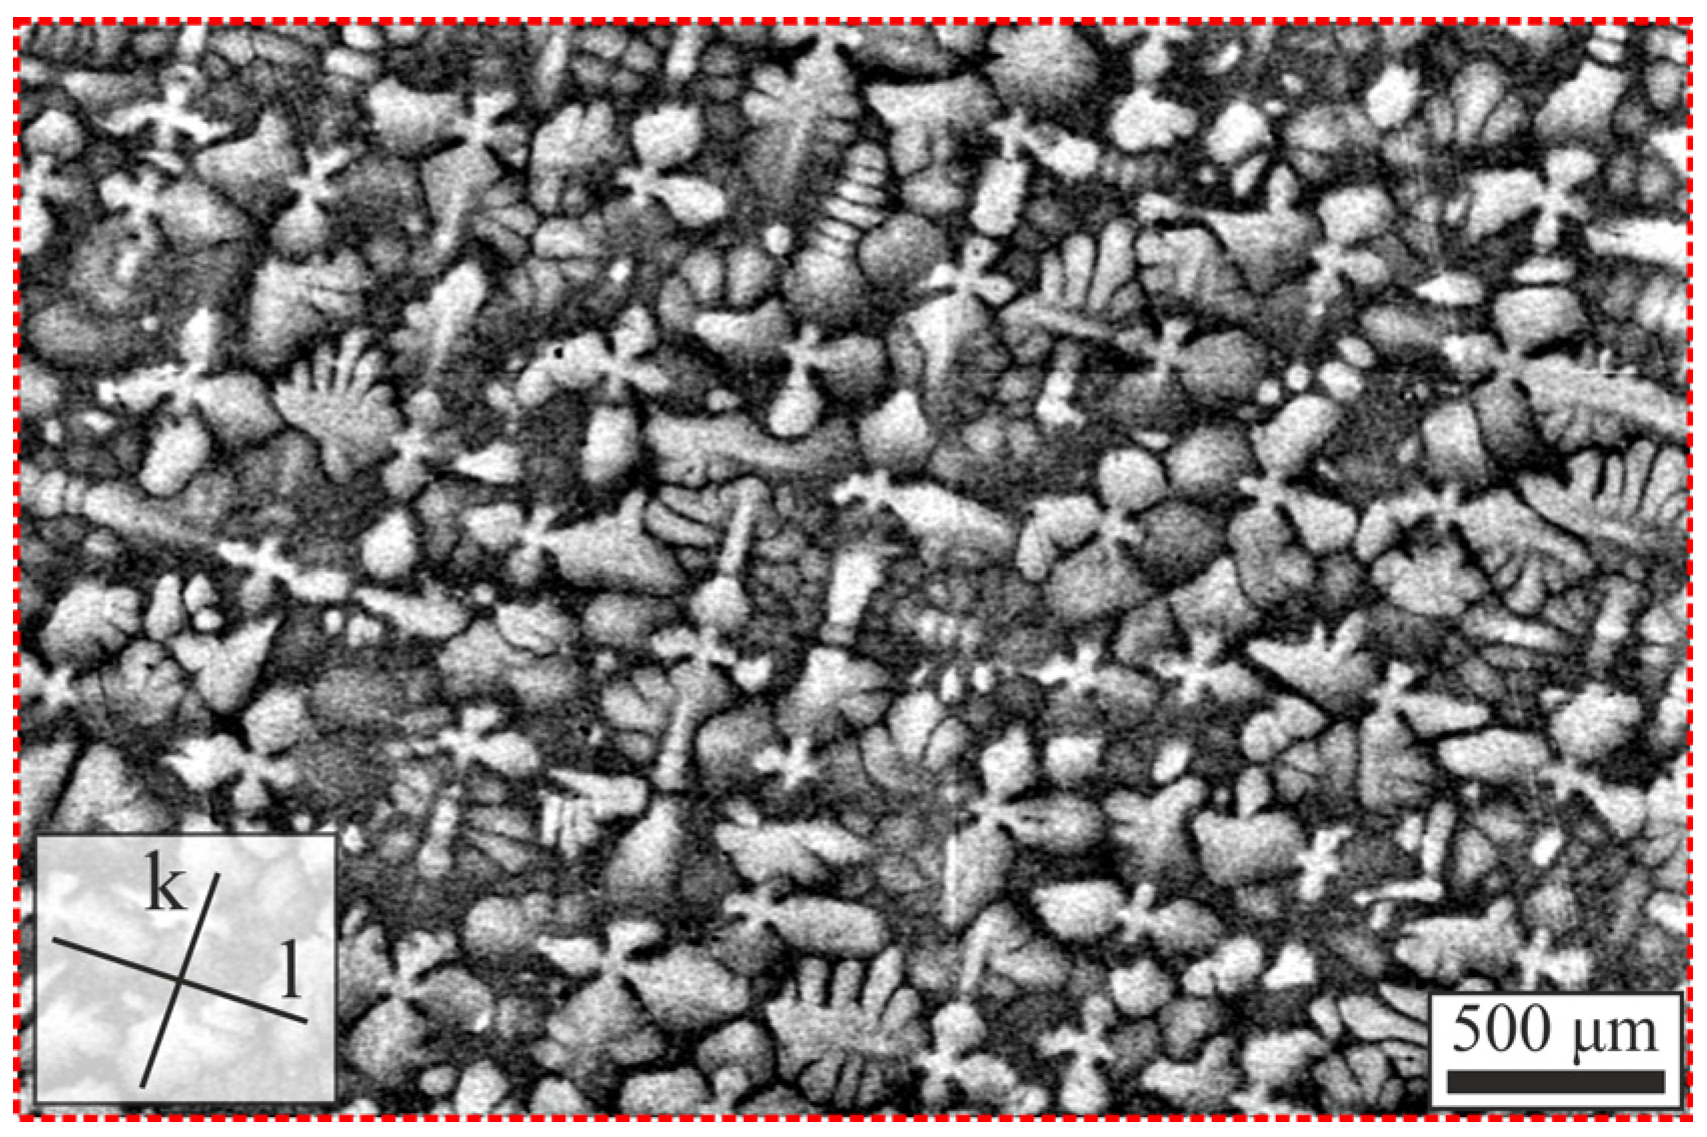
Figure 3 presents an example of the SEM image of the microstructure observed in region 0 (
Figure 2). The dendritic structure with relatively regular morphology of secondary dendrite arms typically occurs in the SE area, which is visible. The secondary dendrite arms arranged orthogonally along
k and
l lines are generally symmetric and possess similar shapes and sizes. The set of dendrites forms long chains only along the line
k.
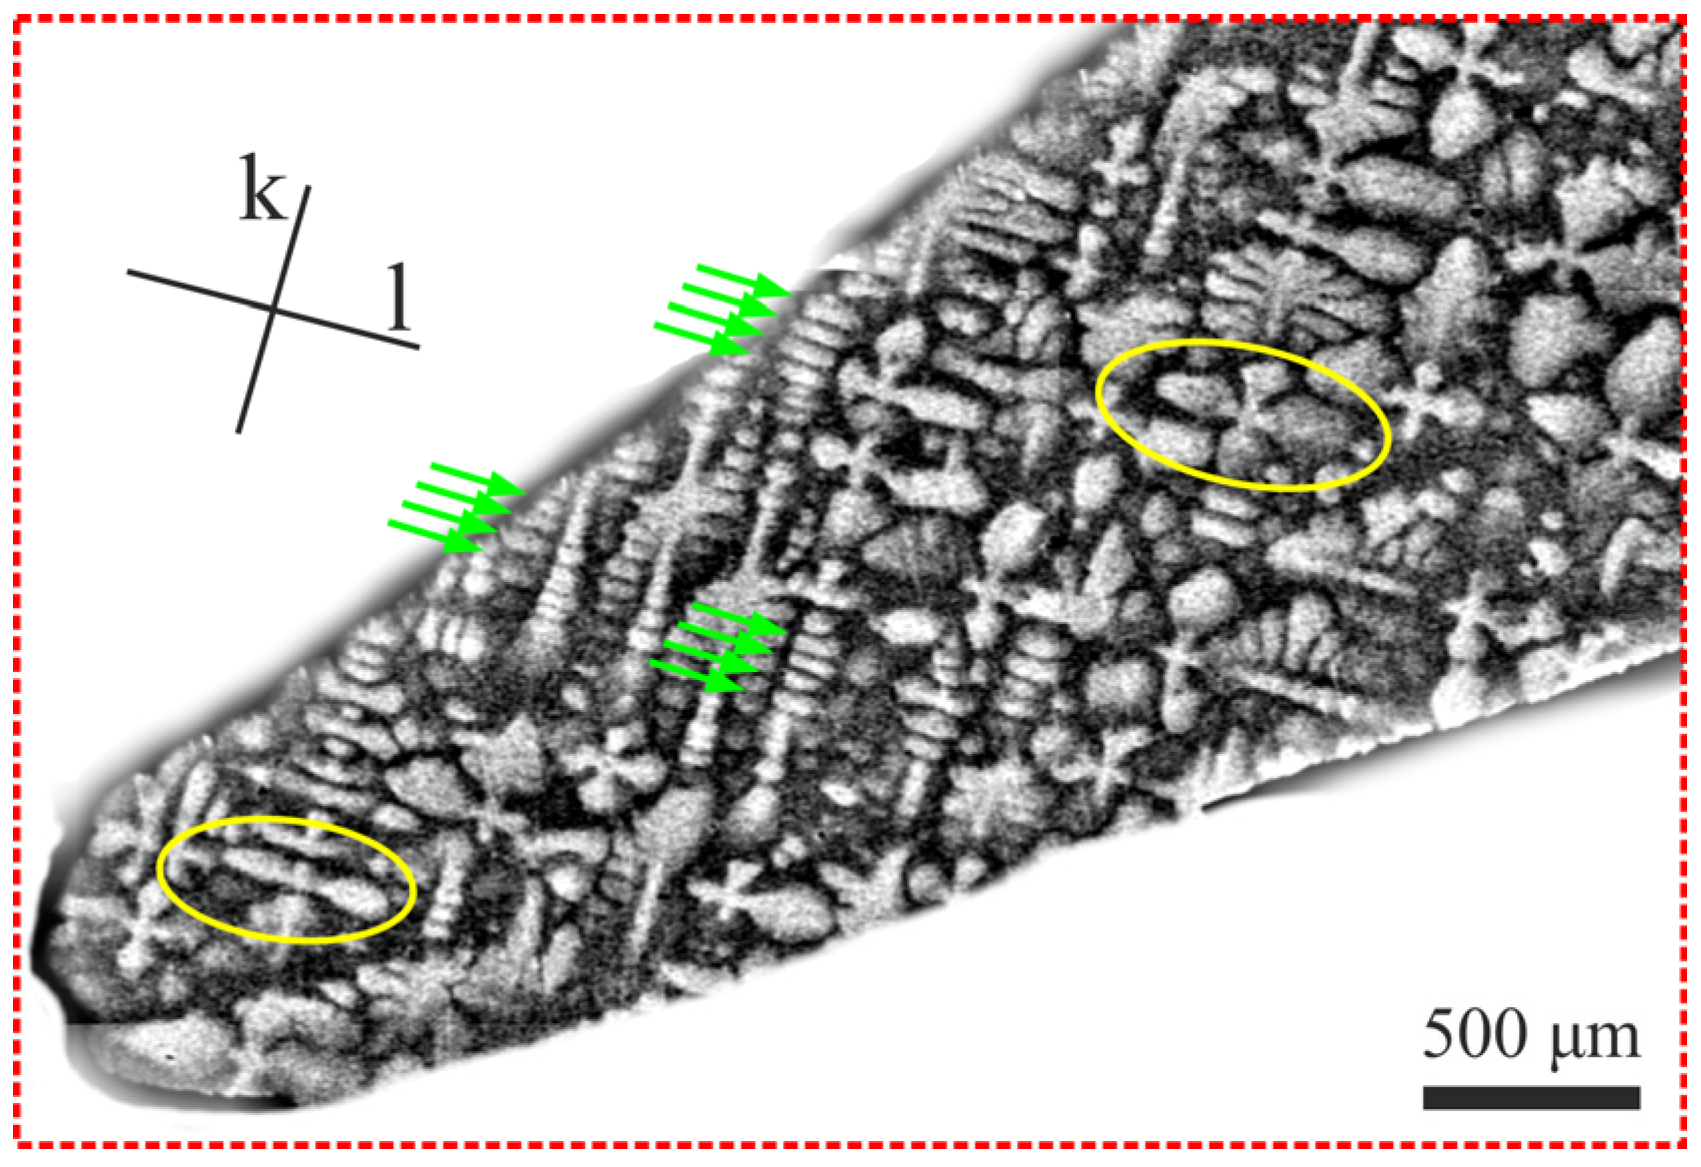
Figure 4 shows the SEM image of the dendritic structure fragment observed in region 1 near the TE of the blade airfoil. Some asymmetric secondary dendrite arms are visible, e.g., marked by the yellow rims. Many secondary dendrite arms are finer, elongated, and densely arranged, creating a set of parallel arms. The examples of typical sets of finer dendrite arms are marked by green arrows (
Figure 4). The elongation of these arms is revealed in the same direction, parallel to the line
l.
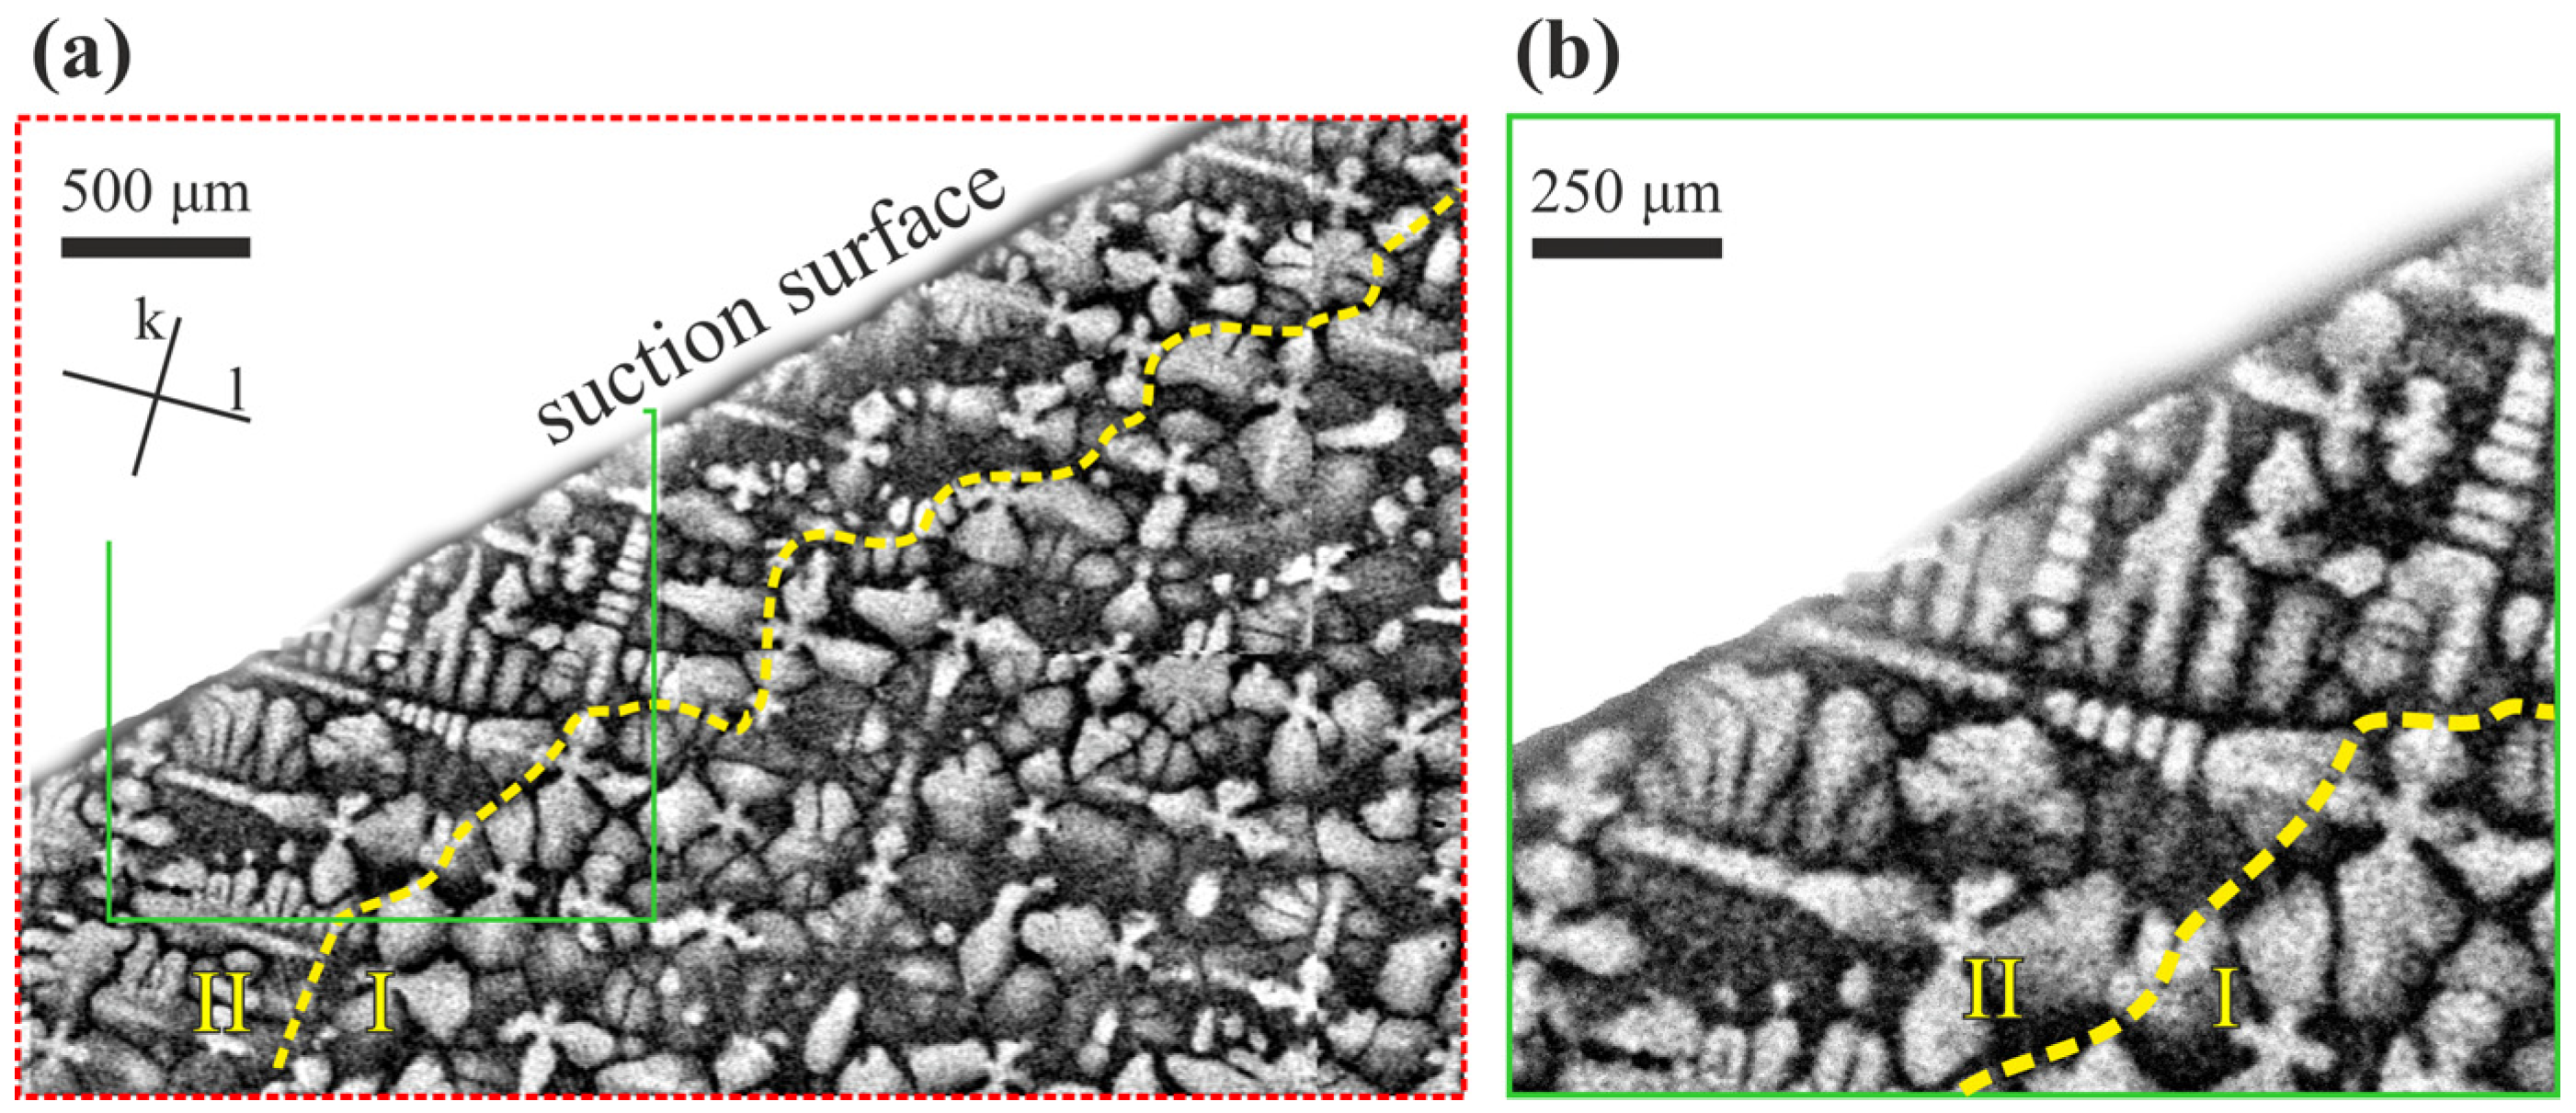
Figure 5 shows the SEM image of the dendritic structure fragment observed in region 2 located between the SE and suction surface of the blade airfoil. Two types of dendritic structures can be distinguished. The first type of structure is closer to the SE in the area marked as I (
Figure 5a,b). It is characterized by a more regular distribution of secondary dendrite arms, which are larger and more symmetrical than those observed for the second type structure in the area marked as II (
Figure 5b). In area I, secondary dendritic arms of variable shape are visible, deformed, and unevenly distributed. These dendrites have arms comparable in size to the arms in the SE area. The structure is finer in area II than in area I. Many thin and short dendritic arms are observed in area II, forming parallel bands. Some of the short arms are tertiary arms. Tertiary dendritic arms often grow closer to the edge of the suction surface, parallel to the line
k.
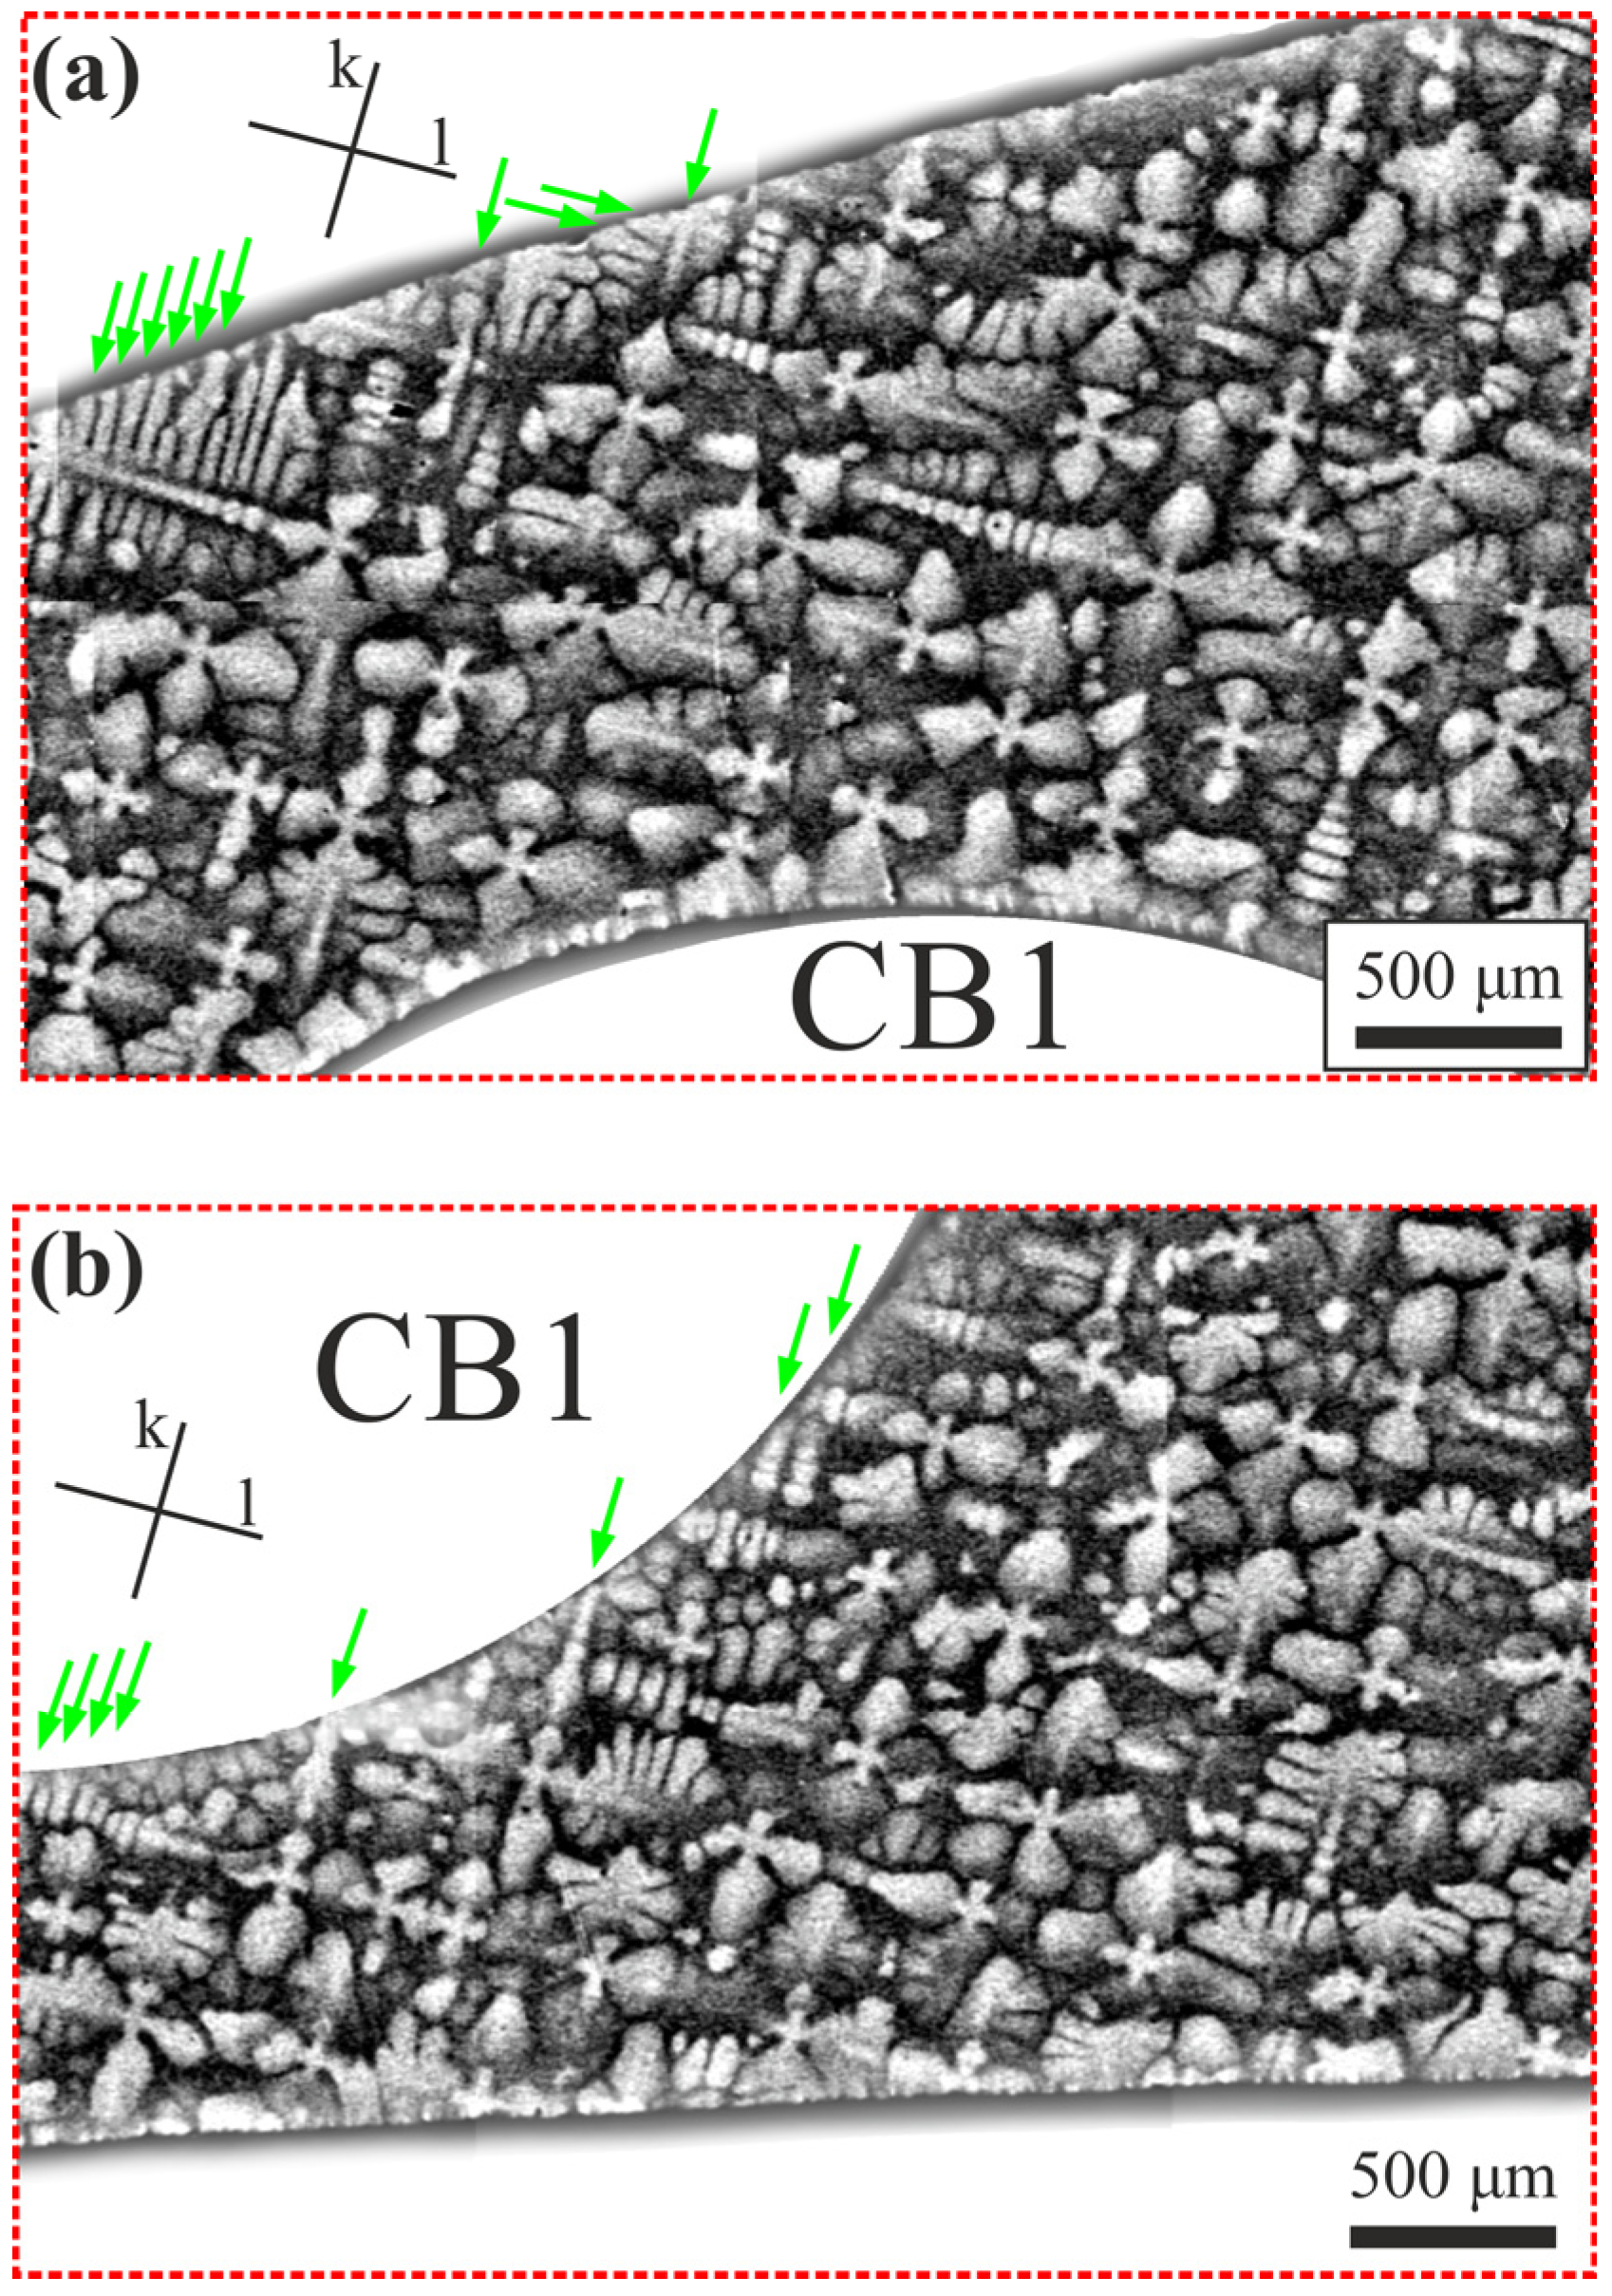
Figure 6 shows the SEM image of the dendritic structure fragment observed in regions 3 and 4 located between the CB1 and suction surface (
Figure 6a) and the blade airfoil’s pressure surface (
Figure 6b). A dendritic structure in region 3 (
Figure 6a) is similar to the microstructure observed close to the suction surface (area II—
Figure 5). Many fine, thin, and short tertiary dendrite arms (marked by arrows) form bands. The fine dendrite arms are arranged in orthogonal directions along lines
k and
l. A slightly more regular arrangement of larger dendrite secondary arms is observed close to the CB1 bore. For region 4 (
Figure 6b), the finest dendritic structure with tertiary arms is observed near the edge of CB1. The bands of thin, short dendrites are arranged along line
k, as marked by the arrows. In contrast, the dendritic structure is not fine near the pressure surface. The dendrites have slightly longer secondary arms, certain discontinued, with a more regular arrangement.
The dendritic microstructure close to the CB3 is shown in
Figure 7. A larger share of fine dendrite arms is noticed, especially at the edges of the suction surface and the CB3 (
Figure 7a). The dendrite arms are slightly larger only at a considerable distance from the mentioned edges. However, the dendrites in the entire region 5 are asymmetrical and irregularly distributed. The short tertiary arms are arranged parallel to the line
k. In the thin-walled area between CB3 and the pressure surface, most of the dendrite arms are short and arranged along line
l. Only a few larger dendrite arms may be observed in the middle of region 6, where a larger distance between the edges is noticed.
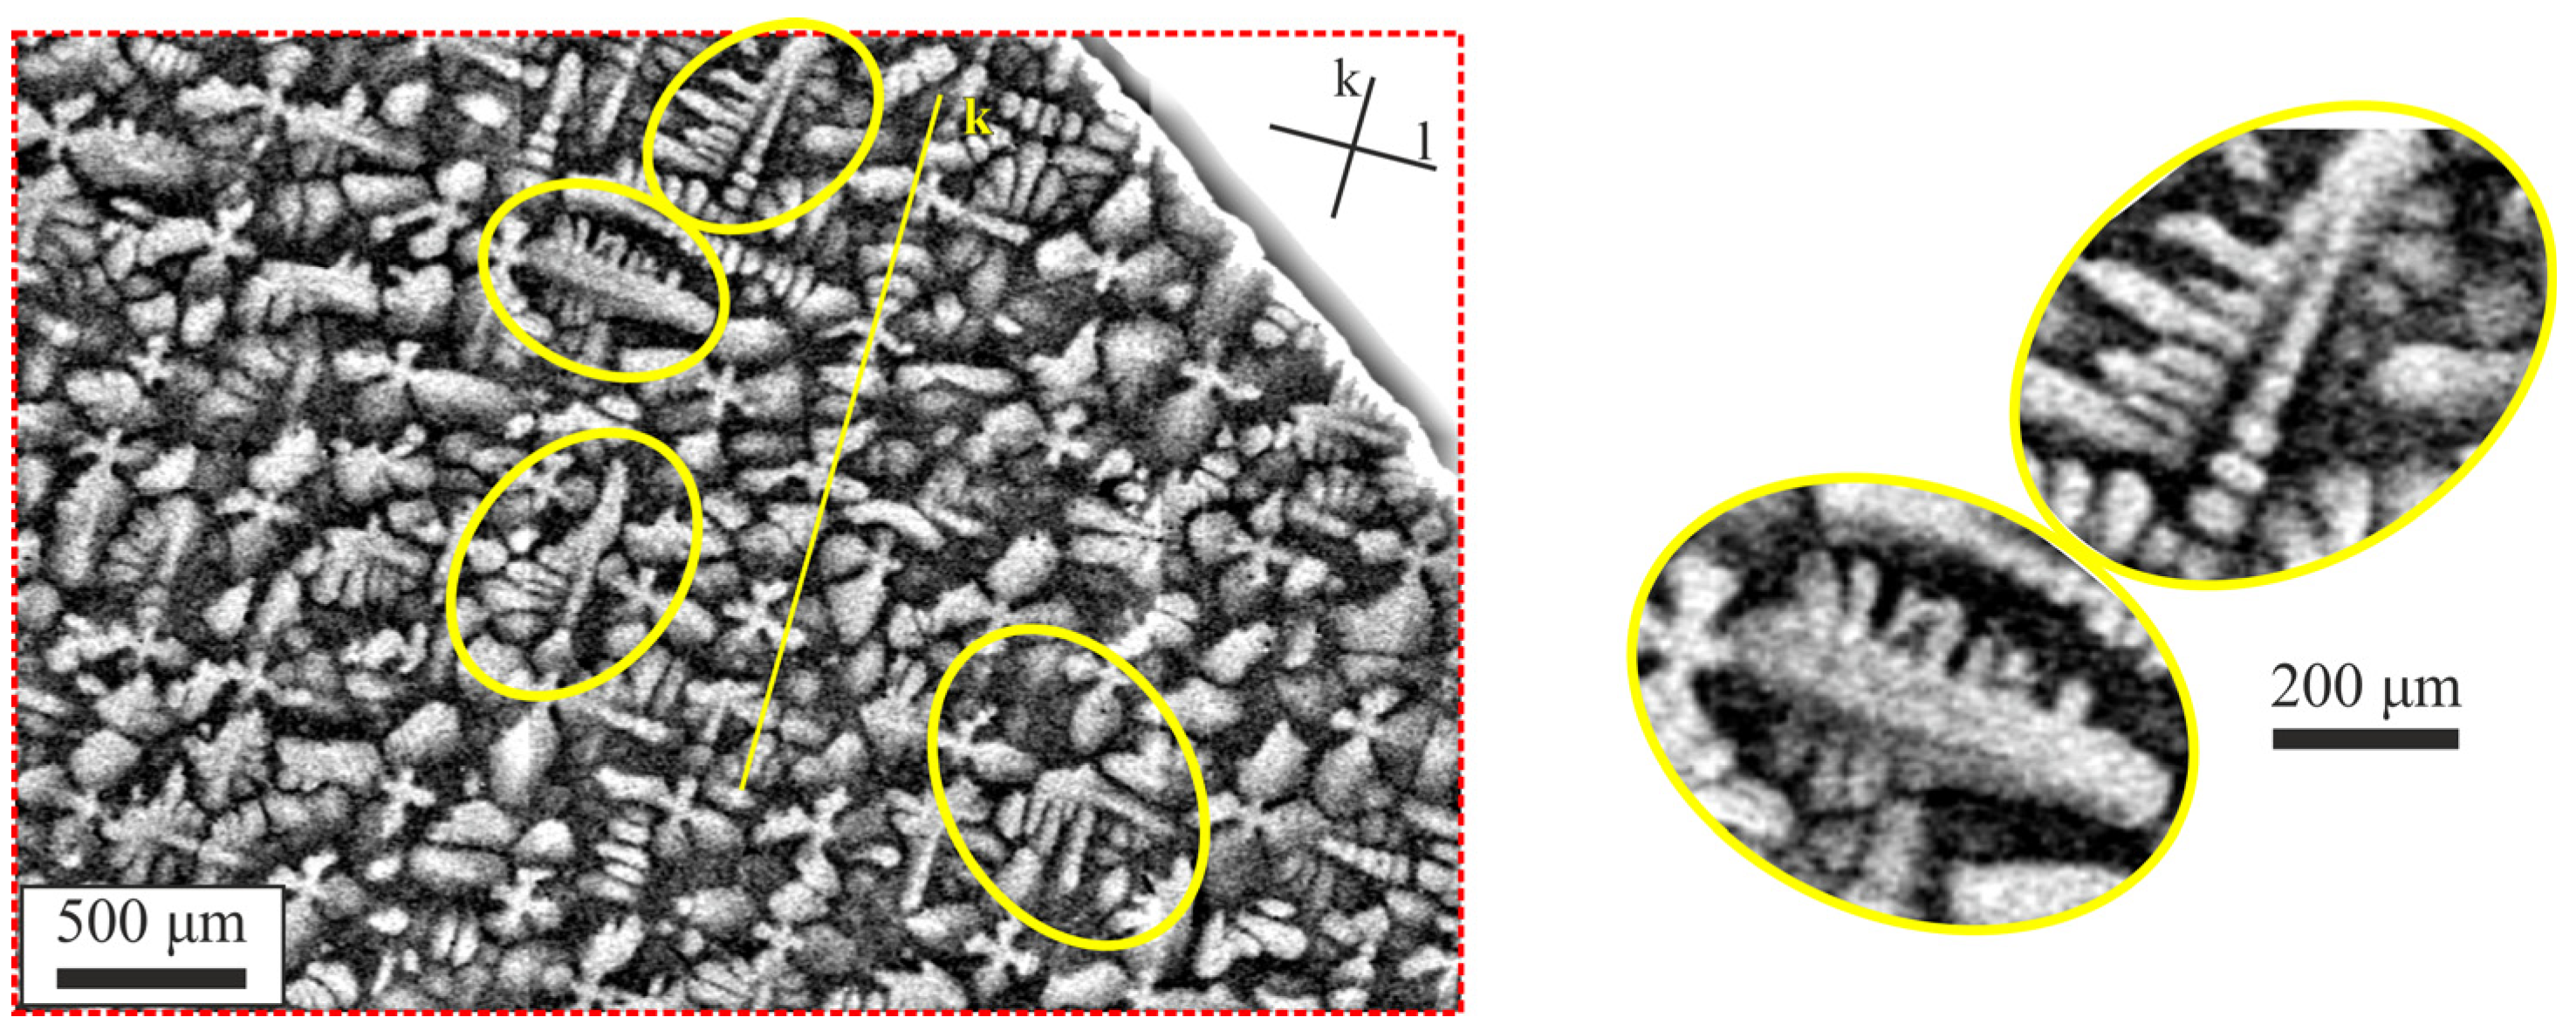
Figure 8 shows a typical dendritic structure in the region close to the LE. Dendritic chains, except for occasional cases, are not visible. The multiplication of dendritic arms to higher multiplicities is common, for example, in the areas indicated by the yellow rims visible at higher magnification in the insert. The size and morphology of dendritic arms vary throughout the analyzed region; dendrites are randomly distributed, and dendritic arms are asymmetric and have various shapes. The orientation of dendritic arms in certain parts of region 7 noticeably deviates (see, for example, the yellow line
k) from the directions of the
k and
l lines, which are typically parallel to them for most other regions of the airfoil cross-sections. Also in this region, fine dendrite arms are noticed, especially at the edges of the suction surface.
PDAS measurements were performed on several cross-sections of the four manufactured blades in both A1 and A2 type samples. The results were averaged over previously selected regions and presented in
Table 1. The analysis shows that the highest PDAS value occurs in region 0, i.e., the SE region, and the lowest in the thin-walled TE region and close to the suction surface of the airfoil.
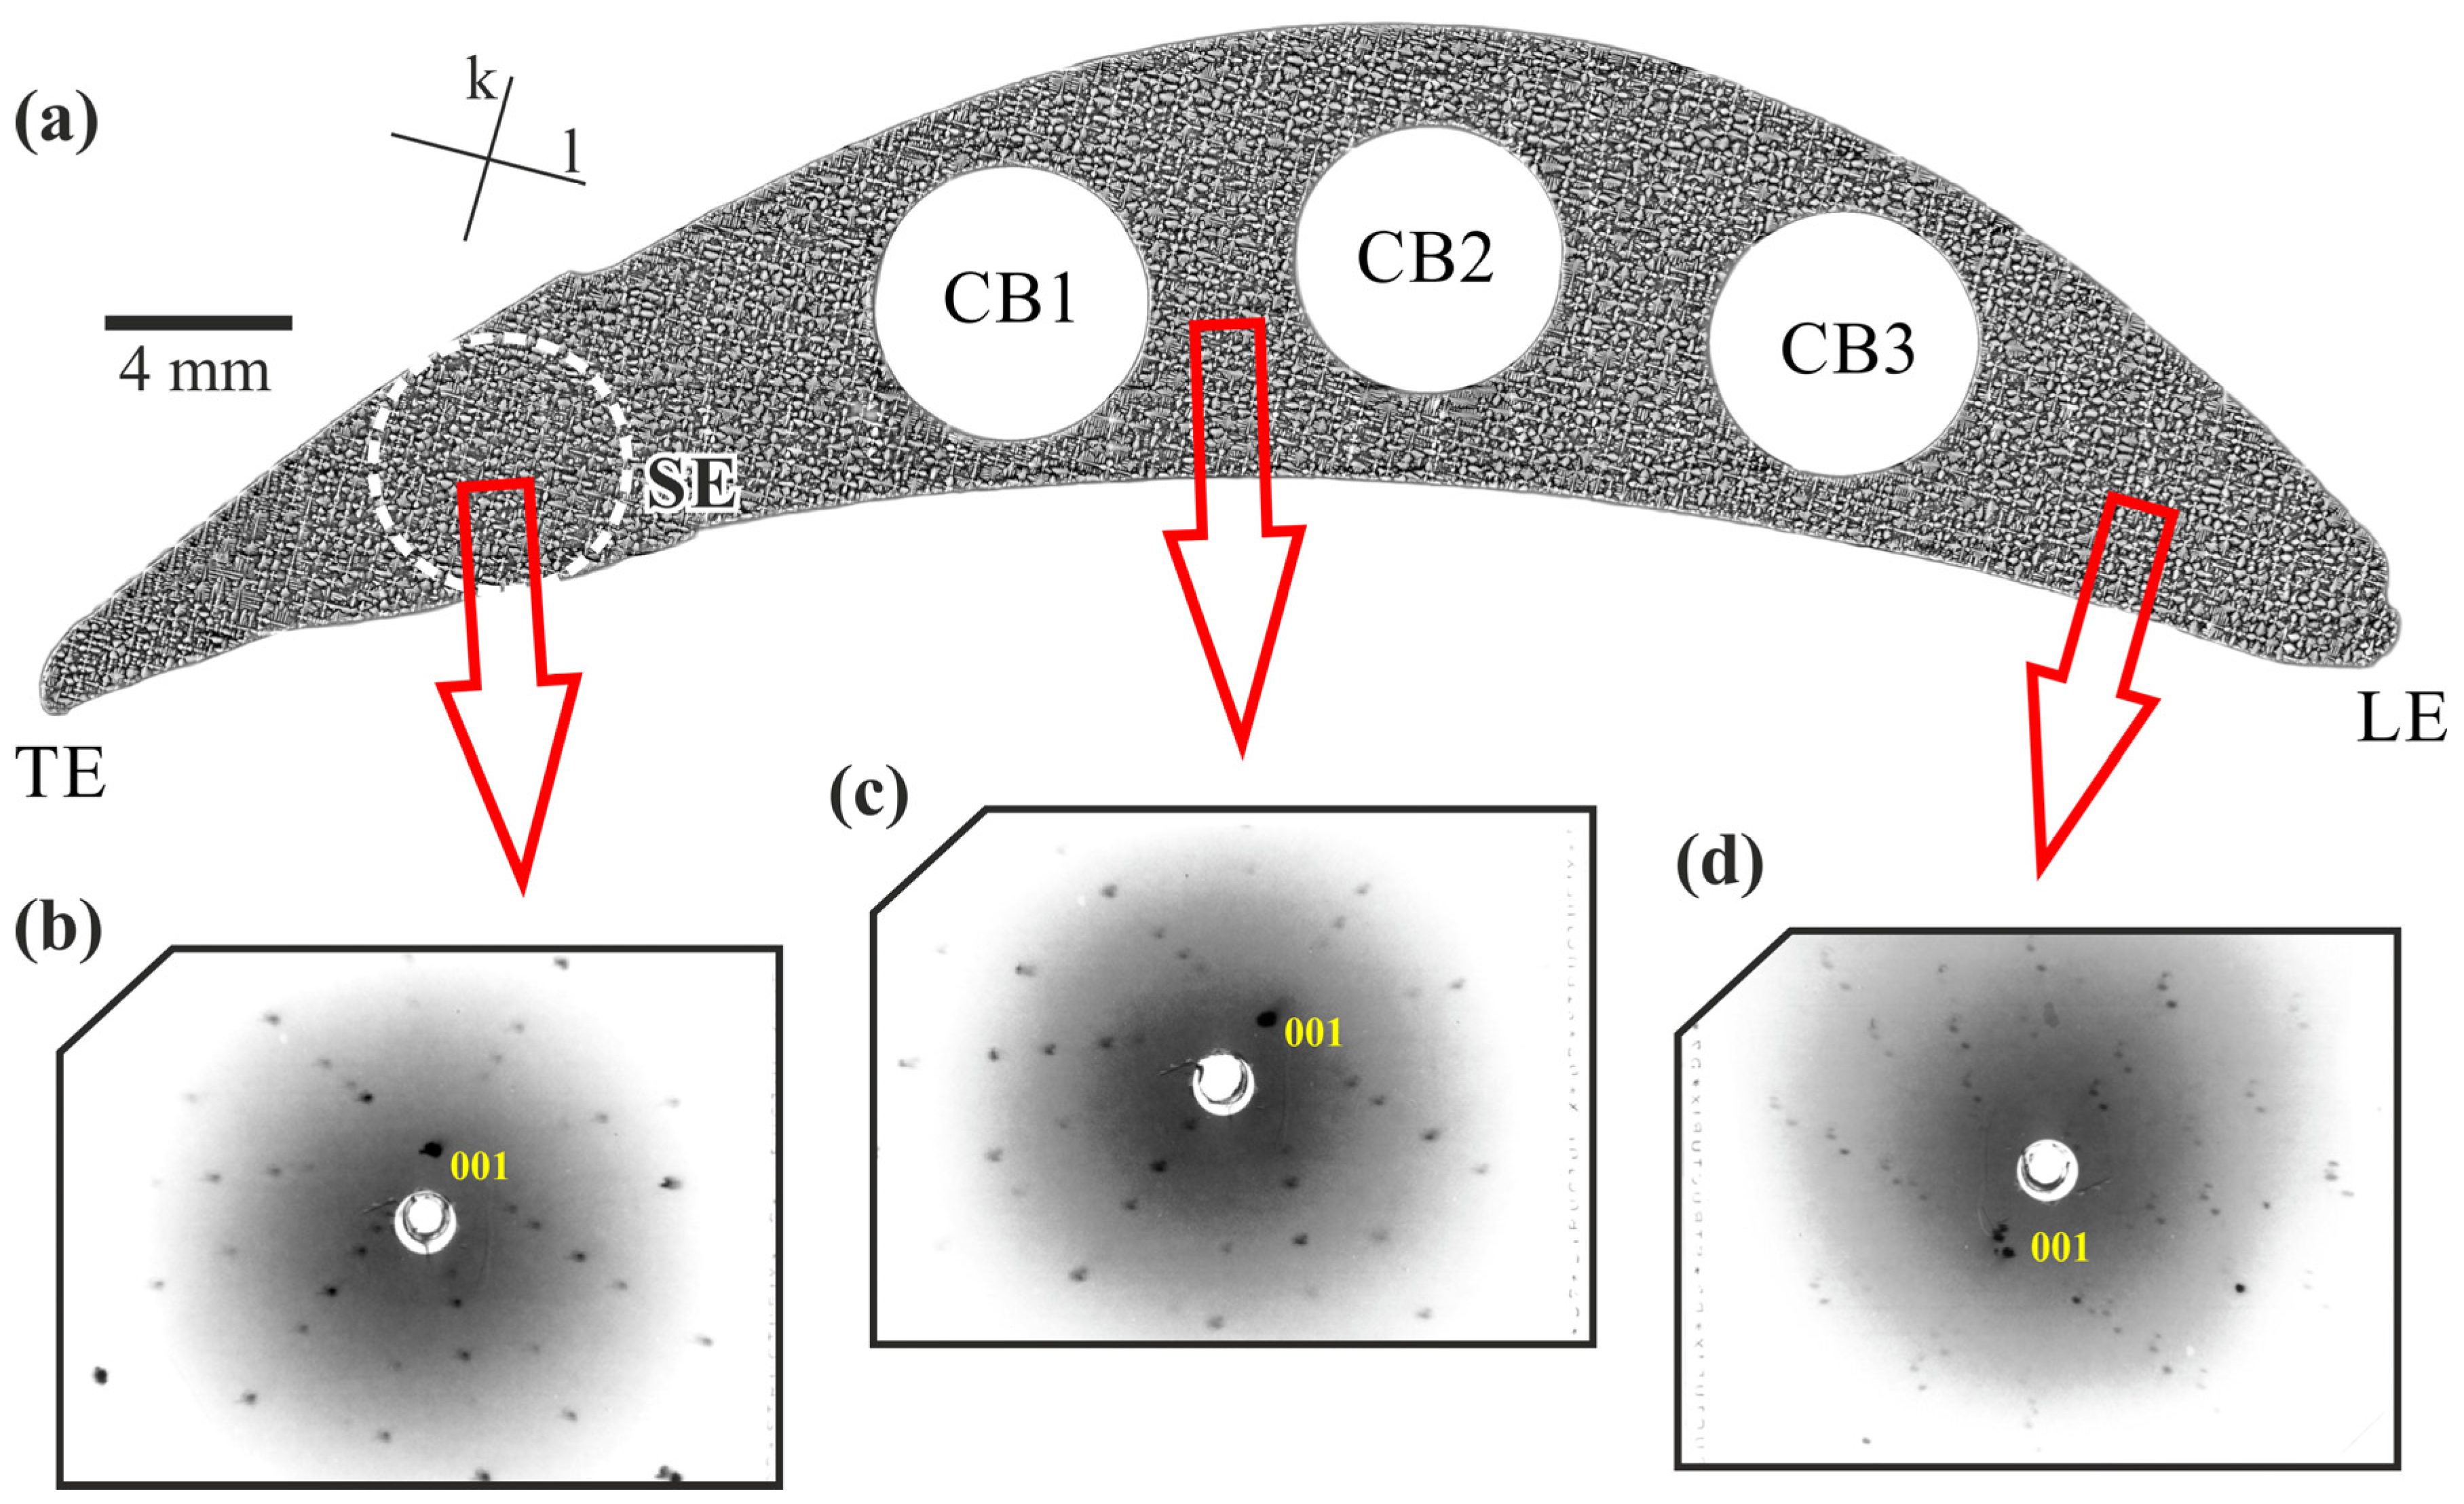
The primary crystal orientation was initially determined by the Laue diffraction in three selected areas of all analyzed airfoil cross-sections: in the SE area, next to the CB1, and near the LE, which is the area furthest from the SE (
Figure 9a). The obtained Laue pattern was also analyzed for lattice symmetry and single-crystalline perfection.
An example of a Laue pattern obtained from the SE region is shown in
Figure 9b. The diffraction Laue spots are distributed symmetrically, and their shape is rather regular. The pattern shows symmetry, corresponding with the cubic symmetry of the γ′-phase. The 001 Laue spot is offset from the central hole, where it should be located if the orientation were consistent with that imposed by the selector, i.e., with the [001] direction parallel to the Z axis. It indicates the misorientation of the studied area from the [001] crystal direction. The Laue pattern shown in
Figure 9c was obtained from a typical region between the CB1 and CB2 bores. As in the previous example, the Laue spots are symmetrically distributed, representing the cubic system symmetry, but the spots have a more irregular shape. Again, the 001 Laue spot is offset from the central hole, indicating crystal misorientation. Laue patterns obtained from an area located close to LE were significantly different from those previously described. Strongly blurred and inconsistent Laue spots are visible in the exemplary pattern (
Figure 9d), but they are still arranged nearly symmetrically, characteristic of the symmetry of a cubic crystal system. The 001 Laue spot is offset from the central hole.
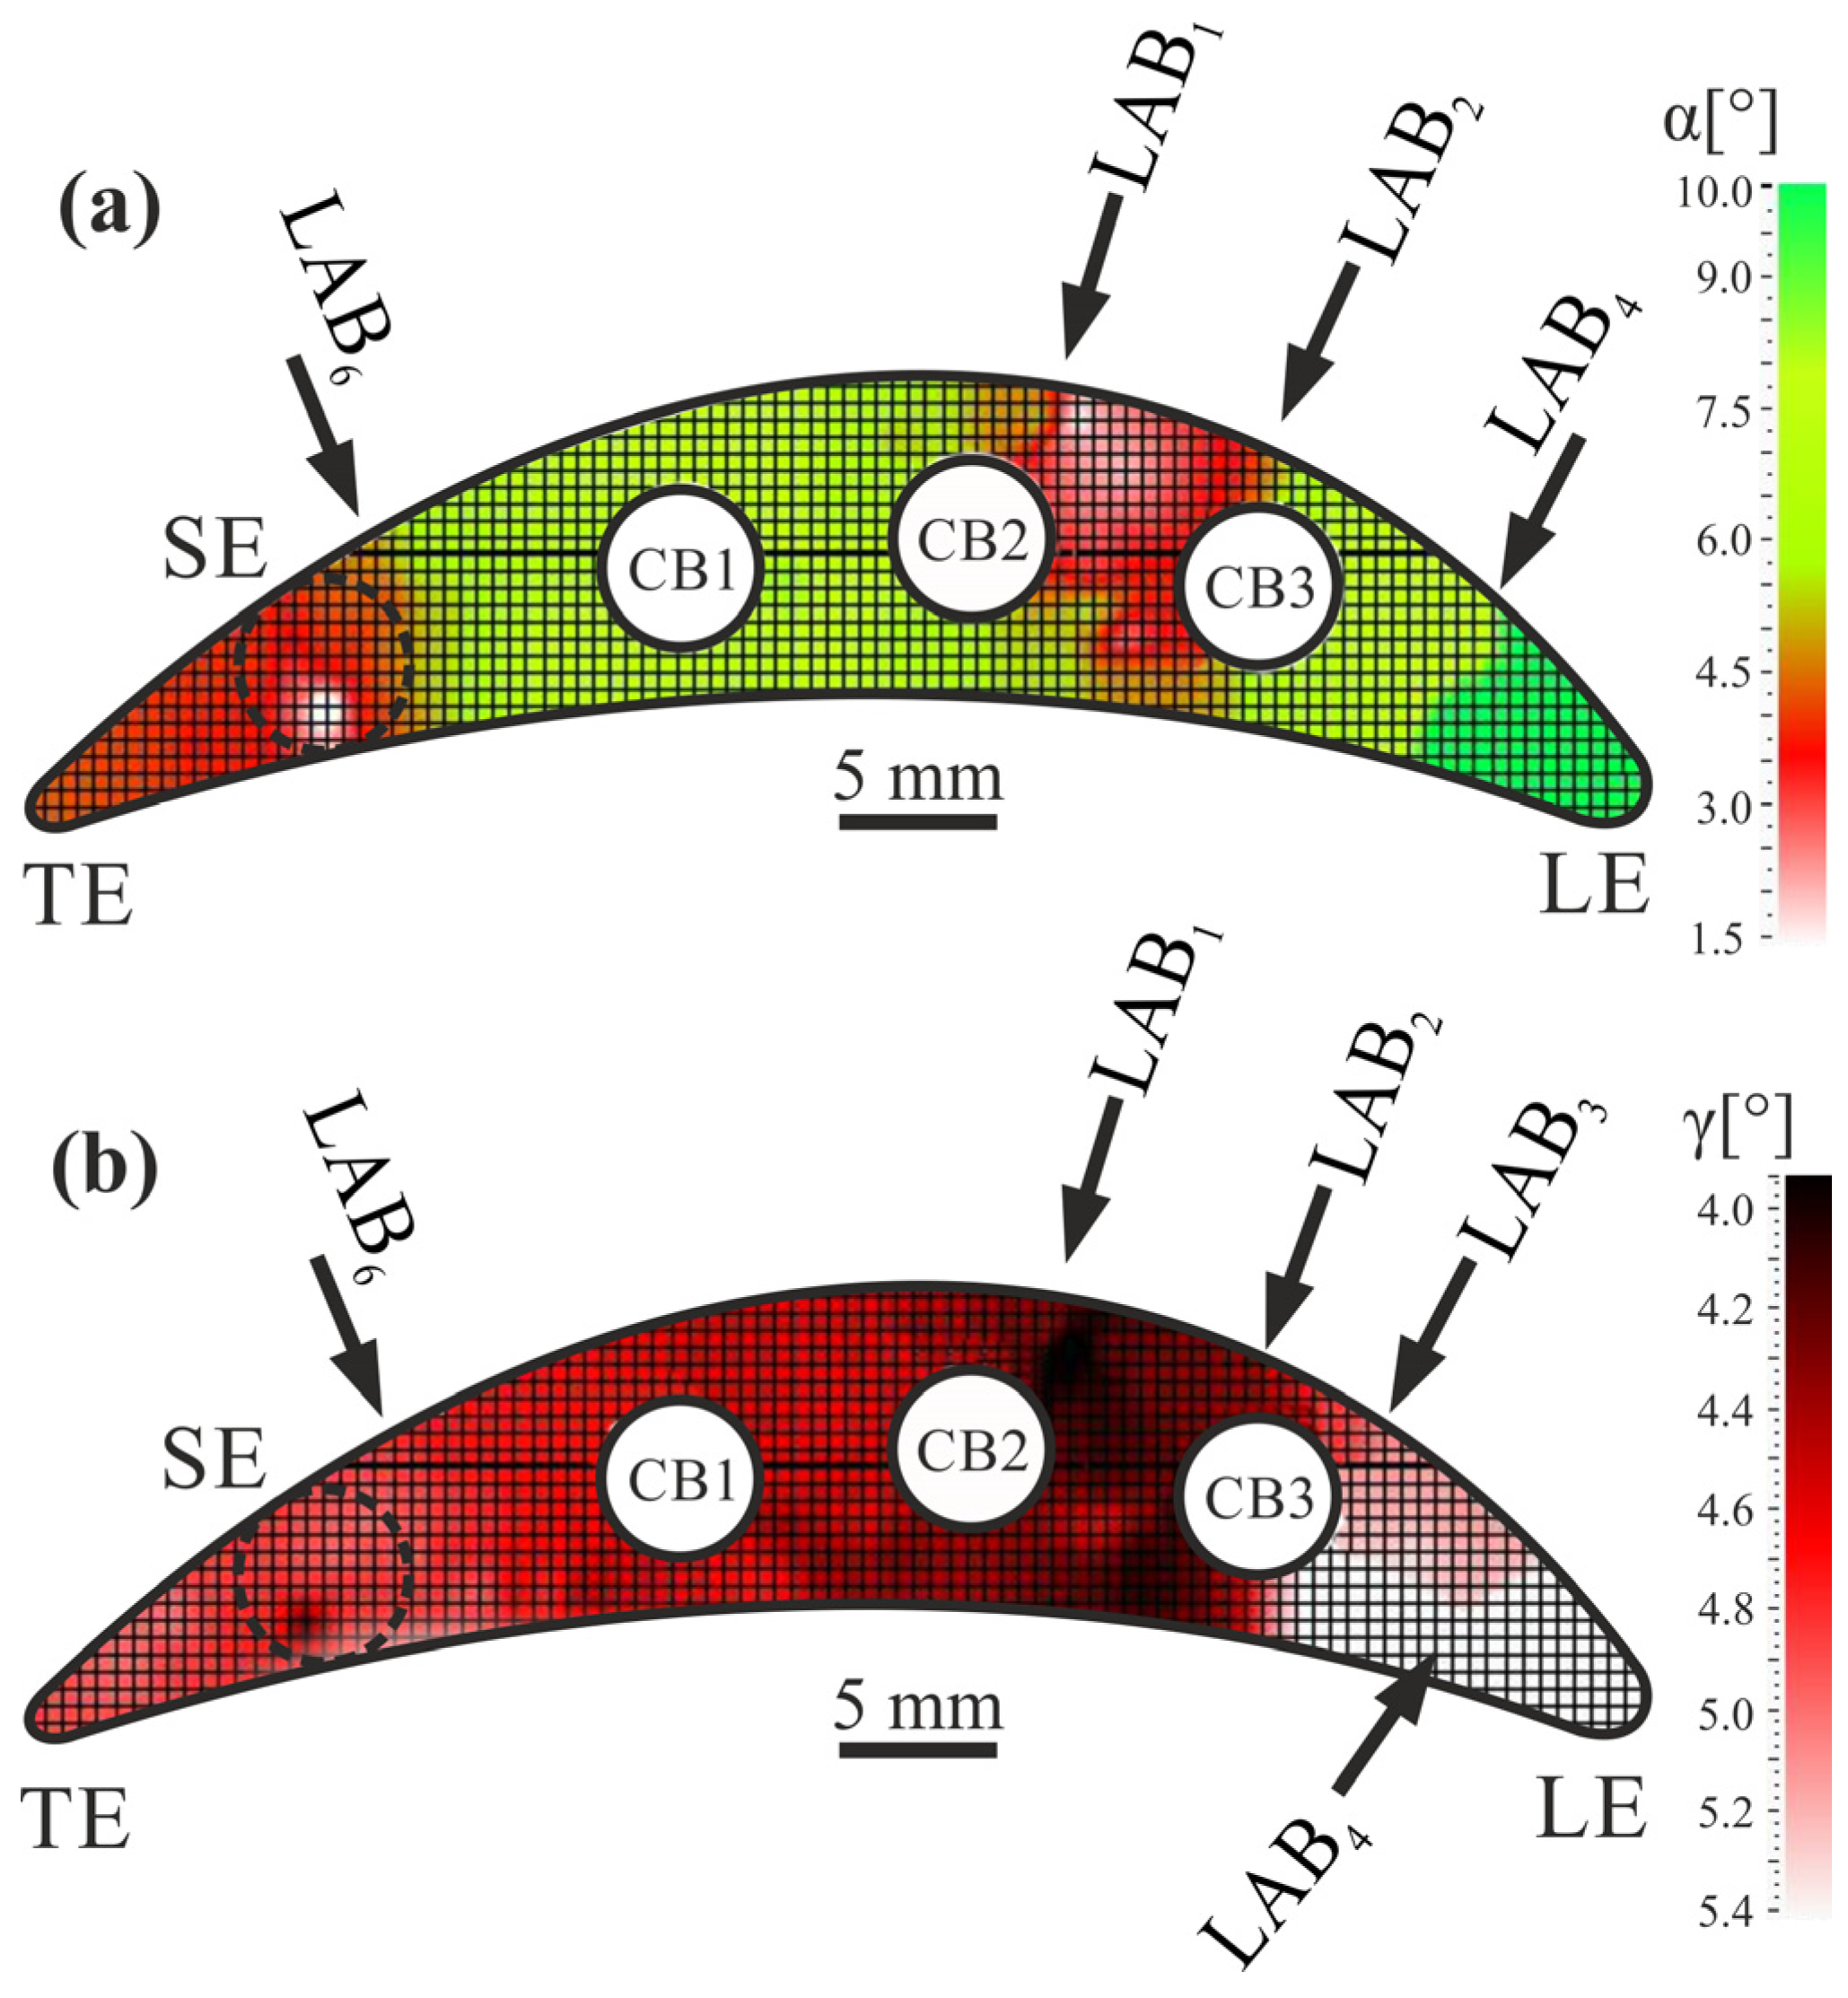
Figure 10 shows exemplary maps of α and γ angles distribution obtained from the A2 cross-section surface of the blade airfoil. Typical changes in the values of the component angles of crystal orientation can be observed. For the α angle, changes are usually jumps, creating clear boundaries between adjacent values. Such boundaries are marked exemplary in
Figure 10 as LAB
1, LAB
2, LAB
4, and LAB
6.
Based on the obtained maps of α angle distribution, changes in α value were determined, ranging from 1.5° to 10°. The highest α value occurs near the LE, the lowest in the SE area (
Figure 10a), and between CB2 and CB3 bores on the suction surface side. The γ angle varies from 4.1° to 5.4°, with the lowest value noticeable between CB1 and CB3 (
Figure 10b). The areas of different γ angles are separated by some kind of boundaries, marked, e.g., as LAB
1, LAB
2, LAB
3, and LAB
4. Such boundaries are created by a smooth change in the γ angle value.
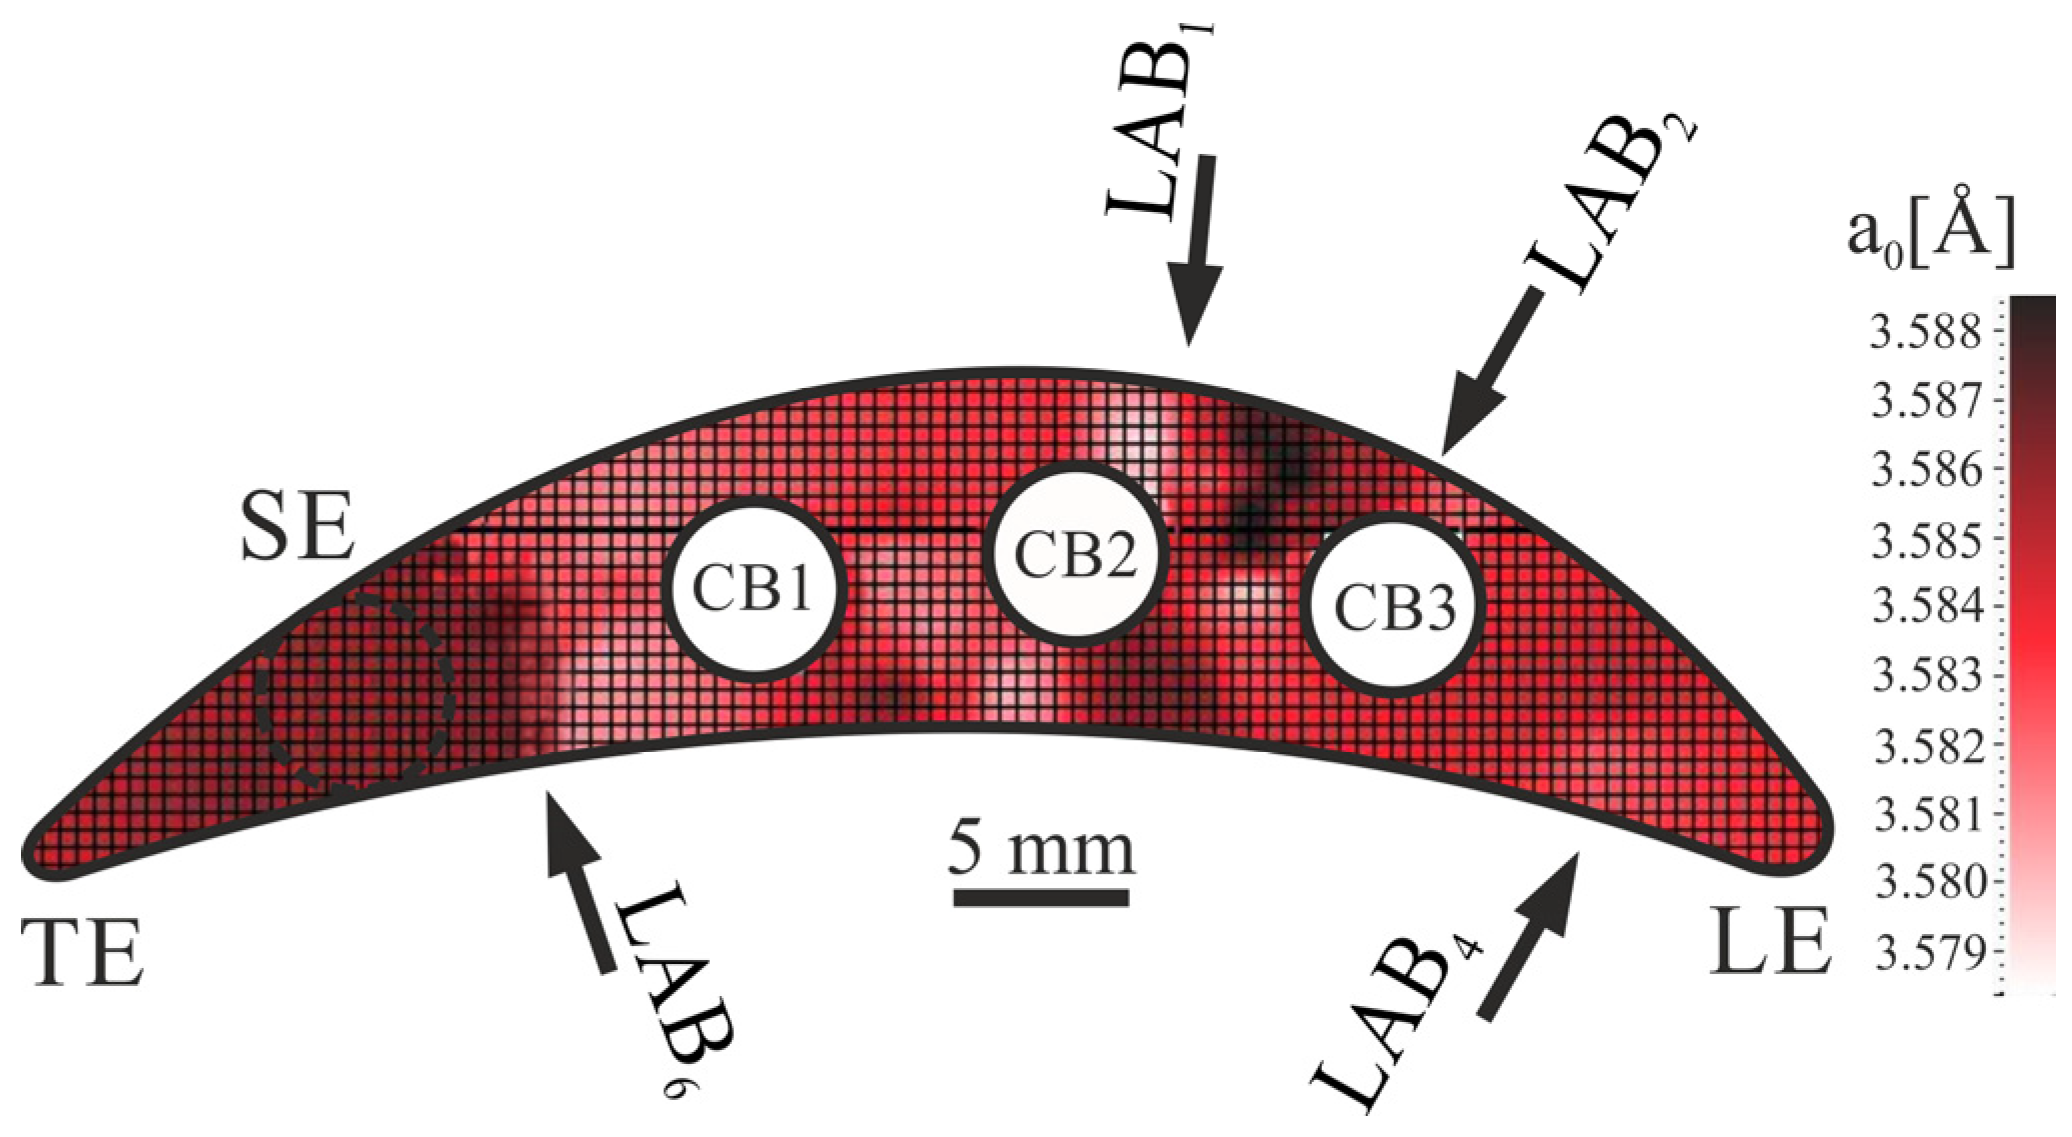
Figure 11 shows the example of the a
0 lattice parameter distribution map. The highest changes in the lattice parameter a
0 are observed between CB2 and CB3, as indicated by LAB
1 and LAB
2, and next to the SE region, indicated as LAB
6. Also, smaller changes in the a
0 value are visible in other cross-section areas of the blades, but are most common across the space separating the cooling bores and suction or pressure surface.
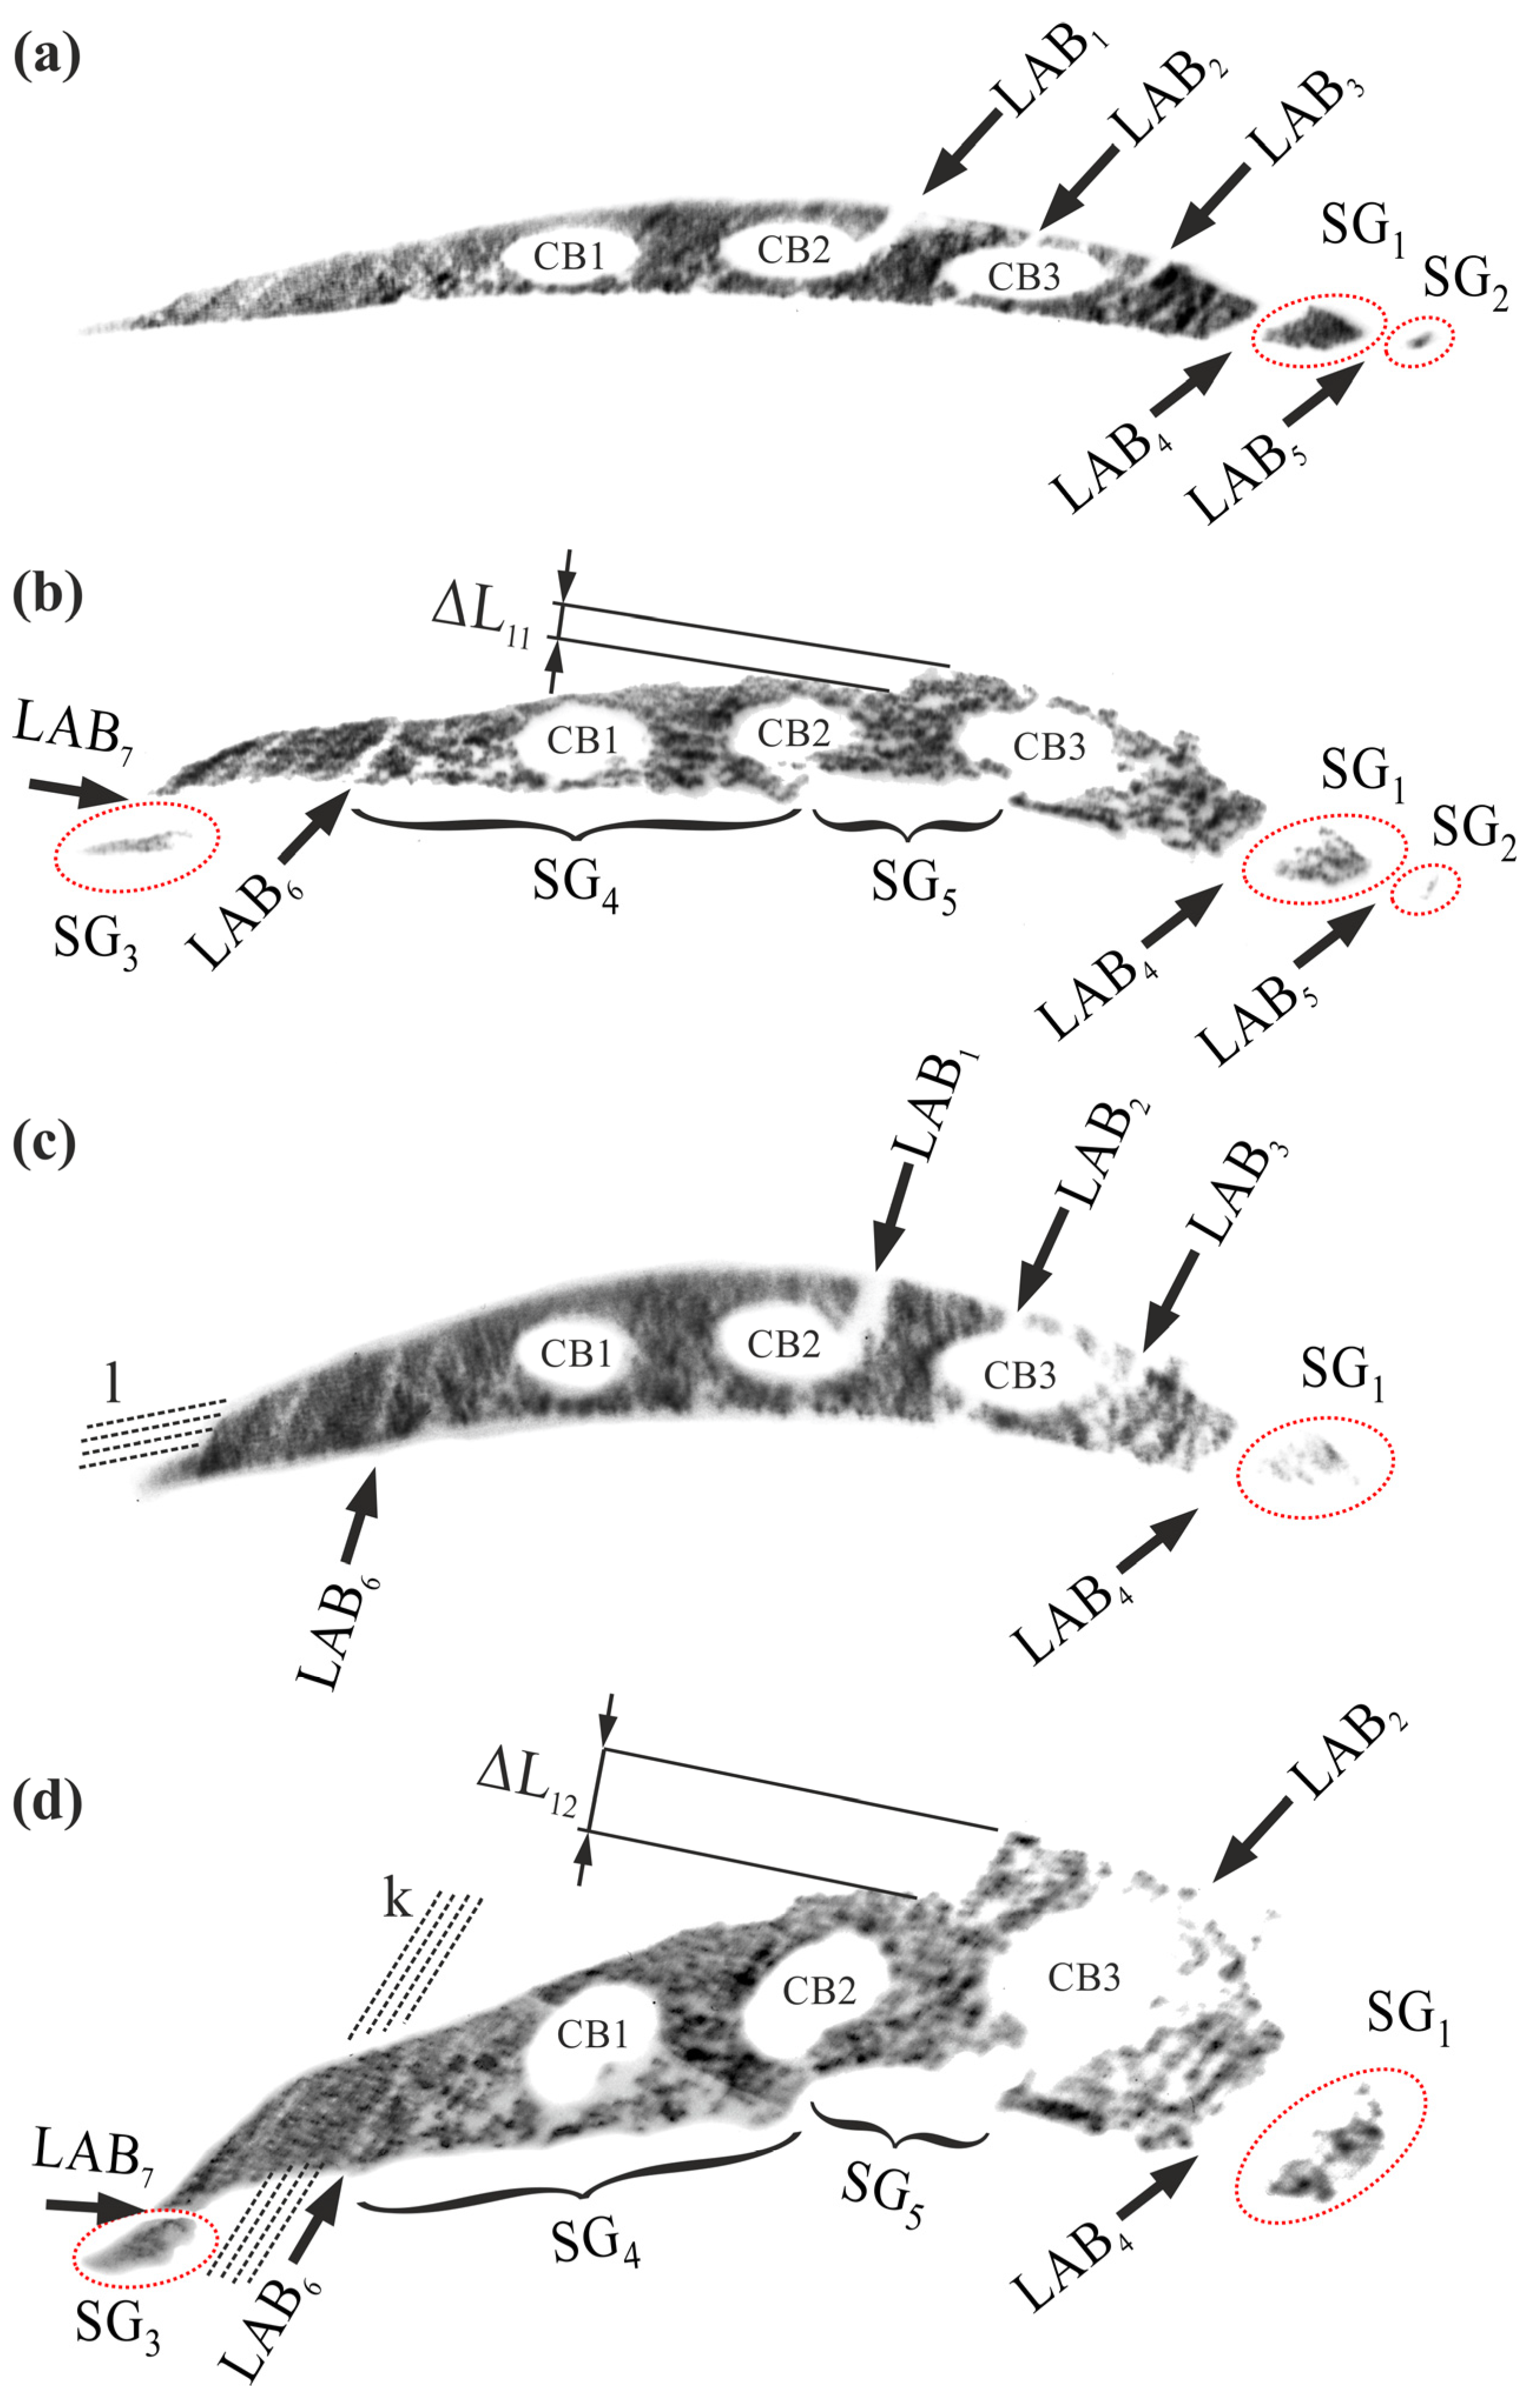
Topograms approximately (depending on the diffraction geometry, i.e., the recorded reflections) reflect the shape of the surface from which they are recorded. The differences in the topograms’ shape arise from the disparity in diffraction geometry, i.e., from the different angles between diffraction planes and studied surfaces. Therefore, the differences in the shape of the topograms recorded from the same surface and for different reflections appear. In the case of a perfect single-crystal structure, the visible contrast is consistent and continuous at the edges. Discontinuity, visible separated fragments, and striping characterize topograms recorded from the analyzed samples (
Figure 12).
Figure 12 shows the examples of X-ray topograms recorded from A1 and A2 cross-sections of S1 and S2 samples (
Figure 1a). The 002 and 113 reflections were used for the X-ray topography studies.
Figure 12a presents a typical topogram of the 002 reflection recorded from the A2 cross-section plane of the S2 sample. Some fragments of topogram are visibly shifted and/or separated from the other fragments, e.g., SG
1 and SG
2. Apart from the typical contrast areas in most fragments, the topogram shows bands of lack of contrast, indicated exemplarily as LAB
1–LAB
5.
Figure 12b presents a typical topogram of the 113 reflection obtained from the A2 cross-section plane of the S2 sample. It shows effects similar to the topogram in
Figure 12a, i.e., shifted fragments and lack of contrast bands, as well as in other areas of the topogram and with different distances and directions of shifts. The distance, exemplary marked as ΔL
11, describes the shift component of the large neighboring areas SG
4 and SG
5 of the topogram. The shifts and lack of contrast bands are, in most cases, present near the cooling bores CB2 and CB3, and near the LE.
Figure 12c presents a typical topogram of the 002 reflection, recorded from the A1 cross-section plane of the S1 sample. Similarly to the results described for
Figure 12a,b, apart from the typical contrast areas, there are visible shifts in topogram fragments (e.g., SG
1) and a lack of contrast bands (e.g., LAB
1, LAB
2, LAB
3, LAB
4, and LAB
6). Additionally, fine, parallel contrast bands can be observed at the TE side of the blade cross-section, aligned approximately in the direction of the cooling bores, as marked by lines
l.
Figure 12d presents a typical topogram of the 113 reflection, recorded from the A1 cross-section plane of the S1 sample. The effects similar to the topograms in
Figure 12a–c are visible, i.e., shifted fragments and lack of contrast bands, but with different distances and directions of shifts. The distance, exemplary marked as ΔL
12, describes the shift component of the large neighboring areas SG
4 and SG
5 of the topogram. In most cases, the shifts and lack of contrast bands are present near the cooling bores CB2 and CB3 and the LE. Furthermore, fine, parallel contrast bands can be observed at the TE side of the blade cross-section, aligned approximately between the suction and pressure surfaces of the airfoil, as marked by lines
k. The topogram fragment identified in the topograms presented in
Figure 12a,b, is not visible in the topograms presented in
Figure 12c,d.
4. Discussion
Observation of the A1 and A2 surfaces of S1 and S2 type samples cut from the cooled single-crystalline turbine blades (
Figure 1a) showed a dendritic structure, typical of nickel-based superalloys (
Figure 2). Due to the complex shape of the blades and the arrangement of the CB1, CB2, and CB3 cooling bores, the visible secondary dendrite arms vary in size and are occasionally distorted. In addition, it is common for subsequent dendrite arm rows to grow from the secondary arms. The most regular, undistorted dendritic structure occurs in the SE area (
Figure 3). The secondary dendrite arms in the SE area grow orthogonally and form chains, but the chains are created parallel to only one direction (
k lines). Such a type of dendrite morphology may be inherited during growth from the blade’s root, and initially from the selector, as demonstrated in Ref. [
33]. In the areas beyond SE, the dendritic structure is usually distorted. In the area near CB3 and LE, the irregularity of the dendrite structure is much higher. The distortions are revealed by changes in the shape and arrangement of dendrite arms and increase with increasing distance from the SE. The disorders are usually the highest in the areas close to the LE and TE, the areas between cooling bores and suction or pressure surfaces, and across the space separating the bores. The formation of distortions of the dendritic structure may be influenced by the location of cooling bores regarding the SE, which are set in the way of dendrite growth direction from the selector perpendicular to the withdrawal direction, as well as the proximity of the ceramic mold, which may change the heat flow conditions during crystallization.
All Laue patterns obtained at selected cross-sections of the bladed airfoils show symmetry corresponding to the cubic symmetry of the dominant γ′-phase. However, the shape, sharpness, and intensity of the Laue spots and the offset of the [001] direction’s spot from the central hole of the X-ray film were different. The largest offset, meaning the highest crystal misorientation of the [001] direction from the withdrawal direction, which is approximately the crystallization direction and the blade axis direction, was demonstrated by Laue patterns recorded from the areas most distant from the SE, near the edge of the LE (
Figure 9d).
Based on maps of the α angle distribution (
Figure 10a), it can be assumed that the lowest value occurs in the SE area. The α mostly increases toward the LE. It means that the expected crystal orientation [001] is maintained to the greatest extent in the SE area, where crystallization takes place directly from the selector. In regions where crystallization proceeds via lateral growth, the orientation changes. The reason may be the specificity of lateral growth related, i.e., to the shape of isotherms during crystallization for the furnace and mold assembly, and also the influence of cooling bores, which impede simple, direct lateral growth.
As shown in
Figure 1c, the γ angle is related to the secondary crystal orientation. It defines the deviation of the [010] or [100] direction (assumed directions of secondary dendrite arms) from the reference axis X. Therefore, analysis of the γ angle is based on determining the change in the growth direction of secondary dendrite arms on the blade’s airfoil cross-sections. The changes in γ values have a slightly different character than the α changes: the γ values increase from the SE towards LE up to the area between CB2 and CB3, then decrease radically. However, similarly to the α angle distribution maps, the γ angle distribution maps show some boundaries between γ values (LAB
1–LAB
6,
Figure 10b). In most cases, these boundaries are consistent in location with those identified for the α angle.
Since α and γ angles determine crystal orientation, the differences observed for values of these angles indicate the occurrence of subgrains separated by low-angle boundaries—LABs (LAB
1–LAB
6,
Figure 10). The low-angle boundaries visualized in the α and γ maps are located mostly near the CB2 and CB3 cooling bores, and near the LE. They are spread between the suction and pressure surfaces and cooling bores across the analyzed cross-sections.
The changes in values of the lattice parameter visible on its distribution maps largely correlate with changes in crystal orientation. Approximately constant lattice parameter values characterize areas identified as subgrains, while a change in a0 occurs at low-angle boundaries. These changes are most likely associated with the need to eliminate the crystal lattice mismatch at the subgrain boundaries and the stress occurring in such locations.
LABs identified in the maps of α and γ angles and a
0 parameter are also visible on the X-ray topograms as narrow bands of lack of contrast (LAB
1–LAB
7,
Figure 12). There are also visible shifted fragments of the topograms, separated by a lack of contrast bands. The differences in shift distances and directions are related to the different crystal orientations of neighboring areas, defined by misorientation angles α and/or γ. It means that the shifted fragments of the topograms represent subgrains separated by LABs. The misorientation angle can be calculated from the shift values using the procedure described in [
39]. The subgrains usually occurred near the LE, CB3, in the areas between cooling bores and suction or pressure surfaces, and across the space separating the bores. Fine, parallel contrast bands observed at the TE side of the blade cross-section and aligned along lines
l and
k are related to the direction of secondary dendrite arms. In this case, the lines are not orthogonal due to the distortion of topograms by diffraction conditions. Fine contrast bands appear only at the SE area, where the dendrites grow directly from the selector, and dendrite chains were observed (
Figure 3). The effect is observed in the SE because only in this area is the dendritic structure sufficiently ordered, and the chains of secondary dendrite arms are present.
5. Conclusions
The airfoils of specially designed, novel model cored single-crystalline as-cast blades made of CMSX-4® nickel-based superalloy were studied. The model blades were designed in such a way as to enable studies of the influence of the mutual arrangement of the selector and cooling bores, as well as other geometric relations in turbine blades, such as thin-walled areas, on the crystal structure and growth defects. The dendritic structure observed by scanning electron microscopy in several cross-sections of the blades’ airfoils was not homogeneous. The differences in the dendrites’ morphology and their array, characterized by variations in dendrite arm size and arrangement, as well as asymmetry of secondary dendrite arms, were observed. The presence of tertiary arms in certain airfoil areas was stated. The dendrite morphology in the areas located close to the leading edge (LE) and trailing edge (TE) or near the cooling bores (CB), distanced from the selector extension (SE) area, is distorted. The dendrites in the area of the SE grow directly from the selector, and there were no significant distortions of dendrite morphology or their array. The results of crystal orientation studies show a similar distribution of growth defects. The Laue diffraction and Ω-scan method indicate the highest misorientation angles in the areas distant from the SE, and X-ray diffraction topography identifies the presence of subgrains (SG) separated by low-angle boundaries (LABs) in such areas.
Based on the generally known knowledge about casting and crystallization, it can be hypothetically assumed that the formation of the LABs and SG, and dendrite distortions may be influenced by the presence of ceramic cores for bores creation and ceramic mold walls, which may change the heat dissipation conditions and crystallization direction. Creation of the identified defects may be caused by differences in the local crystallization rate, resulting in local changes in heat transfer during crystallization, especially by the increase in heat dissipation by ceramic rods of the mold and physical interaction with the growing dendrites.
The location of most of the LABs formed, often at a greater distance from the SE area and behind the cooling channels (as seen from the SE area side), may also be related to the presence of thin walls in these areas and the associated difficulty in free lateral growth. Each subsequent cooling bore encountered along the growth path causes a certain change in the crystal orientation and, consequently, the formation of the LABs separating the subgrains. Therefore, increasing the distance from the SE along the cross-section decreases the dendritic array regularity and the appearance of LABs.
The result analysis suggests that some defects observed in the blades’ airfoils may be inherited from the blade root, where the LABs and dendrite distortions may be created at a previous stage of the crystallization process, as stated in previous studies.
