Article

Spectroscopic Evidence for the α-FeOOH-to-ε-FeOOH Phase Transition: Insights from High-Pressure and High-Temperature Raman Spectroscopy

by
Shanece S. Esdaille
,
Vadym Drozd
,
Andriy Durygin
,
Wenhao Li
and
Jiuhua Chen
*
Department of Mechanical and Materials Engineering, Center for the Study of Matter at Extreme Conditions, Florida International University, Miami, FL 33174, USA
*
Author to whom correspondence should be addressed.
Crystals 2025, 15(9), 782; https://doi.org/10.3390/cryst15090782 (registering DOI)
Submission received: 28 July 2025 / Revised: 25 August 2025 / Accepted: 27 August 2025 / Published: 31 August 2025

Abstract

We conducted in situ Raman spectroscopy measurements on goethite (α-FeOOH) under simultaneous high-pressure and high-temperature conditions using an externally heated diamond anvil cell (EHDAC). Our study investigates spectral changes associated with the α-FeOOH-to-ε-FeOOH phase transition up to ~11 GPa and 563 K. The phase transition was identified based on high-temperature Raman spectra collected at 473 K, 523 K, and 563 K. A key indicator of the transition is the disappearance of a characteristic shoulder peak near 410 cm−1 which occurs near 4.7, 6.0, and 6.6 GPa for temperatures of 473 K, 523 K, and 563 K, respectively. From this, we estimate a linear phase boundary where the transition pressure increases with temperature at a rate of 2.3 ± 0.5 GPa per 100 K. Extrapolation to room temperature (300 K) yields a transition pressure of 0.3 ± 3.1 GPa. These findings extend existing high-pressure Raman data from ambient to elevated temperatures up to 563 K, improving our understanding of hydrogen-bearing phases relevant to Earth’s deep interior.

1. Introduction

Goethite (α-FeOOH) is a primary component of rust and among the most abundant iron oxyhydroxides found on Earth’s surface [1]. It plays a significant role in various geological processes and has attracted extensive research interest [2,3,4]. Given the substantial hydrogen content in the Earth’s upper mantle and transition zone [5,6,7,8,9], along with tomographic evidence of water transport to the lower mantle via subduction slabs, high-pressure polymorphs of FeOOH have emerged as plausible candidates for hosting hydrogen in the deep mantle.
Under ambient conditions, α-FeOOH is the most stable and common hydrous iron oxyhydroxide [10], although the (δ-(Al,Fe)OOH solid solution represents the thermodynamically most stable form. Interest in its high pressure behavior has increased over the past two decades, as its high-pressure polymorphs (e.g., ε-FeOOH and pyrite-FeOOH) offer key insights into hydrogen transport and storage in the Earth’s interior [2,3,4,11,12,13,14,15,16,17]. In addition to its naturally occurring polymorphs—akaganeite (β-FeOOH), lepidocrocite (γ-FeOOH), and feroxyhyte (δ-FeOOH))—experimental studies have identified ε-FeOOH, as a moderate-pressure polymorph, forming above 5 GPa [2,15,18]. Although most of these polymorphs are unstable at elevated temperatures, α-FeOOH remains stable under moderate heating, with hematite (α-Fe2O3) + H2O as its primary dehydration product [10].
Importantly, ε-FeOOH forms solid solutions with other hydrous phases such as δ-AlOOH [19,20,21] and phase H (MgSiH2O4) [22,23] at lower mantle pressures, suggesting it may serve as a long-term hydrogen reservoir. Its wide P-T stability field supports this hypothesis [14].
Understanding the P-T stability fields of iron oxyhydroxides is essential for gaining insights into the behavior of more complex hydrogen-bearing phases in Earth’s interior. Previous studies have established the P-V-T equation of state for FeOOH up to 7.5 GPa and 773 K and delineated its phase boundary [24], while others have defined the decomposition boundary to hematite (Fe2O3) and water [18]. Dehydration curves for FeOOH and diaspore (AlOOH) up to 20 GPa [25] suggest these phases are unlikely to transport water deep into the mantle, due to dehydration at temperatures lower than those on subducting slab surfaces. However, solid solutions between ε-FeOOH and α-PbO2-type TiO2 remain stable within the subducted oceanic crust [26,27], suggesting a more resilient water transport mechanism.
The α → ε phase transition has been theoretically predicted to occur between 5.9 and 7 GPa based on first-principles calculations [28]. Experimentally, changes in compressional behavior of α-FeOOH between 4 and 5 GPa have been observed [29]. Despite limited prior work [18,24,29], Raman spectroscopy can provide valuable insights into the temperature dependence of this pressure-induced transition. However, few Raman-based studies have explored this transition under varying temperature conditions. Notably, both Tang et al. [12] and Liu et al. [30] investigated the transition exclusively at room temperature, reporting pressure-induced spectral anomalies near 5 GPa and 7 GPa, respectively. In contrast, our study is conducted at elevated temperatures, offering novel insight into the temperature dependence of this pressure-induced transition.
In α-FeOOH, modes near 410 cm−1 correspond to Fe–O–Fe/–OH stretching vibrations that are highly sensitive to changes in lattice symmetry [31,32,33]. The previous high-pressure Raman studies have shown that spectral features near 410 cm−1 provide reliable markers for detecting phase transitions. This study builds on these insights by focusing on the pressure dependence of the 410 cm−1 mode as a key indicator of structural evolution under compression.
In this study, we employ in situ, simultaneous high P-T Raman spectroscopy to examine the temperature dependence of the α-FeOOH-to-ε-FeOOH phase transition up to ~11 GPa and 563 K. Due to increased thermal noise, high-temperature spectra exhibit higher background and noise level than ambient measurements. Consequently, we rely primarily on the disappearance of the 410 cm−1 shoulder peak—an indicator of this transition found in previous report [12,30]—as a spectral marker to confirm the structural transformation at elevated P-T conditions.

2. Materials and Methods

The starting material, goethite (α-FeOOH), was synthesized according to a previously reported procedure [34]. Briefly, 180 mL of 5 M KOH solution was rapidly added under constant stirring to 100 mL of 1 M Fe(NO3)3·9H2O solution. The resulting suspension was diluted with deionized water to a final volume of 2 L and maintained in a polyethylene flask at 70 °C for 60 h. During the heating, the red-brown 2-line ferrihydrite gradually transformed into yellow-brown goethite. The product was filtered, rinsed with deionized water, and dried at room temperature.
The phase purity of the synthesized material was confirmed via x-ray diffraction, as shown in Figure 1, which identifies the sample as a single-phase α-FeOOH with the orthorhombic space group Pbnm at ambient conditions. The crystal structure presented in Figure 1 was obtained through Rietveld refinements of the α-FeOOH diffraction pattern using GSAS-II software (revision 5444) [35], and visualized using VESTA (version 3.5.8) [36]. The refined lattice parameters were a = 4.61 Å, b = 9.95 Å, and c = 3.02 Å.
High-pressure Raman spectroscopy experiments were conducted using a Mao-Bell diamond anvil cell (DAC) with 525 μm culet diamonds and a steel gasket. No pressure-transmitting medium was used. A single crystal ruby grain was included for pressure calibration via the ruby fluorescence method, using the R1 and R2 emission line shift [37]. The α-FeOOH sample and the ruby grain were loaded into a 200 μm diameter sample chamber pre-indented to a thickness of 27 μm (Figure 2b).
In situ Raman spectra were collected using a custom-built Raman spectrometer based on a Kaiser optical system and equipped with an Andor CCD detector and a 20× objective lens. The typical integration time for each spectrum ranged from 5 to 10 minutes, depending on signal strength and spectral quality. The laser spot size on the sample surface was approximately 10 µm in diameter. Spectra were collected over the range of 100–2000 cm−1 as the previous room temperature Raman studies [12,30] indicate that there is no significant feature detected beyond 2000 cm−1. Excitation was provided by a 514.5 nm Ar laser at 5 mW power. For high-temperature experiments, the DAC was encased in a resistive heating sleeve. Temperature was measured using a K-type thermocouple and regulated with an external temperature controller (Figure 2a).
For simultaneous high-pressure and high-temperature Raman measurements, the DAC was initially loaded with a pressure between 1.5 and 3.5 GPa, depending on the target temperature, to avoid decomposition. The temperature was then incrementally raised to 473 K, 523 K, or 563 K in 50 K steps. Each target pressure and temperature condition were maintained for 15 minutes to ensure equilibrium before Raman measurements.
Raman peak positions were determined by fitting Gaussian functions using the Fityk (version 1.3.1) software [38]. Pressure was calculated as the average of ruby fluorescence readings taken before and after each spectral acquisition.

3. Results

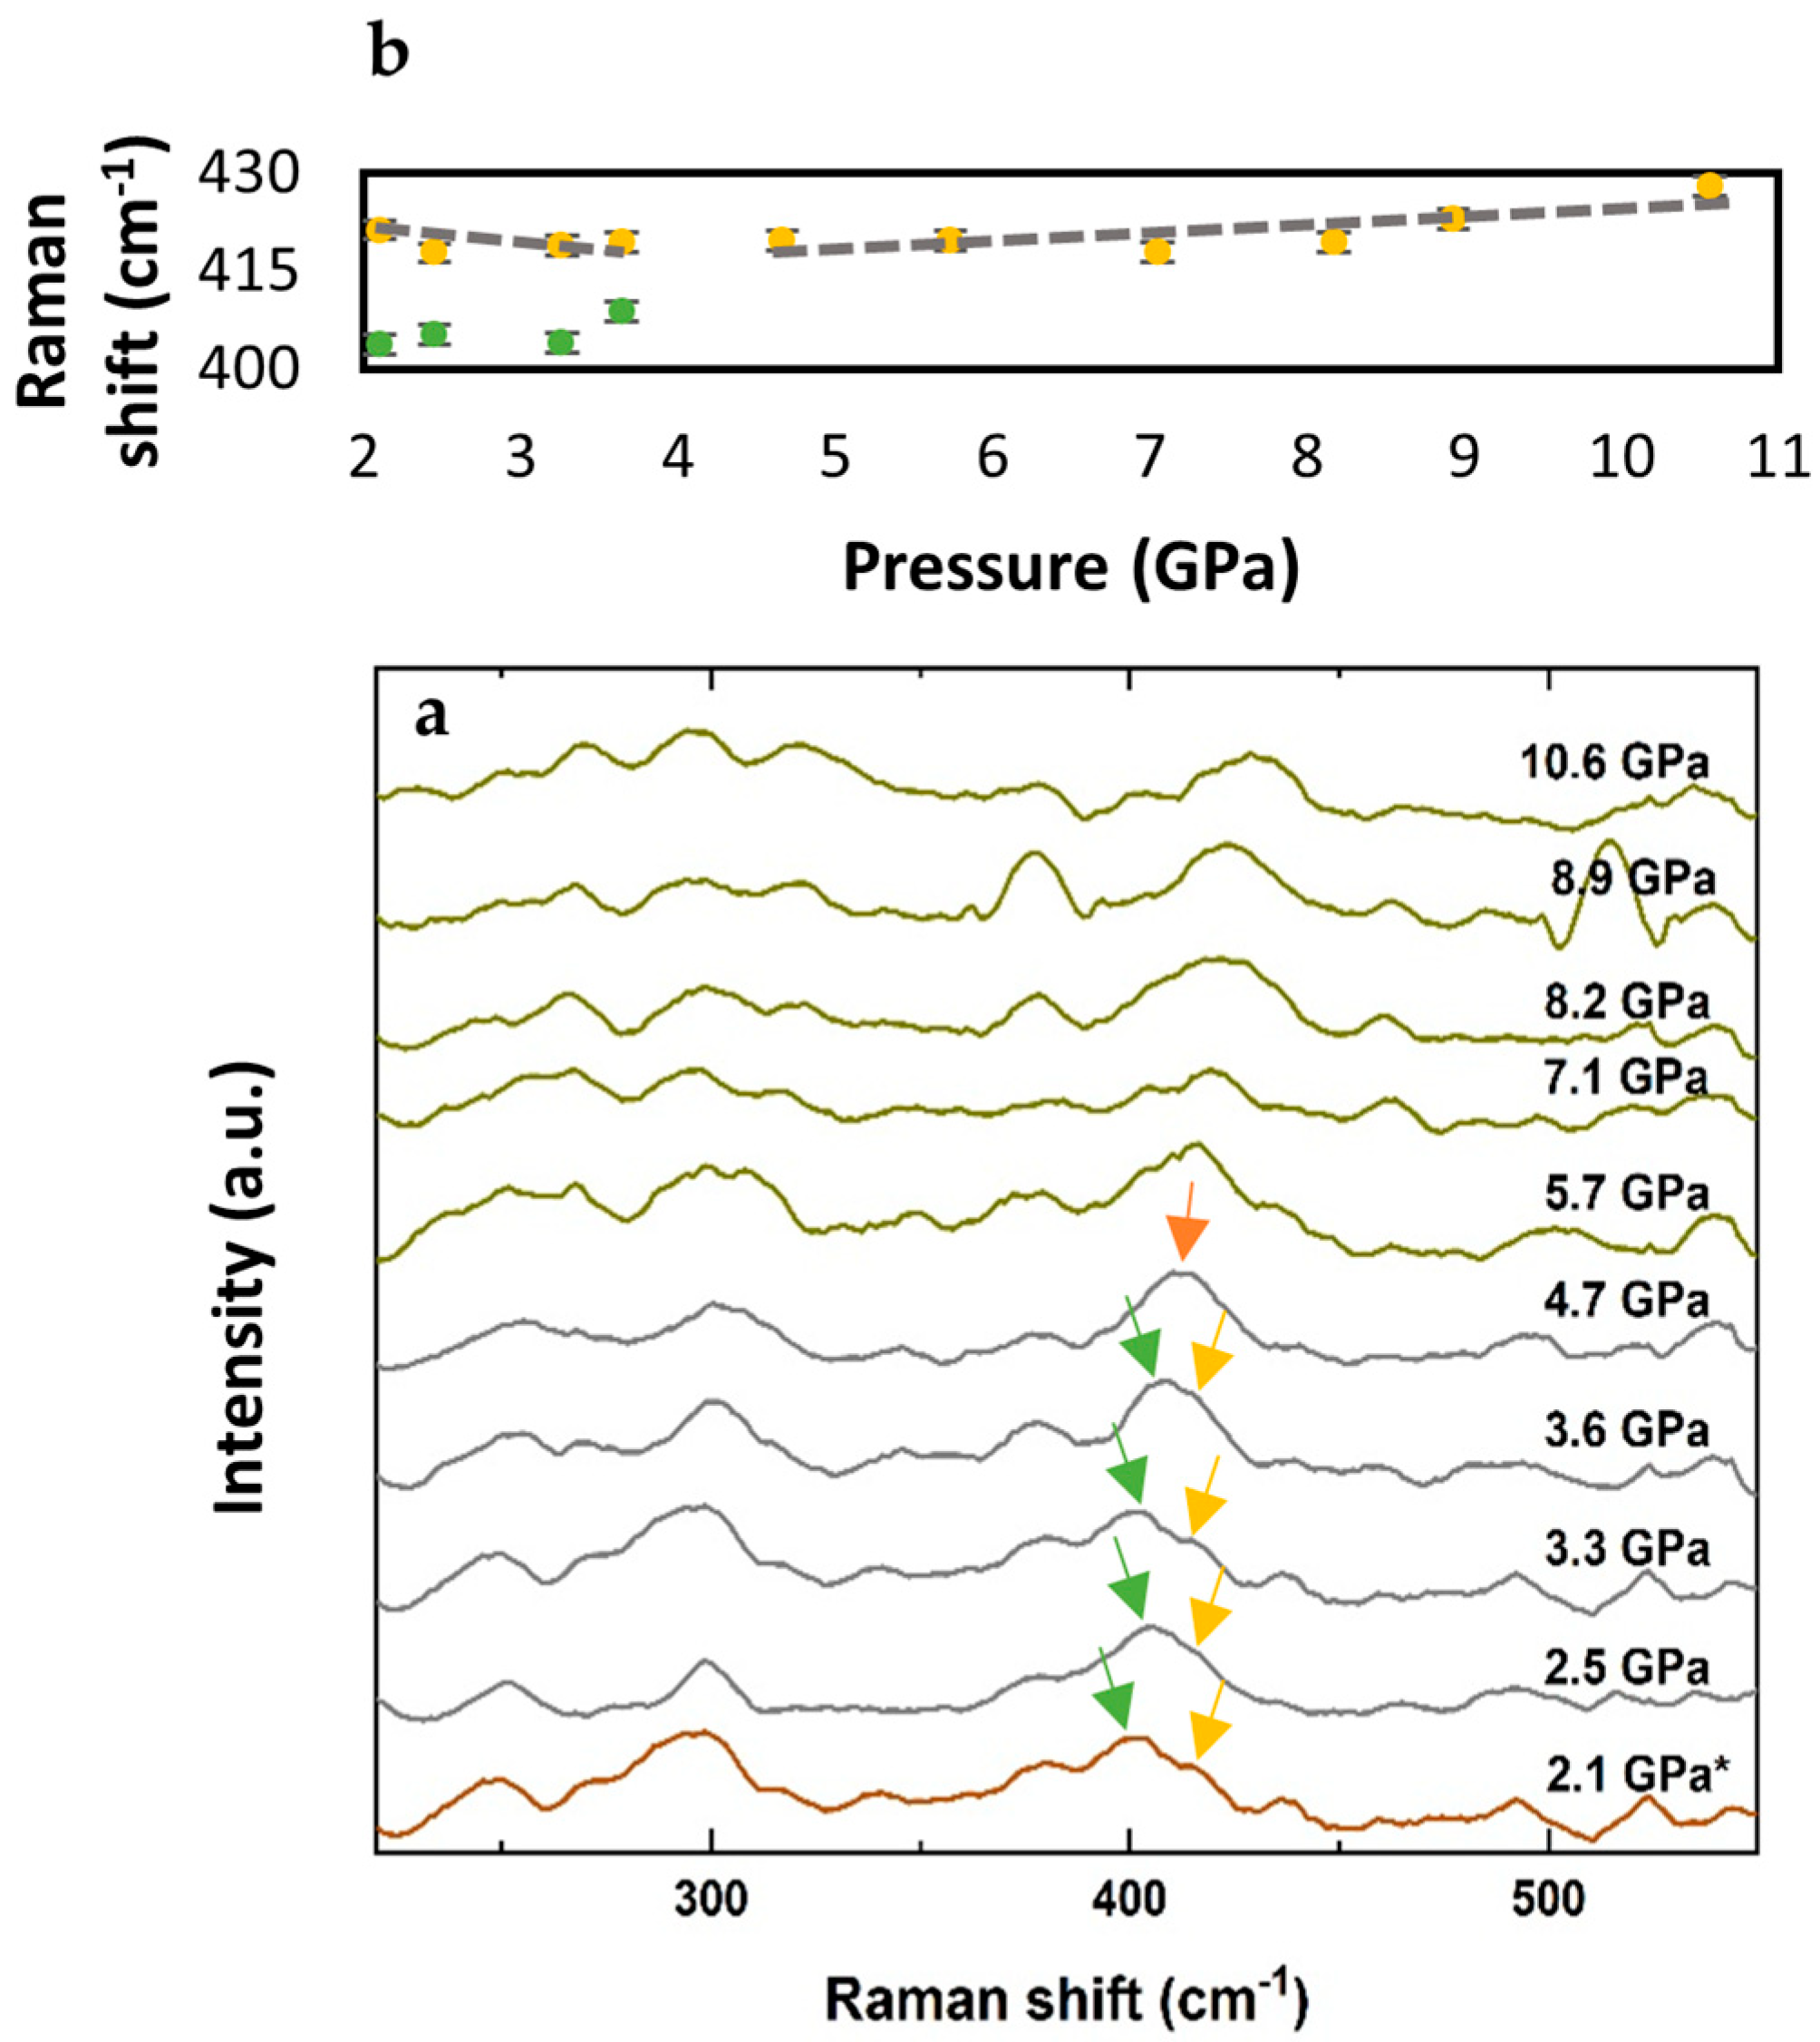
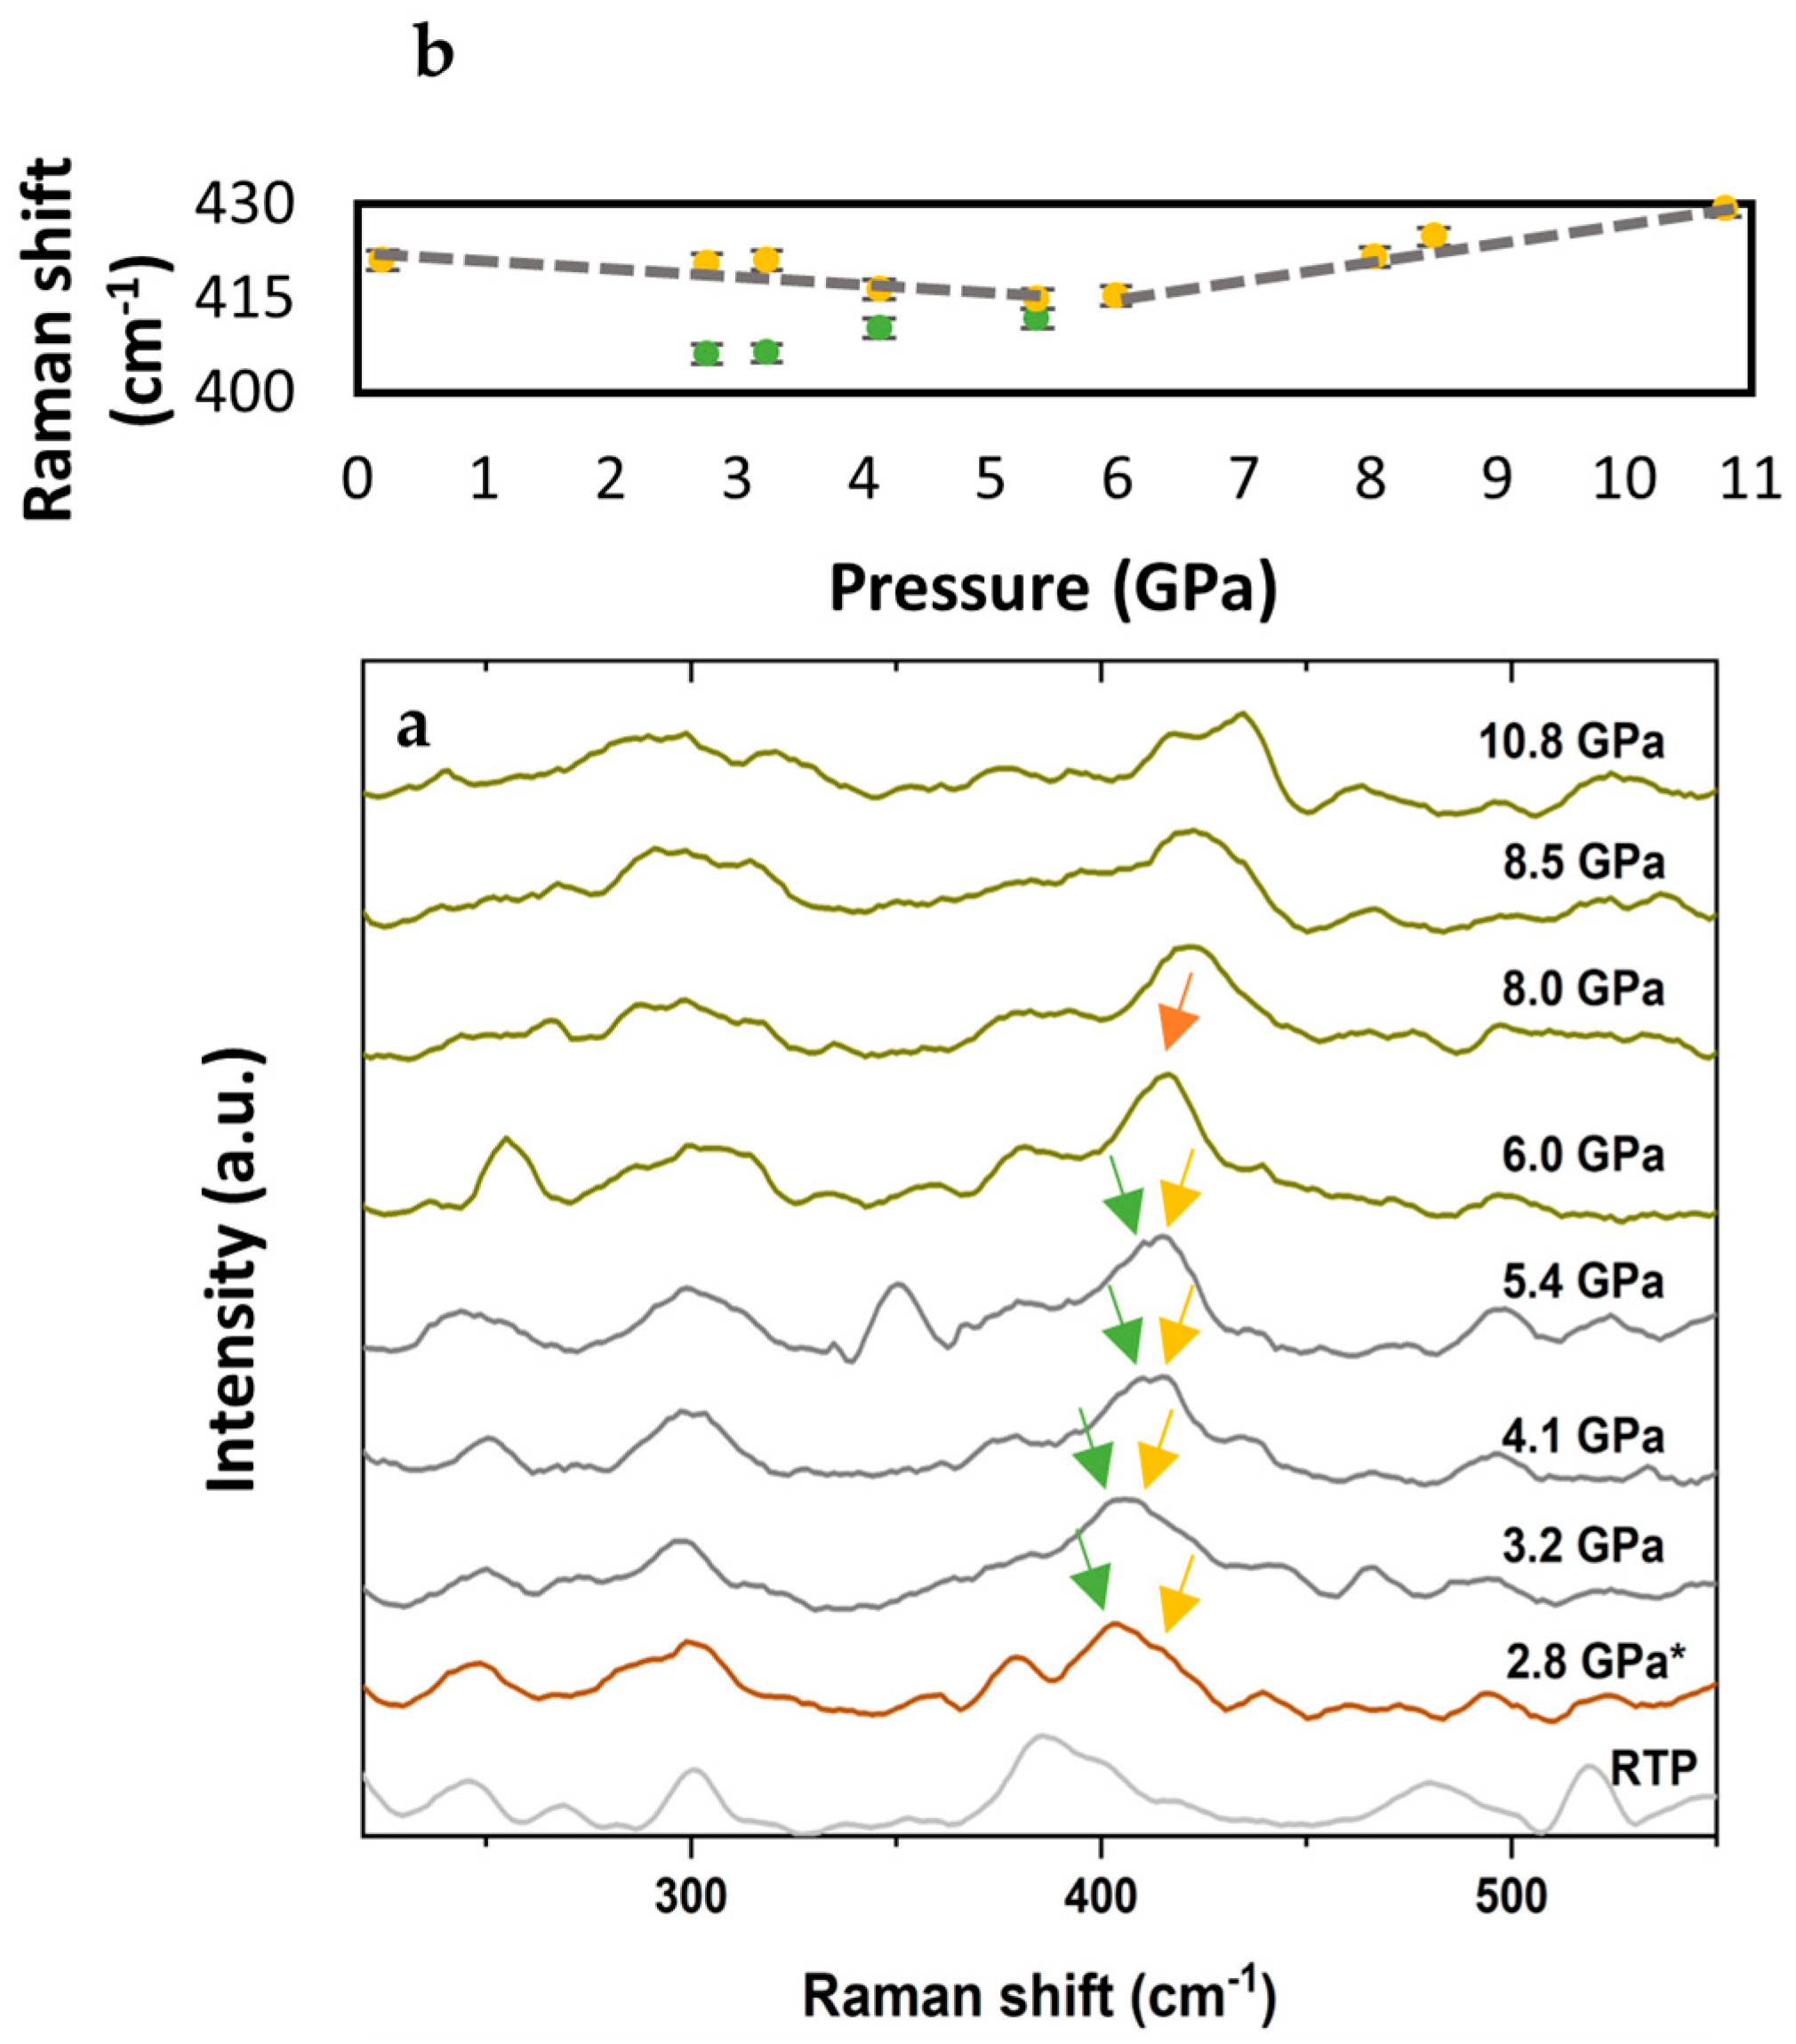
Raman spectroscopy serves as a non-destructive and highly sensitive tool to investigate structural phase transitions in materials. Figure 3, Figure 4 and Figure 5 presents representative Raman spectra of goethite as a function of pressure, up to approximately 11 GPa, at three elevated temperatures: 473 K, 523 K, and 563 K, respectively. Spectra above 600 cm−1 are not shown, because no significant Raman modes were detected in that range.
Mode assignments for the Raman spectra (Figure 3, Figure 4 and Figure 5) were made based on previous Raman studies of iron oxyhydroxides [12,30,32,33]. The peaks near 250 cm−1 and 300 cm−1 correspond to Fe–O symmetric stretching and Fe-OH symmetric bending, respectively. The peak near 410 cm−1 is attributed to Fe–O–Fe/–OH symmetric stretching, while those near 490 cm−1 and 550 cm−1 are associated with antisymmetric Fe–OH stretching. Although changes in the 250–320 cm−1 region were observed at select temperatures, these spectral features lacked reproducibility and were therefore not used as primary indicators of the phase transition. Similarly, peaks in the 490–550 cm−1 region were weak and not considered reliable for analysis. In contrast, the 410 cm−1 feature—known for its high sensitivity to symmetry changes [31,32,33]—exhibited consistent and well-resolved pressure-dependent behavior, including a shift in position and disappearance of a characteristic shoulder peak across all measured temperatures. This provides robust spectroscopic evidence for the α-FeOOH (Pbnm)-to-ε-FeOOH (P21nm) structural phase transition [12,30,31]. Minor spectral features, such as a transient band near 380 cm−1 observed at 8.2 and 8.9 GPa (Figure 3a), and a ~360 cm−1 band appearing at 5.4 GPa (Figure 4a), were not consistently observed across datasets and are attributed to experimental artifacts—likely arising from signal noise, sample orientation effects, or optical alignment fluctuations during compression. These features were excluded from interpretation of phase behavior.
To verify data reliability, Raman measurements were independently repeated at 473 K and 523 K. In both cases, the pressure evolution of the 410 cm−1 modes was consistently reproduced. For clarity, only one dataset per temperature—selected based on higher signal-to-noise ratio and spectral completeness—is presented here. Although the 563 K experiment was not repeated due to technical constraints, the observed trend aligns with those at lower temperatures. On this basis, the key spectral features shown in Figure 3a, Figure 4a and Figure 5a are considered reliable and representative of the phase transition.
Positions of the peaks near 410 cm−1 at 473 K, 523 K, and 563 K (Figure 3a, Figure 4a and Figure 5a, respectively) are plotted as a function of pressure in Figure 3b, Figure 4b and Figure 5b. The onset of the transition was identified at the pressure where the shoulder peak disappeared. Transition boundary pressures were estimated by averaging the pressure values immediately before and after this disappearance. For reference, a spectrum collected under ambient conditions is provided in Figure 4a.
The wavenumber evolution of the peaks near 410 cm−1 is shown in Figure 3b, Figure 4b and Figure 5b for the respective temperatures. Prior to the transition, the shoulder peak shifts slightly to lower wavenumbers. After the transition, the dominant 410 cm−1 mode exhibits a blue shift under further compression. These pressure-dependent changes are consistent with previously reported spectral behavior associated with the α-FeOOH-to-ε-FeOOH transformation [12,30].
At 473 K, the disappearance of the 410 cm−1 shoulder peak occurred at 4.7 GPa (Figure 3a,b). The arrows in Figure 3a visually trace the spectral evolution of the 410 cm−1 mode up to the point of disappearance. The transition onset is assigned at 4.7 GPa based on the first observable deviation from the ambient behavior. A distinct change in the slope of the wavenumber–pressure relationship (Figure 3b) from nearly zero (but negative) to positive further confirms the transition. Additionally, splitting of the 250 cm−1 and 300 cm−1 peaks was observed, likely resulting from a symmetry lowering associated with the phase transition, which lifts mode degeneracy and leads to band splitting.
At 523 K, the disappearance of the 410 cm−1 shoulder peak occurred at 6.0 GPa (Figure 4a). Similarly to the observations at 473 K but with more contrast, the slope of the frequency evolution as a function of pressure changes from negative to positive (Figure 4b), providing additional evidence of the phase transition.
At 563 K, the shoulder peak near 410 cm−1 disappears at 6.6 GPa (Figure 5a). Similarly to 523 K, the slope of the frequency evolution as a function of pressure changes from negative to positive (Figure 5b) after the phase transition.
To evaluate reversibility, decompression experiments were performed at each temperature. Samples were decompressed to pressures below the transition onset but above the known decomposition threshold of α-FeOOH to hematite [10]. Spectra of the decompressed samples were recorded at 2.1, 2.8, and 3.9 GPa for 473, 523, and 563 K as shown at the bottom of Figure 3a, Figure 4a and Figure 5a, respectively. Recovery of the original Raman features upon decompression confirmed that the α → ε phase transition is reversible under the investigated P-T conditions.

4. Discussion

The high-temperature, high-pressure Raman measurements in this study provide new constraints on the α- to ε-FeOOH phase transition, extending prior Raman investigations that were limited to ambient temperature. As summarized in Figure 6, the observed transition pressures of 4.7, 6.0, and 6.6 GPa at 473 K, 523 K, and 563 K, respectively, exhibit a clear positive correlation with temperature. We estimated the phase boundary by taking the average of pressures immediately before and after the first appearance of ε-FeOOH features. Fitting these data to a linear function yielded a slope of 2.3 ± 0.5 GPa per 100 K and a back-extrapolated transition pressure of 0.3 ± 3.1 GPa at room temperature (300 K).
In these experiments, the sample was loaded into the DAC without a pressure-transmitting medium due to the high-temperature conditions involved. The primary concern with omitting a pressure-transmitting medium is the development of non-hydrostatic stress at elevated pressures. However, since high temperatures aid in annealing deviatoric stress, we expect the impact of non-hydrostatic conditions to be minimal, although this setup is not ideal. It should be noted that the phase boundary determined in these experiments may represent a lower bound for the phase transition, as any residual deviatoric stress could promote the onset of the transition.
The α- to ε-FeOOH transition boundary has been a subject of considerable debate. Earlier work by Baneyeva and Bendeliani (1973) [39] and Voigt and Will (1981) [18] reported nearly parallel linear boundaries, though the latter is offset by approximately 1.5 GPa (Figure 6). In contrast, Wiethoff et al. (2017) [24], based on in situ XRD data, suggested a nearly pressure-independent boundary. The boundary derived in the present study falls between those reported by Baneyeva and Bendeliani (1973) [39] and Voigt and Will (1981) [18] within the studied P-T range, but with a steeper slope. The experiments reported by Gleason et al. (2008) [2] are less constrained on the phase boundary. Their data, nevertheless, are in good agreement with the present results, although the boundary they proposed by combining their data with those reported by Voigt and Will [18] has a less steep slope than the present work.
The extrapolated room-temperature transition pressure of 0.3 GPa from our fitted boundary is lower than previously reported pressure by Tang et al. [12] (5 GPa) and Liu et al. [30] (7 GPa), both based on Raman spectroscopy. This discrepancy is consistent with expectations, as pressure-induced phase transitions are often kinetically delayed to higher pressures in room-temperature compression experiments. Tang et al. [12] speculated that the spectral anomalies observed at 5 GPa could correspond to an antiferromagnetic–ferromagnetic transition but also suggested that this anomaly represents the same structural transformation identified by Liu et al. at 7 GPa, which is attributed to the α- to ε-FeOOH phase transition [30].
The larger Clapeyron slope reported here implies a greater release of latent heat during the phase transition than previously inferred. However, we caution that this slope may be overestimated due to differential stress within the sample chamber, as no pressure-transmitting medium was used. Elevated temperatures likely helped to partially reduce this stress; however, lower-temperature runs may have retained higher residual stress, potentially reduced the observed transition pressure, and steepened the derived phase boundary. A more hydrostatic environment would likely yield a shallower slope.
Reports on the reversibility of the α- to ε-FeOOH transition are mixed. Some studies, including Suzuki [15,40] and Wiethoff et al. [24], reported quenchable ε-FeOOH recoverable to ambient conditions. In contrast, our results—along with those of Tang et al. [12] and Liu et al. [30]—suggest that phase transition is reversible. The origin of this discrepancy remains uncertain, but it may be related to experimental setup: ε-FeOOH appears quenchable in multi-anvil press experiments [15,24,40], whereas it is reversible in diamond anvil cell (DAC) setups [12,30].
Despite broad agreement with earlier findings, discrepancies remain regarding the Clapeyron slope, the precise phase boundary, and the reversibility of the transition. These differences underscore the need for further investigations, particularly time-resolved measurements and combined in situ Raman and XRD studies, to better resolve the kinetic effects and structural details associated with this transformation.

5. Conclusions

In this study, we performed in situ high-pressure and high-temperature Raman spectroscopy of α-FeOOH using a diamond anvil cell, reaching up to ~11 GPa at temperatures of 473 K, 523 K, and 563 K. The results provide clear spectroscopic evidence for the α- to ε-FeOOH phase transition, with the disappearance of the 410 cm−1 Raman shoulder peak marking the onset of the transformation. Transition pressures were identified at 4.7, 6.0, and 6.6 GPa for the respective temperatures. A linear phase boundary was determined, yielding a Clapeyron slope of 2.3 ± 0.5 GPa per 100 K and a back-extrapolated transition pressure of 0.3 ± 3.1 GPa at 300 K. Although variations in the reported transition pressures and slopes exist across the literature, our results underscore the reliability of Raman spectroscopy in identifying subtle structural changes under extreme conditions. The phase transition was found to be reversible within the P-T range explored, further suggesting its robustness and relevance to geophysical processes. These findings support the hypothesis that ε-FeOOH could serve as a potential water or hydrogen carrier in subduction zones. Notably, this study offers new insight into the temperature dependence of the α–ε transition under simultaneous compression and heating—an area that remains insufficiently constrained in the current literature. By complementing pressure-only studies, these findings contribute to a more comprehensive understanding of ε-FeOOH stability in deep Earth environments. Future studies employing combined time-resolved Raman and XRD techniques, especially under hydrostatic conditions, will be valuable for refining the FeOOH phase diagram and better understanding the kinetic and thermodynamic factors controlling this transformation.

Author Contributions

Conceptualization, J.C.; methodology, A.D. and V.D.; investigation, S.S.E. and J.C.; formal analysis, S.S.E.; resources, V.D.; data curation, A.D.; x-ray diffraction W.L. and S.S.E.; writing—original draft preparation, S.S.E.; writing—review and editing, J.C. and S.S.E.; visualization, S.S.E. and J.C.; software, A.D.; validation, V.D.; supervision, J.C.; project administration, J.C.; funding acquisition, J.C. All authors have read and agreed to the published version of the manuscript.

Funding

This work was supported by the National Science Foundation grant number Grant EAR-1723185.

Data Availability Statement

Research data are available upon request to the correspondent author.

Conflicts of Interest

The authors declare no conflicts of interest.

Abbreviations

The following abbreviations are used in this manuscript:
XRDX-Ray Diffraction
DACDiamond Anvil Cell
GPaGigapascals

References

  1. Majzlan, J.; Lang, B.E.; Stevens, R.; Navrotsky, A.; Woodfield, B.F.; Boerio-Goates, J. Thermodynamics of Fe oxides: Part I. Entropy at standard temperature and pressure and heat capacity of goethite (α-FeOOH), lepidocrocite (γ-FeOOH), and maghemite (γ-Fe2O3). Am. Mineral. 2003, 88, 846–854. [Google Scholar] [CrossRef]
  2. Gleason, A.E.; Jeanloz, R.; Kunz, M. Pressure-temperature stability studies of FeOOH using X-ray diffraction. Am. Mineral. 2008, 93, 1882. [Google Scholar] [CrossRef]
  3. Hu, Q.; Kim, D.Y.; Yang, W.; Yang, L.; Meng, Y.; Zhang, L.; Mao, H.-K. FeO2 and FeOOH under deep lower-mantle conditions and Earth’s oxygen–hydrogen cycles. Nature 2016, 534, 241–244. [Google Scholar] [CrossRef] [PubMed]
  4. Nishi, M.; Kuwayama, Y.; Tsuchiya, J.; Tsuchiya, T. The pyrite-type high-pressure form of FeOOH. Nature 2017, 547, 205–208. [Google Scholar] [CrossRef]
  5. Pearson, D.G.; Brenker, F.E.; Nestola, F.; McNeill, J.; Nasdala, L.; Hutchison, M.T.; Matveev, S.; Mather, K.; Silversmit, G.; Schmitz, S.; et al. Hydrous mantle transition zone indicated by ringwoodite included within diamond. Nature 2014, 507, 221–224. [Google Scholar] [CrossRef] [PubMed]
  6. Palot, M.; Jacobsen, S.D.; Townsend, J.P.; Nestola, F.; Marquardt, K.; Miyajima, N.; Harris, J.W.; Stachel, T.; McCammon, C.A.; Pearson, D.G. Evidence for H2O-bearing fluids in the lower mantle from diamond inclusion. Lithos 2016, 265, 237–243. [Google Scholar] [CrossRef]
  7. Dixon, J.E.; Dixon, T.H.; Bell, D.R.; Malservisi, R. Lateral variation in upper mantle viscosity: Role of water. Earth Planet. Sci. Lett. 2004, 222, 451–467. [Google Scholar] [CrossRef]
  8. Van der Meijde, M.; Marone, F.; Giardini, D.; van der Lee, S. Seismic Evidence for Water Deep in Earth’s Upper Mantle. Science 2003, 300, 1556–1558. [Google Scholar] [CrossRef]
  9. Tschauner, O.; Huang, S.; Greenberg, E.; Prakapenka, V.B.; Ma, C.; Rossman, G.R.; Shen, A.H.; Zhang, D.; Newville, M.; Lanzirotti, A.; et al. Ice-VII inclusions in diamonds: Evidence for aqueous fluid in Earth’s deep mantle. Science 2018, 359, 1136–1139. [Google Scholar] [CrossRef]
  10. Majzlan, J.; Grevel, K.-D.; Navrotsky, A. Thermodynamics of Fe oxides: Part II. Enthalpies of formation and relative stability of goethite (α-FeOOH), lepidocrocite (γ-FeOOH), and maghemite (γ-Fe2O3). Am. Mineral. 2003, 88, 855–859. [Google Scholar] [CrossRef]
  11. Tang, R.; Liu, J.; Kim, D.Y.; Hu, Q.; Yang, B.; Li, Y.; Pickard, C.; Needs, R.; He, Y.; Liu, H.; et al. Chemistry and P-V-T equation of state of FeO2H at the base of Earth’s lower mantle and their geophysical implications. Sci. Bull. 2021, 66, 1954–1958. [Google Scholar] [CrossRef]
  12. Tang, R.; Chen, J.; Zeng, Q.; Li, Y.; Liang, X.; Yang, B.; Wang, Y. Study on the High-Pressure Behavior of Goethite up to 32 GPa Using X-Ray Diffraction, Raman, and Electrical Impedance Spectroscopy. Minerals 2020, 10, 99. [Google Scholar] [CrossRef]
  13. Thompson, E.C.; Davis, A.H.; Brauser, N.M.; Liu, Z.; Prakapenka, V.B.; Campbell, A.J. Phase transitions in ε-FeOOH at high pressure and ambient temperature. Am. Mineral. 2020, 105, 1769–1777. [Google Scholar] [CrossRef]
  14. Thompson, E.C.; Campbell, A.J.; Tsuchiya, J. Elasticity of ε-FeOOH: Seismic implications for Earth’s lower mantle. J. Geophys. Res. Solid Earth 2017, 122, 5038–5047. [Google Scholar] [CrossRef]
  15. Suzuki, A. High-pressure X-ray diffraction study of ε-FeOOH. Phys. Chem. Miner. 2010, 37, 153–157. [Google Scholar] [CrossRef]
  16. Chen, J.; Esdaille, S. Is Earth’s core rusting? Eos 2022, 103, 34–39. [Google Scholar] [CrossRef]
  17. Esdaille, S.S.; Chen, J. Mineral physics constraints on ultra-low velocity zones in the lowermost mantle. Earth-Sci. Rev. 2024, 250, 104685. [Google Scholar] [CrossRef]
  18. Voigt, R.; Will, G. The system Fe2O3-H2O under high-pressures. Neues Jahrb. MineraIogie-Monatshefte 1981, 2, 89–96. [Google Scholar]
  19. Xu, C.; Nishi, M.; Inoue, T. Solubility behavior of δ-AlOOH and ε-FeOOH at high pressures. Am. Mineral. 2019, 104, 1416–1420. [Google Scholar] [CrossRef]
  20. Nishi, M.; Irifune, T.; Gréaux, S.; Tange, Y.; Higo, Y. Phase transitions of serpentine in the lower mantle. Phys. Earth Planet. Inter. 2015, 245, 52–58. [Google Scholar] [CrossRef]
  21. Nishi, M.; Tsuchiya, J.; Kuwayama, Y.; Arimoto, T.; Tange, Y.; Higo, Y.; Hatakeyama, T.; Irifune, T. Solid Solution and Compression Behavior of Hydroxides in the Lower Mantle. J. Geophys. Res. Solid Earth 2019, 124, 10231–10239. [Google Scholar] [CrossRef]
  22. Tsuchiya, J. First principles prediction of a new high-pressure phase of dense hydrous magnesium silicates in the lower mantle. Geophys. Res. Lett. 2013, 40, 4570–4573. [Google Scholar] [CrossRef]
  23. Ohtani, E.; Amaike, Y.; Kamada, S.; Sakamaki, T.; Hirao, N. Stability of hydrous phase H MgSiO4H2 under lower mantle conditions. Geophys. Res. Lett. 2014, 41, 8283–8287. [Google Scholar] [CrossRef]
  24. Wiethoff, F.; Grevel, K.-D.; Marler, B.; Herrmann, J.; Majzlan, J.; Kirste, J.; Lathe, C. P-V-T behavior of FeO(OH) and MnO(OH). Phys. Chem. Miner. 2017, 44, 567–576. [Google Scholar] [CrossRef]
  25. Yoshino, T.; Baker, E.; Duffey, K. Fate of water in subducted hydrous sediments deduced from stability fields of FeOOH and AlOOH up to 20 GPa. Phys. Earth Planet. Inter. 2019, 294, 106295. [Google Scholar] [CrossRef]
  26. Nishihara, Y.; Matsukage, K.N. Iron-titanium oxyhydroxides as water carriers in the Earth’s deep mantle. Am. Mineral. 2016, 101, 919–927. [Google Scholar] [CrossRef]
  27. Liu, X.; Matsukage, K.N.; Nishihara, Y.; Suzuki, T.; Takahashi, E. Stability of the hydrous phases of Al-rich phase D and Al-rich phase H in deep subducted oceanic crust. Am. Mineral. 2019, 104, 64–72. [Google Scholar] [CrossRef]
  28. Otte, K.; Pentcheva, R.; Schmahl, W.W.; Rustad, J.R. Pressure-induced structural and electronic transitions in FeOOH from first principles. Phys. Rev. B 2009, 80, 205116. [Google Scholar] [CrossRef]
  29. Suzuki, A. Thermal equation of state of goethite (α-FeOOH). High Press. Res. 2017, 37, 193–199. [Google Scholar] [CrossRef]
  30. Liu, K.; Dai, L.; Li, H.; Hu, H.; Zhuang, Y.; Linfei, Y.; Pu, C.; Hong, M. Pressure-induced phase transitions for goethite investigated by Raman spectroscopy and electrical conductivity. High Press. Res. 2019, 39, 106–116. [Google Scholar] [CrossRef]
  31. Cornell, R.M.; Schwertmann, U. The Iron Oxides: Structure, Properties, Reactions, Occurrences and Uses, 2nd ed.; Wiley-VCH: Weinheim, Germany, 2003. [Google Scholar]
  32. Dünnwald, J.; Otto, A. An investigation of phase transitions in rust layers using raman spectroscopy. Corros. Sci. 1989, 29, 1167–1176. [Google Scholar] [CrossRef]
  33. de Faria, D.L.A.; Venâncio Silva, S.; de Oliveira, M.T. Raman microspectroscopy of some iron oxides and oxyhydroxides. J. Raman Spectrosc. 1997, 28, 873–878. [Google Scholar] [CrossRef]
  34. Schwertmann, U.; Cornerll, R.M. Goethite. In Iron Oxides in the Laboratory; Wiley-VCH: Weinheim, Germany, 2000; pp. 67–92. [Google Scholar]
  35. Toby, B.H.; Von Dreele, R.B. GSAS-II: The genesis of a modern open-source all purpose crystallography software package. J. Appl. Crystallogr. 2013, 46, 544–549. [Google Scholar] [CrossRef]
  36. Momma, K.; Izumi, F. VESTA 3 for three-dimensional visualization of crystal, volumetric and morphology data. J. Appl. Crystallogr. 2011, 44, 1272–1276. [Google Scholar] [CrossRef]
  37. Mao, H.K.; Xu, J.; Bell, P.M. Calibration of the ruby pressure gauge to 800 kbar under quasi-hydrostatic conditions. J. Geophys. Res. Solid Earth 1986, 91, 4673–4676. [Google Scholar] [CrossRef]
  38. Wojdyr, M. Fityk: A general-purpose peak fitting program. J. Appl. Crystallogr. 2010, 43, 1126–1128. [Google Scholar] [CrossRef]
  39. Baneyeva, M.I. The Fe2O3-H2O system at high pressures and extemperatures. Geochem. Int. 1973, 10, 840–842. [Google Scholar]
  40. Suzuki, A. Pressure–volume–temperature equation of state of ε–FeOOH to 11 GPa and 700 K. J. Mineral. Petrol. Sci. 2016, 111, 420–424. [Google Scholar] [CrossRef]
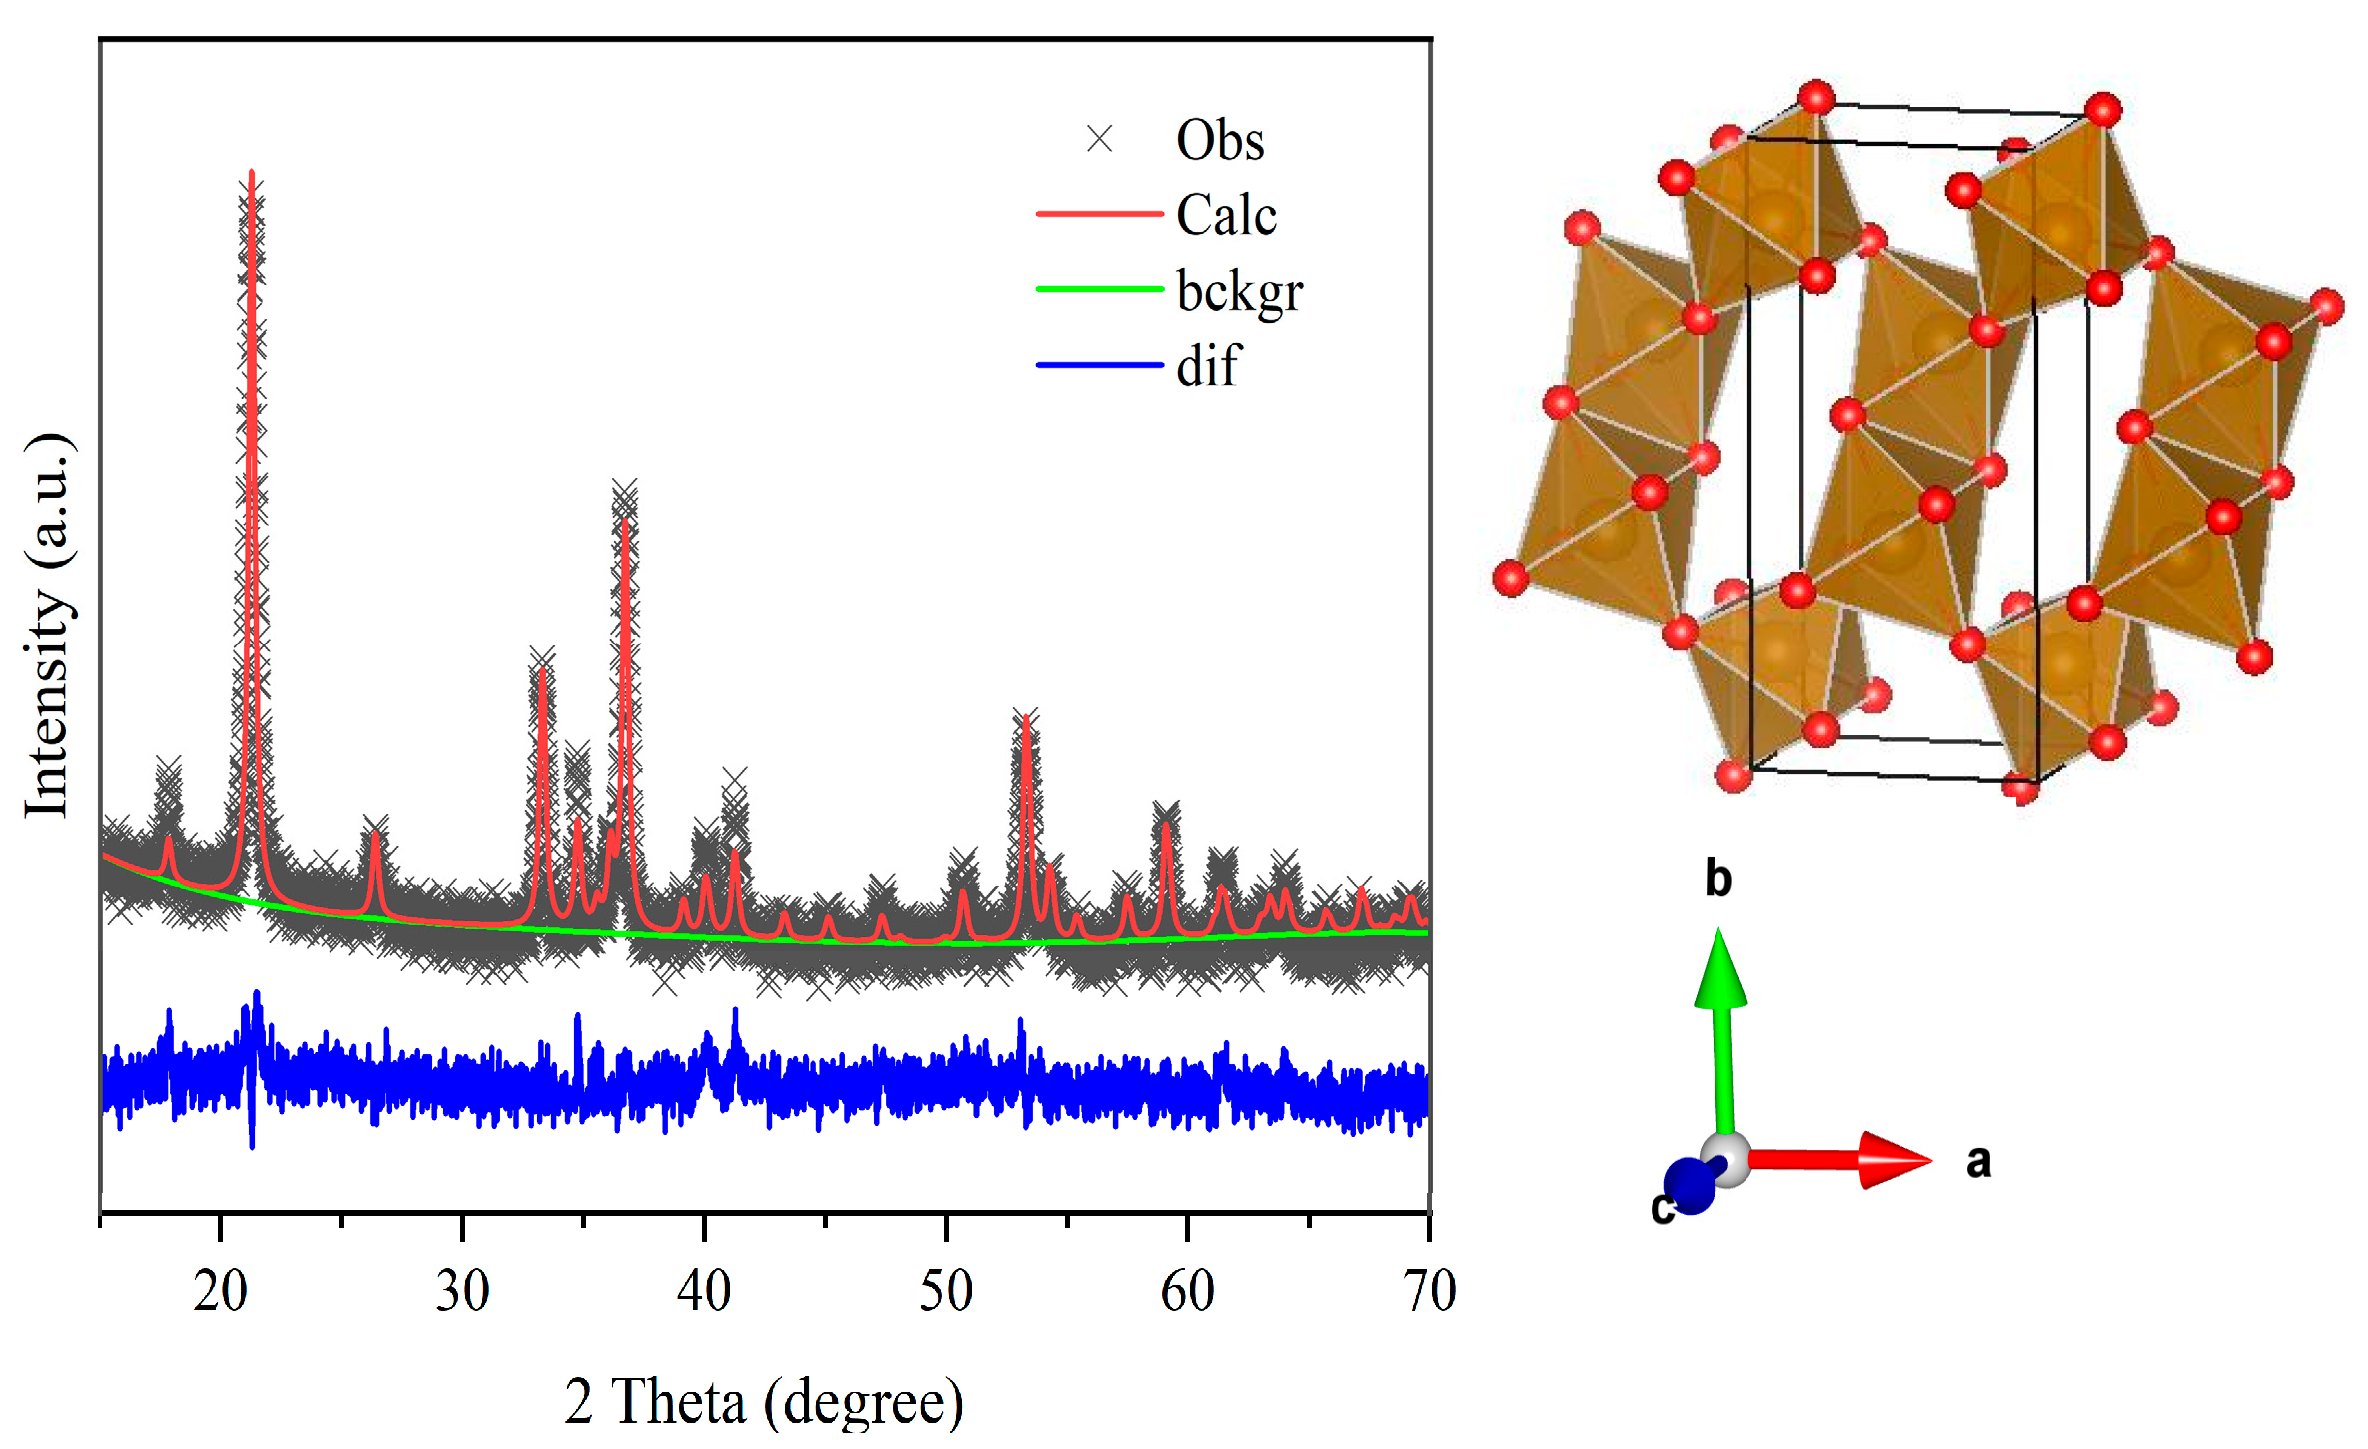
Figure 1. X-ray diffraction pattern (left) and corresponding structural model (right) of the α-FeOOH starting material. The refined orthorhombic lattice parameters are a = 4.61 Å, b = 9.95 Å, and c = 3.02 Å (space group Pbnm). In the structural model, only iron and oxygen atoms are shown for clarity, with Fe atoms at the centers and O atoms at the corners of the FeO6 octahedra; hydrogen atoms are omitted.
Crystals 15 00782 g001
Figure 2. (a) Externally heated DAC setup. (b) Optical microscope image of the starting material (α-FeOOH) and ruby crystal used for pressure calibration.
Crystals 15 00782 g002
Figure 3. (a) Selected Raman spectra of FeOOH at 473K and different pressures. The spectrum in orange color at the bottom (2.1 GPa *) is taken during decompression. Arrows indicate the peaks serving as the principal indicator for the α → ε phase transition. (b) Frequency evolution of the principal transition indicator peaks near 410 cm−1 with increasing pressures at 473 K. Dashed lines represent linear trendlines of the data in each corresponding pressure range.
Crystals 15 00782 g003
Figure 4. (a) Selected Raman spectra of FeOOH at 523 K and different pressures. The spectrum in gray color at the bottom is taken at 0.18 GPa, and 299 K served as a reference of room temperature and pressure (RTP) conditions. The spectrum in orange color at 2.8 GPa * is taken during decompression. Arrows indicate the peaks serving as the principal indicator for the α → ε phase transition. (b) Frequency evolution of the principal transition indicator peaks near 410 cm−1 with increasing pressures at 523 K. Dashed lines represent linear trendlines of the data in each corresponding pressure range.
Crystals 15 00782 g004
Figure 5. (a) Selected Raman spectra of FeOOH at 563 K and different pressures. The spectrum in orange color at the bottom (3.9 GPa *) is taken during decompression. Arrows indicate the peaks serving as the principal indicator for the α → ε phase transition. (b) Frequency evolution of the principal transition indicator peaks near 410 cm−1 with increasing pressures at 563 K. Dashed lines represent linear trendlines of the data in each corresponding pressure range.
Crystals 15 00782 g005
Figure 6. Summary of FeOOH stability field for temperatures and pressures, ranging from 473 to 563 K and from 2 to 11 GPa, respectively. Solid circles and triangles represent α-FeOOH and ε-FeOOH phase, respectively, during compression. The experimental errors are smaller than or within the size of the plot symbols. The boundaries from the literature (highest observed α-FeOOH pressure and lowest observed ε-FeOOH pressure) are also included for reference. Dashed and dash-dotted lines represent the previously experimentally determined phase boundaries of α-to-ε phase transition and the decomposition of α-FeOOH to hematite α-Fe2O3 and water, respectively. The dotted line marks our newly determined α- to ε-FeOOH boundary.
Crystals 15 00782 g006
Disclaimer/Publisher’s Note: The statements, opinions and data contained in all publications are solely those of the individual author(s) and contributor(s) and not of MDPI and/or the editor(s). MDPI and/or the editor(s) disclaim responsibility for any injury to people or property resulting from any ideas, methods, instructions or products referred to in the content.