Article

Effects of Mn and Co Doping on the Electronic Structure and Optical Properties of Cu2ZnSnS4

College of Physics and Electronic Science, Anshun University, Anshun 561000, China
*
Author to whom correspondence should be addressed.
Crystals 2025, 15(9), 781; https://doi.org/10.3390/cryst15090781
Submission received: 13 August 2025 / Revised: 26 August 2025 / Accepted: 29 August 2025 / Published: 30 August 2025

Abstract

The electronic structures and optical properties of Mn-doped, Co-doped, and (Mn,Co)-co-doped Cu2ZnSnS4 were calculated and analyzed using the first-principles pseudopotential plane-wave approach. The results indicate that doping with Mn or Co increases the bond population and decreases the bond length of the S-Mn and S-Co bonds, respectively, enhancing their covalent character. The undoped Cu2ZnSnS4 exhibits a bandgap of 0.16 eV, whereas doping with Mn or Co introduces impurity levels near the Fermi level, resulting in bandgap narrowing. Within the visible light spectrum, the static dielectric constant ε1(0) reaches its maximum value of 67.7 under co-doping conditions, and the absorption coefficient also attains its maximum value of 6.7 × 104 cm−1 under co-doping. Doping with Mn and Co induces a redshift (shift towards lower energy) in both the absorption peaks and dielectric function peaks, concomitantly increasing the probability of photon-induced electronic transitions. Conversely, doping shifts the reflectivity peaks towards higher energies (blue-shift), with the most pronounced blue-shift occurring under co-doping; the strongest reflectivity peaks remain below 43%. A prominent conductivity peak is observed at 1.7 eV. Doping shifts this peak position towards lower energies, with the maximum peak intensity reaching 1.6. These findings collectively suggest that Mn and Co doping effectively modulate key optical properties of Cu2ZnSnS4, such as its band gap and absorption coefficient, constituting an effective strategy for enhancing its optoelectronic transport characteristics.

1. Introduction

Cu2ZnSnS4 (CZTS) has emerged as a prominent absorber layer material for thin-film solar cells due to its environmentally benign constituent elements, favorable optical bandgap tunability (1.0 to 1.5 eV), high absorption coefficient (~104 cm−1), and excellent low-light response performance [1,2]. Theoretical calculations predict a power conversion efficiency (PCE) of up to 32.2% for Cu2ZnSnS4-based thin-film solar cells [3]. However, the highest experimentally reported PCE to date remains at 12.6% [4], indicating significant potential for efficiency improvement. Research identifies low open-circuit voltage (Voc) and Fill Factor (FF) as the primary limiting factors for Cu2ZnSnS4 device efficiency [5], with Voc primarily constrained by band tail states and deep-level defects [6]. Cu2ZnSnS4 is derived from the binary semiconductor ZnS [7]. During its formation, secondary ZnS phases inevitably arise due to Cu-Zn disorder [8], alongside intrinsic point defects such as copper-on-zinc antisites (CuZn), tin-on-zinc antisites (SnZn) [9,10], and sulfur vacancies (VS) [11]. Among these defects, CuZn exhibits a relatively low formation energy and readily acts as a carrier recombination center, degrading cell efficiency [12]. Furthermore, the defect pair formed by CuZn and SnZn significantly influences band tail states, further reducing the conversion efficiency [13].
Suppressing defects, improving band tail states, and enhancing the crystalline quality of Cu2ZnSnS4 thin films represent effective strategies for increasing solar cell conversion efficiency. However, simple stoichiometric adjustment is insufficient to effectively inhibit defect formation and secondary phase generation during Cu2ZnSnS4 synthesis [9]. Consequently, various approaches have been explored to address these challenges. Research indicates that elemental doping can reduce secondary phases like ZnS, suppress defect states in Cu2ZnSnS4, and improve thin-film crystallinity [14]. Doping studies on Cu2ZnSnS4 primarily focus on anion doping and cation doping. Anion doping typically requires high-temperature sulfurization treatment, making precise control of the S/Sn ratio difficult [15], which adversely affects film quality. In contrast, cation doping involves incorporating the substituting element directly during Cu2ZnSnS4 formation, offering superior compositional control and reproducibility. Cation doping research has predominantly targeted Cu and Zn substitution sites, yielding substantial results with elements such as Li, Ag, Na, Fe, and Ni [16,17,18,19,20]. Nevertheless, studies on Mn and Co doping of Cu2ZnSnS4 remain relatively limited. Mn doping [21] has been shown to promote grain growth, reduce band tail states, suppress ZnS formation, and enhance charge transport. Co doping [22] can mitigate Cu-Zn disorder, improve crystalline quality, and effectively tune the optical bandgap. Despite the breadth of single-element doping studies, improvements in cell efficiency have been incremental. Consequently, research has shifted towards dual-ion co-doping as a strategy to enhance conversion efficiency. Co-doping leverages the synergistic effects of two distinct ions, demonstrating significant potential for defect passivation and grain growth promotion [5].
Therefore, this study employs the pseudopotential plane-wave method based on density functional theory (DFT) [23,24] to calculate the electronic structure and optical properties of Mn-doped, Co-doped, and (Mn,Co)-co-doped Cu2ZnSnS4. The investigation focuses on elucidating the effects of individual (Mn,Co) and co-doping on the band structure, density of states (DOS), and optical characteristics of Cu2ZnSnS4.

2. Theoretical Models and Calculation Methods

2.1. Theoretical Models

The computational models utilized the kesterite-structured Cu2ZnSnS4 unit cell, belonging to the space group I 4 ¯ ( N o .82 ) . Each unit cell comprises 4 Cu atoms, 2 Zn atoms, 2 Sn atoms, and 8 S atoms, with lattice constants of a = 5.428 Å and c = 10.864 Å [25]. References [26,27,28] employed a 2 × 2 × 1 supercell for calculations of Cu2ZnSnS4, which demonstrated structural stability. Thus, we also adopted a 2 × 2 × 1 supercell for our computations, with the resulting supercell comprising 64 atoms. In the case of single doping with Mn or Co, the calculations were performed by replacing one Zn atom at the Zn1 site (x = 0.25001263, y = 0.50000500, z = 0.74998448) in the Cu2ZnSnS4 supercell with one Mn or Co atom, respectively. For co-doping with Mn and Co, the model was constructed by replacing one Zn atom at the Zn1 site (x = 0.25001263, y = 0.50000500, z = 0.74998448) with a Mn atom, and simultaneously replacing another Zn atom at the Zn2 site (x = 0.74998755, y = 0.49999496, z = 0.74998424) with a Co atom. The doping concentrations for single Mn or Co doping were 1.6%, while that for (Mn,Co)-co-doping was 3.1%. The structural model of the Cu2ZnSnS4 supercell is illustrated in Figure 1.

2.2. Calculation Methods

The calculations were performed using the first-principles pseudopotential plane-wave method, implemented within the CASTEP [29] software package of the Materials Studio simulation platform. The valence electron configurations included: Cu (3d104s1), Zn (3d104s2), Sn (5s25p2), S (3s23p4), Mn (3d54s2), and Co (3d74s2). The exchange-correlation energy was treated using the Perdew–Burke–Ernzerhof (PBE) [30] functional within the generalized gradient approximation (GGA). Ultrasoft pseudopotentials [31] were employed to describe the interactions between ionic cores and valence electrons. The plane-wave basis set cutoff energy was set to 380 eV. Self-consistent field (SCF) convergence was achieved with an energy tolerance of 5.0 × 10⁻⁷ eV/atom. Brillouin zone integration was performed using a 4 × 4 × 4 Monkhorst-Pack k-point mesh.
This study does not account for excitonic effects or scissors operator corrections; therefore, the calculated values of the bandgap and optical properties (such as the dielectric function and absorption coefficient) may exhibit certain discrepancies compared to experimental measurements. However, the primary objective of this work is to investigate the relative trends of influence of doping on the electronic structure and optical properties of Cu2ZnSnS4. Numerous studies [32,33,34,35,36] have demonstrated that, at the same level of computational accuracy, the GGA–PBE functional can reliably predict doping-induced evolution in the electronic structure and trends in optical properties, making it an effective approach for preliminary material screening and mechanistic exploration.

2.3. Calculation Methods for Optical Properties

The computation of optical properties, including the dielectric function, absorption coefficient, reflection coefficient, refractive index, extinction coefficient, and photoconductivity, was performed using the CASTEP [29] package within the Materials Studio materials simulation platform.
The macroscopic optical properties of semiconductors are typically characterized by the complex dielectric function, ε ( ω ) = ε 1 ( ω ) + i ε 2 ( ω ) , and the complex refractive index, N ( ω ) = n ( ω ) + i k ( ω ) .
ε 1 ( ω ) = n 2 k 2
ε 2 ( ω ) = 2 n k
where ε 1 ( ω ) represents the real part of the complex dielectric function, ε 2 ( ω ) denotes its imaginary part, n ( ω ) is the real part of the refractive index (often simply called the refractive index), and k ( ω ) is the extinction coefficient.
The real and imaginary parts of the complex dielectric function can be derived according to the Kramers–Kronig relations [37].
ε 1 ( ω ) = 1 + 2 π ρ 0 0 ω ω 2 ( ω ) ω 2 ω 2 d ω
ε 2 ( ω ) = A ω 2 C , V B Z 2 ( 2 π 3 ) M C V ( K ) 2 × δ ( E C K E V K h ω ) d 3 K
In the equation, subscripts C and V denote the conduction band and valence band, respectively; BZ represents the first Brillouin zone; M C V ( K ) 2 stands for the dipole moment matrix element; K is the reciprocal lattice vector; A signifies a constant coefficient; ω indicates frequency; δ represents Dirac function; and E C K and E V K correspond to the eigenenergies of the conduction band and valence band. Based on the dielectric function, optical constants such as absorption coefficient α ( ω ) , reflectivity R ( ω ) , refractive index n ( ω ) , and electrical conductivity σ ( ω ) can be derived [35,38,39].
α ( ω ) = 2 ω c ε 1 ( ω ) 2 + ε 2 ( ω ) 2 1 2 ε 1 ( ω ) 1 2
R ( ω ) = ε 1 ( ω ) + i ε 2 ( ω ) 1 ε 1 ( ω ) + i ε 2 ( ω ) + 1 2
n ( ω ) = 1 2 ε 1 2 ( ω ) + i ε 2 2 ( ω ) + ε 1 ( ω ) 1 2
k ( ω ) = 1 2 ε 1 2 ( ω ) + i ε 2 2 ( ω ) ε 1 ( ω ) 1 2
σ ( ω ) = σ 1 ( ω ) + i σ 2 ( ω ) = i ω 4 π ε ( ω ) 1

3. Results and Discussion

3.1. Geometric Structure Analysis

The geometrical structure optimization results of Cu2ZnSnS4 are presented in Table 1. As shown in the table, the undoped lattice parameters are determined to be a = 5.471 Å and c = 10.941 Å. The lattice constant a of the undoped structure shows a minor deviation of 0.80% from the experimental value, while the c parameter deviates by 0.71% from the experimental value [25], indicating good agreement with experimental data. Furthermore, the undoped lattice constant a exhibits a negligible deviation of 0.09% from the computational reference value, and the c parameter demonstrates a deviation of 0.11% from the computational value [40], confirming consistency with previously reported theoretical calculations. Both single doping (Mn,Co) and co-doping lead to a reduction in the lattice constant a and unit cell volume v of Cu2ZnSnS4, while the lattice constant c remains relatively unchanged. The substitution of Zn by Co results in a contraction of the lattice constant a and unit cell volume v of Cu2ZnSnS4, attributable to the smaller ionic radius of Co2+ (0.72 Å) compared to that of Zn2+ (0.74 Å).

3.2. Electronic Structure Analysis

3.2.1. Band Structure Analysis

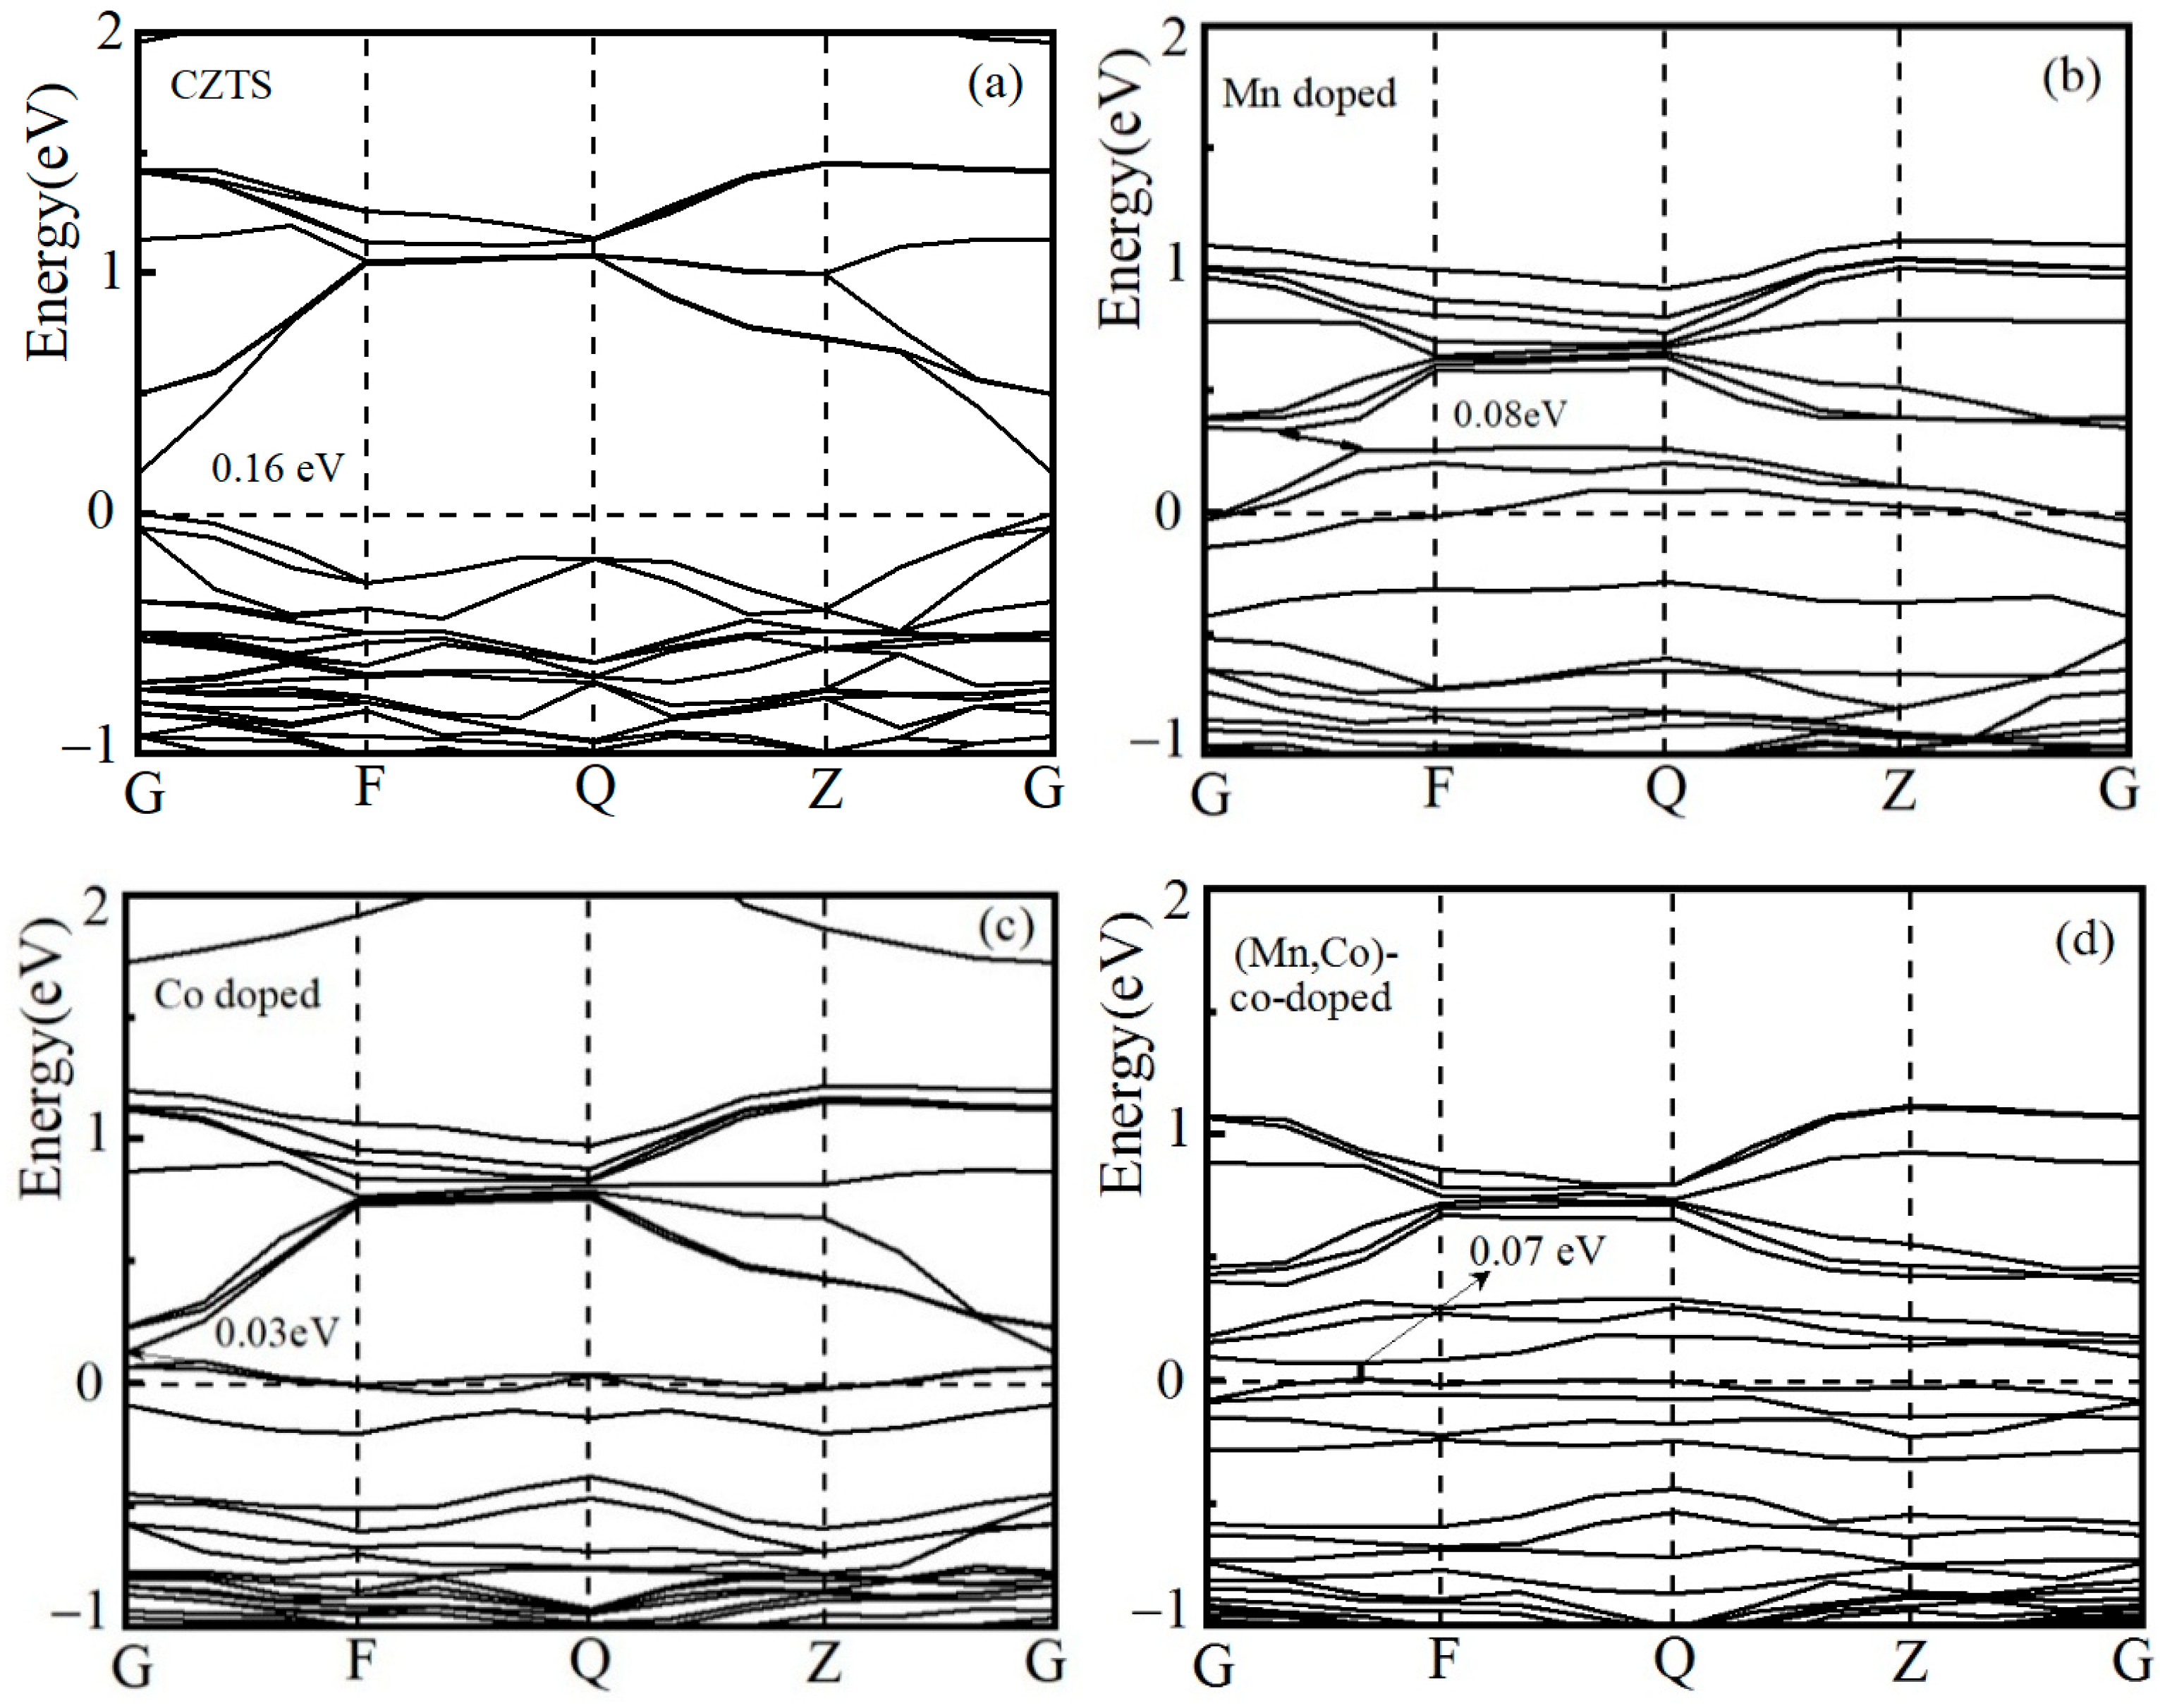
The band structure calculations were performed along the high-symmetry path G(0.000, 0.000, 0.000) → F(0.000, 0.500, 0.000) → Q(0.000, 0.500, 0.500) → Z(0.000, 0.000, 0.500) → G(0.000, 0.000, 0.000) in the first Brillouin zone. The band structures of undoped, Mn-doped, Co-doped, and (Mn,Co)-co-doped Cu2ZnSnS4 are presented in Figure 2, with the horizontal dashed line at 0 eV on the vertical axis representing the Fermi level. Figure 2a reveals that the band gap of undoped Cu2ZnSnS4 is 0.16 eV, consistent with the computational results reported by Joachim [39]. Figure 2b shows the band structure for Mn-doped Cu2ZnSnS4, exhibiting a reduced band gap of 0.08 eV. Mn doping introduces impurity states near the Fermi level, shifting the valence band maximum (VBM) upwards and consequently narrowing the band gap. Figure 2c shows the band structure for Co-doped Cu2ZnSnS4, where the band gap is reduced to 0.03 eV. Analysis of Figure 3 indicates that Co doping induces hybridization between the Co 3d and Cu 3d states. As the Co 3d orbitals are partially filled, they act as acceptor centers capable of receiving electrons, leading to a downward shift of the conduction band minimum (CBM) and a reduction in the band gap. The band structure for (Mn,Co)-co-doped Cu2ZnSnS4 (Figure 2d) exhibits a band gap of 0.07 eV. The synergistic coupling effect of Mn and Co co-doping similarly causes a downward shift of the CBM, reducing the band gap. It should be noted that the calculated band gaps for both doped and undoped Cu2ZnSnS4 in this work are smaller than experimental values. This discrepancy primarily arises from the inherent limitations of the DFT framework, which neglects the discontinuity in the exchange-correlation potential and underestimates electron-electron interactions within the many-particle system for excited states. However, this systematic underestimation does not invalidate the subsequent computational results and analyses [41,42].

3.2.2. Density of States Analysis

Figure 3 presents the density of states for Mn-doped, Co-doped, and (Mn,Co)-co-doped Cu2ZnSnS4, with the vertical dashed line at 0 eV on the horizontal axis indicating the Fermi level. Figure 3a displays the total density of states and atom-projected partial density of states for undoped Cu2ZnSnS4. Analysis reveals the upper valence band region (−5.5 to 0 eV) is predominantly contributed by Cu 3d orbitals, S 3p orbitals, and minor Sn 5p orbitals. The middle valence band region (−8.3 to −5.5 eV) primarily originates from Zn 3d orbitals, Sn 5s orbitals, and minor S 3p orbitals. The lower valence band region (−14.4 to −12.2 eV) consists mainly of S 3p orbitals, Sn 5s orbitals, and Sn 5p orbitals. The conduction band region (0 to 3.0 eV) is dominated by S 3p orbitals, Sn 5s orbitals, and Sn 5p orbitals. Figure 3b indicates Mn doping introduces Mn 3d impurity states near the Fermi level, accompanied by a pronounced density of states peak at 0.31 eV in the conduction band. This feature correlates with the impurity levels in Figure 2b. Hybridization involving the S 3p and Sn 5s states with this impurity level shifts the conduction band downward, resulting in a reduction of the band gap. As shown in Figure 3c, Co doping generates Co 3d impurity states near the Fermi level, characterized by two distinct density of states peaks near the valence band maximum and at the Fermi level, consistent with Figure 2c. Strong hybridization between Co 3d orbitals, Cu 3d orbitals, and S 3p orbitals at the valence band edge induces downward shifts in both the conduction band (approximately 0.41 eV) and valence band, narrowing the band gap. Figure 3d demonstrates (Mn,Co)-co-doped produces density of states peaks at the valence band maximum, Fermi level, and lower conduction band. Enhanced orbital hybridization results in both valence band and conduction band shifting toward lower energies, concomitant with band gap reduction.

3.3. Mulliken Population Analysis

The Mulliken population of electrons and the bonding interactions between atoms reflect significant charge transfer [43]. Table 2 presents the atomic population charges, while Table 3 lists the bond populations. In Table 2, the symbol “−” denotes electron gain. The Zn1 atom is coordinated by four adjacent S atoms (S1, S2, S3, S4), and the Zn2 atom is likewise coordinated by four adjacent S atoms (S5, S6, S7, S8), as shown in Figure 1. In the undoped system, the effective charge gained by the S atom adjacent to Zn1 is 0.37 e. Upon Mn doping, this effective charge decreases to 0.25 e, likely due to stronger interactions involving S. Following Co-doping, the adjacent S atom gains an effective charge of 0.28 e, intermediate between the undoped and Mn-doped values, indicating that the polarizing power of Co towards S is weaker than that of Mn but stronger than that of Zn. In the (Mn,Co)-co-doped system, the Mulliken population for Mn is 0.09 e, compared to 0.01 e for Co, suggesting that Mn tends to provide more positive charge.
As shown in Table 3, the S-Zn bond population in the undoped system is 0.48, with a bond length of approximately 2.366 Å. After Mn doping, the S-Mn bond population increases while its bond length decreases, signifying enhanced covalency. This is attributed to coupling between the Mn 3d and S 3p states. Similarly, Co doping leads to an increased S-Co bond population and a reduced bond length. In the co-doped system, the S-Mn bond exhibits even stronger covalency, while the S-Co bond lengths exhibit disparity. This asymmetry may arise from local lattice distortions or charge competition asymmetry between Mn and Co. As observed in Table 3, the average bond length of the four S–Mn bonds (2.192 Å) after Mn substitution for Zn is shorter than that of the corresponding four S–Zn bonds (2.366 Å). According to quantum chemical theory [39], this leads to a reduction in both the lattice parameters and the unit cell volume, which aligns with the calculated results presented in Table 1 and serves as the primary reason for the lattice contraction observed upon Mn doping.
To investigate the synergistic effects of (Mn,Co)-co-doping, we computed the electron density difference, as shown in Figure 4. The results reveal significant charge transfer around the Mn and Co atoms, indicating charge redistribution and strong chemical interactions between the dopant atoms and the atoms in the Cu2ZnSnS4 system, leading to enhanced bonding effects.

3.4. Optical Properties Analysis

3.4.1. Complex Dielectric Function

The real part of the dielectric function, represents the polarization of the medium. A higher value indicates a stronger capacitance for charge confinement. The imaginary part, signifies the energy dissipation associated with the formation of electric dipoles; a larger value corresponds to a greater probability of electron excitation and interband transitions [44,45].
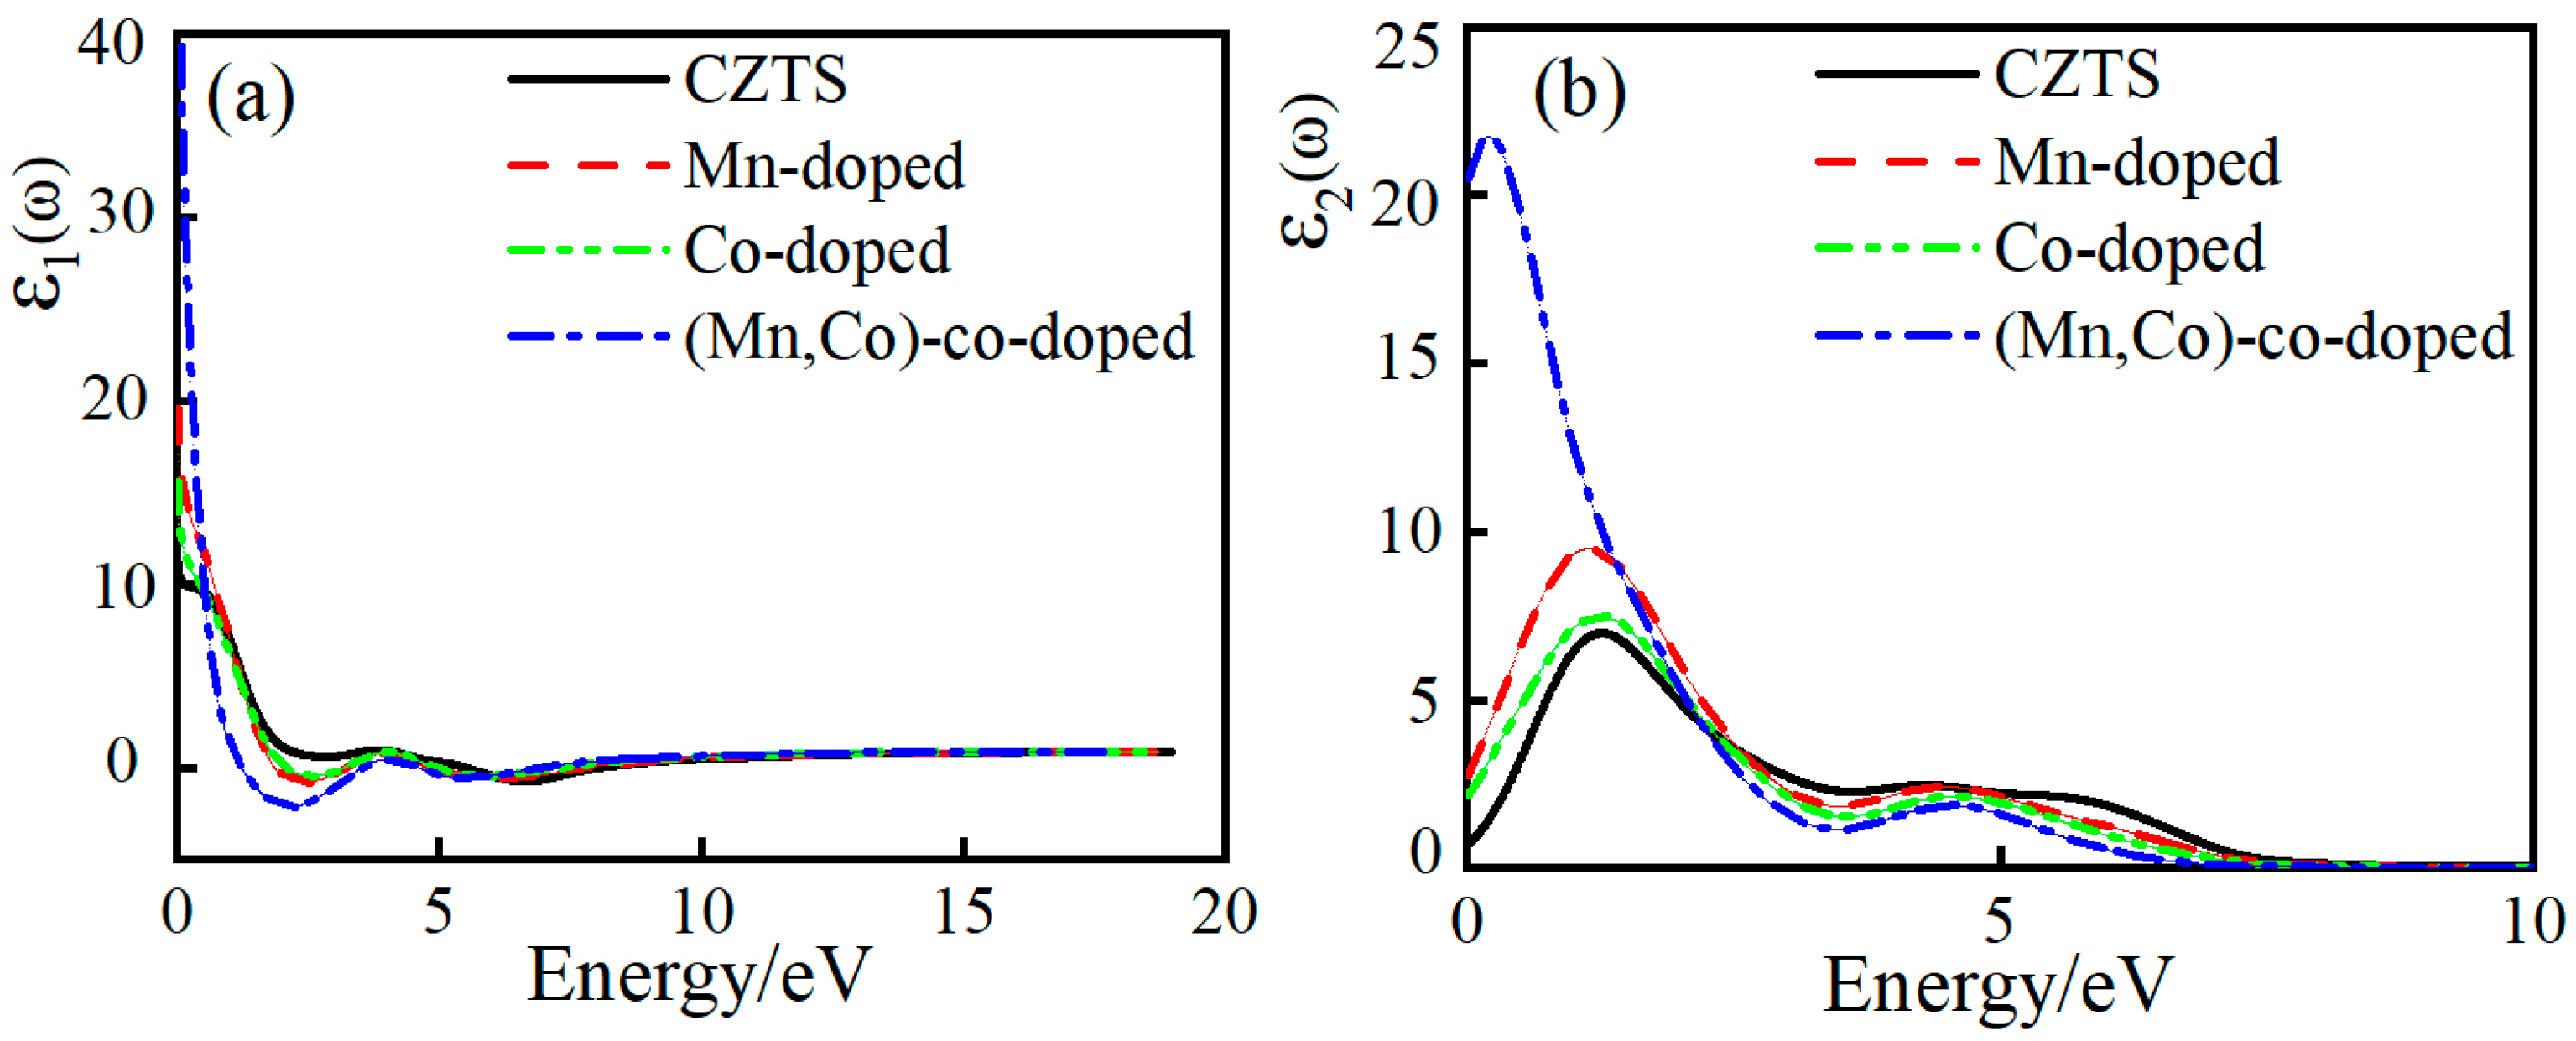
Figure 5a shows the real part of the complex dielectric function for Mn-doped, Co-doped, and (Mn,Co)-co-doped Cu2ZnSnS4. The static dielectric constant of undoped Cu2ZnSnS4, denoted as ε 1 ( 0 ) = 11.1 . Both Mn and Co single-doping increase the static dielectric constant, reaching a maximum value of 67.7 under (Mn,Co)-co-doping. This enhancement primarily arises from the reduced bond lengths and increased covalency of the S-Mn and S-Co bonds induced by doping, which strengthens the charge confinement capability. This indicates that Mn and Co doping can enhance the charge storage capacity of Cu2ZnSnS4, favoring light absorption. On the other hand, according to the Penn model [46], the dielectric constant is approximately inversely proportional to the band gap. A reduction in the band gap leads to an enhancement in both the dielectric constant and the absorption coefficient in the low-energy region.
As seen in Figure 5b, the imaginary part of undoped Cu2ZnSnS4 exhibits three distinct peaks. Based on the analysis of Figure 3, the peak at 1.26 eV originates primarily from direct transitions from the Cu 3d to Sn 5s orbital energy levels. The peak at 4.3 eV arises mainly from transitions from the Cu 3d to Sn 5s or from the Cu 3d to S 3p orbital energy levels. The peak at 5.5 eV is attributed predominantly to transitions from the Cu 3d to Sn 5p orbital energy levels. Following Mn or Co doping, the dielectric peaks shift towards lower energies (red-shift), and their intensities increase. Under (Mn,Co)-co-doping, these peaks exhibit the lowest energy positions and the highest intensity, with a maximum peak value of 21.7. This demonstrates that (Mn,Co)-co-doping maximizes the probability of photon absorption and subsequent electronic transitions in Cu2ZnSnS4.

3.4.2. Absorption and Reflection Spectra

The light absorption of semiconductor materials is a critical factor influencing the power conversion efficiency of solar photovoltaic cells. As shown in Figure 6a, the absorption edge of undoped Cu2ZnSnS4 is at 0.16 eV, corresponding to its bandgap energy. Within the photon energy range of 0 to 3.7 eV, the absorption peaks shift towards lower energies (red-shift) upon Mn or Co doping. At 2.4 eV, the absorption coefficient reaches its maximum value of 6.7 × 104 cm−1 for (Mn,Co)-co-doped Cu2ZnSnS4. This indicates that (Mn,Co)-co-doping significantly enhances the light absorption of Cu2ZnSnS4 within the visible spectrum, consistent with the observed enhancement in the probability of electron excitation transitions induced by co-doping.
In the ultraviolet (UV) region (3.7 to 9.3 eV), a strong absorption peak is also observed. Notably, the intrinsic (undoped) Cu2ZnSnS4 exhibits the highest absorption intensity in this UV peak, while Mn or Co doping leads to a reduction in absorption. We attribute this reduction to the decrease in the lattice constant of Cu2ZnSnS4 caused by Mn- doping, Co-doping, or (Mn,Co)-co-doping. Within the UV region, where photon wavelengths are shorter, Rayleigh scattering becomes more pronounced for shorter wavelengths incident on a smaller lattice, resulting in diminished absorption. Figure 6b presents the reflectance spectra of Mn-doped, Co-doped, and (Mn,Co)-co-doped Cu2ZnSnS4. A distinct reflectance peak is observed between 0 and 3.9 eV. Both Mn and Co doping cause this reflectance peak to shift towards higher energies (blue-shift), with the shift being most pronounced under (Mn,Co)-co-doping. Furthermore, the strongest reflectance peak remains below 43% for all doped samples. This demonstrates that Mn and Co doping suppress reflectance within the visible region and shift the strong reflectance towards higher energies. This reduction in reflectance minimizes transmission losses, thereby enhancing the overall light absorption capability of Cu2ZnSnS4.

3.4.3. Complex Refractive Index

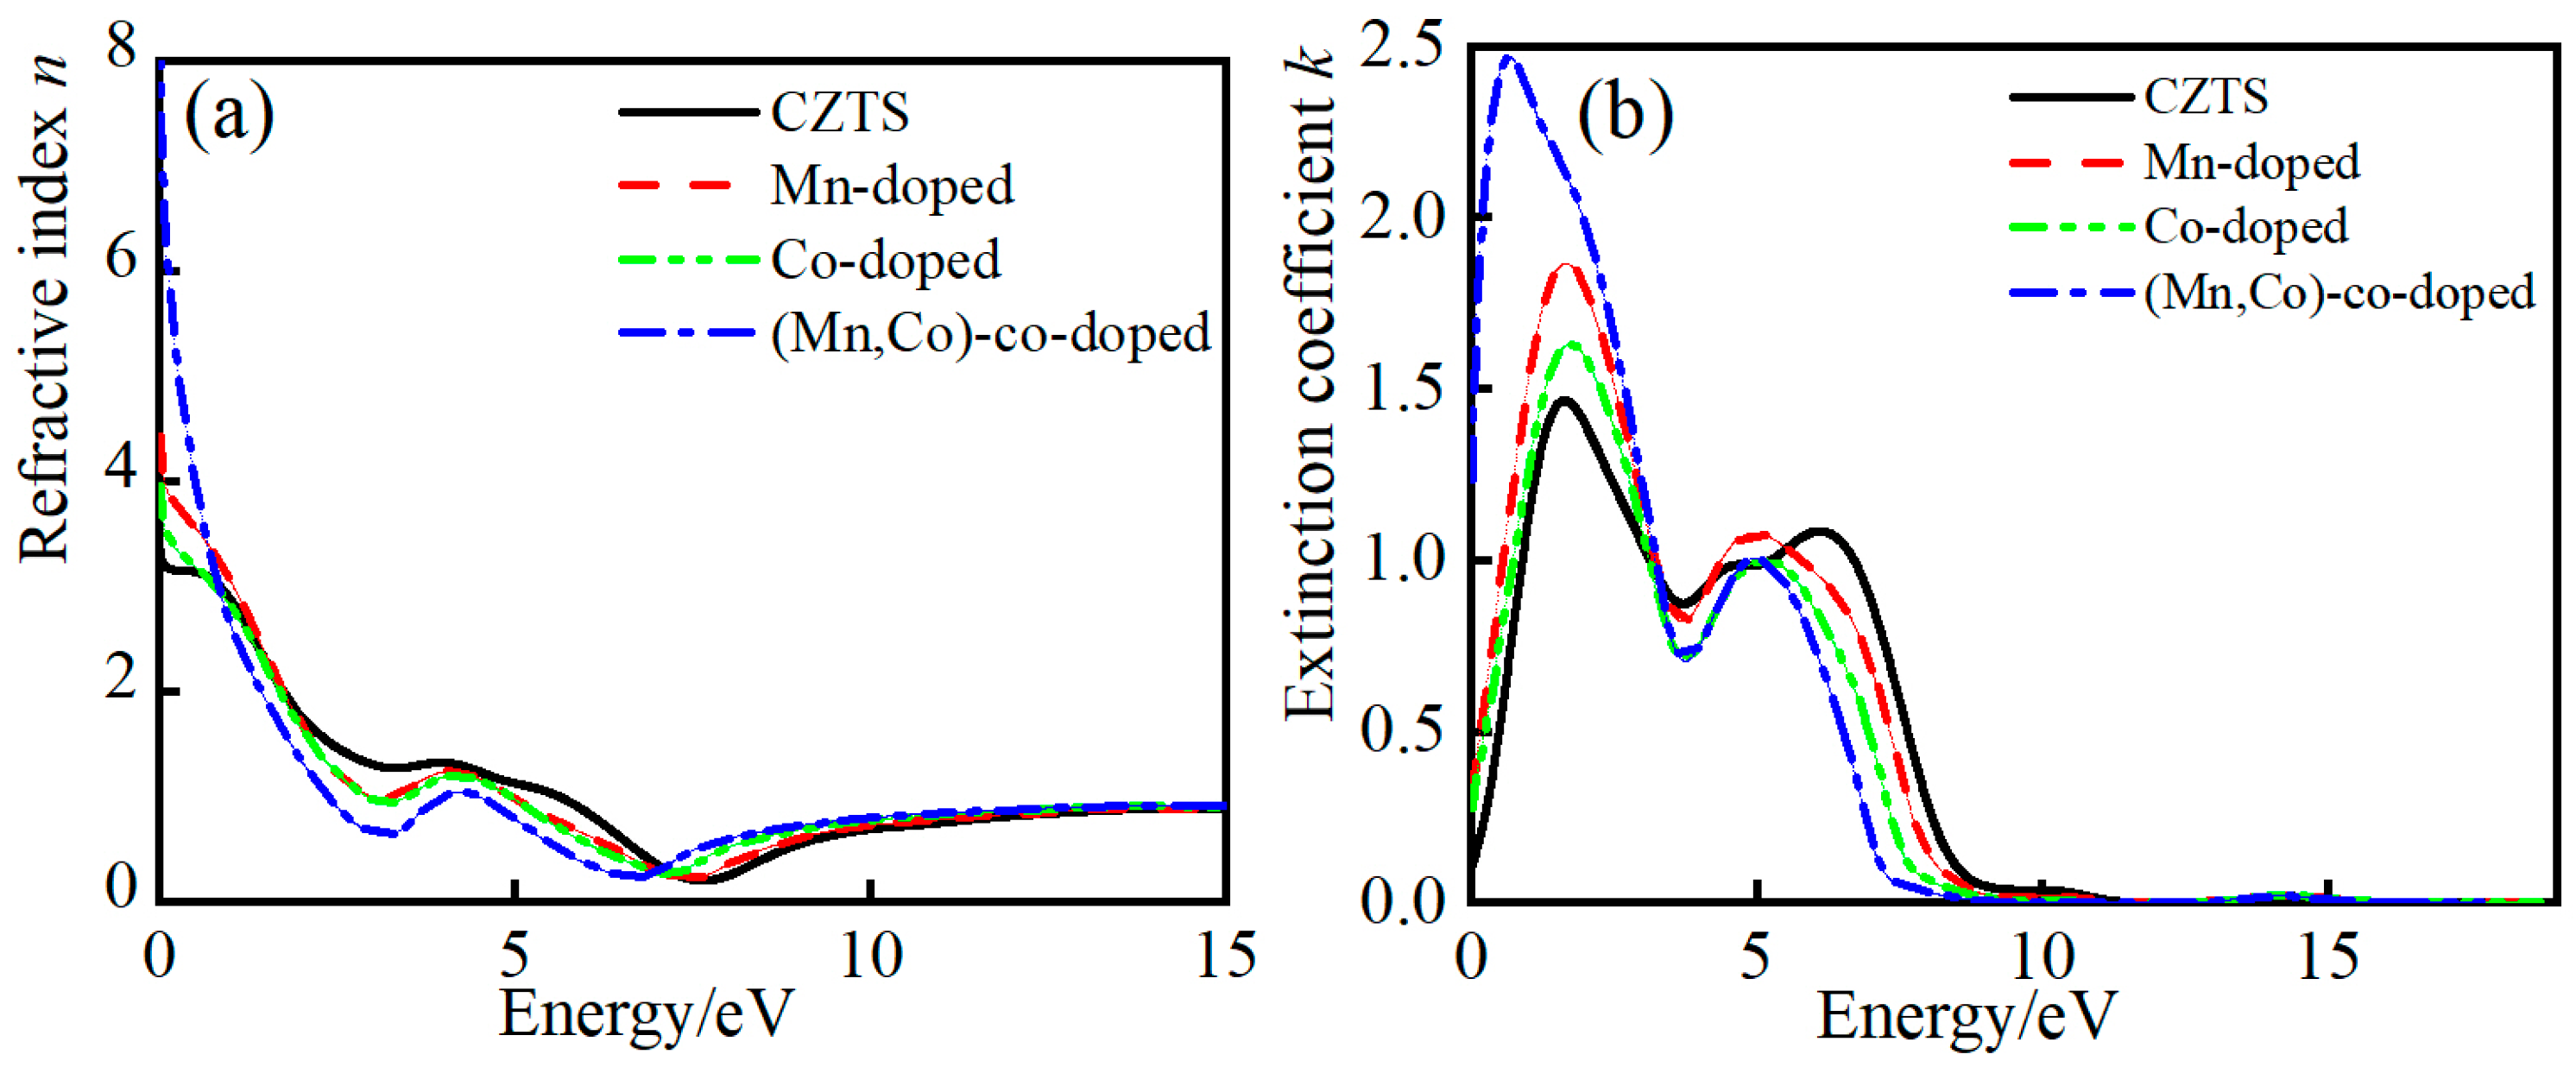
Figure 7 presents the complex refractive index, for Mn-doped, Co-doped, and (Mn,Co)-co-doped Cu2ZnSnS4. As shown in Figure 7a, the static refractive index n ( 0 ) of undoped Cu2ZnSnS4 is 3.3. Both Mn and Co doping increase n ( 0 ) , with the maximum value of 8.3 attained under (Mn,Co)-co-doping. This enhancement indicates that (Mn,Co)-co-doping strengthens the charge confinement capability within the material, suppressing optical leakage from the medium and thereby enhancing light utilization efficiency. The imaginary part of the complex refractive index corresponds to the extinction coefficient k, which governs light absorption within the material. Figure 7b reveals that within the photon energy range of 0 to 3.7 eV, both Mn and Co doping increase the extinction coefficient of Cu2ZnSnS4. The maximum k value of 2.5 is achieved under (Mn,Co)-co-doping. Concurrently, the peak position undergoes a significant red-shift of 0.9 eV towards lower energies. These trends observed in the extinction coefficient are fully consistent with the analysis of the absorption coefficient.

3.4.4. Complex Conductivity

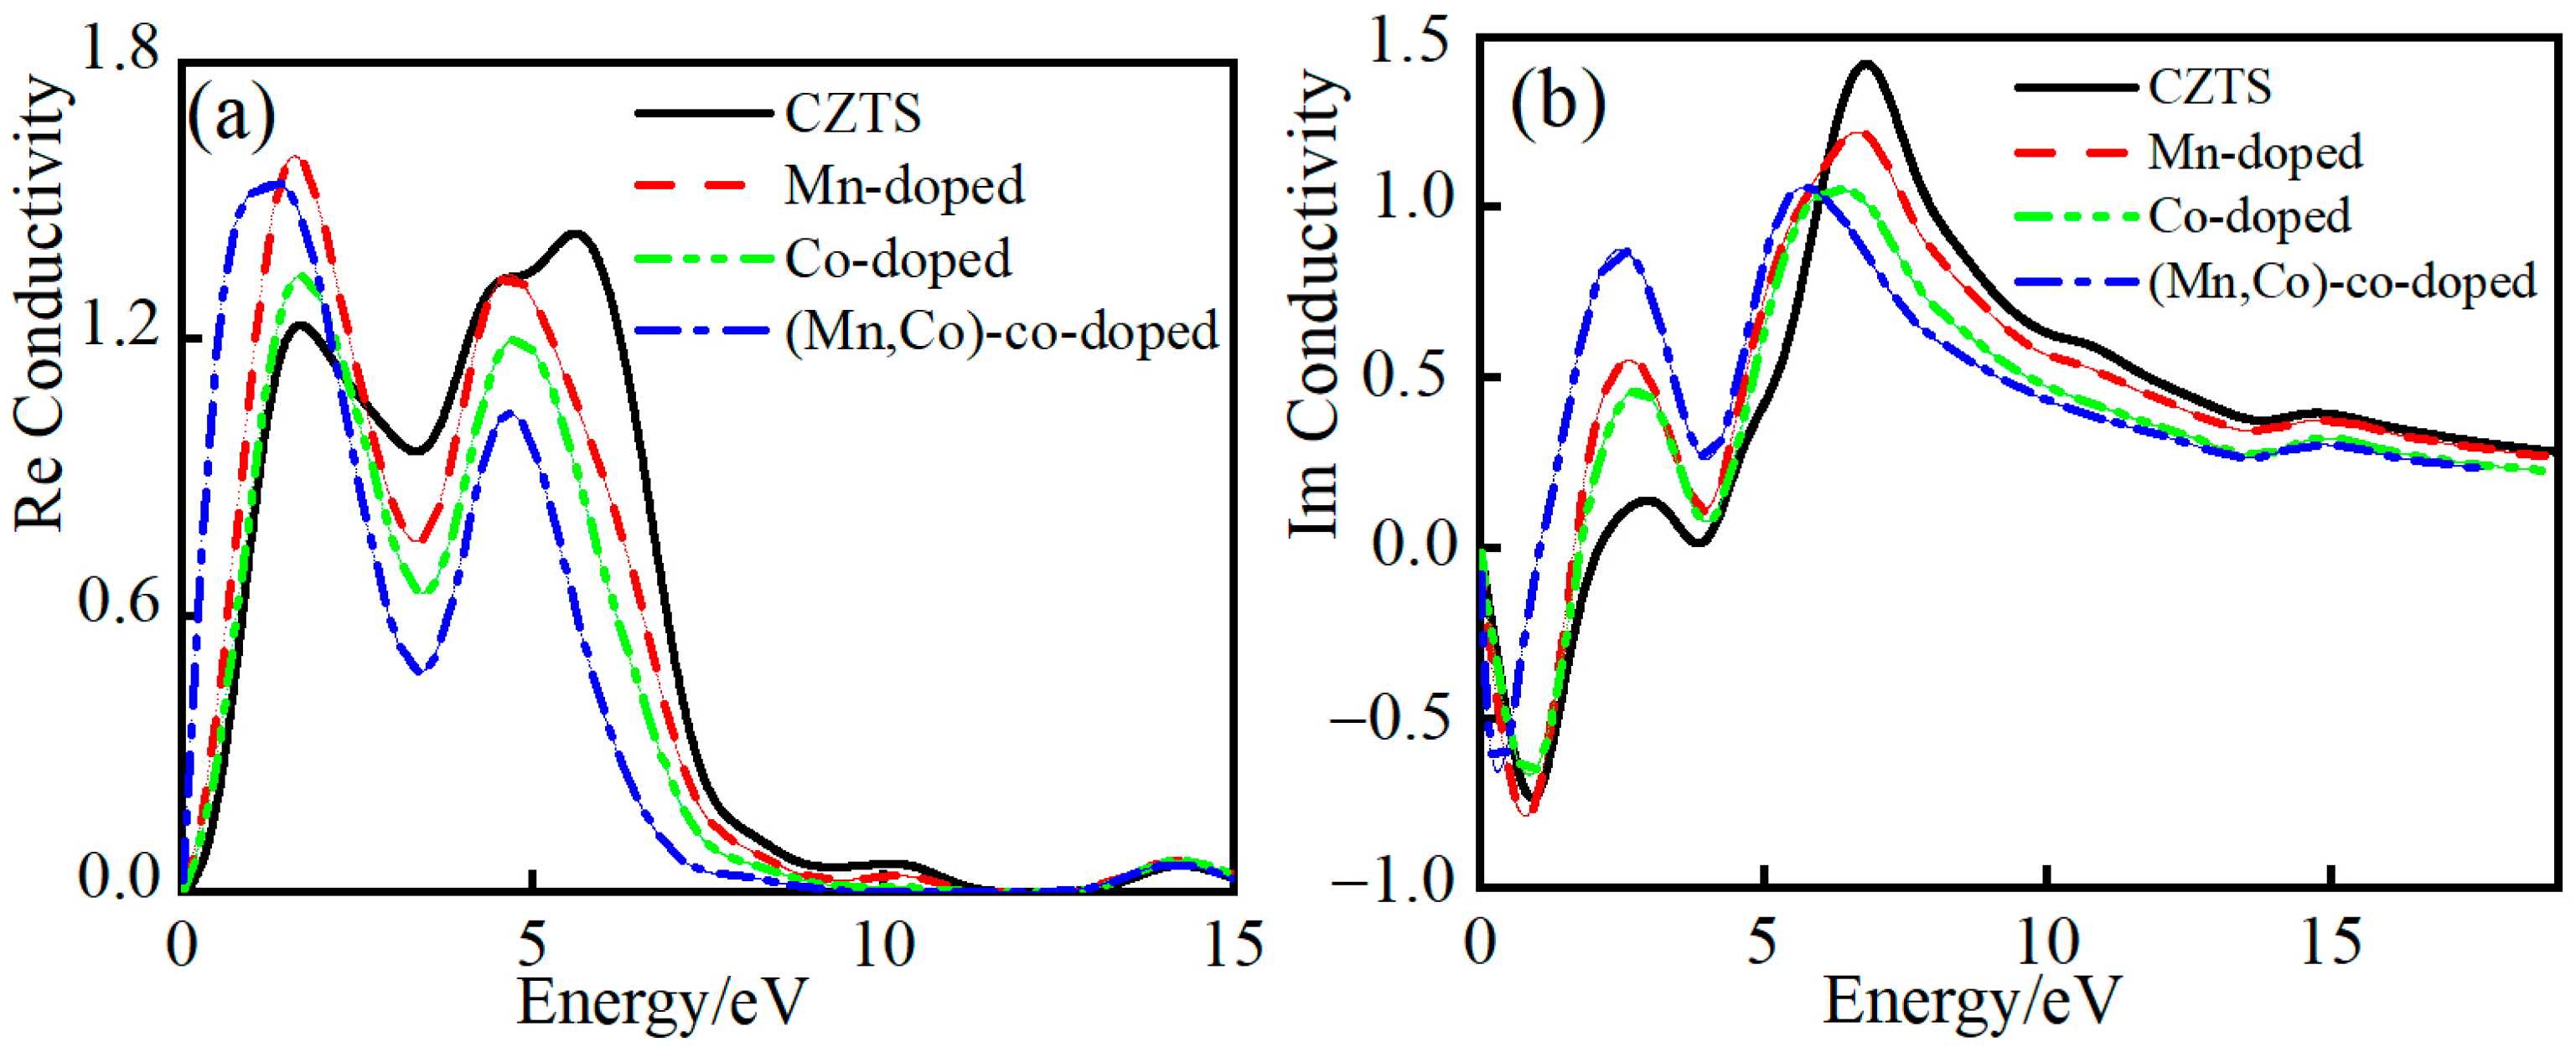
Figure 8 presents the complex optical conductivity, for Mn-doped, Co-doped, and (Mn,Co)-co-doped Cu2ZnSnS4. As shown in Figure 8a, a prominent conductivity peak is observed at 1.7 eV in undoped Cu2ZnSnS4. Both Mn and Co doping induce a red-shift of this peak position towards lower energies and significantly enhance its intensity. At 1.3 eV, the real part of the photoconductivity for (Mn,Co)-co-doping reaches its maximum value of 1.54, which is higher than that of single doping. The enhancement effect of co-doping becomes more pronounced at lower energies, consistent with stronger light absorption and enhanced electronic transitions resulting from the synergistic interaction between Mn and Co. On the other hand, the introduced Mn and Co 3d states near the Fermi level may be particularly susceptible to spin–orbit coupling (SOC)-induced effects [47], which may consequently lead to significant modifications in the real part of the electrical conductivity within the low-energy region. Within the energy range of 1.3 to 3.4 eV, the peak value of the real part of photoconductivity for the (Mn,Co)-co-doped system lies intermediate between those of the Mn-doped and Co-doped samples. This suggests that the synergistic interaction between Mn and Co may balance the carrier concentration and mobility. Figure 8b reveals that within the 0 to 5 eV range, Mn and Co doping cause the negative peak to shift towards lower energies. This shift demonstrates the participation of the Mn and Co 3d-state electrons in low-energy photon absorption processes, which can broaden the spectral range of photoresponse.

4. Conclusions

First-principles calculations were employed to investigate the geometric structure, electronic structure, complex dielectric function, complex refractive index, absorption coefficient, reflectivity, and photoconductivity of Mn-doped, Co-doped, and (Mn,Co)-co-doped Cu2ZnSnS4. Both single doping (Mn or Co) and (Mn,Co)-co-doping effectively modulated the lattice parameters and band gap of Cu2ZnSnS4. In the (Mn,Co)-co-doped system, the synergistic complementary effects between Mn and Co 3d orbital electrons significantly optimized and enhanced optoelectronic properties such as optical absorption coefficient and electrical conductivity, with co-doping exhibiting the most pronounced tuning effect. Concurrently, Mn and Co doping suppressed optical reflection, thereby maximizing light utilization efficiency. These results demonstrate the potential of Mn and Co doping strategies for optimizing the design of Cu2ZnSnS4-based photovoltaic or photodetector devices and improving solar cell conversion efficiency.

Author Contributions

Writing, X.Y.; experimental design, X.Y.; simulation calculation, X.Y.; analysis, X.Y.; writing—review and editing, X.Q.; model building, X.Q.; data analysis, W.Y.; overall planning, W.Y.; funding acquisition, W.Y.; review and revision of the thesis, C.Z.; drawing, C.Z.; literature review, D.Z.; software, D.Z. All authors have read and agreed to the published version of the manuscript.

Funding

This research was funded by the 2024 Youth Guidance Project of Basic Research Program (Natural Science) of Guizhou Province (CN): [2024]411, the Project of the Education Department of Guizhou Province (CN) (Grant No. [2021]315), and the Guizhou Provincial “Centennial Academy-Industry” Science & Technology Flagship Program (CN) (Grant No. [2025] 010).

Data Availability Statement

The original contributions presented in this study are included in the article. Further inquiries can be directed to the corresponding author(s).

Acknowledgments

This work was supported by the Key Supporting Discipline of Materials and Aviation of Anshun University (CN) ([2024]21), and the Guizhou Provincial First-Class Undergraduate Development Program in Materials Physics (CN) ([2022]61).

Conflicts of Interest

The authors declare no conflicts of interest.

References

  1. Liu, D.W.; Peng, H.; Zhang, Q.Q.; Sa, R.J. First-principles calculations to investigate the electronic and optical properties of Cu2ZnSnS4 with Ag and Se cooping. Chem. Phys. 2022, 554, 111418. [Google Scholar] [CrossRef]
  2. Ashebir, G.Y.; Chao, D.; Wan, Z.Y.; Qi, J.J.; Chen, J.W.; Zhao, Q.Y.; Chen, W.M.; Wang, M.T. Solution-processed Cu2ZnSnS4 nanoparticle film as efficient hole transporting layer for stable perovskite solar cells. J. Phys. Chem. Solids 2019, 129, 204–208. [Google Scholar] [CrossRef]
  3. Zheng, X.F.; Liu, Y.F.; Zhang, N.; Hou, J.S.; Zhao, G.Y.; Fang, Y.Z. Fabrication of Cu2ZnSn(S,Se)4 thin film solar cell devices based on printable nano-ink. Bull. Mater. Sci. 2019, 42, 68. [Google Scholar] [CrossRef]
  4. Su, Z.H.; Liang, G.X.; Fan, P.; Luo, J.T.; Zheng, Z.H.; Xie, Z.G.; Wang, W.; Chen, S.; Hu, J.G.; Wei, Y.D.; et al. Device Postannealing Enabling over 12% Efficient Solution-Processed Cu2ZnSnS4 Solar Cells with Cd2+ Substitution. Adv. Mater. 2020, 32, 2000121. [Google Scholar] [CrossRef]
  5. Li, M.G.; Ma, D.; Yao, B.; Li, Y.F.; Ding, Z.H.; Wang, C.K.; Luan, H.M.; Zhu, C.J. Mechanism of improvement of the power conversion efficiency of Cu2ZnSn(S, Se)4 solar cells through changing Ag and Cd co-doping form from uniform to non-uniform. Chem. Eng. J. 2025, 515, 163564. [Google Scholar] [CrossRef]
  6. Yan, Q.; Sun, Q.Z.; Deng, H.; Xie, W.H.; Zhang, C.X.; Wu, J.H.; Zheng, Q.; Cheng, S.Y. Enhancing carrier transport in flexible CZTSSe solar cells via doping Li strategy. J. Energy Chem. 2022, 75, 8–15. [Google Scholar] [CrossRef]
  7. Devi, R.A.; Latha, M.; Velumani, S.; Salazar, J.S.; Cruz, J.S. Telescoping synthesis and goldilocks of CZTS nanocrystals. Mater. Res. Bull. 2019, 111, 342–349. [Google Scholar] [CrossRef]
  8. Zhang, Y.M.; Jia, Z.J.; Zhao, Z.Y. Secondary phases in Cu2ZnSnS4 thin film solar cell: The role of interfaces. Phys. B Condens. Matter 2022, 626, 413539. [Google Scholar] [CrossRef]
  9. Zou, L.; Ma, H.; Zhu, Q.; Xu, B.; Wang, H.R.; Sun, L.; Chen, Y. Defect regulation enhances the efficiency of Cu2ZnSnS4 solar cells by solution engineering. Sol. Energy Mater. Sol. Cells 2025, 285, 113555. [Google Scholar] [CrossRef]
  10. Prima, E.C.; Manopo, J.; Suhendi, E.; Setiawan, A.; Shukri, G.; Agusta, M.K.; Yuliarto, B. The effect of CuZn+ZnCu defect complex on Cu2ZnSnS4 thin film solar cell: A density functional theory study. Mater. Chem. Phys. 2023, 296, 127192. [Google Scholar] [CrossRef]
  11. Wu, T.; Chen, S.; Su, Z.H.; Wang, Z.; Luo, P.; Zheng, Z.H.; Luo, J.T.; Ma, H.L.; Zhang, X.H.; Liang, G.X. Heat treatment in an oxygen-rich environment to suppress deep-level traps in Cu2ZnSnS4solar cell with 11.51% certified efficiency. Nat. Energy 2025, 10, 630–640. [Google Scholar] [CrossRef]
  12. Chen, S.H.; Walsh, A.; Gong, X.G.; Wei, S.H. Classification of Lattice Defects in the Kesterite Cu2ZnSnS4 and Cu2ZnSnSe4 Earth-Abundant Solar Cell Absorbers. Adv. Mater. 2013, 25, 1522–1539. [Google Scholar] [CrossRef]
  13. Xie, T.L.; Han, L.T.; Chu, L.L.; Han, M.T.; Jian, Y.; Chi, J.J.; Zhong, X.Y.; Liu, T.; Kou, D.X.; Zhou, W.H.; et al. Passivation of Deep-Level Defects through Chemical Environment Regulation for Efficient CZTSSe Solar Cells Based on Active Selenium Adsorption–Desorption Process. Adv. Funct. Mater. 2025, 35, 2414940. [Google Scholar] [CrossRef]
  14. Kangsabanik, M.; Sinha, S.; Maity, P.; Chowdhury, J.; Manna, S.; Gayen, R.N. Partial Substitution of Copper with Silver in Cu2ZnSnS4: An Efficient Strategy to Boost the Performance of Self-Powered Broadband Photodetectors in Superstrate Configuration. ACS Appl. Mater. Interfaces 2025, 17, 5101–5113. [Google Scholar] [CrossRef]
  15. Liu, Y.Q.; Xu, J.X.; Yang, Y.Z.; Xie, Z.W. Influence of pre-sulfurization temperature on properties of Cu2ZnSnS4 thin film in two-step sulfurization process. J. Renew. Sustain. Energy 2019, 11, 023501. [Google Scholar] [CrossRef]
  16. Muska, K.; Timmo, K.; Pilvet, M.; Kaupmees, R.; Raadik, T.; Mikli, V.; Kuusk, M.G.; Krustok, J.; Josepson, R.; Lange, S.; et al. Impact of Li and K co-doping on the optoelectronic properties of CZTS monograin powder. Sol. Energy Mater. Sol. Cells 2023, 252, 112182. [Google Scholar] [CrossRef]
  17. Rehman, F.; Ylmaz, S.; Polat, İ.; Bacaksı, E.; Zan, R.; Olgar, M.A. Unveiling Improvements in Structural, Optical, and Photodetection Characteristics of CZTS Thin Films Through Ag-Doping. Opt. Mater. 2025, 163, 117006. [Google Scholar] [CrossRef]
  18. Marzougui, M.; Antoni, F.; Rabeh, M.B.; Kanzari, M. Synthesis and study of microstructural, optical and electrical properties of Na-doped Cu2ZnSnS4 thin films via thermal evaporation. J. Mater. Sci. Mater. Electron. 2024, 35, s10854. [Google Scholar] [CrossRef]
  19. Digraskar, R.V.; Mali, S.M.; Tayade, S.B.; Ghule, A.V.; Sathe, B.R. Overall noble metal free Ni and Fe doped Cu2ZnSnS4(CZTS) bifunctional electrocatalytic systems for enhanced water splitting reactions. Int. J. Hydrogen Energy 2019, 44, 8144–8155. [Google Scholar] [CrossRef]
  20. Yang, X.F.; Qin, X.M.; Yan, W.J.; Zhang, C.H.; Zhang, D.X. Effects of Fe and Ni Doping on the Electronic Structure and Optical Properties of Cu2ZnSnS4. Crystals 2023, 13, 1082. [Google Scholar] [CrossRef]
  21. Pandey, A.; Yadav, P.; Kumar, P.; Singh, M.K. Synthesis, morphological and optical properties of hydrothermally synthesized Bi and Mn co-doped Cu2ZnSnS4(CZTS). Mater. Today Proc. 2023, 82, 85–90. [Google Scholar] [CrossRef]
  22. Gunavathy, K.V.; Rangasami, C.; Arulanantham, A.M.S.; Merlin, B.F.; Reddy, C.P.; Khan, A. Enhancing the optoelectronic performance of CZTS thin films through cobalt doping via nebulizer-assisted spray pyrolysis technique. Sens. Actuators A Phys. 2024, 366, 114941. [Google Scholar] [CrossRef]
  23. Hohenberg, P.; Kohn, W. Inhomogeneous Electron Gas. Phys. Rev. 1964, 136, B864. [Google Scholar] [CrossRef]
  24. Kohn, W.; Sham, L.J. Self-Consistent Equations Including Exchange and Correlation Effects. Phys. Rev. 1965, 140, A1333. [Google Scholar] [CrossRef]
  25. Shibuya, T.; Goto, Y.; Kamihara, Y.; Matoba, M.; Yasuoka, K.; Burton, L.A.; Walsh, A. From kesterite to stannite photovoltaics: Stability and band gaps of the Cu2(Zn,Fe)SnS4 alloy. Appl. Phys. Lett. 2014, 104, 1840. [Google Scholar] [CrossRef]
  26. Zhang, X.L.; Han, M.M.; Zeng, Z.; Duan, Y.H. The role of Sb in solar cell material Cu2ZnSnS4. J. Mater. Chem. A 2017, 5, 6606–6612. [Google Scholar] [CrossRef]
  27. Abdillah, N.; Ayukaryana, N.R.; Agusta, M.K.; Rusydi, F.; Shukri, G. On the thermodynamic of Cu-Zn disorder formation and electronic structure changes of alkaline-earth M-doped kesterite Cu2ZnSnS4 (M = Be, Mg, Ca). Mater. Chem. Phys. 2025, 332, 130262. [Google Scholar] [CrossRef]
  28. Maeda, T.; Nakamura, S.; Wada, T. First-Principles Study on Cd Doping in Cu2ZnSnS4 and Cu2ZnSnSe4. Jpn. J. Appl. Phys. 2012, 51, 10NC11. [Google Scholar] [CrossRef]
  29. Segall, M.D.; Lindan, P.; Probert, M.J.; Pickard, C.J.; Hasnip, P.J.; Clark, S.J.; Payne, M.C. First-principles simulation: Ideas, illustrations and the CASTEP code. J. Phys. Condens. Matter 2002, 14, 2717–2744. [Google Scholar] [CrossRef]
  30. Perdew, J.P.; Burke, K.; Ernzerhof, M. Generalized Gradient Approximation Made Simple. Phys. Rev. Lett. 1996, 77, 3865–3868. [Google Scholar] [CrossRef]
  31. Vanderbilt, D. Soft self-consistent pseudopotentials in a generalized eigenvalue formalism. Phys. Rev. B 1990, 41, 7892–7895. [Google Scholar] [CrossRef]
  32. Chennangod, S.; Ray, S.; Subrahmanya, P.A.; Tarafder, K.; Bhat, T.N. Temperature-dependent in situ Cd substitution at Zn sites in Cu2ZnSnS4 thin films via sol-gel method: Experimental and DFT insights. Appl. Surf. Sci. 2025, 712, 164166. [Google Scholar] [CrossRef]
  33. Raad, N.H.; Karimmirza, E.; Yousefizad, M.; Nouri, N.; Sharifpour, H.; Nadimi, E.; Zeidabadi, M.A.; Manavizadeh, N. Improving the electronic and optical properties of chalcogenide Cu2ZnSnS4 compound with transition metal dopants: A first-principles investigation. Thin Solid Film. 2023, 766, 139653. [Google Scholar] [CrossRef]
  34. Li, Z.L.; Xia, C.Y.; Zhang, Z.P.; Dou, M.L.; Ji, J.; Song, Y.; Liu, J.J.; Wang, F. First-principle study on phase stability of kesterite Cu2ZnSnS4 for thin film solar cells with off-stoichiometric composition. J. Alloys Compd. 2018, 768, 644–651. [Google Scholar] [CrossRef]
  35. Ge, J.; Qi, H. Electronic and optical properties of Ti3AC2 (A=Sn, Ge, Si) MAX phases by first-principles calculations. Phys. B Condens. Matter 2025, 706, 417140. [Google Scholar] [CrossRef]
  36. Tariq, A.; Tahir, M.B.; Dahshan, A.; Ahmed, B.; Sagir, M. Lithium doping effect on structural, electronic and optical properties of KCaF3 fluoroperovskite: DFT insights using GGA-PBE. Inorg. Chem. Commun. 2023, 158, 111475. [Google Scholar] [CrossRef]
  37. Monkhorst, H.J.; Pack, J.D. Special points for Brillouin-zone integrations. Phys. Rev. B 1976, 13, 5188. [Google Scholar] [CrossRef]
  38. Brown, G.F.; Wu, J. Third generation photovoltaics. Laser Photonics Rev. 2009, 3, 394. [Google Scholar] [CrossRef]
  39. Sun, J.; Wang, H.T.; He, J.L.; Tian, Y.J. Ab initio investigations of optical properties of the high-pressure phases of Zno. Phys. Rev. B 2005, 71, 12. [Google Scholar] [CrossRef]
  40. Paier, J.; Asahi, R.; Nagoya, A.; Kresse, G. Cu2ZnSnS4 as a potential photovoltaic material: A hybrid hartree-fock density functional theory study. Phys. Rev. B 2009, 79, 115126. [Google Scholar] [CrossRef]
  41. Borlido, P.; Schmidt, J.; Huran, A.W.; Tran, F.; Marques, M.A.L.; Botti, S. Exchange-correlation functionals for band gaps of solids: Benchmark, reparametrization and machine learning. NPJ Comput. Mater. 2020, 6, 96. [Google Scholar] [CrossRef]
  42. Lebègue, S.; Arnaud, B.; Alouani, M. Calculated quasiparticle and optical properties of orthorhombic and cubic Ca2Si. Phys. Rev. B 2005, 72, 085103. [Google Scholar] [CrossRef]
  43. Li, Y.H.; Gao, S.; Zhang, L.; Chen, H.C.; Wang, C.C.; Ji, H.D. Insights on selective pb adsorption via O 2p orbit in uio-66 containing rich-zirconium vacancies. Chin. Chem. Lett. 2024, 35, 109894. [Google Scholar] [CrossRef]
  44. Hassanien, A.S.; Sharma, I. Dielectric properties, Optoelectrical parameters and electronic polarizability of thermally evaporated a-Pb-Se-Ge thin films. Phys. B Phys. Condens. Matter 2021, 622, 413330. [Google Scholar] [CrossRef]
  45. Hassanien, A.S. Intensive linear and nonlinear optical studies of thermally evaporated amorphous thin Cu-Ge-Se-Te fflms. J. Non-Cryst. Solids 2022, 586, 121563. [Google Scholar] [CrossRef]
  46. Penn, D.R. Wave-Number-Dependent Dielectric Function of Semiconductors. Phys. Rev. 1962, 128, 2093. [Google Scholar] [CrossRef]
  47. Sharma, M.M.; Chhetri, S.K.; Acharya, G.; Graf, D.; Upreti, D.; Dahal, S.; Nabi, M.R.U.; Rahman, S.; Sakon, J.; Churchill, H.O.H.; et al. Quantum oscillation studies of the nodal line semimetal Ni3In2S2-xSex. Acta Mater. 2025, 289, 120884. [Google Scholar] [CrossRef]
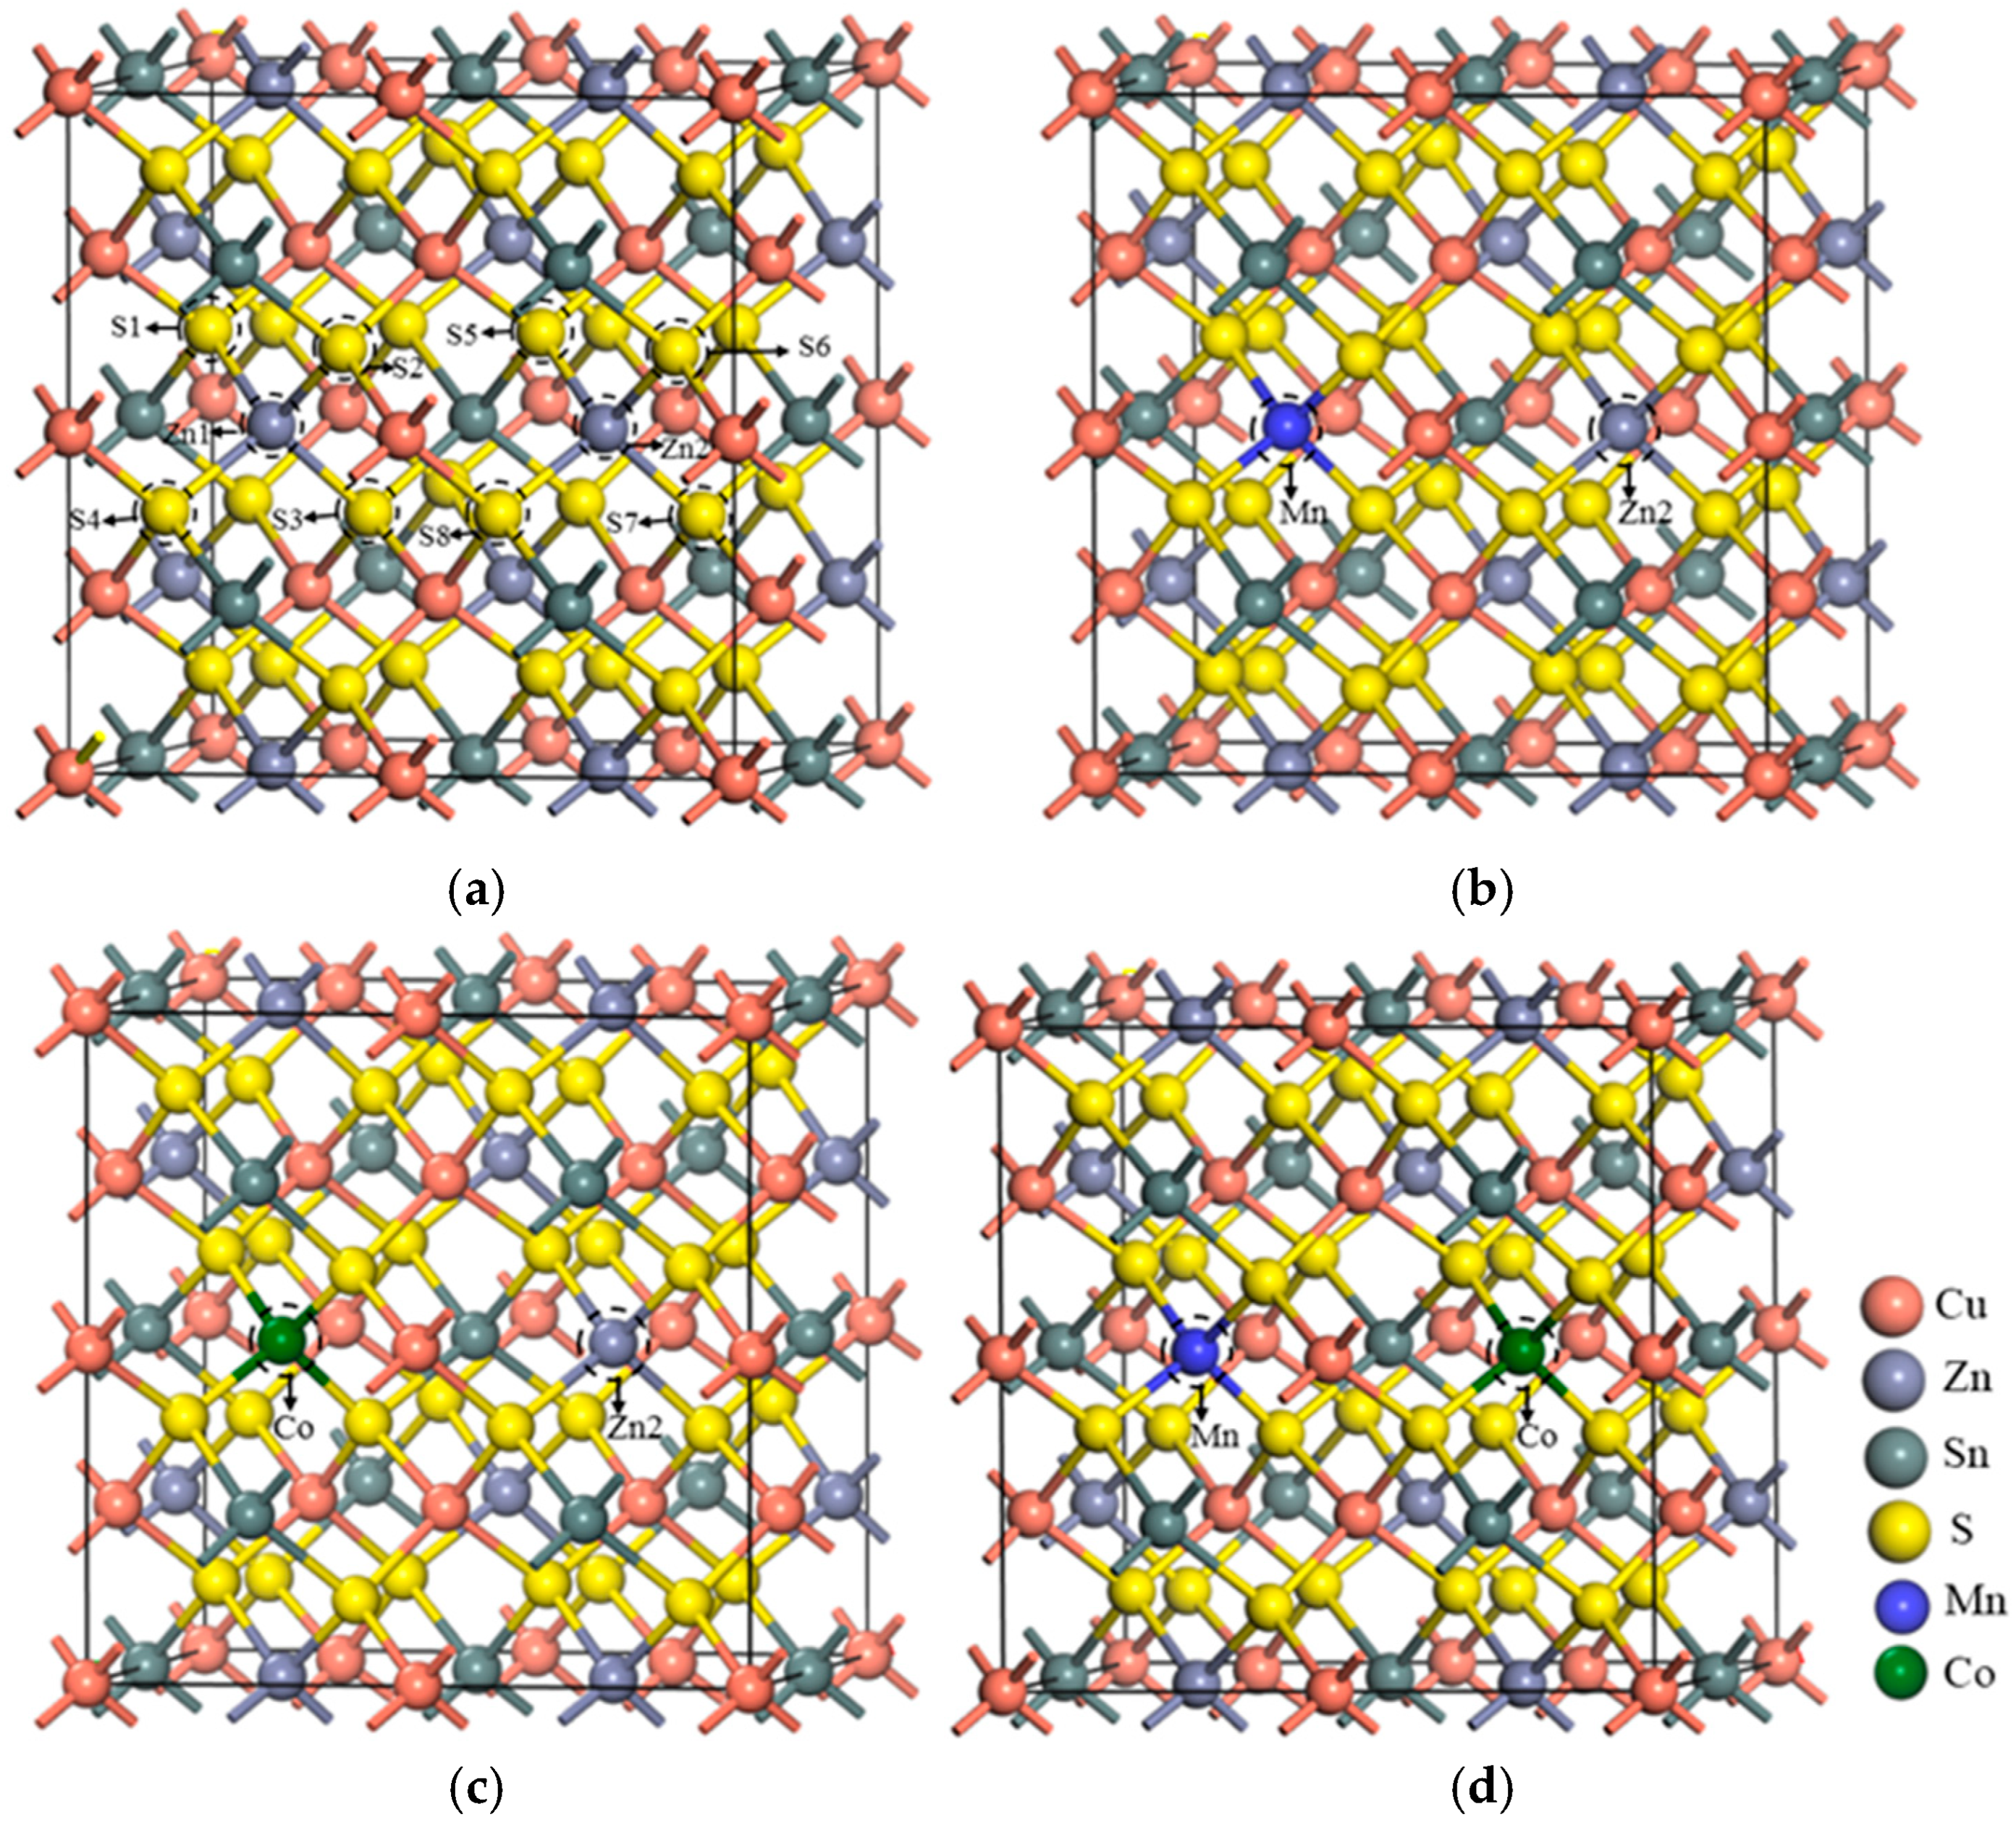
Figure 1. Structure of single-doped and co-doped Cu2ZnSnS4 supercell: (a) Cu2ZnSnS4 supercell (2 × 2 × 1); (b) Mn-single-doping model; (c) Co-single-doping model; (d) (Mn,Co)-co-doping model.
Crystals 15 00781 g001
Figure 2. Band structure of Mn-doped and Co-doped Cu2ZnSnS4: (a) undoped band structure; (b) Mn-doped band structure; (c) Co-doped band structure; (d) (Mn,Co)-co-doped band structure.
Crystals 15 00781 g002
Figure 3. Electronic densities of state of Mn-doped and Co-doped Cu2ZnSnS4: (a) undoped Cu2ZnSnS4 electronic density of state; (b) Mn-doped Cu2ZnSnS4 electronic density of state; (c) Co-doped Cu2ZnSnS4 electronic density of state; (d) (Mn,Co)-co-doped Cu2ZnSnS4 electronic density of state.
Crystals 15 00781 g003
Figure 4. Electron density difference of Cu2ZnSnS4: (a) undoped; (b) Mn doped; (c) Co doped; (d) (Mn,Co)-co-doped.
Crystals 15 00781 g004
Figure 5. Mn-doping and Co-doping Cu2ZnSnS4 complex dielectric function: (a) real part of the complex dielectric function; (b) imaginary part of the complex dielectric function.
Crystals 15 00781 g005
Figure 6. Absorption coefficient and reflection spectrum of Mn-doped and Co-doped Cu2ZnSnS4: (a) absorption coefficient; (b) reflection spectrum.
Crystals 15 00781 g006
Figure 7. Complex refractive index of Mn-doped and Co-doped Cu2ZnSnS4: (a) refractive index n. (b) extinction coefficient k.
Crystals 15 00781 g007
Figure 8. Complex conductivity of Mn-doped and Co-doped Cu2ZnSnS4: (a) real part; (b) imaginary part.
Crystals 15 00781 g008
Table 1. Lattice constants of Mn and Co-doped in Cu2ZnSnS4.
Samplea/Åa%c/Åc%v3
Cu2ZnSnS4(experiment) [25]5.42810.864
Cu2ZnSnS4(calculated) [40]5.46610.929
Undoped Cu2ZnSnS45.47110.941654.854
Mn-doped Cu2ZnSnS45.460−0.20%10.9500.08%652.877
Co-doped Cu2ZnSnS45.455−0.29%10.934−0.06%650.893
(Mn,Co)-co-doped Cu2ZnSnS45.435−0.66%10.936−0.05%648.674
Table 2. Mulliken population analysis of atoms.
SampleAtomspdTotal Charge/eCharge Population/e
Cu2ZnSnS4Zn10.420.959.9811.340.66
S1, S2, S3, S41.844.540.006.37−0.37
Zn20.420.959.9811.340.66
S5, S6, S7, S81.844.540.006.37−0.37
Mn-doped Cu2ZnSnS4Mn0.380.506.056.930.07
S1, S2, S3, S41.834.420.006.25−0.25
Co-doped Cu2ZnSnS4Co0.460.637.898.980.02
S1, S2, S3, S41.844.440.006.28−0.28
(Mn,Co)-co-doped Cu2ZnSnS4Mn0.380.506.036.910.09
S1, S2, S3, S41.834.420.006.25−0.25
Co0.450.637.908.990.01
S5, S71.834.440.006.27−0.27
S6, S81.844.450.006.28−0.28
Table 3. Mulliken population analysis of bonds.
SampleBondPopulationLength (Å)
Cu2ZnSnS4S1—Zn10.482.366
S2—Zn10.482.366
S3—Zn10.482.366
S4—Zn10.482.366
Mn-doped Cu2ZnSnS4S1—Mn0.612.191
S2—Mn0.612.191
S3—Mn0.612.191
S4—Mn0.612.193
Co-doped Cu2ZnSnS4S1—Co0.562.196
S2—Co0.562.196
S3—Co0.562.196
S4—Co0.562.196
(Mn,Co)-co-doped Cu2ZnSnS4S1—Mn0.622.188
S2—Mn0.602.197
S3—Mn0.622.188
S4—Mn0.602.198
S5—Co0.562.179
S6—Co0.552.199
S7—Co0.562.180
S8—Co0.552.198
Disclaimer/Publisher’s Note: The statements, opinions and data contained in all publications are solely those of the individual author(s) and contributor(s) and not of MDPI and/or the editor(s). MDPI and/or the editor(s) disclaim responsibility for any injury to people or property resulting from any ideas, methods, instructions or products referred to in the content.