Article

A Numerical Analysis of the Fluid Flow in a Slab Mold Considering a SEN with Real Clogging and with Symmetrical Reductions

by
Ariana López
1,
Enif Gutiérrez
1,*,
Saul Garcia-Hernandez
1,
Rodolfo Morales-Dávila
2 and
Jose de Jesus Barreto
1
1
TecNM—Instituto Tecnológico de Morelia, Metallurgy Graduate Center, Morelia 58120, Mexico
2
Departament of Metallurgy and Materials Engineering, Instituto Politécnico Nacional-ESIQIE, Ed. 7, Colonia Zacatenco, Ciudad de Mexico 07369, Mexico
*
Author to whom correspondence should be addressed.
Crystals 2025, 15(9), 777; https://doi.org/10.3390/cryst15090777
Submission received: 31 July 2025 / Revised: 27 August 2025 / Accepted: 28 August 2025 / Published: 30 August 2025

Abstract

Nozzle blockage has been a critical issue for productivity and product quality since the introduction of continuous casting. Despite numerous studies on the subject, the problem persists, affecting steel production. This detrimental phenomenon causes changes in the internal nozzle geometry and severe wall irregularities that are neither symmetrical nor uniform. A common approach to studying the complex internal shape of clogged nozzles is considering nozzles with symmetrical transversal area reductions. Therefore, this study aims to quantitatively evaluate the effects of using realistic submerged entry nozzle (SEN) clogging geometries on the fluid dynamic behavior of molten steel inside the SEN and the mold and is compared to simplified symmetric reductions. A three-dimensional mathematical simulation based on the Navier–Stokes equations, the standard kε turbulence model, and the Volume of Fluid (VOF) method was used. The main findings indicate that symmetric reductions can only provide a qualitative prediction of the results, such as increased velocity and asymmetries at the meniscus bath level, but with errors that can reach up to 25%. Symmetric reductions fail to accurately capture the fluid dynamics inside the nozzle and the mold and should therefore be used with caution in studies that require precise flow characterization near the nozzle walls.

1. Introduction

Nozzle clogging is one of the most critical challenges in the steel continuous casting process, as it causes quality degradation and productivity losses in the steel industry [1,2,3]. This phenomenon has different origins, including reactions occurring on the nozzle wall [4,5], steel solidification [6], formation of inclusions in the tundish, and wall adhesion of non-metallic inclusions [7,8,9,10,11,12]. The latter has been identified as the primary cause of SEN clogging [13,14], initiating when molten steel infiltrates the refractory, allowing non-metallic inclusions to adhere to the inner wall surface [15].
Inclusions are more likely to adhere to the nozzle wall when they are small, the refractory surface roughness is high, the casting speed is slow [16,17], and there are zones where the thickness of the boundary layer decreases [18,19,20,21]. Once the blockage starts, it rapidly intensifies, causing significant temperature inhomogeneities in the mold and problems in steel solidification [6] as well as meniscus fluctuations [22,23,24,25], vortex formation [26,27], thinning of the slag layer, and entrainment of slag into the metal bath [28,29]. All these detrimental phenomena cause a growing volume of steel to fail minimum quality standards.
Due to its paramount importance, nozzle clogging has been extensively studied, also considering the effect of the inclusion morphology [30], indices to measure the nozzle clogging [31,32], proposals to mitigate clogging effects such as the use of argon gas [33,34,35], changes in nozzle geometry [20,21,36], and the use of stirring electromagnetic fields [37,38]. Despite extensive research on the subject, nozzle clogging continues decreasing the quality of steel and the productivity of castings. Moreover, few studies have examined the problem beyond the initial stages of clogging.
Among these studies [39,40,41,42], most simplify their analysis by using symmetric transversal area reductions to simulate clogging, ignoring the asymmetric nature of particle adhesion and the resulting irregularities on the wall. Therefore, this study aims to evaluate the effects of using a realistic geometry of a severely clogged SEN, obtained through 3D scanning at the end of its service life in the plant, and to compare its flow behavior with that predicted by mathematical simulations using idealized symmetrical reductions to simulate the same clogging stage.

2. Materials and Methods

This study investigates turbulent fluid flow in an integrated system comprising the upper tundish nozzle, slide gate, submerged entry nozzle (SEN), and the continuous casting mold. Multiphase interactions were modeled using the Volume of Fluid (VOF) method, while the standard k − ε turbulence model was employed. The purpose of this work is not to resolve fine-scale boundary layer processes but rather to assess their overall influence on the bulk flow. Within this framework, the kε model provides a suitable balance, offering reliable predictions of global flow patterns while maintaining computational efficiency.

2.1. Main Assumptions

The coupled system was mathematically simulated in Cartesian three-dimensional coordinates using a finite volume model under transient and isothermal conditions, with gravity acting along the negative vertical coordinate. Both turbulent and laminar flow coexist in the tundish; however, only laminar flow is present near the solid walls. Therefore, nonslip conditions were applied to all solid surfaces. The model considers molten steel as an incompressible Newtonian fluid.

2.2. Fundamental Equations

The current numerical procedure determines the flow field by solving the time-dependent transport equations for mass and momentum, together with the turbulence kinetic energy and dissipation rate of the turbulence kinetic energy. The corresponding equations are as follows:
Mass equation:
u i x i = 0
Momentum equation:
ρ u i t + ρ u i u j x i = P x i + x μ e f f u i x j + u j x i + ρ g
In this formulation, the subscripts i , j denote the components in the x i   direction; u i is the fluid velocity in the x i   direction; t is time; ρ is the flow density; P is the pressure; and g is the gravitational acceleration. The effective viscosity μ e f f represents the resistance of the fluid to flow, including the effects of turbulence, and is defined as the sum of the molecular viscosity μ and the turbulent viscosity μ t , that is, μ e f f   = μ + μ t . In the standard k ε turbulence model, μ t is computed as μ t = ρ C μ k 2 ε , where k is the turbulent kinetic energy, ε is the dissipation rate, and C μ is an empirical model constant.
In addition to the Navier–Stokes equations, the standard k ε model of Launder and Spalding [43] was selected to model the turbulence since the flow phenomena to be studied are not small-scale. The equations for turbulent energy k and dissipation rate ε are given by the following:
ρ t k + ρ x j k j u j = x i μ + μ t σ k k x j + G k ρ ε
ρ t ε + ρ x i ε u i = x j μ + μ t σ ε ε x j + C 1 ε ε k C 3 ε G k C 2 ε ρ ε 2 k
where G k represents the generation of turbulence kinetic energy due to the mean velocity gradients and the recommended values of the constant proposed by Lauder and Spalding [43] are C 1 ε = 1.44 ,   C 2 ε = 1.92 ,   σ ε = 1.3 , σ k = 1 .

2.3. Numerical Procedure

The model-governing equations were solved through the commercial ANSYS-FLUENT® package (Fluent 12.0, Ansys Inc., Centerra Resource, Park, Lebanon, NH, USA, 2009). The governing equations were linearized using an implicit approach. The discretization employs the Second Order Upwind scheme for the momentum equations. The pressure interpolation uses the Body Force Weighted scheme, and the pressure–velocity coupling algorithm uses the SIMPLEC approach [44]. The system was simulated until it reached a quasi-steady state at 300 s. Inlet and outlet velocities were calculated using the employed casting velocity set to 1.5 m/min. A constant time step equal to 0.005 s was used for the simulation. Convergence occurred when the residuals of the output variables reached values equal to or smaller than 10 4 .
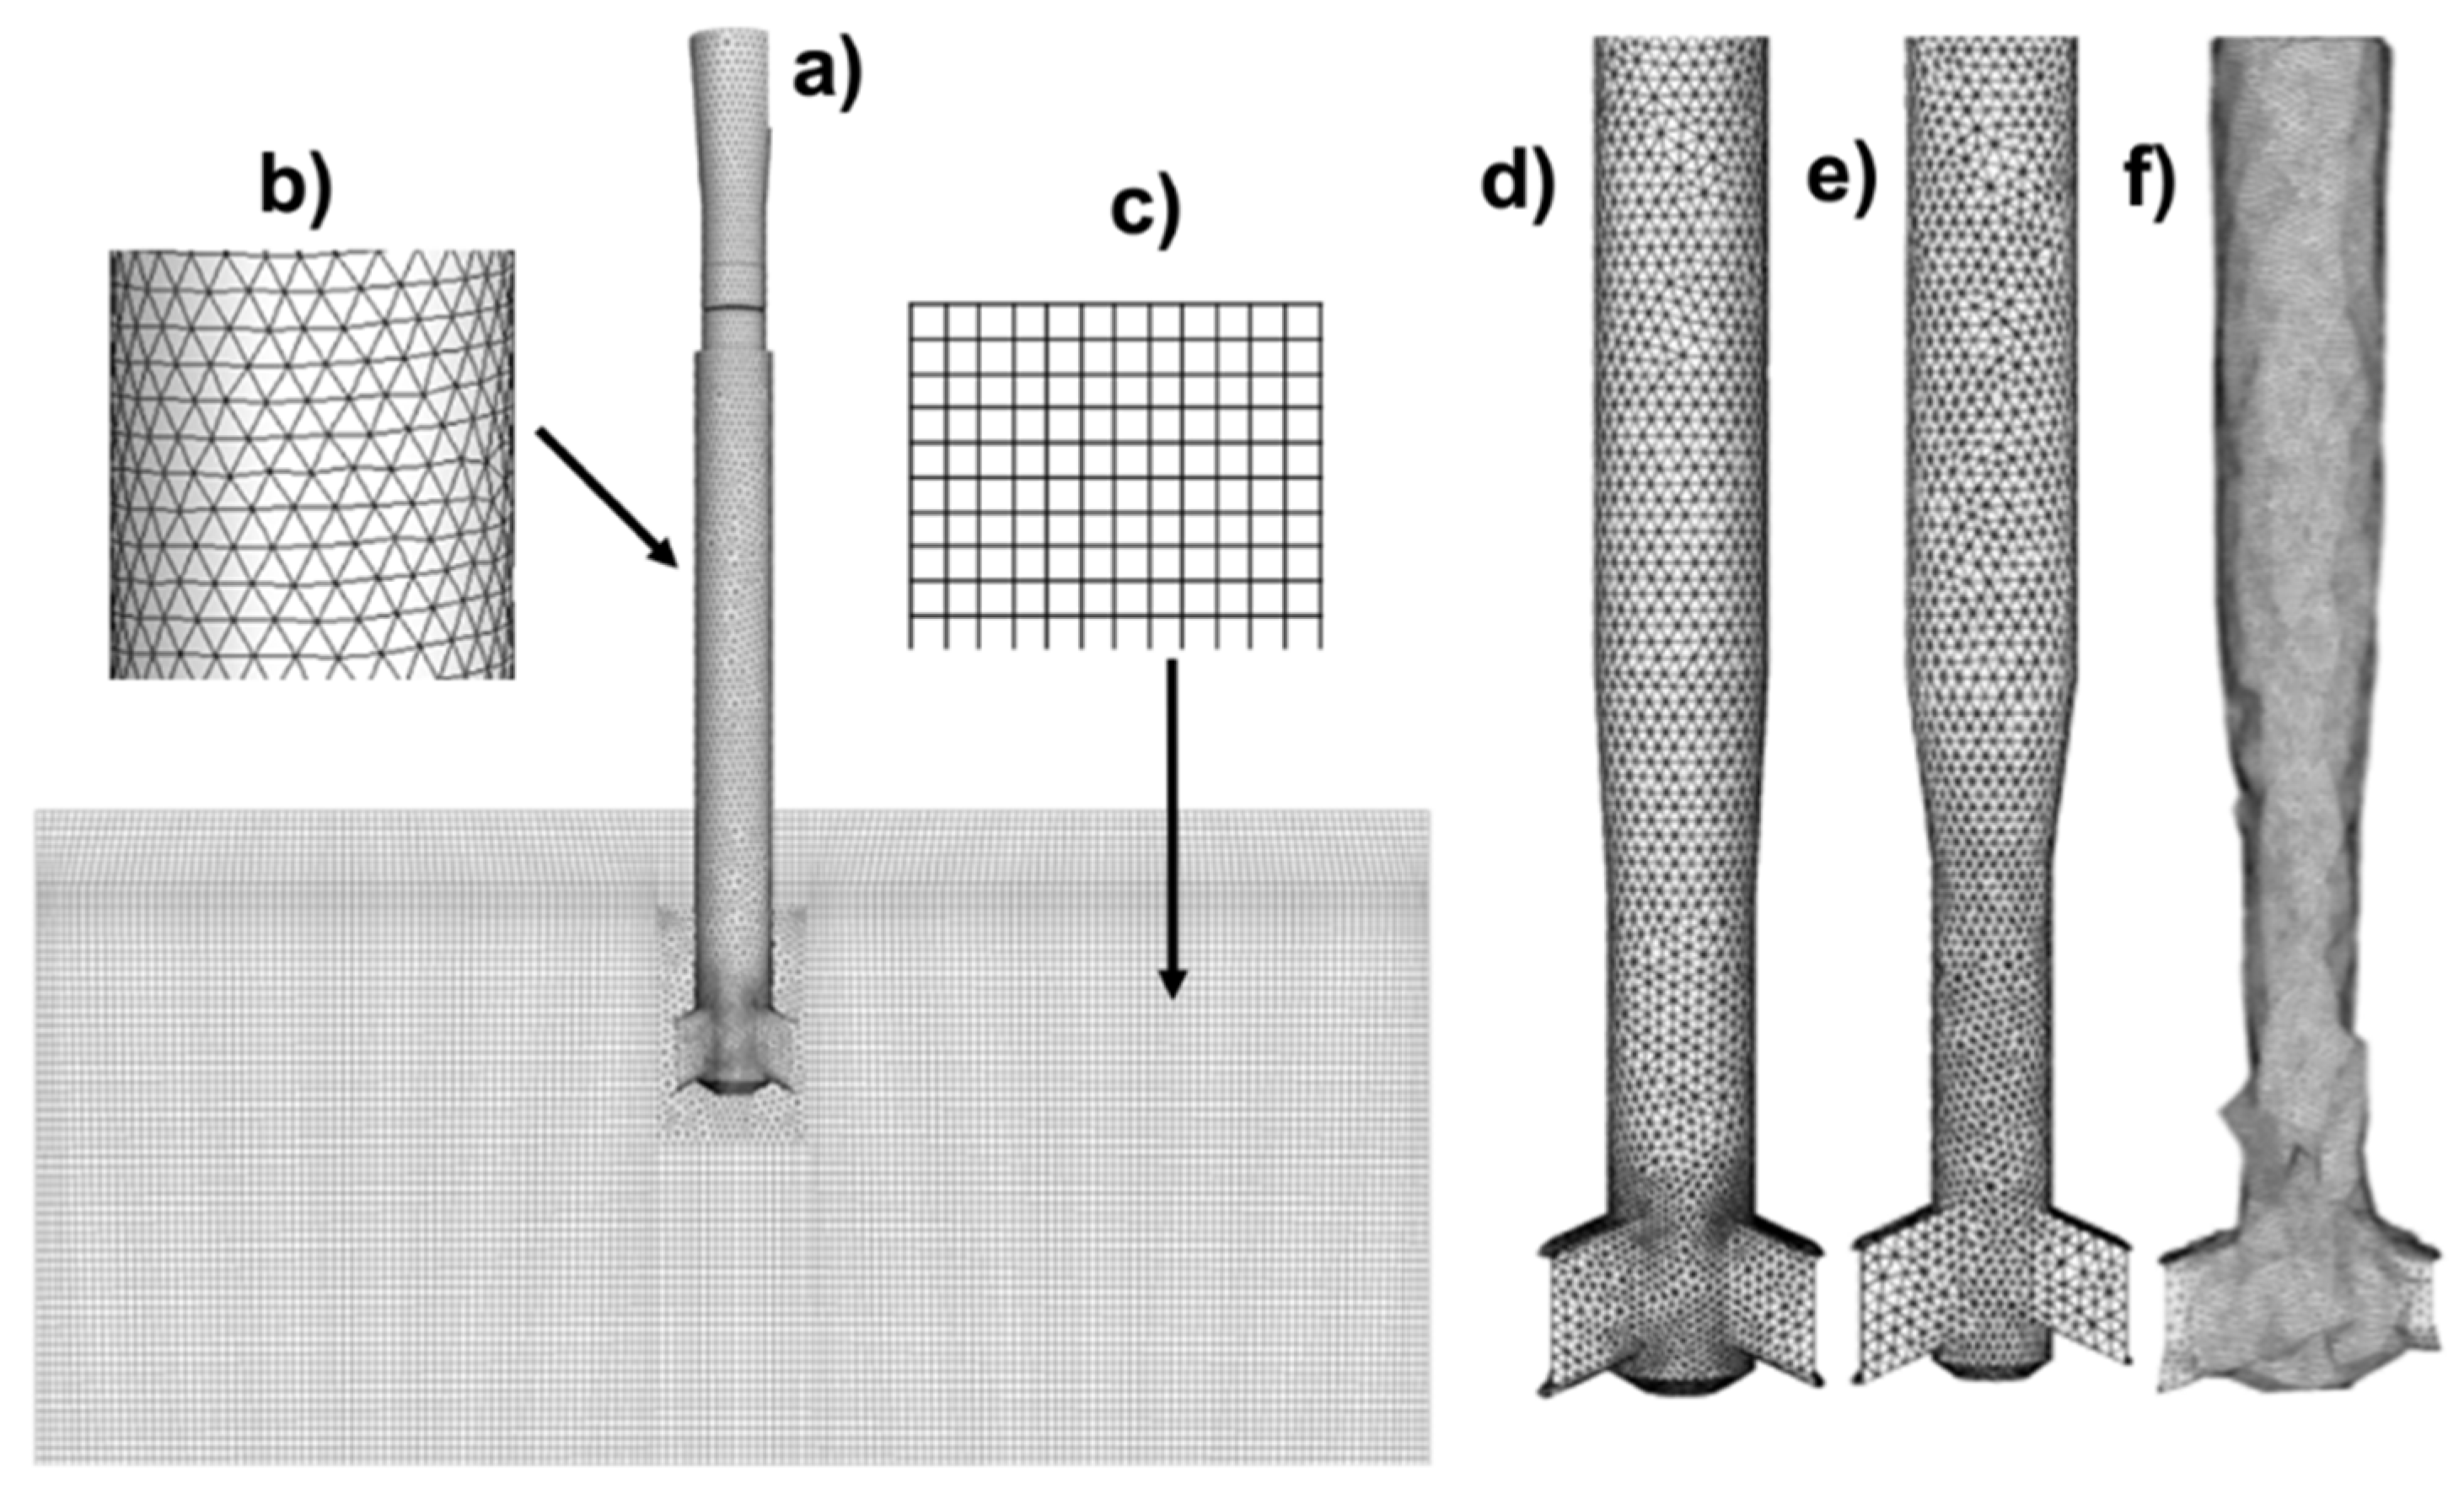
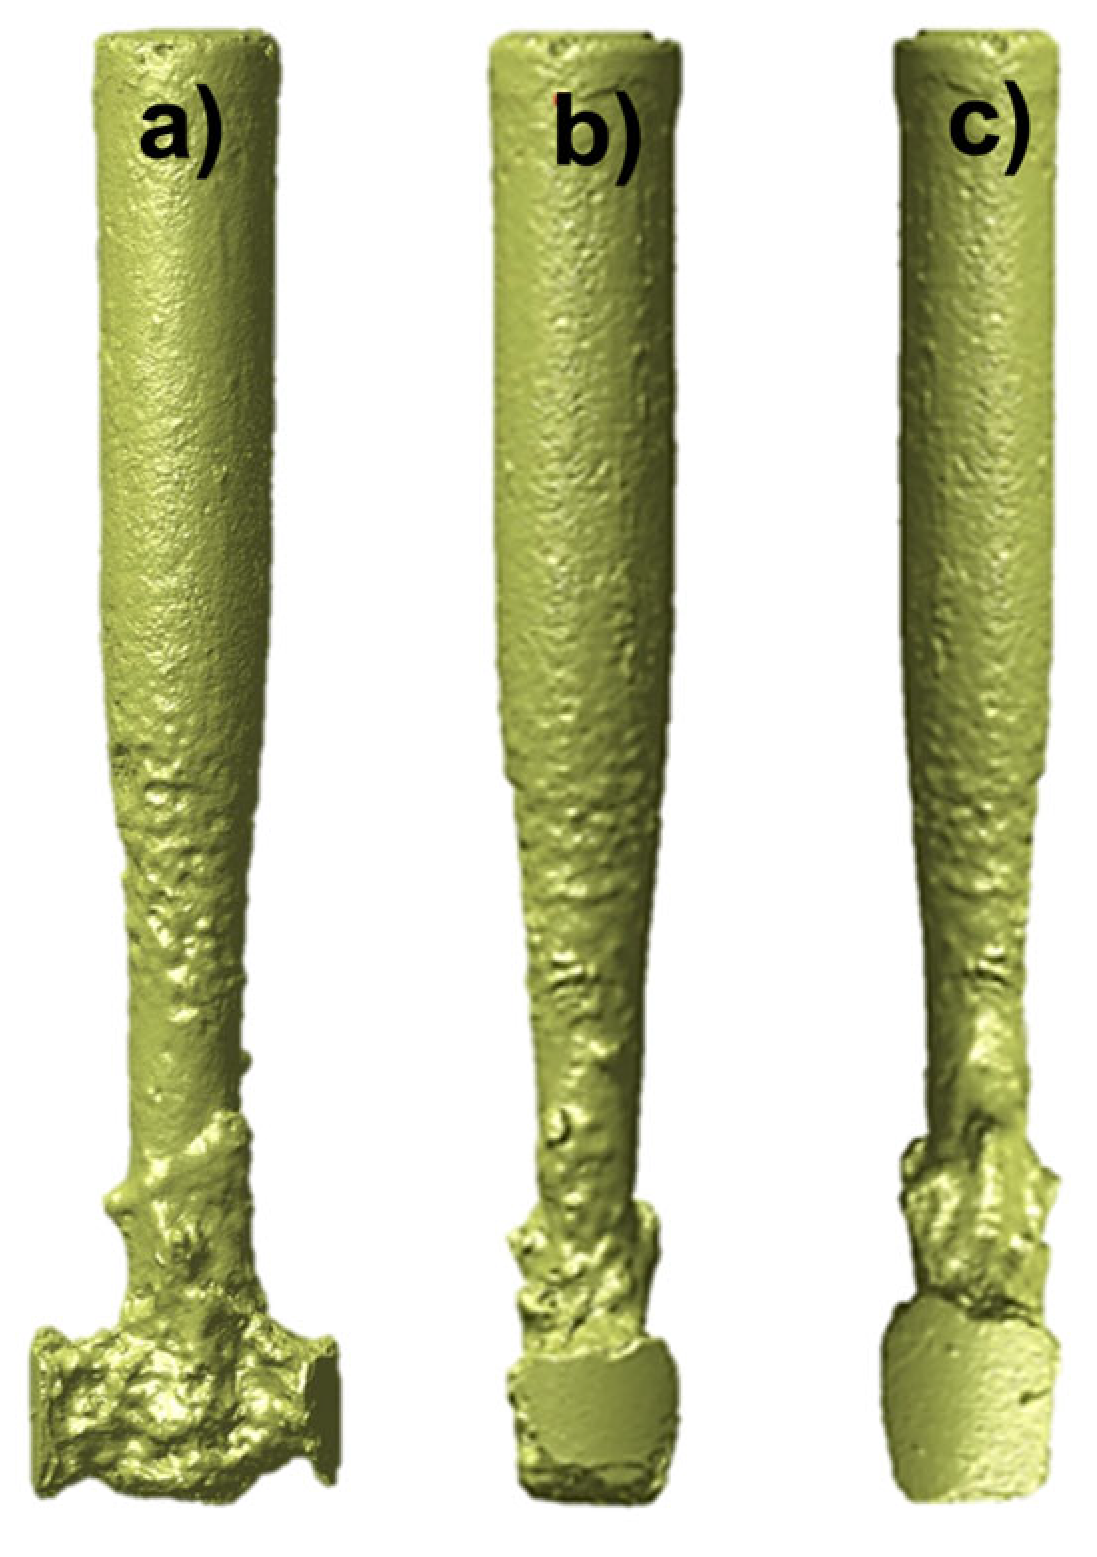
In accordance with the actual operating conditions of the plant, the slide gate was set at 60 % open to maintain a stable mold level. This setting was applied consistently in both the water model and the numerical simulations. The steel density was 7100 kg/m3 with a dynamic viscosity of 0.0064 Pa·s. The system operated at atmospheric pressure (101,325 Pa). The SEN was positioned 127 mm below the meniscus for proper immersion in the liquid steel, while a 100 mm air gap was maintained above the steel surface, corresponding to the vertical distance from the steel surface to the tundish cover. Geometries and dimensions of the coupled system are shown in Figure 1. The computational mesh comprised approximately 90% structured elements, as shown in Figure 2, with a maximum element deformation of 0.76 and an average total of 1.5 million cells. This study simulated a real SEN geometry at the end of its industrial life, exhibiting severe asymmetric clogging in the lower tube section, ports, and pool area; the internal details of this SEN are presented in Figure 3. To accurately reproduce the internal geometry, a green epoxy resin was cast inside the nozzle. After removing the SEN refractory shell, the resulting solid core was scanned using photogrammetry, acquiring high-resolution images from multiple angles. The data were processed following a standard photogrammetric workflow, including image alignment, point cloud generation, and the creation of a 3D solid body. This procedure produced a dense point cloud with a mean spacing of approximately 1 mm, sufficient to capture the geometric features relevant to the clogging patterns. Careful camera calibration and controlled lighting ensured that even minor geometric variations caused by inclusion adherence and refractory erosion were captured, allowing for an accurate reconstruction of the 3D SEN surface.
Four cases were proposed to study the operating performance of the nozzle with and without clogging: case 1 (C1) with no clogging, case 2 (C2) using symmetrical reductions to simulate approximately half of the final clogging level, case 3 (C3) using symmetrical reductions to replicate the same clogging level observed in the core nozzle, and case 4 (C4) representing the real severely clogged nozzle obtained by 3D scanning.
The level of clogging in the SENs was determined by first identifying the region with the highest blockage, located in the lower part of the SEN below −0.6 m. From this point, the volume of each SEN was calculated. The clogging level was then quantified by comparing these volumes to that of the original SEN geometry (C1), calculated as follows:
Clogging   level   ( % )   =   V 1 V i V 1 × 100
where V 1 is the volume of the original SEN (C1) and V i is the volume of the clogged SEN cases. The most severely clogged SEN corresponds to the case with the smallest volume (C4). For C3, idealized geometric shapes were placed over the three-dimensional design of the C4 geometry, preserving the main dimensions of the real geometry while creating a simplified, symmetrical model. Consequently, both C3 and C4 present approximately the same clogging level, corresponding to about 47% relative to the original case (C1).

3. Results and Discussion

3.1. Mathematical Validation

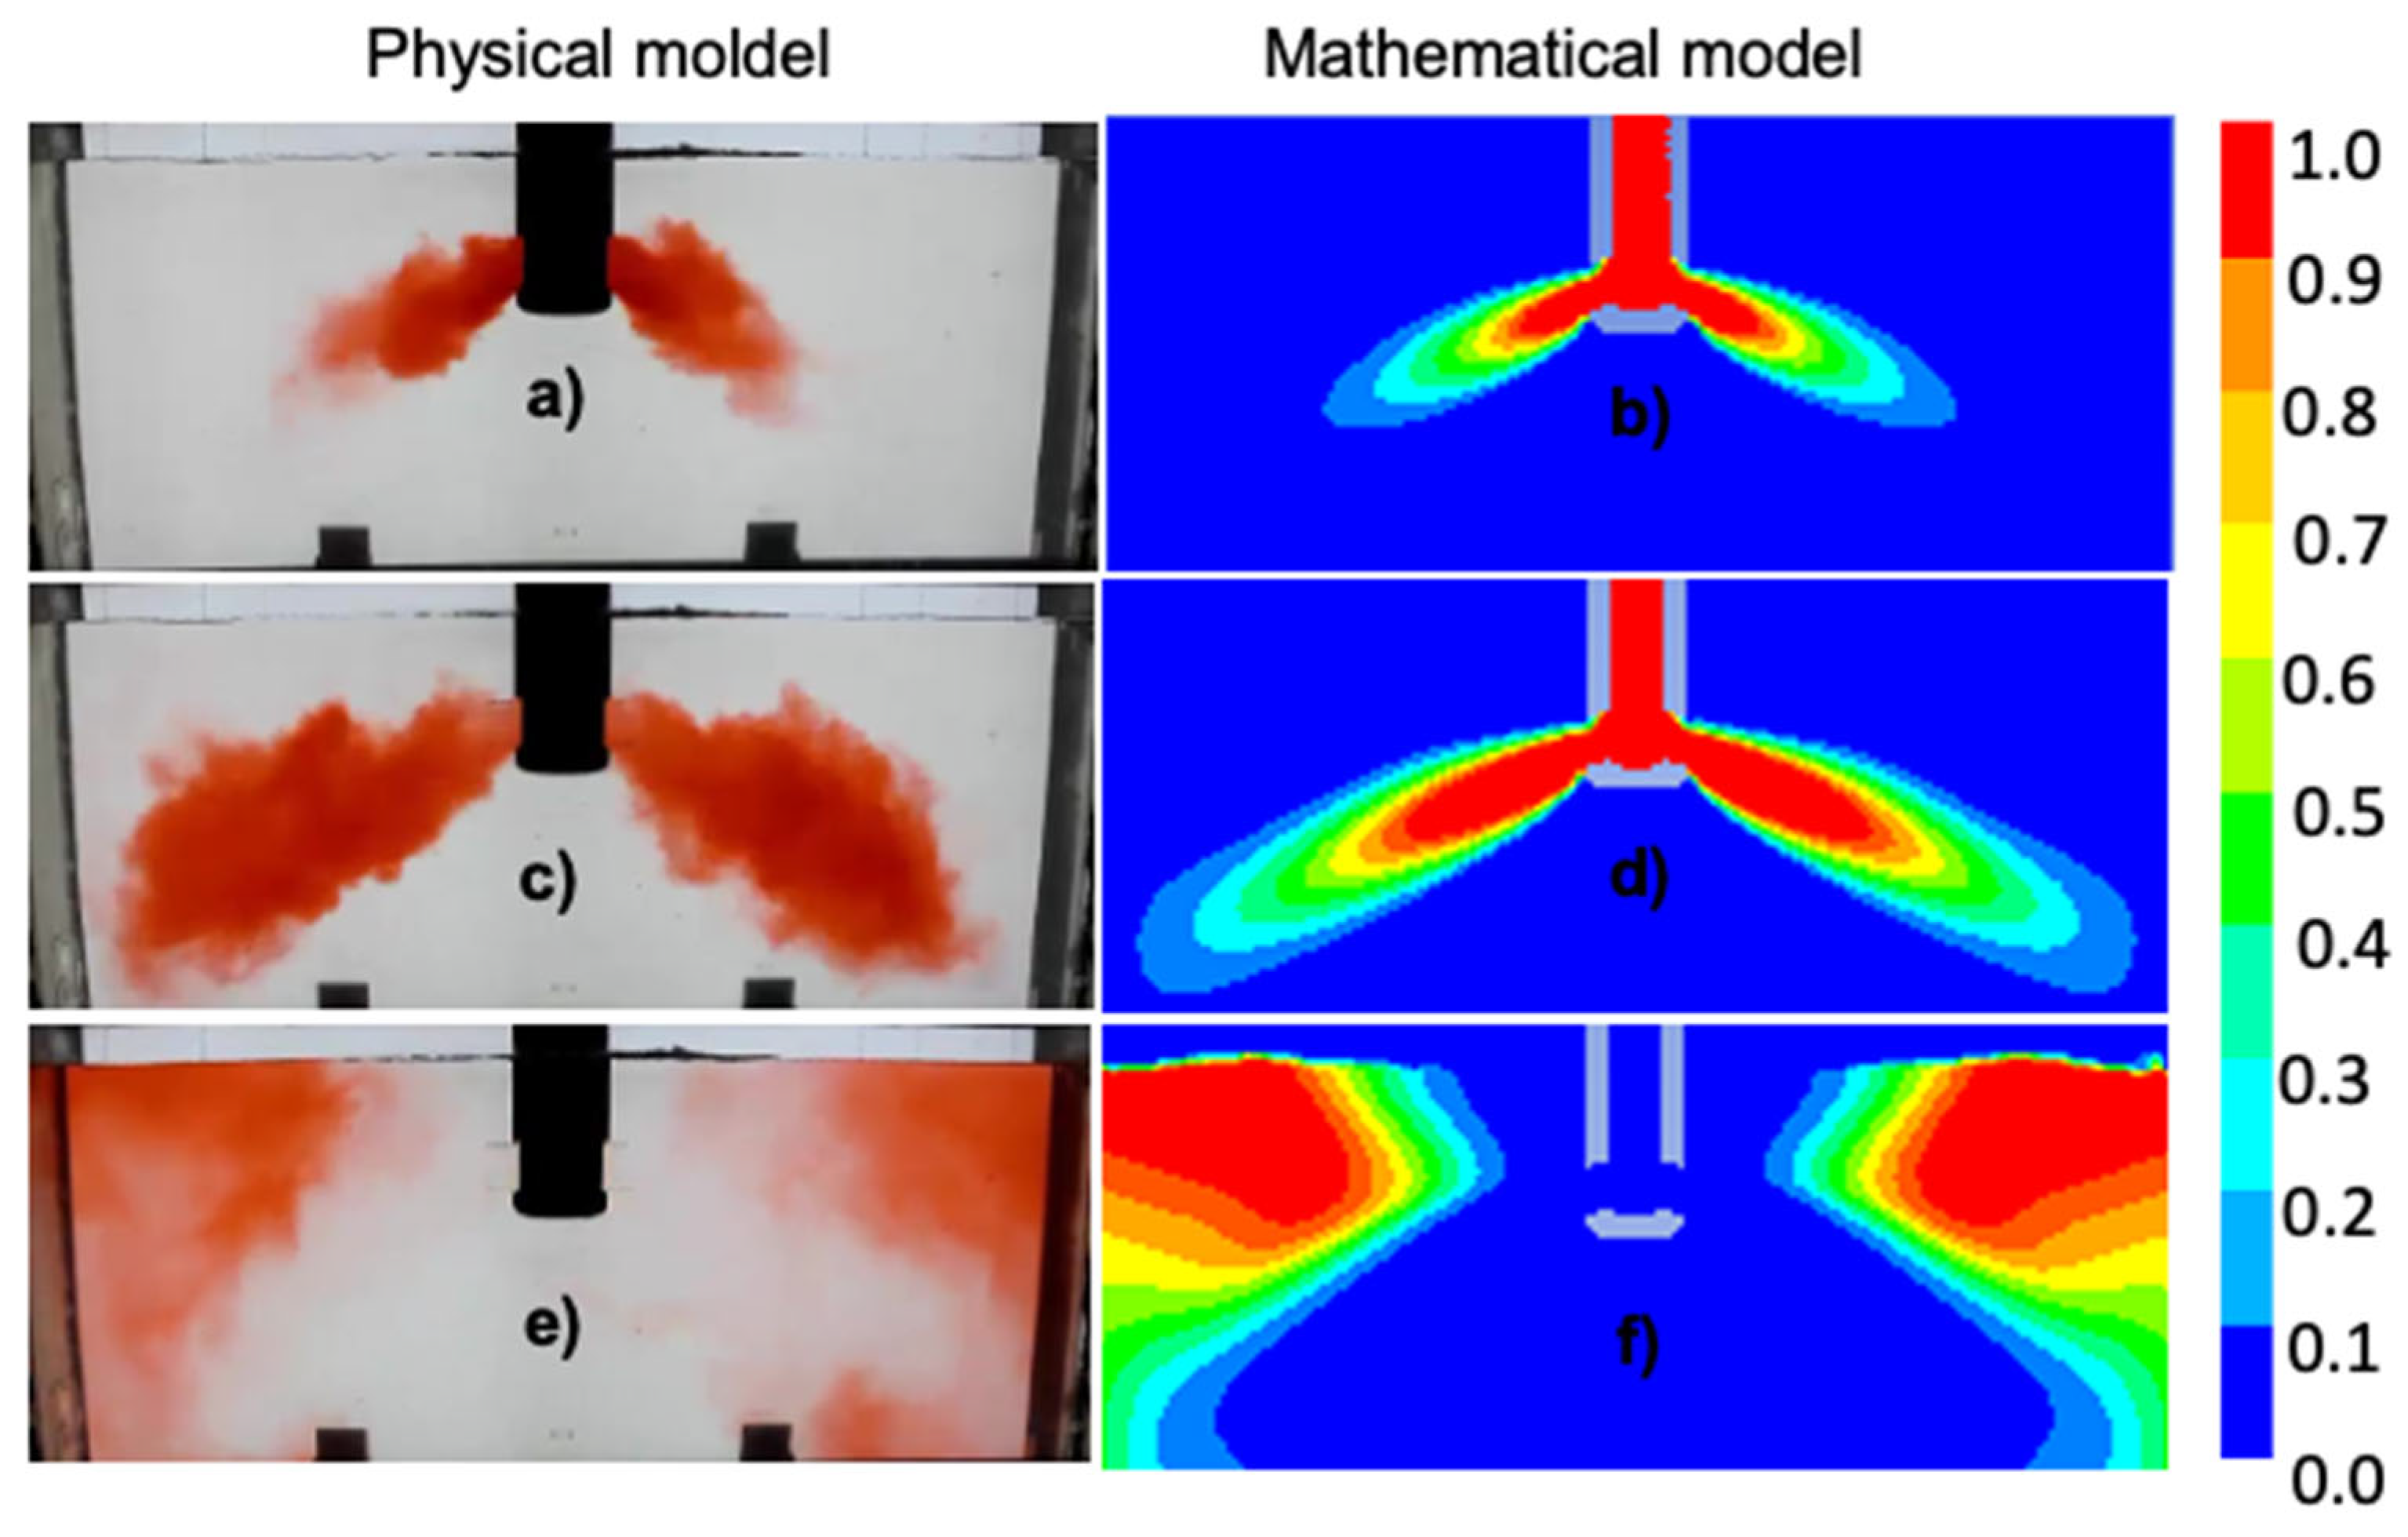
Water modeling was used to validate the mathematical model. The experimental setup consists of a full-scale model coupling the upper tundish nozzle, slide gate, SEN, and mold. The mold was built of 15 mm-thick transparent plastic sheets. The experimentation considers a constant room temperature. Since the model is fully scaled, it satisfies the Froude and Reynolds similarity criteria. A slide gate controlled the entry flow rate to maintain a constant mold level.
In the physical experiment, the tundish was first allowed to operate under constant conditions for five minutes to reach a stable flow. The numerical model was run for the same five-minute period to capture the general flow patterns and achieve quasi-steady-state conditions. Time zero was then defined as the moment the red dye tracer was injected at the top of the nozzle, after which its trajectory was recorded on video for further analysis in both the physical and numerical models.
Figure 4 presents the behavior of the tracer at 3 s, 5 s, and 7 s. Analyzing the tracer behavior of the water model, at the third second of the injection, both jets leave the nozzle ports with symmetry between them, and such symmetry remains as the jets approach the narrow walls. Once the jets hit the walls, shortly after 5 s, the tracer moves toward the free surface and then changes its trajectory to the SEN direction; this flow pattern is again quite similar between the left and right sides of the mold. The symmetrical results were expected since the original SEN did not have design problems under routine operation practice.
The flow patterns of the tracer movement, shown by the mathematical model results, have very similar dispersion in the physical model. Therefore, the qualitative comparison between the physical and mathematical results of tracer dispersion demonstrates that the mathematical model is validated and can reliably reproduce the flow patterns observed in the physical model. Moreover, it should be highlighted that other studies in the literature that performed mesh sensitivity analyses employed meshes with lower density than the one used in the present work [6,42,45], which further supports the adequacy of the selected mesh. For these reasons, a mesh-independence study was not required.

3.2. Comparative Analysis of Flow Behavior Under Different Clogging Stages

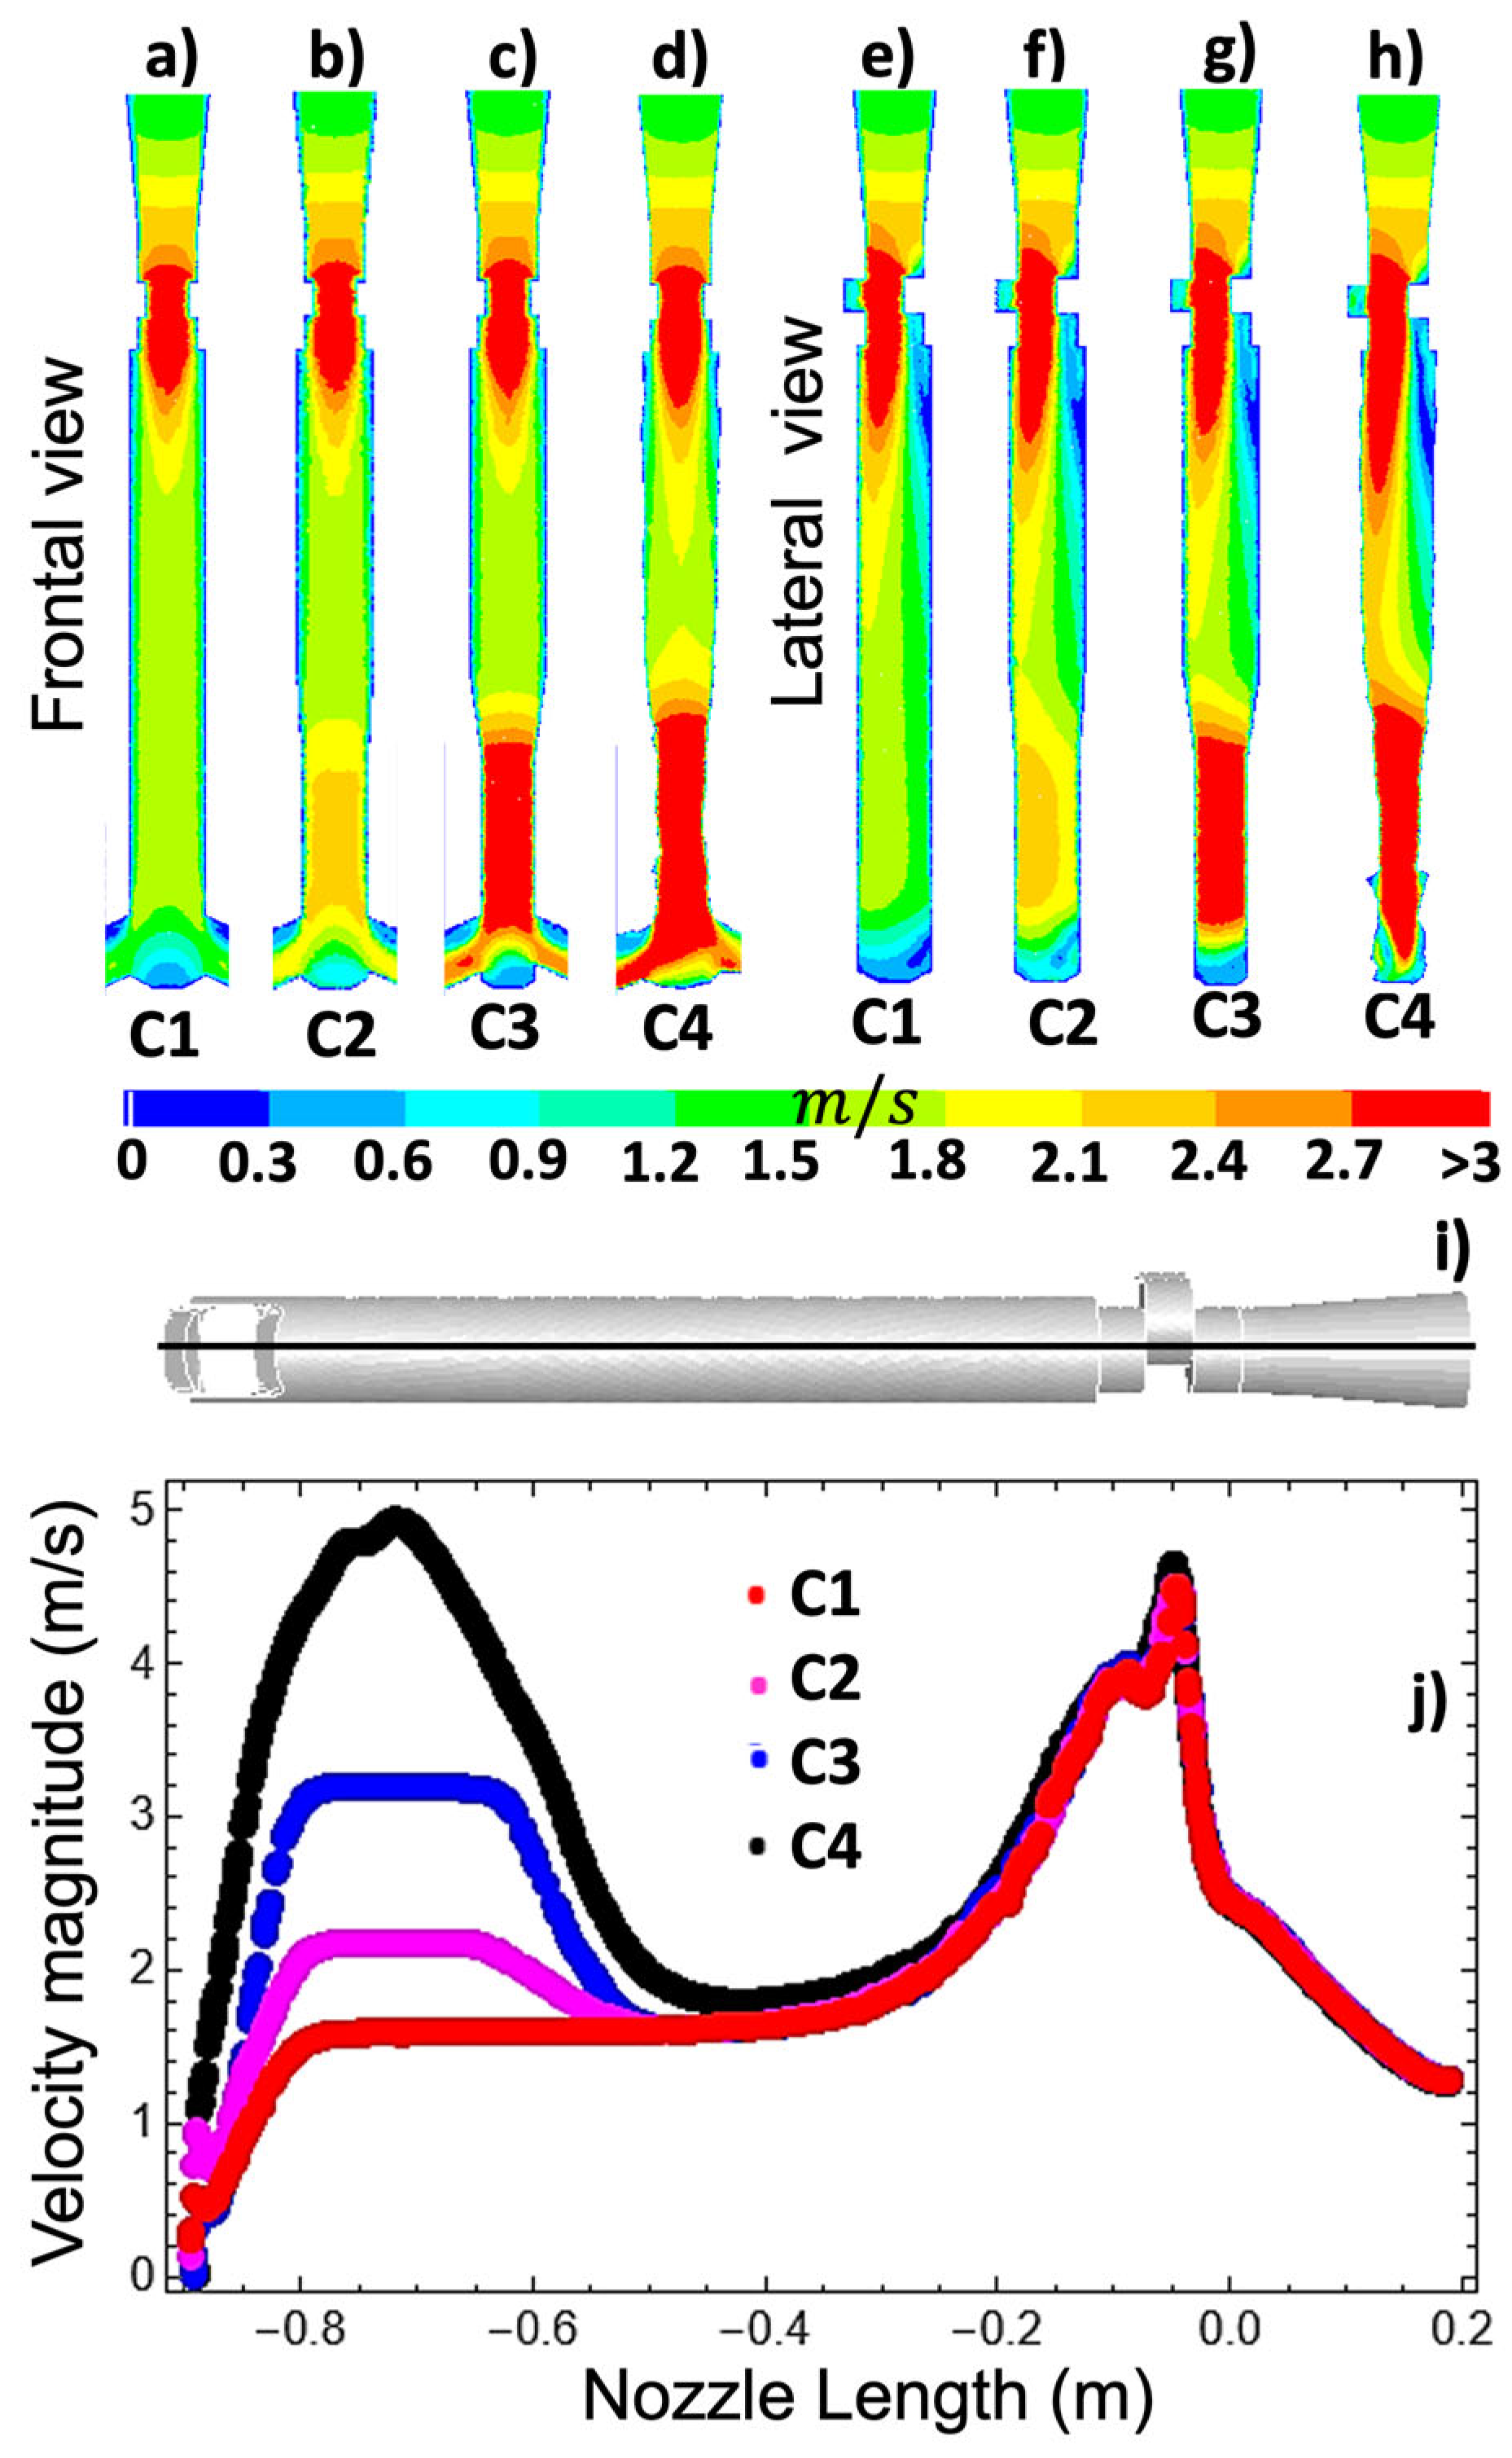
As a starting point for the analysis, Figure 5 shows the velocity contours for all cases in two longitudinal symmetric planes: the frontal plane (Figure 5a–d) and the lateral plane (Figure 5e–h). Once the flow passes the slide gate, the velocity magnitude increases notoriously, inducing the flow to move faster near the side of the slide gate aperture and forming a low-velocity zone on the opposite side.
Further down in the nozzle, at the clogging zone, the velocity increases sequentially from C1 to C4. Flow velocity increases to compensate for the reduced cross-sectional area induced by clogging, ensuring a constant flow rate is maintained.
To perform a quantitative comparison of the velocity variations among the cases, the velocities are calculated along a line drawn at the nozzle center, as shown in Figure 5j. In these figures, all lines are indistinguishable until y = 0.4   m ; after this point, the velocity magnitude remains almost constant until the port section for C1, and this is because the case has no clogging effects. In contrast, the other cases exhibit a further increase in velocity beyond y = 0.4   m , and for C4, the velocity increment is high enough to exceed the velocity magnitude reached in the slide gate zone.
Comparing the maximum velocities within the range of y = –0.4 to y = –0.8 and using C1 as the reference, C2 exhibited an increase of 61.5%, C3 of 138.46%, and C4 of 284.6%. Additionally, a 38% difference in maximum velocity was observed between cases C3 and C4.
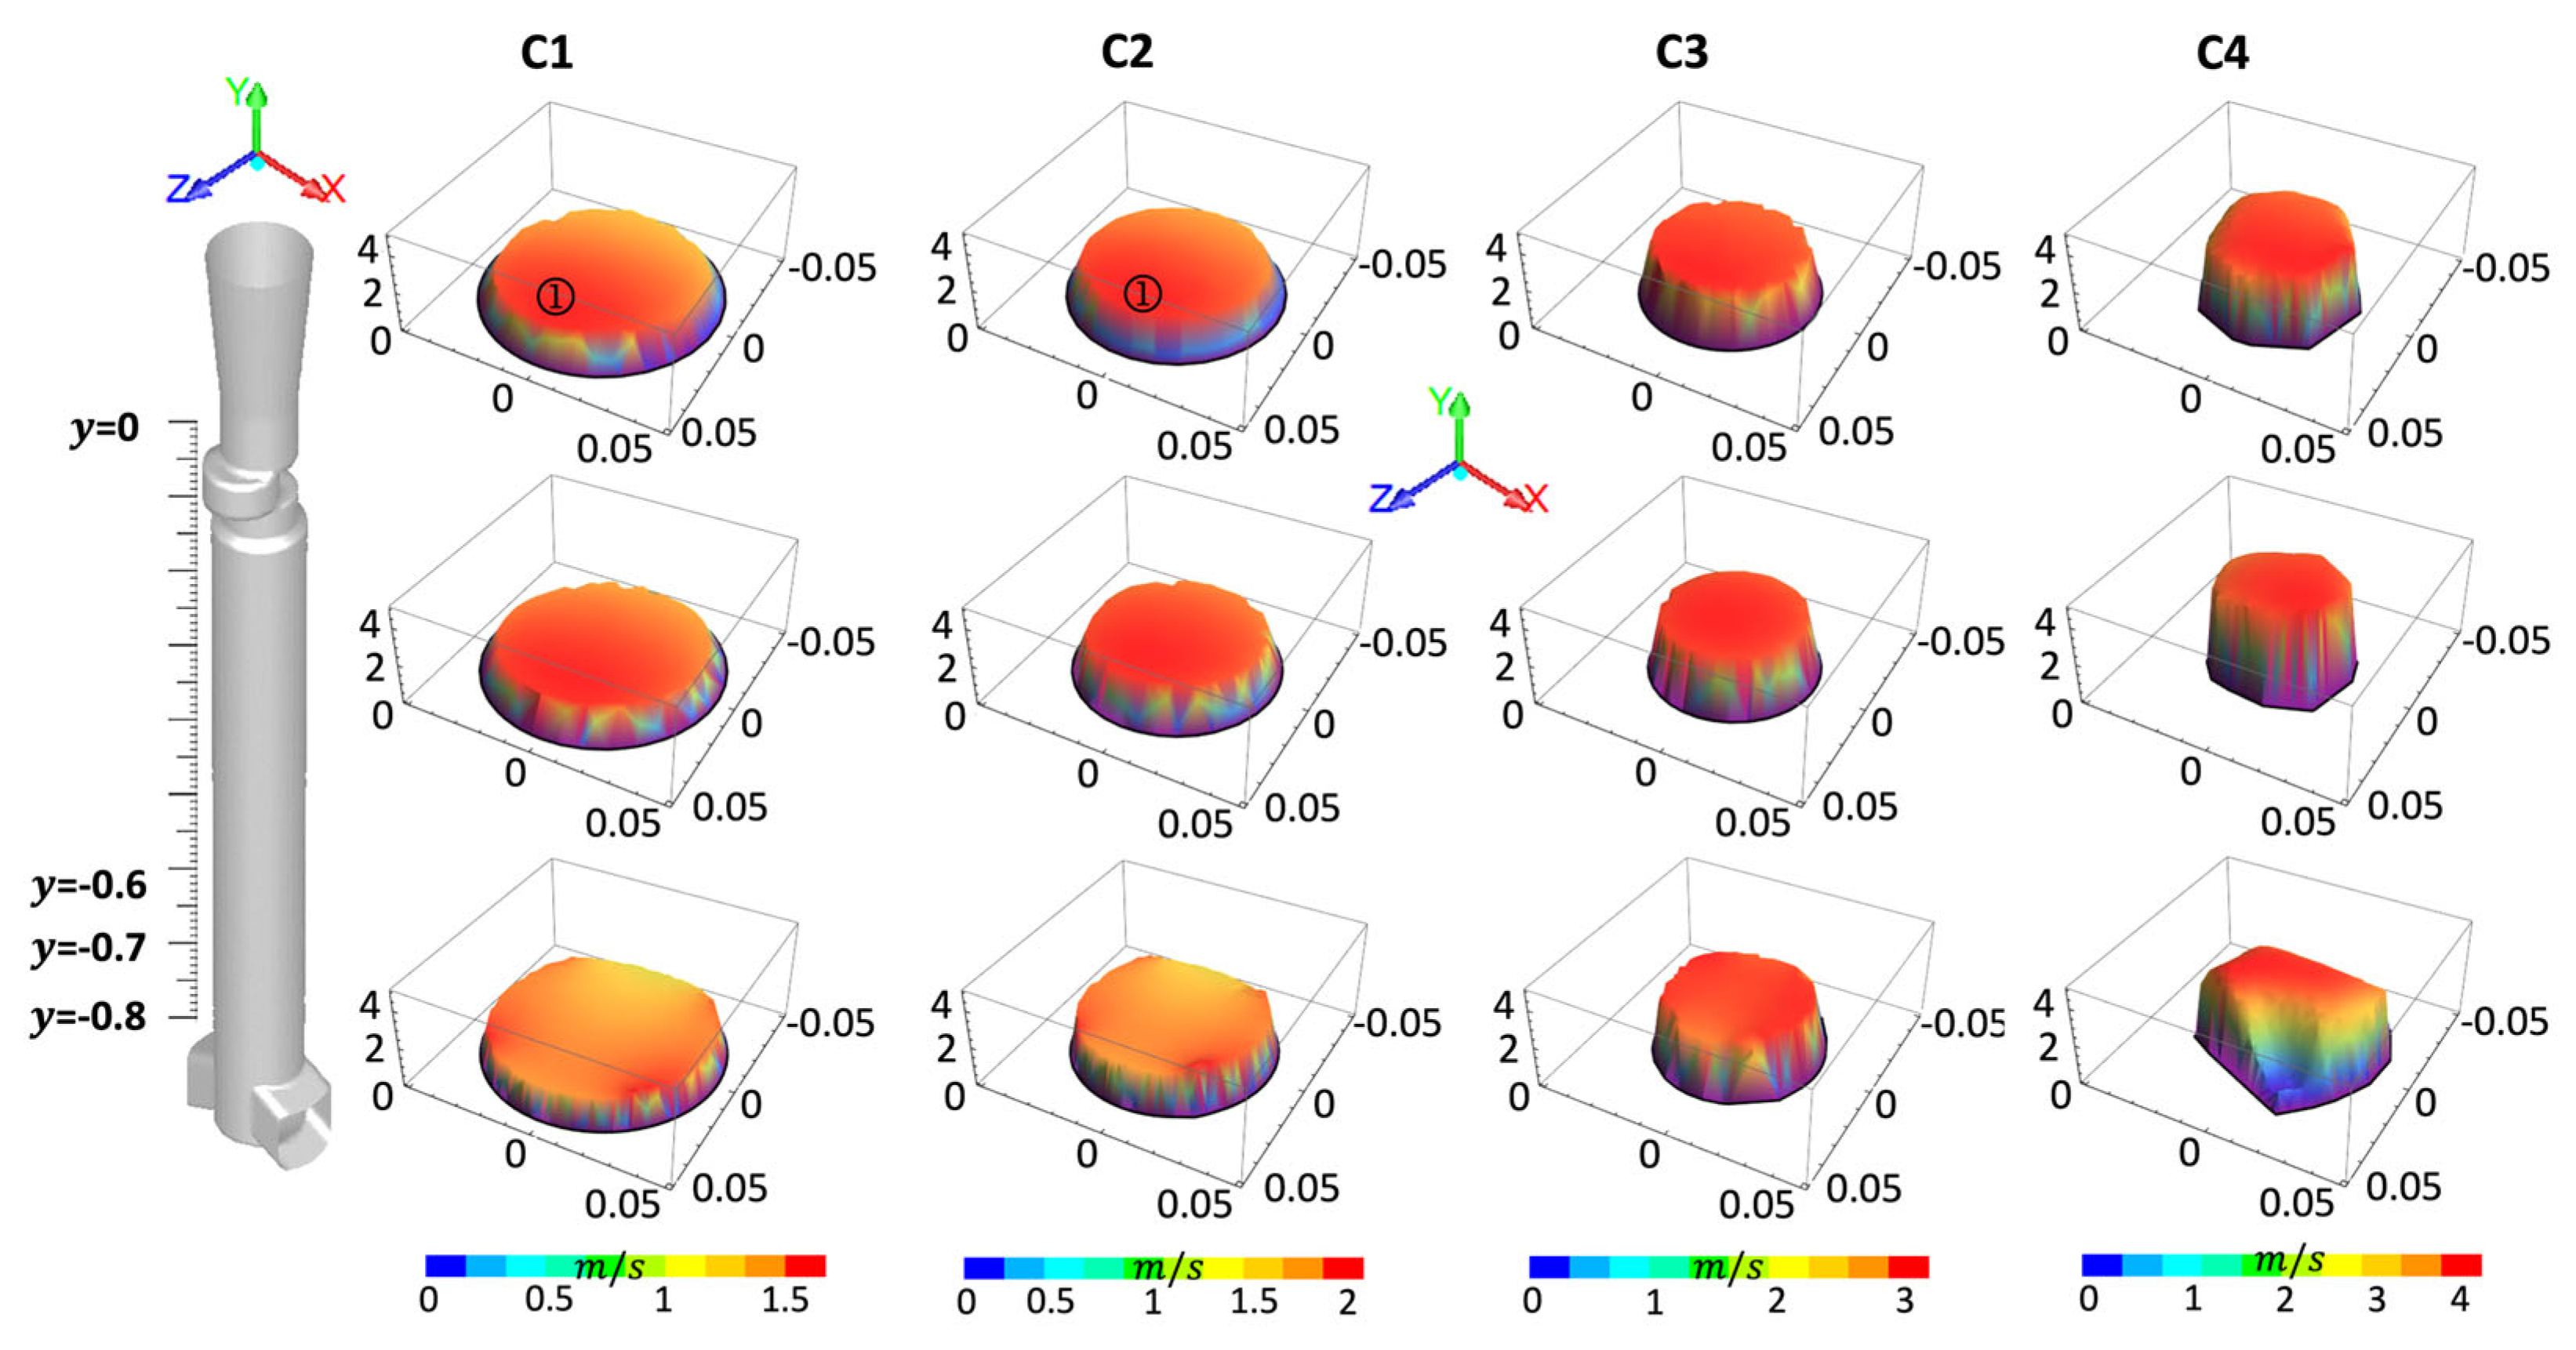
Since the stage of clogging is reflected in a reduction in nozzle diameter, inducing a significant increase in velocity at the clogging zone, it is imperative to analyze the variations in velocity throughout the cross-sectional area, with particular emphasis near the nozzle wall. Figure 6 shows 3D velocity contours along the three cross-sectional positions, where area reductions are more evident; these positions are y = 0.6 , y = 0.7 , and y = 0.8   m .
The plots in Figure 6 display the flow positions inside the nozzle at the x and z axes and the flow velocity magnitude at the y -axis. In addition, the zero velocity in all plots indicates the SEN wall internal perimeter, marked in black to clarify the wall form at each y -position. These zero values result from the nonslip boundary condition for walls. The results show that the velocity increment occurs across the entire cross-sectional area with sequential increases of 0.5   m / s between cases 1, 2, and 3 and a much larger increment of 3   m / s   between cases 1 and 4. See the scale of the color bars to notice it. Furthermore, for cases 1 and 2, the slide gate aperture effects on the velocity are still observed by higher flow velocities at the back part of the nozzle (see point ① in Figure 6), and such effects are less pronounced as the flow approaches the ports. In contrast, for cases 3 and 4, this slide gate effect is almost undetected because of the high increase in velocity magnitude.
Focusing on the cross-sectional shape for each case in Figure 6, C1 keeps its circular shape at all the y -positions, and C2 and C3 maintain equally a circular form; however, its diameter decreases sequentially as the level of clogging increases, and C4 shows that its cross-sectional areas for all the y-positions no longer correspond to a circle or any regular geometric shape since the solid material of the clogging adhered non-uniformly to the internal SEN wall, resulting in noticeable velocity asymmetries compared to the other cases.
To better understand how the clogging affects the flow velocity through the cross-sectional areas, Figure 7 shows these velocity values as a function of their distance from the nozzle center towards the nozzle internal wall. In this figure, the nozzle center has its coordinates as ( x c ,   z c ) = 0 ,   0 , and the distance of each plotted velocity value is calculated as follows:
d = ( x x c ) 2 + ( z z c ) 2
The results in Figure 7 show that the flow velocity magnitude increases as the clogging level increases; nevertheless, for each case, equidistant points from the nozzle center have similar velocity values for each case, with an evident and expected drop of the flow velocity close to the nozzle wall. However, for C4, an important dispersion of the velocity values close to the wall is observed; such velocity dispersion increases significantly in the last cross-sectional area, y = −0.8 m, even for points close to the nozzle center. The observed results in Figure 6 and Figure 7 indicate that the behavior of the steel induced by strong blockage of the real clogging case (C4) cannot be accurately replicated by nozzles with symmetric reductions in their dimensions to simulate the clogging phenomenon. This last is due to the severe irregularities of the wall and the lack of symmetry, which cannot be faithfully reproduced by symmetrical reductions caused by a non-uniform deposition of material adhered to the nozzle. As a result, C4 shows a considerable difference from C3 despite exhibiting similar overall clogging levels. Consequently, special care must be taken when studying clogging phenomena using symmetrically reduced nozzles, particularly in research focused on analyzing flow behavior near the wall and tracking inclusion trajectories.
To study the variations in velocity magnitude on the inclusion adhesion phenomenon in each nozzle, the Linder model [46] has been employed to calculate the adhesion velocity of the inclusion to the nozzle wall. The Linder model accurately predicts the SEN internal inclusion adhesion against results obtained in plant trials [47], especially at the SEN port zone. In this model, the adhesion velocity to the refractory wall of the nozzle ( V T ) is calculated as
    V T = 0.01   d p τ w     ρ ν
where d p is the inclusion diameter, τ w is the wall shear stress, and ν is the kinematic viscosity.
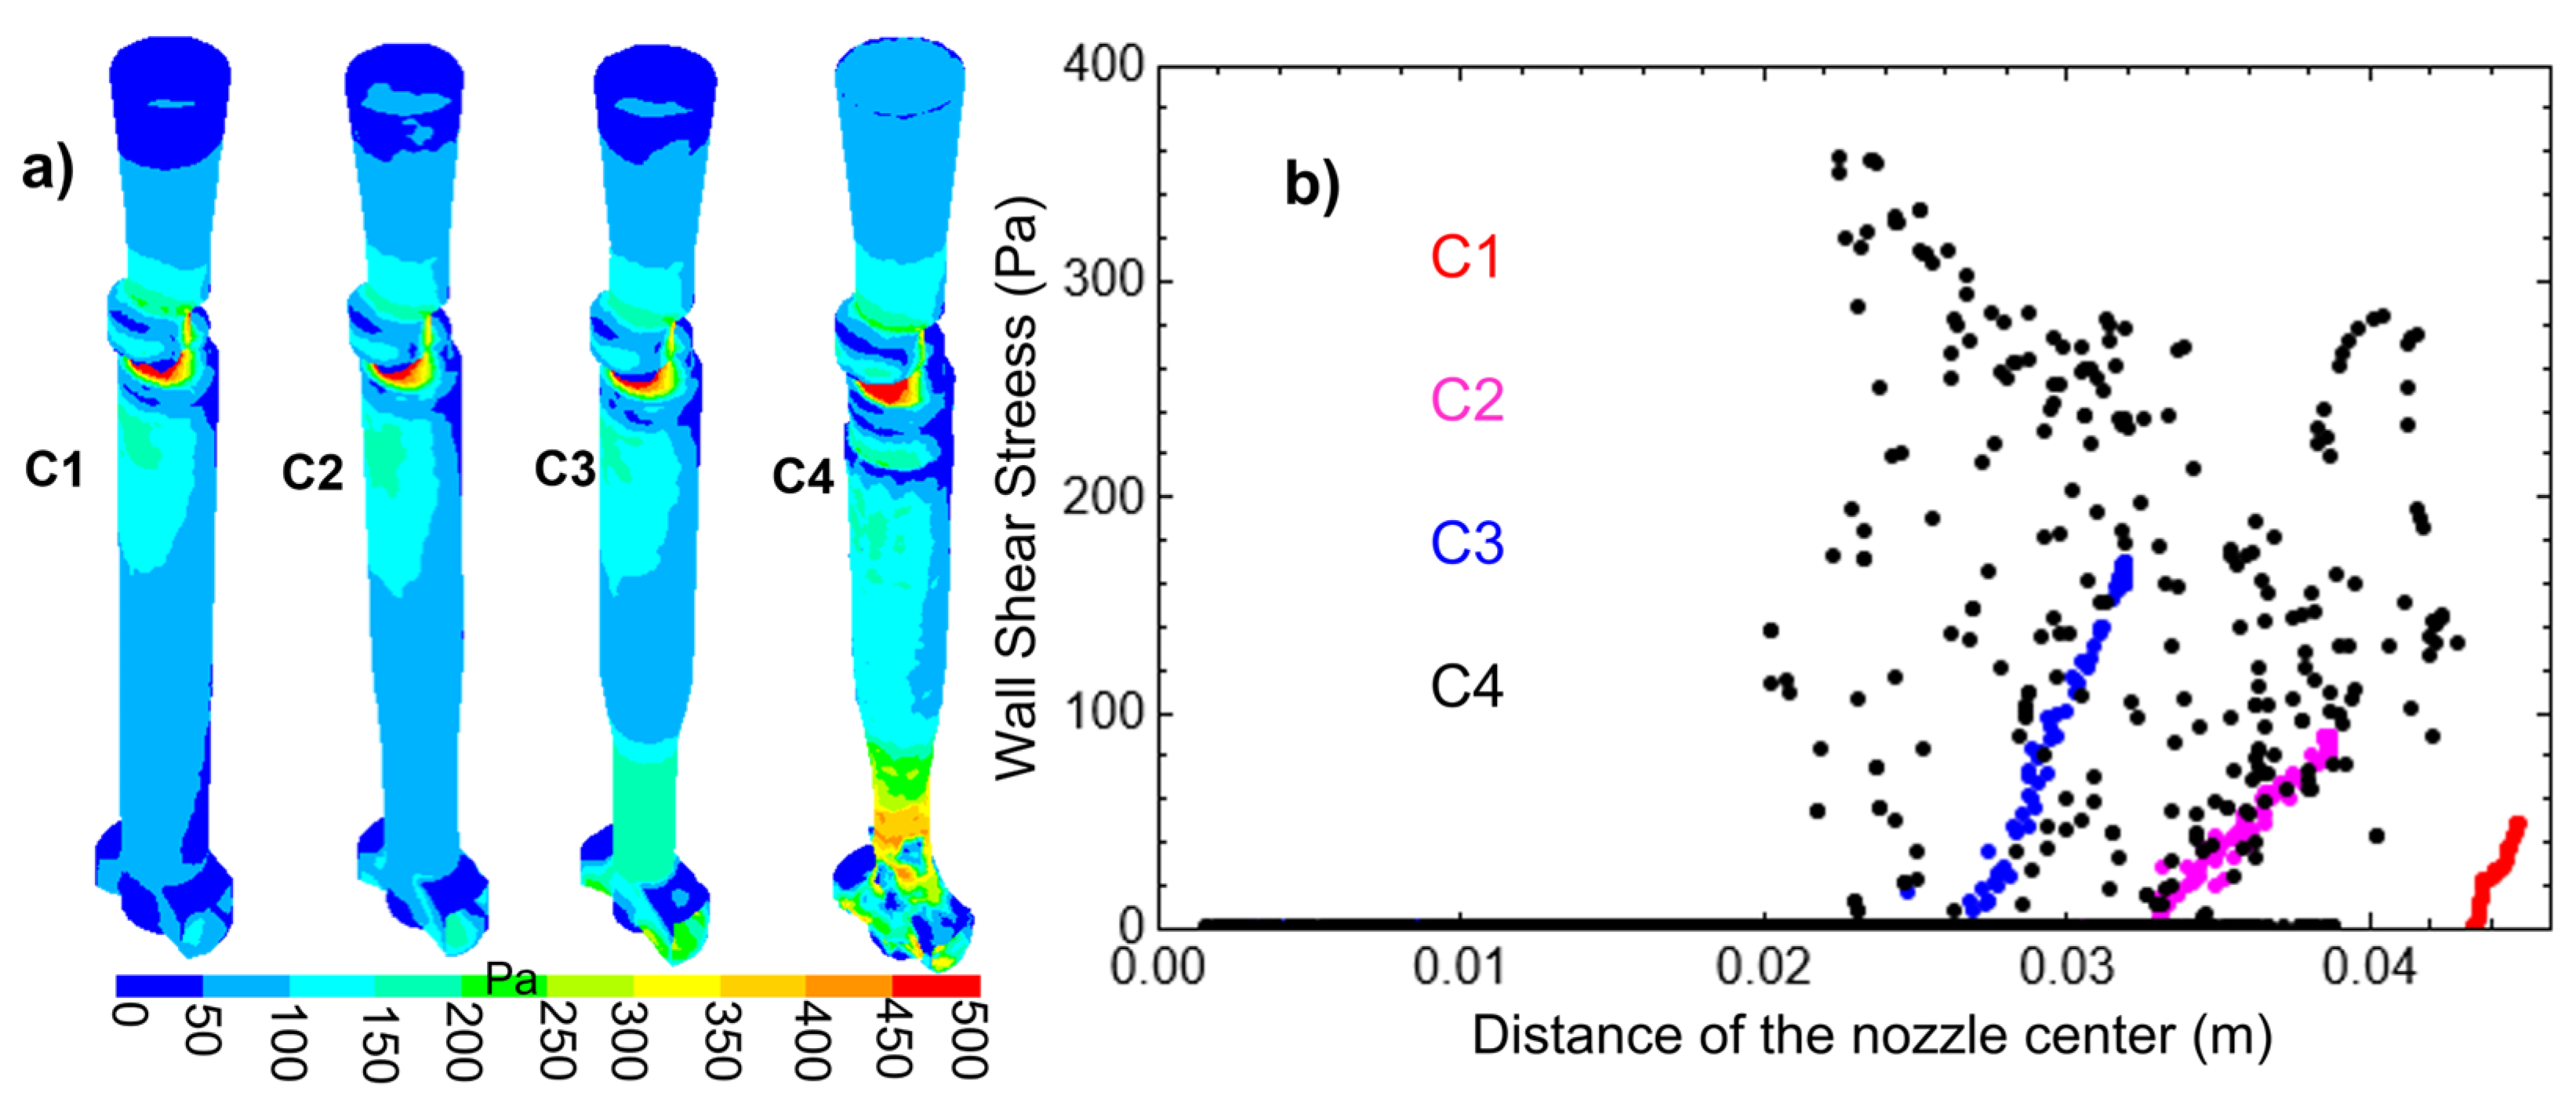
Since d p ,   ρ and ν are constant, the increment or decrement in V T only will depend on any variations of τ w . Therefore, to analyze the adhesion velocity, the wall shear stress in the whole SEN internal wall for the four studied cases is shown in Figure 8a; additionally, Figure 8b shows its magnitude in the cross-sectional area at y = 0.8 as a function of the distance from the nozzle center to the nozzle wall. The contours show increments in τ w as the clogging level increases from C1 to C4.
The highest values of τ w appear below the slide gate position, just before the ports, and at the lower zone of the ports, where the flow reaches its maximum velocities. Particularly, the τ w highest values were detected at the nozzle height of y   =   0.8 . Analyzing these last values at the cross-sectional area in such “ y position, for cases 1 to 3, it is observed that τ w increases as the clogging stage increases, where C2 has an increase of 10% and C3 has an increase of 110% compared to C1. In contrast, C4 reaches values up to 420 Pa, representing an increment of 360% compared to the value of C1. However, the most noticeable observation is that C4 exhibits a significant dispersion of the τ w values which is not due to the reductions in cross-sectional area but rather to the wall irregularities. Following this observation, cases C3 and C4 are compared since both have the same level of clogging but present different τ w values. The results show that C4 has values up to 90% bigger than C3. Wall shear stress τ w increases with the clogging level. This induces a rapid and inevitable increase in the clogging level, confirming that nozzle clogging is a self-accelerating process [48]. As τ w rises, adhesion velocity also increases, leading to more inclusions accumulating at the same locations, below the slide gate, just before the ports, and within the ports zone, which are typical sites of inclusion adherence [1,2,3,11,20,26]. Notably, as clogging progresses, τ w increases not only at the lower part of the ports but along their contour, indicating that inclusions deposit along the entire perimeter of the ports, as reported by Okada et al. [47] and observed in studies using industrial clogged SENs [21,25,26]. This demonstrates that wall shear stress effectively identifies the zones of greatest inclusion deposition.
Therefore, mathematical models that use symmetrical nozzle reductions to simulate clogging significantly underestimate wall shear stress values and, consequently, inclusion adhesion velocities, emphasizing that real clogging effects cannot be accurately captured using such simplifications.
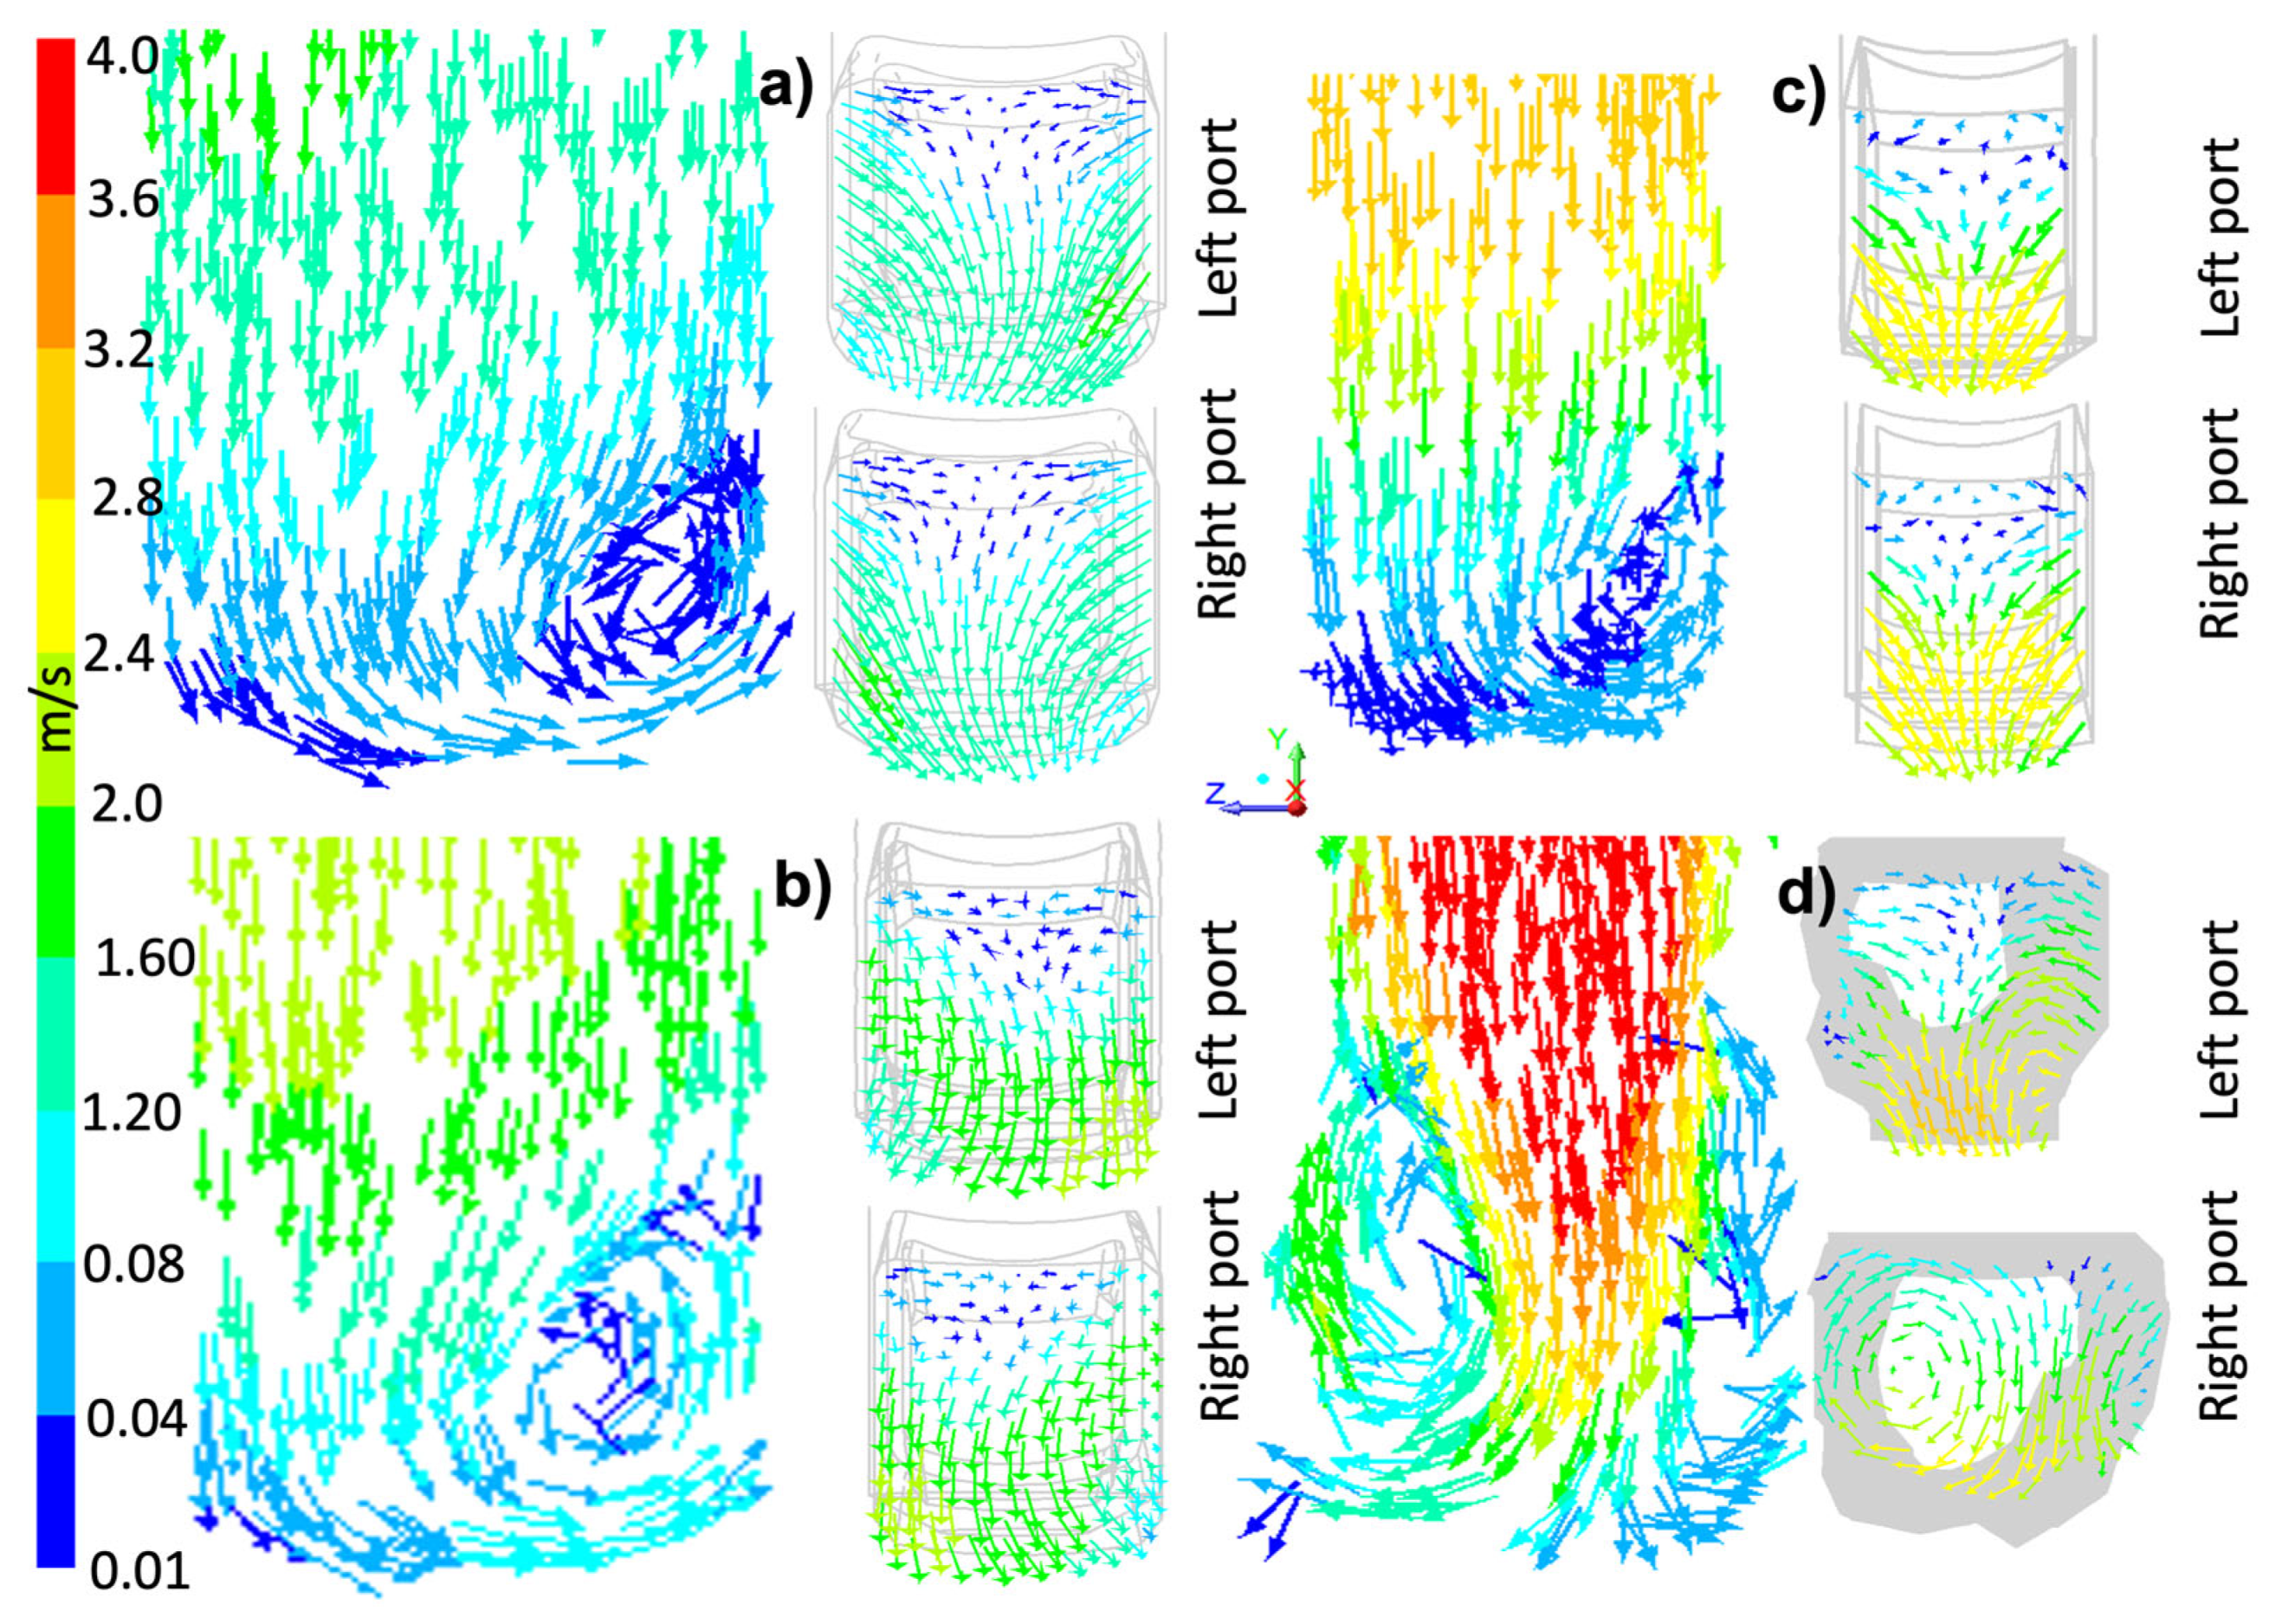
To finalize the analysis of the flow behavior inside the nozzle, how the steel leaves the nozzle will be studied. The velocity vector fields in lateral planes at the nozzle center and the outlet ports for all the proposed cases are shown in Figure 9. The results for the first three cases show a main flow with a velocity increment as the clogging stage increases, with a descending tendency on the same side of the slide gate aperture and a velocity decrement when it impacts the SEN pool, generating a small recirculation when it tries to rise. These flow pattern variations do not indicate that the fluid leaving the ports presents asymmetries in the way it leaves the ports, but it is observed that higher velocities occur as the port area decreases.
In contrast, case 4 shows a considerably difference from the others because its main flow shows a higher velocity than the other cases due to the significant reduction in the nozzle cross-sectional areas; this last also vanishes the descending tendency induced by the slide gate aperture since it is observed as a centered main flow. As a result, the flow impacts the pool of the nozzle, inducing two more intense non-symmetric recirculations than in the other cases.
This asymmetric recirculation shows a more intense interaction with the streams that leave the nozzle by the ports; this is because the flow movement is very irregular when comparing the flow behavior in both ports. Since a larger flow volume moves out exits through the left port, the less obstructed one, the flow movement is more homogenous and has higher velocity than in the right port. In contrast, in the right port, the fluid that exits the nozzle cannot counteract the recirculation effect, and consequently, the fluid leaves the right port rotating. All these flow variations will directly affect the flow patterns in the mold. Therefore, in the next section, these effects are analyzed and discussed.

3.3. Flow Patterns Inside the Mold

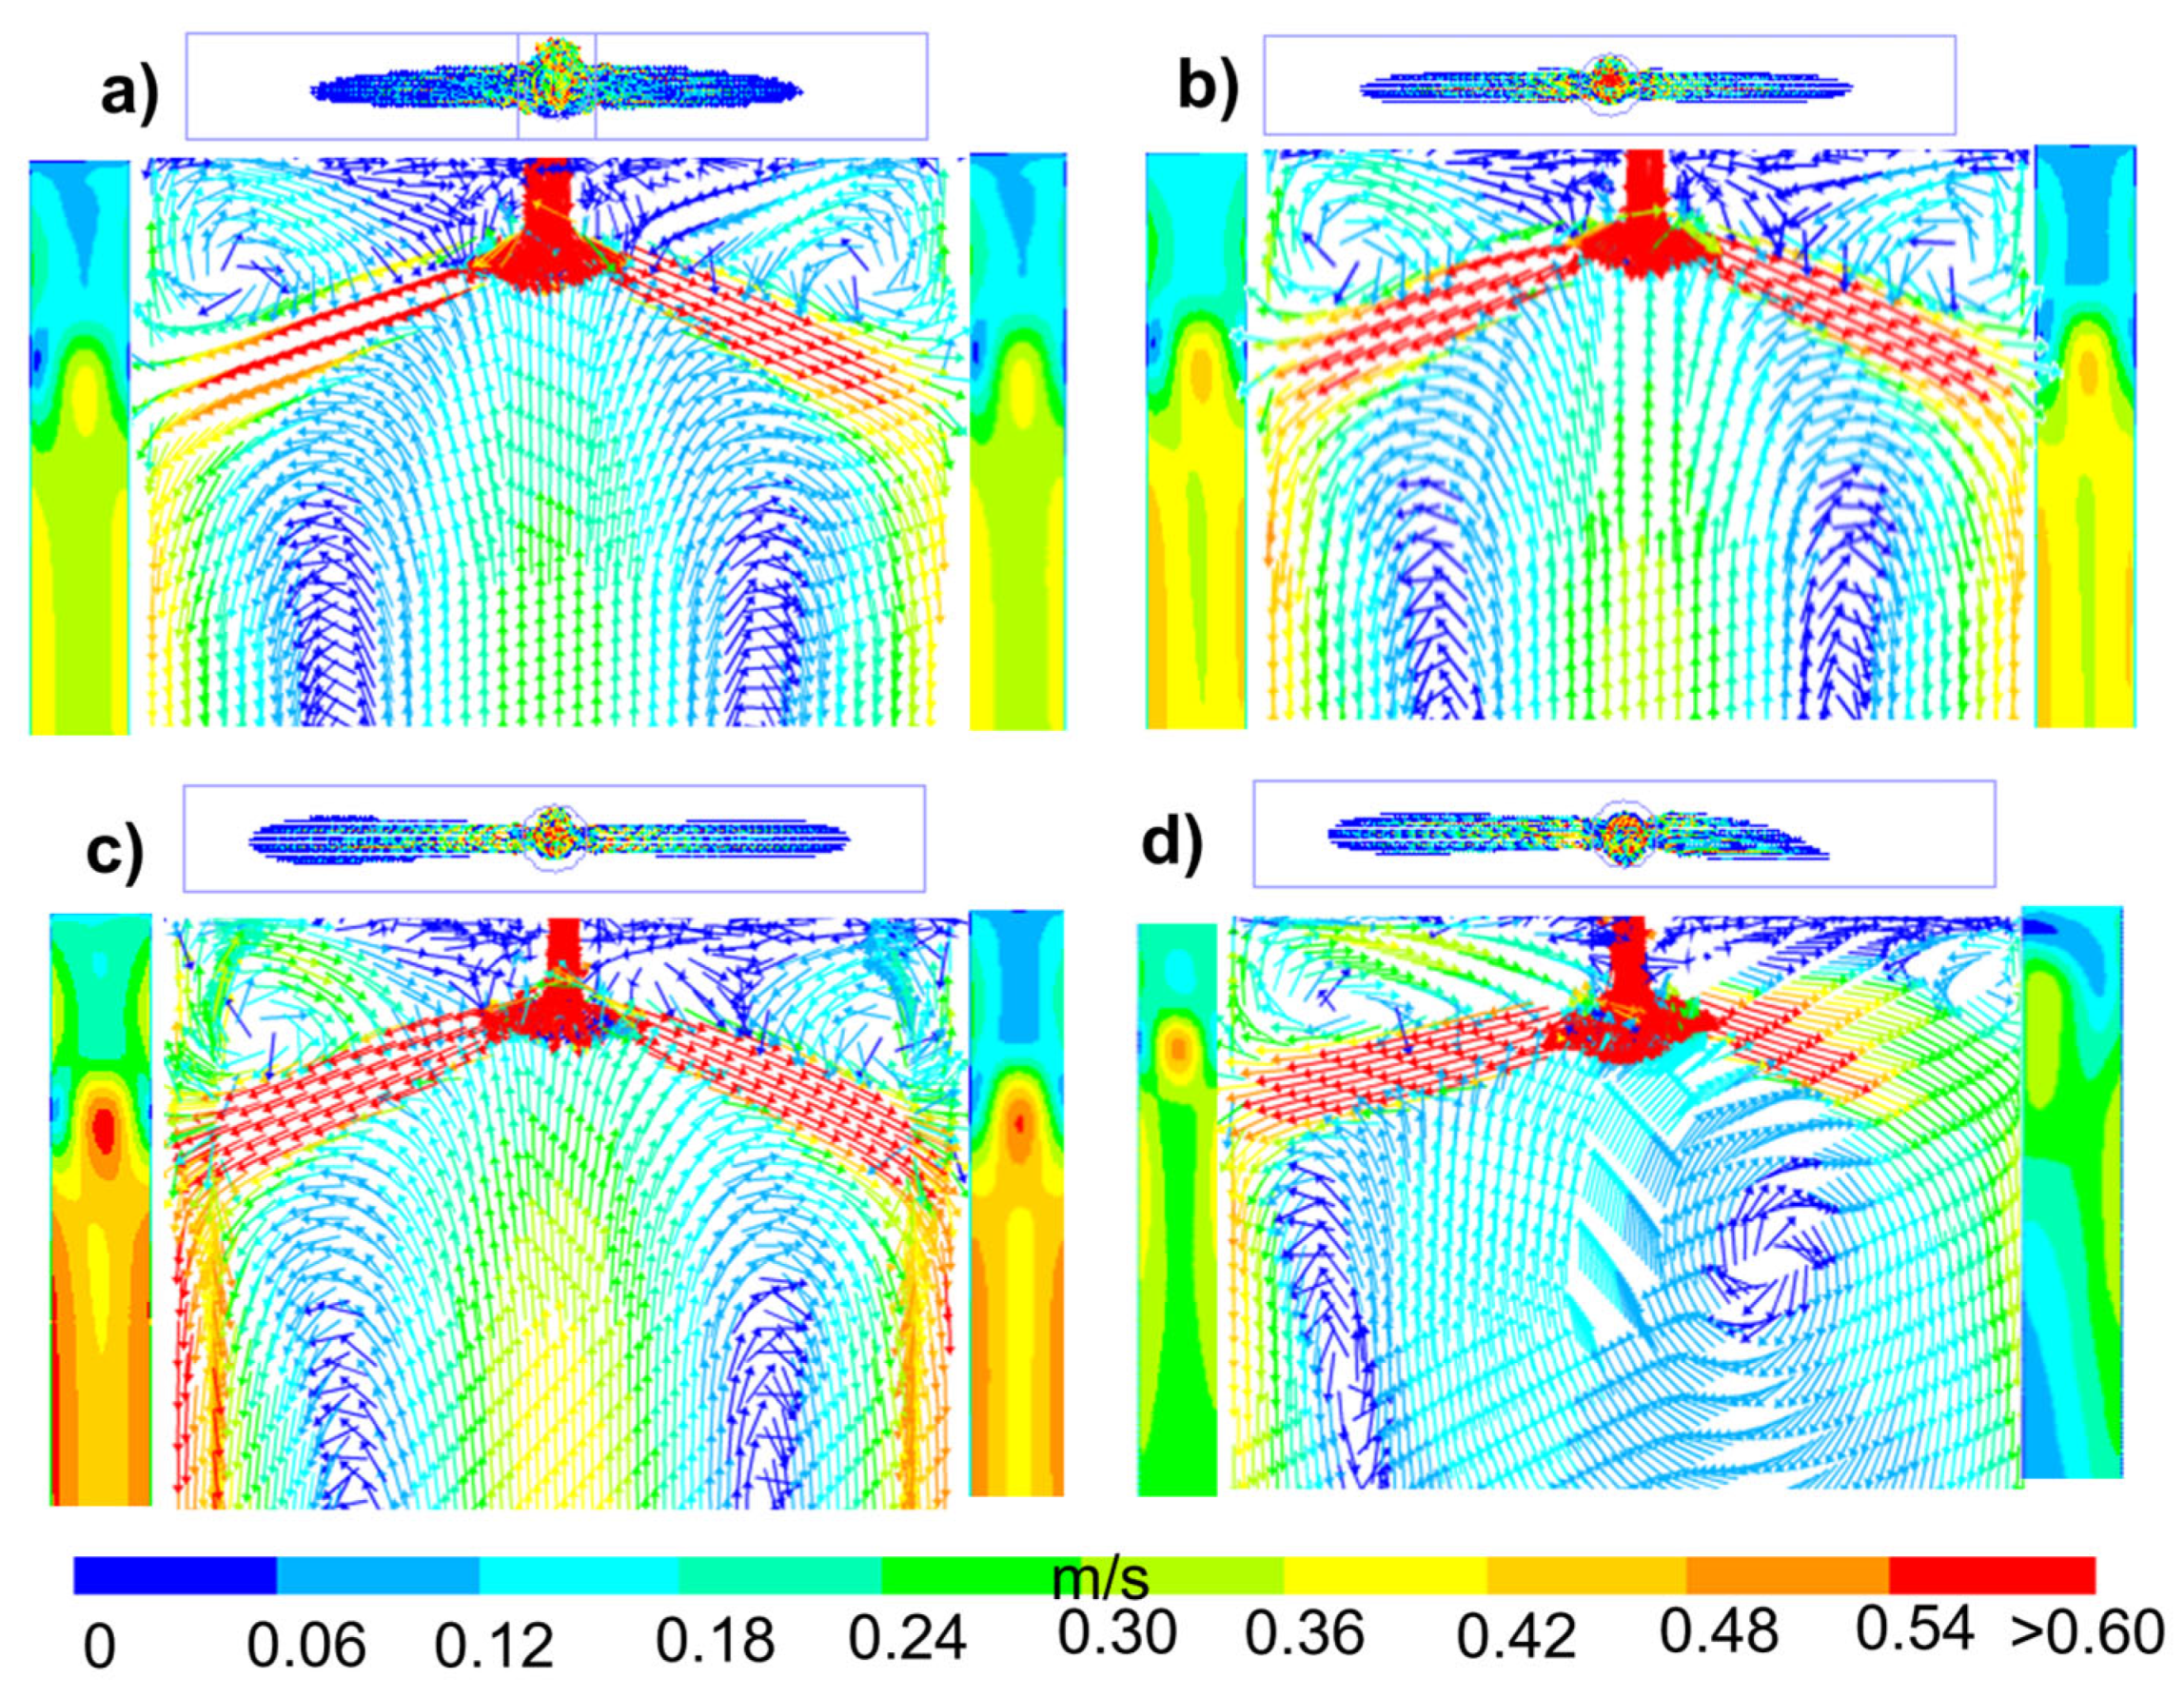
To analyze globally the mold steel behavior induced by the different stages of nozzle clogging, Figure 10 shows three different perspectives of the flow structure for each case: first, at the top section, the jet structure is shown from a top view of the velocity vectors with fixed size; second, the general flow patterns are presented in a velocity vector field at the longitudinal central symmetrical plane of the mold; and third, the velocity contours near the narrow faces are shown for both sides of the mold.
It is important to note that all the velocity information presented in Figure 10 was acquired at the same velocity range. The results indicate that the asymmetry between the right and left jets increases as the clogging increases, with the right jet being the narrowest. Consequently, the left jet impacts the narrow face with a higher velocity than the right jet, resulting in an upper roll flow on the left side with higher velocities than on the right. This last observation becomes more pronounced as the clogging increases.
The lower roll flows also change in velocity intensity and not so much in structure, inducing an increment of velocity magnitude in the narrow faces; all this applies only for the first three cases. In contrast, for case 4, the typical roll flows have changed considerably, and the upper roll flows are considerably asymmetric since the left one is much larger than the right one, which has almost disappeared. This flow pattern is also observed in the lower roll flows, but in the opposite way since the left lower roll flow is much smaller.
This flow behavior is a consequence of the jet structure since both jets have changed: first, the right jet has lost its typical form of jet and now leaves the SEN port as a rotating stream (see Figure 10d) and moves towards the frontal mold wall and, second, the left jet, which comes from the port with less clogging (see Figure 10d), leaves the nozzle with higher velocity than the other cases and has a smaller angle of penetration.
Since the left jet has a greater mass flow than the right one and even higher in comparison with the first three cases, it is expected that its velocity and its impact velocity magnitude on the narrow face will increase, which is not taking place since the velocity of the left jet does not show any evident increase and its impact velocity is smaller than in case 3.
This unexpected velocity behavior comes from a left jet movement change detected since this jet does not leave the SEN port with the typical downward displacement; instead, this jet presented a rotational movement, which comes from the pair of recirculations in the nozzle pool, and as a consequence, the jet flow transfers its momentum to the surrounding fluid, resulting in a loss of energy, explaining why the expected velocity increment does not happen.
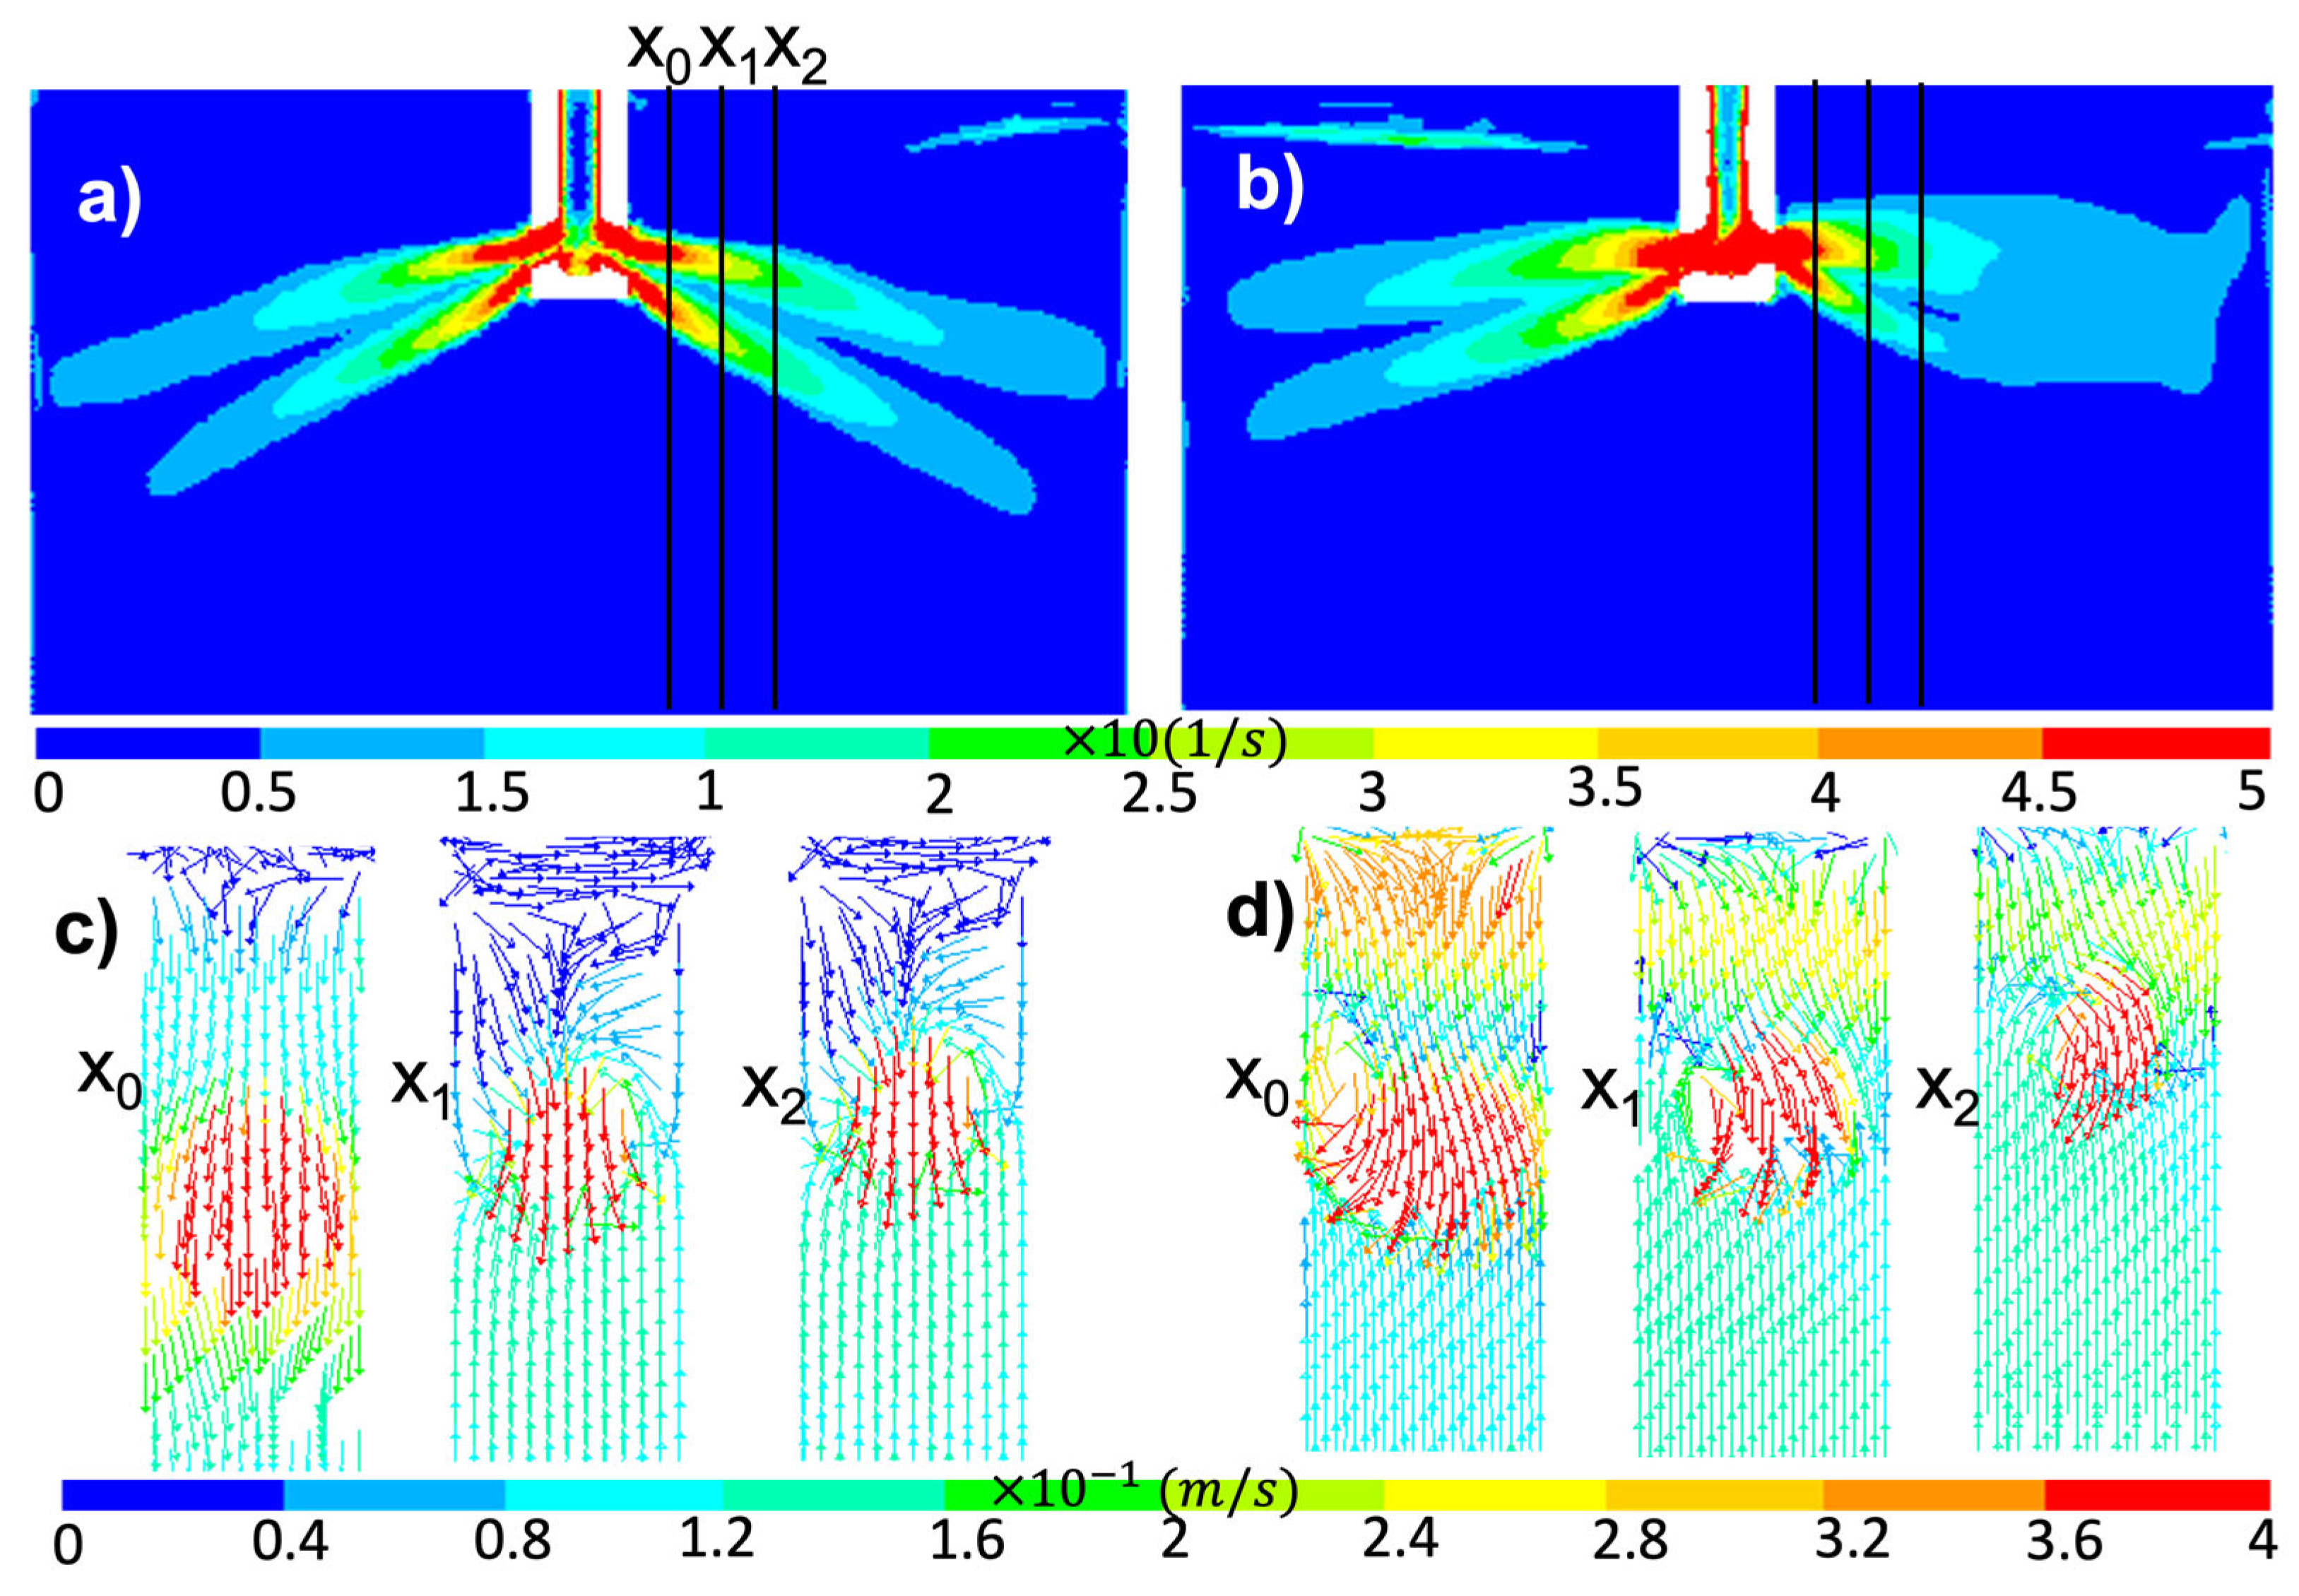
To further support this phenomenon, vorticity contours at the symmetrical central frontal plane and velocity vector fields at three lateral planes (at x 0 = 0.2 m, x 1 = 0.3 m, and x 2 = 0.5 m) for cases 3 and 4 are analyzed in Figure 11.
The results from Figure 11 show an increase in the vorticity magnitude and area of the left jet in C4, indicating that its flow has higher changes in its direction around the jet than in case 3. The velocity vector fields corroborate this since the fluid shows the mentioned rotating movement of the left jet flow for C4; in contrast, it does not happen in C3, where the flow descends straight without significant changes in direction. This analysis explains why the left jet arrives at the narrow walls with a smaller velocity than in C3.
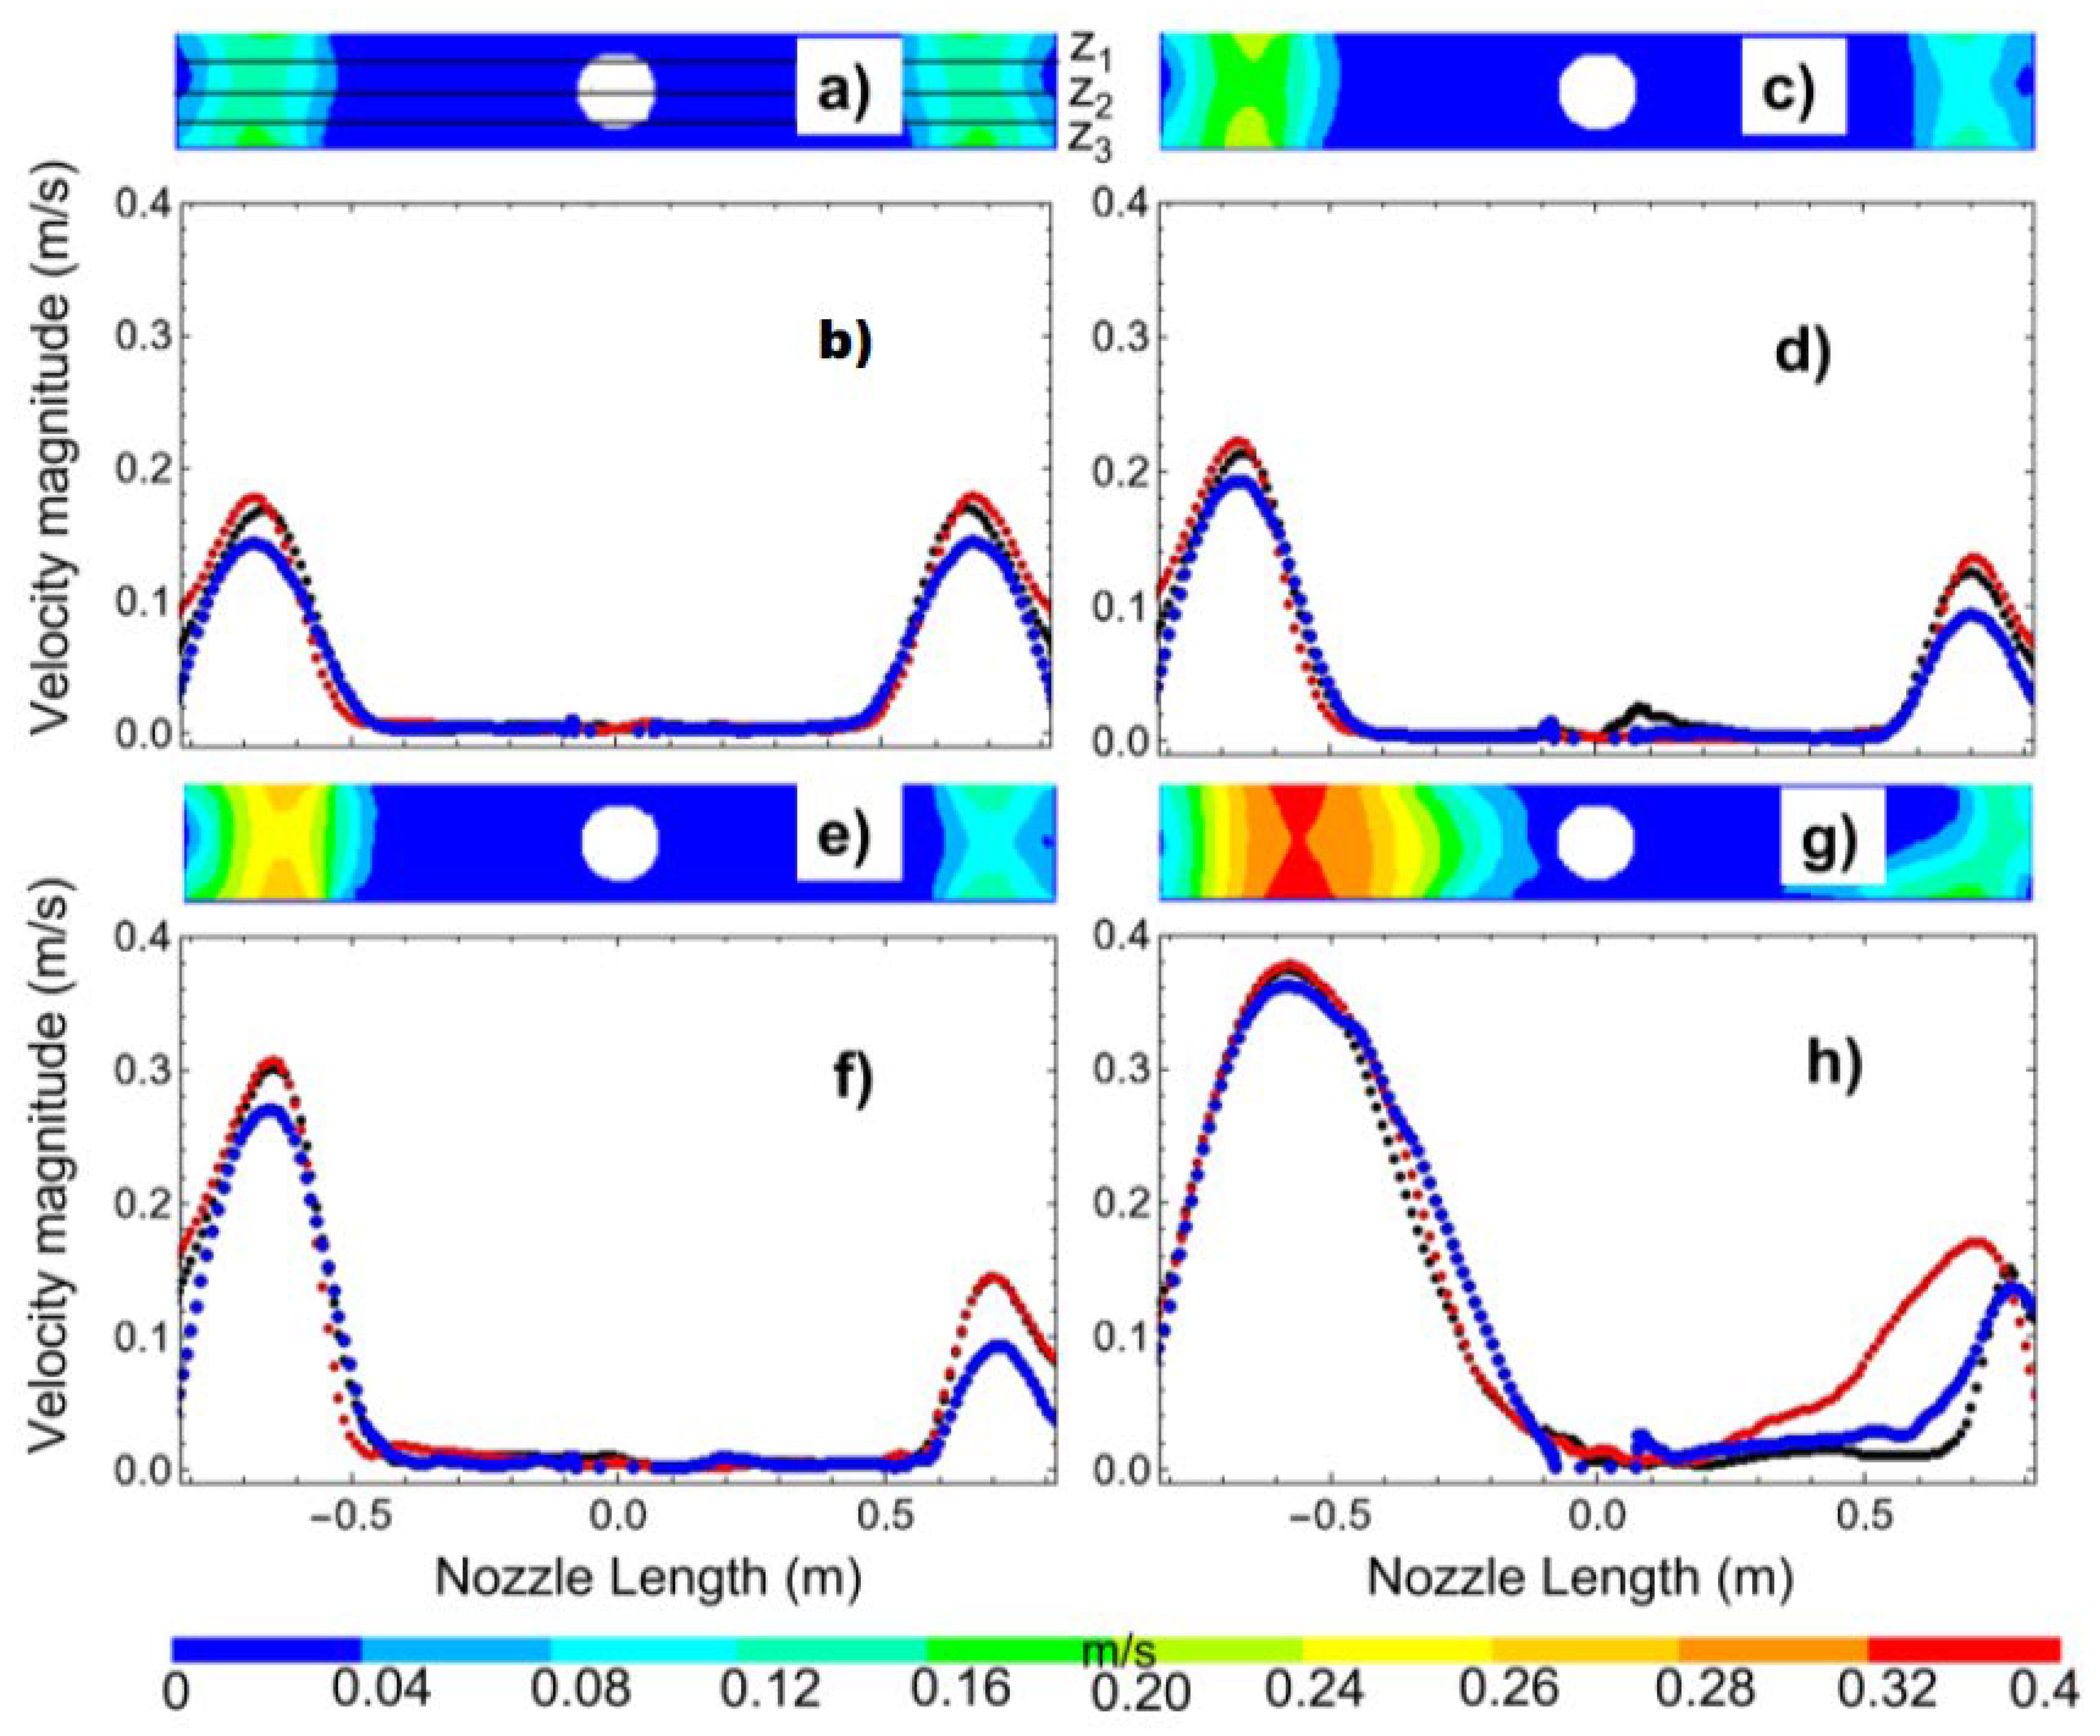
Finally, it is essential to analyze the meniscus stability since it depends on mold fluid dynamics and, consequently, on the effects of nozzle clogging. To start the analysis, the velocity magnitude at the meniscus level is studied by velocity contours in a transversal plane at the bath-level position and by velocity values acquired along three lines at the same position; see all these results in Figure 12 and the line position in Figure 12a The results show maximum velocity values near the narrow mold walls with asymmetries between the right and left sides; such asymmetries present an increment as the nozzle clogging increases, where the highest values are consistently on the left side for all cases.
Since the asymmetries mentioned are notorious, it is important to quantify them. This can be performed using the symmetrical index ( S ) [40], which requires comparing the velocities along two longitudinal lines located at the free surface. The comparison is completed using a pair of equidistant points at each time, one point along line l 1 at x 1 position and the other along line l 2 at - x 1 position (see Figure 13 for the point schematization) and so on until 50 pairs of points are reached. All the collected information is used to calculate a value representing the symmetry on the free surface, which is the symmetrical index S calculated as follows:
S = 1 n i n m i n u M i , u N i m a x u M i , u N i
where n is the number of pair of points along the lines, the subscript i takes values from 1 to n , the bidimensional velocity is u = u x 2 + u y 2 , M i indicates the points taken along line l 1 , and N i denotes points taken on line l 2 . If the value of S is close to 1, it implies a perfect ideal symmetry, but if S is close to zero, it means the flow symmetry is completely broken. The symmetrical index values obtained for each case are shown in Table 1.
From this table, contrasting all cases with C1, C2 presents a decrement of about 50%, C3 presents a decrement of 64%, and C4 presents a decrement of 78%. These values indicate that for a nozzle without clogging, the symmetry in the free surface is high but not fully symmetrical, but this symmetry decreases rapidly as the clogging increases. It is important to notice that although cases 4 and 5 have the same clogging level, the difference in the reduction of the symmetry index compared to the reference case is not negligible since case 3 predicts a symmetry index higher than the real clogged nozzle; quantifying such difference, C3 predicts 66% more symmetry than C4. For this reason, using nozzles with symmetrical reductions leads to an attenuation of the asymmetries of the fluid flow in the mold. Consequently, it may induce an attenuation of the non-uniformity in the temperature flow distribution, as well as the non-uniform development of the solidified shell.

4. Conclusions

This study analyzes the fluid dynamics induced by a nozzle with a real clogging versus the fluid dynamics induced by a nozzle using symmetrical reductions in its geometry to simulate the same clogging stage. The analysis led to the following conclusions:
(1)
When the SEN clogging is too severe, it will modify the fluid dynamics inside the SEN to the point that the effect of the slide gate aperture disappears, as shown in the present research when the real nozzle clogging was applied.
(2)
The natural SEN inner wall irregularities, induced by a realistic SEN clogging simulation, produce strong flow rotational movement inside the SEN pool, generating rotational jets and altering the symmetry flow patterns in the mold.
(3)
Nozzles with symmetric reductions to simulate real clogging can only qualitatively reflect the expected fluid dynamic patterns. Their estimated results are quantitatively inaccurate given errors of up to 38% in the estimated nozzle velocity and 25% for the meniscus velocities.
(4)
The use of symmetric reductions in SEN geometry to simulate real clogging fails to reliably show the fluid dynamics inside it. Such simplification additionally leads to inaccurate predictions of jet behavior, mold flow symmetry, the bath-level velocity magnitudes, and the meniscus stability.
(5)
Uniform symmetrically reduced nozzles may be carefully used in studies that require detailed fluid analysis near the internal SEN wall. This is because a SEN with real clogging induces strong velocity variations near the wall due to its natural irregularities.

5. Future Work

This work clearly demonstrates the strong effect of SEN wall irregularities on overall flow behavior. Consequently, a comprehensive fluid dynamics analysis is needed to examine their impact on flow separation, the boundary layer, and inclusion transport, incorporating a near-wall study with more accurate turbulence models, such as the Shear Stress Transport k–ω turbulence model or the Re-Normalization Group k–ε turbulence model.

Author Contributions

Conceptualization, E.G. and S.G.-H.; methodology, A.L. and E.G.; software, A.L. and E.G.; validation R.M.-D. and E.G.; formal analysis, S.G.-H. and E.G.; investigation, A.L. and E.G.; writing—original draft preparation, E.G.; writing—review and editing, S.G.-H. and R.M.-D.; visualization, S.G.-H. and R.M.-D.; supervision, J.d.J.B. All authors have read and agreed to the published version of the manuscript. All authors have read and agreed to the published version of the manuscript.

Funding

This research received no external funding.

Acknowledgments

The authors thank TecNM-ITM and SNI for their permanent support of the Academic Research Group on Simulation of Materials Processing and Fluid Dynamics. The authors also acknowledge the SECIHTI program and Project CBF2023-2024-268, Hadronic Physics at JLab: Deciphering the Internal Structure of Mesons and Baryons, funded under the 2023–2024 Frontier Science Call.

Conflicts of Interest

The authors declare no conflicts of interest.

References

  1. Bai, H.; Thomas, B.G. Effects of Clogging, Argon Injection, and Continuous Casting Conditions on Flow and Air Aspiration in Submerged Entry Nozzles. Metall. Mater. Trans. B 2001, 32, 707–722. [Google Scholar] [CrossRef]
  2. Basu, S.; Kumar, S.; Girase, N.U. Nozzle Clogging Behaviour of Ti-bearing Al-killed Ultra Low Carbon Steel. ISIJ Int. 2004, 44, 1653–1660. [Google Scholar] [CrossRef]
  3. Thomas, B.G.; Bai, H. Tundish Nozzle Clogging—Application of Computational Models. In Proceedings of the 18° Process Technology Division Conference Proceedings, Iron and Steel Society, Warrendale, PA, USA, 25–28 March 2001; Volume 18, pp. 895–912. [Google Scholar]
  4. Deng, Z.; Zhu, M.; Zhong, B.; Sichen, D. Attachment of Liquid Calcium Aluminate Inclusions on Inner Wall of Submerged Entry Nozzle during Continuous Casting of Calcium-Treated Steel. ISIJ Int. 2014, 54, 2813–2820. [Google Scholar] [CrossRef]
  5. Tian, C.; Yu, J.; Jin, E.; Wen, T.; Jia, D.; Liu, Z.; Fu, P.; Yuan, L. Effect of Interfacial Reaction Behaviour on the Clogging of SEN in the Continuous Casting of Bearing Steel Containing Rare Earth Elements. J. Alloys Compd. 2019, 792, 1–7. [Google Scholar] [CrossRef]
  6. Barati, C.; Wu, M.; Kharicha, A.; Ludwig, A. Role of Solidification in Submerged Entry Nozzle Clogging during Continuous Casting of Steel. Steel Res. Int. 2010, 91, 2000230. [Google Scholar] [CrossRef]
  7. Nadif, M.; Lehmann, J.; Burty, M.; Domgin, J.F. Control of Steel Reoxidation and CC Nozzle Clogging: An Overview. Metall. Res. Technol. 2007, 104, 493–500. [Google Scholar] [CrossRef]
  8. Yang, W.; Zhang, L.; Ren, Y.; Chen, W.; Liu, F. Formation and Prevention of Nozzle Clogging during the Continuous Casting of Steels: A Review. ISIJ Int. 2024, 64, 1–20. [Google Scholar] [CrossRef]
  9. Kojola, N.; Ekerot, S.; Jönsson, P. Pilot Plant Study of Clogging Rates in Low Carbon and Stainless-Steel Grades. Ironmak. Steelmak. 2011, 38, 81–89. [Google Scholar] [CrossRef]
  10. Kojola, N.; Ekerot, S.; Andersson, M.; Jönsson, P. Pilot Plant Study of Nozzle Clogging Mechanisms during Casting of REM Treated Stainless Steels. Ironmak. Steelmak. 2011, 38, 1–11. [Google Scholar] [CrossRef]
  11. Gutiérrez, E.; García-Hernández, S.; de Jesús Barreto, J. Mathematical Analysis of the Dynamic Effects on the Deposition of Alumina Inclusions Inside the Upper Tundish Nozzle. ISIJ Int. 2016, 56, 1394–1403. [Google Scholar] [CrossRef]
  12. Ni, P.; Jonsson, L.; Ersson, M.; Jönsson, P. Transport and Deposition of Non-Metallic Inclusions in Steel Flows—A Comparison of Different Model Predictions to Pilot Plant Experiment Data. Steel Res. Int. 2017, 88, 1700155. [Google Scholar] [CrossRef]
  13. Sasai, K.; Mizukami, Y. Mechanism of Alumina Adhesion to Continuous Caster Nozzle with Reoxidation of Molten Steel. ISIJ Int. 2001, 41, 1331–1339. [Google Scholar] [CrossRef]
  14. Barati, H.; Wu, M.; Holzmann, T.; Kharicha, A.; Ludwig, A. Simulation of Non-metallic Inclusion Deposition and Clogging of Nozzle. In Proceedings of the Minerals, Metals & Materials Series, Modeling and Simulation in Materials Processing 2018, Phoenix, AZ, USA, 11–15 March 2018; pp. 149–158. [Google Scholar]
  15. Vermeulen, Y.; Coletti, B.; Blanpain, B.; Wollants, P.; Vleugels, J. Material Evaluation to Prevent Nozzle Clogging during Continuous Casting of Al Killed Steels. ISIJ Int. 2002, 42, 1234–1240. [Google Scholar] [CrossRef]
  16. Long, M.; Zuo, X.; Zhang, L.; Chen, D. Kinetic Modeling on Nozzle Clogging during Steel Billet Continuous Casting. ISIJ Int. 2010, 50, 712–720. [Google Scholar] [CrossRef]
  17. Wu, S.; Zhang, J.; Li, Z. Mathematic Model of SEN Clogging During Continuous Casting of Steel. J. Iron Steel Res. Int. 2010, 17, 6–9. [Google Scholar] [CrossRef]
  18. Singh, S.N. Mechanism of Alumina Buildup in Tundish Nozzles During Continuous Casting of Aluminum-Killed Steels. Metall. Trans. 1974, 5, 2165–2178. [Google Scholar] [CrossRef]
  19. Lavers, J.D.; Kadar, L. Application of Electromagnetic Forces to Reduce Tundish Nozzle Clogging. Appl. Math. Model. 2004, 28, 29–45. [Google Scholar] [CrossRef]
  20. Gutiérrez, E.; Garcia-Hernandez, S.; Barreto, J.d.J.; Morales, R.; Gonzáles-Solorzano, M.G. Decrease of Nozzle Clogging through Fluid Flow Control. Metals 2020, 10, 1420. [Google Scholar] [CrossRef]
  21. Gonzáles-Solorzano, M.G.; Morales, R.; Gutiérrez, E.; Guarneros, J.; Chattopadhyay, K. Analysis of Fluid Flow of Liquid Steel Through Clogged Nozzles: Thermodynamics Analysis and Flow simulation. Steel Res. Int. 2020, 91, 2000049. [Google Scholar] [CrossRef]
  22. Saha Roy, P.D.; Tiwari, P.K. Knowledge Discovery and Predictive Accuracy Comparison of Different Classification Algorithms for Mould Level Fluctuation Phenomenon in thin Slab Caster. J. Intell. Manuf. 2016, 30, 241–254. [Google Scholar] [CrossRef]
  23. Kumar, M.; Mishra, P.; Roy, A. Experimental Optimization of Submerged Entry Nozzle Submergence Depth to Reduce Meniscus Fluctuations: A Water Model Study. Mater. Today Proc. 2020, 41, 426–430. [Google Scholar] [CrossRef]
  24. Jeon, Y.J.; Sung, H.J.; Lee, S. Flow Oscillations and Meniscus Fluctuations in a Funnel-Type Water Mold Model. Metall. Mater. Trans. B 2010, 41, 121–130. [Google Scholar] [CrossRef]
  25. Wang, Z.; Shan, Q.; Cui, H.; Pan, H.; Lu, B.; Shi, X.; Wen, J. Characteristic Analysis of Mold Level Fluctuation during Continuous Casting of Ti-Bearing IF Steel. J. Mater. Res. Technol. 2024, 31, 1367–1378. [Google Scholar] [CrossRef]
  26. Hua, C.; Wang, M.; Senk, D.; Wang, H.; Zhang, Q.; Zhi, J.; Bao, Y. Cone Clogging of Submerged Entry Nozzle in Rare Earth Treated Ultra-Low Carbon Al-Killed Steel and Its Effect on the Flow Field and Vortex in the Mold. Metals 2021, 11, 662. [Google Scholar] [CrossRef]
  27. Srinivas, P.S.; Singh, A.; Korath, J.M.; Jana, A.K. A Water-Model Experimental Study of Vortex Characteristics Due to Nozzle Clogging in Slab Caster Mould. Ironmak. Steelmak. 2016, 44, 473–485. [Google Scholar] [CrossRef]
  28. Hibbeler, L.C.; Thomas, B.G. Mold Slag Entrainment Mechanisms in Continuous Casting Molds. Iron Steel Technol. 2013, 10, 121–136. [Google Scholar]
  29. Zhao, P.; Li, Q.; Kuang, S.; Zou, Z. Mathematical Modeling of Liquid Slag Layer Fluctuation and Slag Droplets Entrainment in a Continuous Casting Mold Based on VOF-LES Method. High Temp. Mater. Process. 2017, 36, 551–565. [Google Scholar] [CrossRef]
  30. Zheng, L.; Malfliet, A.; Wollants, P.; Blanpain, B.; Guo, M. Effect of Alumina Morphology on the Clustering of Alumina Inclusions in Molten Iron. ISIJ Int. 2016, 56, 926–935. [Google Scholar] [CrossRef]
  31. Girase, N.U.; Basu, S.; Choudhary, S.K. Development of Indices for Quantification of Nozzle Clogging during Continuous Slab Casting. Ironmak. Steelmak. 2007, 34, 506–512. [Google Scholar] [CrossRef]
  32. Wang, R.; Li, H.; Guerra, F.; Cathcart, C.; Chattopadhyay, K. Predicting Quantitative Indices for SEN Clogging in Continuous Casting Using Long Short-term Memory Time-series Model. ISIJ Int. 2022, 62, 2311–2318. [Google Scholar] [CrossRef]
  33. Bai, H.; Thomas, B.G. Turbulent Flow of Liquid Steel and Argon Bubbles in Slide-Gate Tundish Nozzles: Part I. Model Development and Validation. Metall. Mater. Trans. B 2001, 32, 253–267. [Google Scholar] [CrossRef]
  34. Bai, H.; Thomas, B.G. Turbulent Flow of Liquid Steel and Argon Bubbles in Slide-Gate Tundish Nozzles: Part II. Effect of Operation Conditions and Nozzle Design. Metall. Mater. Trans. B 2001, 32, 269–284. [Google Scholar] [CrossRef]
  35. Wang, Y.; Fang, Q.; Zhang, H. Effect of Argon Blowing Rate on Multiphase Flow and Initial Solidification in a Slab Mold. Metall. Mater. Trans. B 2020, 51, 1088–1100. [Google Scholar] [CrossRef]
  36. Gonzalez-Solorzano, M.G.; Morales, R.; Guarneros, J.; Calderon-Ramos, I.; Muñiz-Valdes, C.R.; Najera-Bastida, A. Unsteady Fluid Flows in the Slab Mold Using Anticlogging Nozzles. Fluids 2022, 7, 288. [Google Scholar] [CrossRef]
  37. Miki, Y.; Kitaoka, H.; Sakuraya, T.; Fujii, T. Mechanism for Separating Inclusions from Molten Steel Stirred with a Rotating Magnetic Field. ISIJ Int. 1992, 32, 142–149. [Google Scholar] [CrossRef]
  38. Li, B.; Lu, H.; Shen, Z.; Sun, X.; Zhong, Y.; Ren, Z.; Lei, Z. Physical Modeling of Asymmetrical Flow in Slab Continuous Casting Mold due to Submerged Entry Nozzle Clogging with the Effect of Electromagnetic Stirring. ISIJ Int. 2019, 59, 2264–2271. [Google Scholar] [CrossRef]
  39. Zhang, L.; Wang, Y.; Zuo, X. Flow Transport and Inclusion Motion in Steel Continuous-Casting Mold under Submerged Entry Nozzle Clogging Condition. Metall. Mater. Trans. B 2008, 39, 534–550. [Google Scholar] [CrossRef]
  40. Li, B.; Lu, H.; Zhong, Y.; Ren, Z.; Lei, Z. Influence of EMS on Asymmetric Flow with Different SEN Clogging Rates in a Slab Continuous Casting Mold. Metals 2019, 9, 1288. [Google Scholar] [CrossRef]
  41. Kumar, M.; Mishra, P.; Roy, A. Influence of Submerged Entry Nozzle Port Blockage on the Meniscus Fluctuation Considering Various. Metals 2020, 10, 269. [Google Scholar] [CrossRef]
  42. Lee, W.; Kim, J.G.; Jung, J.; Huh, K.Y. Prediction of Nozzle Clogging through Fluid–Structure Interaction in the Continuous Steel Casting Process. Steel Res. Int. 2021, 92, 2000549. [Google Scholar] [CrossRef]
  43. Launder, B.E.; Spalding, D.B. The numerical computation of turbulent flows. Comput. Methods Appl. Mech. Eng. 1974, 3, 269–289. [Google Scholar] [CrossRef]
  44. ANSYS Inc. FLUENT 12.0, User’s Guide; Centerra Resource Park, Cavendish Court: Lebanon, NH, USA, 2009. [Google Scholar]
  45. Bai, H.; Ni, P.; Ersson, M.; Zhang, T.; Jönsson, P.G. Effect of swirling flow tundish submerged entry nozzle outlet design on multiphase flow and heat transfer in mould. Ironmak. Steelmak. 2019, 46, 911–920. [Google Scholar] [CrossRef]
  46. Linder, S. Hydrodynamics and Collisions of Small Particles in a Turbulent Metallic Melt with Special Reference to Deoxidation of Steel. Scand. J. Metall. 1974, 3, 137–150. [Google Scholar]
  47. Okada, N.; Funagane, H.; Toh, T. Numerical Analysis Study for Clogging Behavior of Immersion Nozzle (Technical Report). Nippon Steel Tech. Rep. 2020, 124, 43–48. [Google Scholar]
  48. Barati, H.; Wu, M.; Kharicha, A.; Ludwig, A. A transient model for nozzle clogging. Powder Technol. 2018, 329, 181–198. [Google Scholar] [CrossRef]
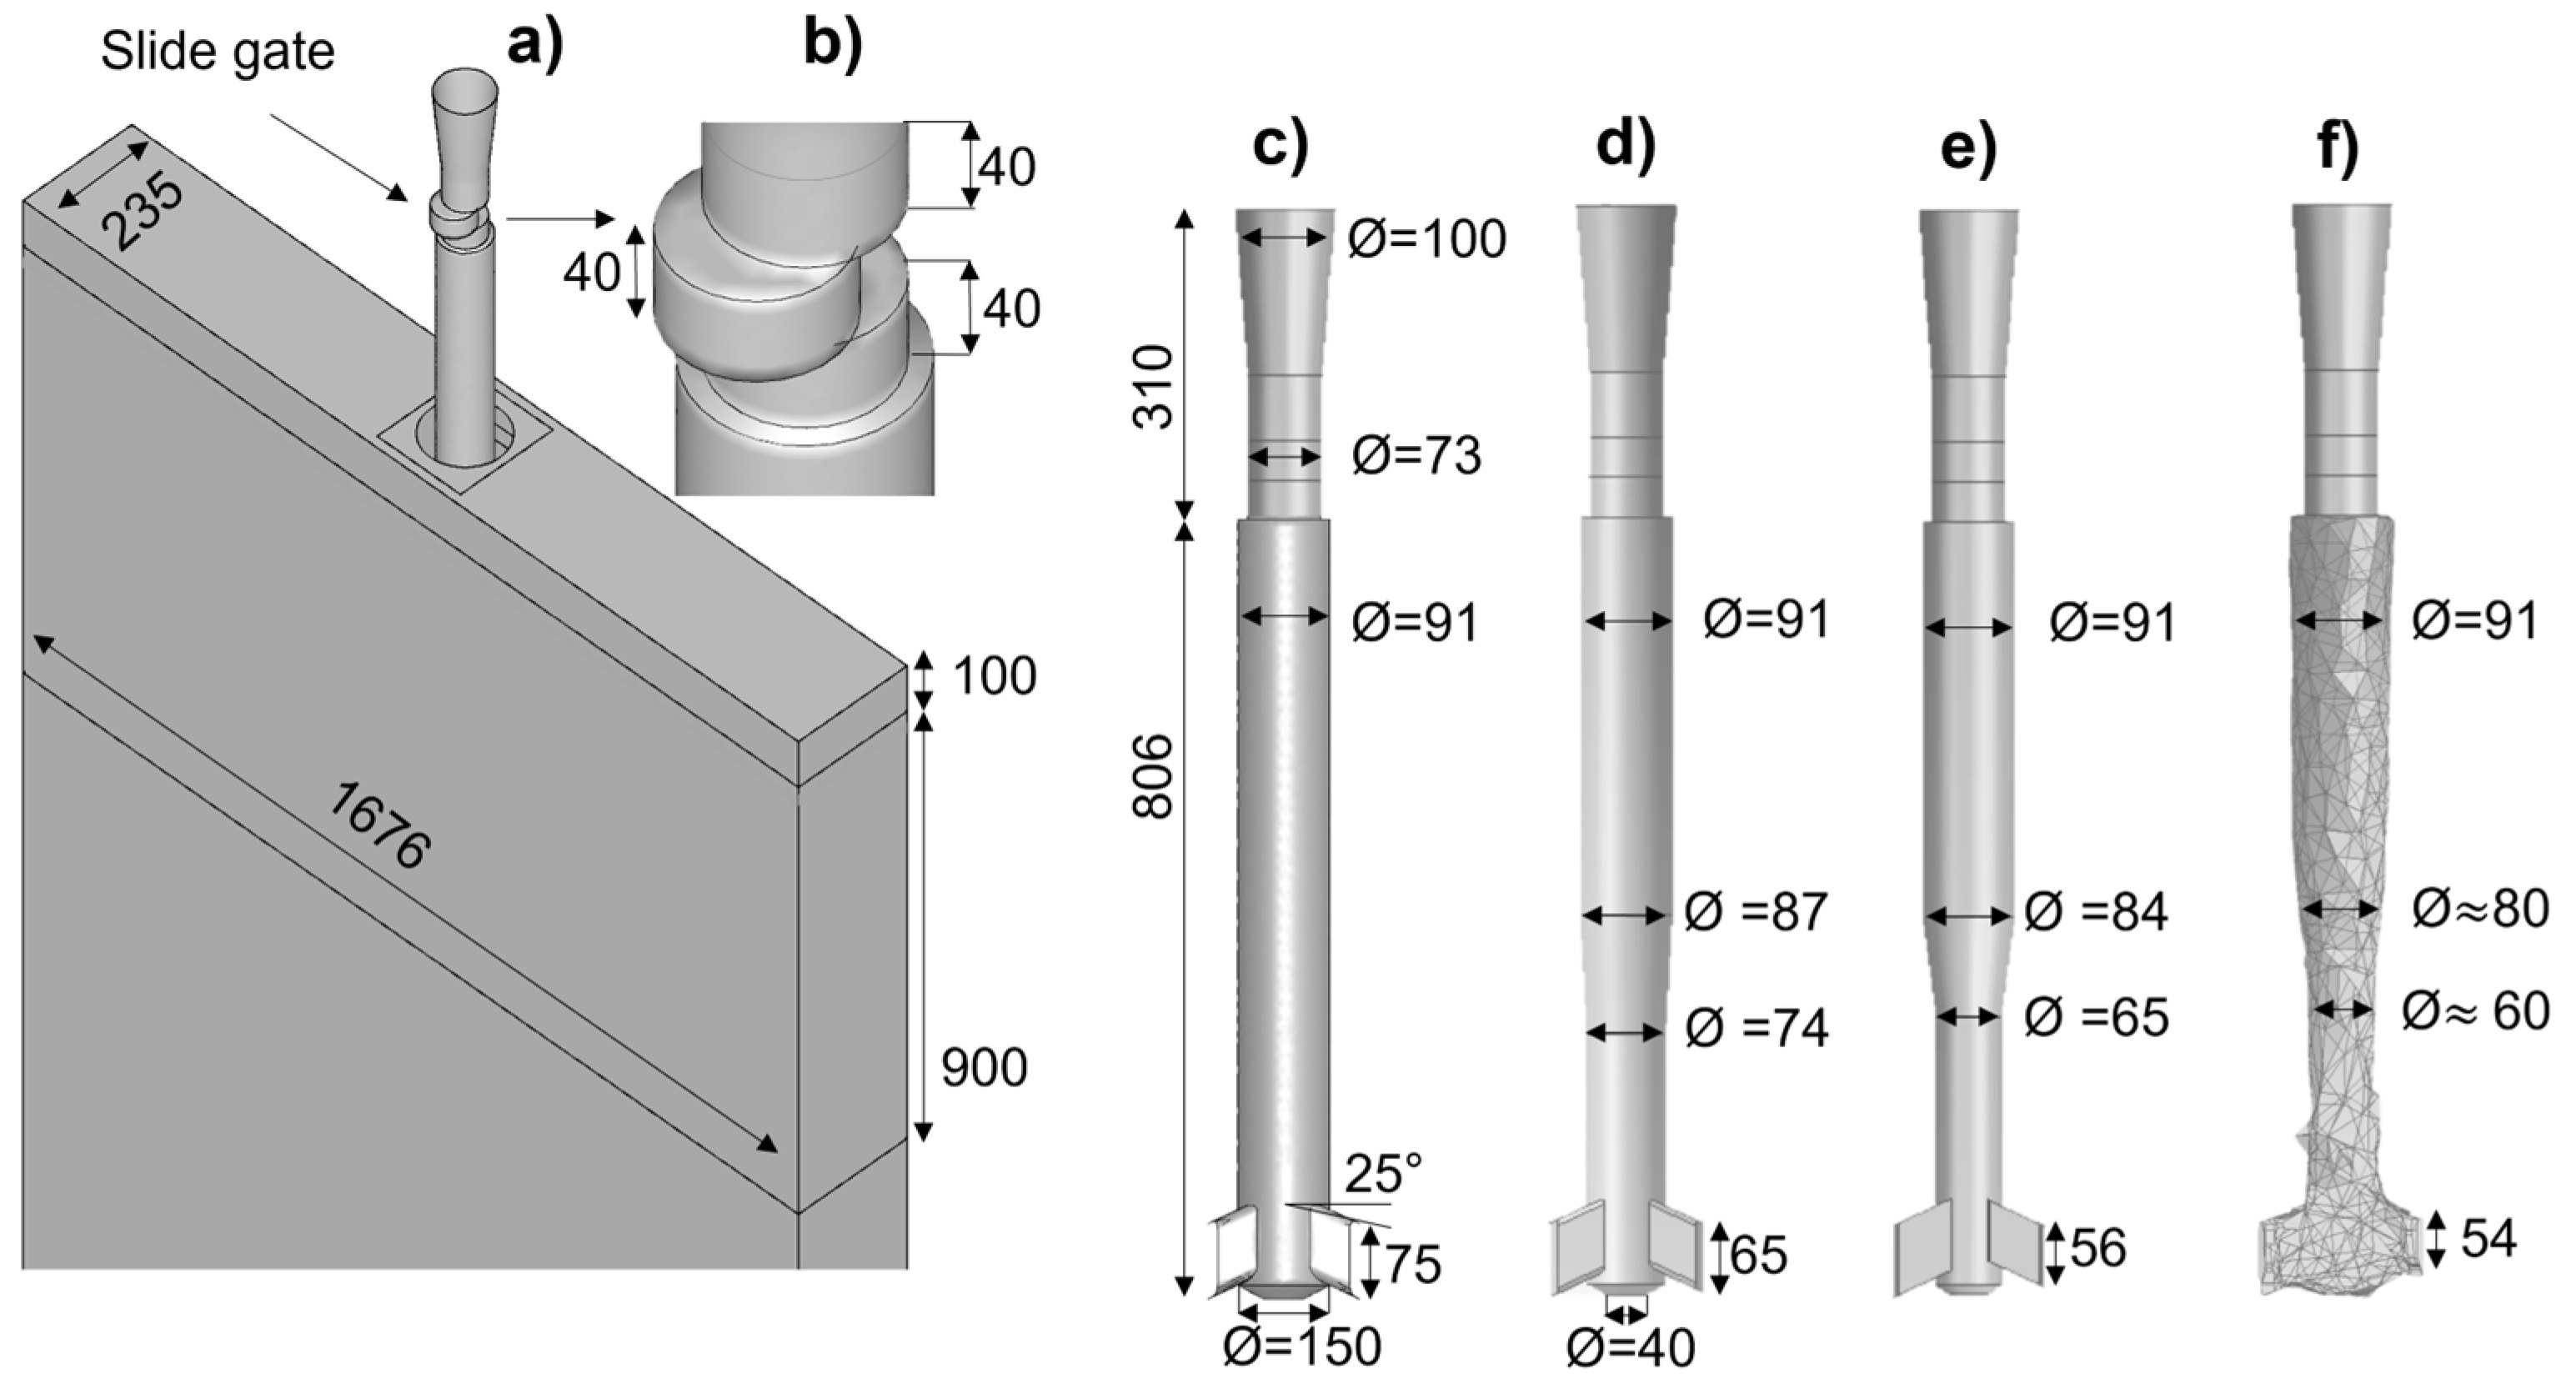
Figure 1. The geometry of the integrated system (mm): (a) the overall view, (b) a detailed view of the slide gate region, (c) nozzle C1, (d) nozzle C2, (e) nozzle C3, and (f) nozzle C4.
Crystals 15 00777 g001
Figure 2. The mesh of the integrated system: (a) a general view, (b) a close view of the SEN, (c) a close view of the mold, and SEN with clogging stage corresponding to (d) C2, (e) C3, and (f) C4.
Crystals 15 00777 g002
Figure 3. The internal view of the SEN core with severe clogging: (a) frontal view, (b) right view, and (c) left view.
Crystals 15 00777 g003
Figure 4. Tracer behavior at (a,b) 3 s, (c,d) 5 s, and (e,f) 7 s.
Crystals 15 00777 g004
Figure 5. (ad) Velocity contours in a frontal view of the nozzle, (eh) velocity contours in the lateral view, and (j) velocity magnitude along the central line of the nozzle.
Crystals 15 00777 g005
Figure 6. Velocity contours at three positions along the nozzle length, located at y = −0.6 m, y = −0.7 m, and y = −0.8 m, for all cases studied.
Crystals 15 00777 g006
Figure 7. Velocity magnitude as a function of the distance along the longitudinal centerline of the nozzle at three positions: y = –0.6 m, y = –0.7 m, and y = –0.8 m.
Crystals 15 00777 g007
Figure 8. Wall shear stress in the SEN for all cases studied: (a) contours in an isometric view and (b) calculated values as a function of the distance along the SEN centerline at y = –0.8 m.
Crystals 15 00777 g008
Figure 9. Fixed velocity vectors ( m / s ) at the central lateral plane of the SEN and at the left and right outlet ports: (a) C1, (b) C2, (c) C3, and (d) C4.
Crystals 15 00777 g009
Figure 10. Fixed velocity vector (m/s) in the longitudinal symmetric plane of the mold and velocity contours in a vertical plane located 5 mm from the narrow walls: (a) C1, (b) C2, (c) C3, and (d) C4.
Crystals 15 00777 g010
Figure 11. (a,b) Vorticity contours in the longitudinal symmetric plane and (c,d) fixed velocity vector fields in three vertical planes ( x 0 = 0.2   m , x 1 = 0.3 m, and x 2 = 0.5 m).
Crystals 15 00777 g011
Figure 12. Velocity contours at the free surface and velocities magnitudes along lines z 1 , z 2 , and z 3 for (a,b) C1, (c,d) C2, (e,f) C3, and (g,h) C4.
Crystals 15 00777 g012
Figure 13. The scheme of the points on the free surface used to calculate the symmetrical index.
Crystals 15 00777 g013
Table 1. Values of the symmetrical index (S) for all cases analyzed.
CaseC1C2C3C4
S0.80.40.290.18
Disclaimer/Publisher’s Note: The statements, opinions and data contained in all publications are solely those of the individual author(s) and contributor(s) and not of MDPI and/or the editor(s). MDPI and/or the editor(s) disclaim responsibility for any injury to people or property resulting from any ideas, methods, instructions or products referred to in the content.