Article

Surface-Mounted PMN-PT Piezoelectric Sensor with Time-Reversal Signal Processing for High-Strength Bolt Loosening Detection

1
School of Civil Engineering and Architecture, Taizhou University, Taizhou 318000, China
2
School of Civil Engineering, Chongqing Jiaotong University, Chongqing 400074, China
3
School of Civil Engineering, Tianjin University, Tianjin 300384, China
4
Key Laboratory of Intelligent Lifeline Protection and Emergency Technology for Resident ATY, Wenzhou University of Technology, Wenzhou 150080, China
*
Authors to whom correspondence should be addressed.
These authors contributed equally to this work.
Crystals 2025, 15(9), 768; https://doi.org/10.3390/cryst15090768
Submission received: 30 July 2025 / Revised: 27 August 2025 / Accepted: 27 August 2025 / Published: 29 August 2025
(This article belongs to the Special Issue Advanced High-Strength Steel)

Abstract

High-strength bolts play an essential role in connecting steel structural components across bridges, buildings, and machinery, thanks to their low cost and broad adaptability. However, prolonged exposure to complex loading and harsh environments can cause loosening, which increases the risk of structural distortion or catastrophic collapse. Conventional monitoring tools, such as strain gauges or fiber-optic sensors, often suffer from high expense, short service life, and poor early-warning performance. To overcome these challenges, this study presents a novel surface-mounted piezoelectric sensor built on lead magnesium niobate–lead titanate (PMN-PT) single crystals, selected for their superior piezoelectric constants, energy density, and low-frequency sensitivity. The sensor integrates a PMN-PT wafer, monolithic washer, epoxy resin encapsulation, and shielded cabling. It was experimentally validated through waterproofing and electrical tests across five working conditions, maintaining capacitance stability within 3.25% and infinite insulation resistance. Preload monitoring experiments were conducted using a time-reversal method, and a tightening index based on focused signal amplitude was proposed to quantify bolt-loosening conditions. Results confirmed a strong linear association (R2 = 0.986) between the focused signal amplitude and preload torque (0–120 N·m), with a maximum error of only 5.7% in validation trials under unknown torque. Overall, this PMN-PT-based sensor offers a cost-efficient, sensitive, and durable solution for early detection of bolt loosening in steel structures.

1. Introduction

As critical connecting elements, high-strength bolts are widely used in large-scale steel structures such as bridges, buildings, and mechanical systems. However, under the combined effects of structural vibrations [1,2] and extreme weather conditions, bolts can loosen, causing component misalignment or global instability, and potentially triggering severe safety incidents [3,4]. Consequently, developing highly sensitive bolt-loosening monitoring technologies capable of early warning is of urgent engineering significance to safeguard critical infrastructure.
Current mainstream monitoring approaches include visual inspection [5] and vibration-based methods [6,7,8]. Visual inspection, a conventional technique, relies heavily on operator expertise and lacks both quantitative loosening assessment and real-time monitoring capabilities. Vibration-based methods primarily focus on identifying structural damage at the global level and typically detect anomalies only after significant deterioration has occurred [9,10]. These methods have inherent limitations, especially in achieving reliable early-stage monitoring of severely degraded bolts. In order to address micro-damage detection and timely warning needs, recent research has focused on strain-gauge-based direct preload measurement [11]. This approach quantifies preload variations through stress–strain monitoring at bolt connections. Most existing methods determine the degree of bolt loosening by directly or indirectly observing preload levels. Common monitoring methods can be broadly categorized into direct methods and indirect methods, as summarized in Table 1. The direct measurement method involves monitoring the stress and strain generated at bolt locations. For example, Nelson et al. [11] summarized and proposed a direct preload measurement technique based on strain gauges. Jia et al. [12] proposed an indirect stress evaluation method using axial stress distribution analysis at nut locations. Nevertheless, strain gauges are susceptible to installation damage and environmental instability, limiting their application to bolts under ambient-temperature tensile loads within the elastic range.
With the advancement of smart materials, increasing attention has been given to their unique sensing-response capabilities. Ren et al. [13] developed an intelligent bolt that employs embedded fiber Bragg grating (FBG) sensors to simultaneously measure axial and shear forces. Li et al. [14] established a thermo-sensitive model of dual-metal-layer metal-coated FBG (MFBG) and analyzed the thermal sensitivity parameters of single-metal-layer MFBG and Ni/Ni-coated MFBG. Yang et al. [15] developed an embedded FBG sensor for bolt torque monitoring, demonstrating high reliability with an R2 > 0.98 between applied torque and wavelength shifts. However, high implementation costs and fiber fragility restrict their deployment in extreme environments or under dynamic loading scenarios. Sidorov et al. [16] proposed an IoT sensor node named Ten Sense M30, capable of accurately monitoring bolt joint preload. It offers secure non-line-of-sight communication over a distance of 800 m and has an expected service life of over five years. Liu et al. [7] proposed a bolt-loosening monitoring method based on APGDF and prototype networks, which achieves optimal detection by tapping near the loosened bolt position. This method is particularly effective in scenarios with insufficient samples and noise interference, such as single-bolt and multi-bolt loosening in complex tower structures. Li et al. [17] evaluated bolt connection faults in ring structures caused by nonlinear defects in terms of load and transfer functions. By applying harmonic excitation three times with appropriate amplitudes, they defined evaluation features based on nonlinear fault-induced load and transfer functions, ultimately establishing an effective evaluation method with sensitive local indicators for complex ring-like structures. Zhao et al. [18] proposed a digital image correlation (DIC)-based method for bolt preload monitoring by analyzing the strain field of the bolt head surface. Artificial speckles were sprayed onto the bolt head, and images before and after deformation were captured with a camera. Using DIC, the strain field of the bolt head surface was calculated, and the linear relationship between surface strain and bolt preload was used for monitoring.
Direct measurement methods generally suffer from constraints such as limited sensor placement and low monitoring accuracy. To overcome these challenges, indirect measurement methods have been proposed by researchers worldwide. For instance, line-marking methods were among the earliest indirect techniques for bolt-loosening monitoring. Huang et al. [19] conducted multi-mode loosening detection of threaded fasteners using both active sensing and impact methods, proposing a multimodal loosening detection approach that leverages the complementarity of ultrasonic and acoustic response signals. They introduced the concept of multi-scale cross-fuzzy entropy to map multimodal information into a unified feature space, thereby constructing more representative and effective loosening features. Redundant features were removed using linear discriminant analysis (LDA). Fu et al. [20] proposed a method using acoustic emission (AE) sensors and deep learning, which also reduces noise by filtering corresponding frequency components. After continuous wavelet transform (CWT), one-dimensional signal data were converted into two-dimensional image data. Convolutional neural networks (CNNs) were then employed to learn these image features and classify different degrees of bolt loosening. Li et al. [21] applied principal component and probability density analysis for diagnostic signal evaluation, successfully identifying bolt loosening levels. Coelho et al. [22] introduced regression algorithms to quantify torque loosening levels, aimed at pattern recognition, detection, and quantification of bolt joint torque loosening.
Even when the bolt system state was unknown, this machine learning classification method effectively identified and categorized torque loss by analyzing indirect vibration measurements. The challenge of recognizing and monitoring torque loosening stems from variability and nonlinear effects present in bolt joints. Chen et al. [23] was the first to attempt combining impact-based methods with both deep and shallow learning approaches to address the problem of underwater bolt flange loosening detection. Liang et al. [24] proposed a one-dimensional coupled model using electromechanical impedance (EMI) techniques, exciting structures with high-frequency sweeping signals (>20 kHz). Structural damage was then evaluated by detecting changes in coupled electromechanical parameters using resistive or conductive admittance through surface-mounted sensor–actuators. Shao et al. [25] applied the frequency shift method of piezoelectric impedance features to monitor bolt axial force, finding that sensitive high-frequency resonances mainly originated from the piezoelectric patch itself. As axial load increased, both resonance and anti-resonance frequencies showed a linear downward trend. Liao et al. [26] proposed a novel damage index (DI) by integrating piezoelectric impedance and ultrasonic-guided waves. By combining the two sensing technologies, they eliminated disadvantages of single-sensor approaches in signal interpretation, stability, and structural adaptability, enabling identification of early bolt loosening and crack damage. Sun and Zhang [27] developed a quantitative EMI (Q-EMI) method for measuring structural damping in bolt-loosening monitoring. This approach employed distributed thickness-shear mode piezoelectric transducers for selective excitation of vibration modes. Nguyen et al. [28] proposed a predictive simulation strategy to comprehensively study EMI response characteristics of smart interfaces subjected to typical functional degradation. Chen et al. [29] introduced a multi-resolution full-range bolt-tightening monitoring method using time shifts of direct and trailing waves. Based on the acoustoelastic effect and wave path summation, a theoretical model was established and a monitoring principle proposed. Tong et al. [30] presented a bolt condition identification method based on Lamb wave propagation models and imaging techniques. Han et al. [31] proposed an energy attenuation calibration formula for bolt preload length, addressing cylindrical guided-wave problems through ultrasonic energy attenuation. Xu et al. [32] and Na et al. [33] combined piezoelectric impedance techniques with neural networks to achieve effective damage identification, localization, and severity assessment, providing important references for health monitoring of bolt-sphere joints in large-span space structures. Fan et al. [34] proposed a signal-processing method to extract modulation information from complex response signals obtained under frequency sweep excitation. A nonlinear modulation index was defined to quantify the degree of bolt loosening. Finally, Razi et al. [35] employed an impact hammer to consistently excite systems. By striking pipelines and receiving vibrations with Piezoelectric (PZT) sensors attached to flange bolts, the signals were normalized and filtered, and empirical mode decomposition was applied to establish an effective energy-based damage index.
Perceptive materials possess the capability to sense physical or chemical changes in the external environment and are primarily used for the fabrication of sensors. Actuating materials, on the other hand, refer to those that respond to physical or chemical changes in the external environment, often being manufactured into actuators to control adverse structural responses. The characteristics of commonly used smart materials are summarized in Table 2.
In contrast, piezoelectric materials have emerged as promising alternatives due to their high sensitivity, rapid response, cost-effectiveness, and environmental stability [36]. In structural health monitoring (SHM), piezoelectric ceramics such as polyvinylidene fluoride (PVDF) [37] and lead zirconate titanate (PZT) [38] are typically fabricated into sensors or actuators for surface mounting or structural embedding [39,40,41,42]. Yang et al. [43] divided the concrete surface into multiple regions, where PZT patches were arranged in arrays. Each array was equipped with both a driver and a sensor, and frequency sweep excitation along with various pulse signals was applied, enabling stress monitoring of concrete in different regions. Ai et al. [44] employed raw admittance features measured from three embedded PZT sensors to extract effective structural mechanical impedance (ESMI) and structural mechanical impedance (SMI) features, which were then used for detecting impact damage in reinforced concrete structures. Pedro et al. [45] investigated the interplay between self-sensing capabilities and the piezoelectric properties of PZT and barium titanate (BT) in aluminum components. Their study demonstrated how BT and PZT particles were incorporated into AA2017-T451 aluminum to create self-sensing materials (SSMs) that respond to external stimuli. Under cyclic loading, these SSMs exhibited a linear correlation between load and electrical response, with sensitivity increasing at lower frequencies. Pedro et al. [46] further examined the sensorial properties of heat-treated AA7075-T651 aluminum plates embedded with PZT and BT particles via friction stir processing (FSP). The results showed that the sensitivity of AA7075-PZT was significantly higher than that of AA7075-BT, with AA7075-PZT achieving a maximum sensitivity of 15.27 × 10⁻⁴ μV/MPa, whereas AA7075-BT exhibited only 7.28 × 10⁻⁴ μV/MPa—52% lower. Ryan et al. [47] focused on developing ultrasonic additive manufacturing (UAM) composites with aluminum matrices embedded with shape memory NiTi, magnetostrictive Galfenol, and electroactive PVDF phases. Their research addressed (i) electrical insulation between NiTi and Al phases for strain sensing, modeling NiTi–Al composites as tunable stiffness materials and thermally invariant structures via the shape memory effect; (ii) process development and testing of Galfenol–Al composites; and (iii) creation of PVDF–Al composites for embedded sensing applications, including the development of a PVDF–Al composite sensor. Philipp et al. [48] evaluated the feasibility of embedding eddy current (EC) sensors for non-destructive testing (NDT) into selective laser melting (SLM) components for SHM. A robust embedding process for EC sensors was developed, ensuring sensor survivability during the harsh conditions of laser powder bed fusion (LPBF). Shao et al. [49] developed a piezoelectric impedance frequency-shift method to estimate bolt preload, designing and manufacturing an experimental device capable of precisely controlling the axial preload of bolts for bolt-loosening detection in engineering structures. Jiang et al. [41] quantified multi-bolt loosening by extracting nonlinear features from stress wave signals, using recurrence plots (RP), phase trajectories, and recurrence quantification analysis (RQA). Garrett et al. [50] introduced an artificial intelligence approach employing acoustic-emission-based SHM to estimate fatigue crack length in thin metal plates. Sun and Wang [51] applied lead magnesium niobate–lead titanate (PMN-PT) material onto the surface of concrete, subjecting specimens to both linear and impact loads. By monitoring the time-domain signal variations of the piezoelectric material, dynamic stress monitoring of concrete was achieved. Results indicated that PMN-PT exhibited superior sensing characteristics under impact loading. Duddi et al. [42] monitored concrete Young’s modulus and crack development through passive sensing technologies, including vibration and acoustic emission (AE). Sha et al. [52] developed an embedded intelligent piezoelectric sensor specifically for SHM of concrete structures.
Linear ultrasonic energy dissipation and time-of-flight delay effects derived from piezoelectric ceramic sensors have been widely applied for bolt-loosening detection [53]. Wang et al. [54,55] identified limitations in early-stage detection using ultrasonic propagation across bolted interfaces, noting that energy dissipation stabilizes once preload surpasses critical thresholds. However, environmental interference significantly undermines ultrasonic-based methods, as external noise disrupts wave propagation and hinders practical implementation. To address this, Fink’s time-reversal technique (1998) [56,57] enables phase compensation and signal-energy focusing, yielding noise-immune signal reconstruction. While extensively applied for enhancing structural damage detection [58,59], its application to high-strength bolt-loosening monitoring remains underexplored. From the research outcomes, it can be observed that ultrasonic techniques possess advantages such as a wide frequency response range, low energy consumption, and broad propagation distance, making them widely used in metal and composite material detection [60]. However, they also suffer from shortcomings, including frequency sensitivity, susceptibility to noise interference, and severe scattering in concrete structures. The impedance method has been widely applied for real-time monitoring of localized damage and enables effective damage localization. Nonetheless, its strict frequency requirements limit it to local and surface monitoring, and its accuracy for detecting internal structural damage still requires improvement. Passive monitoring methods that leverage the direct piezoelectric effect can effectively reduce monitoring costs and are commonly employed for overall structural damage detection. However, for localized monitoring, passive approaches still demand further research.
From the perspective of prior research and the characteristics of PMN-PT single-crystal materials, most existing studies have employed traditional PZT ceramics (d33~600 pC/N) or resistive strain gauges as sensing elements. This study is pioneering in its use of PMN-PT single-crystal material (d33 > 2000 pC/N), whose piezoelectric constant is more than four times higher than that of PZT. Benefiting from the ultra-high piezoelectric performance of PMN-PT, sensors fabricated with this material achieve superior sensitivity and signal-to-noise ratio. This work presents a novel surface-mounted piezoelectric sensor based on PMN-PT single-crystal material, composed of a PMN-PT sheet, an integral washer, an epoxy encapsulation layer, and shielded wiring. Compared with conventional piezoelectric sensors, PMN-PT single crystals offer outstanding advantages in piezoelectric coefficients, energy density, and low-frequency sensitivity [61]. A series of fundamental performance tests and actuation experiments collectively verify the feasibility of the sensor for bolt preload monitoring. Furthermore, preload experiments incorporating the time-reversal (TR) algorithm demonstrate effective suppression of environmental noise through signal-energy focusing. Finally, a fastening index derived from the focused signal is proposed, enabling high-precision evaluation of bolt-loosening states. The application of the new PMN-PT material to bolt-loosening monitoring, owing to its excellent sensitivity and signal-to-noise performance, holds critical significance for enabling early warning and predictive maintenance of bolted connections.
2. Methodology

The TR algorithm is a mathematical technique that was first proposed in 1965 [62]. Later, Fink [56,57] and other scholars introduced the concepts of the time-reversal mirror and the time-reversal cavity. In simple terms, time-reversal technology refers to the process of performing a temporal inversion of the received signal, that is, reversing the order of the signal in time. In the frequency domain, this operation is equivalent to performing a phase conjugation. The time-reversal algorithm has been widely applied in the field of structural health monitoring. In this study, the same method is employed, with its fundamental principle outlined as follows: when dealing with complex propagation paths and environmental noise interference in practical engineering applications, the time-reversal method can effectively achieve adaptive signal-energy focusing and significantly improve the signal-to-noise ratio (SNR). Based on these advantages, this work utilizes the time-reversal algorithm to design the monitoring experiments.

Time-Reversal (TR) Algorithm

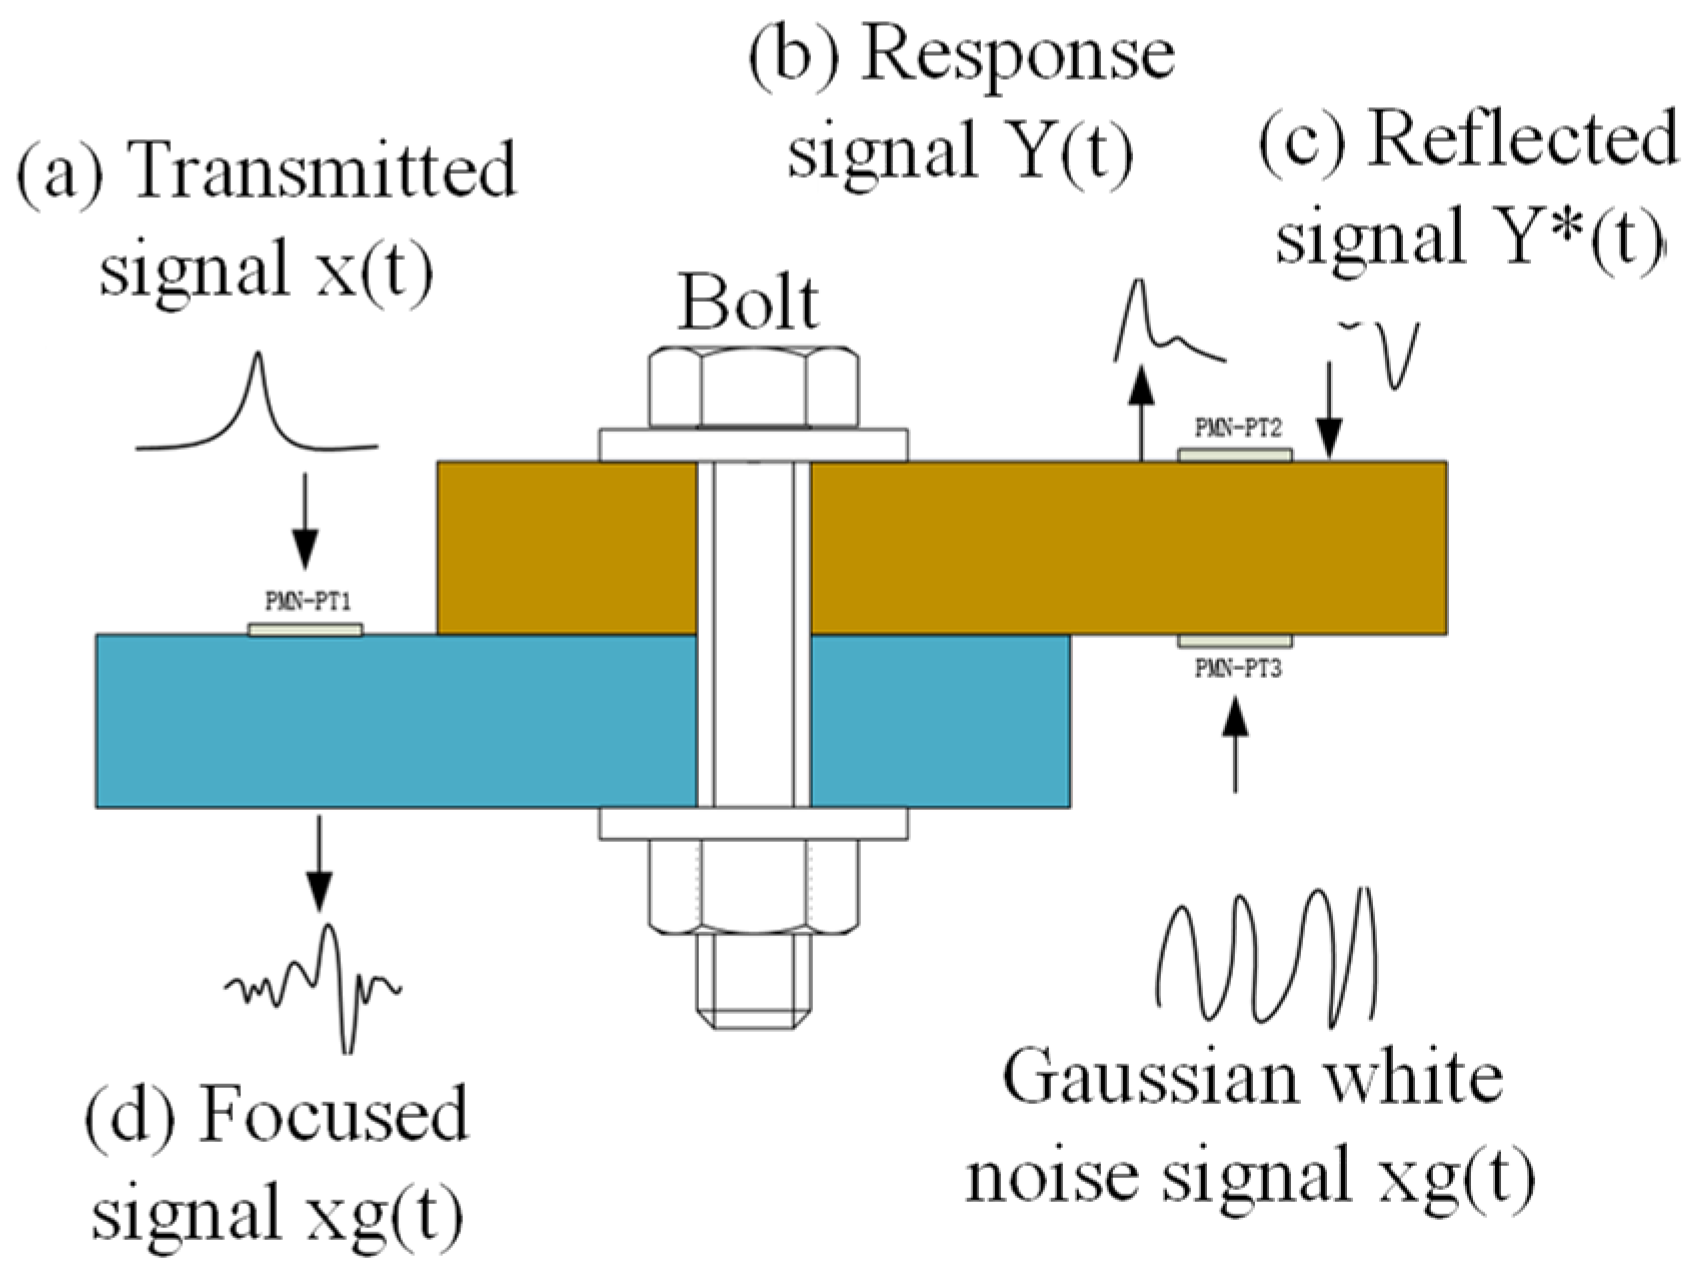
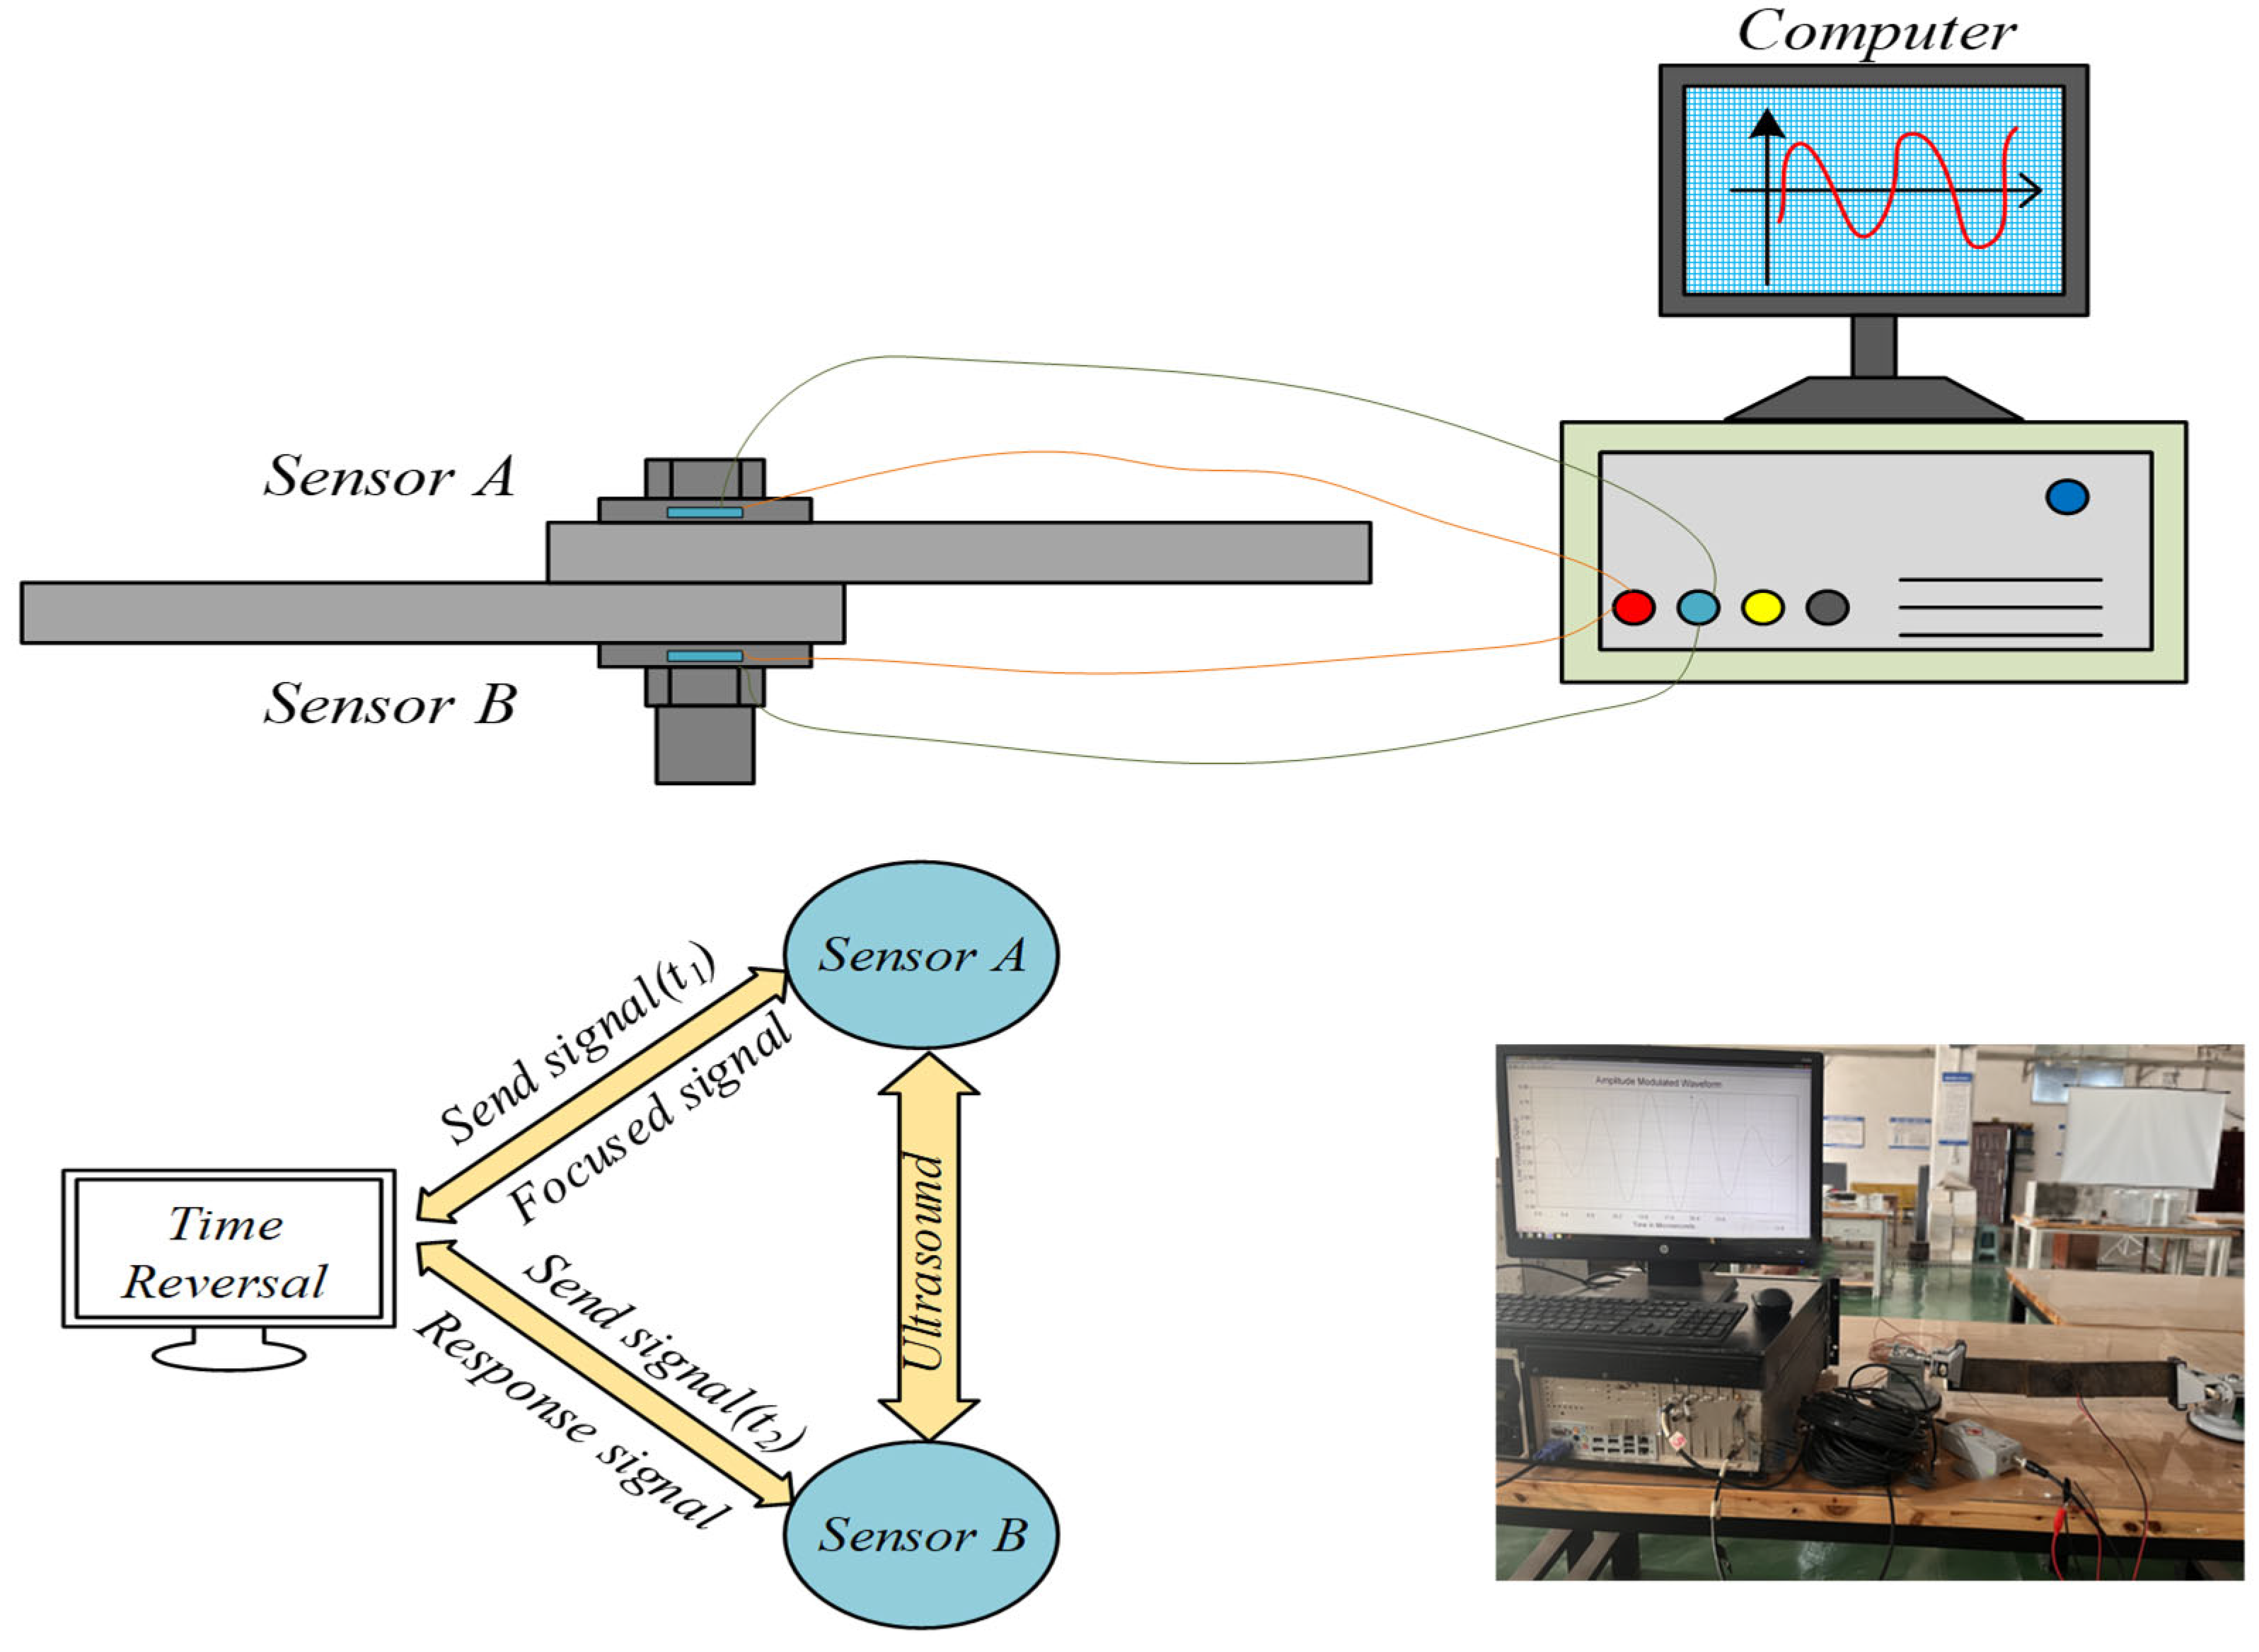
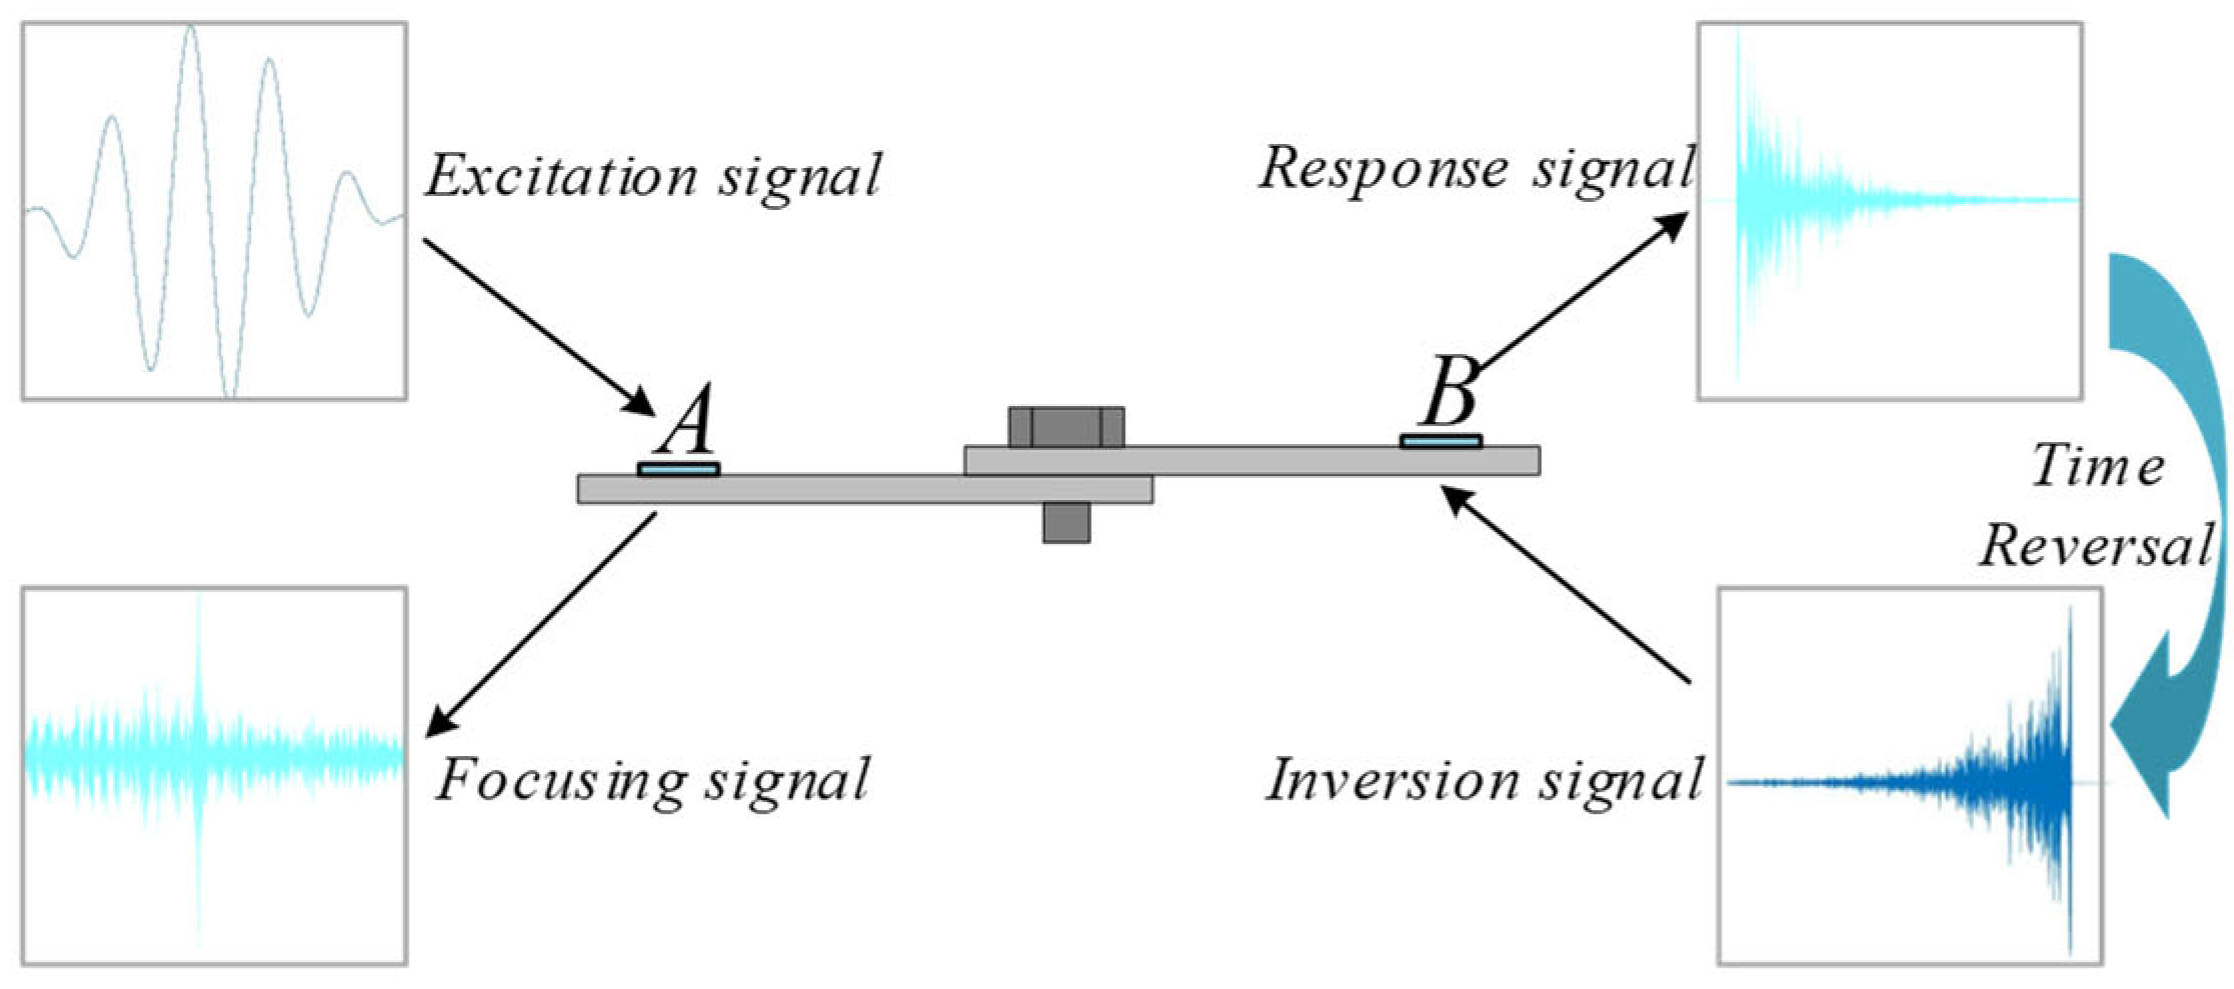
As shown in Figure 1, based on the positive and negative piezoelectric effects of piezoelectric materials [63], the Gaussian sinusoidal wave excited by Sensor A as a driver is denoted as x ( t ) , and the signal received by Sensor B is denoted as y ( t ) .
y ( t ) = x ( t ) h ( t )
where denotes the convolution operation, and h ( t ) represents the transfer function between the driver and the sensor. Applying the Fourier transform to Equation (1) yields Equation (2):
Y ( ω ) = X ( ω ) H ( ω )
where Y ( ω ) , X ( ω ) , and H ( ω ) represent the frequency-domain results of y ( t ) , x ( t ) , and h ( t ) , respectively. The signal y ( t ) received by the PMN-PT2 sensor is then processed by time reversal, resulting in the time-domain signal y ( t ) . Time reversal in the time domain corresponds to a phase-conjugate operation in the frequency domain.
Y ( ω ) = Y ( ω )
where denotes the complex conjugate operation, leading to Equation (4):
Y ( ω ) = X ( ω ) H ( ω )
According to the fundamental principle of the time-reversal algorithm, the propagation process from the source to the receiver and its return during stress-wave propagation are theoretically equivalent. Therefore, the time-reversed response signal Y ( ω ) from PMN-PT2, upon secondary excitation, is received by PMN-PT1 as the focused signal Y T R ( ω ) , defined by Equation (5):
Y T R ( ω ) = Y ( ω ) H ( ω ) = X ( ω ) H ( ω ) H ( ω )
For sine-wave, square-wave, and other symmetric signals, x ( t ) = x ( t ) holds, implying that in the frequency domain, X ( ω ) = X ( ω ) . Therefore, Equation (6) follows from Equation (5):
Y T R ( ω ) = X ( ω ) H ( ω ) H ( ω ) = X ( ω ) H ( ω ) 2
Applying the inverse Fourier transform to Equation (6) yields Equation (7):
y T R ( t ) = 1 2 π X ( ω ) | H ( ω ) | 2 e i ω t d ( ω )
To ensure that the time-reversal process focuses exclusively on phase adjustment of propagating waves without introducing additional coupling between the excitation signal and the medium’s transfer characteristics, maintaining independence between X ( ω ) and | H ( ω ) | is critical. Assuming parameter | H ( ω ) | 2 is independent of angular frequency ω , Equation (7) can be reformulated as Equation (8):
y T R ( t ) = C 0 x ( t )
where C 0 = | H ( ω ) | 2 . According to Equation (8), the excitation signal has similar mathematical properties to the focused signal. For example, the excitation signal x ( n ) = a δ ( n ) , where δ ( n ) is the unit pulse function and a its amplitude, leads to x ( 0 ) = a . Consequently, y T R ( 0 ) = a C 0 , showing that once the excitation amplitude is determined, the focused signal amplitude depends only on the transfer function between the two sensors. In addition, noise interference in the time-reversal algorithm has less impact when the excitation signal amplitude is low. Even when the transfer function is large, the time-reversal algorithm can still achieve effective signal monitoring.

3. Sensor Preparation and Performance Verification

This section describes the use of a self-developed Type-001 cut PMN-PT material to fabricate a novel surface-mounted piezoelectric sensor for bolt preload monitoring. To assess the feasibility of bolt preload monitoring, a series of performance evaluations were carried out, including waterproof capability tests, electrical performance tests, and capacitance characterization.

3.1. Sensor Preparation

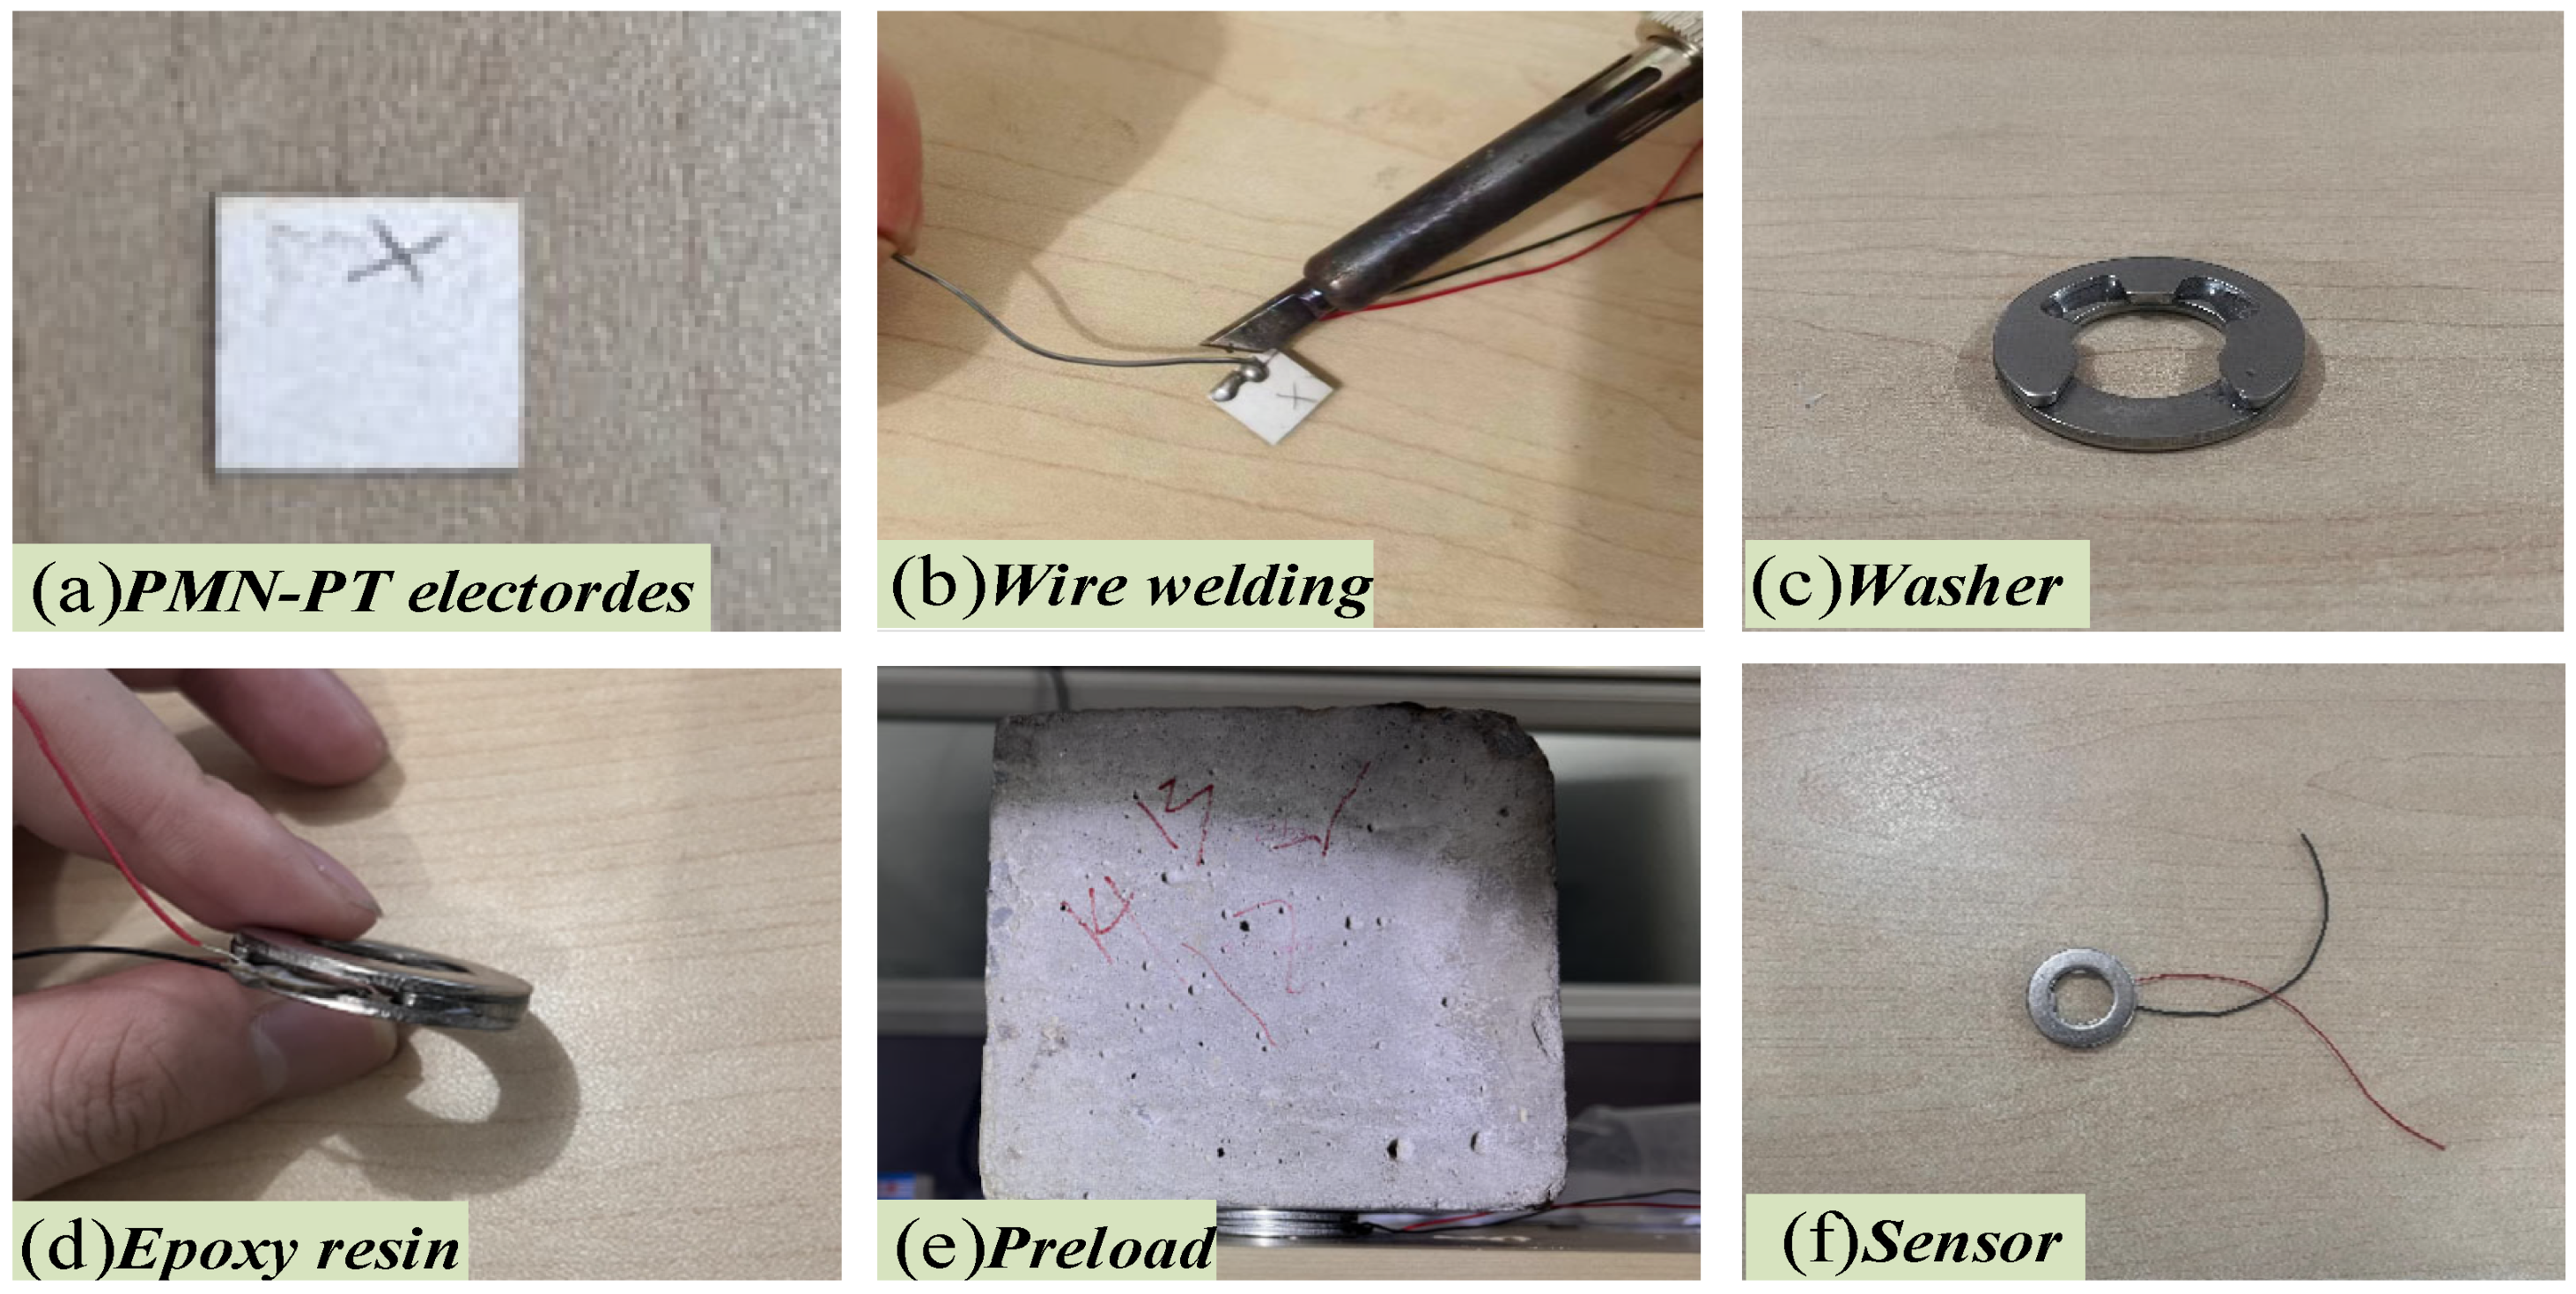
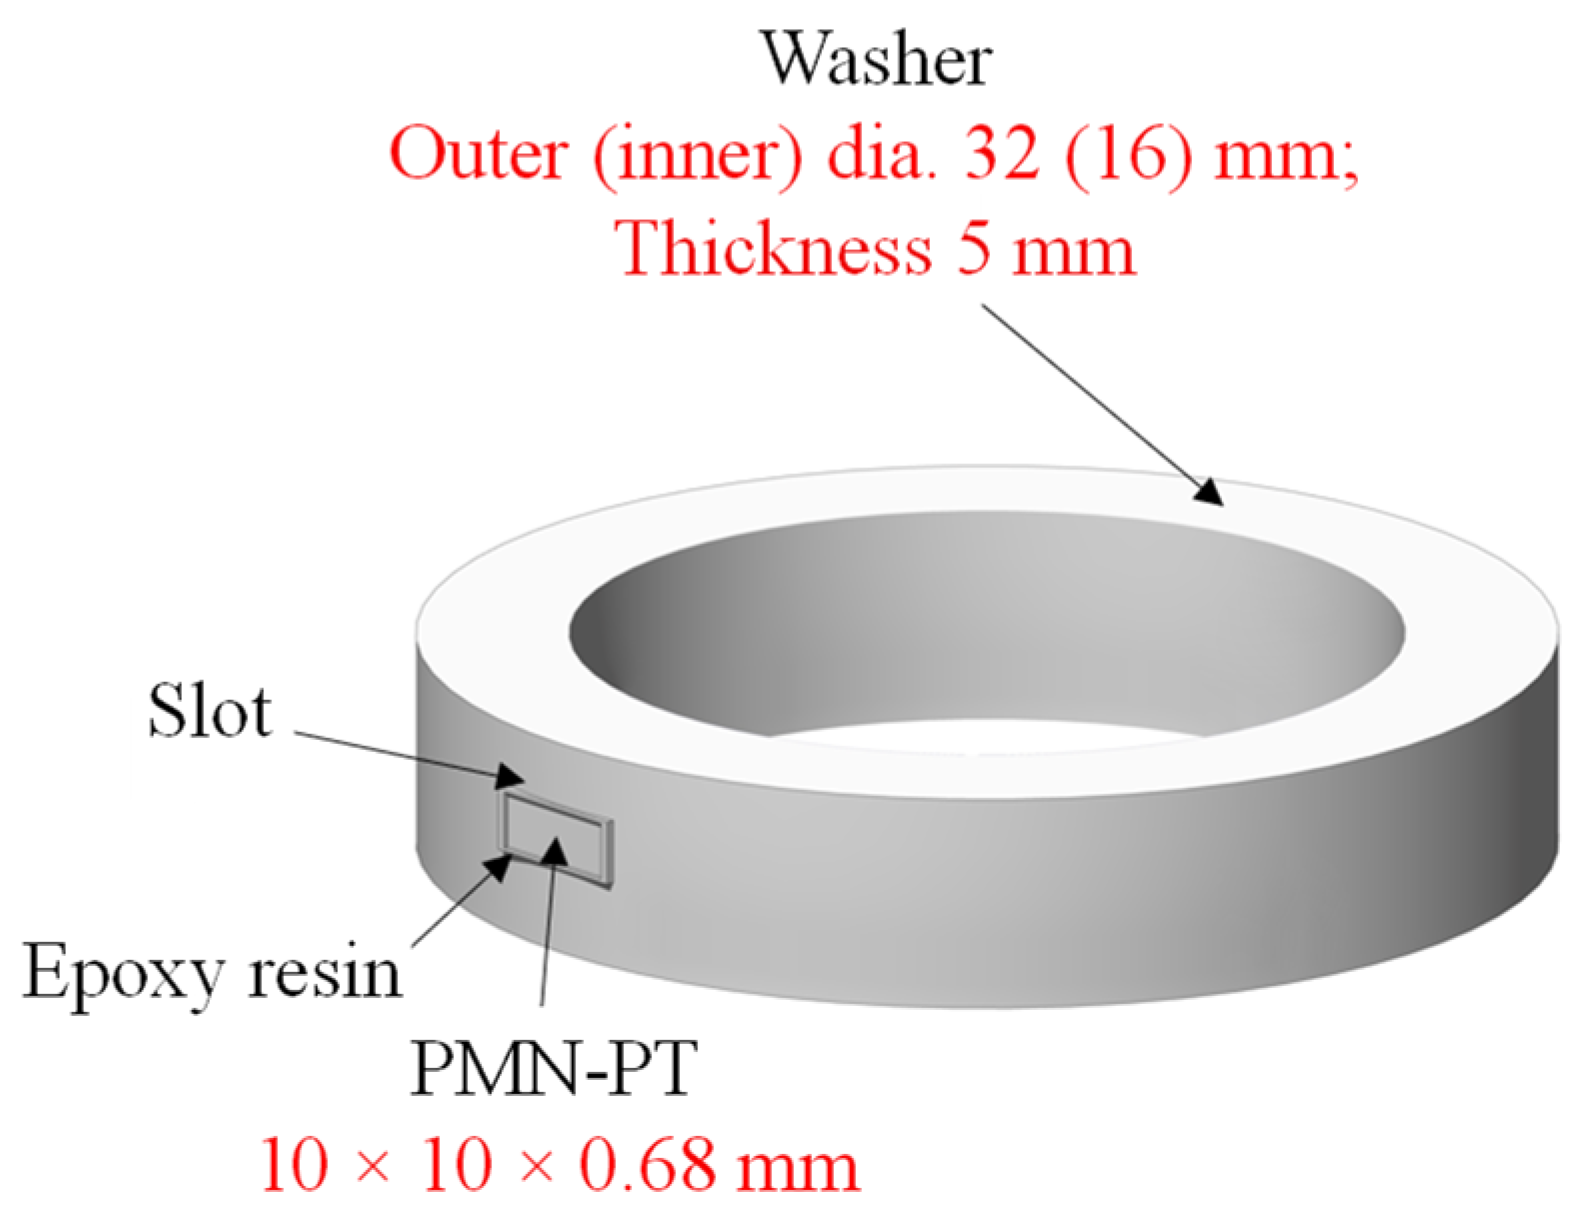
The sensor (smart washer) consists of a PMN-PT wafer, a monolithic washer, an epoxy resin layer, and shielded wiring. As shown in Figure 2, the monolithic washer, manufactured by Dongguan Endun, has an outer diameter of 32 mm, an inner diameter of 16 mm, and a thickness (height) of 5 mm. The core sensing element is a PMN-PT wafer measuring 10 mm × 10 mm × 0.68 mm, poled along its thickness direction. Silver electrodes were deposited on both surfaces using spray coating to ensure optimal sensing performance. For embedding, the wafer is inserted horizontally into a machined tangential slot on the washer’s circumference. In this arrangement, the 0.68 mm thickness spans the washer’s 5 mm thickness, while the wafer’s embedded radial extent (≤8 mm) fits within the washer’s ring width (32 − 16 = 16 mm, i.e., 8 mm per side). Slight edge trimming and epoxy encapsulation provide clearance and protection against brittle fracture under torque. Silver electrodes were deposited on both wafer surfaces via spray coating, with electrical leads bonded to the top and bottom. The wafer was then precisely placed into the washer slot, and interfacial gaps were filled with K-9741 epoxy resin (Guangdong Hengda New Materials Co., Ltd., Zhuhai, China). Controlled preloading was applied prior to a 24 h curing process in a dry, ventilated environment to ensure uniform epoxy encapsulation. Key material properties of the washer and epoxy are provided in Table 3 and Table 4, respectively. Figure 2 shows the schematic geometry, while Figure 3 illustrates the complete assembly process with a real-view photograph.

3.2. Basic Performance Test

In bolt preload monitoring, sensors must maintain operational stability under diverse environmental conditions, necessitating stringent requirements for consistent fundamental performance. Two PMN-PT wafers (designated A1 and A2) with dimensions 10 mm × 10 mm × 0.68 mm were selected for standardized evaluation through waterproof capability and electrical performance testing. These assessments primarily involved systematic measurements of resistance and capacitance parameters.

Water Resistance and Electrical Performance Test

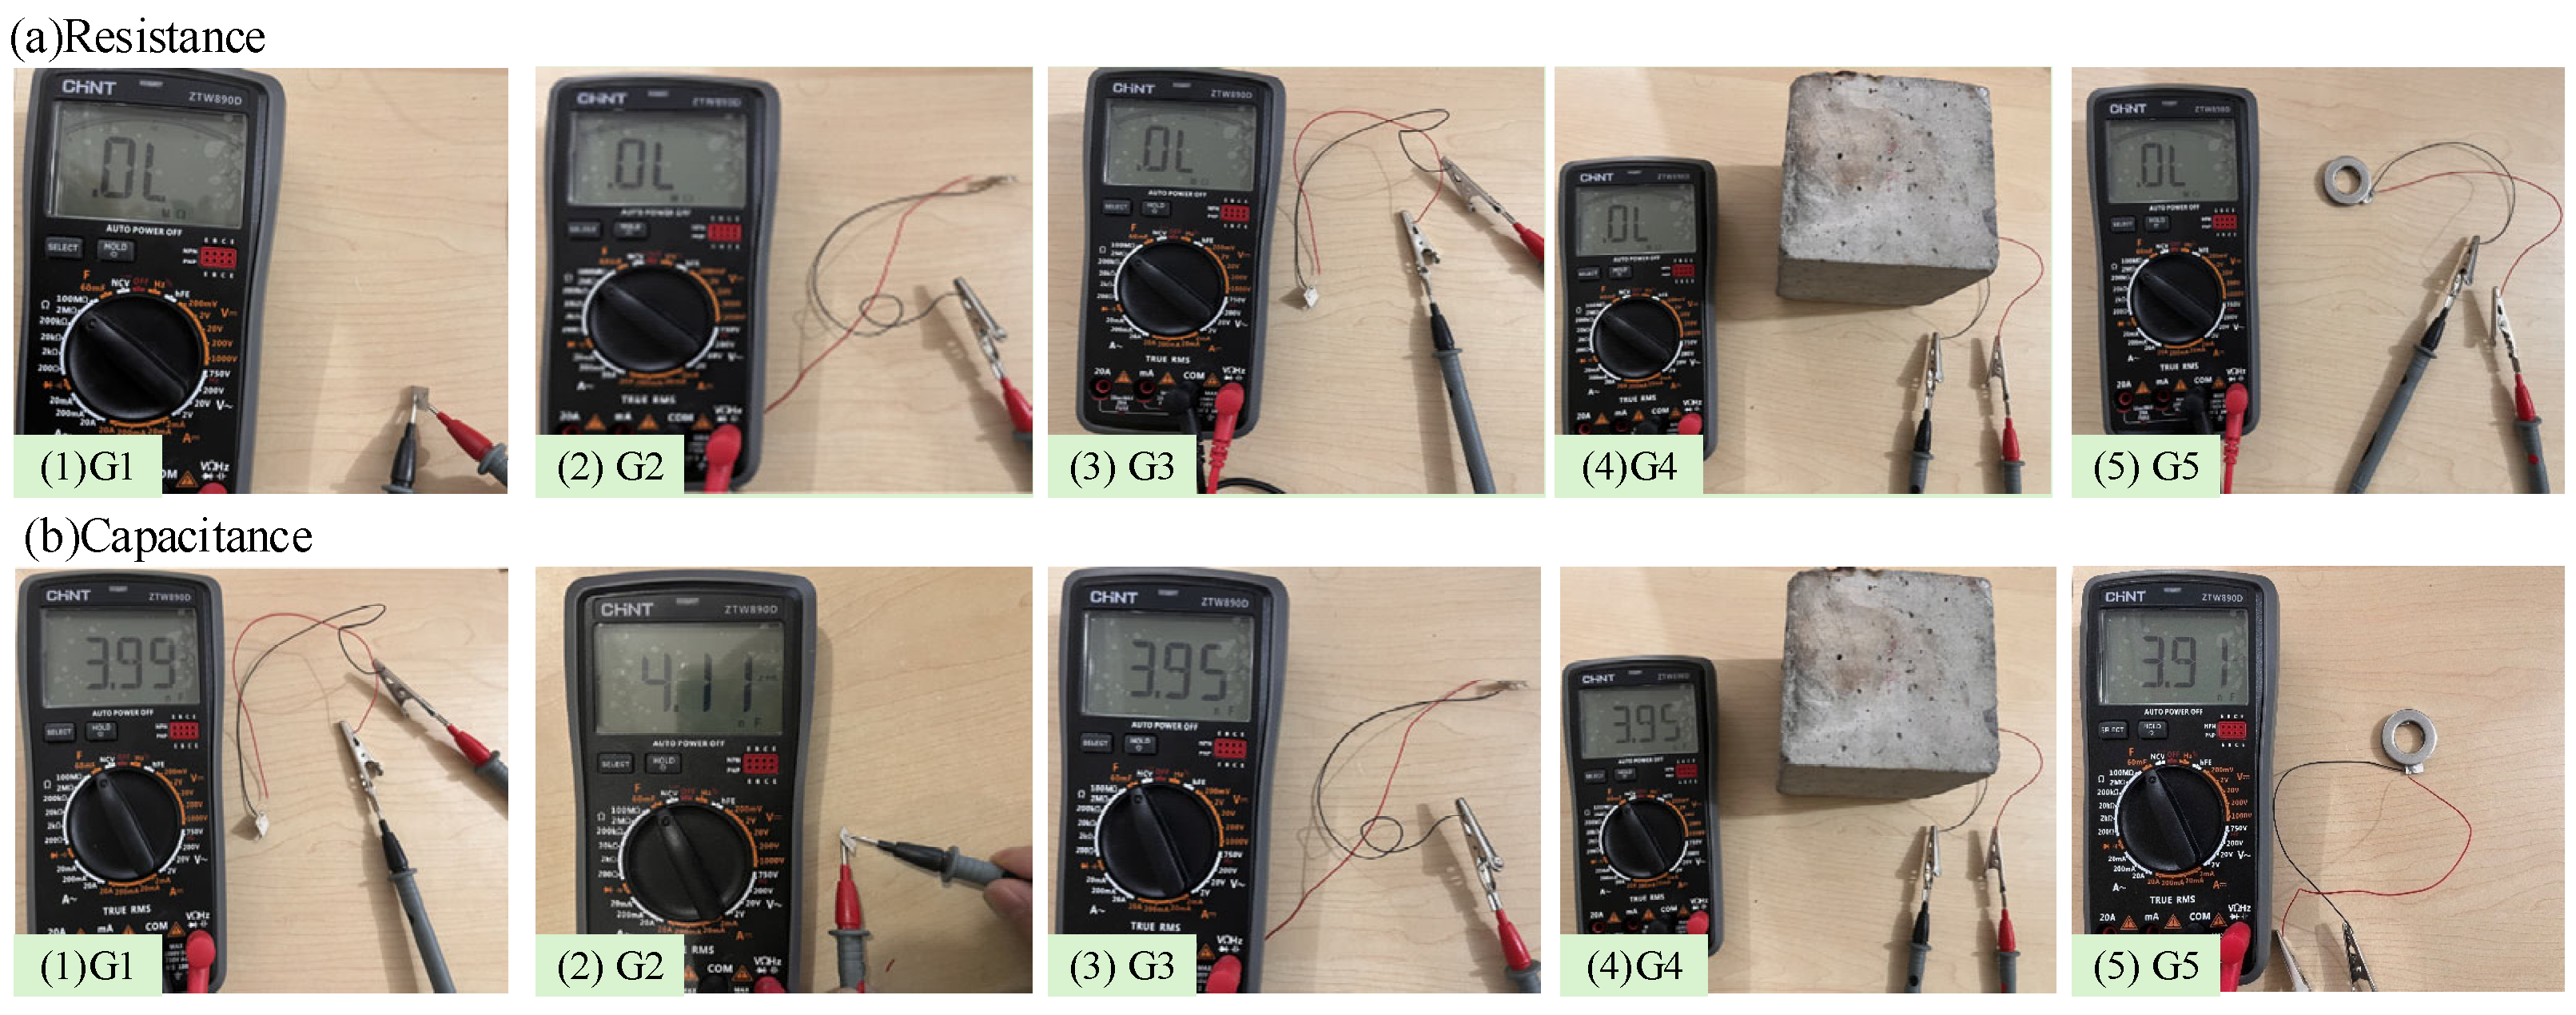
Elvin et al. [64] reported that the capacitance value of piezoelectric elements changes significantly when embedded in a substrate after welding. To evaluate the waterproofness and electrical performance of the sensor, different working conditions were established, and the resistance and capacitance of the PMN-PT sheet were measured for the first time, recorded as condition G1. Epoxy resin was evenly applied around the welded PMN-PT material, then left for one hour to cure, recorded as condition G2. The sensor was immersed in a glass of water and stirred with a glass rod for 15 min, recorded as condition G3. The finished sensor was pre-pressurized for 24 h and marked as condition G4. The assembled smart washer sensor was then recorded as condition G5. The resistance and capacitance values are shown in Figure 4, with measurements summarized in Table 5 and Table 6.
As shown in Table 5 and Table 6, PMN-PT wafers A1 and A2 exhibited infinite resistance across all test conditions. According to the first category of piezoelectric constitutive equations (stress-charge form), the PMN-PT sensor operates under mechanically free and electrically short-circuited boundary conditions. The relationship between external circuit resistance R 1 and internal piezoelectric material resistance R 2 theoretically satisfies R 1 R 2 , resulting in infinite interelectrode resistance, confirming the stable electrical performance of the PMN-PT wafers under the tested conditions. During the transition from G1 to G2, a slight capacitance reduction was observed, primarily due to partial delamination of the silver electrode layer during lead welding, which altered the capacitive characteristics. Under G3 conditions, further minor capacitance decrease occurred due to increased interelectrode distance caused by epoxy resin thickness variations. Comparative analysis between G3 and G4 revealed stabilized capacitance values, demonstrating effective waterproof encapsulation. The final capacitance reduction in G5 originated from microstructural deformations induced by assembly preloading and epoxy curing shrinkage. These results collectively confirm that the PMN-PT wafers maintain robust waterproof integrity (<0.01% moisture penetration) and stable electrical performance (capacitance fluctuation rate ≤ 3.25%) throughout fabrication and operation.

3.3. Sensor Drive Performance Test

The operational principle for monitoring bolt preload using the time-reversal algorithm involves deploying two smart washers: one functioning as an actuator and the other as a sensor. By comparing the time-domain response signals from both devices, piezoelectric performance deviations can be detected, thereby validating functional symmetry between the actuator and sensor modes. The experimental implementation included (1) installing the sensors using a torque wrench; (2) connecting the actuator, charge amplifier, and computer sequentially for signal excitation and acquisition; and (3) validating signal consistency through bidirectional testing in actuator-to-sensor and sensor-to-actuator configurations. The 3D experimental setup (Figure 5) illustrates the integrated system topology, showing the bolted joint assembly and spatial positioning of the smart washers.
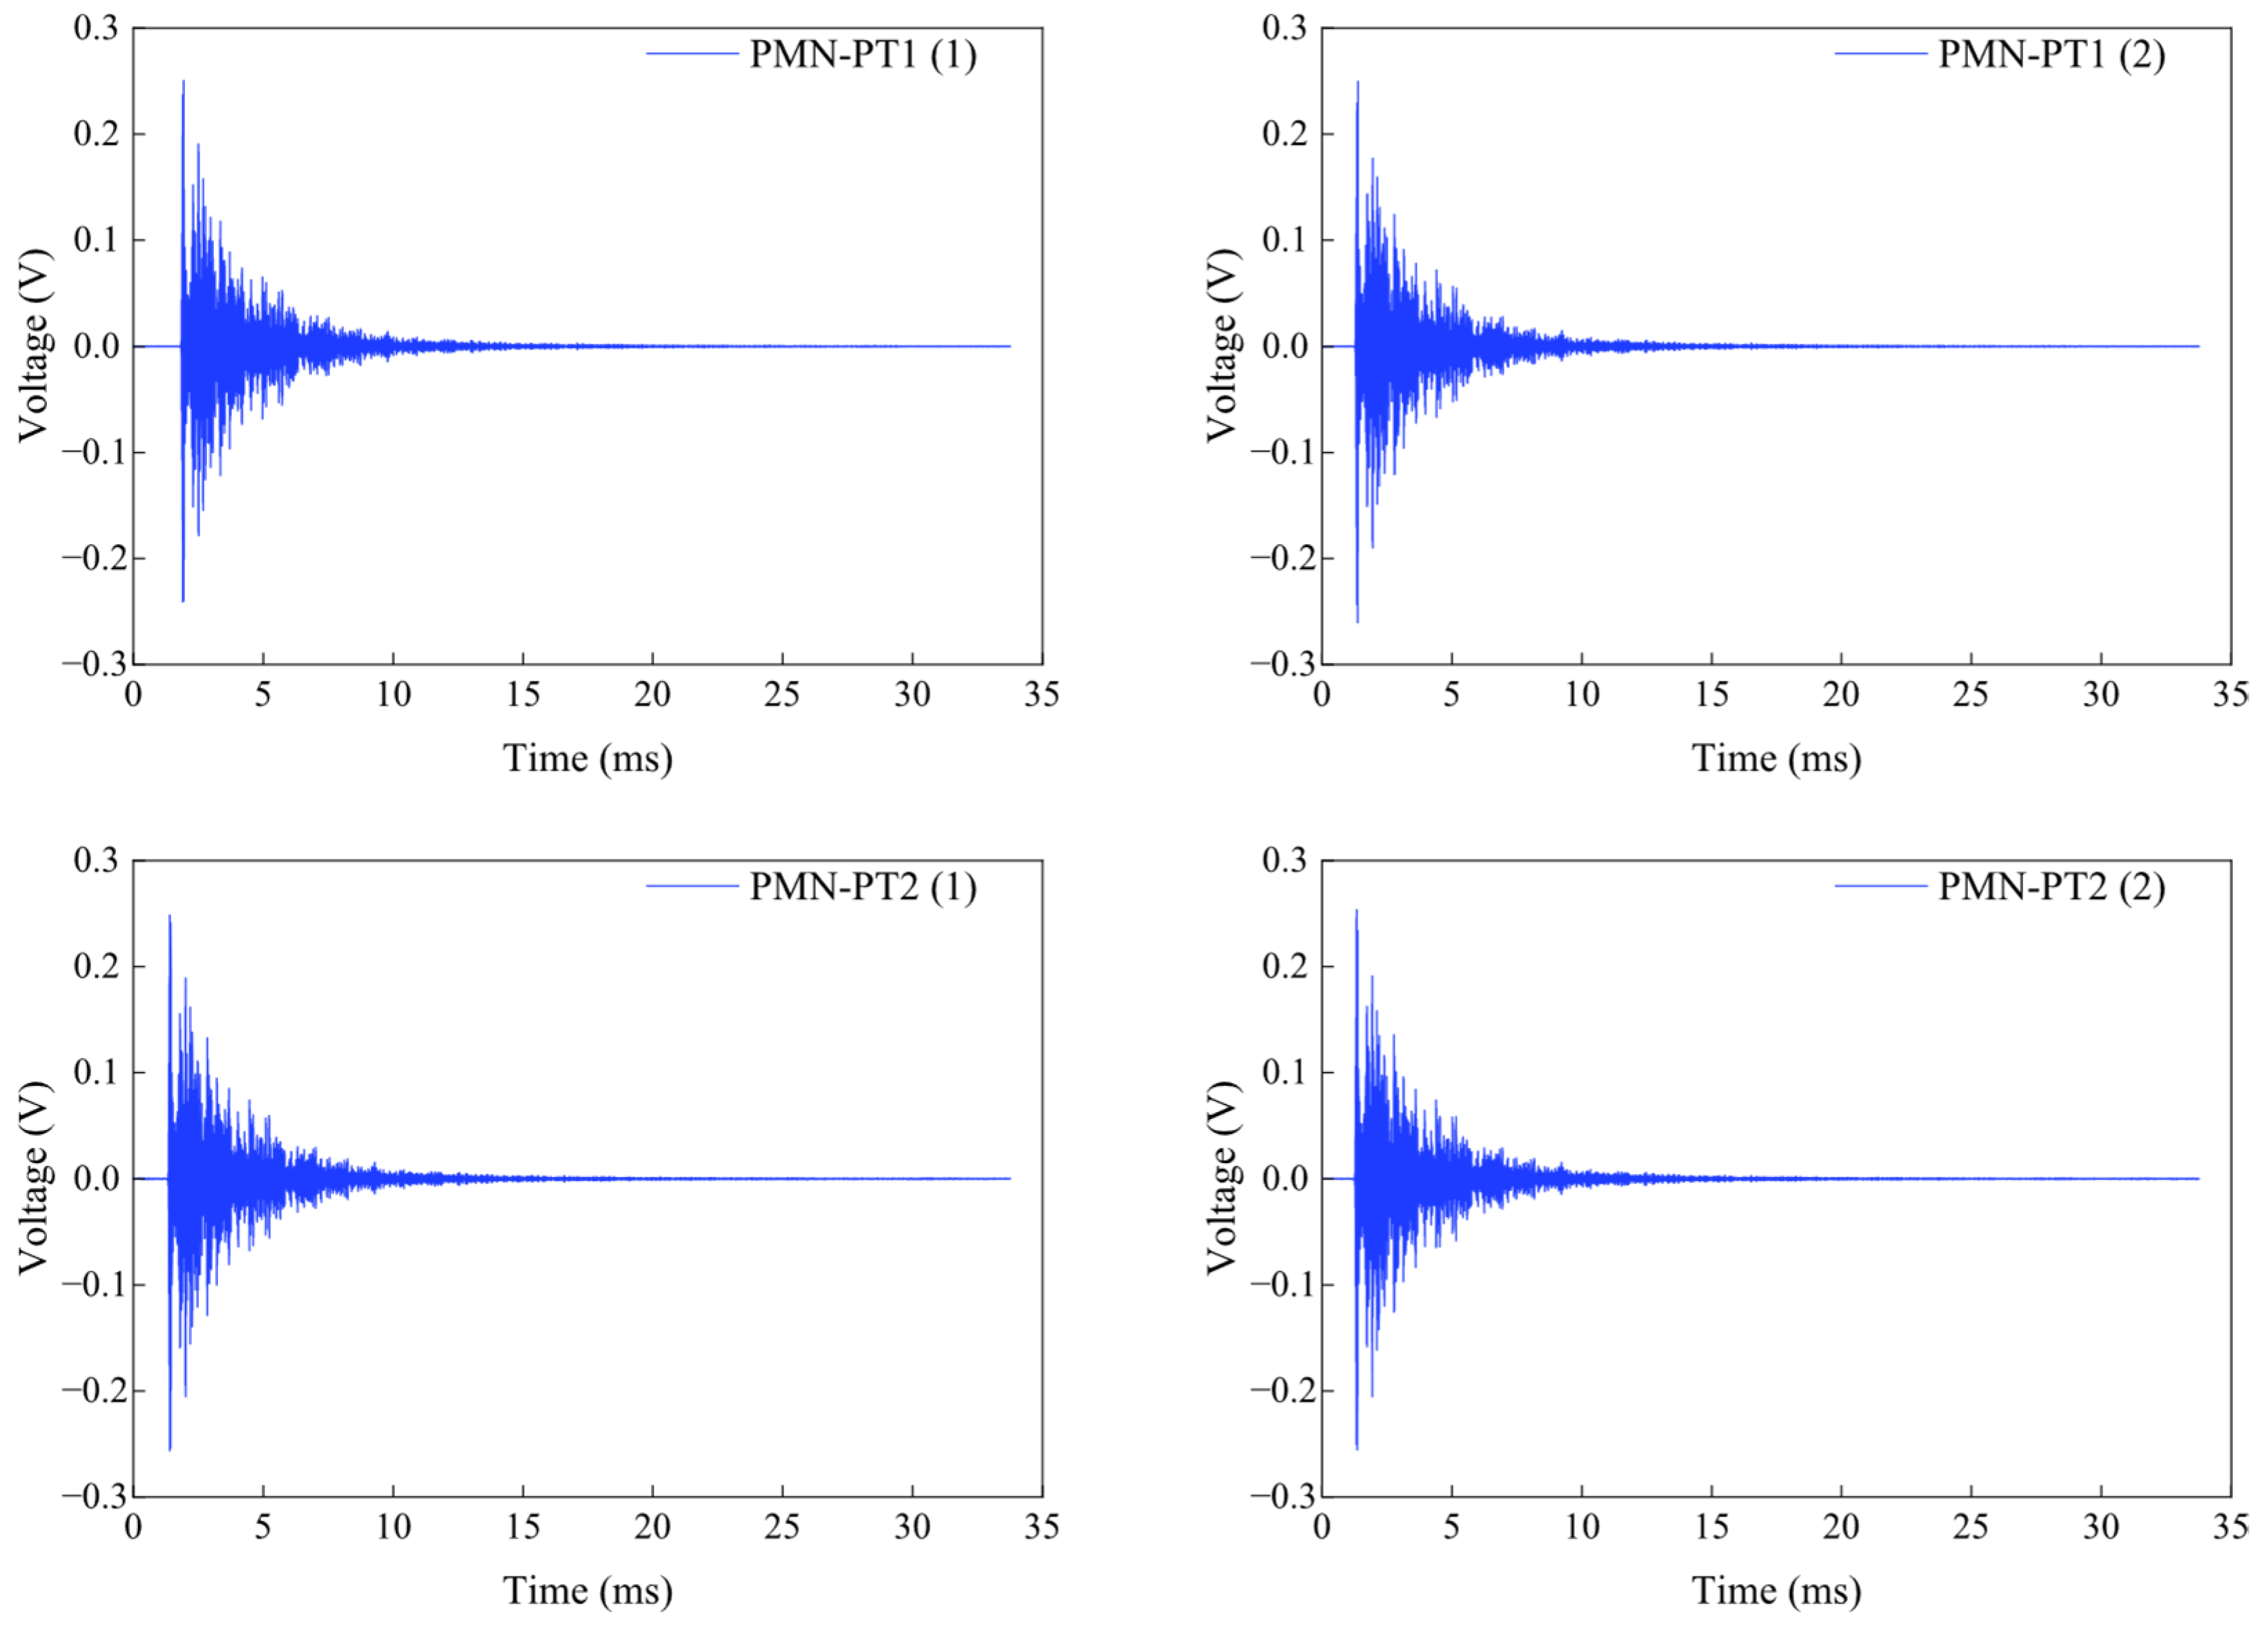
The excitation signal was set as a sine wave with a center frequency of 150 kHz and processed using a window function. The voltage amplitude was 5 V, with a loading duration of 3.5 ms. Smart washer A1 excited the signal while smart washer A2 received it, with the excitation repeated twice. Then, smart washer A2 was used to excite the signal while smart washer A1 received it, again repeating the excitation twice. The voltage output curve is shown in Figure 6. The time-history voltage curves from repeated experiments with smart washers A1 and A2 were similar, indicating that the performance of different smart washers as sensors or actuators was very consistent, confirming good stability.

3.4. Comparison with Other Piezoelectric Sensors

This study conducted an environmental noise comparison experiment to evaluate the SNR of sensors fabricated from PZT, PVDF, and PMN-PT materials under varying noise levels, comparing direct signal reception with signals obtained after time-reversal processing (see Table 7). In this experiment, three different types of piezoelectric sensors were studied in detail: piezoelectric ceramic (PZT) sensors, piezoelectric film (PVDF) sensors, and (001) cut relaxor ferroelectric single-crystal (0.67PMN-0.33PT) sensors, as shown in Figure 7a. PZT sensors are primarily used for converting force into electrical signals. Their high sensitivity, simple force-to-electricity conversion mechanism, customizable shape, and low cost make them the most commonly used sensors in structural health monitoring. Although PVDF sensors are slightly inferior to PZT in piezoelectric performance, they offer higher elasticity and tensile strength, fast response, and strong stability, making them suitable for long-term operation in complex environments. As shown in Figure 7b, for structures undergoing large deformations, PVDF sensors, due to their high flexibility, are less prone to damage or detachment. They can deform synchronously with the base structure and capture signals throughout the deformation process. The piezoelectric sensing element is made from cut lead magnesium niobate–lead titanate (PMN-PT) material, as shown in Figure 7c. Compared to PZT materials, PMN-PT sensors exhibit significant improvements in piezoelectric and electromechanical coupling coefficients, with maximum strain reaching up to 1.7%—ten times that of traditional piezoelectric materials—and a very fast response speed [65,66].
PMN-PT piezoelectric single crystals exhibit a higher SNR compared to traditional PZT and PVDF materials [66]. Furthermore, the time-reversal algorithm is robust in handling environmental noise. To evaluate the specific SNR capabilities under different noise levels, a comparison of different piezoelectric materials in various noise environments is essential. This further explores the extent to which the time-reversal algorithm enhances SNR in practical engineering applications. The study examines the compatibility of three piezoelectric materials with the time-reversal algorithm, designing an environmental noise comparison experiment based on time-reversal with different piezoelectric materials. The dimensions of the piezoelectric materials used are provided, with the experimental process shown in Figure 8.
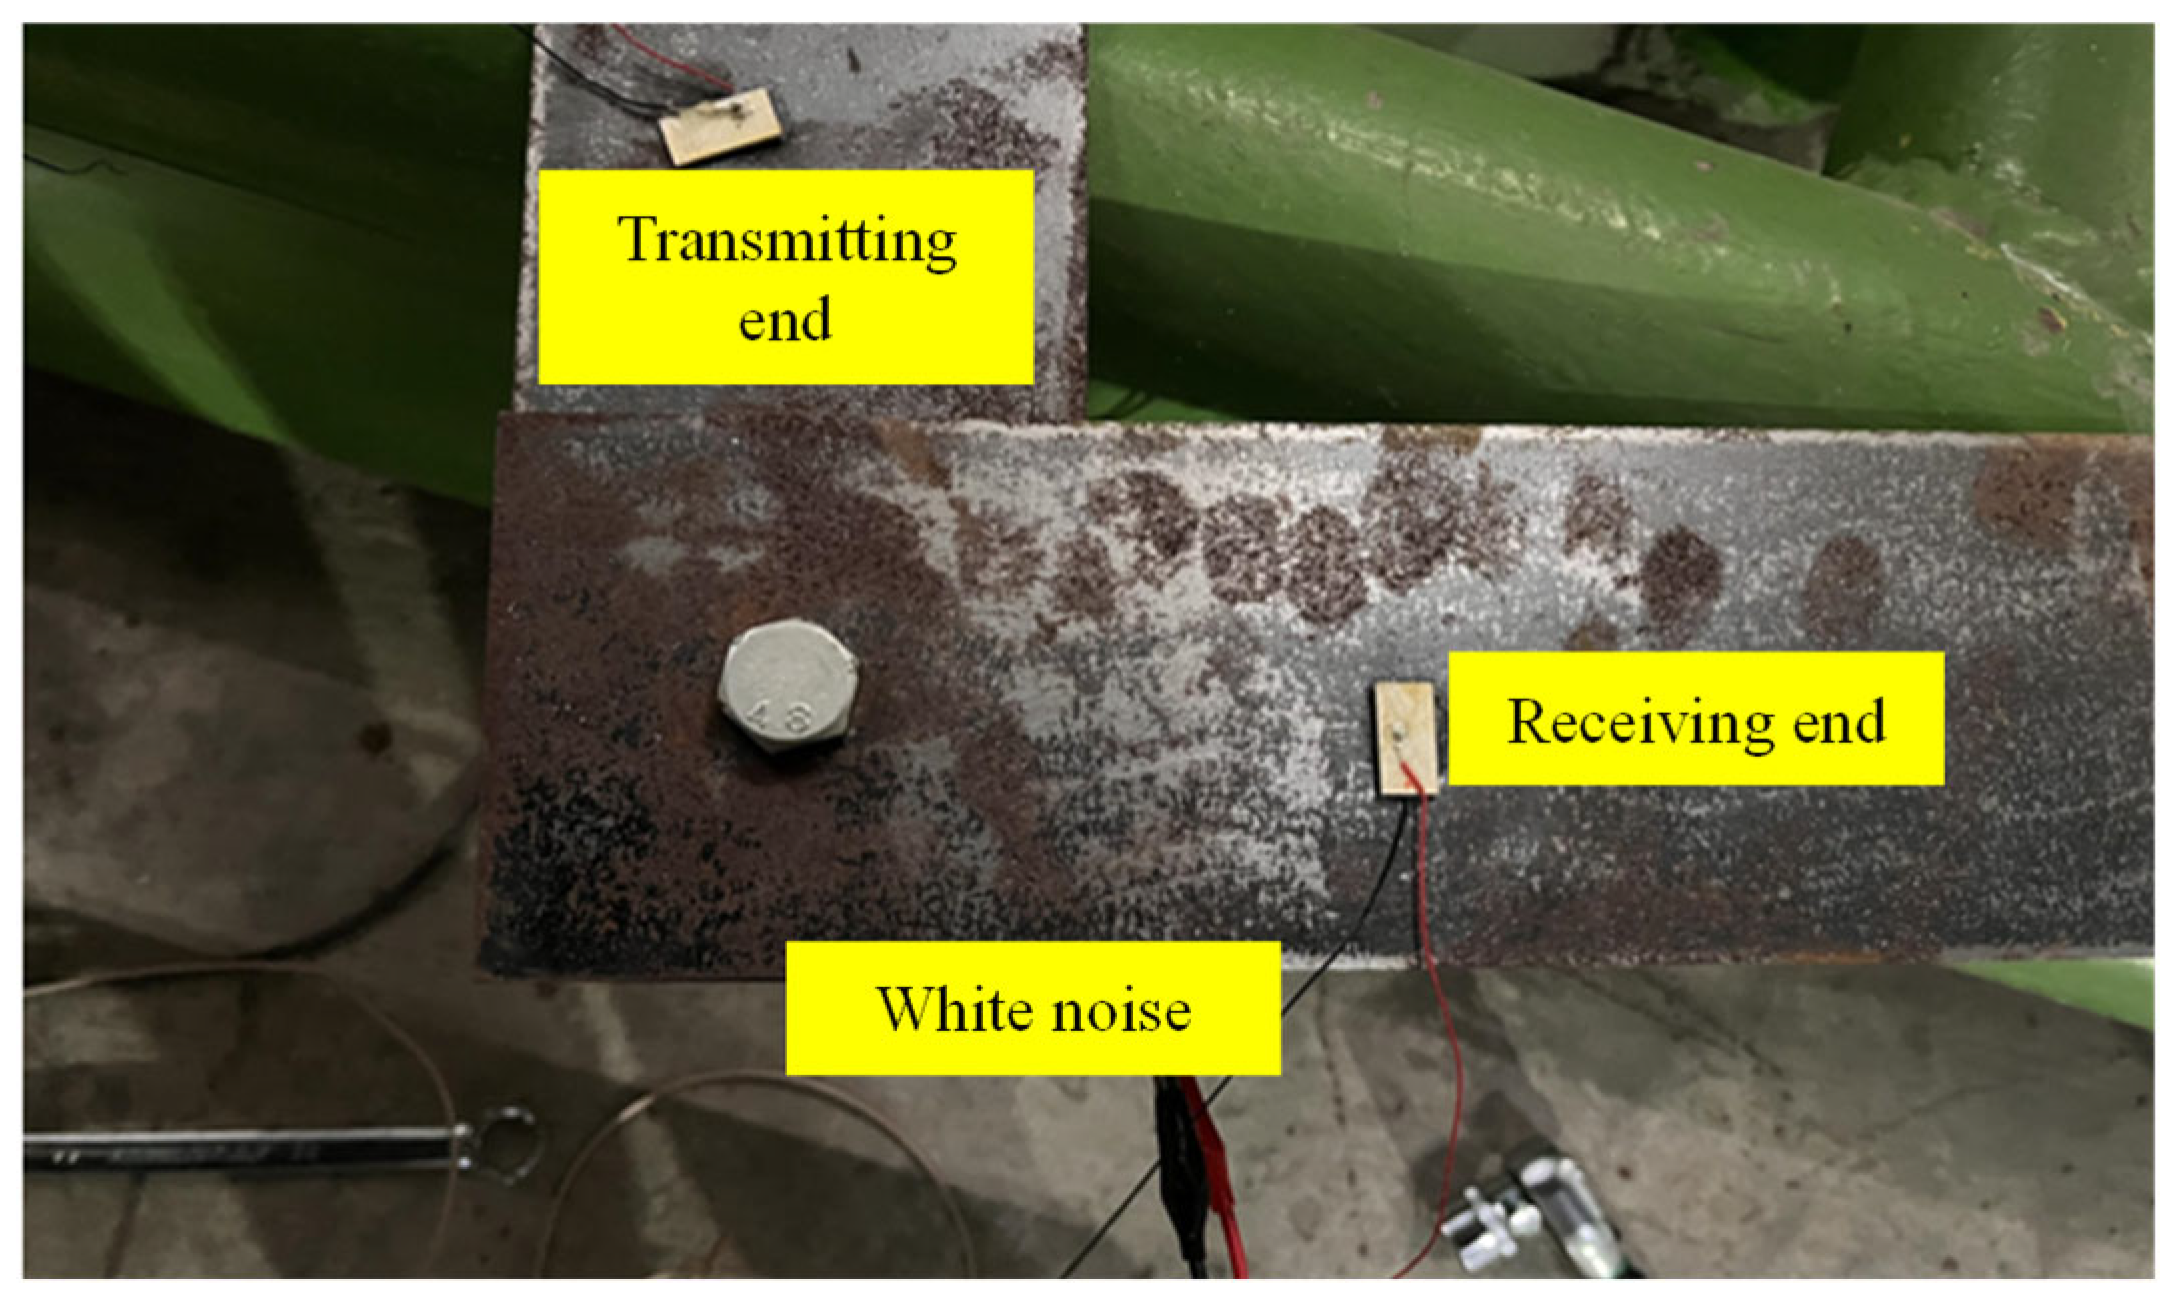
The required hardware and software for the experiment include a data acquisition system with a MATLAB version R2023a-integrated PCI-2 card, charge amplifier, torque wrench, two steel plates, and high-strength bolts (Model M14). The maximum applied torque is 120 N·m, assuming the bolt is fully tightened at 120 N·m. The charge amplifier amplifies the signal by a factor of 40. A sine wave with a central frequency of 150 kHz is excited by PMN-PT1, modulated by a Hanning window, with a maximum amplitude of 5 V. Additionally, PMN-PT3 excites a Gaussian white noise signal to simulate environmental noise. The on-site experimental setup is shown in Figure 9.
It is important to note that preparation before the experiment aimed to minimize potential sources of error. Specific measures included the following: To ensure consistent propagation of ultrasonic signals, the contact surfaces of the specimens were finely processed. The connection points of the two steel plates and the areas where the piezoelectric materials were attached were polished with sandpaper to remove surface irregularities and impurities. After polishing, the surfaces of the connection points were thoroughly cleaned with ethanol. This step ensured the removal of dust and oil generated during polishing, and the rapid evaporation of ethanol ensured cleaning efficiency while avoiding potential impacts of moisture on the experimental results.
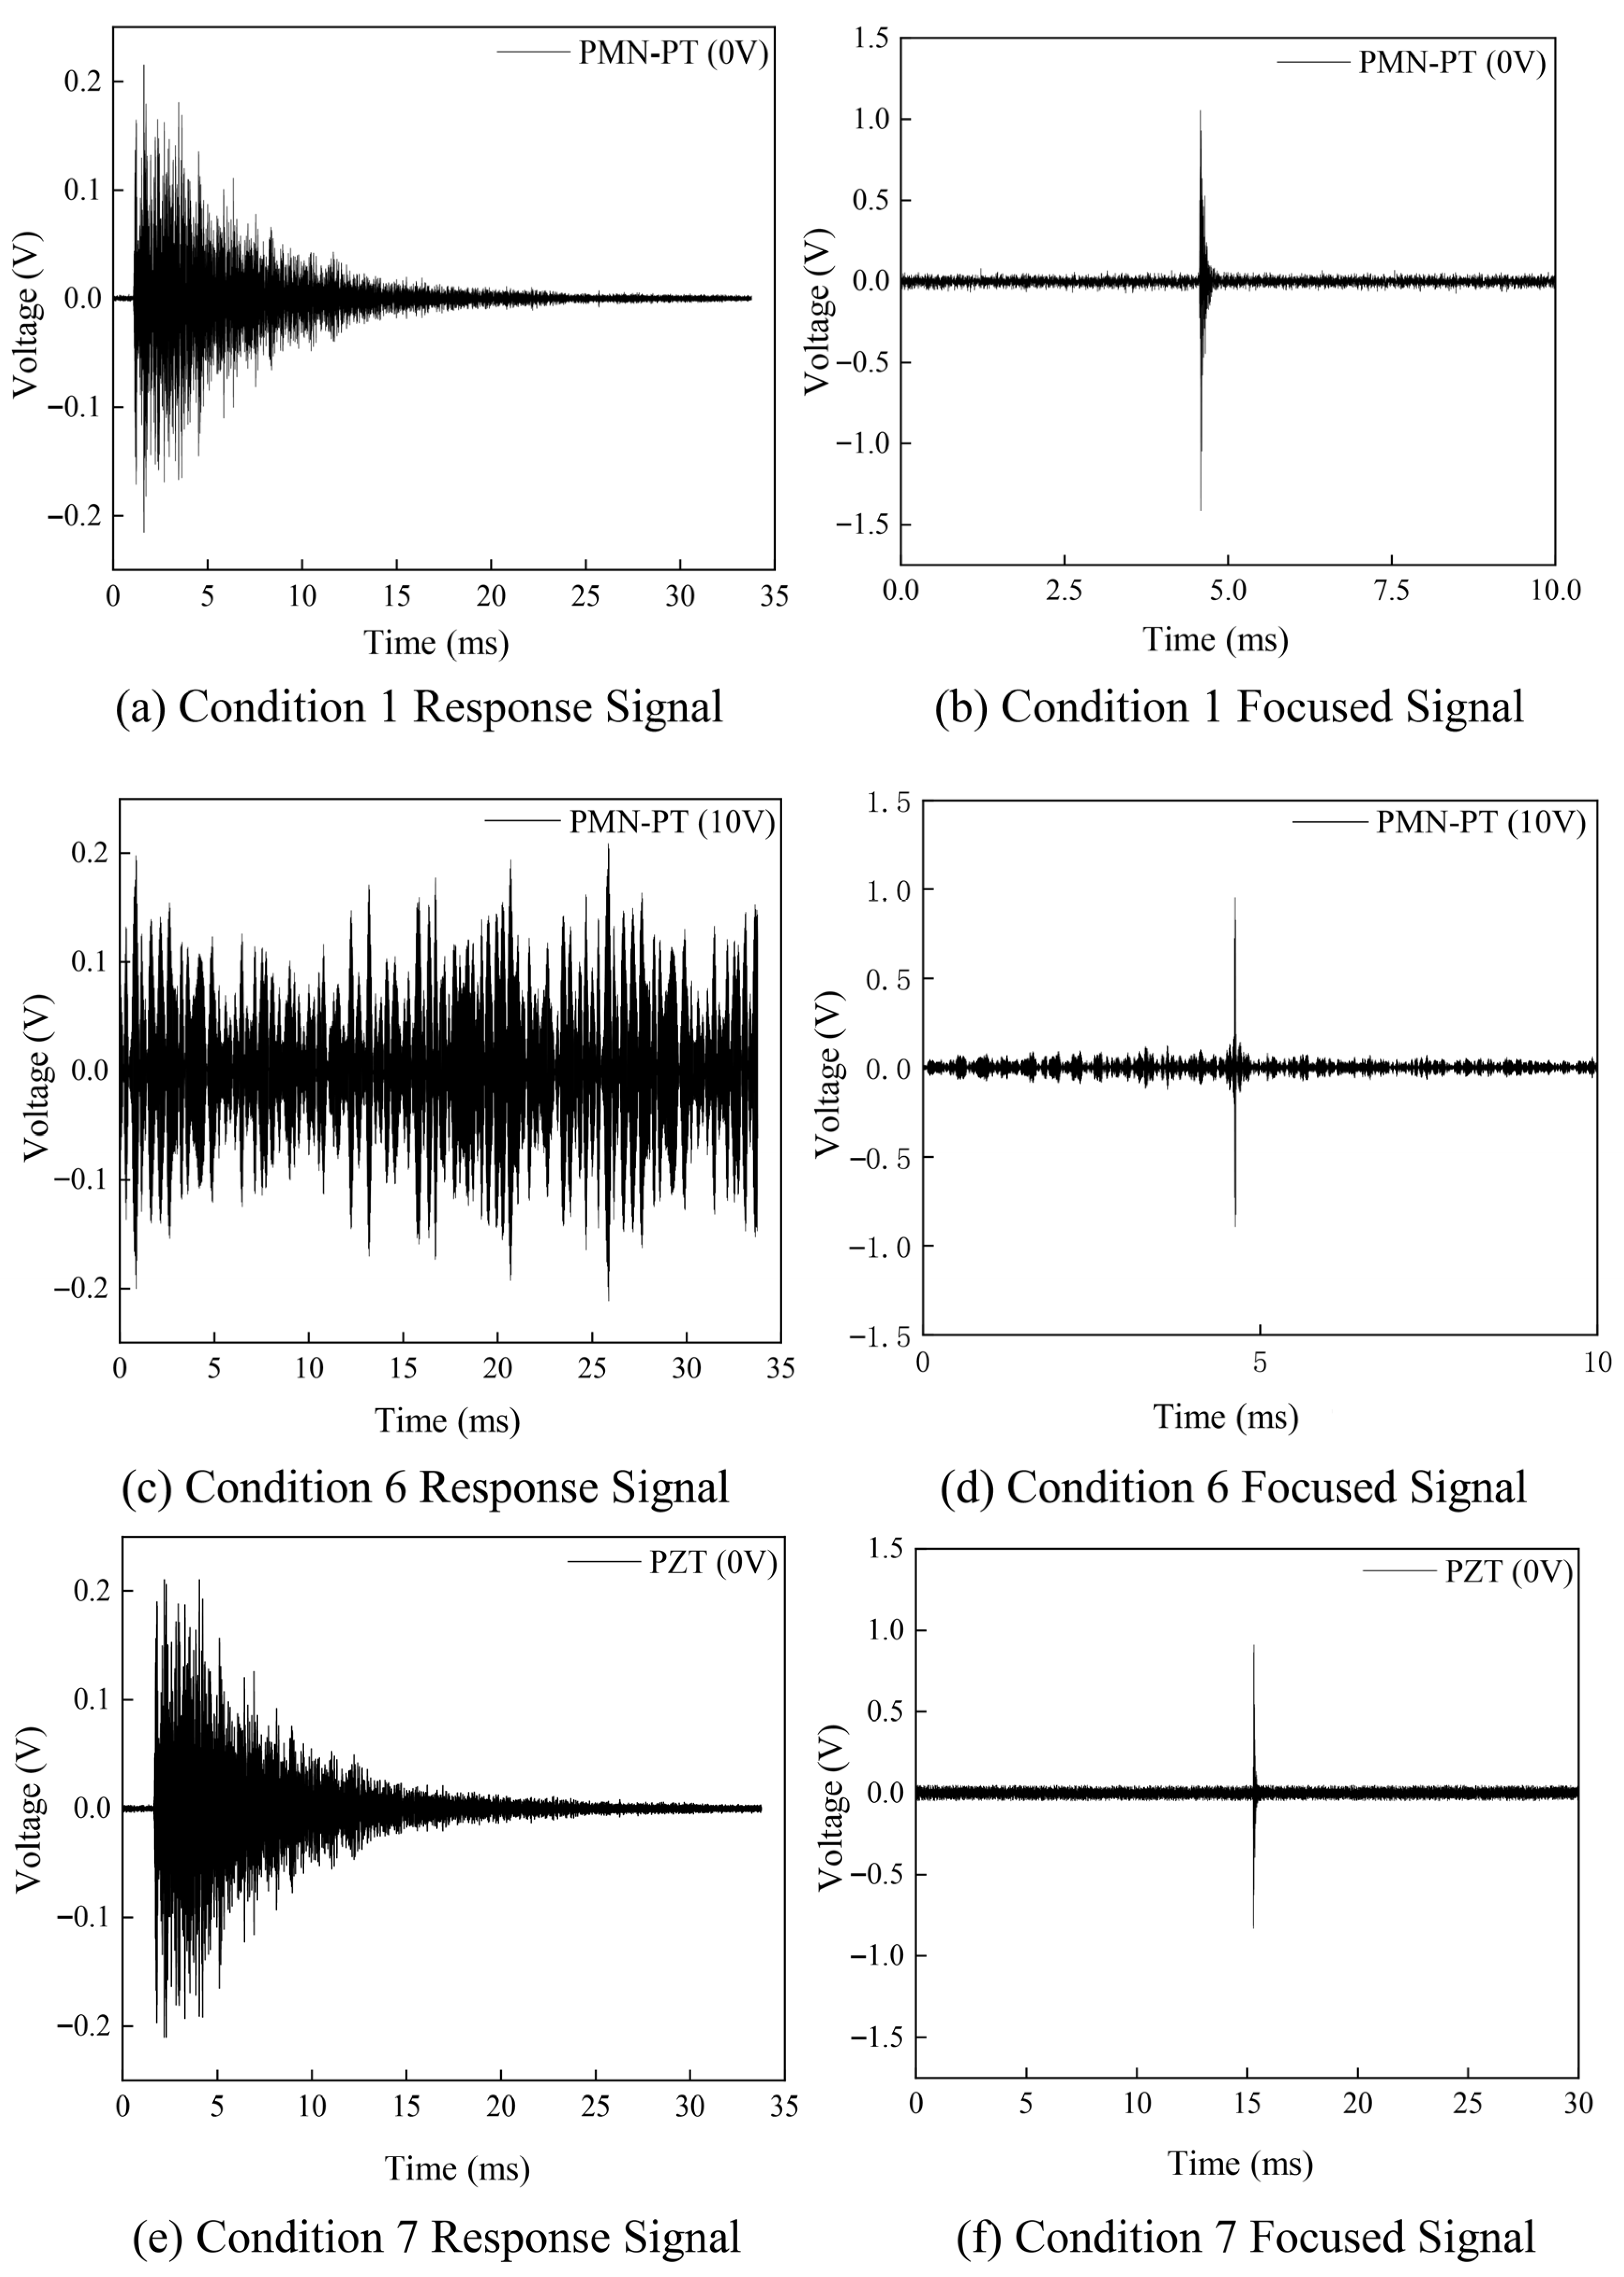
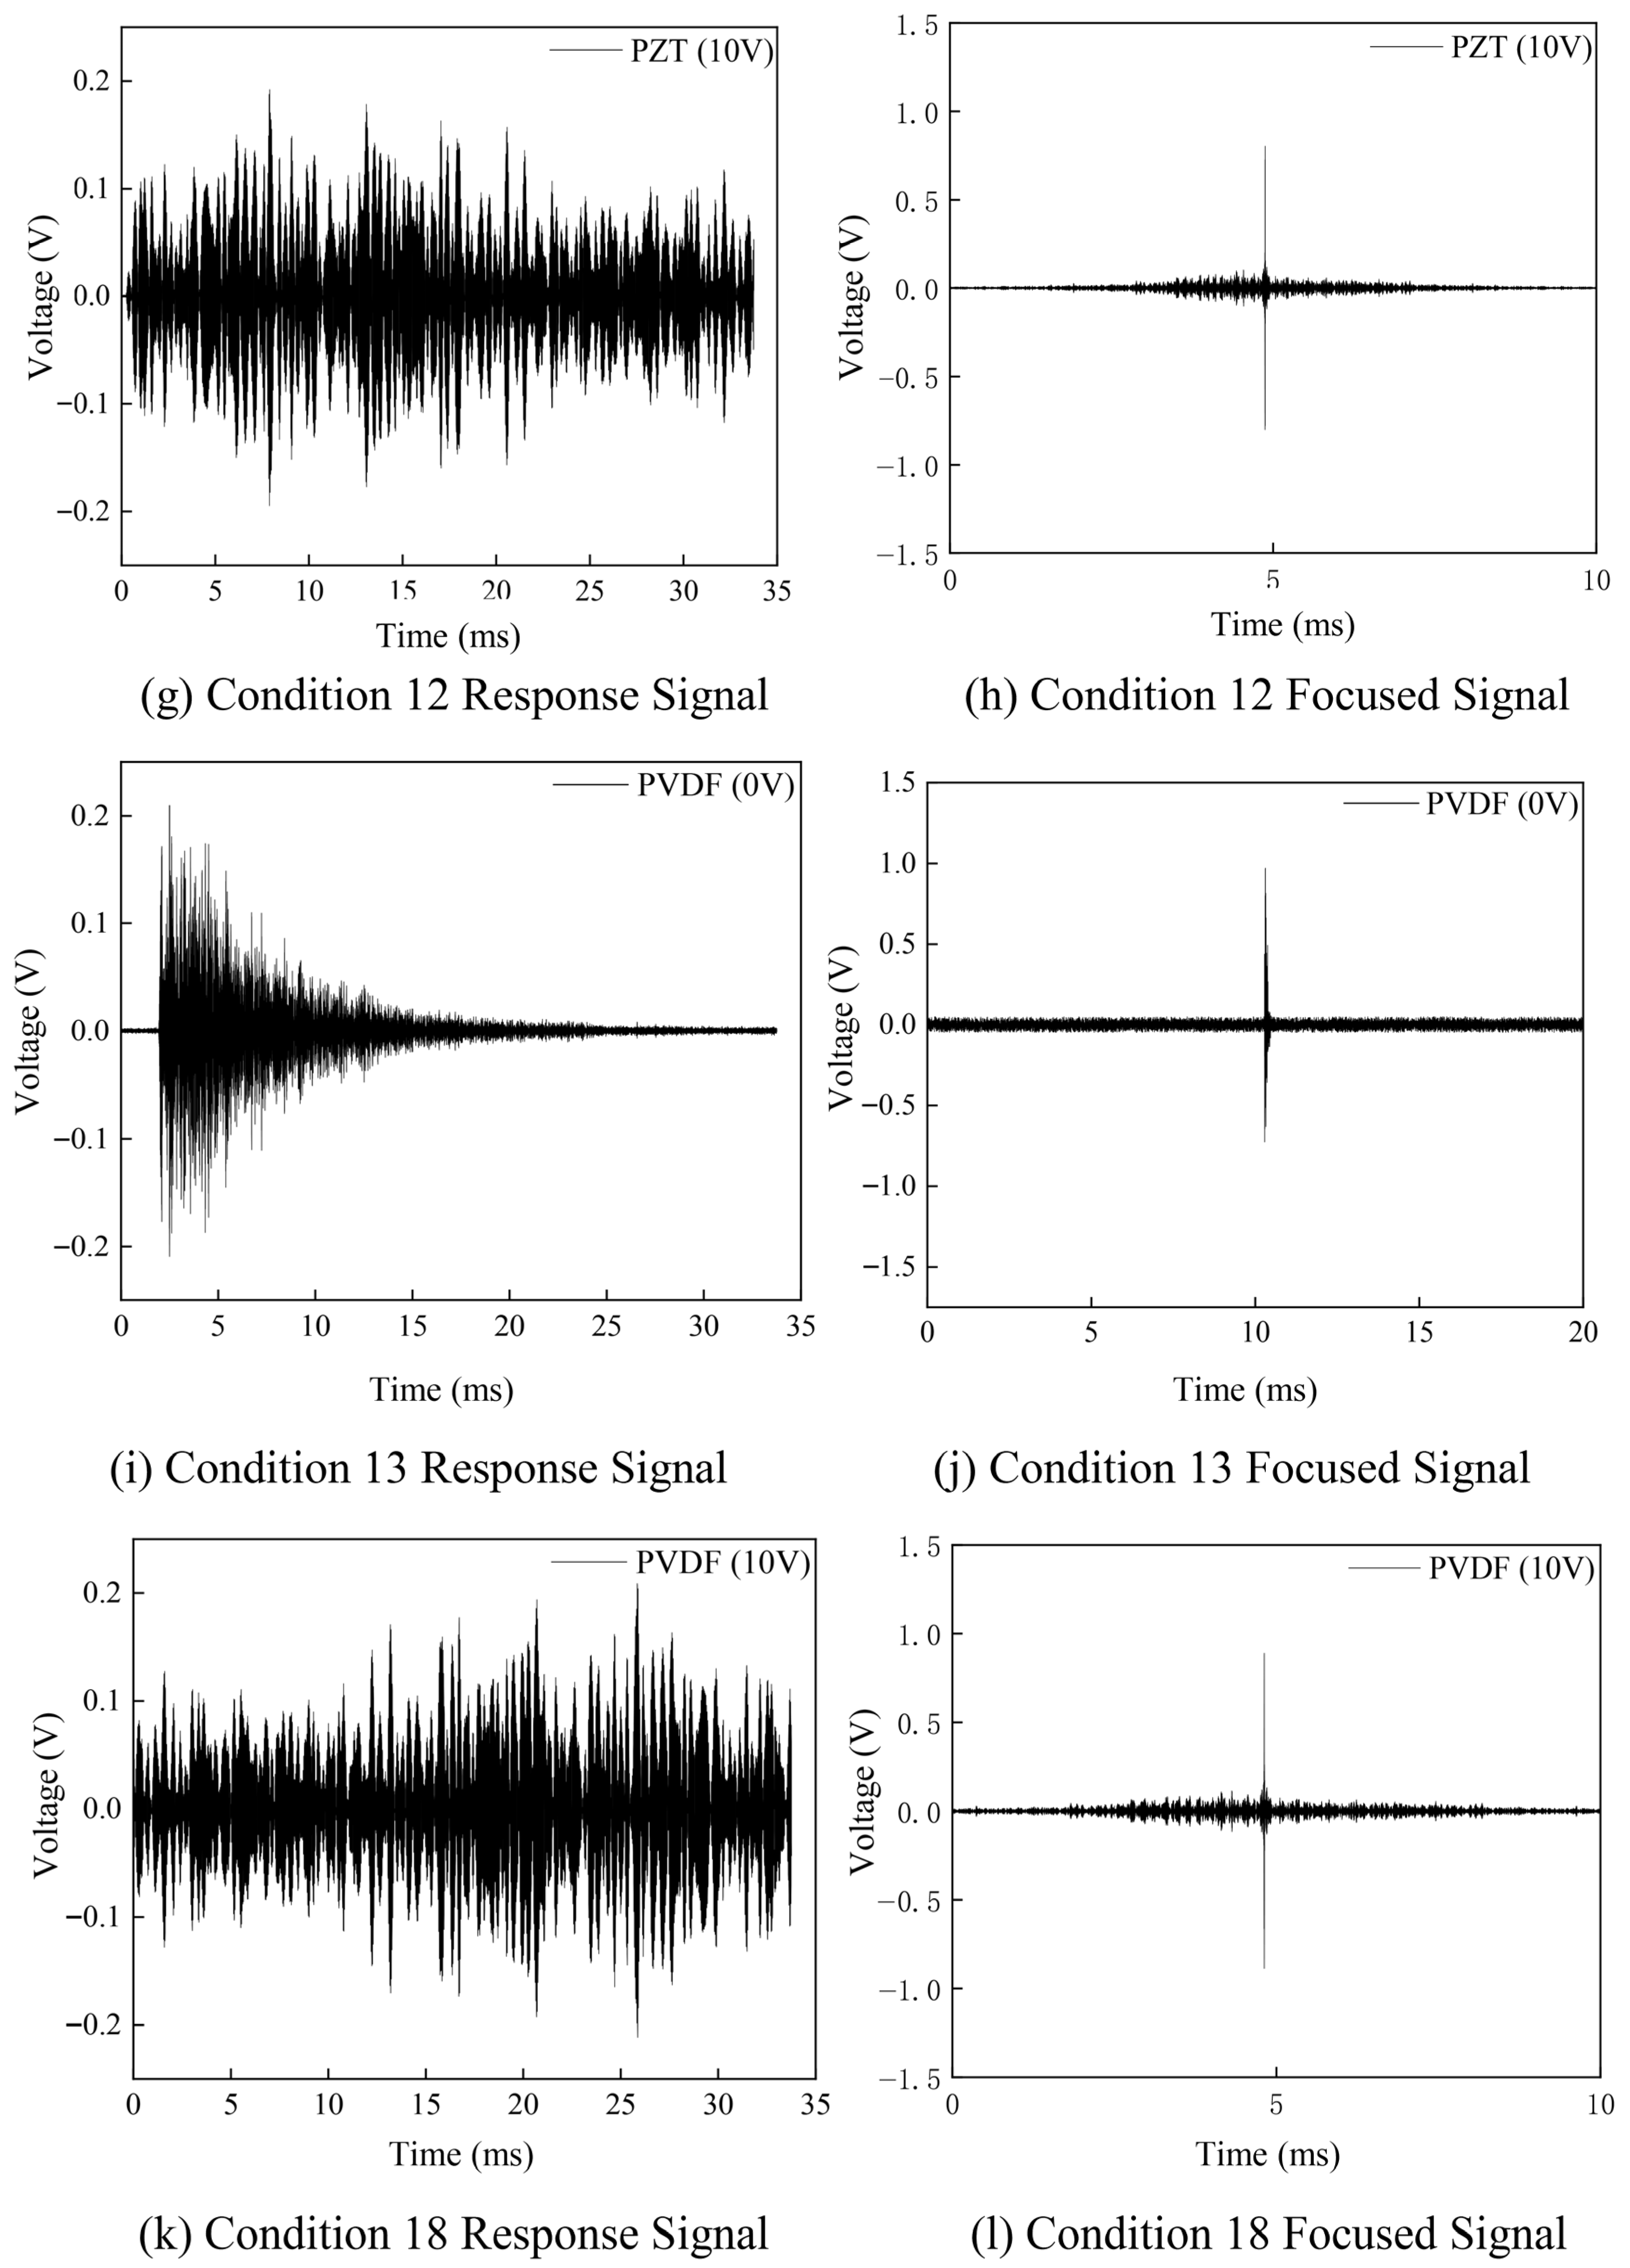
By adjusting the Gaussian white noise signal amplitude to represent different conditions, the signal received by PMN-PT2 at Condition 1 was considered the response signal. The response signal was processed using MATLAB’s time-reversal method, then re-excited by PMN-PT2 and received by PMN-PT1 to obtain the focused signal. The same procedure was repeated for PZT and PVDF materials. The summarized results for the conditions are shown in Table 8. The experimental results are presented in Figure 10a–l.
From Figure 10a–l, it is evident that the time-domain plots for both response and focused signals from the three piezoelectric materials are generally similar, with peak signal values varying due to differences in piezoelectric coefficients. During the experiment, variations in the coupling between the piezoelectric materials and the steel plates, due to manual attachment, may have influenced the results. Moreover, as the amplitude of the white noise increases (from Conditions 1, 7, 13 to Conditions 6, 12, 18), the peak values of the response signals become less noticeable. However, the focused signal peak values after time-reversal processing are less affected. To further analyze the superior noise performance of the three piezoelectric materials, the response signal and focused signal amplitudes for different conditions were compared, as shown in Figure 11, Figure 12 and Figure 13.
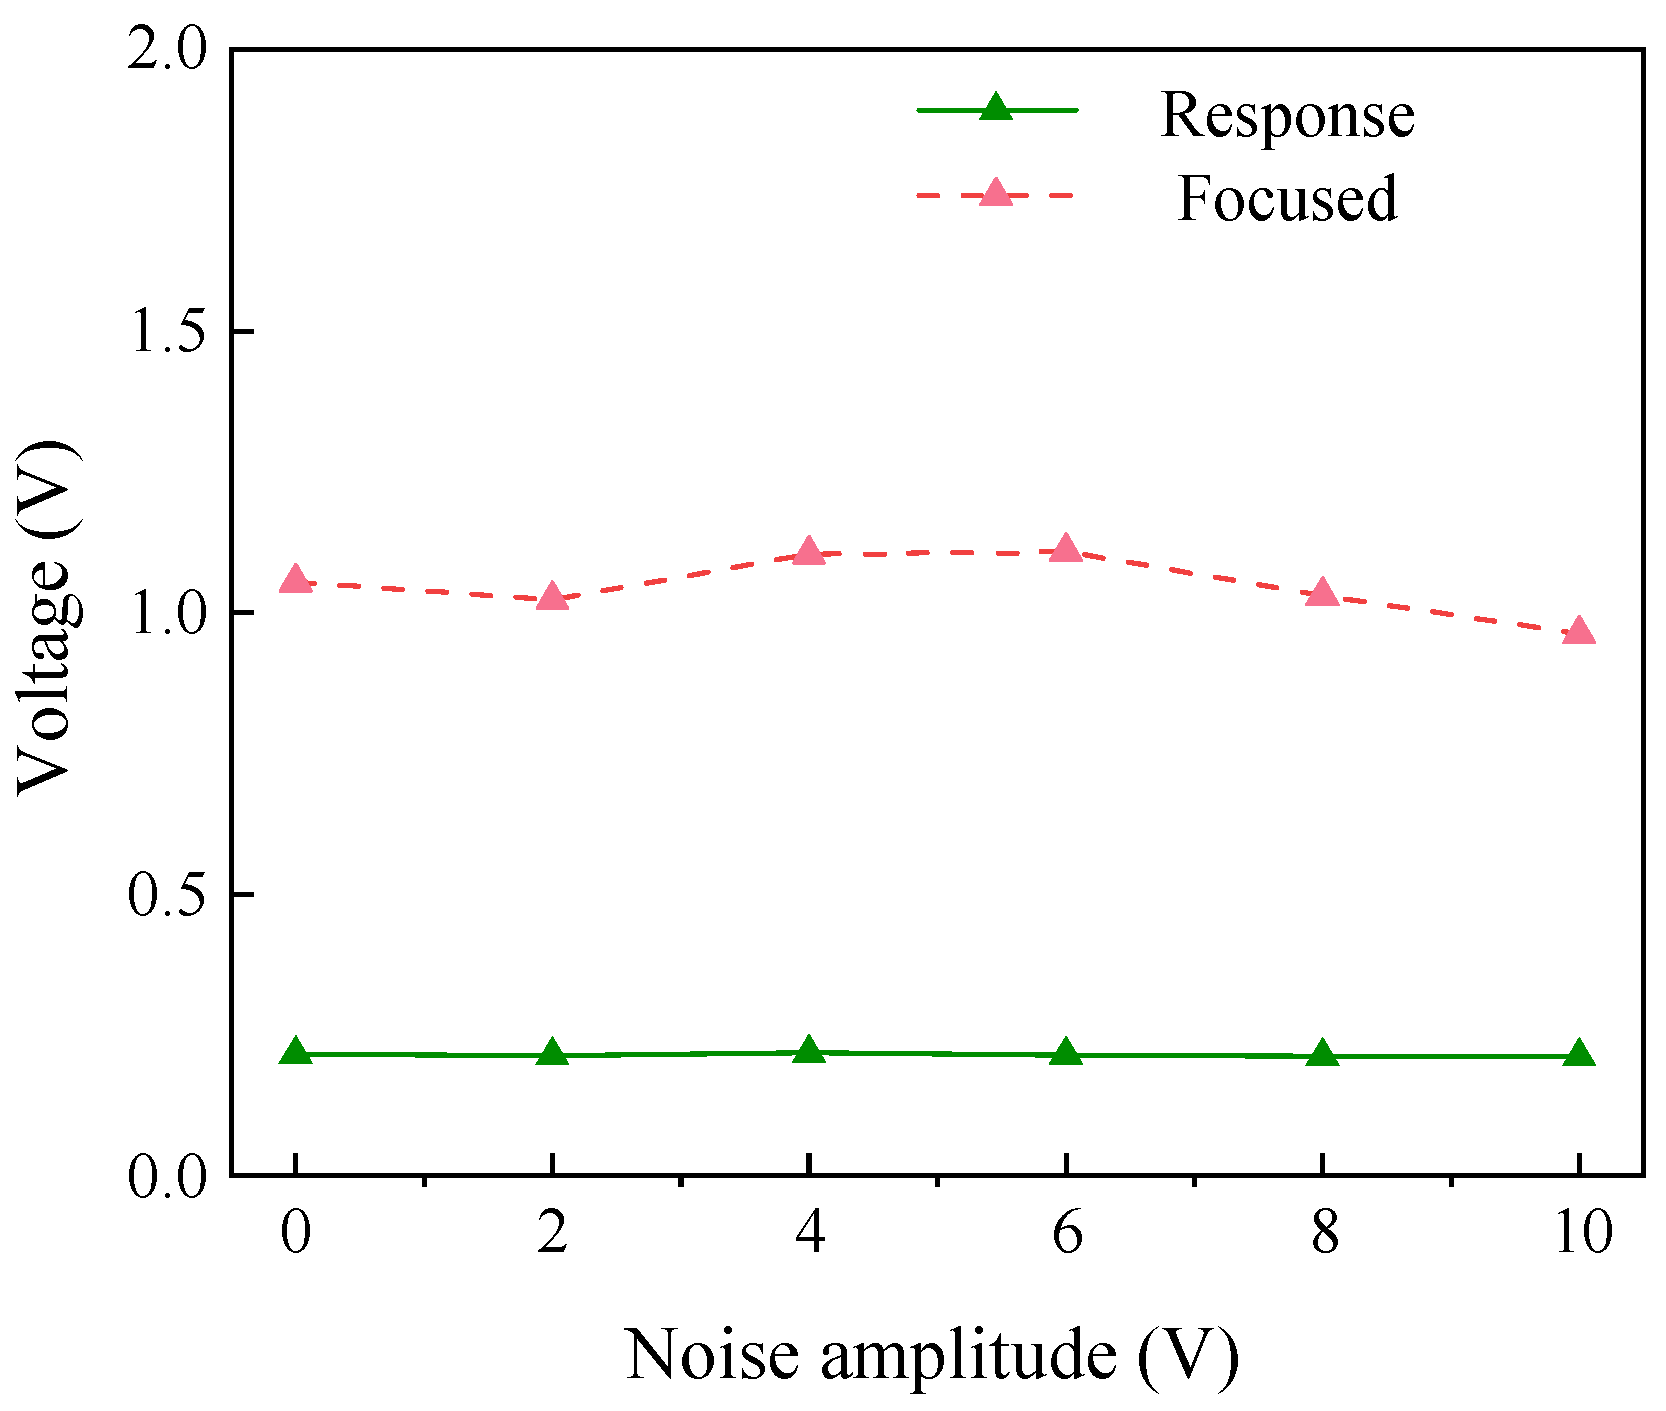
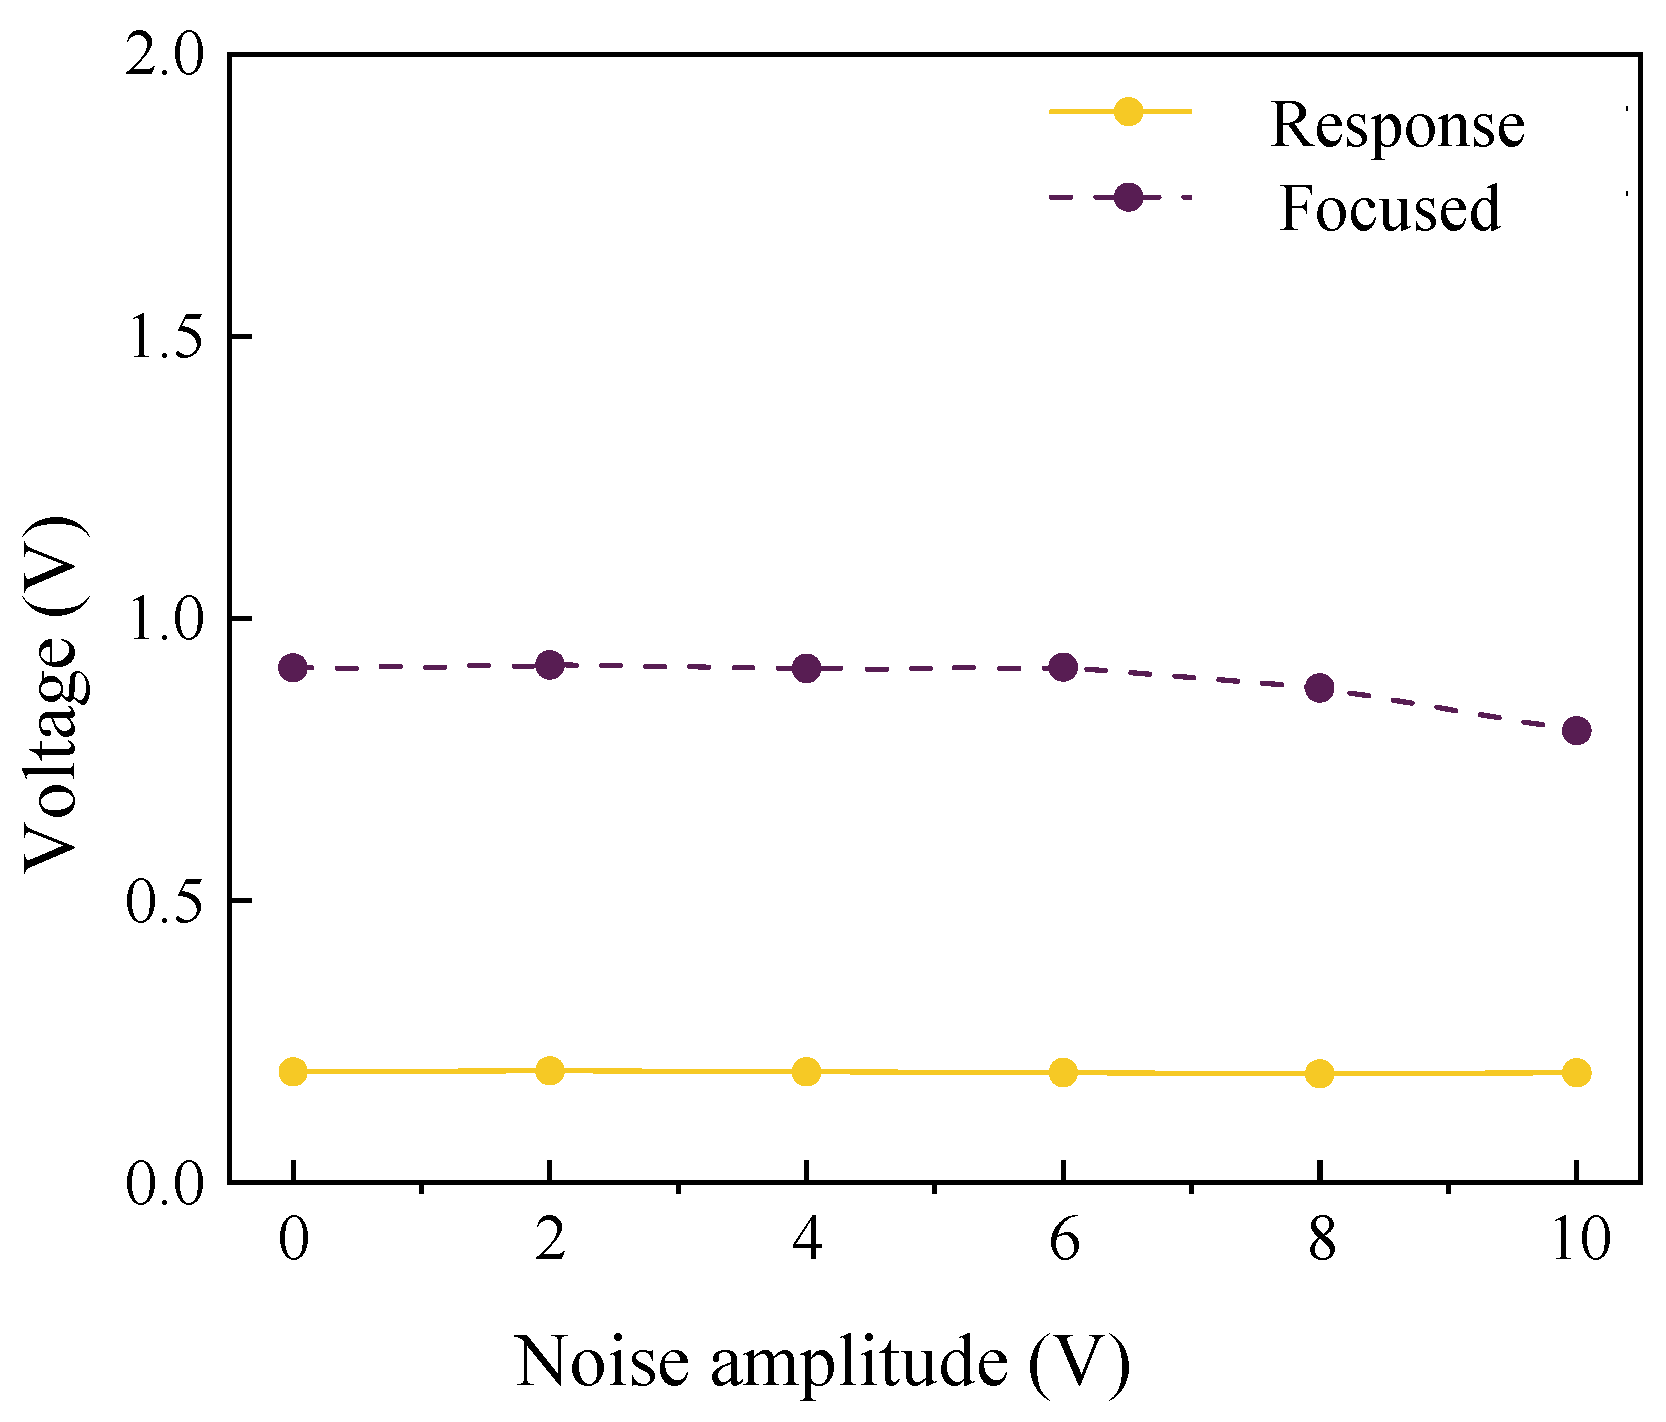
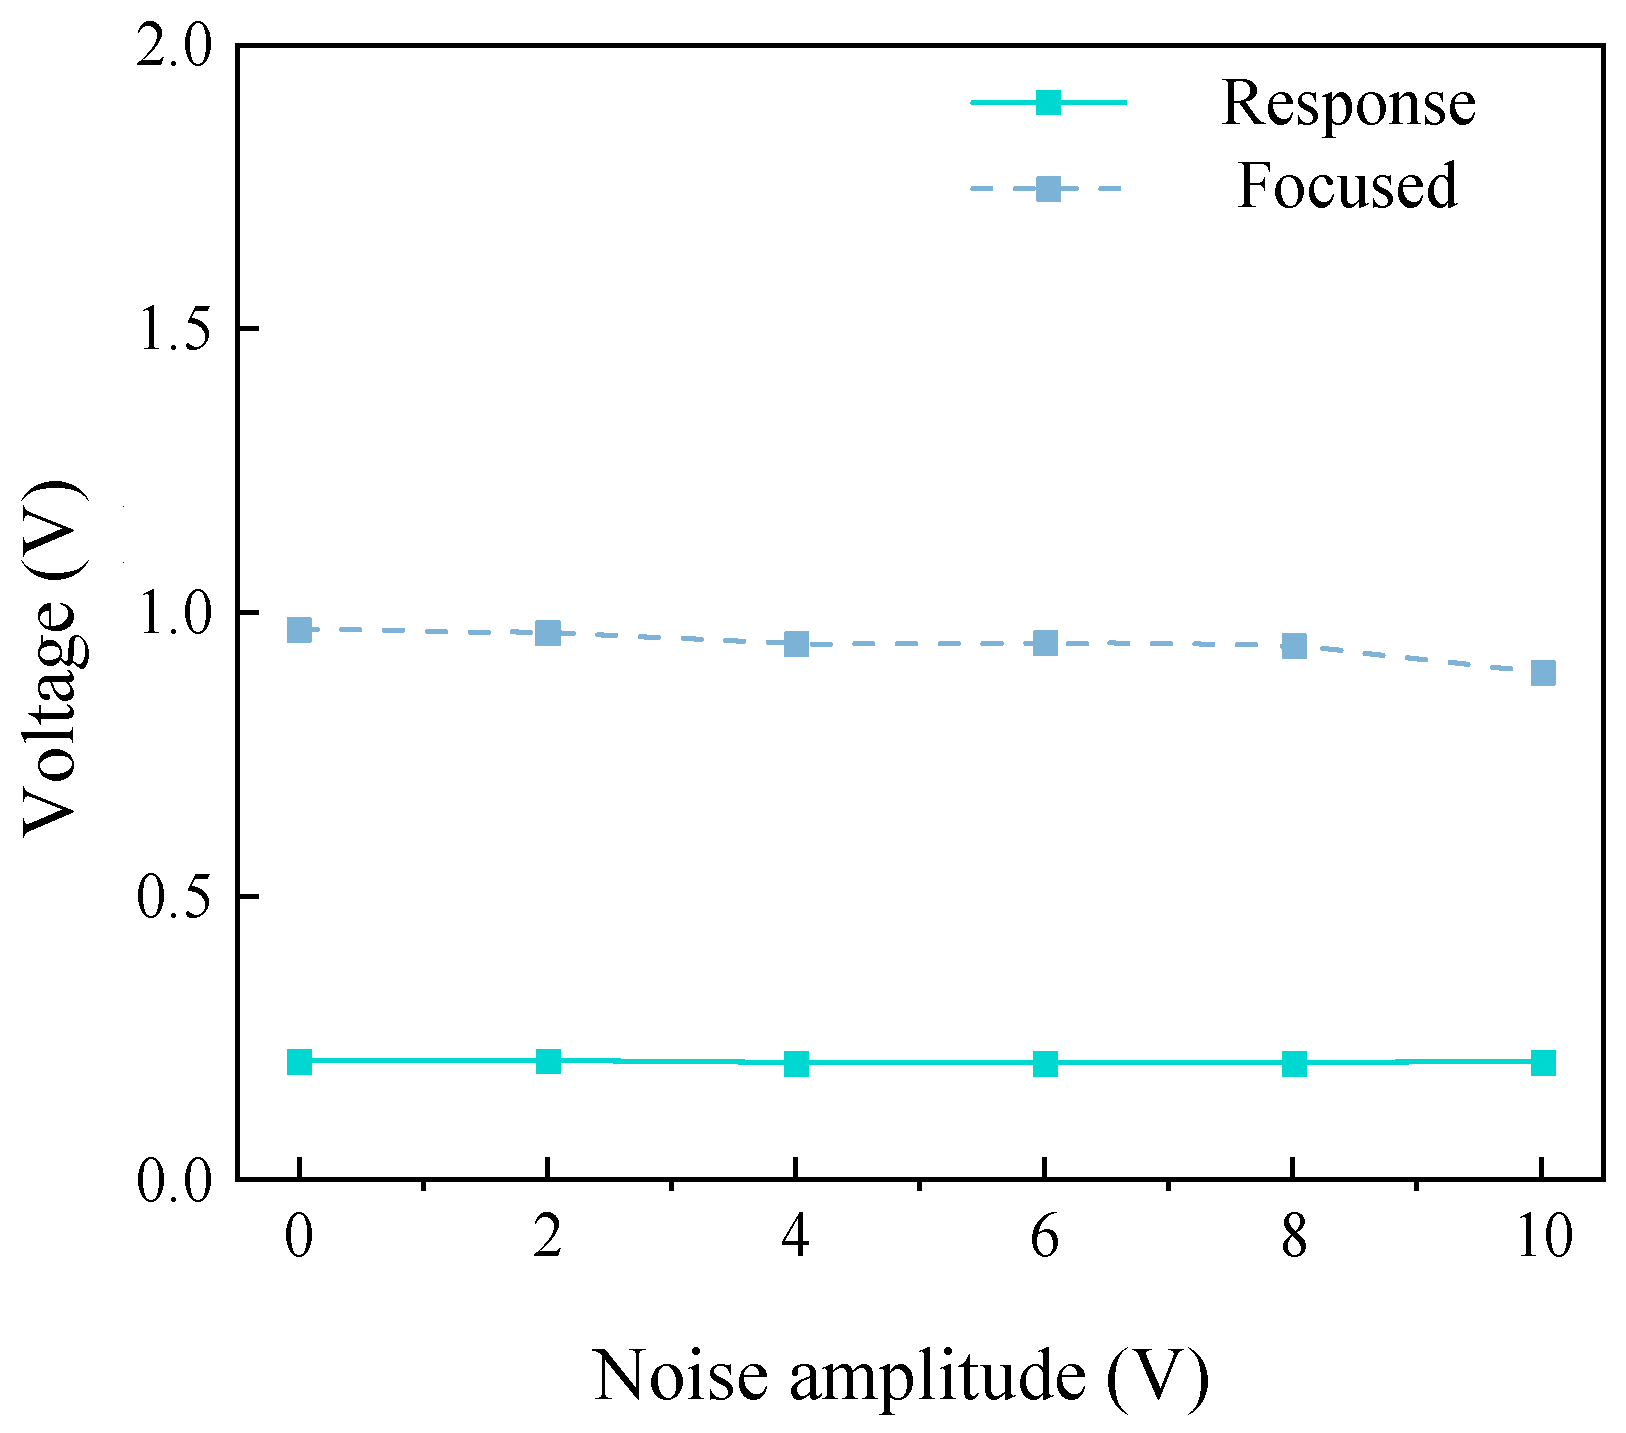
According to the results shown in Figure 11, Figure 12 and Figure 13, it can be observed that as the noise amplitude increases, the response signals for all three piezoelectric materials slightly decrease, but the change is not significant. This is because the noise primarily affects the overall peak value of the signal. Overall, the peak value of the PMN-PT response signal is consistently greater than that of the focused signal, directly attributable to its good SNR and high piezoelectric coefficient. The peak values of the focused signals for all three materials show a decreasing trend as environmental noise increases, with PMN-PT still outperforming the other two materials. The focused signal for PMN-PT increases by an average of approximately 4.89 times compared to the response signal. The focused signal for PZT increases by an average of approximately 4.58 times compared to the response signal. The focused signal for PVDF increases by an average of 4.51 times compared to the response signal. This difference in response and focused signal peaks can be attributed to the fact that the initial response signal peak for PMN-PT is higher than that of the other two materials. During the second excitation, when the ultrasonic signal is received, the higher piezoelectric coefficient of PMN-PT leads to a significantly larger peak value for the focused signal. This sequence reflects the materials’ piezoelectric coefficients, from high to low.
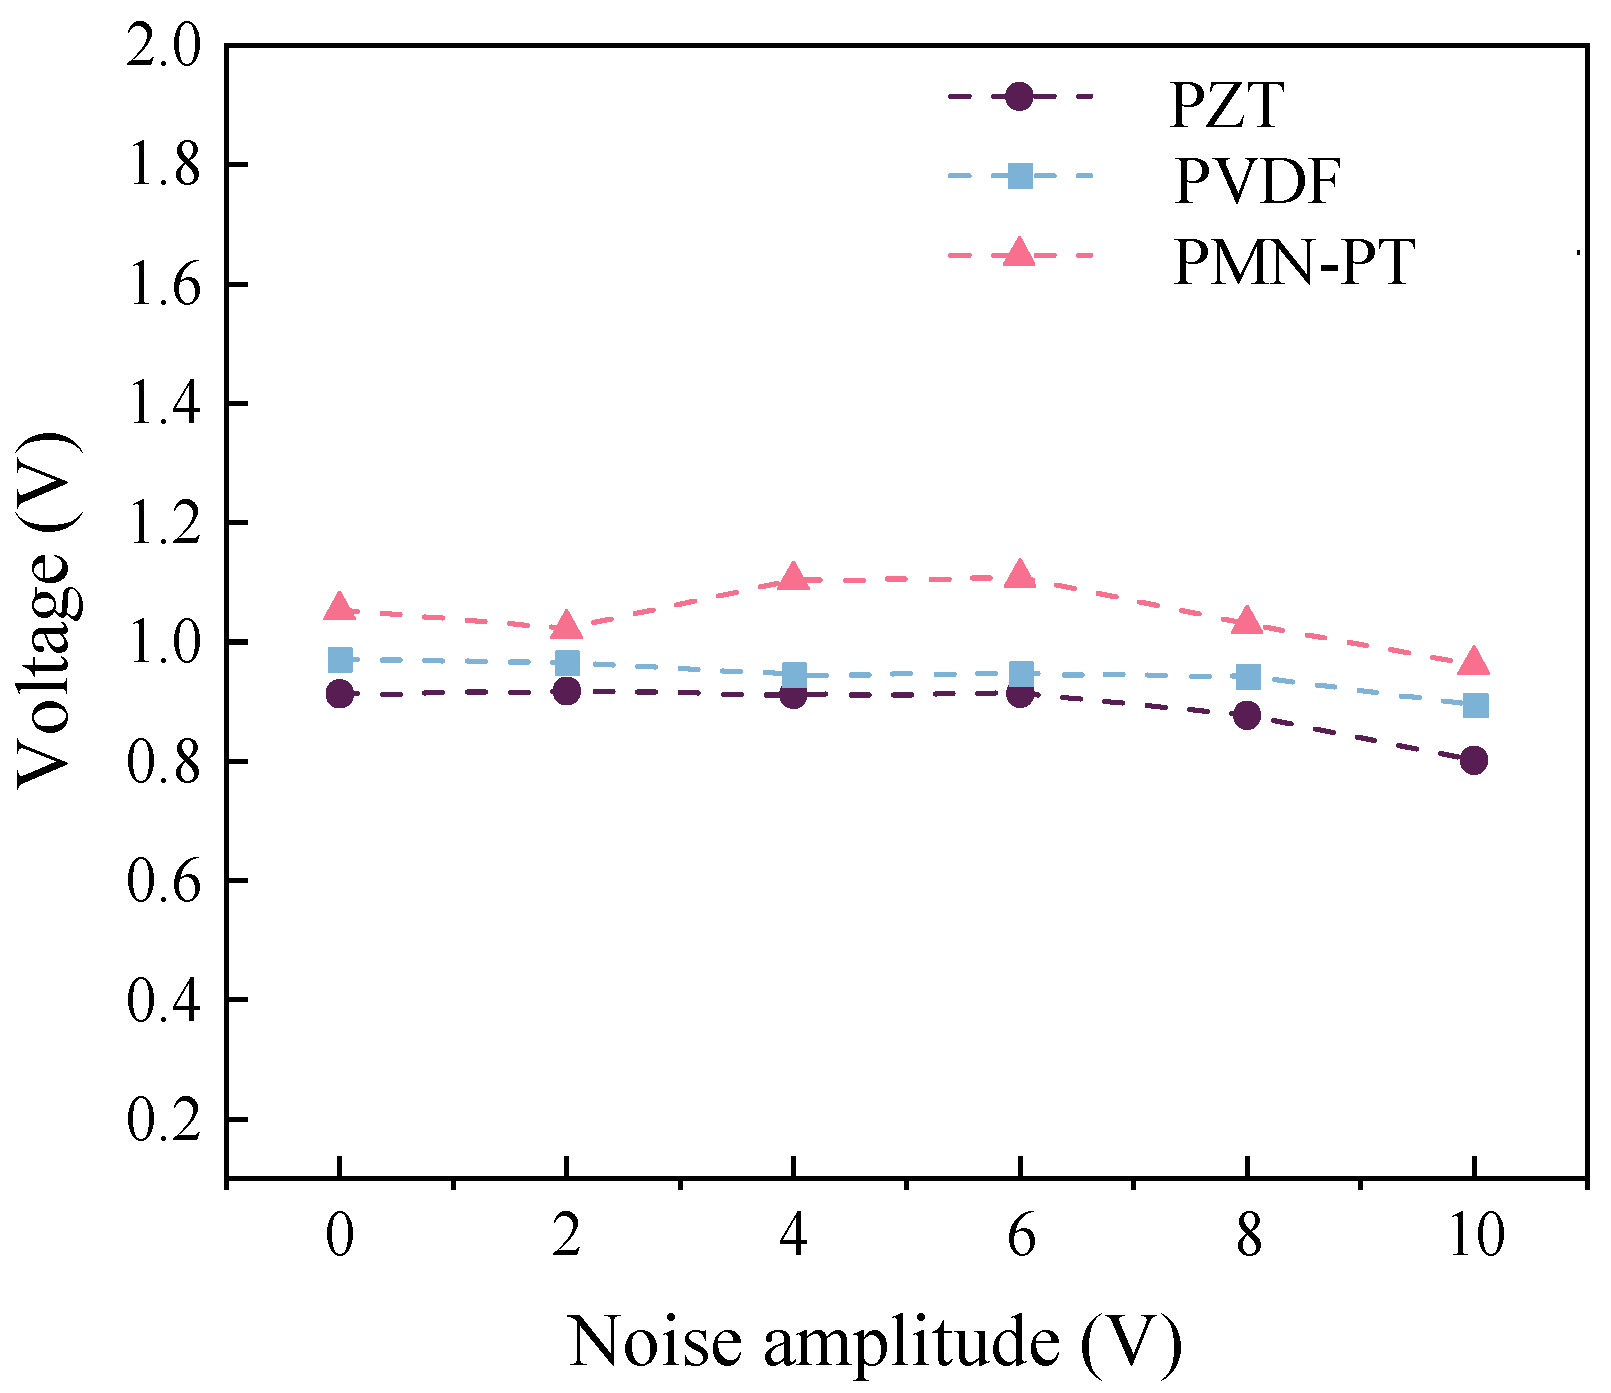
A comparison of the focused signal amplitudes for the three materials is shown in Figure 14. The data clearly show that PMN-PT yields better results compared to the other two materials. Through time-reversal processing, the results for all three materials significantly improved, with noticeable increases in voltage amplitude, demonstrating the time- and space-focusing capability of the time-reversal algorithm. In the experimental results, the difference between the response and focused signals for the three piezoelectric materials is relatively small, but their piezoelectric coefficients vary greatly. Theoretically, there should be a significant distinction between the peak values of the response and focused signals for the three materials. The reasons for this discrepancy may include the following: (1) PZT and PVDF are commercial sensors, and differences in wire soldering and silver polarization compared to the homemade sensors could account for significant variations. (2) The coupling between the piezoelectric materials and the steel plate during sensor attachment could also cause noticeable differences. However, the ranking of signal amplitudes aligns with the sequence of piezoelectric coefficients. In summary, PMN-PT piezoelectric composite materials exhibit superior noise reduction performance compared to PZT ceramics and PVDF films. Time-reversal technology significantly optimizes the received voltage amplitude, especially in noisy environments, demonstrating its effectiveness in improving signal quality. However, the effectiveness of the time-reversal algorithm in enhancing voltage amplitude decreases as the level of environmental noise increases.

4. Bolt Preload Monitoring Test

4.1. Experimental Design

To validate the effectiveness of the time-reversal method in monitoring high-strength bolt preload, the experimental setup comprised two steel plates, high-strength bolts, and two PMN-PT sensors. The specifications of these components are detailed in Table 9.
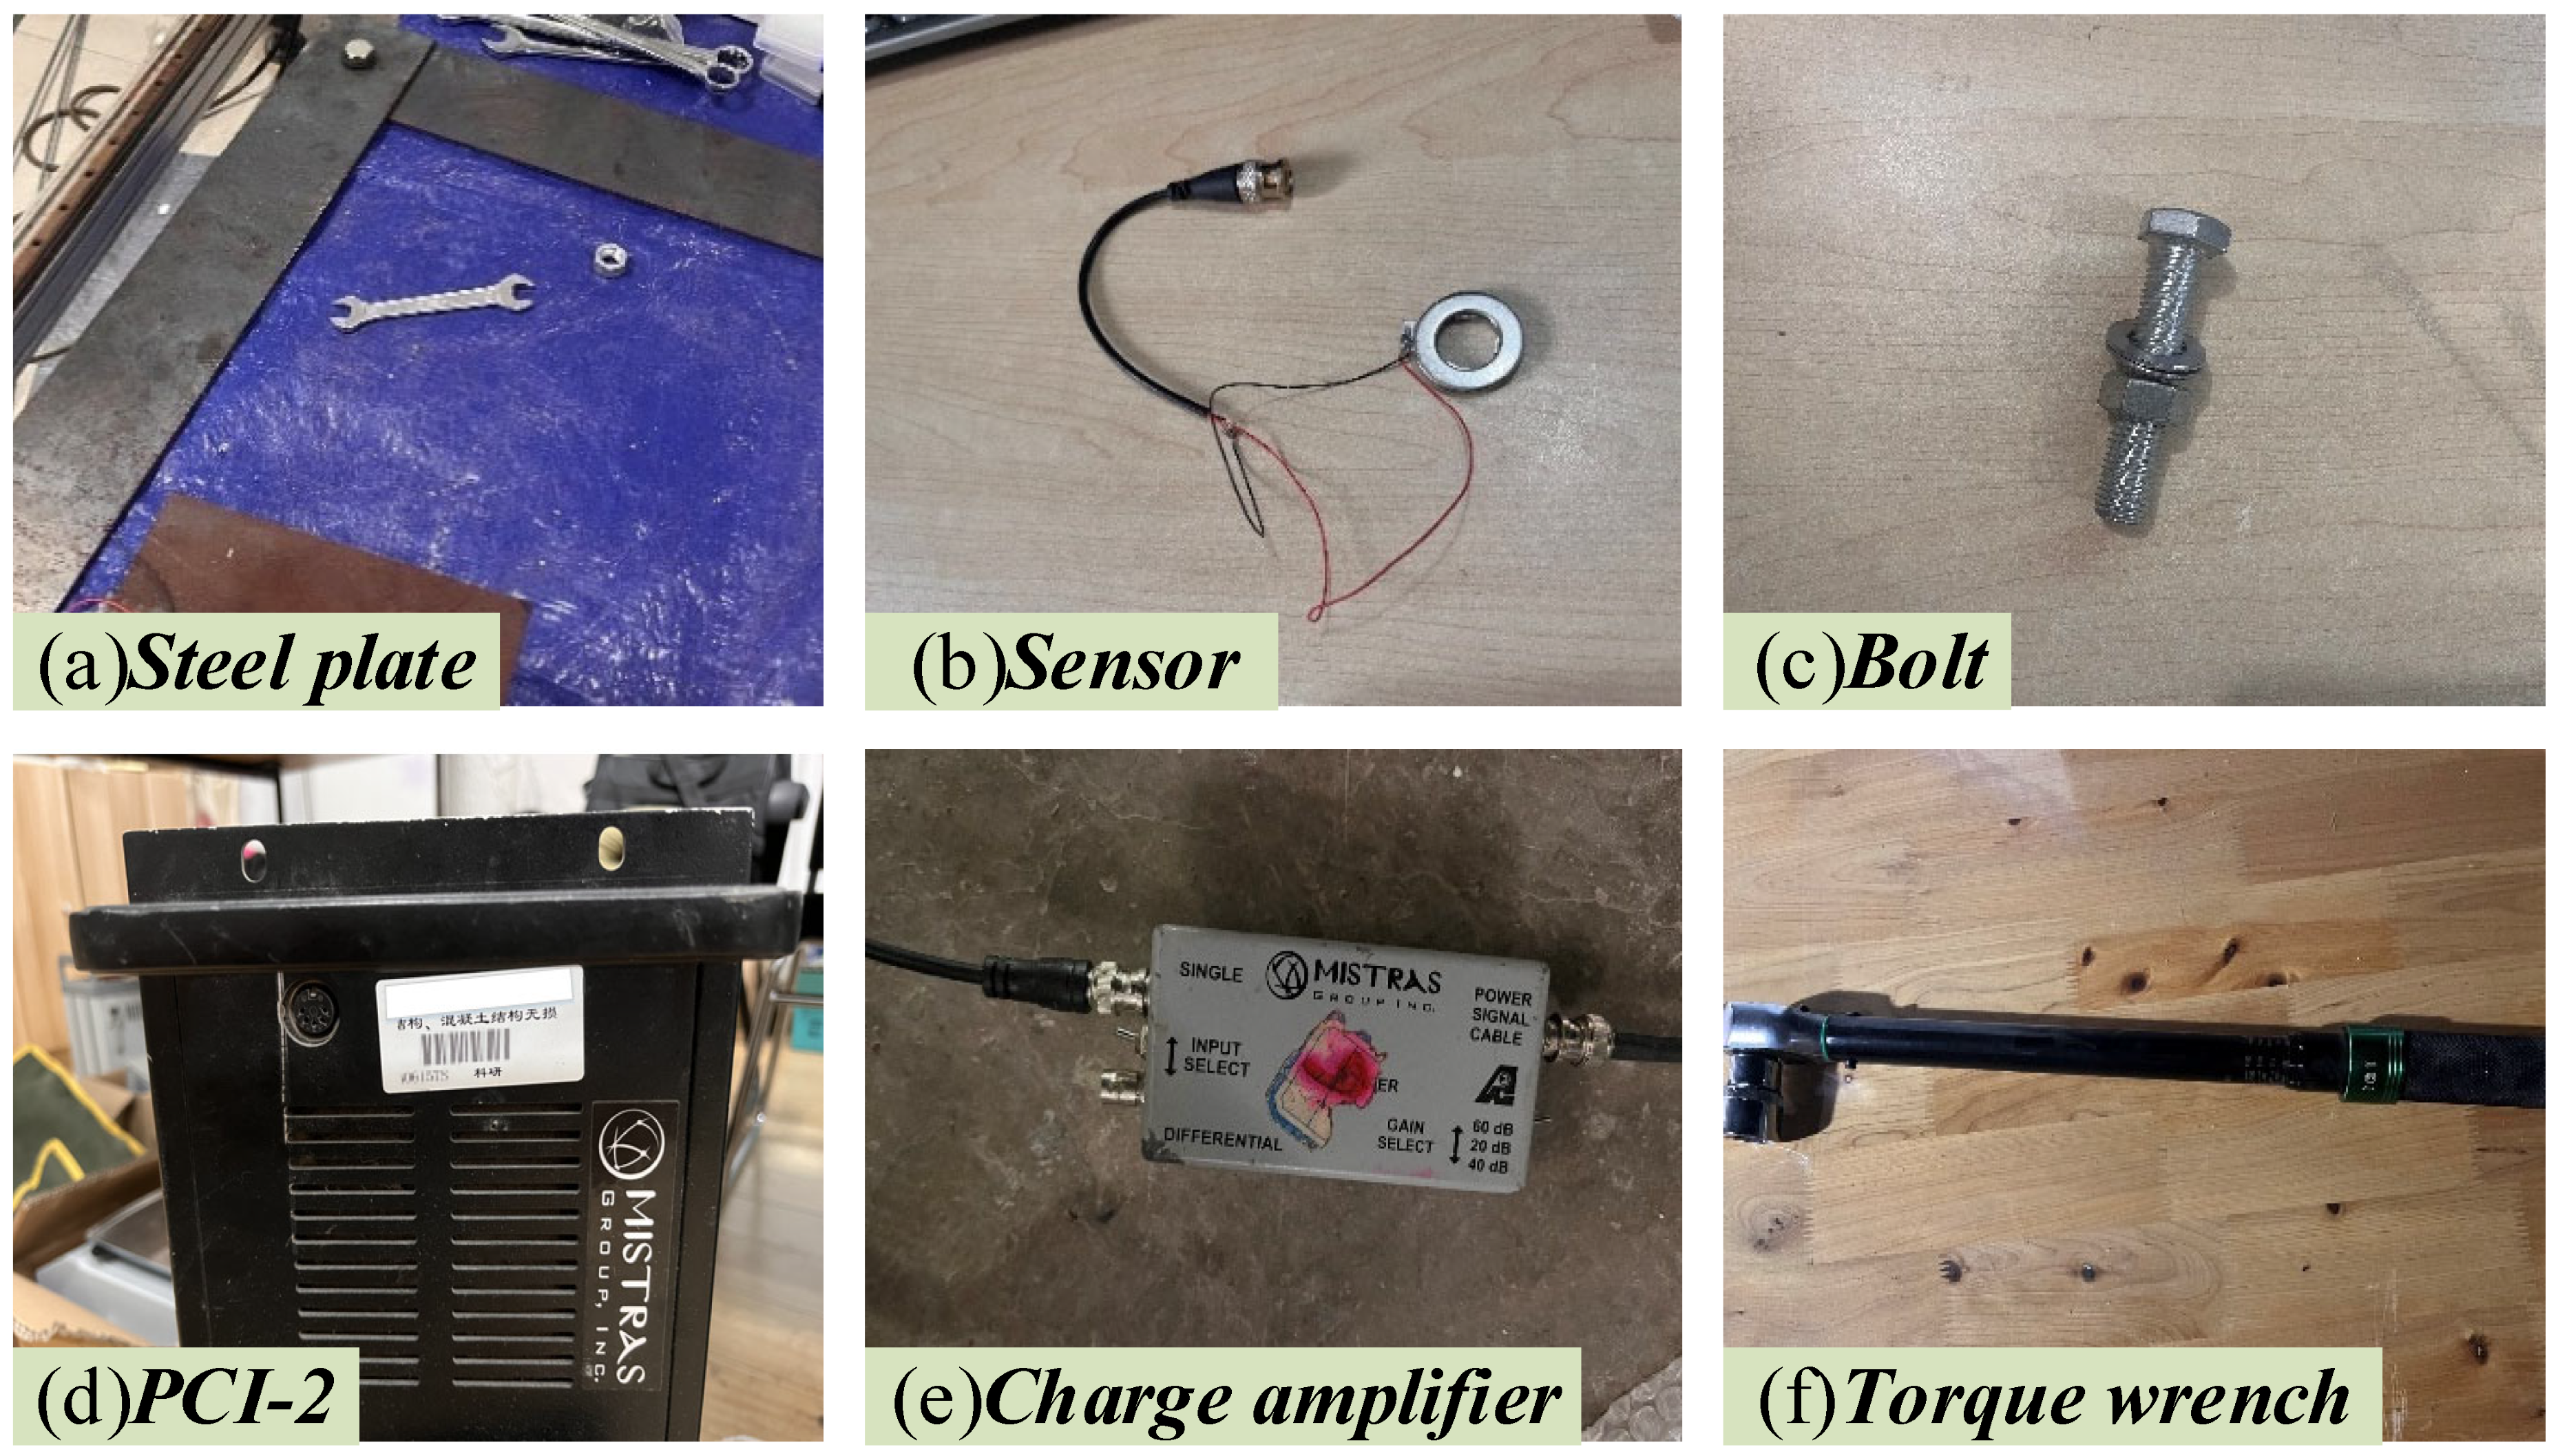
This section reports bolt preload experiments using the developed sensor system. The procedure involved adjusting bolt torque with a torque wrench, analyzing the relationship between preload variations and signal characteristics through received response signals and focused signal processing, deriving a fastening index via normalized data processing, and validating its accuracy through tests with unknown preload levels. Bolt preload refers to the axial force exerted between connected plates by the bolt-nut assembly. If the friction coefficient remains constant during torque application, the axial force shows a linear relationship with applied torque—higher torque corresponds to greater preload, thus enabling indirect preload assessment through torque measurements. The experimental workflow incrementally increased bolt torque while using ultrasonic techniques to monitor preload variations, thereby establishing correlations between preload levels and ultrasonic signal features. Material specifications and schematic diagrams are presented in Figure 15a–f and Figure 16.

4.2. Analysis of Test Results

4.2.1. Response Signal Analysis

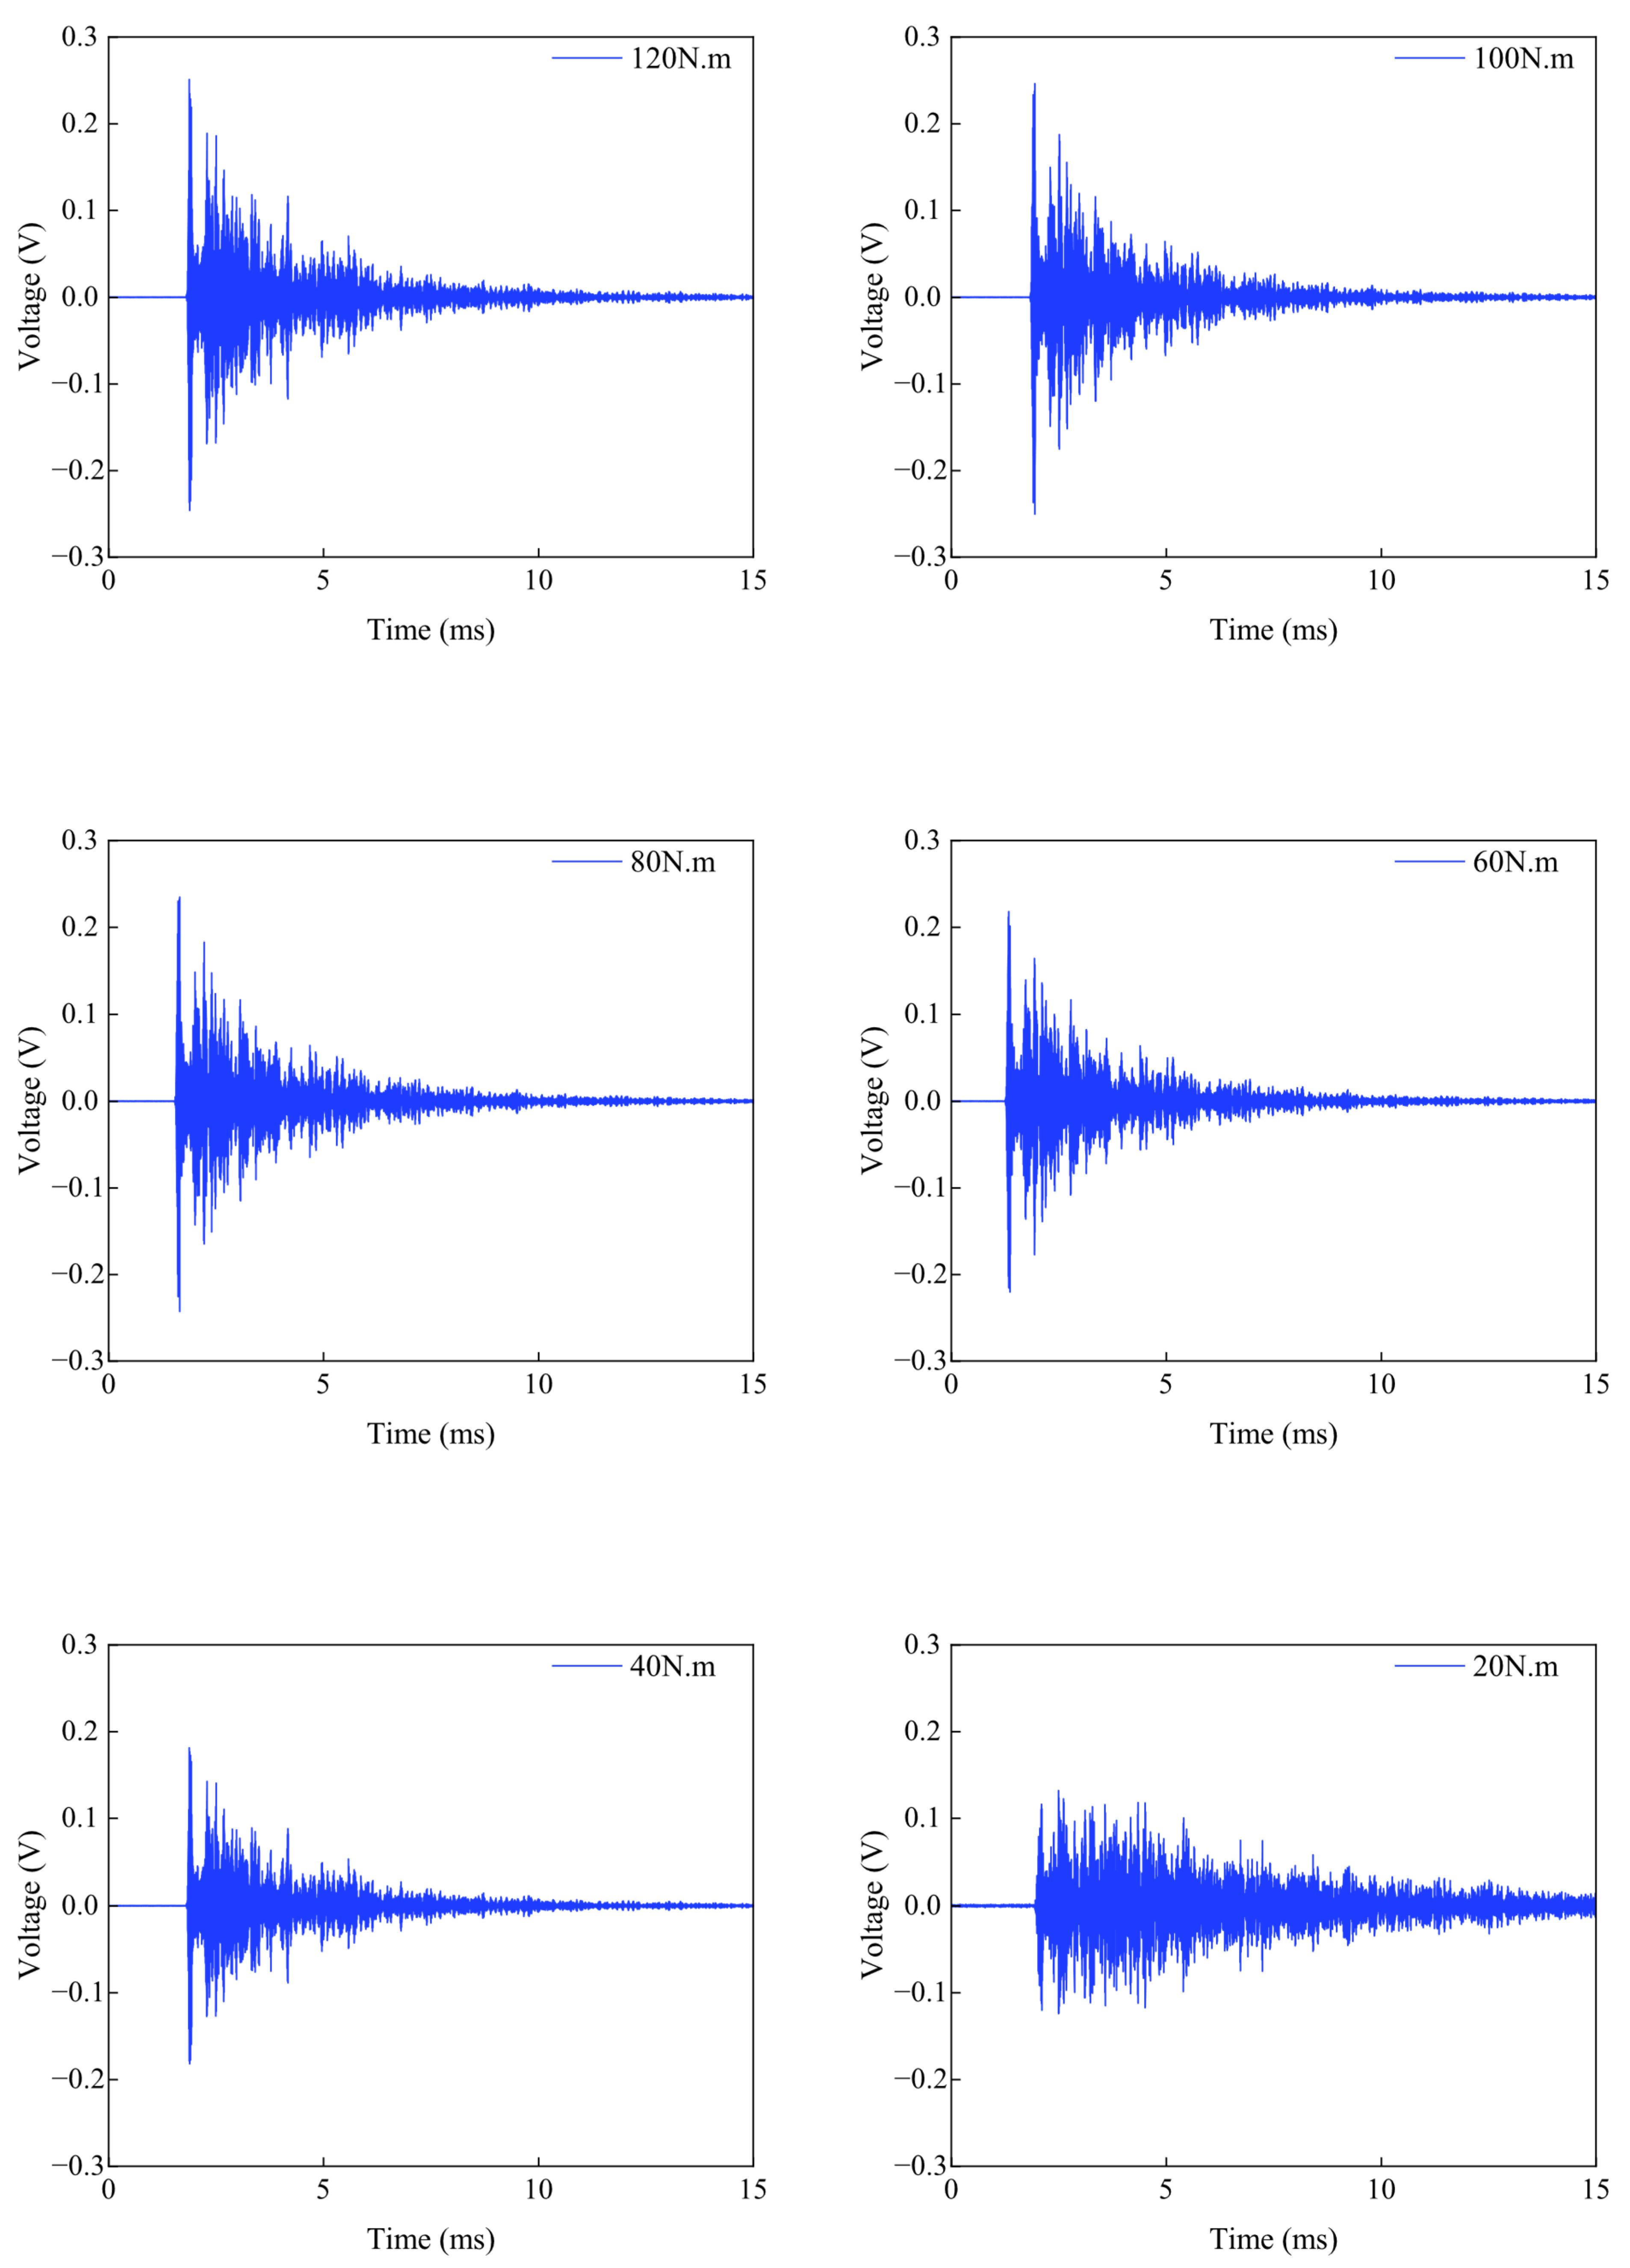
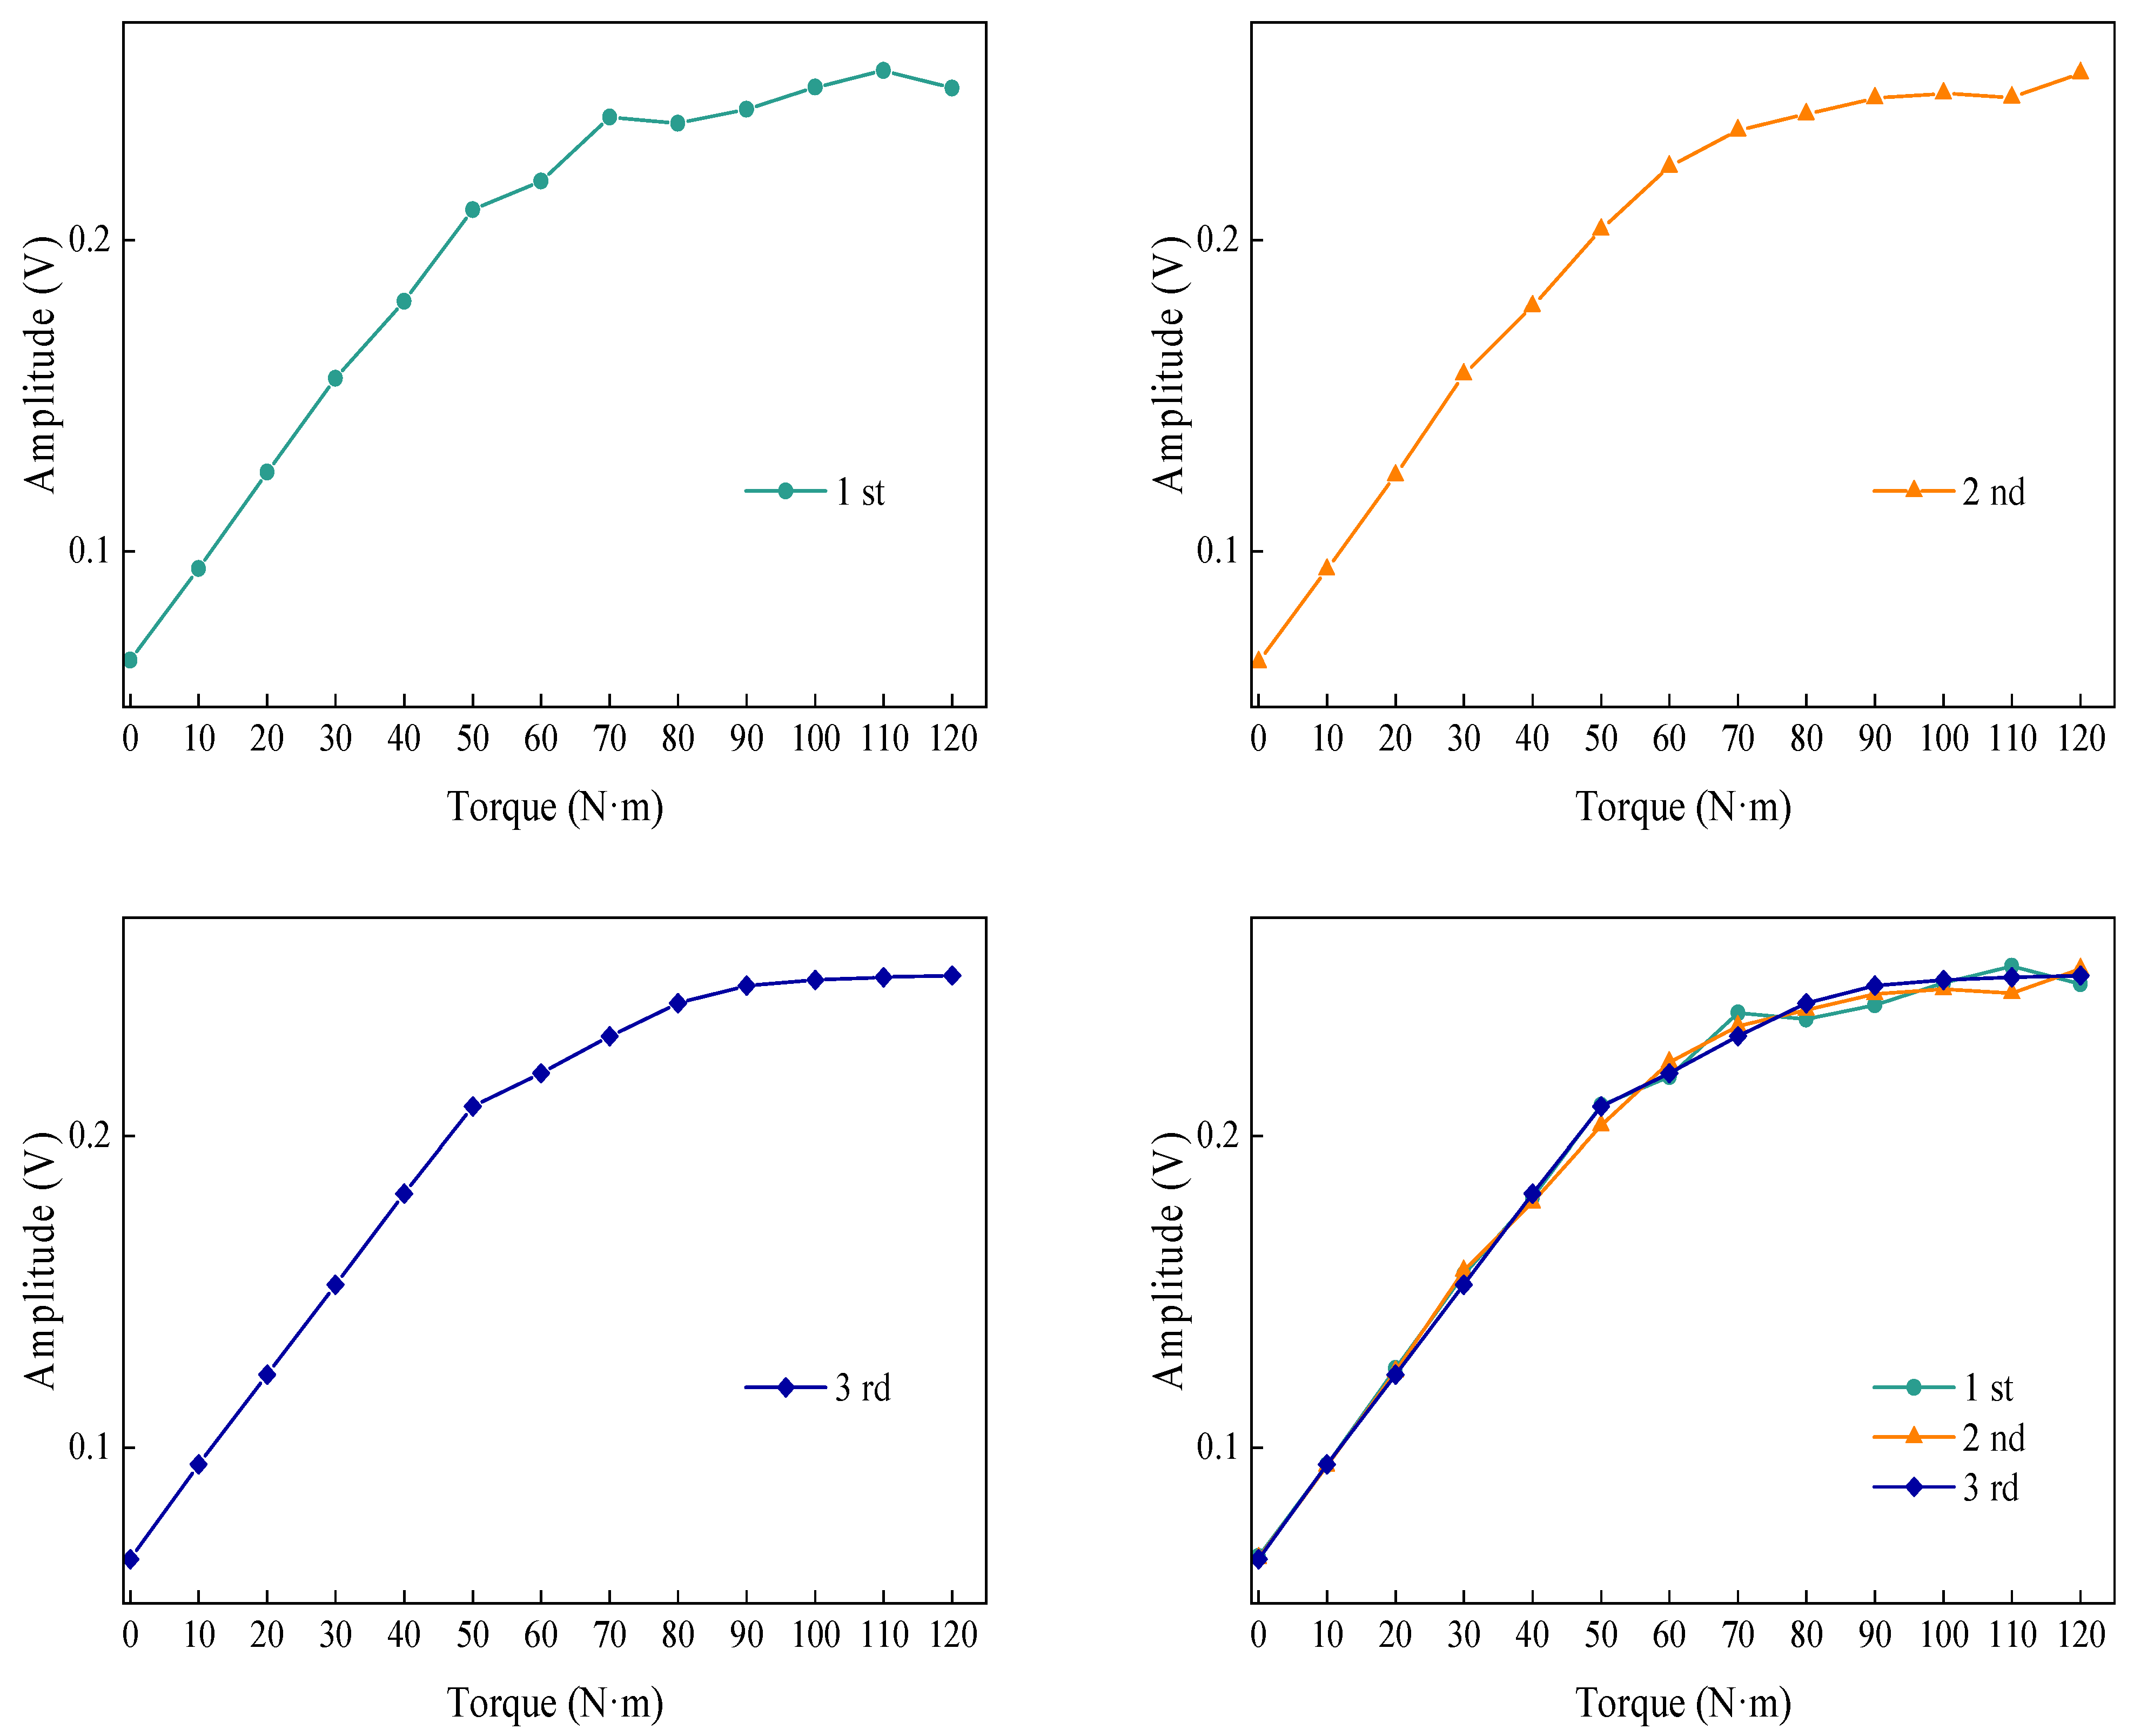
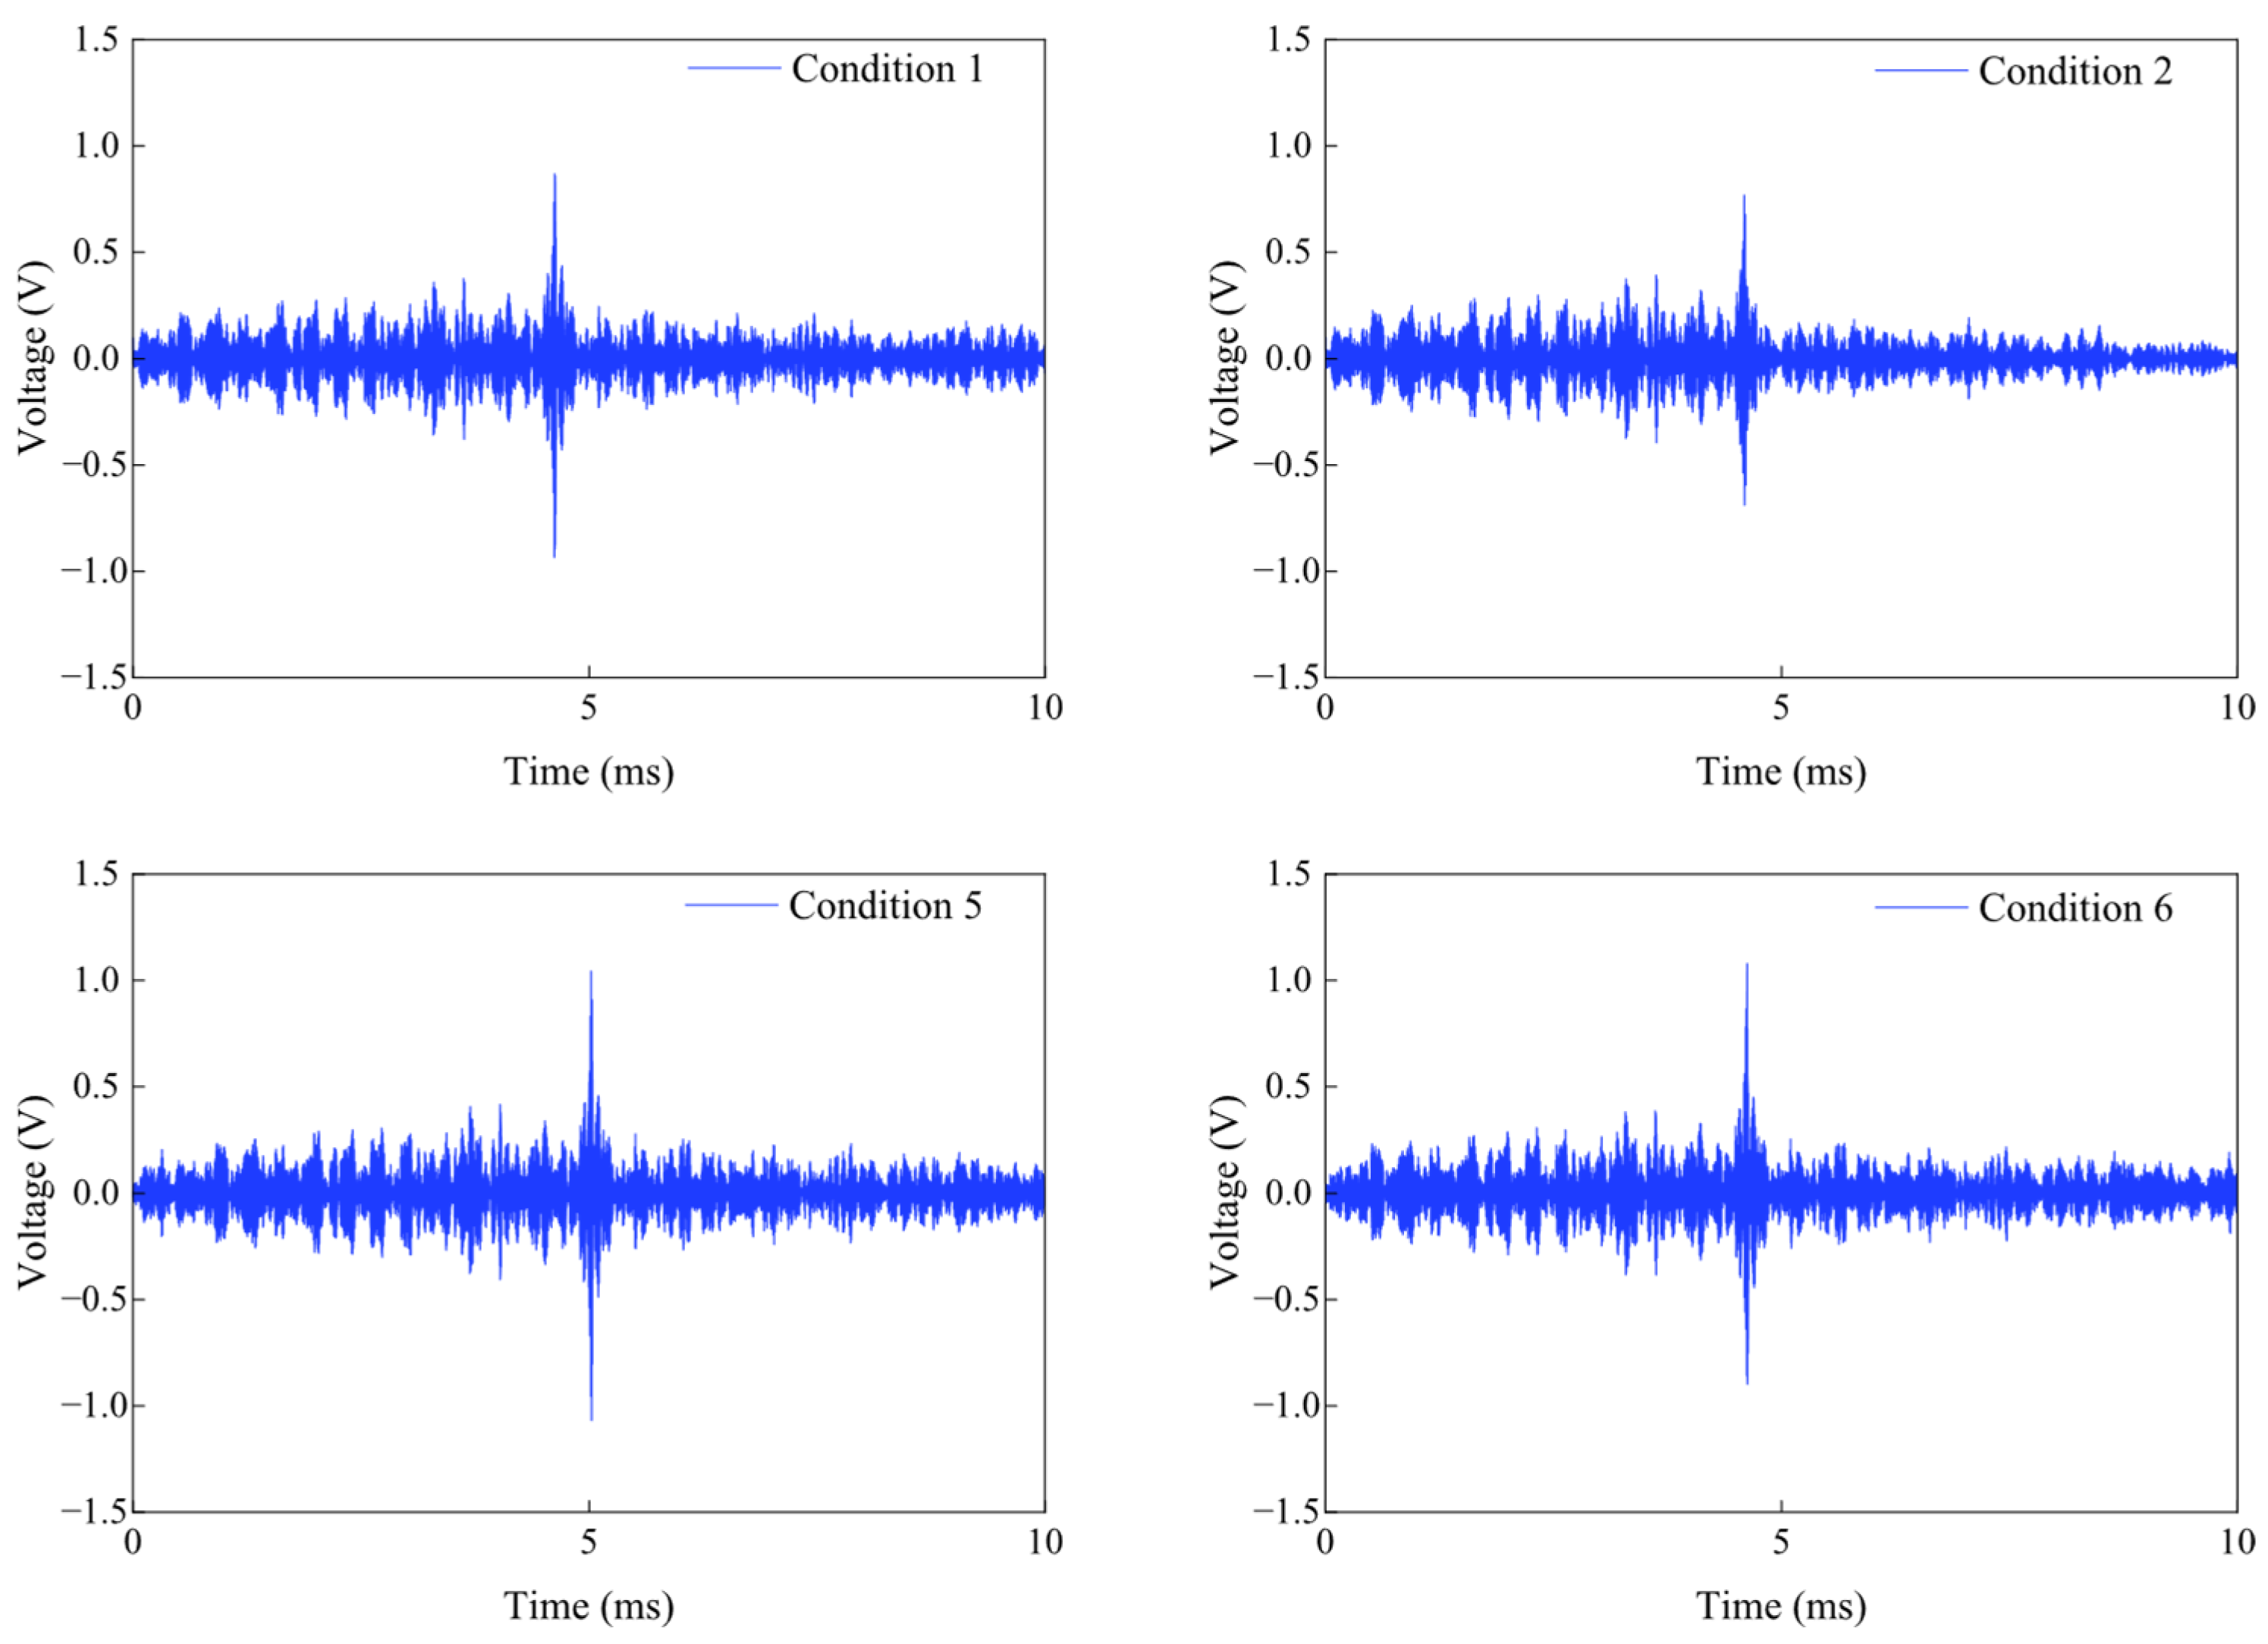
This section investigates the variation trends of received response signals under different operating conditions, with a focus on establishing the correlation between signal characteristics and bolt preload changes. In the first experimental group, Figure 16 and Figure 17 present the voltage time-domain plots of ultrasonic waves transmitted from Actuator A through the high-strength bolted connection to Receiver B. Three sets of peak signals corresponding to different torque levels were subsequently fitted to quantify the relationship between directly received response signals and applied bolt torque, as shown in Figure 18.
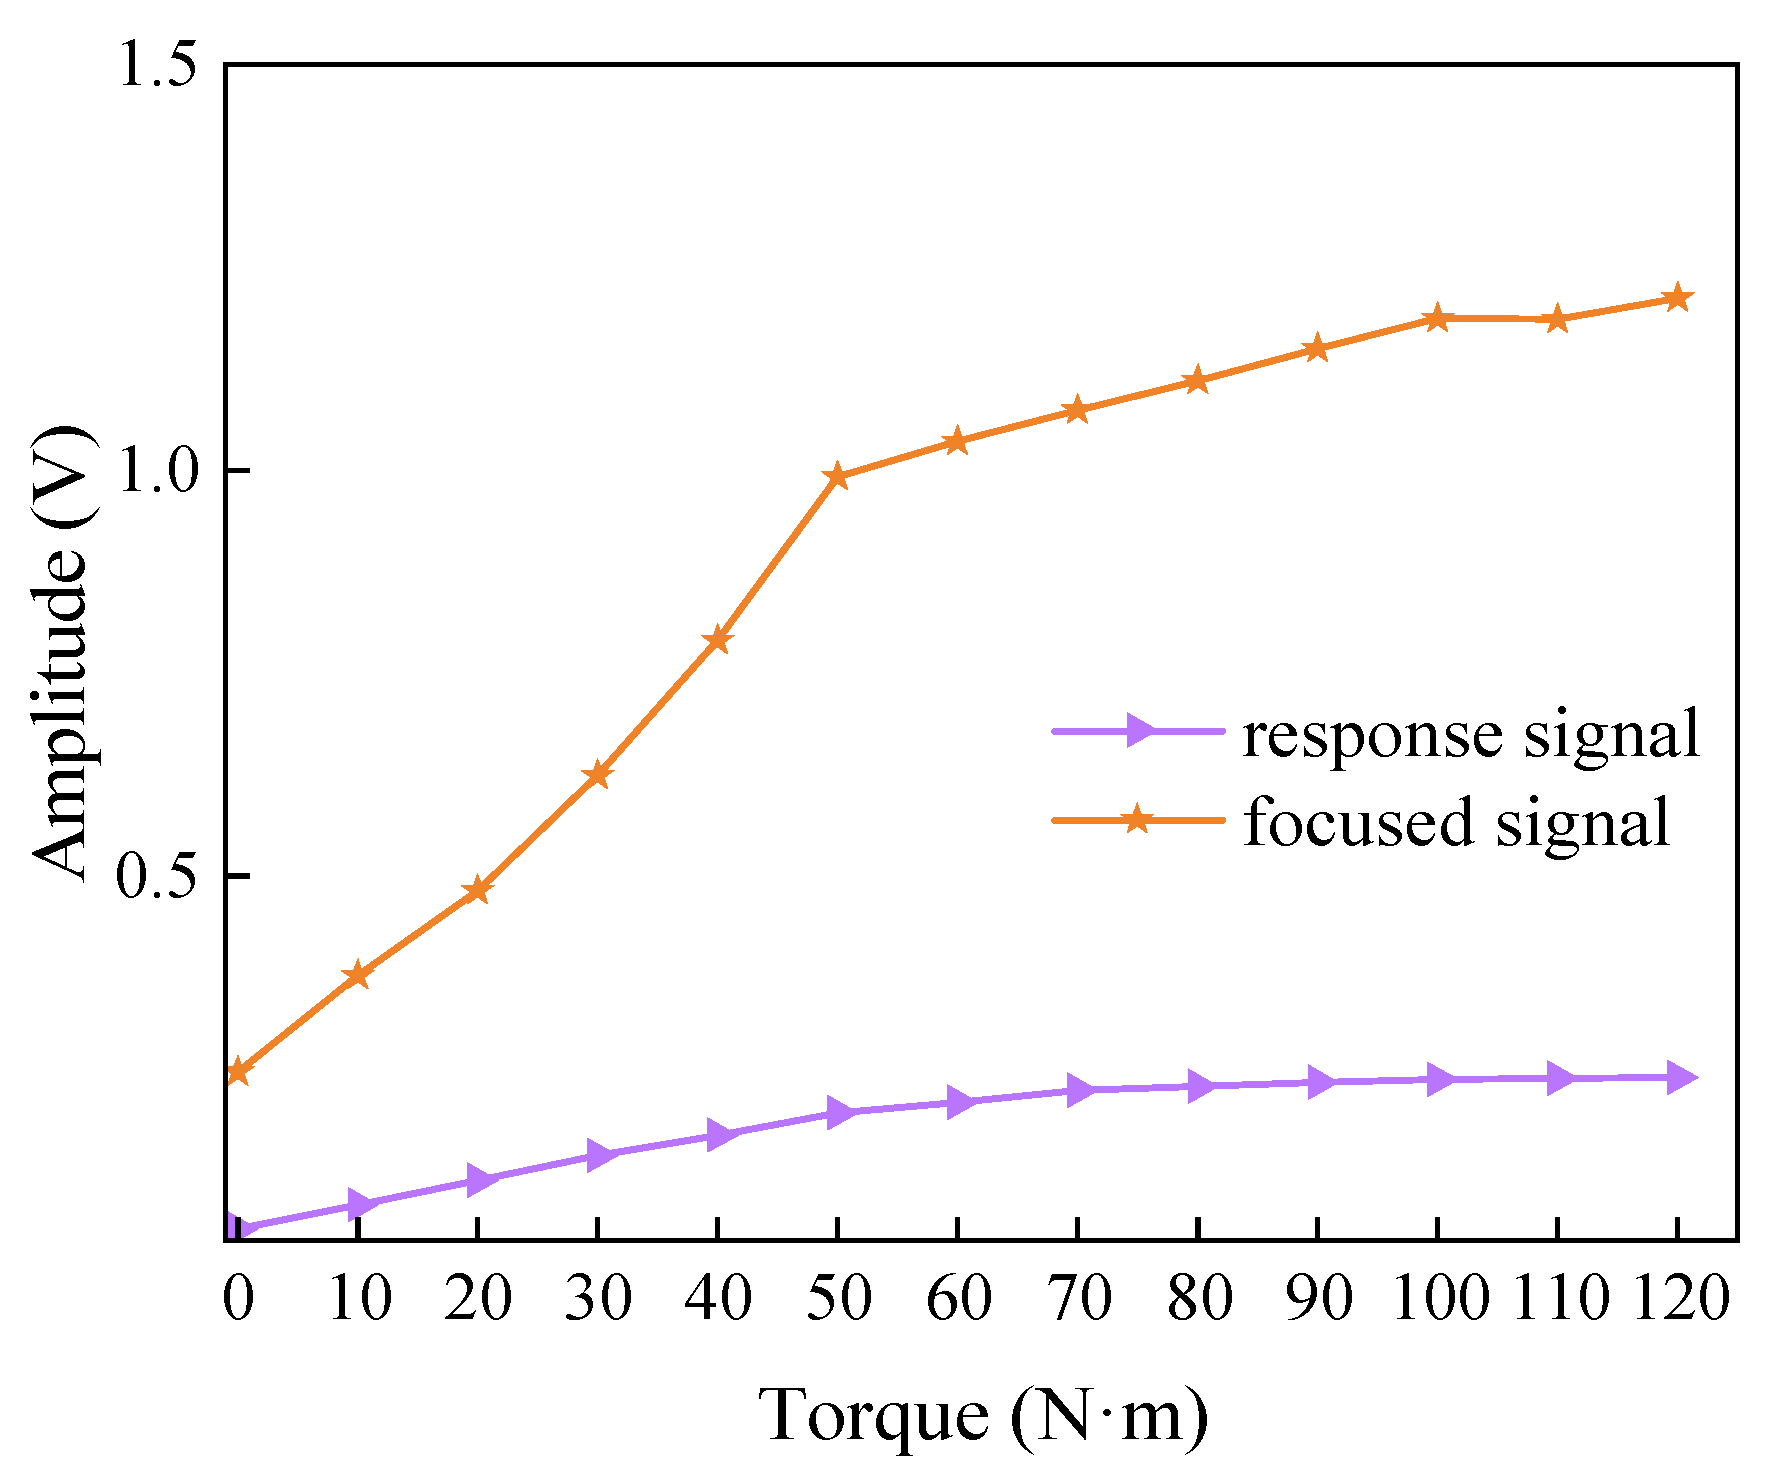
The results shown in Figure 17 and Figure 18 demonstrate a linear correlation between the response signal amplitude and bolt preload. As the applied torque increases, the peak amplitude of the response signals correspondingly rises. Notably, within the 80–120 N·m torque range, signal variations diminish significantly, indicating stable bolt fastening with minimal changes in the actual contact area between connected components. Under this condition, ultrasonic wave propagation experiences reduced energy reflection and dissipation. Conversely, within the 0–50 N·m torque range, substantial signal amplitude fluctuations are observed due to pronounced energy reflection and loss caused by bolt loosening. The transitional 60–80 N·m torque range exhibits intermediate signal behavior, reflecting partial stabilization of the interfacial contact during the tightening process.

4.2.2. Focused Signal Analysis

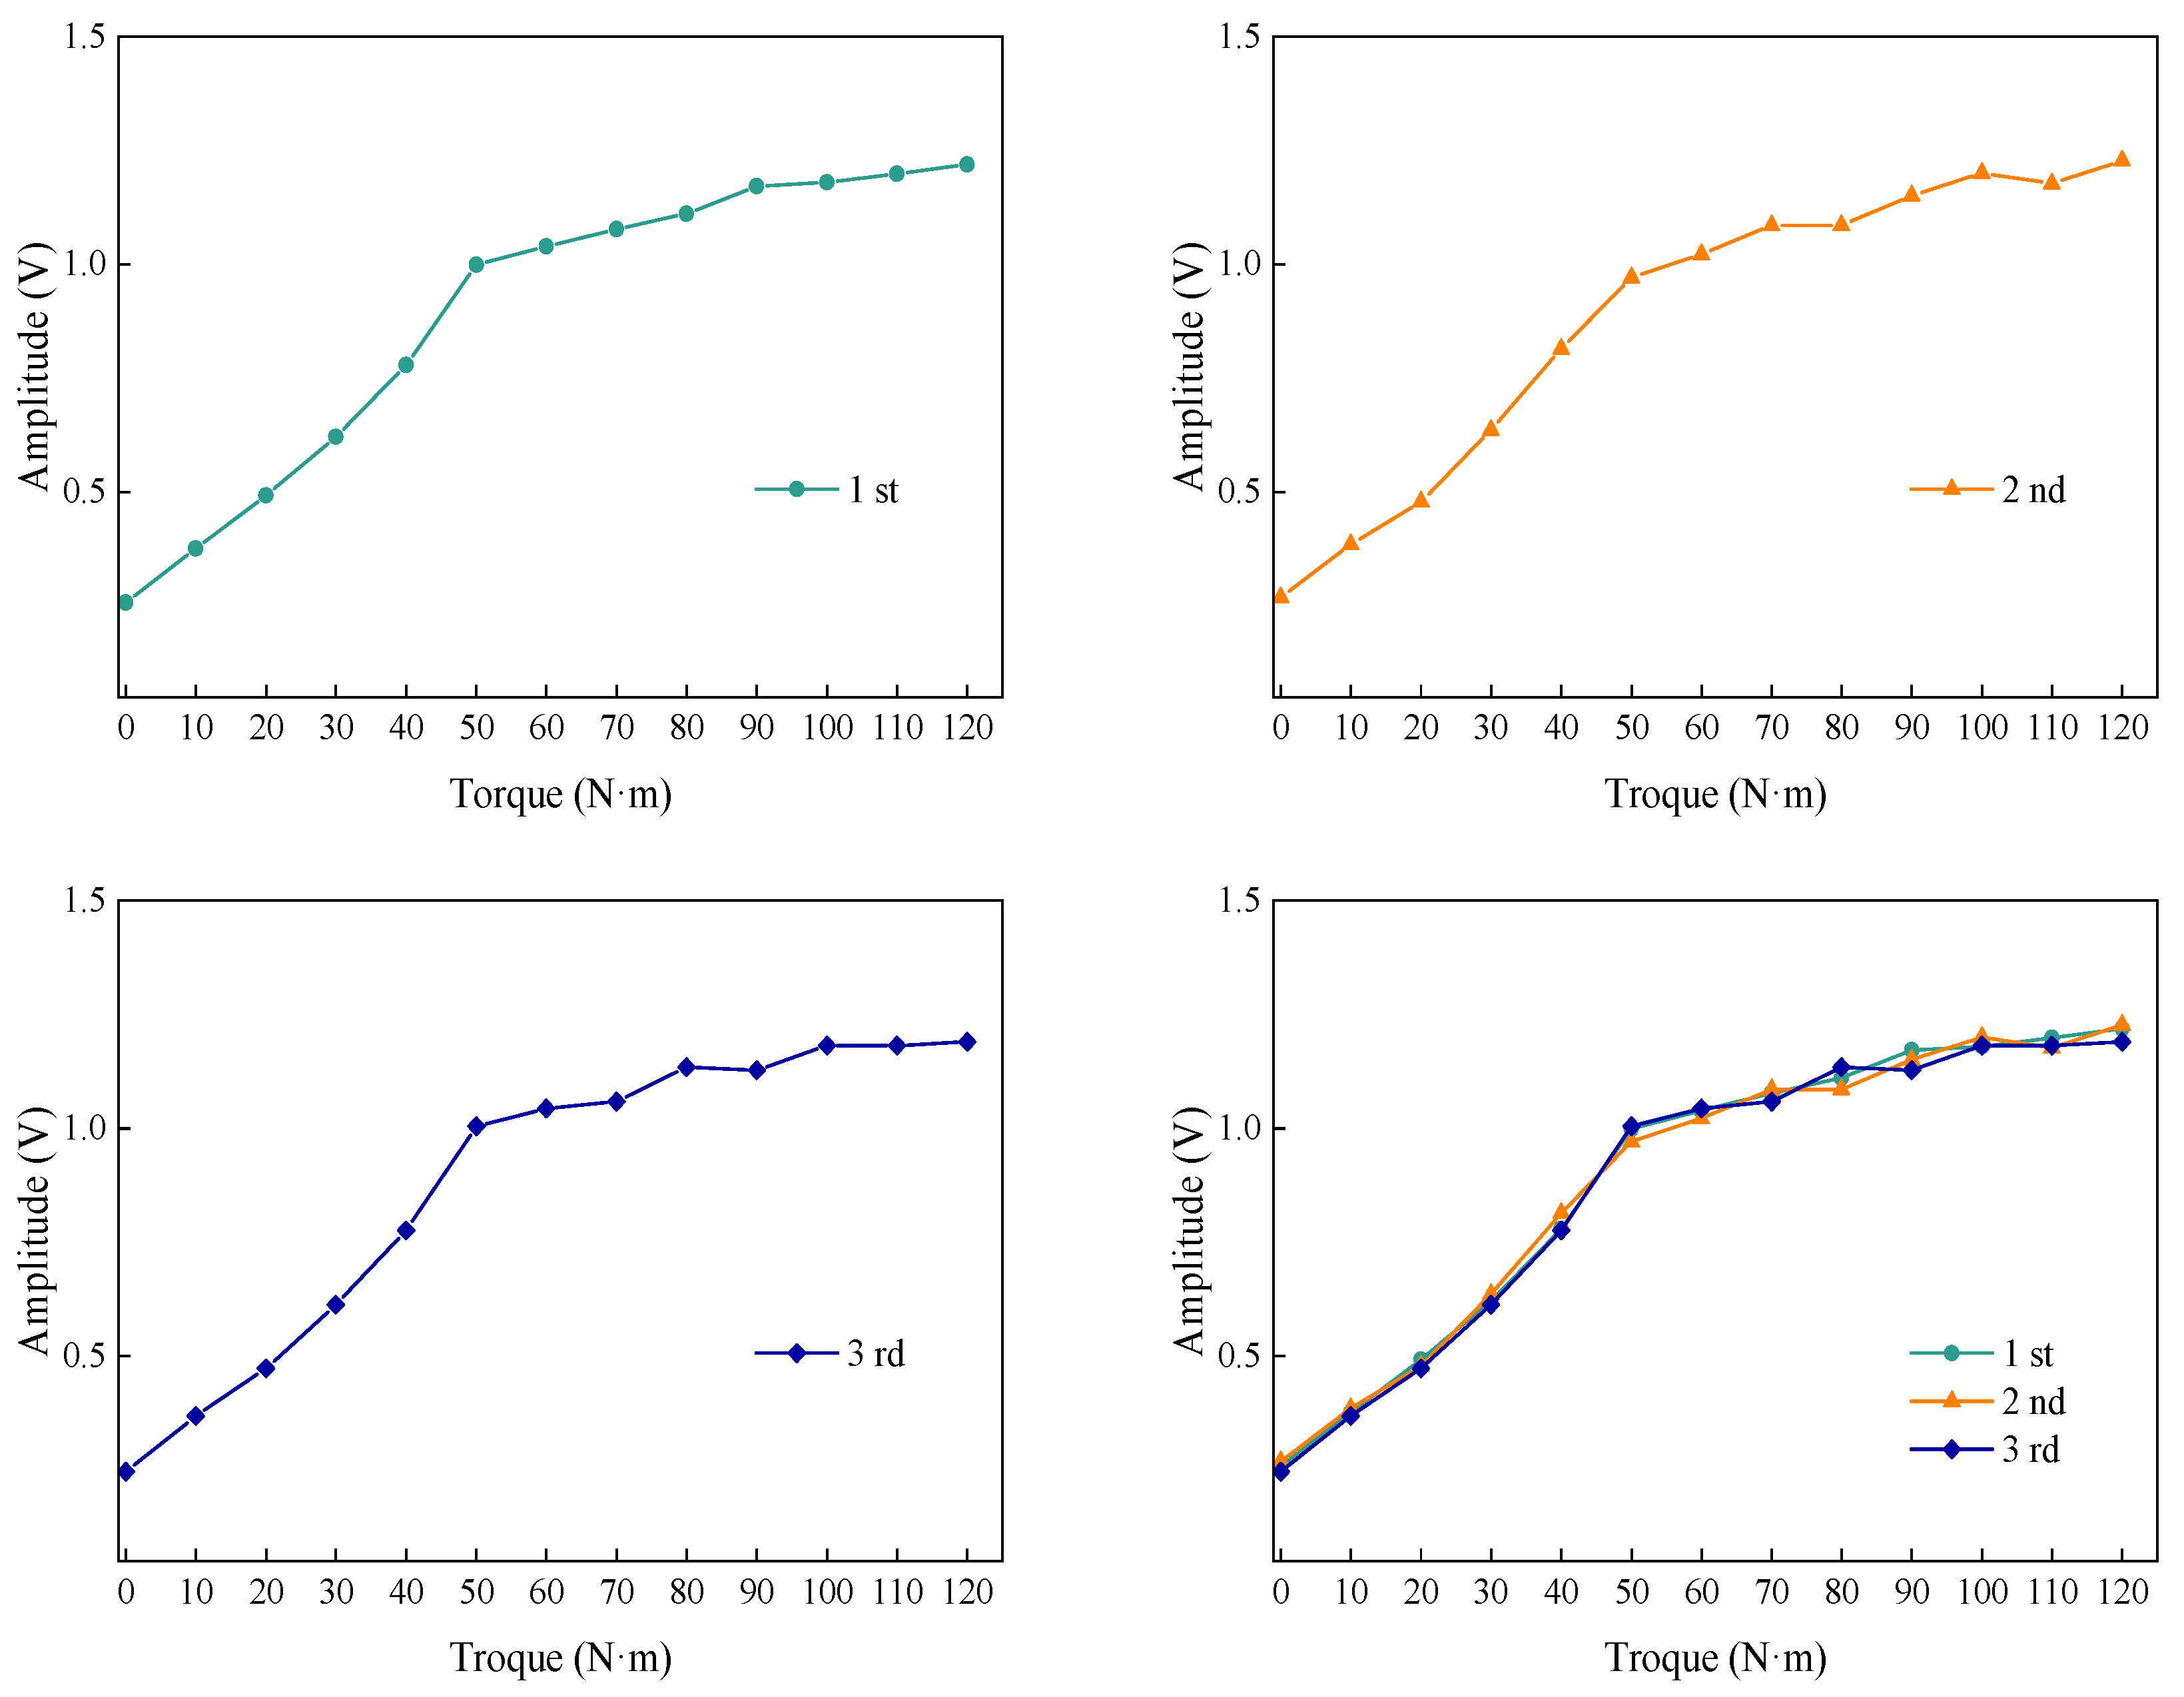
The bolt preload experiments based on the time-reversal method maintained fixed actuator–sensor positions. Temporal discrepancies in the initial ultrasonic excitation received by Sensor B were corrected by adjusting the transmission sequence of the secondary excitation signals, ensuring that energy from variably timed wavefronts reconverged at the source to achieve focused energy amplification. Since all signals propagated through identical paths, their coherent superposition at Sensor A generated a localized energy peak with a significantly amplified amplitude compared to adjacent temporal regions. Figure 19 presents representative focused signal time-domain diagrams from the first experimental group, while Figure 20 illustrates the fitted relationship between the time-reversed focused signal peaks and applied bolt torque across three preload levels.
Figure 19 and Figure 20 demonstrate that the peak amplitude of the focused signal decreases linearly with reduced bolt preload. During the initial tightening phase (0–50 N·m), the voltage amplitude exhibits rapid growth, reflecting significant ultrasonic energy dissipation caused by substantial variations in the actual contact area of loose bolted connections. As the preload increases to 60–90 N·m, the amplitude growth rate slows, indicating stabilized contact conditions and reduced energy loss. When the preload further reaches 100–120 N·m, the amplitude stabilizes around 1.212 V with minimal variation, demonstrating that additional mechanical tightening has negligible effects on ultrasonic signal characteristics due to saturated interfacial contact.

4.2.3. Comparative Analysis of Response Signal and Focused Signal

Figure 21 compares the voltage amplitudes of time-reversed focused signals and directly received response signals under varying bolt preload levels. Both signal types exhibit increasing amplitudes with applied torque, showing significant variations during initial tightening stages (0–50 N·m) and progressively stabilizing as the bolt approaches full fastening. In low preload conditions, both signals serve as viable indicators for preload assessment. However, when the torque reaches 50 N·m, the response signal demonstrates diminished sensitivity to further preload changes, while the focused signal maintains pronounced amplitude variations, establishing its reliability as the primary evaluation metric for medium-to-high preload monitoring.

4.3. Evaluation of Bolt Preload Condition

4.3.1. Fastening Index

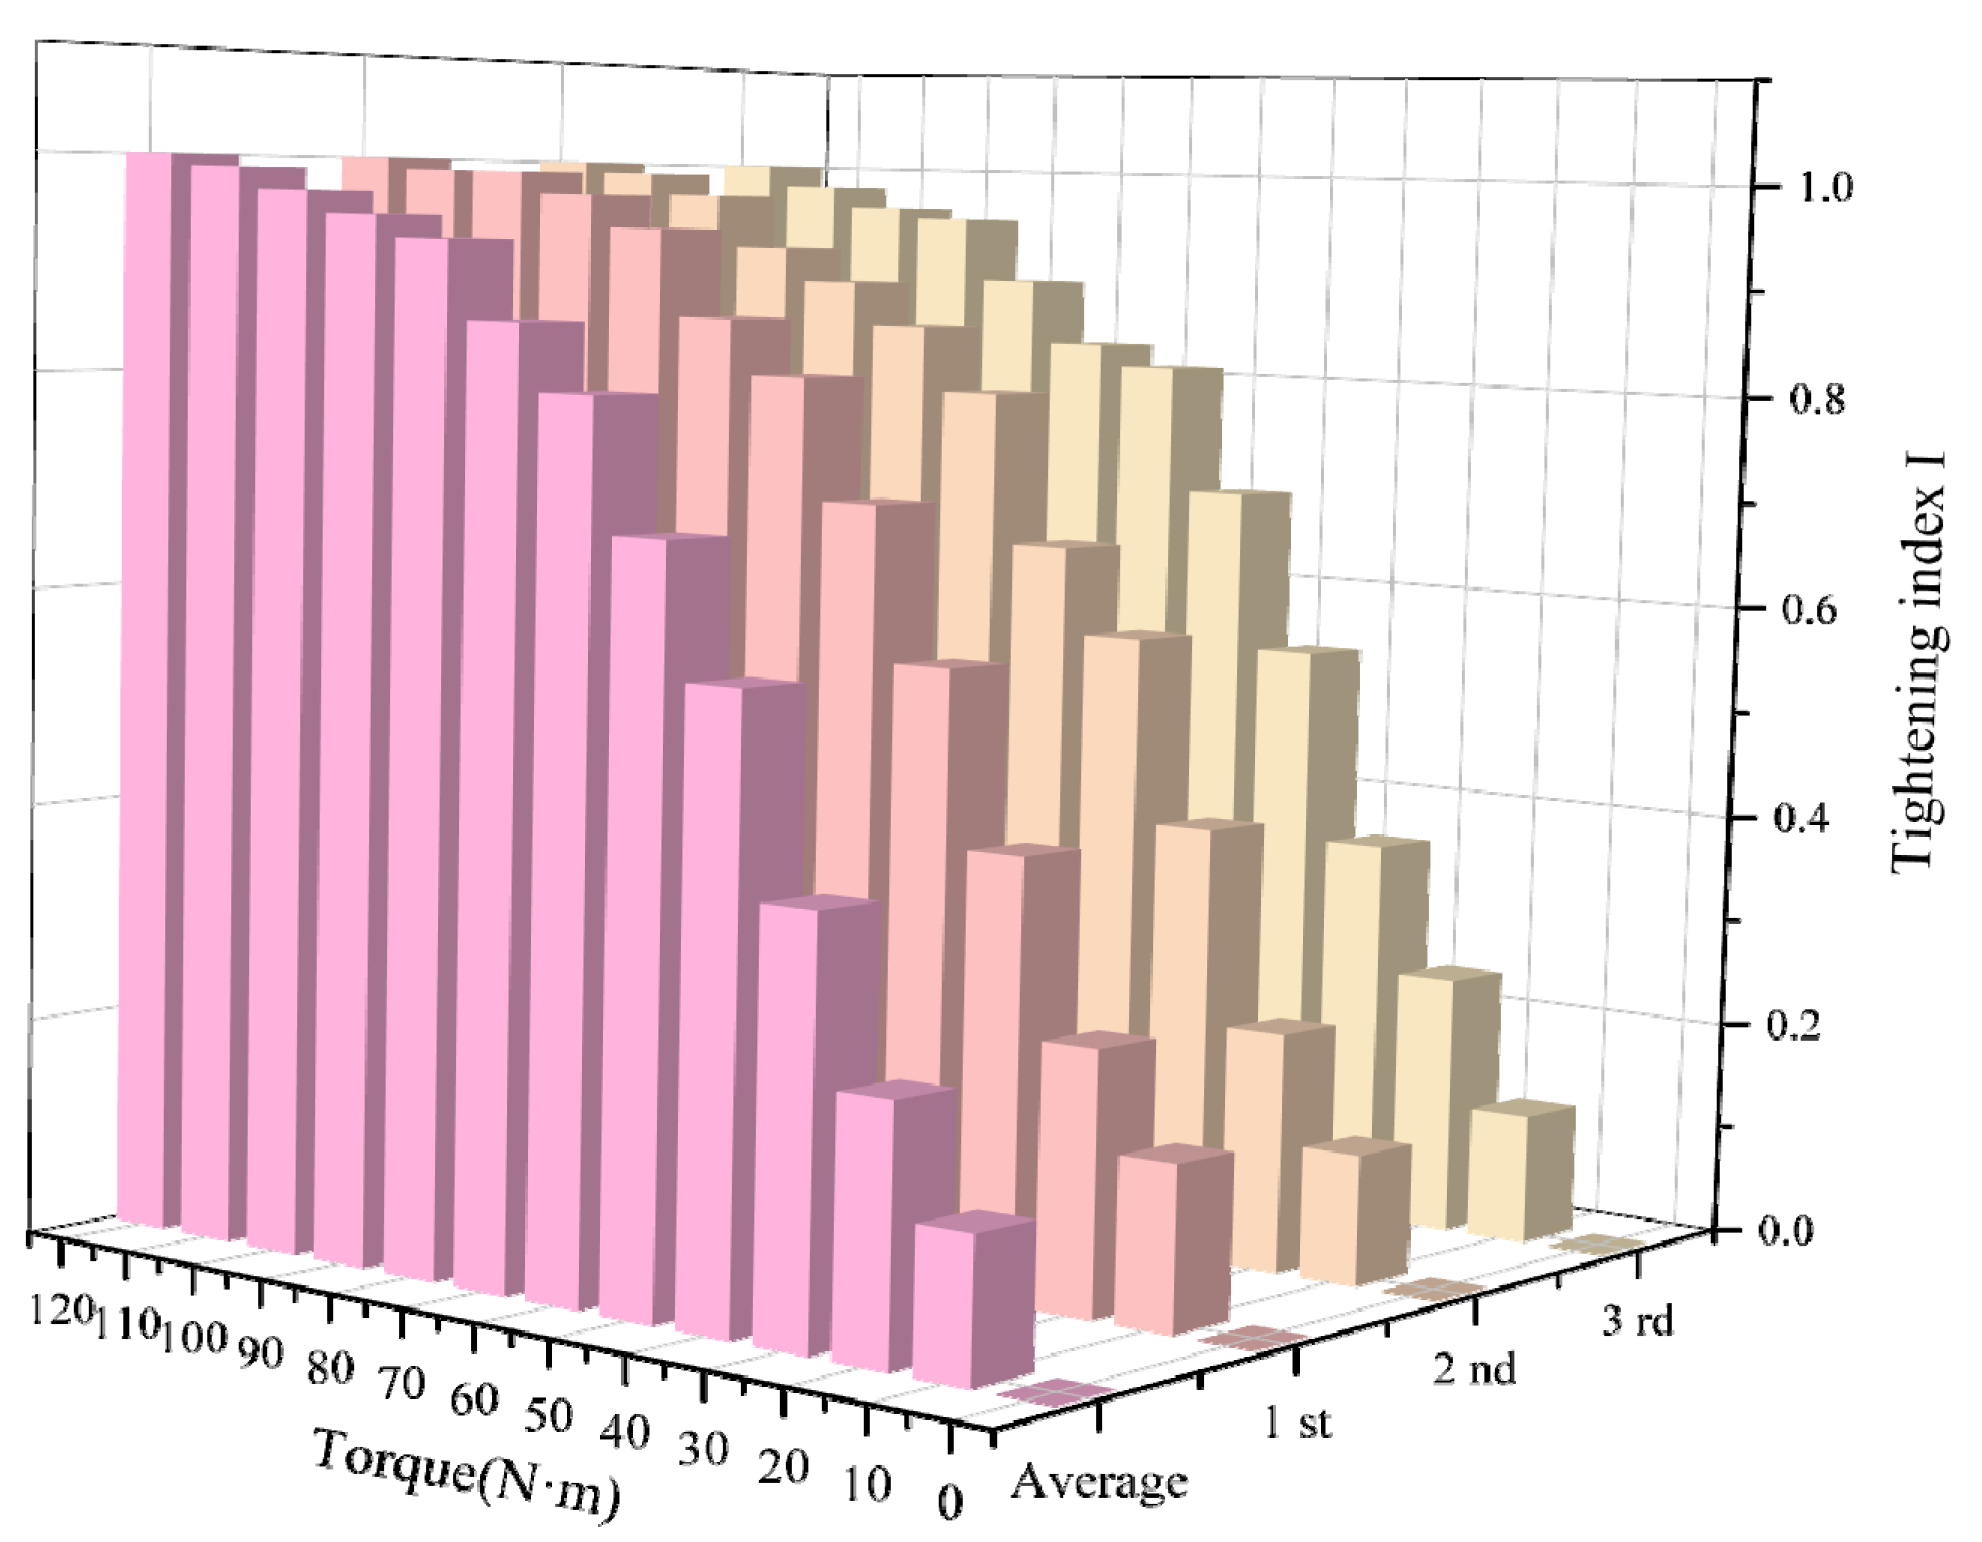
To further investigate the distribution characteristics of focused signal amplitudes under varying bolt preload conditions and enable accurate assessment of bolt loosening, a fastening index metric defined by Equation (9) was developed based on focused signal analysis. The derived relationship between the loosening index I and bolt preload levels is graphically presented in Figure 22.
I = U U m i n U m a x U m i n
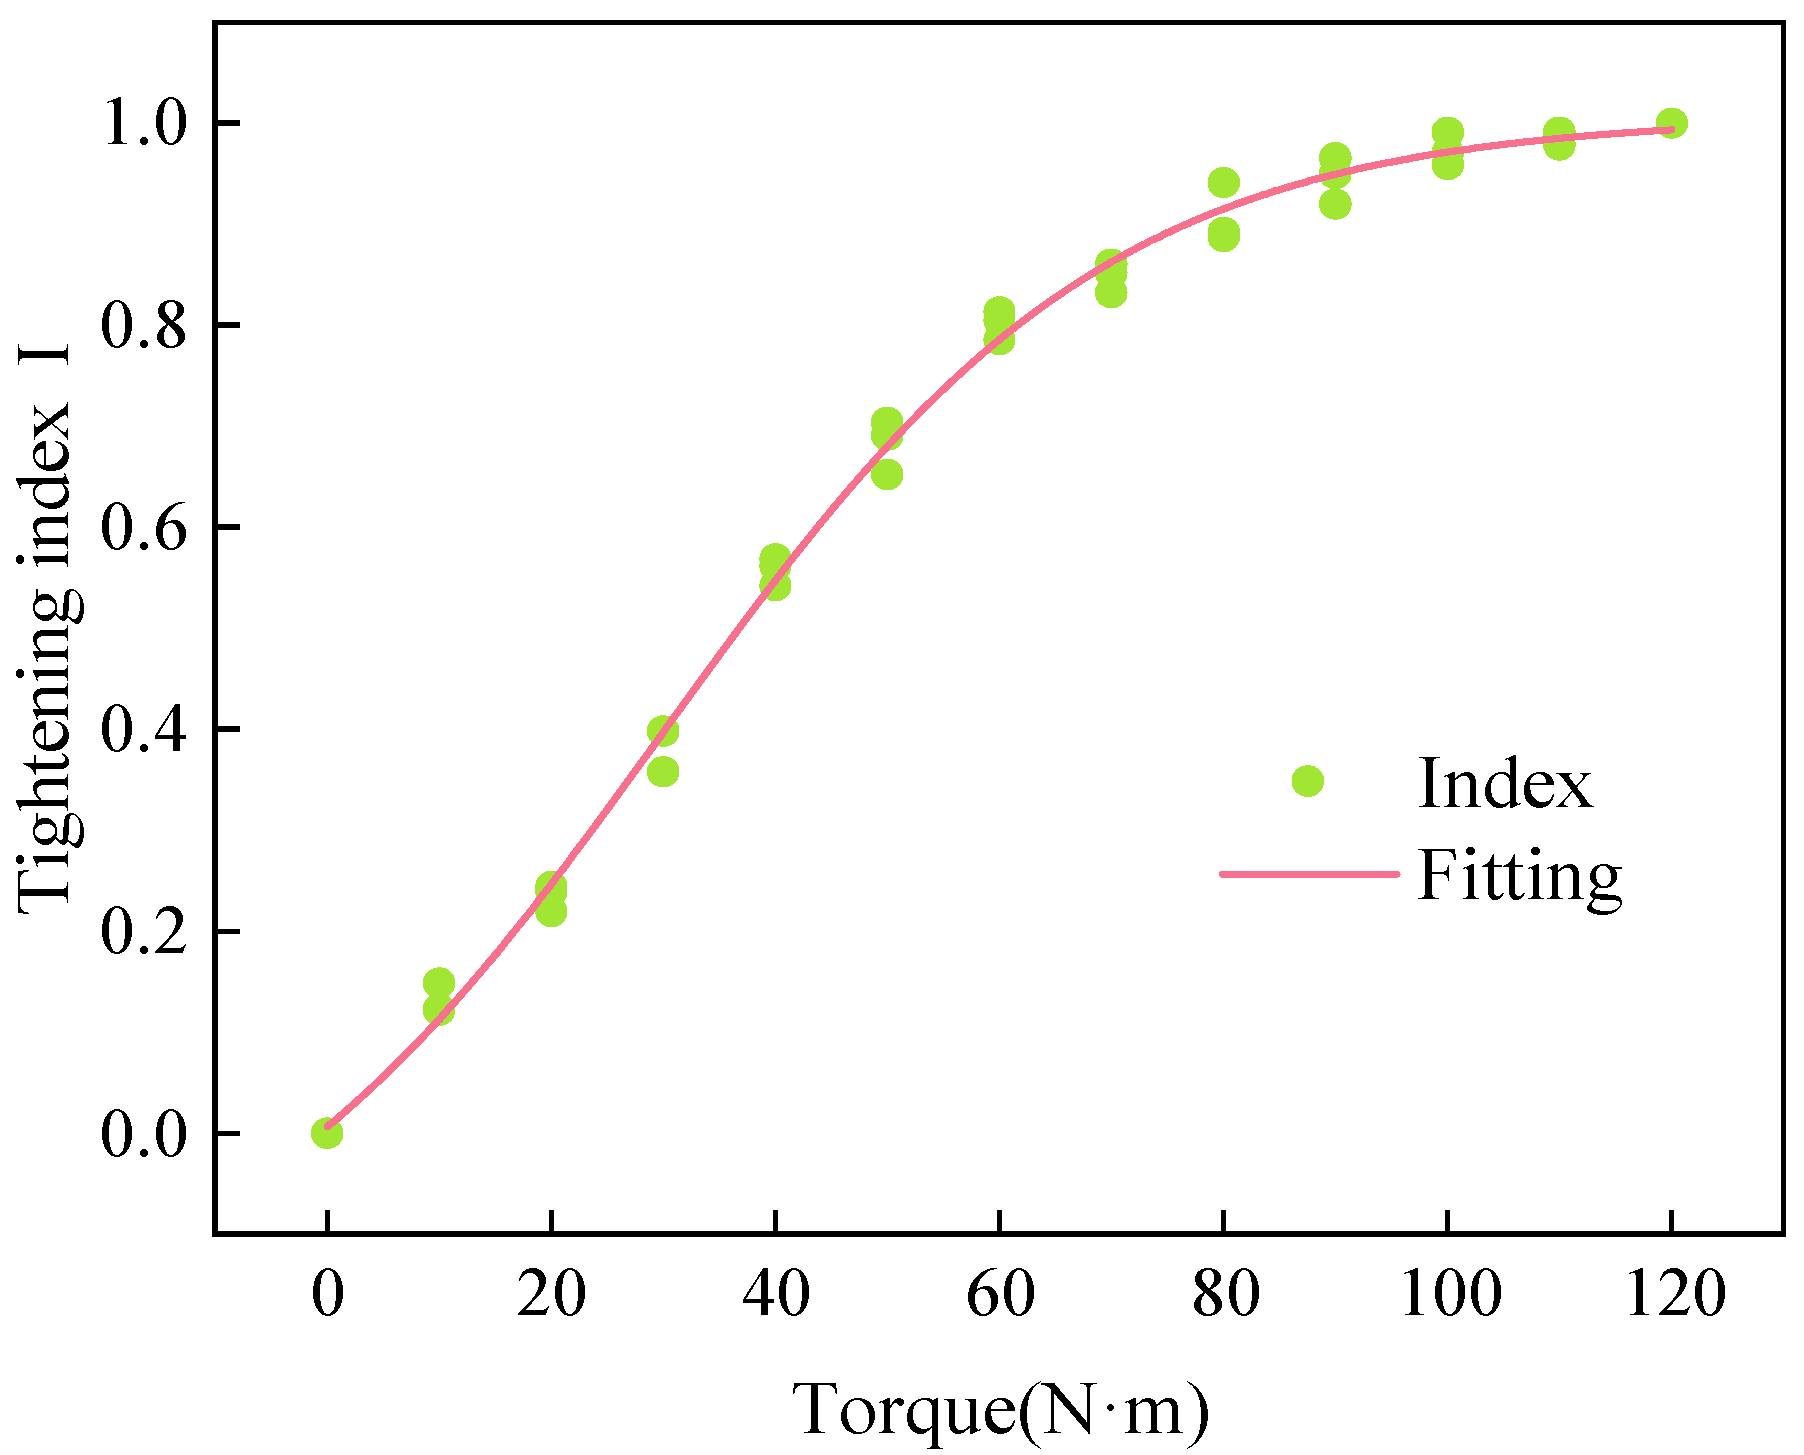
where U represents the value in each set of focused signals, U m i n denotes the minimum value within each set, and U m a x corresponds to the maximum value. As shown in Figure 22, when the bolt preload reaches 80 N·m, the third experimental group exhibits the largest deviation (≈0.05 loosening index difference) from the normalized mean value, with a relative error of approximately 2% compared to the original focused signal average. These results confirm the measurement accuracy. Nonlinear curve fitting of the fastening indices from all three experimental groups is presented in Figure 23.
Figure 23 demonstrates a well-fitted curve (R2 = 0.986) that aligns closely with experimental measurements. The fastening index exhibits minimal variation (consistently > 0.8) as the bolt preload decreases from 120 N·m to 70 N·m, followed by a pronounced reduction when the preload drops from 50 N·m to 0, ultimately reaching zero. These results validate the operational state classifications: the bolt remains fastened (index > 0.8) when the preload exceeds 70 N·m, transitions to a loosened state (index approaching 0) below 50 N·m, and resides in a partially stabilized transitional state between 50 and 70 N·m. The index effectively correlates with bolt tightening conditions, confirming its reliability for preload monitoring across all operational phases.

4.3.2. Verification of Unknown Bolt Preload

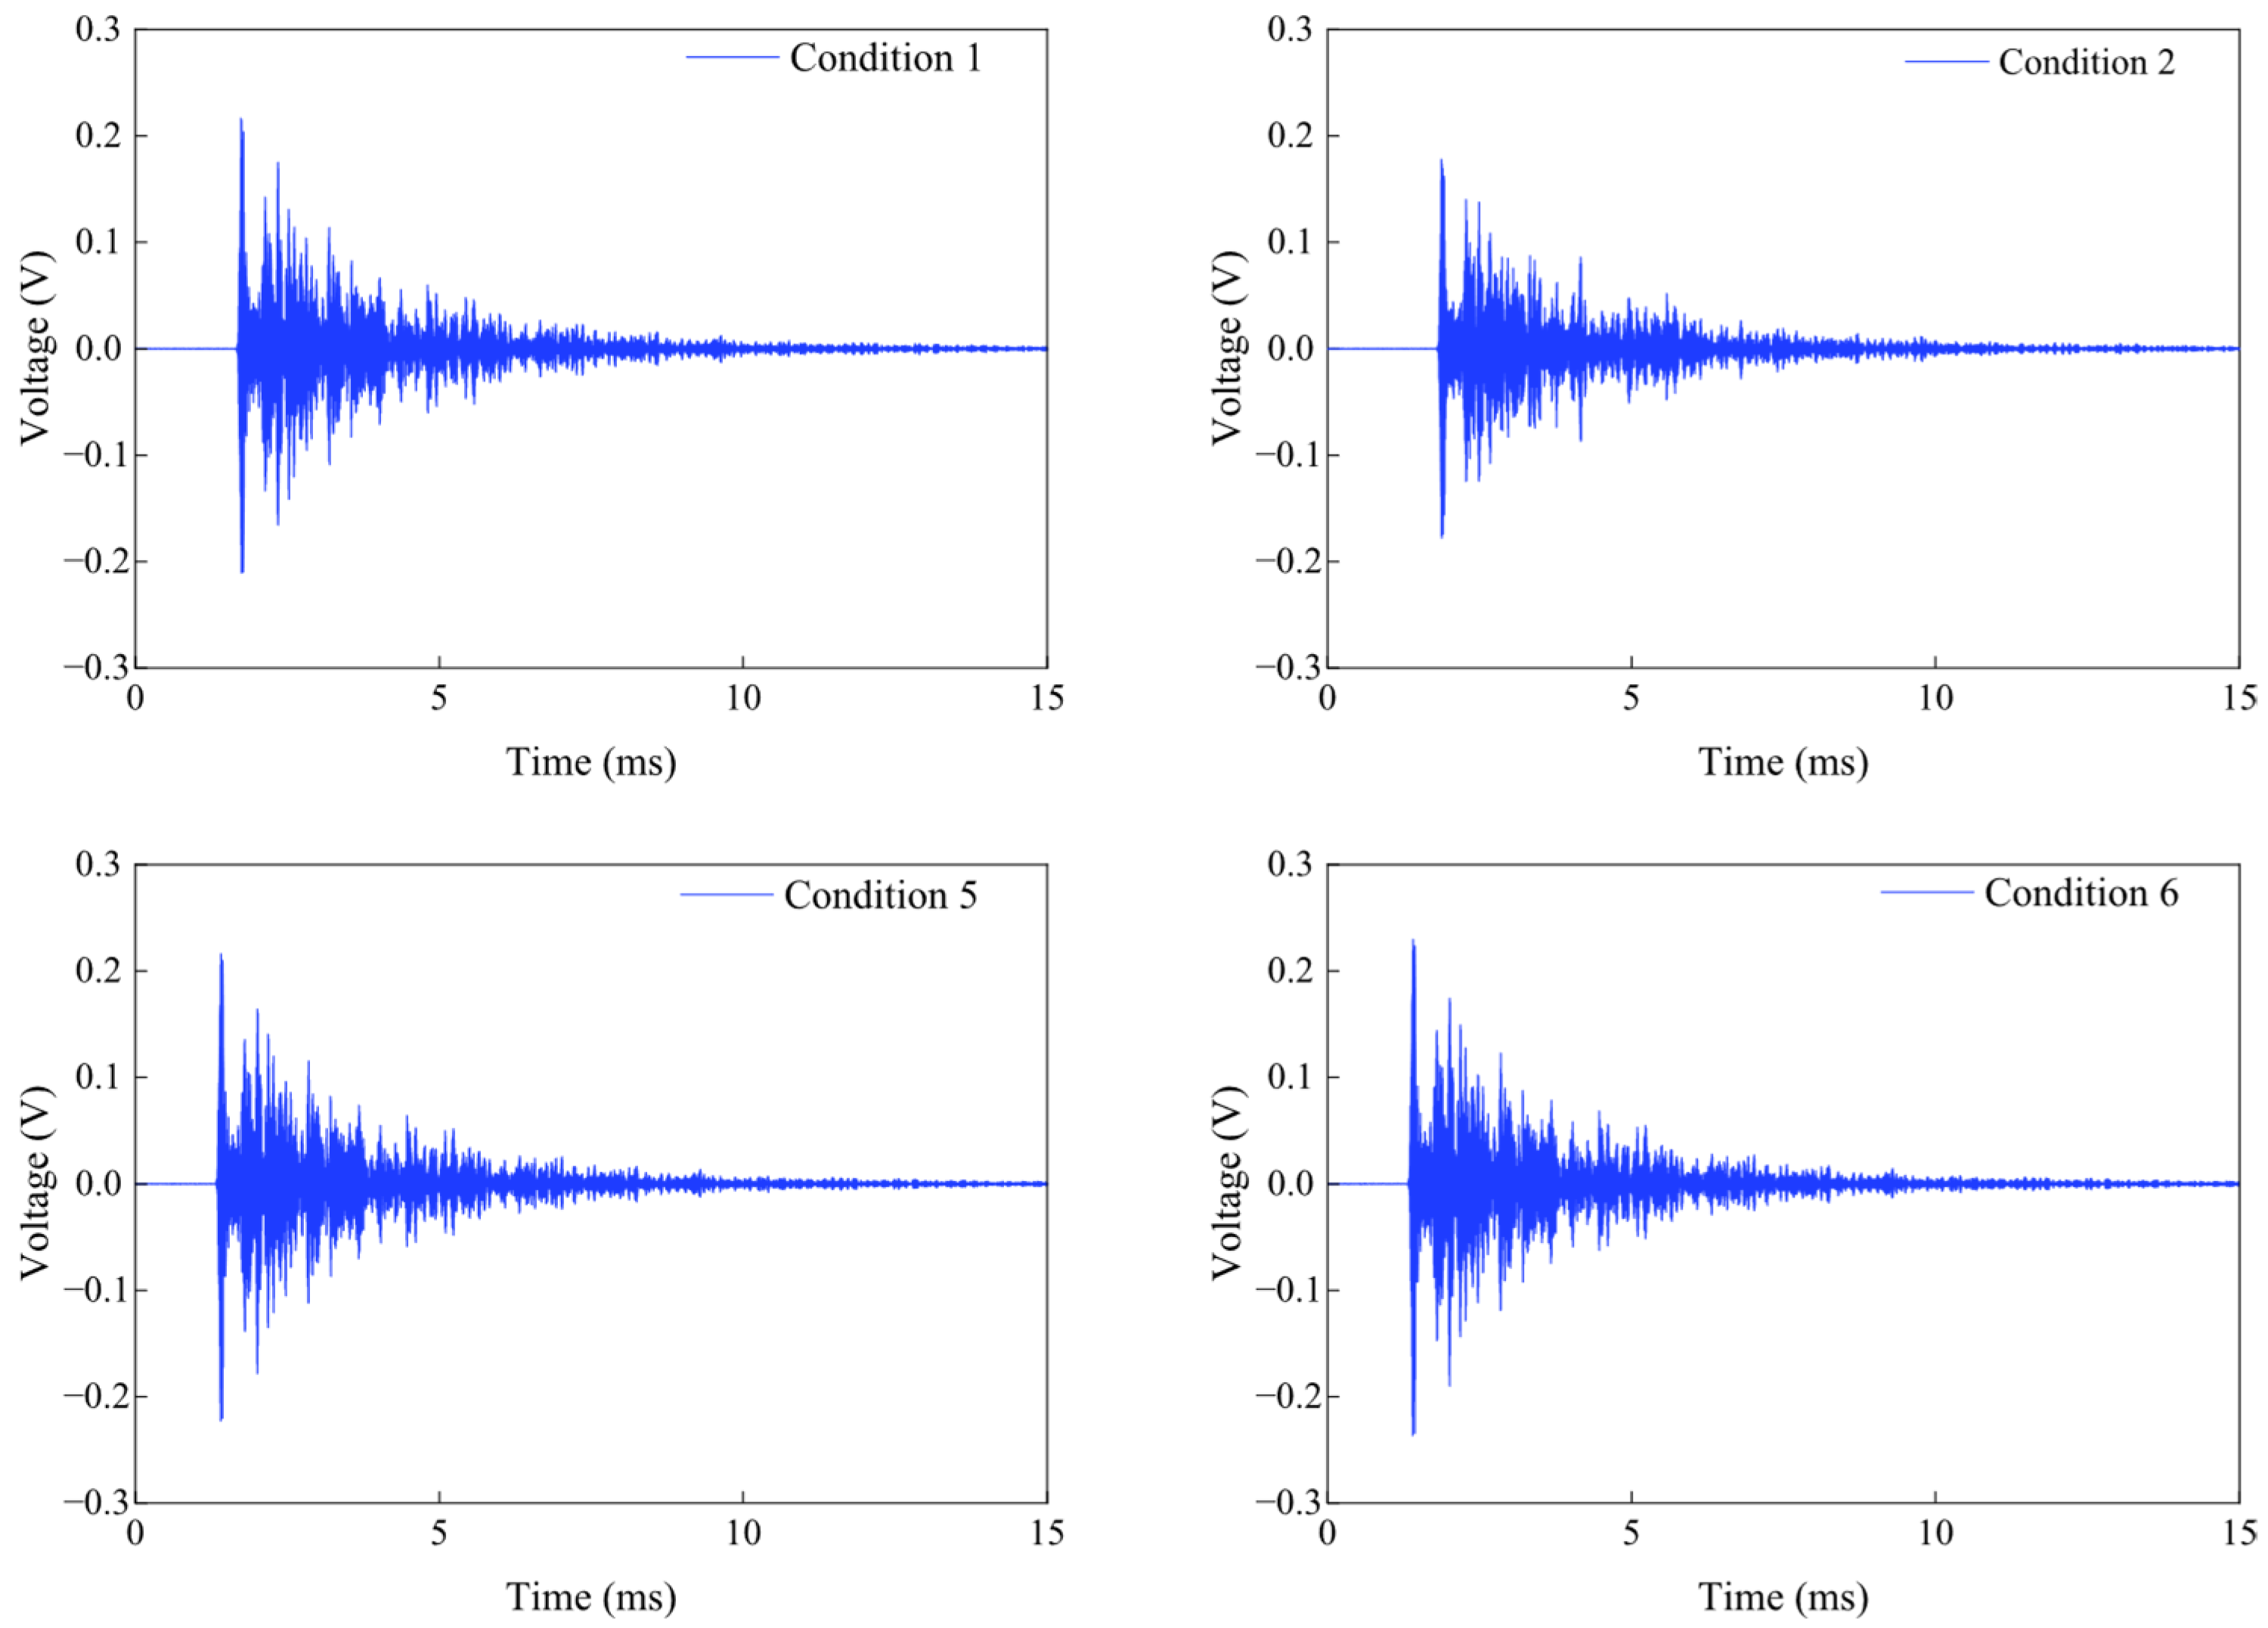
To validate the accuracy of the fastening index, experimental tests were conducted under six unknown preload conditions spanning the full operational range from fully loosened to fully tightened states. The validation process involved calculating the loosening index to estimate preload ranges, applying the differential method for preload quantification, and incrementally increasing torque using a calibrated torque wrench to obtain ground-truth measurements. Comparative analysis between calculated and measured preload values (Table 10) confirmed the method’s reliability, with representative response and focused signals illustrated in Figure 24 and Figure 25.
According to Table 10, the calculated and measured bolt preload results show that the overall error is small, with the smallest error in working condition five (about 1.5%) and the largest error in working condition two (about 5.7%). The possible reasons for these errors include (1) measurement error in the peak value of the coalescence signal; (2) the assumption that the maximum bolt preload corresponds to 120 N·m, while the actual preload may be slightly higher, causing the calculated tightening index to be overestimated; (3) the torque wrench measuring only integer values; and (4) the method of loosening the bolt using the torque wrench introducing slight overestimation of the applied torque. Nevertheless, the overall error of the test is negligible. Overall, the small test errors indicate that the bolt tightening index can reliably serve as a preload evaluation metric.

5. Conclusions

This study designed and fabricated a novel surface-mounted piezoelectric sensor based on PMN-PT material, systematically evaluating its waterproof capability, electrical properties, and capacitance characteristics through experiments. Subsequently, bolt preload monitoring experiments employing the time-reversal method were conducted, leading to the development of a fastening index based on comparative analysis of response and focused signals. Key conclusions are as follows:
(1) The developed PMN-PT piezoelectric sensor demonstrates exceptional insulation performance (infinite resistance) and operational stability (capacitance fluctuation rate ≤ 3.25%) under five operating conditions, with significantly higher energy density and piezoelectric properties compared to conventional PZT and PVDF sensors.
(2) Comparative signal analysis shows that both response and focused signals serve as reliable indicators for preload monitoring at low torque levels (<50 N·m). However, beyond 50 N·m, response signals exhibit diminished sensitivity, while focused signals maintain significant amplitude change, enabling precise loosening detection.
(3) The proposed fastening index enables three-state classification: fastened (I > 0.8), partially fastened (0.5 < I ≤ 0.8), and loosened (I ≤ 0.5). Validation tests under unknown preload conditions demonstrated measurement errors ranging from 1.5% (Condition 5) to 5.7% (Condition 2), with performance surpassing conventional strain-gauge and FBG sensor methods in both sensitivity and operational range.

Author Contributions

Conceptualization, B.F., X.W. and K.K.; methodology, B.F., K.K., Q.Y., X.W. and Y.W.; software, Q.Y. and K.K.; validation, B.F., S.Z., K.K. and X.W.; formal analysis, B.F., K.K. and X.W.; investigation, B.F. and Y.W.; resources, Z.G.; data curation, Y.W., K.K. and Q.Y.; writing—original draft preparation, B.F., Q.Y., X.W. and Y.W.; writing—review and editing, Z.G., K.K., X.W. and S.Z.; visualization, K.K. and X.W.; supervision, Z.G.; project administration, B.F.; funding acquisition, B.F. All authors have read and agreed to the published version of the manuscript.

Funding

The authors would like to acknowledge the financial support given by Chongqing Natural Science Foundation of China (Grant Nos. cstc2021jcyj-msxmX1168 and cstb2022nscq-msx1655), the State Key Laboratory of Structural Dynamics of Bridge Engineering and Key Laboratory of Bridge Structure Seismic Technology for Transportation Industry Open Fund (Grant Nos. 202205 and 202105), and the Open Fund of State Key Laboratory of the Mountain Bridge and Tunnel Engineering (Grant Nos. SKLBT-ZD2102 and SKLBT-19-007).

Data Availability Statement

The original contributions presented in the study are included in the article; further inquiries can be directed to the corresponding authors.

Acknowledgments

Kashan Khan gratefully acknowledges the Marie Skłodowska-Curie Postdoctoral Fellowship (2024) at City St George’s, University of London, which provided valuable professional support during the course of this research.

Conflicts of Interest

The authors declare no conflicts of interest.

References

  1. Gong, H.; Ding, X.; Liu, J.; Feng, H. Review of research on loosening of threaded fasteners. Friction 2022, 10, 335–359. [Google Scholar] [CrossRef]
  2. Du, J.; Qiu, Y.; Wang, Z.; Li, J.; Wang, H.; Wang, Z.; Zhang, J. A three-stage criterion to reveal the bolt self-loosening mechanism under random vibration by strain detection. Eng. Fail. Anal. 2022, 133, 105954. [Google Scholar] [CrossRef]
  3. Wang, F. Multi-Bolt looseness detection using a new acoustic emission strategy. Struct. Health Monit. 2023, 22, 1543–1553. [Google Scholar] [CrossRef]
  4. Huang, J.; Liu, J.; Gong, H.; Deng, X. A comprehensive review of loosening detection methods for threaded fasteners. Mech. Syst. Signal Process. 2022, 168, 108652. [Google Scholar] [CrossRef]
  5. Deng, L.; Sa, Y.; Li, X.; Lv, M.; Kou, S.; Gao, Z. A Vision-Based Bolt Looseness Detection Method for a Multi-Bolt Connection. Appl. Sci. 2024, 14, 4385. [Google Scholar] [CrossRef]
  6. Ahmadi, H.R.; Momeni, K.; Jasemnejad, Y. A new algorithm and damage index for detection damage in steel girders of bridge decks using time-frequency domain and matching methods. Structures 2024, 61, 106035. [Google Scholar] [CrossRef]
  7. Liu, P.; Wang, X.; Wang, Y.; Zhu, J.; Ji, X. Research on percussion-based bolt looseness monitoring under noise interference and insufficient samples. Mech. Syst. Signal Process. 2024, 208, 111013. [Google Scholar] [CrossRef]
  8. Li, H.; Zou, Z.; Wu, H.; Zhao, J.; Sun, H.; Sun, W.; Wang, Q.; Wang, X. Theoretical and experimental investigations of vibration and damping behaviors of carbon fiber-reinforced composite thin shells with partial bolt looseness constraints. Eur. J. Mech. A/Solids 2023, 97, 104839. [Google Scholar] [CrossRef]
  9. Huang, H.; Yao, Y.; Zhang, W.; Zhou, L. A push-out test on partially encased composite column with different positions of shear studs. Eng. Struct. 2023, 289, 116343. [Google Scholar] [CrossRef]
  10. Li, D.; Nie, J.H.; Wang, H.; Ren, W.X. Loading condition monitoring of high-strength bolt connections based on physics-guided deep learning of acoustic emission data. Mech. Syst. Signal Process. 2024, 206, 110908. [Google Scholar] [CrossRef]
  11. Nelson, N.R.; Prasad, N.S.; Sekhar, A.S. Structural integrity and sealing behaviour of bolted flange joint: A state of art review. Int. J. Press. Vessel. Pip. 2023, 204, 104975. [Google Scholar] [CrossRef]
  12. Jia, J.; Yu, X.; Zhang, X.; Lv, Q.; Ye, J. Bolt body axial stress detection based on nut axial stress. J. Constr. Steel Res. 2023, 211, 108190. [Google Scholar] [CrossRef]
  13. Ren, L.; Feng, T.; Ho, M.; Jiang, T.; Song, G. A smart “shear sensing” bolt based on FBG sensors. Measurement 2018, 122, 240–246. [Google Scholar] [CrossRef]
  14. Li, C.; Liu, M.; Song, H.; Wu, Y.; Zhu, S. Study of temperature sensing performance of bimetallic layer MFBG. Sens. Actuators A Phys. 2023, 359, 114479. [Google Scholar] [CrossRef]
  15. Yang, W.S.; Chiang, C.C.; Hsu, H.C. Monitoring torque in bolts using an embedded fiber Bragg grating sensor. Optik 2023, 291, 171294. [Google Scholar] [CrossRef]
  16. Sidorov, M.; Nhut, P.V.; Matsumoto, Y.; Ohmura, R. LoRa-Based Precision Wireless Structural Health Monitoring System for Bolted Joints in a Smart City Environment. IEEE Access 2019, 7, 179235–179251. [Google Scholar] [CrossRef]
  17. Li, Q.; Wang, T.; Liao, M.; Jing, X. Evaluating bolt connecting faults in ring-type structures with nonlinear fault-induced loads and transmissibility functions. Mech. Syst. Signal Process. 2023, 191, 110212. [Google Scholar] [CrossRef]
  18. Zhao, L.; Huo, L.; Zhou, J.; Yang, Z.; Li, H. Digital Image Correlation-Based Bolt Preload Monitoring. Soc. Sci. Res. Netw. 2023. [Google Scholar] [CrossRef]
  19. Huang, J.; Liu, J.; Gong, H.; Deng, X. Multimodal loosening detection for threaded fasteners based on multiscale cross fuzzy entropy. Mech. Syst. Signal Process. 2023, 186, 109834. [Google Scholar] [CrossRef]
  20. Fu, W.; Zhou, R.; Guo, Z. Automatic bolt tightness detection using acoustic emission and deep learning. Structures 2023, 55, 1774–1782. [Google Scholar] [CrossRef]
  21. Li, Y.; Kong, X.; Gao, Y. A Method for Detecting Bolt Looseness Base on Probability Density of Vibration Signals of Two Connected Parts and Principal Component Analysis. J. Vib. Shock. 2015, 34, 63–67. (In Chinese) [Google Scholar] [CrossRef]
  22. Coelho, J.S.; Machado, M.R.; Dutkiewicz, M.; Teloli, R.O. Data-driven machine learning for pattern recognition and detection of loosening torque in bolted joints. J. Braz. Soc. Mech. Sci. Eng. 2024, 46, 75. [Google Scholar] [CrossRef]
  23. Chen, J.; Chen, Z.; Zhu, W.; Song, G. Underwater bolted flange looseness detection using percussion-induced sound and Feature-reduced Multi-ROCKET model. Struct. Health Monit. 2024, 23, 495–511. [Google Scholar] [CrossRef]
  24. Liang, C.; Sun, F.P.; Rogers, C.A. Coupled Electro-Mechanical Analysis of Adaptive Material Systems-Determination of the Actuator Power Consumption and System Energy Transfer. J. Intell. Mater. Syst. Struct. 1997, 8, 335–343. [Google Scholar] [CrossRef]
  25. Shao, J.; Wang, T.; Wang, Z.; Wei, D.; Li, Y. Bolt Looseness Detection Using Piezoelectric Impedance Frequency Shift Method. China Mech. Eng. 2019, 30, 6. (In Chinese) [Google Scholar] [CrossRef]
  26. Liao, W.; Sun, H.; Wang, Y.; Qing, X. A novel damage index integrating piezoelectric impedance and ultrasonic guided wave for damage monitoring of bolted joints. Struct. Health Monit. 2023, 22, 3514–3533. [Google Scholar] [CrossRef]
  27. Wei, S.; Ying, Z. Numerical Simulation of Bolt Looseness Monitoring Based on Impedance Method. Appl. Mech. Mater. 2013, 351–352, 1264–1268. [Google Scholar] [CrossRef]
  28. Nguyen, B.-P.; Hung Tran, Q.; Nguyen, T.-T.; Man Singh Pradhan, A.; Huynh, T.-C. Understanding Impedance Response Characteristics of a Piezoelectric-Based Smart Interface Subjected to Functional Degradations. Complexity 2021, 2021, 5728679. [Google Scholar] [CrossRef]
  29. Chen, D.; Zhang, N.; Huo, L.; Song, G. Full-range bolt preload monitoring with multi-resolution using the time shifts of the direct wave and coda waves. Struct. Health Monit. 2023, 22, 3871–3890. [Google Scholar] [CrossRef]
  30. Tong, T.; Hua, J.; Gao, F.; Lin, J. Identification of bolt state in lap joint based on propagation model and imaging methods of Lamb waves. Mech. Syst. Signal Process. 2023, 200, 110569. [Google Scholar] [CrossRef]
  31. Han, J.; Xie, K.; Yang, Z.; Li, L.; Zhao, M. A Study of the Nonlinear Attenuation Behavior of Preload in the Bolt Fastening Process for Offshore Wind Turbine Blades Using Ultrasonic Technology. Energies 2025, 18, 3211. [Google Scholar] [CrossRef]
  32. Xu, J.; Hao, J.; Li, H.; Luo, M.; Guo, W.; Li, W. Experimental damage identification of a model reticulated shell. Appl. Sci. 2017, 7, 362. [Google Scholar] [CrossRef]
  33. Na, W.S.; Baek, J. A Review of the Piezoelectric Electromechanical Impedance Based Structural Health Monitoring Technique for Engineering Structures. Sensors 2018, 18, 1307. [Google Scholar] [CrossRef]
  34. Fan, J.; Chen, W.; Chen, D.; Chen, H.; Luo, L.; Bao, S. Vibro-acoustic modulation-based bolt looseness detection method using frequency sweep probe waves. Nondestruct. Test. Eval. 2024, 39, 1147–1168. [Google Scholar] [CrossRef]
  35. Razi, P.; Esmaeel, R.A.; Taheri, F. Improvement of a vibration-based damage detection approach for health monitoring of bolted flange joints in pipelines. Struct. Health Monit. 2013, 12, 207–224. [Google Scholar] [CrossRef]
  36. Aabid, A.; Parveez, B.; Raheman, M.A.; Ibrahim, Y.E.; Anjum, A.; Hrairi, M.; Parveen, N.; Parveen, N. A Review of Piezoelectric Material-Based Structural Control and Health Monitoring Techniques for Engineering Structures: Challenges and Opportunities. Actuators 2021, 10, 101. [Google Scholar] [CrossRef]
  37. De Rosa, I.M.; Sarasini, F. Use of PVDF as acoustic emission sensor for in situ monitoring of mechanical behaviour of glass/epoxy laminates. Polym. Test. 2010, 29, 749–758. [Google Scholar] [CrossRef]
  38. Masmoudi, S.; El Mahi, A.; Turki, S. Use of piezoelectric as acoustic emission sensor for in situ monitoring of composite structures. Compos. B Eng. 2015, 80, 307–320. [Google Scholar] [CrossRef]
  39. Tan, L.; Zhou, Y.; Kong, H.; Yue, Z.; Wang, Q.; Zhou, L. Dynamic Monitoring of Steel Beam Stress Based on PMN-PT Sensor. Buildings 2024, 14, 2831. [Google Scholar] [CrossRef]
  40. Wang, X.; Kong, H.; Wang, K.; Chen, Q. Dynamic stress monitoring for RC beam using PMN-PT-based three-direction normal stress sensor. Structures 2024, 68, 107091. [Google Scholar] [CrossRef]
  41. Jiang, J.; Chen, Y.; Dai, J.; Liang, Y. Multi-bolt looseness state monitoring using the recursive analytic based active sensing technique. Measurement 2022, 191, 110779. [Google Scholar] [CrossRef]
  42. Duddi, M.; Kocherla, A.; Subramaniam, K.V.L. Real-Time Monitoring of Concrete Properties Using an Embedded Smart Piezoelectric Sensor with Active and Passive Sensing Abilities. In Smart & Sustainable Infrastructure: Building a Greener Tomorrow; Springer: Berlin/Heidelberg, Germany, 2024; Volume 48, pp. 1089–1100. [Google Scholar] [CrossRef]
  43. Yang, J.; Zuo, W.; Zhang, W.; Lu, G.; Jiang, S. Feasibility Study on Internal Defect Monitoring of Concrete Structure Based on Piezoceramics Transducer. Bull. Chin. Ceram. Soc. 2023, 42, 111. (In Chinese) [Google Scholar]
  44. Ai, D.; Zhu, H.; Luo, H.; Wang, C. Mechanical impedance based embedded piezoelectric transducer for reinforced concrete structural impact damage detection: A comparative study. Constr. Build. Mater. 2018, 165, 472–483. [Google Scholar] [CrossRef]
  45. Ferreira, P.M.; Caçador, D.; Machado, M.A.; Carvalho, M.S.; Vilaça, P.; Sorger, G.; Farias, F.W.C.; Figueiredo, A.R.; Vidal, C. Enabling electrical response through piezoelectric particle integration in AA2017-T451 aluminium parts using FSP technology. Smart Mater. Struct. 2024, 33, 065037. [Google Scholar] [CrossRef]
  46. Ferreira, P.M.; Caçador, D.; Machado, M.A.; Carvalho, M.S.; Vilaça, P.; Sorger, G.; Farias, F.W.C.; Figueiredo, A.R.; Vidal, C. Smart piezoelectric composite: Impact of piezoelectric ceramic microparticles embedded in heat-treated 7075-T651 aluminium alloy. Int. J. Mech. Mater. Des. 2025, 21, 155–180. [Google Scholar] [CrossRef]
  47. Hahnlen, R.; Dapino, M.J. Active metal-matrix composites with embedded smart materials by ultrasonic additive manufacturing. In Proceedings of the SPIE Smart Structures and Materials + Nondestructive Evaluation and Health Monitoring, San Diego, CA, USA, 7–11 March 2010; Volume 7645, pp. 159–170. [Google Scholar] [CrossRef]
  48. Stoll, P.; Gasparin, E.; Spierings, A.; Wegener, K. Embedding eddy current sensors into LPBF components for structural health monitoring. Prog. Addit. Manuf. 2021, 6, 445–453. [Google Scholar] [CrossRef]
  49. Shao, J.; Wang, T.; Yin, H.; Yang, D.; Li, Y. Bolt Looseness Detection Based on Piezoelectric Impedance Frequency Shift. Appl. Sci. 2016, 6, 298. [Google Scholar] [CrossRef]
  50. Garrett, J.C.; Mei, H.; Giurgiutiu, V. An Artificial Intelligence Approach to Fatigue Crack Length Estimation from Acoustic Emission Waves in Thin Metallic Plates. Appl. Sci. 2022, 12, 1372. [Google Scholar] [CrossRef]
  51. Sun, Y.; Wang, X. Study on Dynamic and Static Stress Performance of Concrete Monitored by Piezoelectric Materials; Chongqing Jiaotong University: Chongqing, China, 2022. (In Chinese) [Google Scholar]
  52. Sha, F.; Xu, D.; Cheng, X.; Huang, S. Mechanical Sensing Properties of Embedded Smart Piezoelectric Sensor for Structural Health Monitoring of Concrete. Res. Nondestruct. Eval. 2021, 32, 88–112. [Google Scholar] [CrossRef]
  53. Yang, J.; Chang, F.K. Detection of bolt loosening in C–C composite thermal protection panels: I. Diagnostic principle. Smart Mater. Struct. 2006, 15, 581. [Google Scholar] [CrossRef]
  54. Huo, L.; Wang, F.; Li, H.; Song, G. A fractal contact theory based model for bolted connection looseness monitoring using piezoceramic transducers. Smart Mater. Struct. 2017, 26, 104010. [Google Scholar] [CrossRef]
  55. Wang, F.; Huo, L.; Song, G.; Wang, F.; Huo, L.; Song, G. A piezoelectric active sensing method for quantitative monitoring of bolt loosening using energy dissipation caused by tangential damping based on the fractal contact theory. Smart Mater. Struct. 2018, 27, 015023. [Google Scholar] [CrossRef]
  56. Ing, R.K.; Fink, M. Time-reversed lamb waves. IEEE Trans. Ultrason. Ferroelectr. Freq. Control. 1998, 45, 1032–1043. [Google Scholar] [CrossRef] [PubMed]
  57. Fink, M. Time Reversal of Ultrasonic Fields-Part I: Basic Principles. IEEE Trans. Ultrason. Ferroelectr. Freq. Control. 1992, 39, 555–566. [Google Scholar] [CrossRef] [PubMed]
  58. Jiang, X.; Zhang, X.; Yang, Z. Shear horizontal guided wave propagation analysis in variable cross-section stiffener and damage detection in stiffened panel. Constr. Build. Mater. 2025, 464, 140171. [Google Scholar] [CrossRef]
  59. Yue, J.; Hong, X.; Cui, B.; Cai, R.; Xu, G.; Chen, W. Omni-directional wavenumber dictionary modified imaging method for orthotropic composites damage detection using ultrasonic guided waves. Thin-Walled Struct. 2024, 205, 112419. [Google Scholar] [CrossRef]
  60. Warchomicka, F. Surface topographies on the micro and nanoscale of metal alloys for tissue regeneration. Nanostruct. Biomater. Regen. Med. 2019, 315–336. [Google Scholar] [CrossRef]
  61. Li, X.; Giuseppe Fenu, N.; Giles-Donovan, N.; Cochran, S.; Lucas, M. Can Mn:PIN-PMN-PT piezocrystal replace hard piezoceramic in power ultrasonic devices? Ultrasonics 2024, 138, 107257. [Google Scholar] [CrossRef]
  62. Parvulescu, A.; Clay, C.S. Reproducibility of signal transmissions in the ocean. Radio Electron. Eng. 1965, 29, 223–228. [Google Scholar] [CrossRef]
  63. Moheimani, S.O.R. A survey of recent innovations in vibration damping and control using shunted piezoelectric transducers. IEEE Trans. Control. Syst. Technol. 2003, 11, 482–494. [Google Scholar] [CrossRef]
  64. Elvin, N.; Elvin, A.; Senderos, B.Z. Capacitance changes in thin piezoelectric transducers embedded in isotropic host materials. J. Intell. Mater. Syst. Struct. 2018, 29, 816–829. [Google Scholar] [CrossRef]
  65. Rakbamrung, P.; Lallart, M.; Guyomar, D.; Muensit, N.; Thanachayanont, C.; Lucat, C.; Guiffard, B.; Petit, L.; Sukwisut, P. Performance comparison of PZT and PMN-PT piezoceramics for vibration energy harvesting using standard or nonlinear approach. Sens. Actuators A Phys. 2010, 163, 493–500. [Google Scholar] [CrossRef]
  66. Kim, Y.-I.; Kim, G.; Bae, Y.-M.; Ryu, Y.-H.; Jeong, K.-J.; Oh, C.-H.; Kim, K.B. Comparison of PMN-PT and PZN-PT Single-Crystal-Based Ultrasonic Transducers for Nondestructive Evaluation Applications. Sens. Mater. 2015, 27, 107–114. [Google Scholar]
Figure 1. Propagation process of an ultrasonic signal through a bolted joint.
Crystals 15 00768 g001
Figure 2. Schematic diagram of the smart washer showing nominal PMN-PT wafer dimensions (10 × 10 × 0.68 mm) and horizontal insertion into a tangential side slot. The embedded radial extent is ≤ 8 mm, consistent with the washer’s geometry (OD 32 mm, ID 16 mm, thickness 5 mm).
Crystals 15 00768 g002
Figure 3. Sensor fabrication process: (a) piezoelectric single crystal preparation, (b) lead wire soldering, (c) integrated gasket fabrication, (d) epoxy resin filling, (e) pre-pressing, and (f) complete sensor assembly.
Crystals 15 00768 g003
Figure 4. Results of (a) resistance test and (b) capacitance test for PMN-PT wafers under multiple conditions.
Crystals 15 00768 g004
Figure 5. Three-dimensional layout of the experimental setup for bidirectional time-reversal signal monitoring.
Crystals 15 00768 g005
Figure 6. Voltage output time-history curves illustrating signal stability of the PMN-PT smart washer under repeated excitation conditions.
Crystals 15 00768 g006
Figure 7. Common piezoelectric sensors.
Crystals 15 00768 g007
Figure 8. Schematic diagram of the signal-to-noise ratio test.
Crystals 15 00768 g008
Figure 9. Experimental setup (PMN-PT as an example).
Crystals 15 00768 g009
Figure 10. Experimental results under different conditions.
Crystals 15 00768 g010aCrystals 15 00768 g010b
Figure 11. Comparison of response and focused signals for PMN-PT.
Crystals 15 00768 g011
Figure 12. Comparison of response and focused signals for PZT.
Crystals 15 00768 g012
Figure 13. Comparison of response and focused signals for PVDF.
Crystals 15 00768 g013
Figure 14. Comparison of focused signal amplitudes for the three materials.
Crystals 15 00768 g014
Figure 15. Materials and equipment used in the bolt preload monitoring experiments.
Crystals 15 00768 g015
Figure 16. Experimental setup for monitoring bolt preload using the time-reversal method.
Crystals 15 00768 g016
Figure 17. Time-domain response signals directly received from the bolted connection under various preload levels.
Crystals 15 00768 g017
Figure 18. Response signal amplitude of Sensor B versus preload of high tensile bolts.
Crystals 15 00768 g018
Figure 19. Inversion of the received focused signal.
Crystals 15 00768 g019
Figure 20. Variation in focused signal amplitude from Sensor A with respect to bolt preload force.
Crystals 15 00768 g020
Figure 21. Response signal and focused signal amplitude variation with preload force.
Crystals 15 00768 g021
Figure 22. Normalization results of the focused signal amplitude.
Crystals 15 00768 g022
Figure 23. Curve fitting results of the derived tightening index versus bolt preload.
Crystals 15 00768 g023
Figure 24. Response signals under different operating conditions.
Crystals 15 00768 g024
Figure 25. Focused signals under different operating conditions.
Crystals 15 00768 g025
Table 1. Comparison of direct and indirect bolt monitoring methods.
Monitoring MethodMonitoring
Content
AdvantagesDisadvantages
Direct MethodStress, strainSimple principle, low costLow accuracy, not suitable for field monitoring
Indirect MethodImpedance, time–frequency domain, acceleration, etc.High accuracy, suitable for field monitoringTheoretical complexity, relatively high cost
Table 2. Characteristics of common smart materials.
Material TypeAdvantagesDisadvantagesPrimary Functions
Optical FiberStrong resistance to electromagnetic interference, low energy consumption, small size, wide transmission bandwidth, low densityHigh elastic modulus, easily brittle and fractured, high testing system costMonitoring structural health, temperature, pressure, and other parameters
Carbon FiberLightweight and high strength, low thermal expansion coefficient, good electrical conductivityEasily brittle and fractured, high recycling cost, complex processingMonitoring structural cracks, fatigue, vibration, stress–strain, etc.
Shape Memory Alloy (SMA)Good elasticity, high plasticity, corrosion resistance, wear resistance, biocompatibilityTemperature-dependent, difficult to process, expensiveFabricated into thermal-driven sensors for monitoring configuration changes, displacement, and damage
Piezoelectric MaterialsHigh energy conversion efficiency, fast response, high sensitivityEasily brittle, highly temperature-sensitiveMonitoring dynamic stress and strain, structural damage and localization, fatigue monitoring
Magnetorheological/Electrorheological FluidsFast response, wide adjustment range, high durability, low energy consumptionHigh cost, encapsulation required, need for periodic stirring or vibrationFabricated into controllers for semi-active and active structural control
Magnetostrictive/Electrostrictive MaterialsHigh-temperature resistance, fast response, wide operating frequency, good durabilityRequire external magnetic field, prone to stress concentration, high energy consumptionUsed as drivers in high-power ultrasonic testing, sonar systems, and actuators
Table 3. Mechanical performance parameters of the monolithic washer material.
Material NameElastic Modulus (GPa)Poisson’s Ratio (v)Density ρ (kg/m3)
Washer900.358400
Table 4. Key performance parameters of Ergo-1309 epoxy resin material.
Dielectric   Constant   ( ε ) Dielectric   Loss   ( t a n δ ) Poisson s   Ratio   ( v ) Density ρ (kg/m3)
2.840.0820.381.2
Table 5. PMN-PT sheet resistance test results.
ConditionG1G2G3G4G5
A1infinite
A2infinite
Averagesinfinite
Table 6. PMN-PT sheet capacitance test results.
ConditionG1G2Magnitude of Change (%)G3Magnitude of Change (%)G4Magnitude of Change (%)G5Magnitude of Change (%)
A14.113.99−3.007%3.95−1.012%3.94−0.253%3.91−0.767%
A24.134.00 −3.250%3.96−1.010%3.95−0.253%3.91−1.023%
Averages4.123.995 −3.129%3.955−1.011%3.945−0.253%3.91−0.895%
Table 7. Piezoelectric sensor material parameters.
ModelThickness (mm)Flexibility Coefficient S11 (Nm2)Piezoelectric Coefficient d33 (pC/N)Dielectric Constant
ε33 (FM−1)
Young’s Modulus Ep (GPa)
PZT-5H0.61.65 × 10−114503.01 × 10−860
LDT0-028K0.23.0 × 10−105201.2 × 10−103
PMNT67/330.71.64 × 10−118605.0 × 10−1018
Table 8. Summary of different conditions.
ConditionMaterialNoise Amplitude (V)ConditionMaterialNoise Amplitude (V)ConditionMaterialNoise Amplitude (V)
1PMN-PT07PZT013PVDF0
2PMN-PT28PZT214PVDF2
3PMN-PT49PZT415PVDF4
4PMN-PT610PZT616PVDF6
5PMN-PT811PZT817PVDF8
6PMN-PT1012PZT1018PVDF10
Table 9. Specifications of experimental components for high-strength bolt testing.
ComponentPlateBoltSensor
Model/SpecificationQ345M14PMN-PT
Dimensions (mm)400 × 100 × 1014 × 1.25 × 605 × 5 × 0.68 32 × 16 × 5
Table 10. Comparison of calculated and measured bolt preload values under various test conditions.
ConditionFocus Signal (V)Fastening IndexCalculated Value of Preload Force (N·m)Measured Preload Force (N·m)Inaccuracies
Condition 10.93470.70952.37543.1%
Condition 20.74920.51537.83405.7%
Condition 30.63530.39530.64324.4%
Condition 40.82530.59443.36443.8%
Condition 51.06950.85067.98691.5%
Condition 61.07850.86069.42713.7%
Disclaimer/Publisher’s Note: The statements, opinions and data contained in all publications are solely those of the individual author(s) and contributor(s) and not of MDPI and/or the editor(s). MDPI and/or the editor(s) disclaim responsibility for any injury to people or property resulting from any ideas, methods, instructions or products referred to in the content.