Abstract
Andrographolide (ADG) is a typical poorly water-soluble drug, and a co-amorphous strategy was used here to improve its aqueous solubility. Co-amorphous systems of ADG and amino acids with a 1:1 molar ratio were screened via the neat ball milling method. L-lysine (Lys) and L-tryptophan (Trp) can be used as co-formers with ADG, forming a co-amorphous phase, which was confirmed by powder X-ray diffraction, IR and Raman spectroscopy. ADG-Trp showed poor solubility at 37 °C, which was close to that of raw ADG (0.08 mg·mL−1). ADG-Lys showed unexpectedly enhanced solubility, at 0.5 mg·mL−1 in the media of water and PBS (pH 7.4) and 0.3 mg·mL−1 in the medium of HCl buffer (pH 1.2) at 37 °C. ADG-Lys showed good storage stability for 5 months, but its thermal stability was poor and it could recrystallize at 100 °C. Compared with ADG-Trp, ADG-Lys has weaker hydrogen bonding interactions and stronger hydrophobic interactions related to ADG molecules, which might cause the unusual enhancement in solubility. To our knowledge, ADG-Lys prepared in this work shows the maximum ADG content (70 wt.%) and the highest ADG solubility among the reported ADG amorphous solid dispersions and co-amorphous systems.
1. Introduction
Andrographolide (ADG) is a natural pentacyclic diterpenoid organic compound (Scheme 1) extracted from Andrographis paniculate [1,2]. ADG has a wide range of applications, with anti-inflammatory, anticancer, antibacterial, antiviral, hepatoprotective, antioxidant, antimalarial, and anti-atherosclerosis effects [3,4]. However, lipophilic ADG is a typical poorly water-soluble drug, leading to low bioavailability and limiting its clinical applications [5,6].
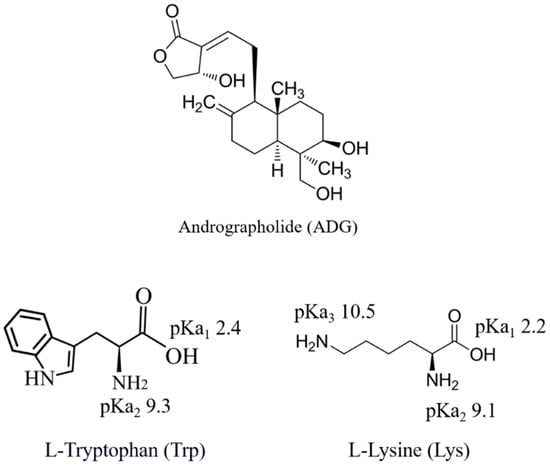
Scheme 1.
Molecular structures of andrographolide (ADG), L-tryptophan (Trp), and L-lysine (Lys).
Drug polymorphism is quite common for active pharmaceutical ingredients and plays an important role in the pharmaceutical industry [7,8]. Only one ADG anhydrous polymorph has been reported in the Cambridge Crystallographic Data Centre (CCDC) database since 1982 [9,10]. Only a few ADG co-crystals have been reported, with vanillin, vanillic acid, salicylic acid, resorcinol, guaiacol [11], and bosentan [12] as co-formers. The research on ADG polymorphisms is still insufficient.
An amorphous system is a promising strategy to improve the solubility and bioavailability of poorly water-soluble drugs [13,14]. Pure amorphous drugs usually face a high risk of recrystallization. The most common amorphous formulations include amorphous solid dispersions and co-amorphous systems [15,16,17]. Pure amorphous ADG has not been reported. The reported ADG amorphous solid dispersions contain no more than 33% ADG [18] and have too many polymer matrices, which is not suitable for oral applications. Co-amorphous systems [19,20] of ADG are promising, serving to enhance its solubility with high content. The binary co-amorphous system of ADG–oxymatrine (molar ratio 1:1) has been reported, but it is prone to recrystallization [21]. Ternary co-amorphous systems with a molar ratio of 1:1:1, such as ADG–oxymatrine–trans-cinnamic acid, ADG–oxymatrine–p-hydroxycinnamic acid, and ADG–oxymatrine–ferulic acid, have been prepared and successfully improved the dissolution behavior and physical stability of co-amorphous ADG–oxymatrine [22]. This is obviously insufficient for co-amorphous systems of ADG. Amino acids are the safest and most commonly used co-formers in co-amorphous systems [23,24], but co-amorphous systems of ADG and amino acids are lacking. It is necessary to investigate the possibility that amino acids act as co-formers of ADG, which will provide insights for the development of novel formulations of ADG.
In this work, ADG and 20 common amino acids were screened for co-amorphous systems with a molar ratio of 1:1 via the neat ball milling method. ADG–tryptophan (ADG-Trp) and ADG–lysine (ADG-Lys) were confirmed as co-amorphous systems, and their dissolution profiles were compared. ADG-Lys showed significantly enhanced solubility at 0.5 mg·mL−1 in water or PBS and 0.3 mg·mL−1 in a pH 1.2 buffer, while ADG-Trp did not show a solubilization effect. Lysine is a feasible co-former, not only for acidic drugs but also for neutral or basic drugs in co-amorphous systems.
2. Materials and Methods
2.1. Materials
Andrographolide (ADG, C20H30O5, 98%, Lot. AB70735) was bought from Jiangsu Aikon (Nanjing, Jiangsu Province, China). Alanine (C3H7NO2, 99%, Ala, Lot. GG130118) was bought from Energy Chemical (Shanghai, China). Arginine (C6H14N4O2, 98.5–101.0%, Arg, Lot. A2007140), aspartic acid (C4H7NO4, 98%, Asp, Lot. D1925016), cysteine (C3H7NO2S, 99%, Cys, Lot. A2126187), glutamic acid (C5H9NO4, 99%, Glu, Lot. B2401111), glutamine (C5H10N2O3, 99%, Gln, Lot. B2102154), glycine (C2H5NO2, 99%, Gly, Lot. l1903013), histidine (C6H9N3O2, 99%, His, Lot. H1908018), isoleucine (C6H13NO2, 99%, Ile, Lot. L2021142), leucine (C6H13NO2, 99%, Leu, Lot. K1928013), lysine (C6H14N2O2, 98%, Lys, Lot. K2013154), methionine (C5H11O2NS, 99%, Met, Lot. C2112284), phenylalanine (C9H11NO2, 99%, Phe, Lot. K2013191), serine (C3H7NO3, 99%, Ser, Lot. H1908018), tryptophan (C11H12N2O2, 99%, Trp, Lot. L2030085), tyrosine (C9H11NO3, 99%, Tyr, Lot. F2011111), valine (C5H11NO2, 99%, Val, Lot. B2026002), PBS powders (pH 7.40, 1 L/pouch, Lot. C2401472), and acetic acid (HAc, 99.8%, Lot. L2109415) were bought from Aladdin (Shanghai, China). Asparagine (C4H8N2O3, 99%, Asn, Lot. C12267046), proline (C5H9NO2, 99%, Pro, Lot. C11725059), and threonine (C4H9NO3, 99%, Thr, Lot. C12092608) were bought from Macklin (Shanghai, China). HCl solution (AR, 36–38%) and NaOH (96%, Lot. F23251573) were bought from Xilong Scientific (Beijing, China). Packaged Soluplus® (Batch No. 30724424U0) was bought from BASF (Germany). All reagents were used without any treatment.
2.2. Methods
Calibration Curves. ADG calibration curves with absorbance at 240 nm were established using ADG aqueous solutions, PBS solutions, or HCl solutions (Figure S1). The wavelength of 240 nm was chosen in this work, instead of the maximum absorption wavelength of 225 nm, to avoid interference with PBS and Lys. First, 25 mg of raw ADG was dissolved in 1 L of the media to prepare 25 μg·mL−1 ADG solutions, and the solutions were used to prepare 5, 10, 15, and 20 μg·mL−1 ADG solutions by dilution with the same media. All these solutions were measured by UV–vis spectroscopy immediately (Shimadzu UV-2550, Shimadzu, Japan, 200–600 nm). The calibration curves were linearly fitted based on the Beer–Lambert law, and the calibration curves of the ADG solutions in the three media were similar (errors < 5%). Tryptophan (Trp) calibration curves with absorbance at 240 and 276 nm were established in the three media in the same way (Figure S1).
Stability of ADG Solutions. The above solutions for calibration curves were stored at room temperature and 37 °C for 24 h, and then were measured by UV–vis spectroscopy.
ADG Solubilities with Lysine (Lys) or Tryptophan (Trp). First, 0.42 mg·mL−1 Lys or 0.58 mg·mL−1 Trp aqueous solutions, PBS solutions, or HCl solutions were prepared. Then, 20 mL of each of the above solutions and 20 mg of raw ADG were mixed and kept at 37 °C for 24 h, and 5 mL of the supernatant was taken out for a UV–vis spectroscopy test.
Neat Ball Milling Process. BM-ADG was prepared by neat ball milling (Tencan Powder, XQM-1, Changsha, Hunan Province, China, 600 r·min−1, 100 mL ball mill jar, 100 g zirconia beads) with 1 g of raw ADG for 2 h. ADG–amino acids were prepared by the neat ball milling of 1 g of raw ADG and equimolar amino acids (e.g., 0.58 g of tryptophan, 0.42 g of lysine) under the same conditions.
Dissolution Profiles. Three dissolution media were used, namely water, a pH 1.2 buffer, and PBS. First, 100 mg of raw ADG, 158 mg of ADG-Trp, or 142 mg of ADG-Lys was added to a dry beaker, and 100 mL of the media kept at 37 °C was slowly added (three parallel experiments) into the beaker. Then, the beaker was sealed and kept at 37 °C in a constant-temperature water bath. Next, 5 mL of the supernatant was taken out without disturbing the solution at 1, 2, 4, 6, 8, 10, and 24 h for a UV–vis test. For the ADG-Lys samples, the collected supernatant was subjected to centrifugation to ensure that there were no solid particles. The dissolution profiles of each sample were measured in parallel three times.
Conventional Characterization. The samples were characterized by powder X-ray diffraction (PXRD, Philips X’ Pert Pro, PANalytical, The Netherlands, Cu Kα, 40 kV, 30 mA, 5–30°, 0.5°·min−1), Fourier transform infrared spectroscopy (FTIR, Shimadzu, IRAffinity-1S, Shimadzu, Kyoto, Japan, 400–4000 cm−1, 2 cm−1), confocal Raman spectroscopy (Thermo Fisher Scientific, Hillsboro, OR, USA, DXR3xi, 532 nm laser, 50–3300 cm−1), scanning electron microscopy (SEM, Thermo Fisher Scientific, Apreo 2C, Hillsboro, OR, USA, 2 kV), and differential scanning calorimetry–thermogravimetric analysis (DSC-TGA, NETZSCH STA 449F3, State of Bavaria, Seulb City, Germany, dry N2, 10 K·min−1).
3. Results
3.1. Co-Amorphous Systems of ADG and Amino Acids
Commercial ADG (raw ADG) is a white crystalline powder. The powder X-ray diffraction (PXRD) pattern of raw ADG is consistent with the simulated pattern (Figure 1), indicating that raw ADG is the crystalline form. The strongest diffraction peak of raw ADG is at 2θ with 15.8°, and the disappearance of this peak was used to judge the formation of the amorphous phase. The PXRD pattern of the neat ball-milled raw ADG (BM-ADG) remained unchanged compared to that of raw ADG, indicating that the ADG crystalline form is not altered during the neat ball milling process. Soluplus is a novel carrier for the formation of stable amorphous solid dispersions, improving the solubility of poorly water-soluble drugs [25]. However, the preparation of amorphous solid dispersions of ADG and Soluplus by neat ball milling failed, and the content of ADG was 20%. The referenced peak at 15.8° was prominent in the PXRD pattern of the product of ADG–Soluplus. Amorphous solid dispersions are not suitable for ADG pharmaceutical formulations with high content of ADG, as the preparation of ADG amorphous solid dispersions with ADG content exceeding 20% cannot be realized.
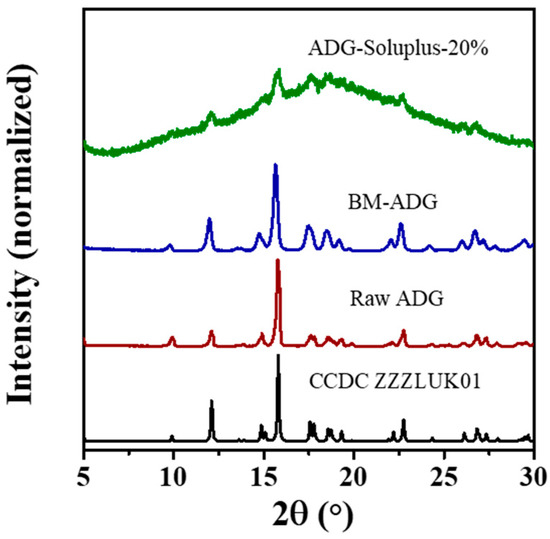
Figure 1.
Powder X-ray diffraction (PXRD) patterns of the simulated crystalline ADG, raw ADG, neat ball-milled ADG (BM-ADG), and ball-milled ADG (mass ratio, 20%) and Soluplus. The used ADG CIF was downloaded from the Cambridge Crystallographic Data Centre (CCDC, Number ZZZLUK01, P21, a = 6.55 Å, b = 8.00 Å, c = 17.99 Å, β = 97.36°). The PXRD pattern simulations were performed using the Mercury 2022.3.0 software.
Twenty common amino acids were screened to prepare the co-amorphous ADG in this work, and the neat ball-milled products of ADG and amino acids with a molar ratio of 1:1 were prepared and termed ADG–amino acids (Figure 2a). The neat ball milling method is the most common method to prepare co-amorphous systems [26,27]. The PXRD patterns show that only ADG-Trp and ADG-Lys do not have sharp diffraction peaks, indicating amorphous characteristics. Considering that the signal at 2θ of 15.8° originates from crystalline ADG, and the signal at 2θ of 17.0° has only contributions from amorphous scattering and no overlap with the signals of the crystal phases of ADG or the amino acids, the ratio of the signal intensity at 17.0° and that at 15.8° was used to represent the amorphization degree of ADG (Figure 2b). A higher ratio indicates a higher degree of amorphization. The 20 products were categorized into three classes: Class I includes ADG-Trp, ADG-Lys, and ADG-Arg, with a high ADG ratio (>0.8), where the crystalline ADG signal was not observed; Class II includes ADG-Cys, ADG-Phe, and ADG-Tyr, with the ADG ratio ranging from 0.5 to 0.8, with a weak ADG signal; Class III includes the remaining products, with strong ADG signals. For Class II of amino acids, ADG-2Cys, ADG-2Phe, and ADG-2Tyr, with a molar ratio of 1:2, were prepared (Figure 2c). ADG-2Cys almost shows no crystalline ADG signal, while ADG-2Phe and ADG-2Tyr still exhibit crystalline ADG signals. In summary, ADG-Trp, ADG-Lys, ADG-Arg, and ADG-2Cys show totally amorphous ADG, and only ADG-Trp and ADG-Lys belong to co-amorphous systems, as ADG-Arg and ADG-2Cys show the signals of crystalline arginine and cysteine.
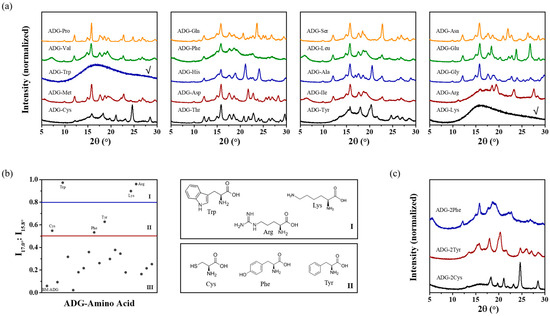
Figure 2.
Screening of co-amorphous ADG and amino acids. (a) PXRD patterns of neat ball-milled ADG and amino acids (1:1 molar ratio), (b) the ratio of the diffraction intensity at 17.0° and 15.8° of ball-milled ADG and amino acids with a 1:1 molar ratio, (c) PXRD patterns of neat ball-milled ADG and cysteine (Cys), tyrosine (Tyr), or phenylalanine (Phe) with a 1:2 molar ratio.
ADG-Trp and ADG-Lys systems with different molar ratios were prepared and investigated. The PXRD patterns of fresh ADG-Trp systems show that ADG-Trp with ADG molar content from 10 mol% to 50 mol% is a co-amorphous system (Figure 3a). There are some signal traces of crystallized ADG observed from the PXRD patterns of ADG-Trp-60 mol% and 70 mol%. The PXRD patterns of fresh ADG-Lys systems show that ADG-Lys-40 mol% to 70 mol% are co-amorphous systems (Figure 3b). Crystallized lysine signals are observed in the PXRD patterns of ADG-Trp-10 mol% to 30 mol%, and crystallized ADG signals are observed in the PXRD patterns of ADG-Trp-80 mol% to 90 mol%.
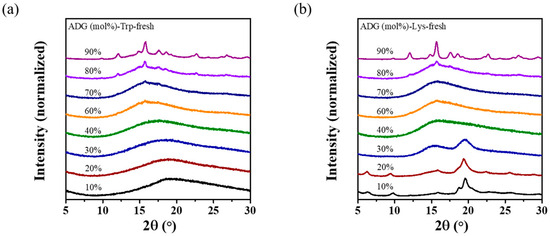
Figure 3.
Screening of co-amorphous ADG and Trp or Lys with different molar ratios. PXRD patterns of fresh (a) ADG-Trp with ADG content ranging from 10 mol% to 90 mol% and (b) ADG-Lys with ADG content ranging from 10 mol% to 90 mol%.
3.2. Dissolution Profiles of ADG-Trp and ADG-Lys
ADG-Trp and ADG-Lys (1:1 molar ratio) were selected for the co-amorphous system study of ADG. The ΔpKa rule [28,29] was used to determine whether ADG-Trp and ADG-Lys were co-amorphous or co-amorphous salts. In the system of the acid (HA) and the base (B), ΔpKa is defined as follows: ΔpKa = pKa (BH+) − pKa (HA). The predicted pKa of ADG is 13.5 [19]. Trp has two pKa values of 2.4 and 9.3, and Lys has three pKa values of 2.2, 9.1, and 10.5 [30,31]. Trp in ADG-Trp and Lys in ADG-Lys play the role of the base. pKa (TrpH+) is 2.4, related to the pKa1 of Trp, and ΔpKa is calculated as 2.4−13.5 = –11.1. pKa (LysH+) is 9.1, related to the pKa2 of Lys, and ΔpKa is calculated as 9.1−13.5 = –4.4. Because the ΔpKa rule indicates that the values are much smaller than –1, ADG-Trp and ADG-Lys are co-amorphous phases with a high probability. The δ-pH diagram of Trp (Figure 4a) indicates that Trp exists in its molecular form in the media of water and phosphate-buffered saline (PBS), and it exists in the form of TrpH+ in HCl buffer. The δ-pH diagram of Lys (Figure 4b) indicates that Lys exists in the form of LysH22+ in HCl buffer, it exists in the form of LysH+ in PBS, and it exists in its molecular form in water.
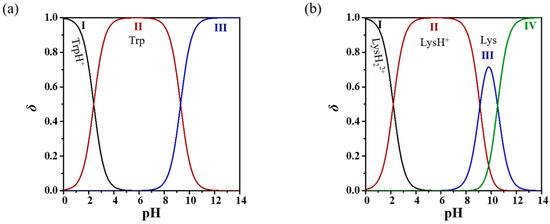
Figure 4.
δ-pH diagrams of (a) tryptophan (Trp) and (b) lysine (Lys).
Three dissolution media, namely pure water, HCl buffer (pH 1.2), and PBS (pH 7.4), were used to compare the dissolution properties of ADG-Trp and ADG-Lys. The dispersion concentration of ADG was settled at 1.00 mg·mL−1. The ADG dissolution profiles of raw ADG in the three media are similar (Figure 5a). Typically, in the medium of water, raw ADG exhibits rapid dissolution at the early stage, with an ADG concentration of 49 μg·mL−1 at 1 h. The ADG concentration gradually increases to 72 μg·mL−1 at 6 h and slowly reaches 80 μg·mL−1 at 24 h, which is similar to the reported ADG solubility of 65 μg·mL−1 at 35 °C and 73 μg·mL−1 at 40 °C [32].
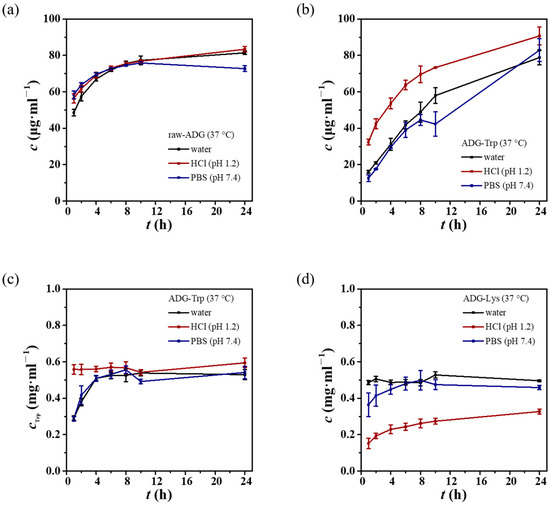
Figure 5.
Dissolution properties of ADG-Trp and ADG-Lys at 37 °C. Dissolution profiles of (a) raw ADG, ADG-Trp in terms of (b) ADG concentration and (c) tryptophan concentration, and (d) ADG-Lys.
The ADG dissolution profiles of ADG-Trp are similar in the media of water and PBS (Figure 5b). Typically, in the medium of water, ADG-Trp exhibits a slower dissolution rate at the early stage, with an ADG concentration of 16 μg·mL−1 at 1 h and 42 μg·mL−1 at 6 h, compared to raw ADG at the same periods, and it reaches 79 μg·mL−1 at 24 h, which is similar to that of raw ADG at 24 h. In the medium of HCl buffer, ADG-Trp shows a quicker dissolution rate at the early stage, with 32 μg·mL−1 at 1 h and 64 μg·mL−1 at 6 h, compared to water or PBS, but it is still slower than that of raw ADG at the same periods. The ADG concentration is 91 μg·mL−1 at 24 h in HCl buffer, which is similar to that in the other two media. We proposed that the increased dissolution rate of ADG-Trp in HCl at the early stage is attributable to the protonation of Trp, which can facilitate the dissolution of Trp and reduce the intermolecular interactions of Trp with ADG. The related Trp dissolution profiles show that the Trp concentration of ADG-Trp becomes constant at 0.51 mg·mL−1 at 4 h in the media of water and PBS (Figure 5c), close to the theoretical value of 0.58 mg·mL−1. The Trp concentration of ADG-Trp in HCl buffer reaches 0.56 mg·mL−1 within 1 h, indicating that tTrp dissolves very rapidly in HCl buffer. In summary, the co-amorphous system of ADG with Trp reduces the dissolution rate at the early stage and does not enhance the solubility of ADG. The ADG dissolution profiles of ADG-Lys show high ADG concentrations in all three media (Figure 5d). The dissolution profile of ADG-Lys shows an ADG concentration of 0.49 mg·mL−1 at 1 h, 0.53 mg·mL−1 at 10 h, and 0.50 mg·mL−1 at 24 h in the medium of water, similar to that of 0.36 mg·mL−1 at 1 h, 0.48 mg·mL−1 at 10 h, and 0.46 mg·mL−1 at 24 h in the medium of PBS. In the medium of HCl buffer, the ADG concentration of ADG-Lys is 0.15 mg·mL−1 at 1 h, 0.27 mg·mL−1 at 10 h, and 0.33 mg·mL−1 at 24 h, which are lower than those in the other two media.
UV–vis spectroscopy reveals that only minimal degradation is observed in the ADG solutions under the dissolution experimental conditions (Figure 6a). Thus, the dissolution profiles of ADG are reasonable and are not influenced by the degradation of ADG. Moreover, 0.42 mg·mL−1 Lys solutions and 0.58 mg·mL−1 Trp solutions do not exhibit obvious solubilization effects on ADG in the three media (Figure 6b), suggesting that the favorable dissolution behavior of ADG-Lys primarily results from the formation of co-amorphous systems. The PXRD pattens of the residual solids collected during the dissolution experiment at 1 h show that ADG-Trp obviously crystallizes into crystalline ADG in all three media (Figure 6c), and ADG-Lys can predominantly retain its amorphous feature in the three media (Figure 6d). Only a small amount of crystalline ADG is observed in the residual solids of ADG-Lys.
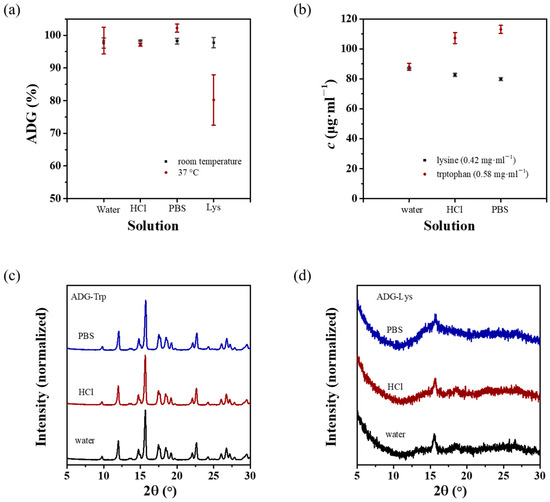
Figure 6.
Changes in ADG solutions and solids during the dissolution process. (a) ADG% of the ADG solutions after one day of storage in different media, including water, HCl buffer, PBS, and 0.42 mg·mL−1 Lys solution, at room temperature and 37 °C; (b) apparent solubilities of ADG in different media, including 0.58 mg·mL−1 Trp or 0.42 mg·mL−1 Lys at 37 °C (0.42 mg·mL−1 and 0.58 mg·mL−1 are the total dissolution concentrations of Lys and Trp in the dissolution experiments, respectively); PXRD patterns of the residual ADG solids after one hour of dissolution in the three media for (c) ADG-Trp and (d) ADG-Lys.
3.3. Morphology and Vibrational Spectroscopic Analysis of ADG-Trp and ADG-Lys
The scanning electron microscopy (SEM) image of raw ADG reveals that raw ADG is composed of irregular particles with non-uniform sizes, from 1 to over 100 μm (Figure 7a). BM-ADG exhibits aggregated nanocrystals with a size of less than 1 μm, as observed from the SEM image (Figure 7b) and PXRD pattern. ADG-Trp (Figure 7c) and ADG-Lys (Figure 7d) are composed of aggregated irregular particles. ADG-Lys has larger particle sizes and a smaller degree of aggregation than ADG-Trp. It seems that the morphology is not the key reason for the significant difference in the dissolution properties of ADG-Trp and ADG-Lys.
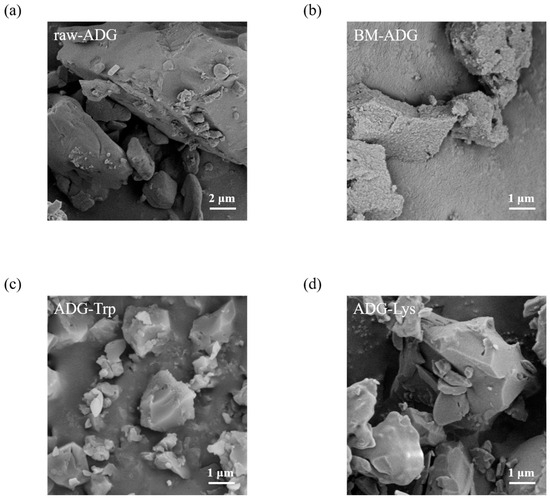
Figure 7.
Scanning electron microscopy (SEM) images of (a) raw ADG, (b) BM-ADG, (c) ADG-Trp, and (d) ADG-Lys.
Low-frequency Raman spectroscopy (Figure 8) reveals that raw ADG exhibits Raman bands at 59, 72, 87, 111, 152, 167, 214, and 284 cm−1, while ADG-Trp and ADG-Lys show no bands. The Raman results indicate that raw ADG is crystalline, and ADG-Trp and ADG-Lys are amorphous [33].
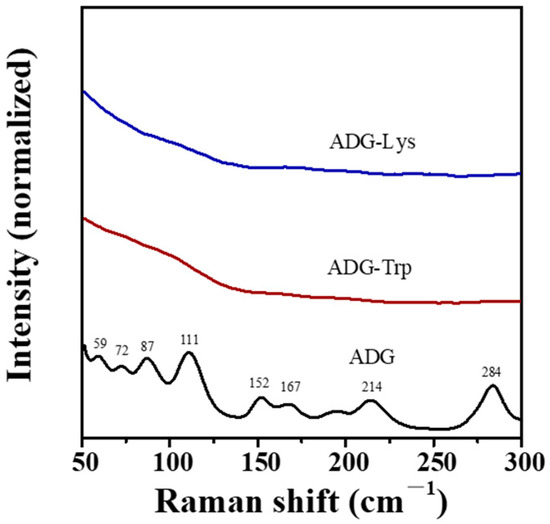
Figure 8.
Low-frequency Raman spectra of raw ADG, ADG-Trp, and ADG-Lys.
The mid-frequency IR spectra show that raw ADG exhibits bands at 1031 cm−1 for C=C groups and 1721 cm−1 for C=O groups (Figure 9a) [21,22,34]. The characteristic C=C group bands are observed in the IR spectra of ADG-Trp (1033 cm−1) and ADG-Lys (1034 cm−1), with a broad full width at half maximum (FWHM), and C=O group bands are also observed in ADG-Trp (1737 cm−1) and ADG-Lys (1744 cm−1), with a broad FWHM, which is consistent with their amorphous characteristics [35]. The existence of C=C bands indicates the presence of ADG molecules in ADG-Trp and ADG-Lys. The absence of C=O bands for Trp and Lys at around 1721 cm−1 is caused by the formation of inner salts, and the existence of C=O bands in ADG-Trp and ADG-Lys excludes the formation of ADG salts and the hydrolysis of ADG. Theoretically, ADG in ADG-Trp is stable and ADG in ADG-Lys has a risk of hydrolysis. However, if hydrolysis occurs, the band at 1744 cm−1 would disappear. The IR band at 1744 cm−1 is also observed in co-amorphous ADG–oxymatrine [21]. The right shifts of the C=O band position suggest an increase in C=O bond energy. Thus, mid-frequency IR spectroscopy indicates that ADG-Trp and ADG-Lys are co-amorphous phases. The high-frequency IR spectra (Figure 9b) show that ADG-Trp and ADG-Lys are very similar, but they are different from raw ADG, indicating that the existing forms of ADG in ADG-Trp and ADG-Lys are the same.
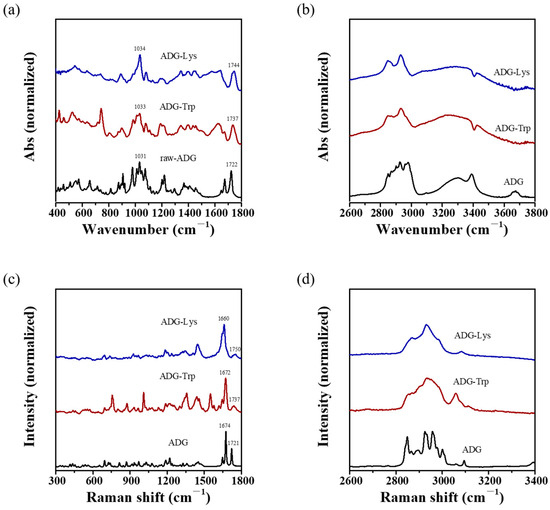
Figure 9.
Vibrational spectroscopic analysis of raw ADG, ADG-Trp, and ADG-Lys. (a) Mid-frequency IR spectra, (b) high-frequency IR spectra, (c) mid-frequency Raman spectra, and (d) high-frequency Raman spectra.
The mid-frequency Raman spectra show that raw ADG exhibits bands at 1674 cm−1 for C=C groups and 1721 cm−1 for C=O groups (Figure 9c). The C=C group of ADG-Trp has an unchanged band at 1672 cm−1 and that of ADG-Lys has a left shift to 1660 cm−1, indicating that the C=C group of ADG-Lys has an extra interaction with Lys. The Raman band at 1660 cm−1 is also observed in co-amorphous ADG–oxymatrine [21]. The C=O groups of ADG-Trp and ADG-Lys have right shifts to 1737 and 1750 cm−1, indicating an increase in the bond energy of C=O. The FWHMs of the C=C group and C=O group bands are broader than those of raw ADG, which is consistent with their amorphous characteristics. The high-frequency Raman spectra (Figure 9d) show that ADG-Trp and ADG-Lys are very similar, but they are different from raw ADG, indicating that the existing forms of ADG in ADG-Trp and ADG-Lys are the same.
3.4. Stability of ADG-Trp and ADG-Lys
The thermogravimetric analysis (TGA) curve of raw ADG (Figure 10a) indicates that crystalline ADG is very stable before 200 °C, with a small weight loss of 0.8%, and decomposes rapidly above 250 °C. The combined differential scanning calorimetry (DSC) curve of raw ADG shows a melting peak at 238 °C, which is consistent with the reported melting point [36]. The TGA curve of ADG-Trp shows a less distinct dehydration step with approximately 5% water content and decomposes after 200 °C (Figure 10b). The DSC curve of ADG-Trp shows a dehydration peak at 90 °C, an endothermic peak at 140 °C corresponding to the amorphous-to-crystalline transformation, and an exothermic peak at 203 °C corresponding to melting. The TGA curve of ADG-Lys shows 7% water weight loss before 100 °C and then continues to decompose (Figure 10c). The DSC curve of ADG-Lys indicates a dehydration peak at around 75 °C and a weak endothermic peak at 127 °C, corresponding to the amorphous-to-crystalline transformation. The macroscopic thermogravimetric analysis (macro-TGA, Figure 10d) reveals that raw ADG is very stable in air at 100 °C without mass changes, ADG-Trp has 4.3% water content and maintains a constant weight during heating, and ADG-Lys has 6.5% water content and its weight slowly decreases during heating. The PXRD patterns of the samples after heating (Figure 10e) show that raw ADG exhibits no changes, ADG-Trp recrystallizes into crystalline ADG, and ADG-Lys exhibits a small amount of crystallization, consistent with the recrystallization temperature of 127 °C. The recrystallization signal of ADG-Trp may be masked by dehydration signals in DSC-TGA, and 140 °C may correspond to the amorphous-to-crystalline transformation of Trp. The thermal stability results indicate that ADG-Trp and ADG-Lys do not have good thermal stability. The storage experiments (Figure 10f) show that ADG-Trp recrystallizes partially and ADG-Lys remains completely amorphous after several months of storage. ADG-Lys demonstrates better storage stability than ADG-Trp.
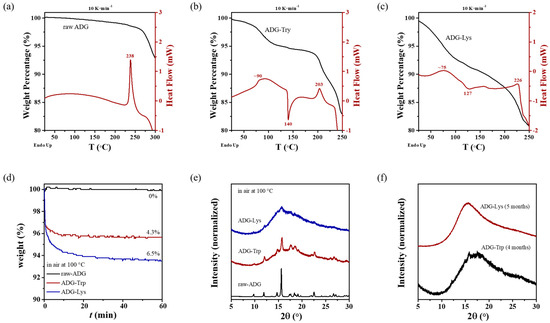
Figure 10.
Thermal and storage stability of ADG-Trp and ADG-Lys. Differential scanning calorimetry–thermogravimetric analysis (DSC-TGA) curves of (a) raw ADG, (b) ADG-Trp, and (c) ADG-Lys; (d) macroscopic thermogravimetric analysis (macro-TGA) curves of raw ADG, ADG-Trp, and ADG-Lys in air at 100 °C; (e) PXRD patterns of raw ADG, ADG-Trp, and ADG-Lys after being heated at 100 °C for 1 h in air; (f) PXRD patterns of ADG-Trp after storage for 4 months and ADG-Lys after storage for 5 months in a sealed environment.
4. Discussion
4.1. Stability of ADG-Lys
ADG will degrade in strongly alkaline environments [37]. Lysine is a weak base with an aqueous solution pH of 9.92; thus, the degradation of ADG is not significant. For solid dispersions, the pKb of lysine is 4.9 [38], which is weak, and the degradation of ADG is kinetically inhibited compared to solution states. IR and Raman spectroscopy, suspension experiments, and thermal recrystallization experiments were utilized to demonstrate that ADG exists as molecules in ADG-Lys. A weakly alkaline environment also leads to the poor thermal stability of ADG-Lys, making it suitable for storage at a low temperature.
4.2. Lysine as a Co-Former
ADG-Lys exhibits the highest solubility among the currently reported amorphous solid dispersions and co-amorphous systems of ADG [18]. Slurry experiments demonstrate that ADG-Lys can almost maintain an amorphous phase during dissolution, whereas ADG-Trp recrystallizes into crystalline ADG. The stability of ADG-Lys during dissolution is a key factor contributing to its exceptionally high solubility. The IR and Raman signals of ADG in ADG-Lys indicate a weakened hydrogen bond with the C=O group of ADG, which induces an increase in the C=O bond energy and a reduction in the bond energy of the connected C=C bond. ADG has a weak ability to form hydrogen bonds via lactone groups. The carboxylate group and ammonium ion group of Lys and Arg have a long distance, indicating a stronger hydrogen-bond donor as a carboxylate group compared to other amino acids. The carboxylate group of Lys can replace the lactone group of ADG in hydrogen bonds. The freer lactone group of ADG seems to facilitate the dissolution of ADG [39]. Therefore, Lys and Arg may be feasible and common co-formers for acidic, neutral, and basic drugs in co-amorphous systems. UV–vis spectroscopy is not effective in measuring Lys concentrations; the tracking of the dissolution concentration of Lys via other methods would help to determine the dissolution behavior of Lys in co-amorphous systems.
5. Conclusions
Co-amorphous ADG-Trp and ADG-Lys were prepared by the neat ball milling method. ADG-Trp shows poor solubility, but ADG-Lys shows enhanced solubility at 0.5 mg·mL−1 in the media of water and PBS (pH 7.4) and 0.3 mg·mL−1 in the medium of HCl buffer (pH 1.2). The enhanced solubility of ADG-Lys mainly results from the stability of the amorphous phase during dissolution. ADG-Lys shows the maximum ADG content (70 wt%) and ADG solubility among the reported ADG amorphous solid dispersions and co-amorphous systems. ADG-Lys could be a good pharmaceutical form for the clinical use of ADG.
Supplementary Materials
The following supporting information can be downloaded at: https://www.mdpi.com/article/10.3390/cryst15090752/s1. Figure S1: Calibration curves of ADG and tryptophan.
Author Contributions
Conceptualization, methodology, supervision, F.C.; project administration, investigation, data curation, validation, H.L.; investigation, Y.Z.; resources, S.R., R.X., W.H., W.X. and F.C.; visualization, writing—original draft preparation, writing—review and editing, F.C.; funding acquisition, W.X., W.H. and F.C. All authors have read and agreed to the published version of the manuscript.
Funding
This research was funded by the National Natural Science Foundation of China [grant number 22005175] and the Fujian Provincial Department of Science and Technology [grant numbers 2023H6021 and 2023J011022].
Data Availability Statement
The original contributions presented in the study are included in the article/Supplementary Materials; further inquiries can be directed to the corresponding author/s.
Conflicts of Interest
The authors declare no conflicts of interest.
References
- Dai, Y.; Chen, S.-R.; Ling, C.; Jing, Z.; Wang, Y.; Wang, Y. Overview of pharmacological activities of andrographis paniculata and its major compound andrographolide. Crit. Rev. Food Sci. Nutr. 2019, 59, S17–S29. [Google Scholar] [CrossRef]
- Karuppusamy, S.; Pullaiah, T.; Nelson, V.K. Andrographolides—An overview. In Andrographolides; Karuppusamy, S., Nelson, V.K., Pullaiah, T., Eds.; Bentham Science Publishers: Sharjah, United Arab Emirates, 2024; pp. 1–9. [Google Scholar]
- Ren, X.; Xu, W.; Sun, J.; Dong, B.; Awala, H.; Wang, L. Current trends on repurposing and pharmacological enhancement of andrographolide. Curr. Med. Chem. 2021, 28, 2346–2368. [Google Scholar] [CrossRef]
- Agrawal, P.; Nair, M.S. An insight into the pharmacological and analytical potential of andrographolide. Fundam. Clin. Pharmacol. 2022, 36, 586–600. [Google Scholar] [CrossRef]
- Ding, B.; Zheng, Z.; Su, J.; Zhou, J.; Xu, S.; Luo, W.; Su, H.; Li, Y.; Xiong, W. Unraveling the impact of stabilizers on nanocrystal preparation and oral absorption: A case study of poorly soluble andrographolide. Nano Lett. 2025, 25, 820–827. [Google Scholar] [CrossRef]
- Zhang, X.; Luo, P.; Wang, J.; Yang, L.; Pang, Z.; Chen, S.; Zhou, Y.; Qin, L. The comparison of anticrystallization effects of cellulose derivatives with polyvinylpyrrolidone and poloxamer on andrographolide: In vitro and in vivo characterization. Carbohydr. Polym. 2025, 358, 123510. [Google Scholar] [CrossRef]
- Zhou, Y.; Lv, C.; Liu, X.; Gao, J.; Gao, Y.; Wang, T.; Huang, X. An overview on polymorph preparation methods of active pharmaceutical ingredients. Cryst. Growth Des. 2024, 24, 584–600. [Google Scholar] [CrossRef]
- Shi, Q.; Chen, H.; Wang, Y.; Xu, J.; Liu, Z.; Zhang, C. Recent advances in drug polymorphs: Aspects of pharmaceutical properties and selective crystallization. Int. J. Pharm. 2022, 611, 121320. [Google Scholar] [CrossRef]
- Smith, A.B.; Toder, B.H.; Carroll, P.J.; Donohue, J. Andrographolide: An X-ray crystallographic analysis. J. Crystallogr. Spectrosc. Res. 1982, 12, 309–319. [Google Scholar] [CrossRef]
- Manjula, S.; Kalaiarasi, C.; Pavan, M.S.; Hathwar, V.R.; Kumaradhas, P. Charge density and electrostatic potential of hepatitis C anti-viral agent andrographolide: An experimental and theoretical study. Acta Crystallogr. Sect. B Struct. Sci. Cryst. Eng. Mater. 2018, 74, 693–704. [Google Scholar] [CrossRef]
- Suresh, K.; Goud, N.R.; Nangia, A. Andrographolide: Solving chemical instability and poor solubility by means of cocrystals. Chem. Asian J. 2013, 8, 3032–3041. [Google Scholar] [CrossRef]
- Zoulikha, M.; Zou, J.; Yang, P.; Wu, J.; Wu, W.; Hao, K.; He, W. Cocrystal pleomorphism-inspired drug nanoassembly for pulmonary-endothelium targeting and pulmonary hypertension treatment. Acta Pharm. Sin. B 2025, 15, 557–570. [Google Scholar] [CrossRef]
- Tomar, D.; Singh, P.K.; Sajidul, H.; Sheela, M.; Anitha, S.; Rahul, K.; Jitender, M.; Dharmendra, K.; Dua, K. Amorphous systems for delivery of nutraceuticals: Challenges opportunities. Crit. Rev. Food Sci. Nutr. 2022, 62, 1204–1221. [Google Scholar] [CrossRef]
- Moseson, D.E.; Tran, T.B.; Karunakaran, B.; Ambardekar, R.; Hiew, T.N. Trends in amorphous solid dispersion drug products approved by the U.S. Food and Drug Administration between 2012 and 2023. Int. J. Pharm. X 2024, 7, 100259. [Google Scholar] [CrossRef]
- Saberi, A.; Kouhjani, M.; Yari, D.; Jahani, A.; Asare-Addo, K.; Kamali, H.; Nokhodchi, A. Development, recent advances, and updates in binary, ternary co-amorphous systems, and ternary solid dispersions. J. Drug Deliv. Sci. Technol. 2023, 86, 104746. [Google Scholar] [CrossRef]
- Dhaval, M.; Dudhat, K.; Soniwala, M.; Dudhrejiya, A.; Shah, S.; Prajapati, B. A review on stabilization mechanism of amorphous form based drug delivery system. Mater. Today Commun. 2023, 37, 107411. [Google Scholar] [CrossRef]
- Mizoguchi, R.; Waraya, H.; Hirakura, Y. Application of co-amorphous technology for improving the physicochemical properties of amorphous formulations. Mol. Pharm. 2019, 16, 2142–2152. [Google Scholar] [CrossRef]
- Tipduangta, P.; Chansakaow, S.; Tansakul, P.; Meungjai, R.; Dilokthornsakul, P. Polymer matrix and manufacturing methods in solid dispersion system for enhancing andrographolide solubility and absorption: A systematic review. Pharmaceutics 2024, 16, 688. [Google Scholar] [CrossRef]
- Shi, Q.; Wang, Y.; Moinuddin, S.M.; Feng, X.; Ahsan, F. Co-amorphous drug delivery systems: A review of physical stability, in vitro and in vivo performance. AAPS PharmSciTech 2022, 23, 259. [Google Scholar] [CrossRef]
- Rode, K.; Maji, I.; Mahajan, S.; Singh, P.K. Unlocking the potential of flavonoid-based co-crystal and co-amorphous systems. Drug Discov. Today 2024, 29, 104050. [Google Scholar] [CrossRef]
- Fang, X.; Hu, Y.; Huang, Z.; Han, L.; Li, B.; Lu, S.; Cao, Y. Exploring the formation mechanism of coamorphous andrographolide-oxymatrine based on molecular dynamics and spectroscopy. J. Pharm. Sci. 2022, 111, 2056–2071. [Google Scholar] [CrossRef]
- Fang, X.; Hu, Y.; Yang, G.; Shi, W.; Lu, S.; Cao, Y. Improving physicochemical properties and pharmacological activities of ternary co-amorphous systems. Eur. J. Pharm. Biopharm. 2022, 181, 22–35. [Google Scholar] [CrossRef]
- Kapoor, D.U.; Singh, S.; Sharma, P.; Prajapati, B.G. Amorphization of low soluble drug with amino acids to improve its therapeutic efficacy: A state-of-art-review. AAPS PharmSciTech 2023, 24, 253. [Google Scholar] [CrossRef]
- Wang, H.; Zhao, P.; Ma, R.; Jia, J.; Fu, Q. Drug–drug co-amorphous systems: An emerging formulation strategy for poorly water-soluble drugs. Drug Discov. Today 2024, 29, 103883. [Google Scholar] [CrossRef]
- Attia, M.S.; Elshahat, A.; Hamdy, A.; Fathi, A.M.; Emad-Eldin, M.; Ghazy, F.-E.S.; Chopra, H.; Ibrahim, T.M. Soluplus® as a solubilizing excipient for poorly water-soluble drugs: Recent advances in formulation strategies and pharmaceutical product features. J. Drug Deliv. Sci. Technol. 2023, 84, 104519. [Google Scholar] [CrossRef]
- Martínez, L.M.; Cruz-Angeles, J.; Vázquez-Dávila, M.; Martínez, E.; Cabada, P.; Navarrete-Bernal, C.; Cortez, F. Mechanical activation by ball milling as a strategy to prepare highly soluble pharmaceutical formulations in the form of co-amorphous, co-crystals, or polymorphs. Pharmaceutics 2022, 14, 2003. [Google Scholar] [CrossRef]
- Nascimento, A.L.C.S.; Martins, I.C.B.; Spósito, L.; Morais-Silva, G.; Duarte, J.L.; Rades, T.; Chorilli, M. Indomethacin-omeprazole as therapeutic hybrids? Salt and co-amorphous systems enhancing physicochemical and pharmacological properties. Int. J. Pharm. 2024, 653, 123857. [Google Scholar] [CrossRef]
- Cruz-Cabeza, A.J. Acid–base crystalline complexes and the pKa rule. CrystEngComm 2012, 14, 6362–6365. [Google Scholar] [CrossRef]
- Quintano, M.; Moura, R.T.; Kraka, E. The pKa rule in light of local mode force constants. Chem. Phys. Lett. 2023, 826, 140654. [Google Scholar] [CrossRef]
- Tummanapelli, A.K.; Vasudevan, S. Ab initio molecular dynamics simulations of amino acids in aqueous solutions: Estimating pKa values from metadynamics sampling. J. Phys. Chem. B 2015, 119, 12249–12255. [Google Scholar] [CrossRef]
- Šebesta, F.; Sovová, Ž.; Burda, J.V. Determination of amino acids’ pKa: Importance of cavity scaling within implicit solvation models and choice of dft functionals. J. Phys. Chem. B 2024, 128, 1627–1637. [Google Scholar] [CrossRef]
- Chen, M.; Xie, C.; Liu, L. Solubility of andrographolide in various solvents from (288.2 to 323.2) K. J. Chem. Eng. Data 2010, 55, 5297–5298. [Google Scholar] [CrossRef]
- Fan, Y.; Xue, R.; Chen, F. Explanation and prediction for the product of trehalose dihydrate selective dehydration process using mid-frequency Raman difference spectra. Vib. Spectrosc. 2024, 130, 103626. [Google Scholar] [CrossRef]
- Assim Haq, S.; Paudwal, G.; Banjare, N.; Iqbal Andrabi, N.; Wazir, P.; Nandi, U.; Ahmed, Z.; Gupta, P.N. Sustained release polymer and surfactant based solid dispersion of andrographolide exhibited improved solubility, dissolution, pharmacokinetics, and pharmacological activity. Int. J. Pharm. 2024, 651, 123786. [Google Scholar] [CrossRef]
- Long, X.; Nasse, M.J.; Ma, Y.; Qi, L. From synthetic to biogenic Mg-containing calcites: A comparative study using FTIR microspectroscopy. Phys. Chem. Chem. Phys. 2012, 14, 2255–2263. [Google Scholar] [CrossRef]
- Zhang, Y.; Hu, X.; Liu, X.; Dandan, Y.; Di, D.; Yin, T.; Zhang, S.; Tang, X. Dry state microcrystals stabilized by an HPMC film to improve the bioavailability of andrographolide. Int. J. Pharm. 2015, 493, 214–223. [Google Scholar] [CrossRef]
- Jaidee, W.; Rujanapun, N.; Malee, K.; Chaisawadi, S.; Puttarak, P.; Hiransai, P.; Cordell, G.A.; Sarker, S.D.; Nahar, L.; Charoensup, R. Degradation kinetics of Andrographolide in aqueous solution, product identification and biological activity evaluation. Sci. Rep. 2025, 15, 28856. [Google Scholar] [CrossRef]
- Indulkar, A.S.; Alex, S.; Zhang, G.G.Z. Impact of dissolution medium pH and ionization state of the drug on the release performance of amorphous solid dispersions. J. Pharm. Sci. 2025, 114, 497–506. [Google Scholar] [CrossRef]
- Löbmann, K.; Laitinen, R.; Strachan, C.; Rades, T.; Grohganz, H. Amino acids as co-amorphous stabilizers for poorly water-soluble drugs—Part 2: Molecular interactions. Eur. J. Pharm. Biopharm. 2013, 85, 882–888. [Google Scholar] [CrossRef]


Disclaimer/Publisher’s Note: The statements, opinions and data contained in all publications are solely those of the individual author(s) and contributor(s) and not of MDPI and/or the editor(s). MDPI and/or the editor(s) disclaim responsibility for any injury to people or property resulting from any ideas, methods, instructions or products referred to in the content. |
© 2025 by the authors. Licensee MDPI, Basel, Switzerland. This article is an open access article distributed under the terms and conditions of the Creative Commons Attribution (CC BY) license (https://creativecommons.org/licenses/by/4.0/).