Article

Temperature- and Emission Wavelength-Dependent Time Responses of Strontium Aluminates

1
Institute of Solid State Physics, University of Latvia, Ķengaraga iela 8, Latgales priekšpilsēta, LV-1063 Riga, Latvia
2
Centre de Recherche en Photonique, Université du Québec en Outaouais, 101 rue St-Jean Bosco, Gatineau, QC J8Y 3G5, Canada
3
Central Laboratory for Applied Physics, BAS, 61 Blvd Sanct Peterburg, 4000 Plovdiv, Bulgaria
4
Centre de Développement des Technologies Avancées CDTA, Baba Hassen, Algiers 16303, Algeria
*
Author to whom correspondence should be addressed.
Crystals 2025, 15(8), 744; https://doi.org/10.3390/cryst15080744
Submission received: 12 July 2025 / Revised: 11 August 2025 / Accepted: 14 August 2025 / Published: 20 August 2025
(This article belongs to the Section Polycrystalline Ceramics)

Abstract

In this paper, we study the temperature- and emission wavelength-dependent time responses of previously reported precursor-driven Eu2+- and Dy3+-doped strontium-aluminate phosphors to create unique luminescent anti-counterfeiting tags suitable for detection with smartphones. A smartphone was used to detect the red–green–blue (RGB) components of the rise and decay time responses of the samples in a temperature range from 0 °C to 100 °C. The RGB color-dependent detection revealed a finer excitation/relaxation kinetics structure of the individual samples, which becomes evident in the decay responses. The results suggest another possibility for multilevel encoding and temperature sensor applications, and provides a foundation for developing a more accurate theoretical model of the energy transitions in phosphorescent materials.

1. Introduction

Persistent-luminescent phosphorescent materials are widely employed in lighting, safety signs, and, more recently, in optical anti-counterfeiting labels [1,2,3,4,5]. Such tags typically encode information in the time domain (e.g., glow decay rates) or in combined color–time sequences, creating an invisible layer of protection that cannot be reproduced by simple QR codes or printed inks [6,7]. Among known persistent luminescence materials, strontium-aluminate compounds doped with Eu2+ and Dy3+ are particularly attractive due to their high quantum yield, non-toxic composition, and low excitation threshold, making them ideal candidates for energy-efficient and user-friendly applications [8,9,10].
Strontium-aluminate phosphors typically emit in the blue–green region over a wide band centered around 490–520 nm [11,12,13,14], and the persistent afterglow often extends over tens of minutes to even hours. While this long-duration glow is good for safety and emergency signage, it is less suited for modern anti-counterfeiting platforms where shorter and well-resolved decay profiles are needed, for example, in smartphone-interrogated authentication schemes (as we have previously reported in [7,9]). Ultra-long afterglow also saturates consumer-grade sensors and lacks sufficient decay structure to encode complex signatures.
In our previous study [6], we introduced a precursor-controlled microwave–hydrothermal synthesis route to systematically reshape the trap landscape of Sr-aluminates doped with Eu and Dy. By adjusting the precursor chemistry, we tuned the phase composition and tailored trap depths to a shallower range. This adjustment enables rapid trap emptying and shorter glow durations—on the order of seconds to tens of seconds—making the material far better suited for dynamic optical tagging that can be read by mid-range smartphone cameras.
Several models have been developed to describe trap depth distributions and carrier de-trapping mechanisms in phosphorescent materials [4,15,16,17,18,19]. These have long been known [20,21] to be related to the particular dependence of the time response. Thus, single energy traps have been known to lead to a temperature-dependent exponential decay, a uniform trap distribution to a decay inversely proportional to time, i.e., t−1, and a quasi-uniform distribution—to an inverse power law decay, i.e., t−α [21]. Also, when re-trapping occurs during optical excitation of electrons from traps, the result can be non-exponential decays. The role of spatially randomly distributed defects in the crystal characterized by a rectangular potential barrier to which an electron can tunnel from a trap and then to a recombination center has been considered [22], resulting in a general expression for the decay time dependence of which the inverse power law is a good approximation for the most part of the decay, with α in the 0.95–1.5 range. Non-rectangular potential barriers have been considered [23] to explain the inverse power law with α in the full 0.5–2.0 range. Recently, distributions of subsystems with different trap depths have been considered [24] in combination with a set of differential rate equations, resulting in a multiexponential fitting to describe afterglow kinetics. It should be pointed out that the diversity of approaches is to a large extent related to the variety of luminescent materials used, the dopants, and the sizes of the particles.
However, while most of the attention has been focused on the type of energy distribution of the traps or defects or their spatial distribution, little or no attention has been paid to the finer spectral and kinetic structure of the emission process itself. Notably, our findings in this study indicate that reabsorption of the blue portion of the emission spectrum can lead to a delayed emission in the green and red part of the overall luminescence spectrum, giving rise to a secondary intensity rise in these color channels during the afterglow phase. This unexpected “anomalous” red-channel and/or green-channel resurgence represents a new mode of luminescent behavior that is not observed in deeper-trap, solid-state Sr-aluminate phosphors [7]. This kinetic fingerprint is easily detectable using simple RGB signal extraction from smartphone video recordings and holds significant potential for optical fingerprinting and anti-cloning technologies on the one side, and the development of more detailed systems of rate equations that describe the luminescence process.

2. Materials and Experimental Setup

2.1. Materials Under Study

The seven phosphorescent samples used in this study were presented and described in a recent paper [6]. Eu2+- and Dy3+-co-doped strontium-aluminate luminophores were synthesized via a microwave-assisted hydrothermal method and tailored by choice of precursors to create unique emission profiles. By precisely controlling the synthesis parameters, a finely adjusted emission behavior optimized for anti-counterfeiting application was achieved—powders were grown using a low-temperature microwave–hydrothermal burst (240 °C, 1 h 30 min) followed by a brief 1200 °C calcination, a sequence that nucleates very defect-rich crystallites; depending on whether the precipitating anion is a hydroxide or a carbonate/HMTA, the final mix swings from monoclinic SrAl2O4 to >90% cubic Sr3Al2O6 with minor Sr4Al14O25 (Table 1). This phase flexibility and local environment creates an ensemble of shallow traps 0.05–0.19 eV below the conduction band, so the afterglow of the material completes in tens of seconds rather than hours. The obtained powders demonstrate good potential as secure, persistent smartphone-detectable optical labels. As described in reference [6], X-ray diffraction (XRD) measurements were performed on all samples using a MiniFlex 600 diffractometer (Rigaku, Japan) with Cu Kα radiation (40 kV, 15 mA). Phase identification was carried out by Rietveld refinement with FullProf software (v5.20), employing crystallographic information files from the Materials Project (mp-3393, mp-3094, mp-5512). Table 1 contains the summary of the basic characteristics of the seven samples. Compared to our previous study [7], where the reaction mixtures were fired either by conventional or microwave-assisted combustion or by solid-state sintering at 600–1200 °C, the results yield single- or dual-phase materials dominated by Sr4Al14O25 or SrAl2O4, with no deliberate cubic Sr3Al2O6 enrichment. The materials that are used in this study have the principal electron traps several times shallower compared to the materials in [7], therefore allowing for fast cycling and differences in the color signature.

2.2. Experimental Arrangement

Figure 1 presents the experimental arrangement for the performed measurements. A pulse generator with variable period and duty cycle η drives a UV LED whose light excites the sample via a 600 μm quartz-polymer optical fiber.
A 380 nm UV LED was used for the illumination of the samples, since previous [6] studies of these samples indicated excitation in the 360 nm to 380 nm range was the most efficient. The powder of the luminescent material was placed in a 0.8 mm diameter hole to which the lead-in fiber had access to excite the samples. A thermoelectric cooler (TEC) was used to maintain a constant temperature in the 0C to 100C range, which was controlled by a thermocouple. A smartphone (Xiaomi 11TPro) was used to take video at a 30 FPS rate of the phosphorescent light pulsing from the samples. As the LED excitation was pulsed over a period T, we refer to the “ON phase” as the duration τ over which the LED is switched on, and the “OFF phase” as the duration Tτ over which the LED is switched off. The duty cycle of the modulation is the ratio η = τ/T. At each temperature, the time responses with a period of T = 2 s were measured for three different duty cycles, η = 20%, 50%, and 80%.
The data processing of the video is as follows. Initially, the video is loaded using the OpenCV library, and the total number of frames is automatically retrieved. A representative frame containing the maximum light intensity is used to allow the user to manually select a rectangular region within the image. This selection defines the region of interest (ROI) on which all subsequent analyses are performed. For each frame in the video, the region of interest (ROI) is extracted from the full-color image. This portion is then split into three matrices corresponding to the Red, Green, and Blue (RGB) color channels. Simultaneously, a grayscale version of the same ROI is obtained to represent the perceived overall intensity Y. The intensities of the phosphorescent light were traced separately for the R, G, and B pixels, and the integral signal Y referred to as “Grey” was obtained as a weighted sum:
Y = 0.0722 B + 0.7152 G + 0.2126 R
where the coefficients represent the luminance perception of typical three-color human vision. Since the ROI is a two-dimensional image of height h and width w, the horizontal mean intensity was computed for all of the rows and columns of the selected rectangular area.

3. Results and Analysis

Using the experimental arrangement from Figure 1, we performed extensive measurements on the rise/decay time responses in the temperature range from 0 °C to 100 °C. As the response times are of the order of a second, a period of T = 2 s was used that allowed us to take an average of 10 consecutive periodic excitations of each sample. As a reference, we considered the η = 50% duty cycle.

3.1. Rise and Decay Time Responses

3.1.1. Two Types of Time Responses

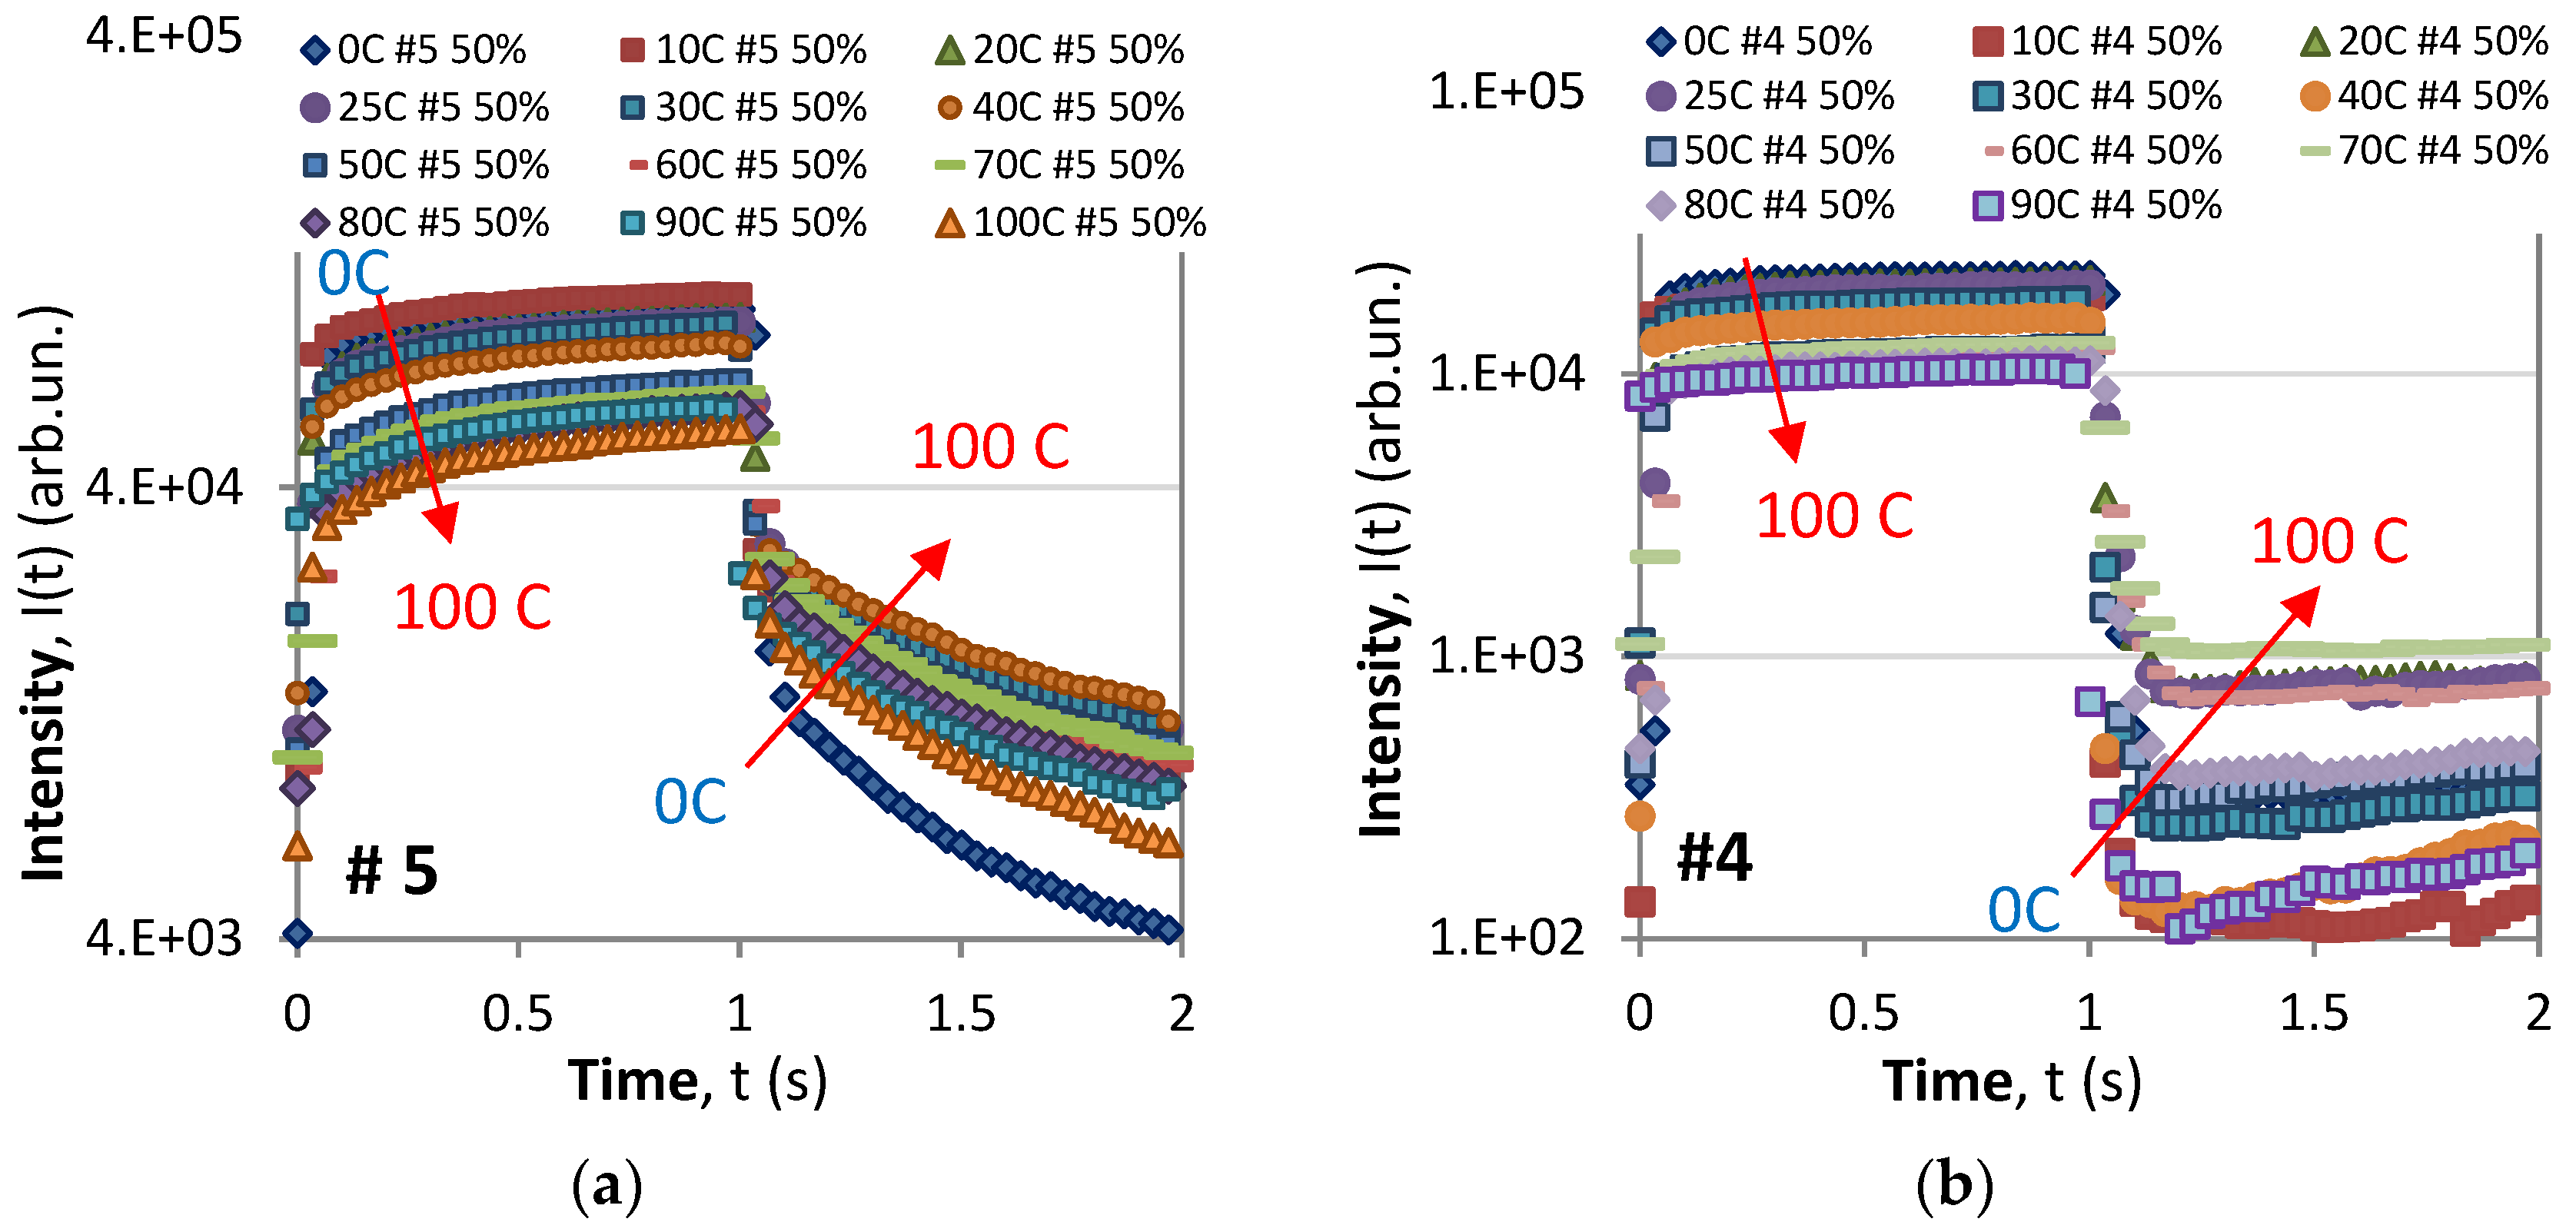
In the initial studies [6] of these samples, we noted that one of the samples (#4) exhibited an anomalous overall integral (Grey) decay response consisting of a rapid initial drop during the OFF phase followed by a slow rise of the luminescence in the absence of external excitation, while the rest of the samples exhibited the standard smooth decay, which can be approximated by a power or exponential law whose parameters differ for the rise (excitation ON) and the decay (excitation OFF) phases. In Figure 2a below, we show the rise/decay time responses at different temperatures of sample (#5) with a standard response and sample #4 exhibiting the above-described anomalous decay response in Figure 2b.
In both samples, we observe the already commented effect of temperature on the responses [9], namely the intensity during the ON phase decreases with temperature following the well-known Arrhenius dependence (Equation (A1)) (see Appendix A) on the one hand, and an increase in the phosphorescence intensity during the OFF phase on the other. While the general trend is still valid, we observe for sample #4 that the anomalous decay response is stronger at lower temperatures and tends to disappear with temperature increase.

3.1.2. Normalized Responses

To compare the temperature responses of the samples, we use two normalized quantities. The first is normalized to the initial temperature T0 intensity measured during the ON phase, which is obtained from Equation (A1) as
ξ ( T ) = I ( T ) I ( T 0 ) = A ( T 0 ) 1 + A exp Δ E k T ,   where   A ( T 0 ) = 1 + A exp Δ E k T 0
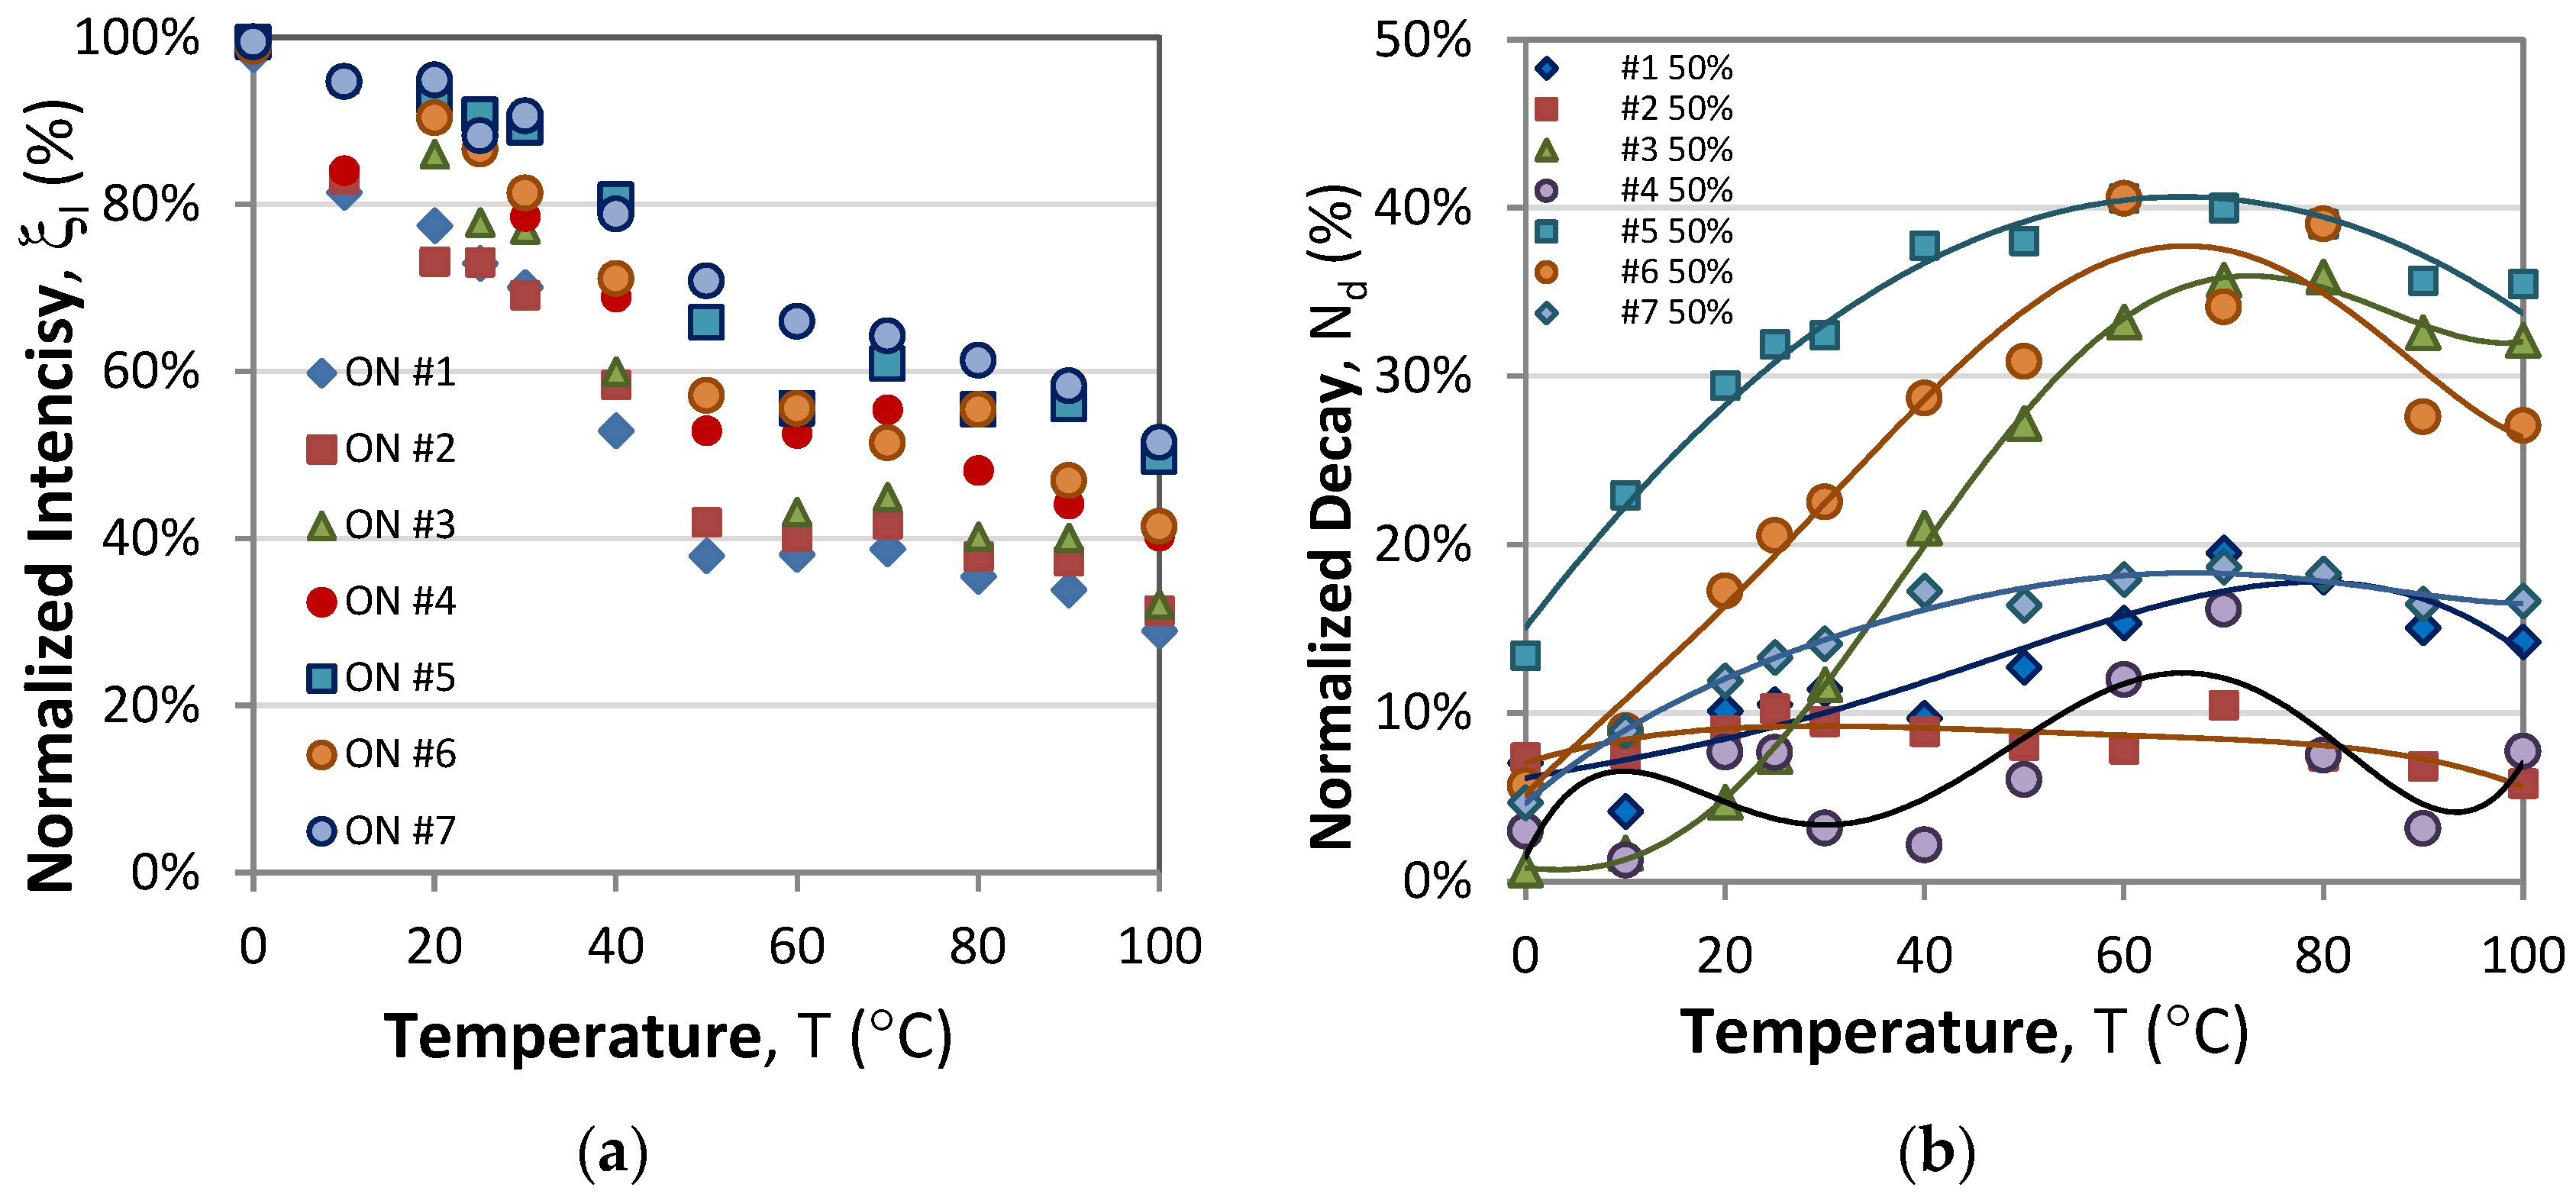
The second is the normalized decay response Nd from Equation (A6), which is calculated over a desired number of measurement instances ti (i = k to m). It is a measure of the effect of temperature on both the rise and decay responses and is generally proportional to the relative share of phosphorescence in the total luminescence, which, as shown earlier [25], initially increases with temperature and then decreases. Figure 3a presents the normalized intensity during the ON phase, while Figure 3b is a comparison of the normalized decays of the samples under study and is calculated for a summation of i = 2 ÷ 30.
As seen from Figure 3b, the strongest temperature dependence of the normalized decay is for samples #5, #6, #3, and #7, which monotonically increase until about 60 °C–70 °C followed by a decrease with temperature, as already observed and explained [9]. For the rest of the samples, however, the behavior is quite different, and for sample #4, the normalized decay is irregular with temperature. The fact that the responses and sensitivities to temperature vary so much implies that there are different mechanisms associated with the luminescence process, which needs a more profound study of the structure of luminescence.

3.2. RGB Color Dependence of the Rise/Decay Time Responses

3.2.1. RGB Time Responses at Different Temperatures

In an earlier study [7], it was reported that the time responses of the phosphorescence depend on the emission wavelength, i.e., different spectral components of the luminescence spectrum exhibit different rise and decay time responses. This effect was more clearly observed with RGB time responses of Sr aluminates in a previous study [26]. The samples of this study did not exhibit the anomalous behavior, and no deeper analysis was carried out. As we very recently noted, the capability of smartphones to individually read the signals from RGB pixels whose transmission filters transmit different parts of the luminescence spectrum permits us to detect anomalous responses for parts of the luminescence spectrum [27]. Thus, we can roughly compare the rise/decay time responses in the blue (B), green (G), and red (R) portions of the spectrum as well as the integral overall luminescence represented by the Grey scale parameter Y. We did this at each temperature for three different duty cycles.
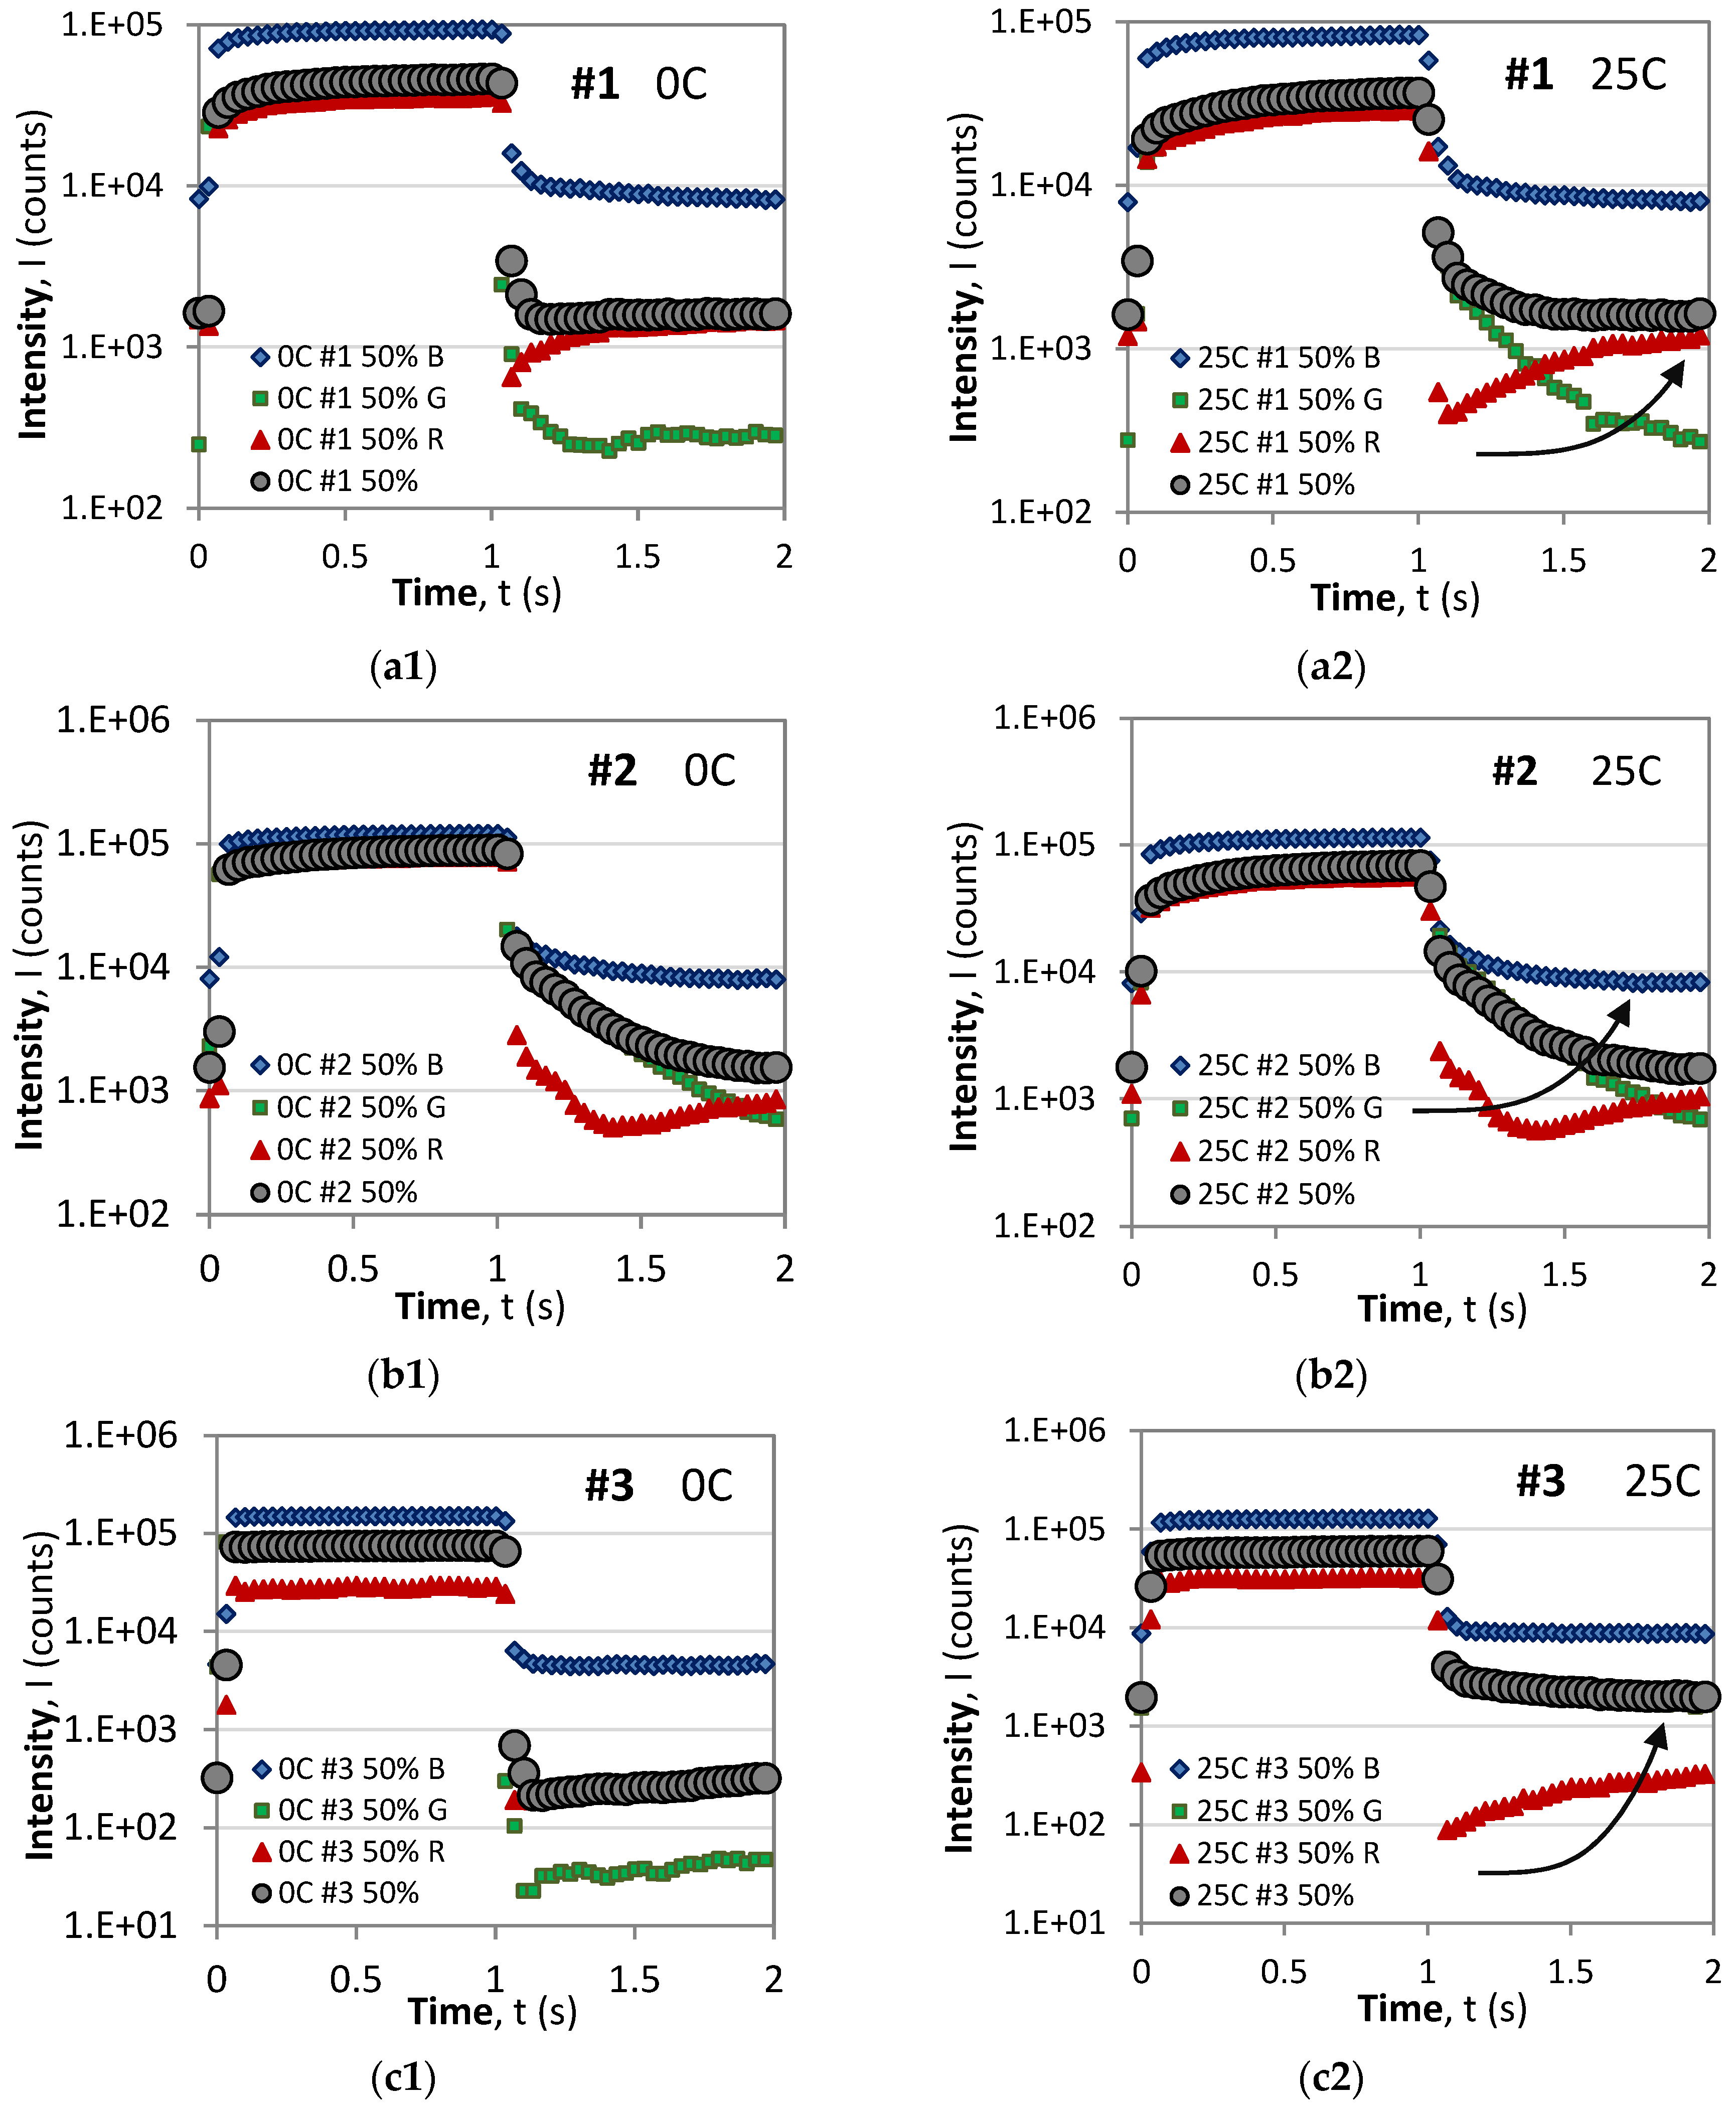
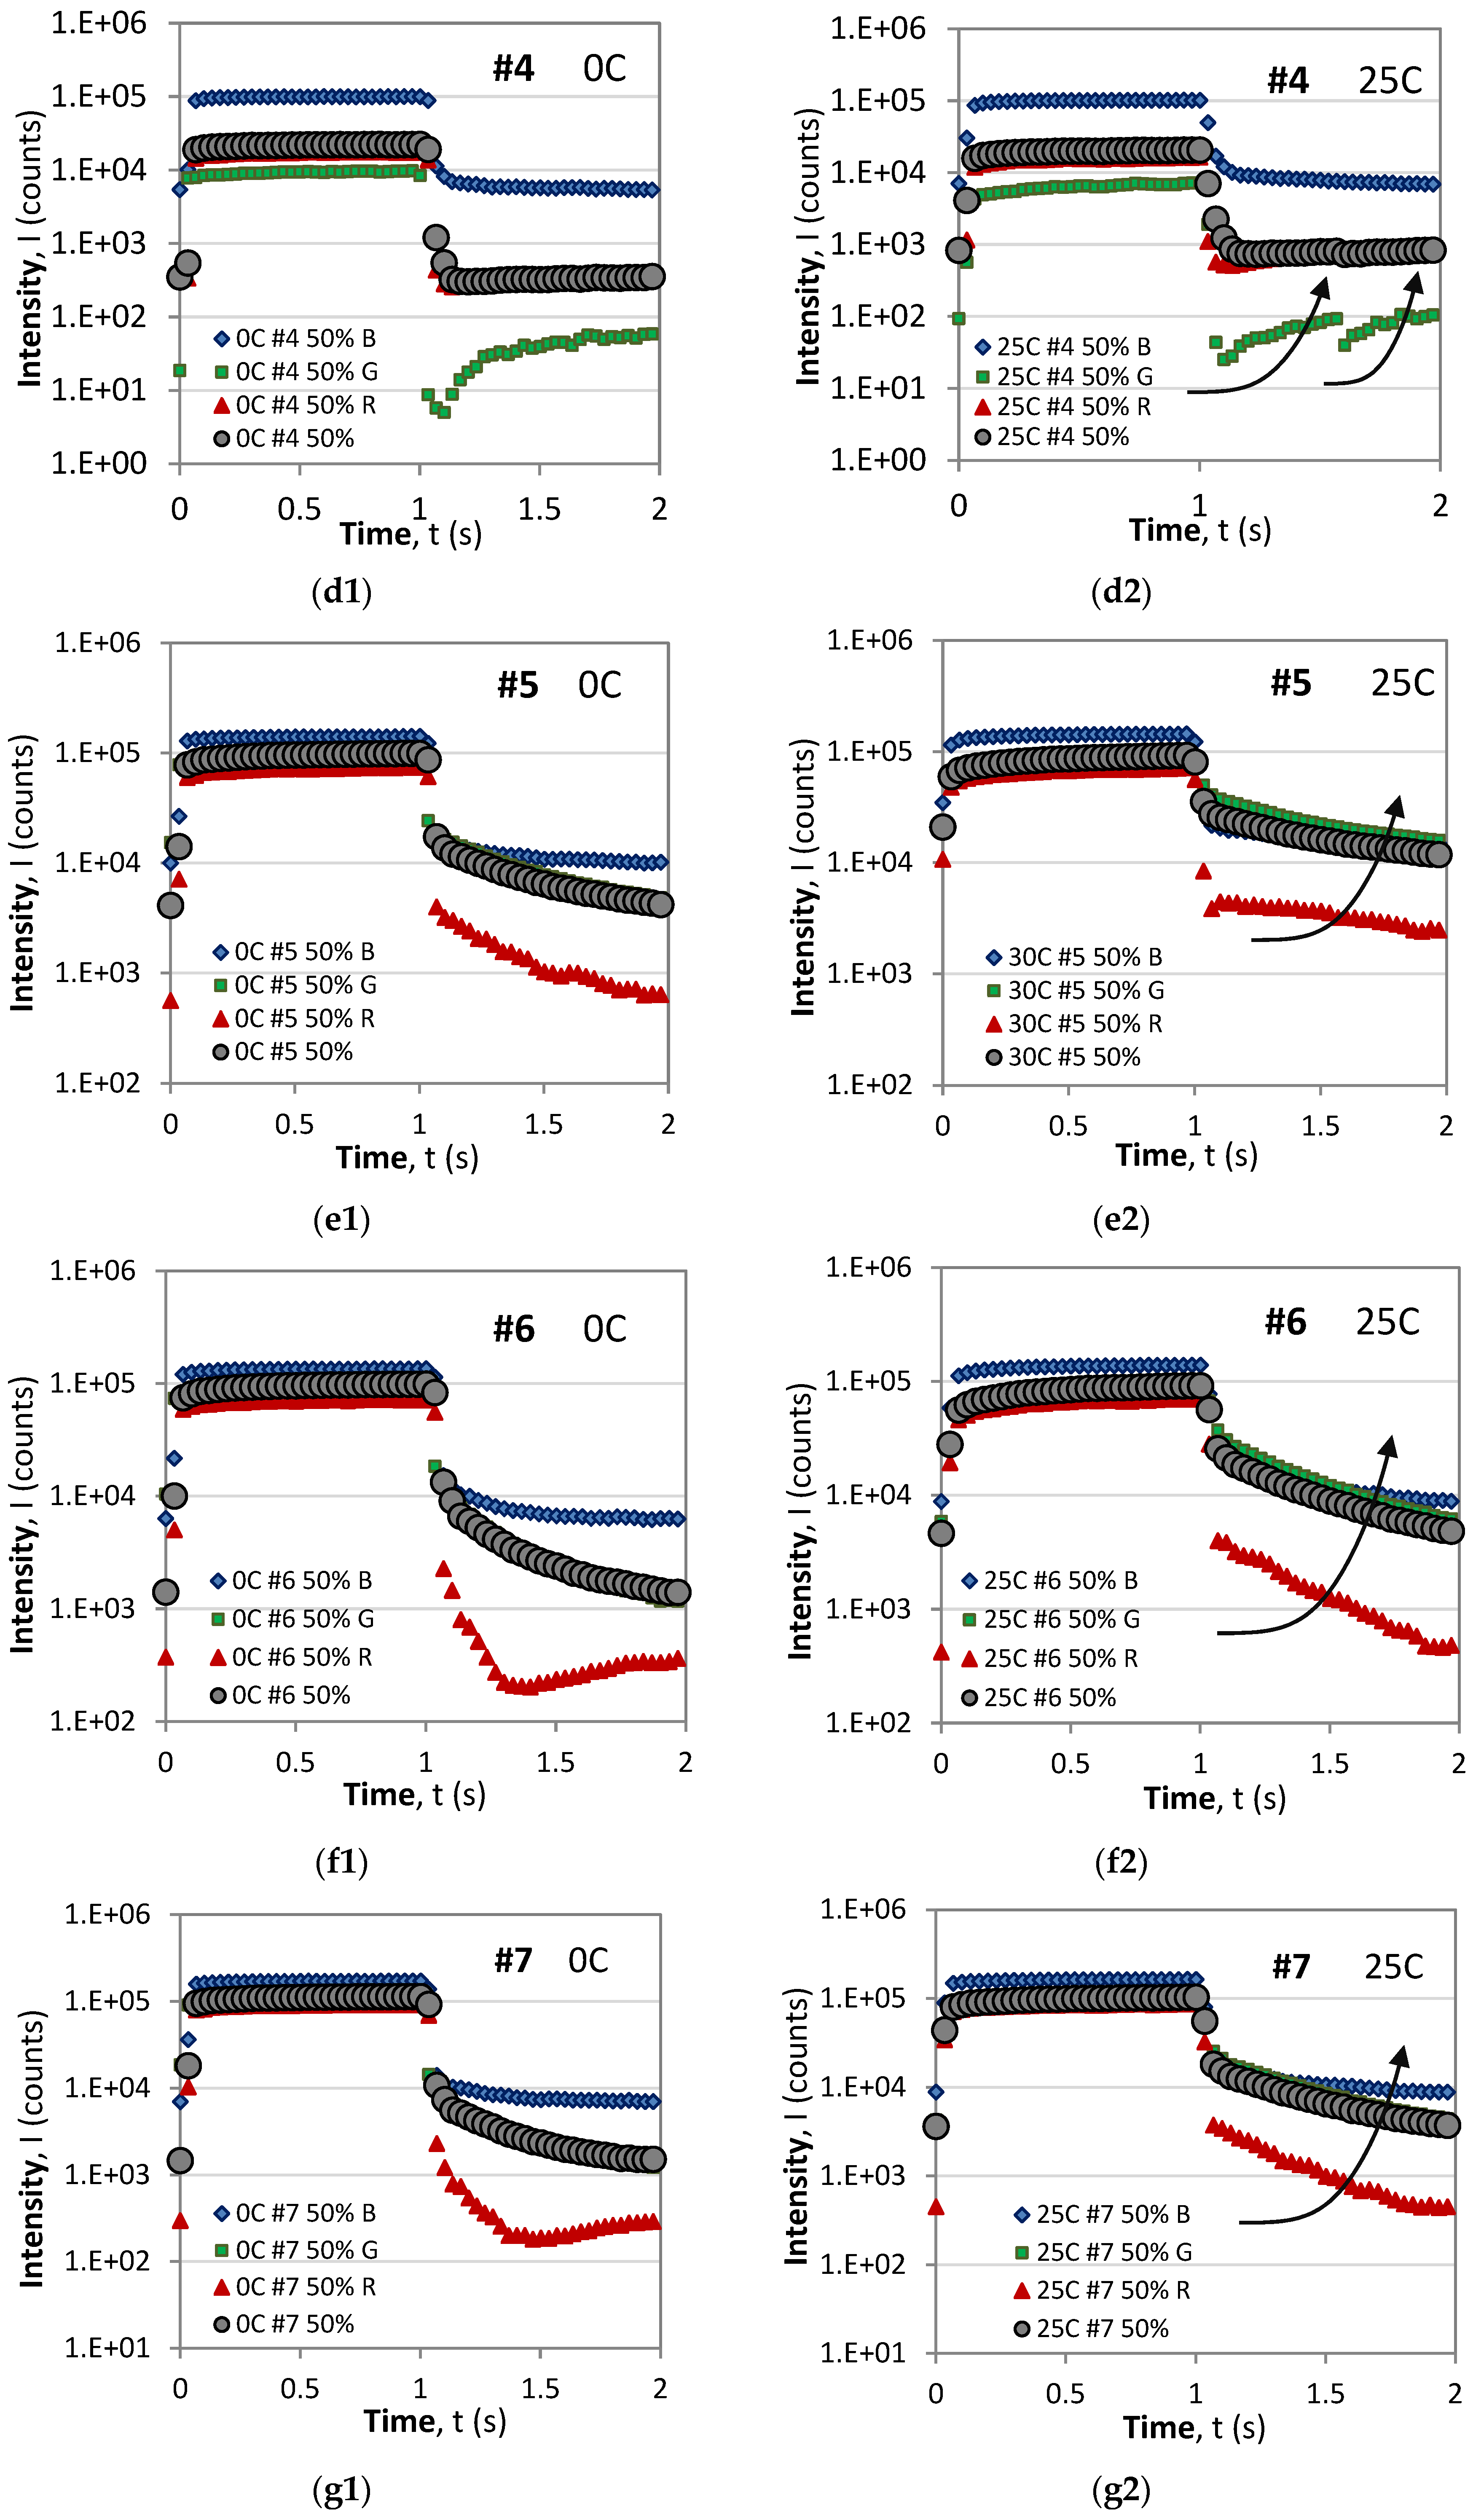
Figure 4 presents a selection of these RGB and integral responses (in grey circles) of each sample at 0C (left column) and at a room temperature of 25C (right column) to outline the tendency caused by temperature increase. A comparison of the time responses leads to the following observations:
(i)
For all samples and all color pixels (R, G, and B), the saturation level during the ON phase decreases with temperature, which is in agreement with Equation (A1) [28].
(ii)
In all of the cases, the dominant component during the ON (excitation) phase are the blue (B) pixels followed by the green (G), and the weakest, except for sample #4, are the red (R) pixels.
(iii)
For all samples, the B component exhibits the standard behavior of monotonic rise and decay responses.
(iv)
During the OFF (decay) phase, with the exception of #5, the R components of the time responses exhibit the anomalous behavior manifested as a fast drop to a minimum value followed by a slow rise in luminescence. Though not observed in these graphs in the case of a larger period, the slow rise in the R component reaches a local maximum and is followed by a slow decay. A similar behavior is observed for the G component at 0C for samples #1, #3, and #4.
(v)
As a result of the behavior of the R and G components, the resultant overall response in grey of samples #1, #3, and #4 also exhibits anomalous behavior at 0C, of which only #4 is anomalous at 25C.
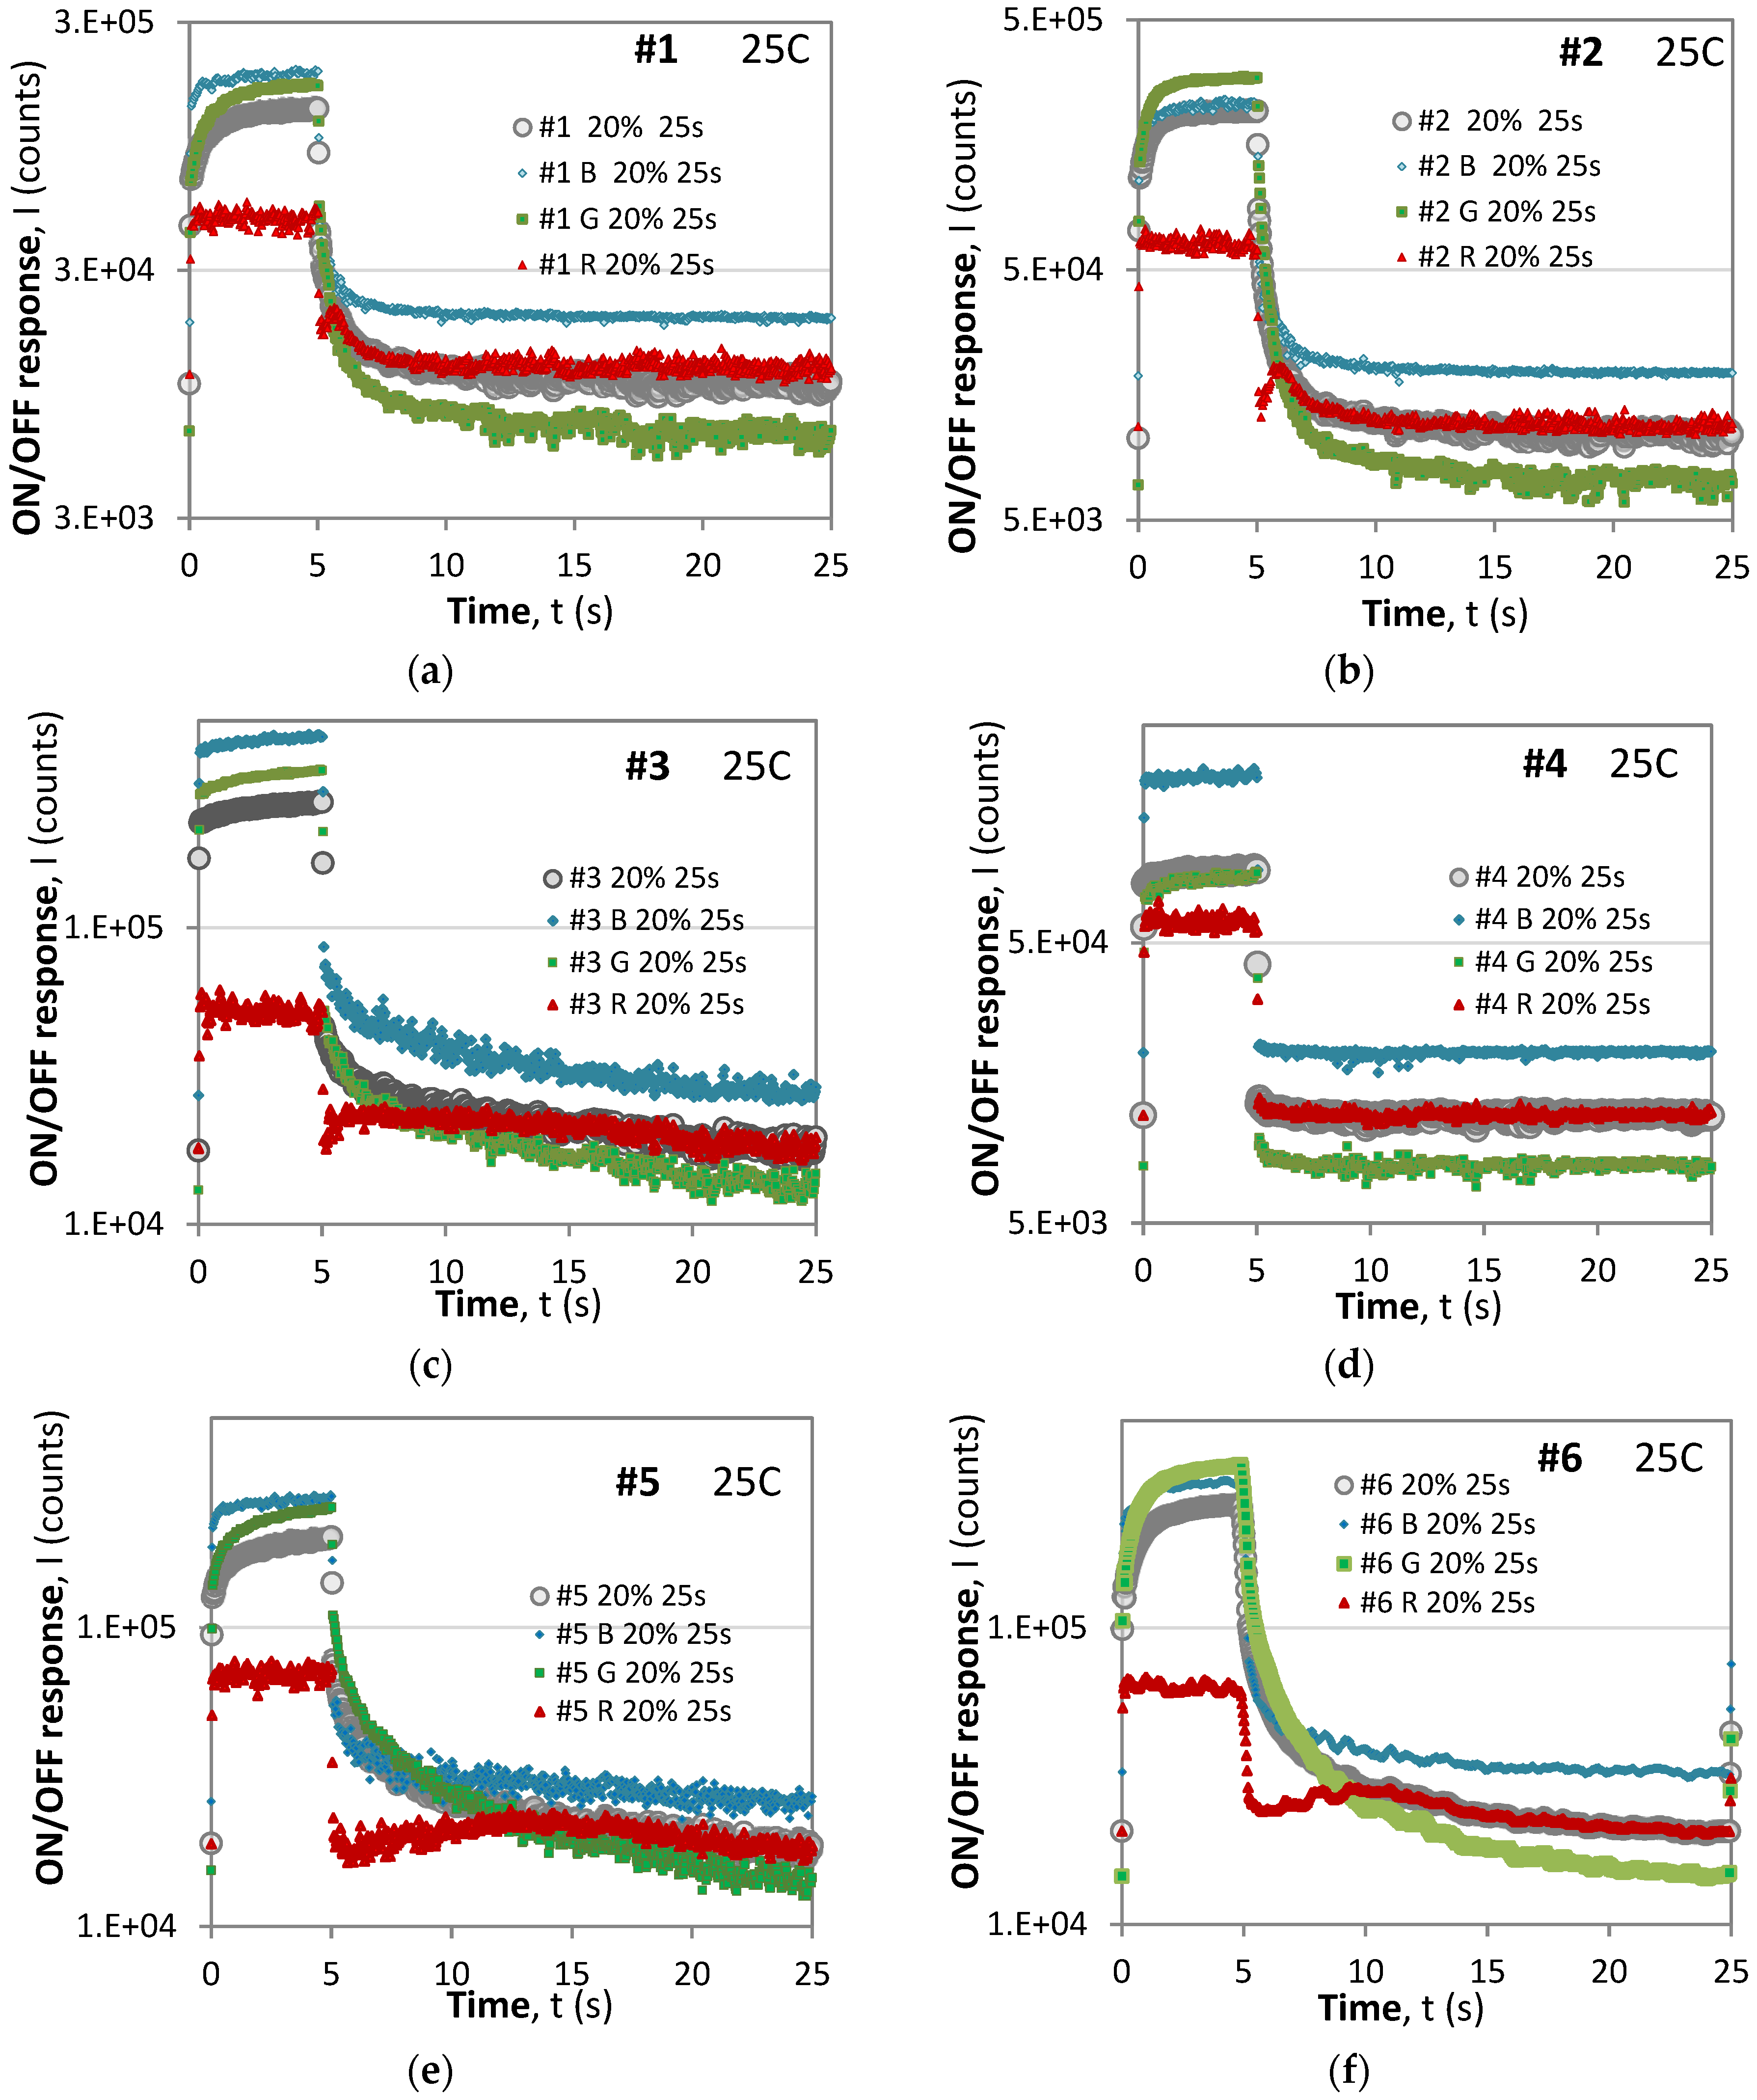
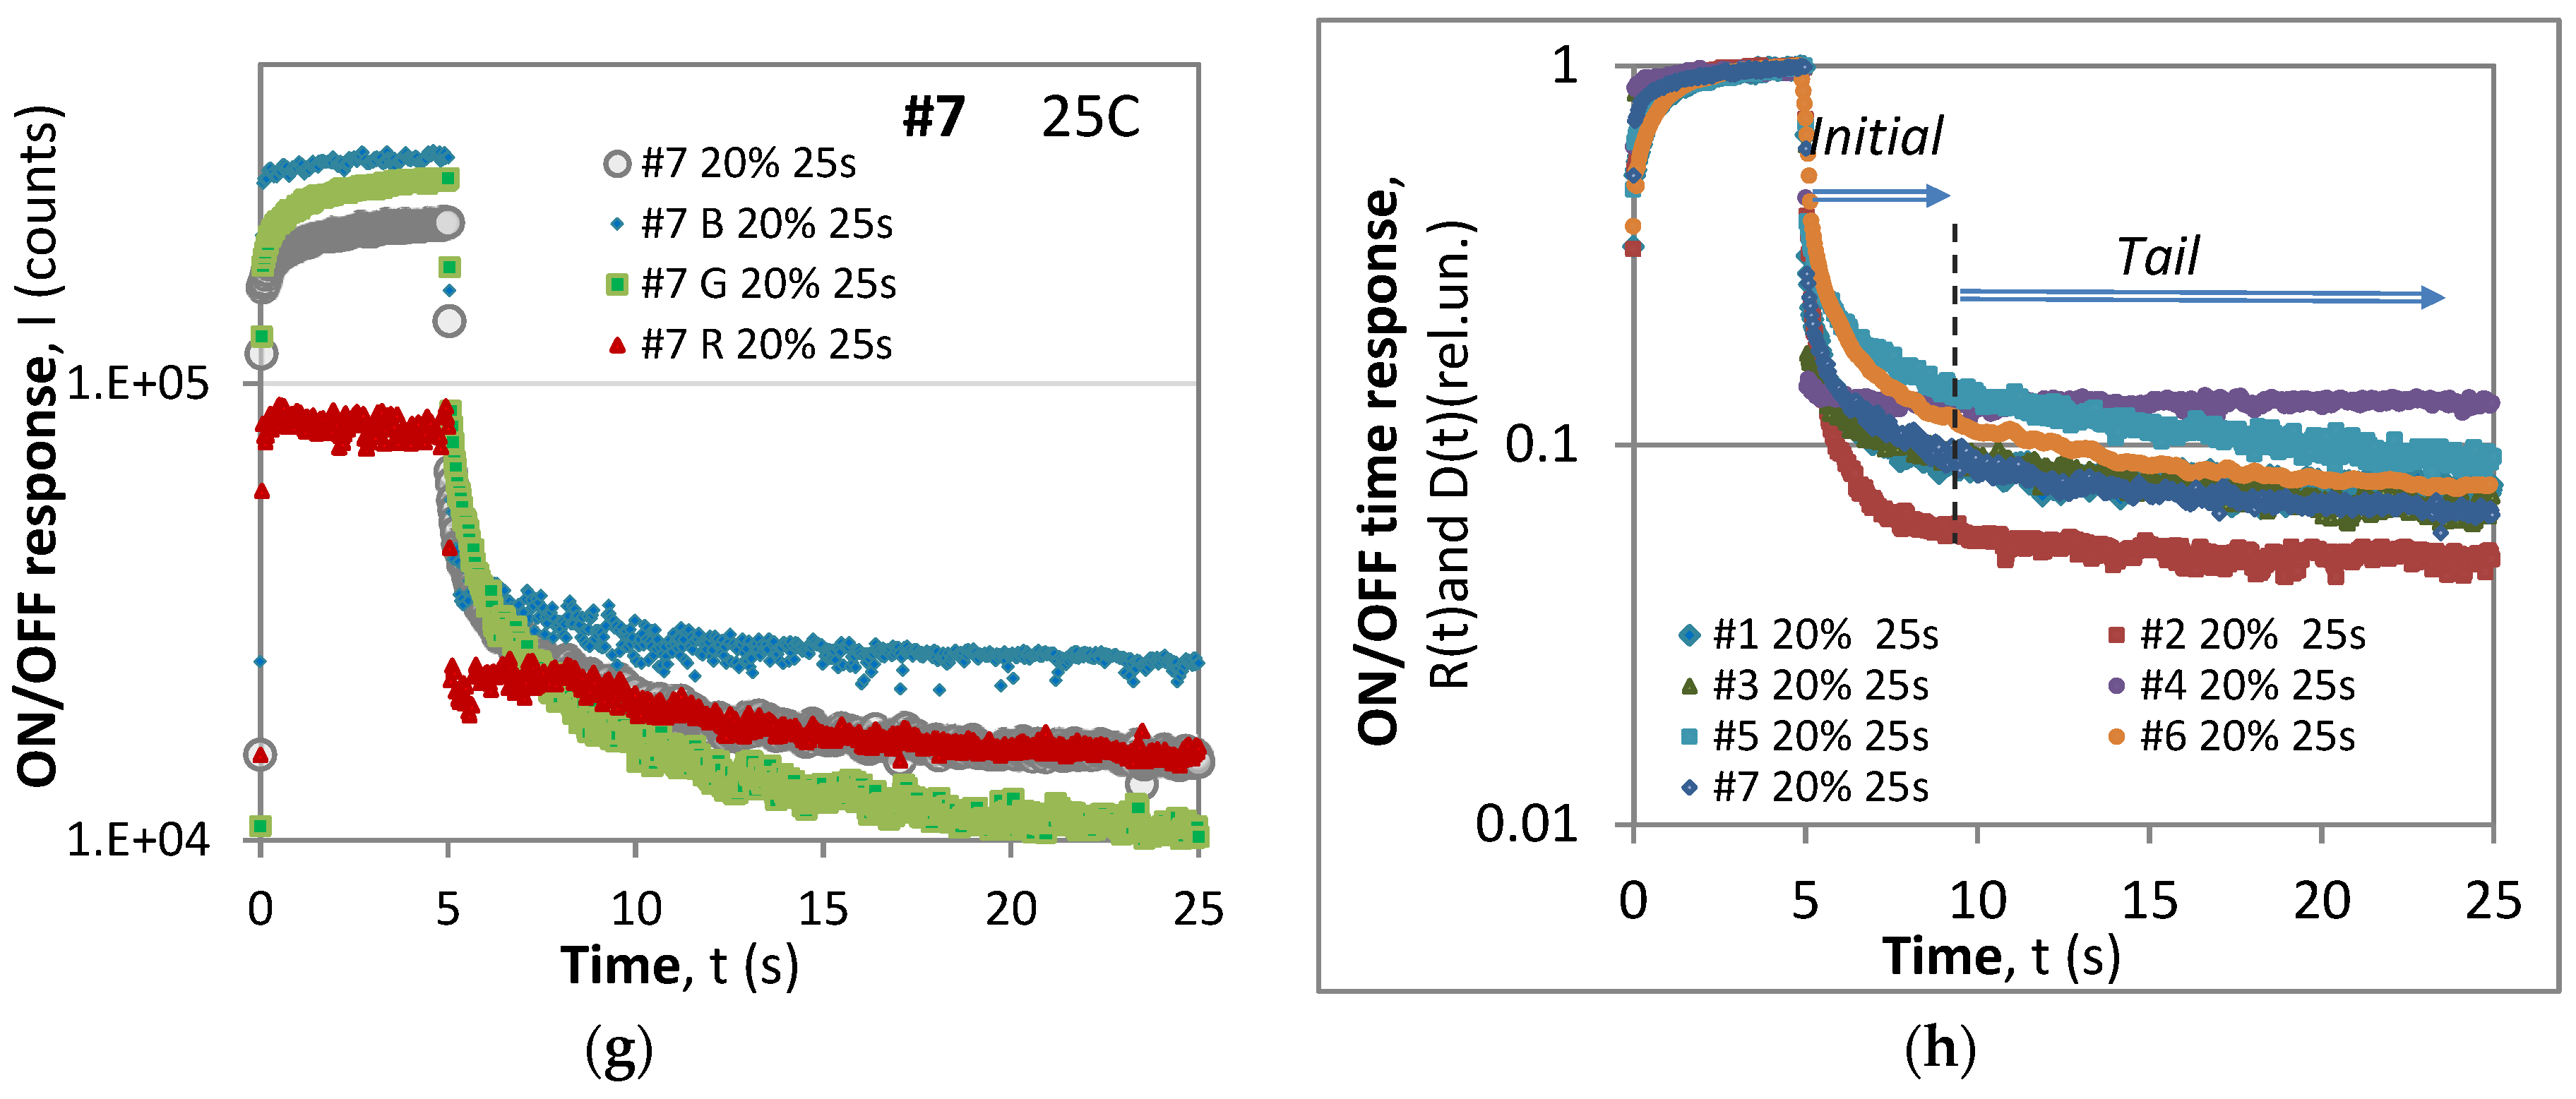
However, when the excitation duration is 5 s (instead of 1 s) and the period is T = 25 s, the behavior at 25 °C is somewhat different from the case of T = 2 s and τ = 1 s of excitation, as evidenced from Figure 5.
A closer comparison of the responses from Figure 5 reveals the following:
(i)
With the exception of #4, all of the samples exhibit anomalous behavior of the R component.
(ii)
Unlike the B and G components, both the rise and the decay responses of the R components exhibit an initial surge in the intensity followed by a slower decay in both the ON and OFF phases.
(iii)
For short time excitation (τ = 1 s) (Figure 4), the dominant component during excitation was the blue (B) component, while for longer excitation (τ = 5 s), the G component gained dominance for samples #2 and #6 and was close for samples #5 and #7. This signifies that the overall color of the phosphorescent sample changes and depends on the excitation conditions.
(iv)
A comparison of the maximum levels during short-period excitations (T = 2 s) from Figure 3 and those from long-period excitations (T = 25 s) from Figure 5 reveals that in the former case, the samples would reach saturation during the ON phase, while the latter saturation would not be reached, though the excitation duration was longer, i.e., 5 s at η = 20% vs. 1 s at η = 50%. This observation suggests that the saturation level depends on the period of modulation as well as on the duty cycle.
(v)
The particular shape of the rise and decay responses depend on the excitation duration.
Making use of the power law and exponential approximations (see Appendix A), we present in Table 2 the best fitting functions for the ON and OFF phases (initial part and the tail). As seen for the specific excitation conditions in most of the cases, the rise response is approximated by an exponential, while the initial OFF phase is approximated by a power law, and the tail of the decay may be better fitted by an exponential.
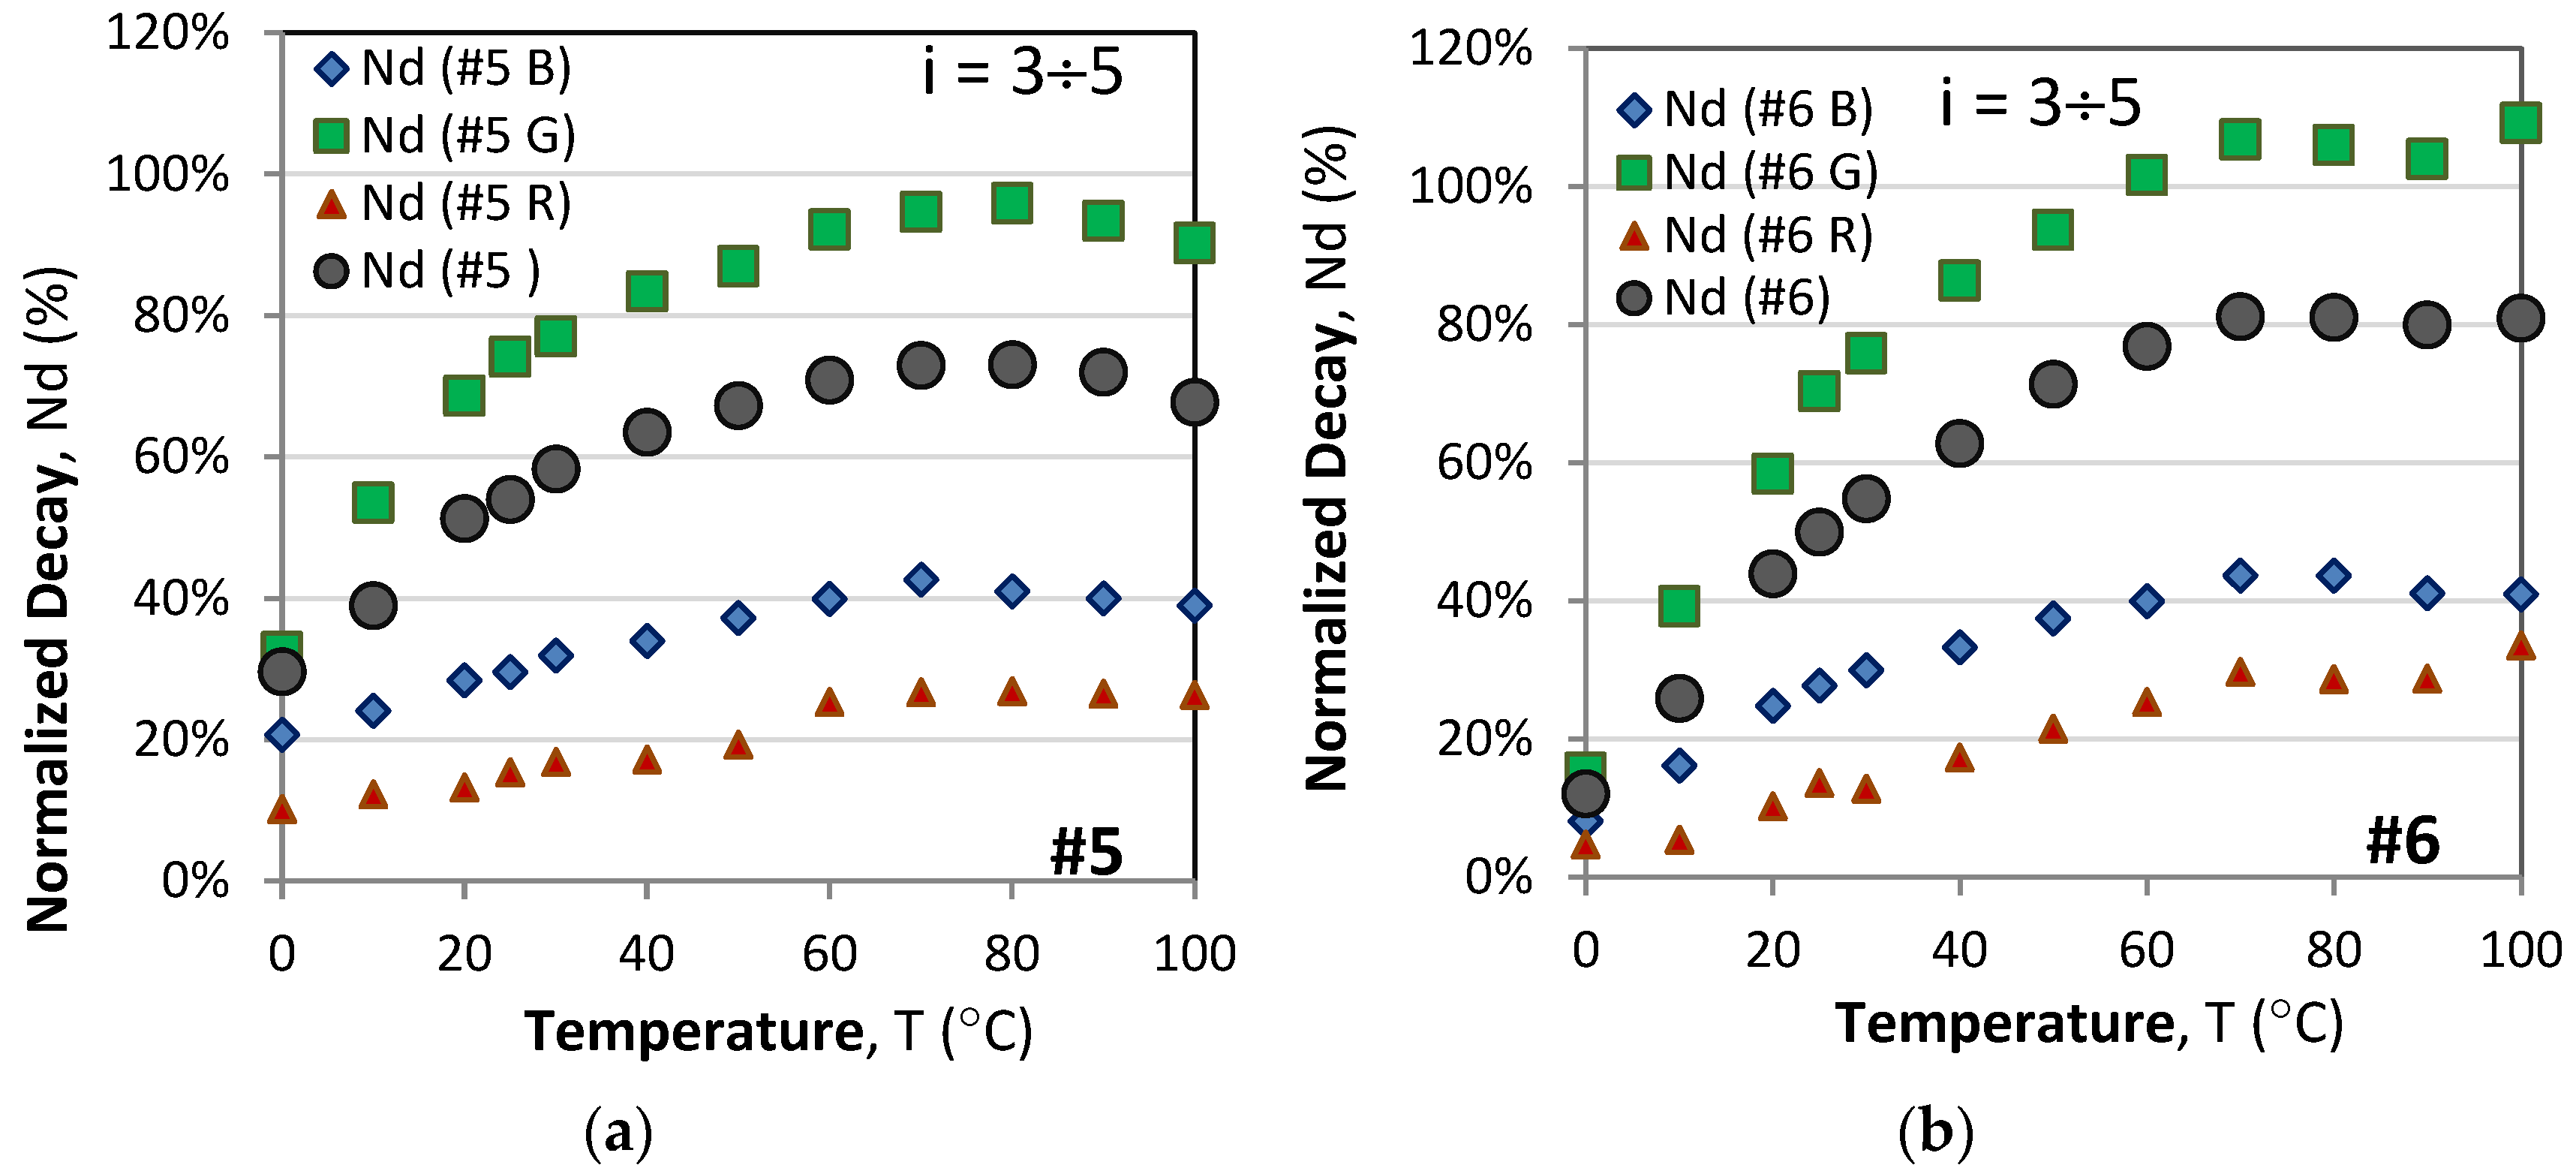
Since the rise and decay responses are RGB color-dependent, so is the normalized decay parameter Nd. In Figure 6 we present the RGB and the overall normalized decays for samples #5 and #6.
The curves clearly show that the strongest sensitivity of the normalized decay to temperature is of the G component and, with reference to Table 1, the main crystal phase of samples #5 and #6 is Sr3Al2O6. As the normalized decay is the proposed parameter for temperature sensing [25], the obtained results indicate that the sensor’s sensitivity can be improved by detecting the response of a color pixel rather than the averaged integral normalized decay. Of all the samples studied, samples #6 and #5 exhibit the highest sensitivities both in the integral signal and in the G component.

3.2.2. RGB Time Responses at Different Duty Cycles

Finally, we consider the role of the excitation duration τ for a given period (T = 2 s), as expressed by the duty cycle η. As an example where the basic tendencies are clearly visible, we show in Figure 7 the RGB and integral time responses at 10 °C for sample #3 from the first group (monoclinic SrAl2O4-rich samples) and for sample #6 from the second group (cubic Sr3Al2O6-rich samples) from Table 1. As is clearly seen, at that relatively low temperature (10C) the responses of the two samples are quite different. The common observations for all of the samples consist of the following.
In the first place, the anomalous behavior is strongest at the lowest duty cycle (20%) and tends to vanish as the duty cycle increases. Second, the blue component rises and decays monotonically. Third, as the duty cycle increases, i.e., the excitation duration τ increases, the decay is slower. And fourth, typically, the increase in the duty cycle produces a similar effect to that of temperature increase in that the relative share of phosphorescence increases and the anomalous response vanishes.
The notable differences between the two samples, which are representative for the two groups from Table 1, are as follows.
First, for #3, both the R and the G components exhibit anomalous time responses to a degree that the integral time responses in Figure 7a1,a2 in grey also exhibit anomalous behavior for all duty cycles. At 25 °C, the anomalous behavior for the green component vanishes, as evident from Figure 4c2. In contrast, for #6, the anomalous response is only observed for the R component and weakens with the duty cycle. At 25 °C and 50% (Figure 4f2), it behaves similarly to that at 10C and 80% (Figure 7c2).
Second, the anomalous effect is much stronger for the G component (drops rapidly by more than three orders at 20%) than for the R component (drops rapidly by about two orders at 20%) for sample #3, whereas for sample #6 the anomalous effect is observed only for the red components, which drop more slowly by more than two orders at 20%.
These marked differences correlate with the different crystal structures (monoclinic vs. cubic) outlined above.
Third, sample #6 exhibits no anomalous behavior of the integral response (in grey).

3.3. Analysis of the Obtained Results

3.3.1. The Standard and the Anomalous Time Responses

The results presented clearly outline two types of rise/decay time responses to which we refer as standard and anomalous, which we next consider in detail.
  • Standard luminescence response
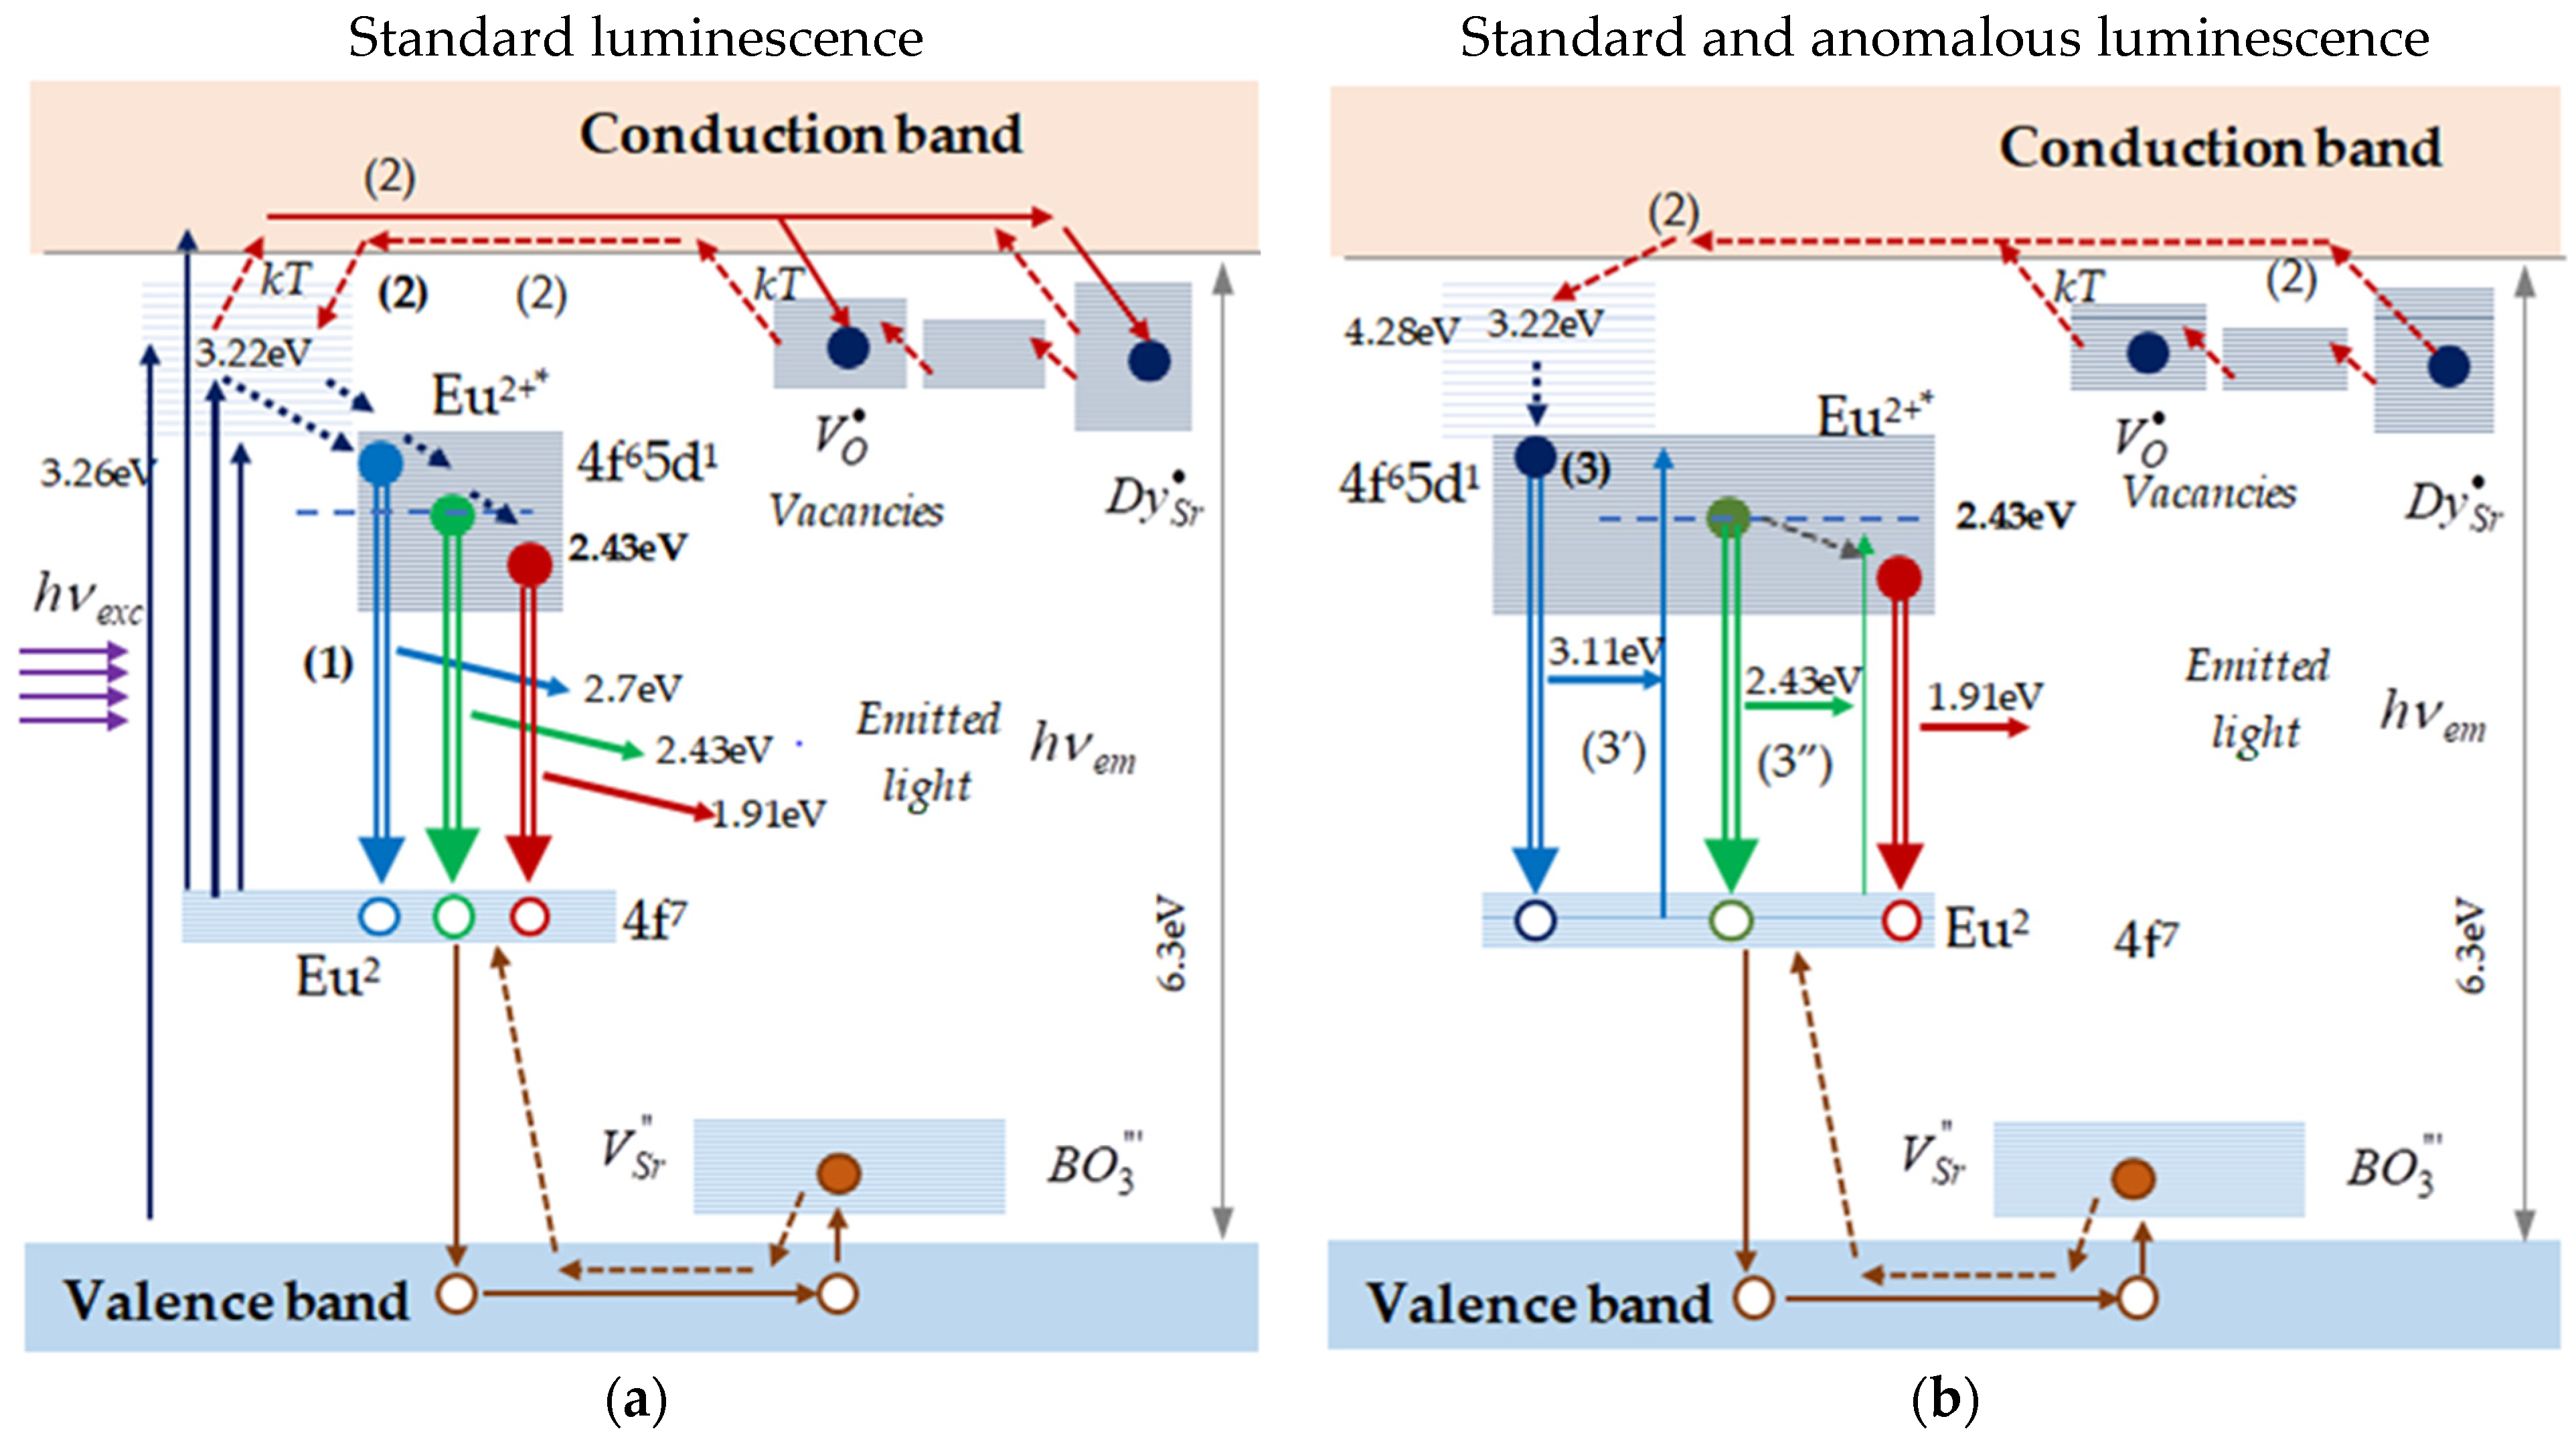
The standard luminescence time response, which is manifested as a monotonic rise during external excitation (ON phase) and a monotonic decay when external excitation is switched off (OFF phase), can be approximated with different functions such as power laws, exponential laws, and others. With reference to Figure 8a, the luminescence mechanism is as follows.
The incident photons are absorbed and the Eu2+ ions become excited Eu2+*. Next, two processes are possible and take place with a different relative share. Within less than a millisecond, the excited ion returns to the ground state, and the emission is fluorescence over the spectral range from blue to red, which is process (1) (Figure 6a). With a certain probability, the excited Eu2+* (* stands for excited) ion absorbs some thermal energy kT, and through the conduction band the electron gets trapped by vacancies, defects, or dopants like Dy, where it resides for some time before it is released by the thermal energy kT. With some probability, it is re-trapped by an Eu ion and, much like in process (1), becomes de-excited, emitting within the same spectral range as the fluorescence from process (1) but with a delay of milliseconds to hours, which is phosphorescence and is referred to as process (2). For both processes, it is assumed that the emitted photons of all wavelengths are part of the same kinetics, and the emissions at different wavelength are independent and practically simultaneous. As a result of this, the R, G, B, and the overall rise and decay time responses are monotonic, and their particular forms depend on the energy and spatial trap distributions, grain size, excitation intensity, and duration. If temperature rises, so does the thermal energy kT, which increases the probability that an excited Eu2+* ion releases an electron into the conductivity band and, thus, the relative share of phosphorescence. Beyond some critical temperature (60 °C–70 °C in our case), the thermal energy is too large for a de-trapped electron to get trapped by a Eu2+* ion, and its energy is lost as heat. The relative share of the phosphorescence decreases with temperature and so does the normalized decay Nd.
During the ON phase, both process (1) and (2) take place. Upon switching off the external excitation (OFF phase), a rapid initial drop of the luminescence corresponding to the fluorescence share reaches a level that corresponds to the phosphorescence share that is roughly proportional to the normalized decay. Then, a slower monotonic decay is observed, referred to as phosphorescence.
B.
Anomalous time responses
Looking at the time dependence of the R and G components from Figure 4 and Figure 5, we identify the rapid drop of the luminescence due to the fluorescence, just as in the case of the standard process described above. In the absence of external excitation, the luminescence intensity rises slowly, which means that there is an internal source of excitation of the energy levels whose de-excitation leads to emissions at higher wavelengths. Since in all cases the rise and decay responses in the blue (B component) are monotonic, the higher energy of the blue photons of the phosphorescent afterglow pump the lower energy levels whose de-excitation leads to emissions in the red (R) and in the green (G). Equally, the decay responses in the green (G component) can also pump the energy levels for the response in the red (R). Thus, during the OFF phase, the red emission (R) can be pumped by the blue (B) and by the green (G) internal emissions, while the green (G) only by the blue emission. This process is illustrated in Figure 8b. Since the pumping in the blue (B) is from delayed phosphorescence afterglow, the rise in R and G luminescence in the OFF phase is also delayed, and its temperature dependence follows that of the pumping B component, i.e., rises up. As the phosphorescence decays to zero, the pumping of the R and G levels vanishes and, ultimately, after reaching a local maximum, these anomalous responses decay to zero as well, which is what we observe for the R component time response from Figure 5 (T = 25 s, η = 20%) and the G component from Figure 4c1,d1,d2.
In Figure 5, for the longer 5 s excitation, only the R component exhibits anomalous behavior caused by the internal pumping from the B and G components. Therefore, the rise and decay rate of the R component (during the OFF phase) should be determined by the decay rates of the B and G components, which in the general case are different. Thus, for samples #5 and #6, the R component rises slowly in the OFF phase, which correlates with the slower decay of the G component, which dominantly pumps it. For samples #1, #2, and #3, the R component rises much faster followed by a slow decay, which correlates with the fast decay of both the B and G components.

3.3.2. Description of the Anomalous Time Responses

To formally describe the anomalous time responses, we proceeded in the same manner as for the normalized rise response during the ON phase, i.e., by functions of the type
D R ( t ) = D R , 0 ( t ) + D 1 R R ( t ) D B , G ( t )
where DR(t) is the resultant intensity decay response of the R components, DR,0(t) is the fast decaying function of the initial drop due to the fluorescence, D is some saturation constant, RR(t) is a monotonically increasing to saturation function after the initial drop, while DB,G(t) is the function describing the decay of the R or G components, pumping the R component.
If defined by normalized functions, each of the time sections of the rise and the decay responses can be fitted using the power law or exponential functions listed in Table A1 from Appendix A, which we present for #1 and #4 in Table 3. The rise response may be described by a single function as for sample #4 or with two functions—R1(t) for the initial part and R2(t) for the saturation part. The decay response is described by a fast-decaying function D1(t) and one or two slowly varying functions D2(t) and D3(t).
While the fitting using exponential and power law functions for R2 ≥ 0.99 is good enough for practical applications, the above qualitative description of the observed anomalous time responses based on the presented and future experimental observations can be used as a solid basis for a more complete description and modeling of the luminescence phenomena that take into account not only spatial, energy trap, and vacancies distributions but the internal transitions and excitations causing the anomalous behavior described here.

4. Discussion

Our detailed study of the temperature and emission wavelength dependence of the rise and decay responses of strontium aluminates synthesized using different precursors has revealed a number of important points.
To correctly describe the integral time responses of phosphorescent materials, it is not sufficient to measure the integral emission over the whole emission spectrum but the different spectral components using a smartphone covering the blue, green, and red parts of the emission. The three different B, G, and R components of the emission spectrum exhibit individual rise/decay time responses.
The time-dependent luminescence responses are closely related to the depth and distribution of electron traps within the crystal structure. In this publication, we have built upon the results of our previous publication [6], which dealt with the specific characteristics of the precursor choice—tailored materials. The key takeaway is that precursors influence the resulting crystal phase composition (monoclinic SrAl2O4, cubic Sr3Al2O6, hexagonal Sr4Al14O25) and, therefore, the trapping center landscape. Monoclinic SrAl2O4-rich samples (precipitated with LiOH, KOH, NaOH) have more well-defined electron trap depths, resulting in distinctly different luminescence decay characteristics compared to cubic Sr3Al2O6-rich samples (precipitated with carbonates and HMTA), which exhibit broader trap depth distributions and subsequently more complex luminescence kinetics. In Table 2, samples #1–#4 clearly exhibit distinct two-stage decay dynamics of the integral luminescence, described separately by initial (power-law) and tail (exponential) approximations. This behavior suggests the presence of at least two distinct trap populations or relaxation pathways with significantly different de-trapping kinetics. The initial power-law decay represents rapid de-trapping from shallow electron traps located near the conduction band, whereas the exponential tail indicates slower, thermally assisted de-trapping from deeper traps. Samples #2–#4 contain a significant fraction of monoclinic SrAl2O4, which is known to have well-defined, discrete trap depths, thus clearly separating initial fast decay from a slower tail. However, questions remain about sample #1, which is almost pure Sr3Al2O6, that still exhibits a well-defined trap structure.
In contrast, samples #5–#7, consisting of a large fraction of cubic Sr3Al2O6 phases, exhibit a simpler decay described adequately by a single power-law function. This suggests a broader and more continuous trap depth distribution in cubic phases, eliminating clear distinctions between fast and slow de-trapping processes.
As hypothesized in Section 3.3.1 B above, the anomalous luminescent response (initial drop followed by delayed secondary rise, evident in red emission channels) likely arises from internal energy transfer processes. Primary emitted photons (higher-energy blue emissions) may be partially reabsorbed internally, transferring energy to intermediate trap states or defect-related levels. These intermediates subsequently relax, emitting photons at longer wavelengths (green and red emissions). The anomalous luminescent behavior is observed predominantly in sample #4, and we believe that it may arise from its unique phase composition—primarily monoclinic SrAl2O4 with a significant admixture of both cubic Sr3Al2O6 and hexagonal Sr4Al14O25—which could introduce complex interfacial defect states or energy transfer pathways not present in the more phase-pure samples.
While the fundamental electronic energy diagrams of Eu2+-activated strontium aluminates remain similar across the different phases, subtle variations in local crystal symmetry and defect environment introduce distinct energy transfer pathways and trap distributions. Cubic phases generally exhibit broader distributions of predominantly shallow traps, contributing to complex kinetics sensitive to small thermal variations. Monoclinic phases possess narrower and often deeper traps, giving rise to clearly resolved decay components.
In view of the above, the most important result of the study of the RGB color time responses using smartphone interrogation is the observation and qualitative description of the anomalous time response of the samples, which is more strongly pronounced at lower temperatures and shorter excitation durations, as evidenced from Figure 4 and Figure 7 (left columns). The proposed explanation is the process of internal excitation of the lower energy levels of the Eu2+* band by blue (B) or green (G) components of the phosphorescence, which re-emit in the green or in the red.
Thus, the results obtained and interpreted indicate that to correctly describe the time responses of the phosphorescent materials, it is not sufficient to take into consideration the energy and spatial distributions of the traps but the internal energy conversions that lead to the observed different RGB time responses and the anomalous responses.
There are several consequences from these experimental observations:
For the purposes of anti-counterfeiting applications, the specific RGB time responses can be used for multilevel encoding and, as shown here and in Ref. [6], can be tailored individually using different precursors.
The temperature sensitivities of the RGB spectral components are essentially different, which can be used to increase the sensitivity above that obtained from the integral signal. More particularly, using a smartphone with individual RGB pixel interrogation, one of the spectral components can be chosen to maximize the sensitivity.
A more detailed set of differential rate equations can be formulated to describe the excitation and de-excitation of the levels of the Eu2+* energy band leading to the individual time responses, which modify the integral response.
A number of issues deserve more detailed future experimental study and analysis, namely the dependence of the excitation period T and duration τ (or the duty cycle η) on the excitation intensity and on the excitation wavelength, which we shall present in future studies. As already noted, the anomalous time response is observed and is more pronounced for shorter excitation durations and for temperatures under 40C, which are specific for some applications, and thus require deeper study.
Lastly, some of the reasons that the anomalous time responses have not been the focus of attention are that, in most of the cases, relatively broadband sources with irregular spectral distributions have been used with the intention of exciting all possible states, which creates an averaging effect. Also, the excitation duration may be sufficiently long for the same purpose. And, most importantly, typically the integral luminescence signal is detected, which is the averaging over the whole spectrum. This leads to an averaging effect that conceals the anomalous behavior of some spectral components.
However, for practical applications, such as temperature and thermal gradient sensing [25,29,30] and anti-counterfeiting tags, the sources used are not irregular broadband but rather narrow-band LEDs or lasers emitting at particular wavelengths, exciting particular energy bands selectively and more efficiently. The excitation duration may not be sufficiently long to achieve saturation of all traps and defects but is usually pulsed with short durations, which dramatically change the kinetics of the internal excitations and the shape of the time responses of the different spectral components of the luminescence.

5. Conclusions

The experiments performed, the presented results, and our analysis allow us to formulate the following conclusions.
First, the use of smartphones allows the simultaneous individual analysis of the rise and decay time responses of the different spectral regions—red (R), green (G), and (B) blue—as well as the weighted sum Y representing the integral signal, which exhibit dramatically different types of responses.
Second, anomalous time responses of the green and red spectral components of the overall luminescence spectrum were observed and analyzed. The effect consists of a rapid drop in luminescence followed by its slow increase in the absence of external excitation until a local maximum is reached and there is a final decay to zero. The anomalous effect is stronger at low temperatures and shorter excitation durations (lower duty cycles) and tends to disappear at least partially with the increase in the excitation duration and the temperature of the samples.
Third, the observed differences of the anomalous effects of the R and G components correlate with the crystal structure of the samples and the precursors used to synthesize them.
Fourth, the proposed explanation for the observed anomalous response is the internal excitation by the delayed blue component emission of lower energy levels, leading to emissions in the green and red parts of the spectrum, which occur in the absence of external excitation.
Fifth, by carefully choosing the particular precursors, it is possible to individually tailor not only the integral luminescence response but those of the specific spectral responses (G and R components).
Sixth, the results obtained are of particular importance for increasing the number of levels for anti-counterfeiting tags and labels and phosphorescence-based temperature sensors.
Seventh, a more detailed study of the dependence of the time responses on the excitation duration, emissions, and excitation wavelengths will permit the development of a more detailed theoretical description of the luminescence phenomena based on systems of rate equations to correctly take into account internal energy transitions and anomalous behaviors of spectral components of higher wavelengths.

Author Contributions

Conceptualization, T.E. and V.V.; methodology, T.E. and V.V.; software, K.N.; validation, S.F. and K.K.; formal analysis, T.E. and K.N.; investigation, K.K.; resources, V.V.; data curation, S.F.; writing—original draft preparation, T.E. and V.V.; writing—review and editing, K.N., K.K. and S.F.; visualization, T.E.; supervision, T.E. and V.V.; project administration, V.V. and T.E.; funding acquisition, V.V. and T.E. All authors have read and agreed to the published version of the manuscript.

Funding

Financial support provided by Fundamental and applied Research project Nr.LZP-2023/1–0521 and realized at the Institute of Solid-State Physics, University of Latvia, is greatly acknowledged. V.V. thanks the support from MikroTik patron, a donation (No. 40012) administrated by the University of Latvia Foundation. The Institute of Solid-State Physics, University of Latvia, as the Center of Excellence, has received funding from the European Union’s Horizon 2020 Framework Program H2020-WIDESPREAD-01–2016–2017-TeamingPhase2 under grant agreement No. 739508, project CAMART2. The financial support from the Natural Sciences and Engineering Research Council (NSERC) of Canada under the Discovery DDG-2025-00037 grant is acknowledged.

Data Availability Statement

Data available upon request.

Conflicts of Interest

The authors declare no conflicts of interest.

Appendix A. Power Law and Exponential Approximations for the Time Responses

The Power Law Approximations
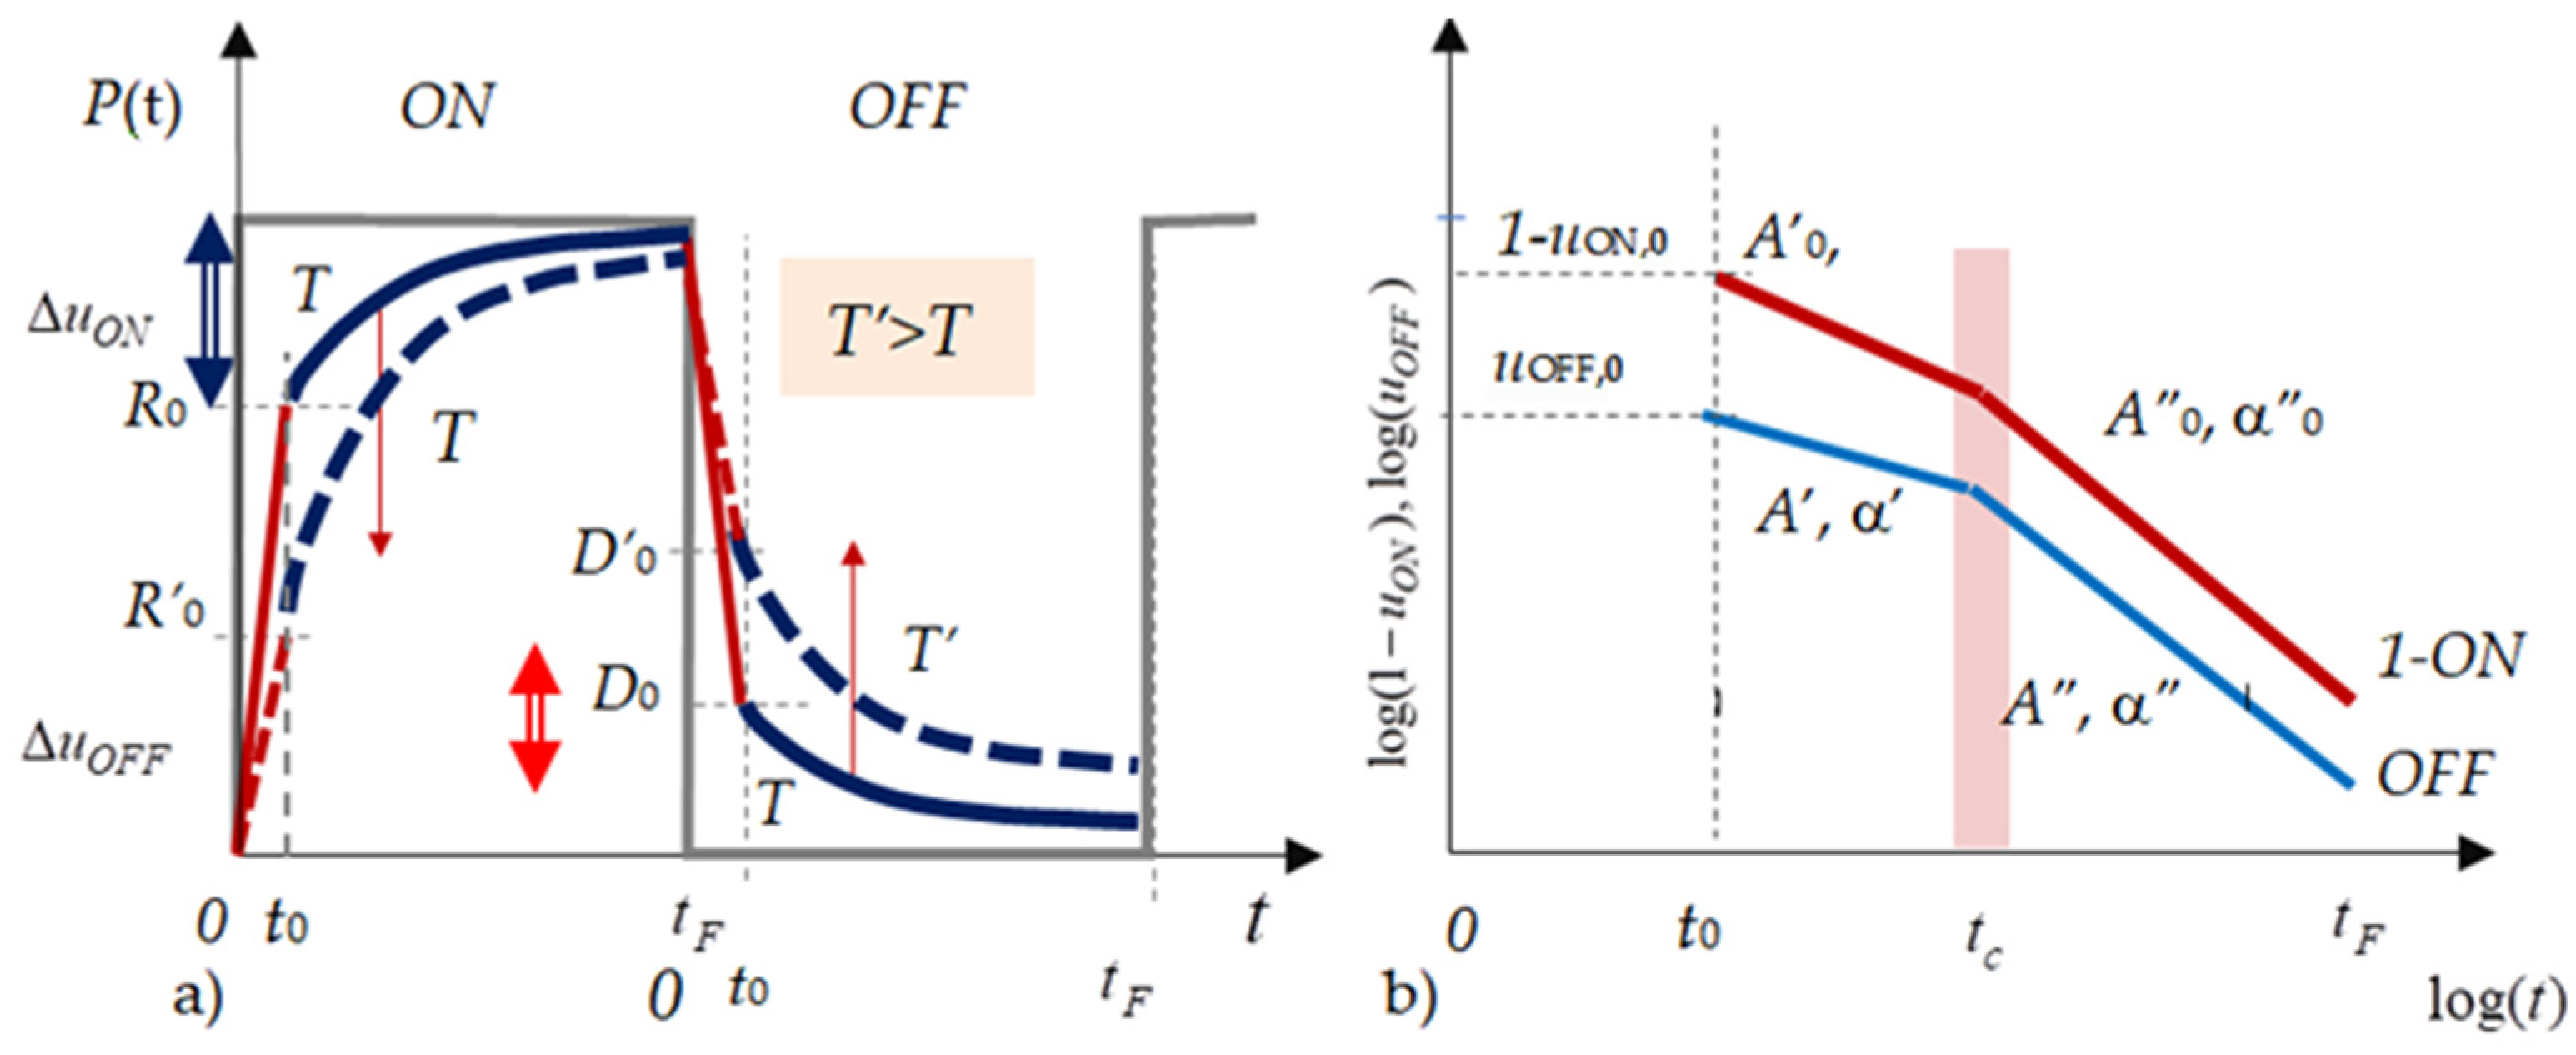
In the general case, the time responses of phosphorescent materials depend on the temperature, the excitation intensity of the sample [20,21,24], the duration of the excitation, its period, the excitation wavelength, and on the emission wavelength [7,8].
Figure A1. Normalized ON/OFF time responses: (a) R(t) and D(t) responses and their temperature dependence; (b) the double log plot of typical normalized 1-uON and uOFF vs. time responses.
Crystals 15 00744 g0a1
Figure A1 illustrates how the ON/OFF rise/decay time responses of phosphorescent strontium aluminates change with increasing temperature (T’ > T). The dependence of the luminescence intensity on the temperature I(T) and that of the ON/OFF rise/decay time responses on temperature and the duty cycle R(t,η,T) and D(t,η,T) are given below [25,28] as
I ( T ) = I ( 0 ) 1 + A exp Δ E k T A = Γ 0 Γ ν
Table 1 below summarizes the absolute and normalized power (column (A)) and exponential (column (B)) law approximations.
Table A1. Power law and exponential approximation formulae.
Time
Response
Type of
Approximation
Power Law
(A)
Exponential Law
(B)
Rise time
response
(ON phase)
Absolute R ( t , η , T ) = R ( η , T ) 1 A 0 ( η , T ) t α 0 ( η , T ) (A2a) R ( t , η , T ) = R ( η , T ) 1 B 0 ( η , T ) e β 0 ( η , T ) t (A2b)
Normalized u O N ( t , η , T ) = 1 A 0 ( η , T ) t α 0 ( η , T )
log 1 u O N ( t ) = log A 0 α 0 log t
(A3a) u O N ( t , η , T ) = 1 B 0 ( η , T ) e α 0 ( η , T ) t
log 1 u O N ( t ) = log B 0 β 0 . t
(A3b)
u O N ( t , η , T ) = R ( t , η , T ) R ( η , T ) (A3c)
Decay time
response
(OFF phase)
Absolute
(A4)
D ( t , η , T ) = R ( η , T ) A ( η , T ) t α ( η , T ) (A4a) D ( t , η , T ) = R ( η , T ) A ( η , T ) e β ( η , T ) t (A4b)
Normalized
(A5)
u O F F ( t , η , T ) = A ( η , T ) t α ( η , T )
log u O F F ( t ) = log A α log t
(A5a) u O F F ( t , η , T ) = B ( η , T ) e β ( η , T ) t
log u O F F ( t ) = log B β . t
(A5b)
u O F F ( t , η , T ) = D ( t , η , T ) R ( η , T ) (A5c)
For the power law approximations, the physical meanings of the parameters are as follows.
For the ON phase, the higher the A0, the higher the relative share of phosphorescence at the initial moment of measurement t0. A larger power parameter α0 means that the phosphorescence share will increase faster (Figure A1a), and there is a rise to saturation level R∞ = R(t > > t0) = R(t → ∞). In Figure A1b, a larger A0 and a lower α0 is described by the upper red 1-ON line representing A0 and α0. Lower A0 and higher α0 values are represented as the red 1-ON line with parameters A0 and α0.
For the OFF phase, the higher A is, the higher the initial level of phosphorescence from which it decays to zero, and the higher α is, the faster the decay. In Figure A1b, in blue lines, a higher A′ and a lower α′ are described by the upper line meaning a higher level of phosphorescence with a slower decay, while a lower A″ and a higher α″ are presented by a line that describes a lower phosphorescence that decays faster. The normalized differential signal and the normalized decay parameters are defined using (A2) as
Ν = k m R i k m D i k m R i + k m D i 100 % Ν d = 1 N 100 % = 2 k m D i k m R i + k m D i 100 %
For a detailed explanation of the physical meaning of the fitting parameters, see [6,7,8].

References

  1. Mushtaq, U.; Ayoub, I.; Kumar, V.; Sharma, V.; Swart, H.C.; Chamanehpour, E.; Rubahn, H.-G.; Mishra, Y.K. Persistent luminescent nanophosphors for applications in cancer theranostics, biomedical, imaging and security. Mater. Today Bio 2023, 23, 100860. [Google Scholar] [CrossRef]
  2. Zhang, J.; Wang, Z.; Huo, X.; Meng, X.; Wang, Y.; Suo, H.; Li, P. Anti-Counterfeiting Application of Persistent Luminescence Materials and Its Research Progress. Laser Photon. Rev. 2024, 18, 2300751. [Google Scholar] [CrossRef]
  3. Brito, H.F.; Hölsä, J.; Laamanen, T.; Lastusaari, M.; Malkamäki, M.; Rodrigues, L.C.V. Persistent luminescence mechanisms: Human imagination at work. Opt. Mater. Express 2012, 2, 371. [Google Scholar] [CrossRef]
  4. Vitola, V.; Millers, D.; Bite, I.; Smits, K.; Spustaka, A. Recent progress in understanding the persistent luminescence in SrAl2O4:Eu,Dy. Mater. Sci. Technol. 2019, 35, 1661–1677. [Google Scholar] [CrossRef]
  5. Einbergs, E.; Zolotarjovs, A.; Bite, I.; Vītola, V.; Spustaka, A.; Tunēns, G.; Arnautov, A. A mechanoluminescence based approach to spatial mechanical stress visualisation of additively manufactured (3D printed) parts. Materialia 2022, 24, 101516. [Google Scholar] [CrossRef]
  6. Vitola, V.; Dile, M.; Krizmane, K.; Einbergs, E.; Eftimov, T.; Nikolov, K.; Fouzar, S. Tailoring the luminescence properties of strontium aluminate phosphors for unique smartphone detectable optical tags. Crystals 2025, 15, 474. [Google Scholar] [CrossRef]
  7. Fouzar, S.; Kostova, I.; Eftimov, T.; Benmounah, A.; Ouchabane, M.; Lakhssassi, A. Excitation and spectral dependence of the rise and decay time responses of Eu2+ and Dy3+ doped strontium aluminates. J. Mater. Sci. Mater. Electron. 2022, 33, 20962–20980. [Google Scholar] [CrossRef]
  8. Eftimov, T.; Kostova, I.; Arapova, A.; Patronov, G. Rise and decay time responses of Sr aluminate phosphorescent materials. J. Lumin. 2021, 235, 117985. [Google Scholar] [CrossRef]
  9. Fouzar, S.; Eftimov, T.; Kostova, I.; Benmounah, A.; Lakhssassi, A. Effects of temperature on the time responses of strontium aluminates. Opt. Mater. 2021, 122, 111619. [Google Scholar] [CrossRef]
  10. Van der Heggen, D.; Joos, J.J.; Feng, A.; Fritz, V.; Delgado, T.; Gartmann, N.; Walfort, B.; Rytz, D.; Hagemann, H.; Poelman, D.; et al. Persistent Luminescence in Strontium Aluminate: A Roadmap to a Brighter Future. Adv. Funct. Mater. 2022, 32, 2208809. [Google Scholar] [CrossRef]
  11. Leimane, M.; Krizmane, K.; Bite, I.; Grube, J.; Vitola, V. Sol–Gel Synthesis of Translucent and Persistent Luminescent SiO2@ SrAl2O4 Eu, Dy, B Materials. Materials 2023, 16, 4416. [Google Scholar] [CrossRef] [PubMed]
  12. Van den Eeckhout, K.; Smet, P.F.; Poelman, D. Persistent Luminescence in Eu2+-Doped Compounds: A Review. Materials 2010, 3, 2536–2566. [Google Scholar] [CrossRef]
  13. Aitasalo, T.; Hölsä, J.; Jungner, H.Ö.; Lastusaari, M.; Niittykoski, J. Sol-gel processed Eu2+-doped alkaline earth aluminates. J. Alloys Compd. 2002, 341, 76–78. [Google Scholar] [CrossRef]
  14. Yang, L.; Liu, Q.; Zheng, H.; Zhou, S.; Zhang, W. The decay model of Eu2+ and Eu2+, Dy3+ substituted SrAl2O4 prepared by high temperature solid phase method. J. Phys. Chem. Solids 2019, 124, 151–156. [Google Scholar] [CrossRef]
  15. Li, Q.; Zhao, J.; Sun, F. Energy transfer mechanism of Sr4Al14O25:Eu2+ phosphor. J. Rare Earths 2010, 28, 26–29. [Google Scholar] [CrossRef]
  16. Aitasalo, T.; Holsa, J.; Lastusaari, M.; Niittykoski, J. Mechanisms of persistent luminescence in Eu2+, RE3+ doped alkaline earth aluminates. J. Lumin. 2001, 94–95, 59–63. [Google Scholar] [CrossRef]
  17. Clabau, F.; Rocquefelte, X.; Jobic, S.; Deniard, P.; Whangbo, M.-H.; Garcia, A.; Le Mercier, T. On the phosphorescence mechanism in SrAl2O4:Eu2+ and its codoped derivatives. Solid State Sci. 2007, 9, 608–612. [Google Scholar] [CrossRef]
  18. Dorenbos, P. Mechanism of Persistent Luminescence in Eu2+ and Dy3+ Codoped Aluminate and Silicate Compounds. J. Electrochem. Soc. 2005, 152, H107. [Google Scholar] [CrossRef]
  19. Clabau, F.; Rocquefelte, X.; Jobic, S.; Deniard, P.; Whangbo, M.-H.; Garcia, A.; Le Mercier, T. Mechanism of Phosphorescence Appropriate for the Long-Lasting Phosphors Eu2+-Doped SrAl2O4 with Codopants Dy3+ and B3+. Chem. Mater. 2005, 17, 3904–3912. [Google Scholar] [CrossRef]
  20. Randall, J.T.; Wilkins, M.H.F. Phosphorescence and electron traps—I. The study of trap distributions. Proc. R. Soc. Lond. 1945, 184, 365–389. [Google Scholar]
  21. Randall, J.T.; Frederick, W.M.H. Phosphorescence and electron traps—II. The interpretation of long-period phosphorescence. Proc. R. Soc. Lond. 1945, 184, 390–407. [Google Scholar]
  22. Huntley, D.J. An explanation of the power-law decay of luminescence. J. Phys. Condens. Matter 2006, 18, 1359. [Google Scholar] [CrossRef]
  23. Sahai, M.K.; Bakshi, A.K.; Datta, D. Revisit to power law decay of luminescence. J. Lumin. 2017, 195, 240–246. [Google Scholar] [CrossRef]
  24. Romero, M.; Castaing, V.; Lozano, G.; Miguez, H. Trap Depth Distribution Determines Afterglow Kinetics: A Local Model Applied to ZnGa2O4:Cr3+. J. Phys. Chem. Lett. 2024, 15, 9129–9135. [Google Scholar] [CrossRef]
  25. Fouzar, S.; Eftimov, T.; Kostova, I.; Dimitrova, T.L.; Benmounah, A.; Lakhssassi, A. A Simple Fiber Optic Temperature Sensor For Fire Detection In Hazardous Environment Based On Differential Time Rise/Decay Phosphorescence Response. IEEE Trans. Instrum. Meas. 2022, 71, 1–8. [Google Scholar] [CrossRef]
  26. Eftimov, T.A.; Kostova, I.; Peltekov, A.; Hristova, K.; Brabant, D.; Fouzar, S.; Nikolov, K. A study of strontium aluminates for all optical contactless sensing applications using smartphone interrogation. Opt. Laser Technol. 2024, 176, 110965. [Google Scholar] [CrossRef]
  27. Nikolova, K.; Nikolov, K.; Eftimov, T.; Panova, N.; Vitola, V. The Smartphone as an Affordable 2D Spectrometer for Parallel Spectral and Time-dependent Measurements. In Proceedings of the 8th International Conference on Optics, Photonics and Lasers (OPAL’ 2025), Rhodes, Greece, 14–16 May 2025; pp. 143–146. [Google Scholar]
  28. Wang, L.; Wang, W.; Shang, Z.; Cao, P.; Shi, M.; Yang, B.; Zou, J. Optical and reliability properties studies of Sr4Al14O25:Eu2+ film for high-CRI white LEDs. J. Mater. Sci. Mater. Electron. 2020, 31, 13561–13569. [Google Scholar] [CrossRef]
  29. Katumo, N.; Gao, G.; Laufer, F.; Richards, B.S.; Howard, I.A. Smartphone-Based Luminescent Thermometry via Temperature-Sensitive Delayed Fluorescence from Gd2O2S:Eu3+. Adv. Opt. Mater. 2020, 8, 2000507. [Google Scholar] [CrossRef]
  30. Eftimov, T.; Kostova, I.; Fouzar, S.; Brabant, D.; Nikolov, K.; Vladev, V. Smartphone-Readable Optical-Fiber Quasi-Distributed Phosphorescent Temperature Sensor. Photonics 2024, 11, 694. [Google Scholar] [CrossRef]
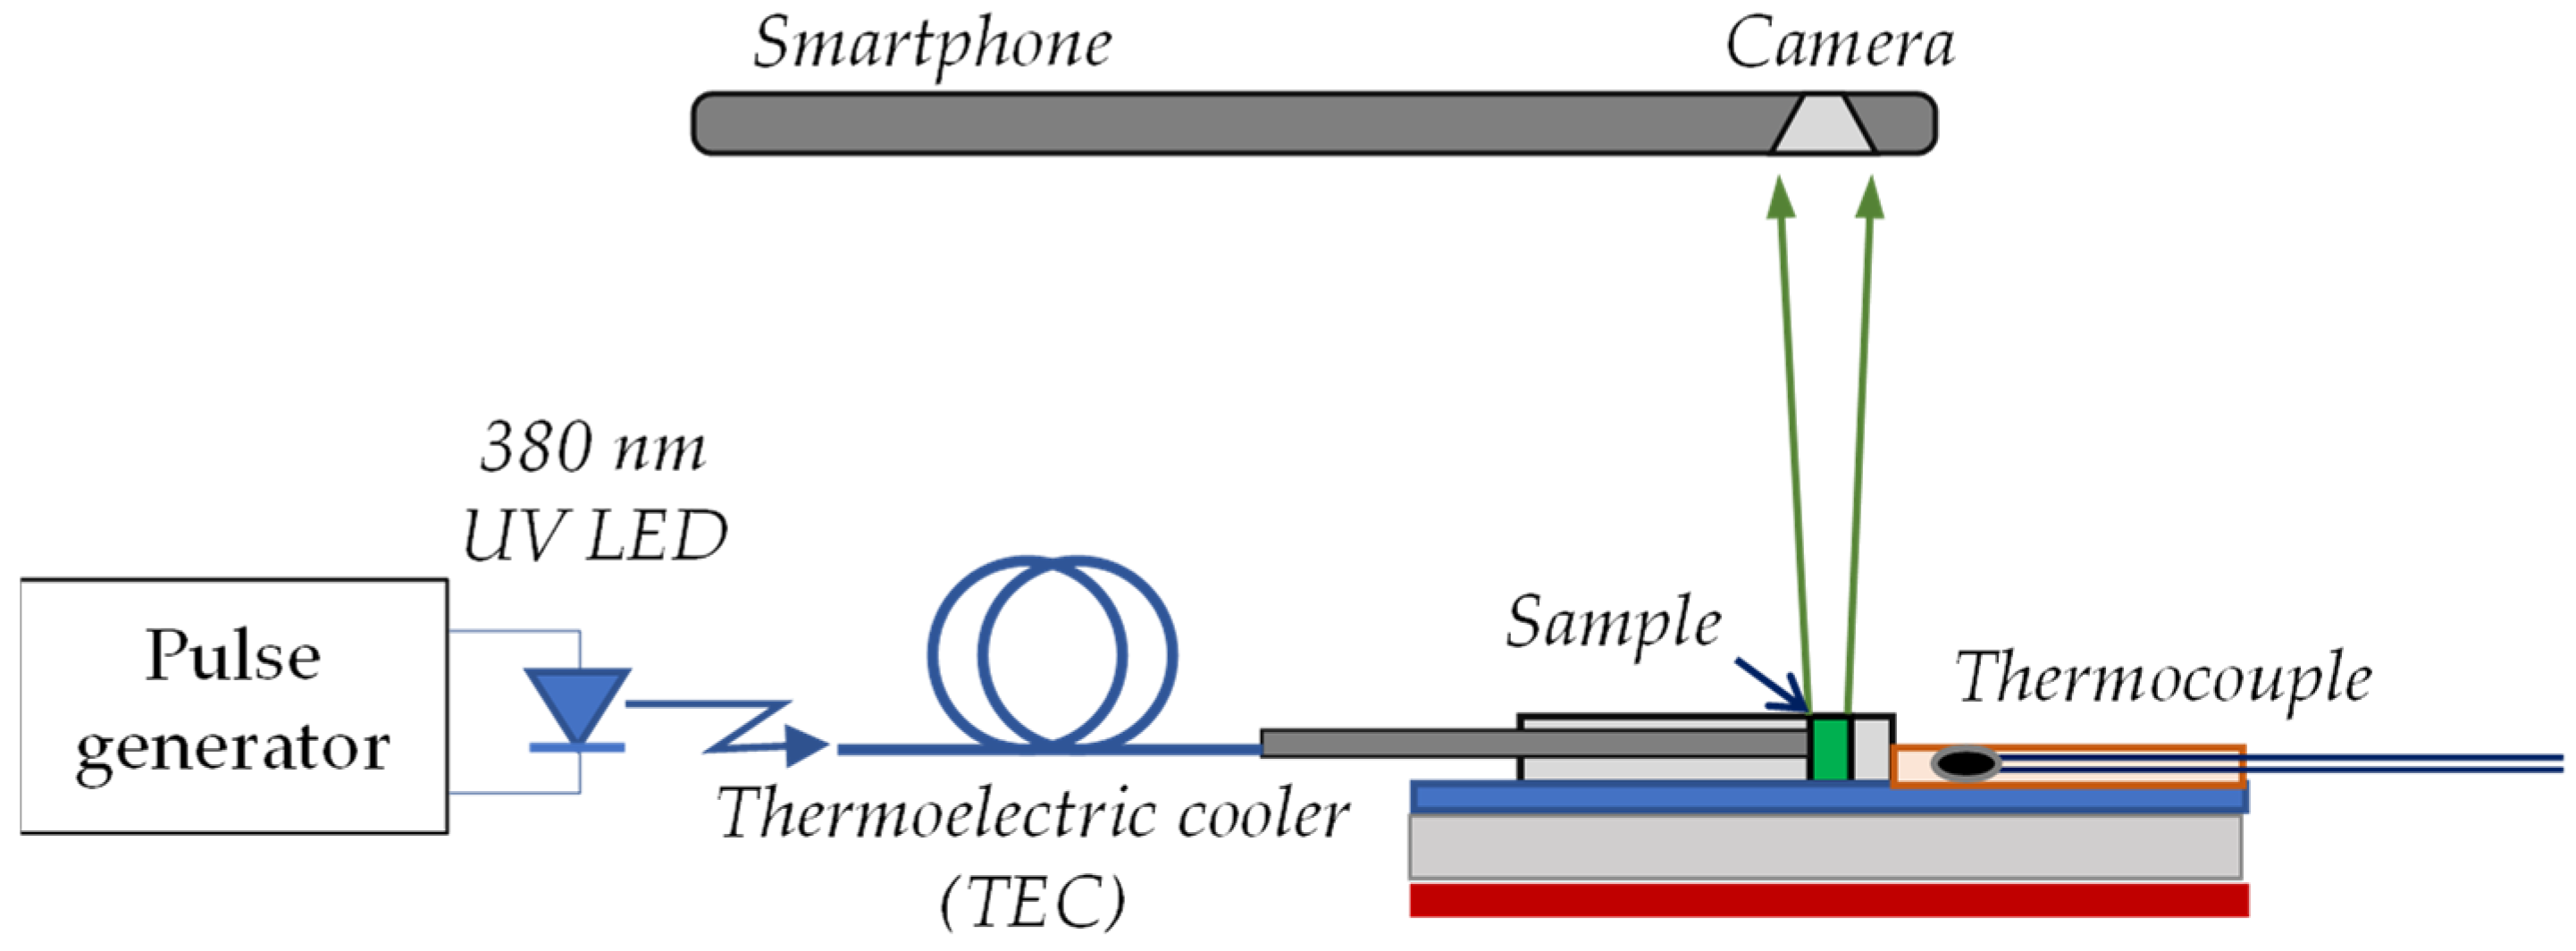
Figure 1. Experimental setup for smartphone interrogation of temperature-dependent time responses.
Crystals 15 00744 g001
Figure 2. Rise and decay responses of samples #5 and #4 during the ON and OFF phases: (a) sample #5 with a standard monotonous rise and decay response; (b) sample #4 with anomalous decay response.
Crystals 15 00744 g002
Figure 3. Normalized responses to temperature of the samples under study: (a) Normalized intensity ξ(T) from (2); (b) normalized decay from Equation (A6) with summation for i = 2 ÷ 30.
Crystals 15 00744 g003
Figure 4. ON/OFF time dependencies of the RGB pixels and the overall signal at 0C and 25C of samples from #1: at 0C (a1) and 25C (a2) to #7 at 0C (g1) and 25C (g2).
Crystals 15 00744 g004aCrystals 15 00744 g004b
Figure 5. ON/OFF time dependencies of the RGB pixels and the overall signal at 25C of samples from #1 (a) to #7 (g) and (h)—a comparison of the normalized responses of all seven samples.
Crystals 15 00744 g005aCrystals 15 00744 g005b
Figure 6. RGB dependence of the normalized decay compared to the overall response: (a) sample #5; (b) sample #6.
Crystals 15 00744 g006
Figure 7. RGB and integral time responses for samples #3 and #6 at 10 °C for three different duty cycles: (a1,a2) 20%; (b1,b2) 50%; and (c1,c2) 80%.
Crystals 15 00744 g007
Figure 8. The schematic illustrations of the electron trapping/de-trapping model and luminescence for (a) standard luminescence and (b) standard and the anomalous luminescence.
Crystals 15 00744 g008
Table 1. Summary of the seven precursor-tailored Sr-aluminate phosphors used in this study (for details [6]).
IDPrecursor (Anion)Main Crystal Phase(s)Particle MorphologyTrap Depth
(eV)
Sr: Al (wt)
#1HMTAMostly Sr3Al2O6 + trace Sr4Al14O25Compact spheres0.05/0.174.1
#2LiOH~60% monoclinic SrAl2O4 + cubic Sr3Al2O6Fused platelets0.1031.4
#3KOHMonoclinic SrAl2O4 richRagged plates0.0551.2
#4NaOHMonoclinic SrAl2O4 with ≈18% cubic phasePlate-like0.161/0.1122.0
#5K2CO3>90% cubic Sr3Al2O6Smooth quasi spheres0.117/0.1862.7
#6Na2CO3Nearly pure Sr3Al2O6 Dense spheres0.1483.2
#7(NH4)2CO3~1:1 monoclinic SrAl2O4/cubic Sr3Al2O6 mixCompact, partly sintered0.1501.6
Table 2. Power and exponential law fitting functions for the ON (rise) and OFF (decay) responses for the overall Y (Grey) signal.
Sample #Rise Time Response ApproximationDecay Time Response Approximation
Decay InitialDecay Tail
Sample #1Exponential1 − 0.3801 × e−0.752tPower law0.1324 × t−0.3Exponential0.0897 × e−0.009t
Sample #2Power1 − 0.0808 × t−1.252Power law0.1025 × t−0.494Exponential0.0583 × e−0.009t
Sample #3Exponential1 − 0.1597 × e−0.537tPower law0.1016 × t−0.516Exponential0.0591 × e−0.01t
Sample #4Exponential1 − 0.0927 × e−0.334xPower law0.1338 × t−0.034Exponential0.1271 × e−0.0014t
Sample #5Exponential1 − 0.2854 × e−0.586tPower law0.2137 × t−1.285
Sample #6Exponential1 − 0.4495 × e−0.869tPower law0.2008 × t−0.341
Sample #7Exponential1 − 0.205 × e−0.752tPower law0.137 × t−0.253
Table 3. Power and exponential law approximations for the R, G, and B components and the overall Y (Grey) ON (rise) and the OFF (decay) time responses for samples #1 and #4 at 25C (see Figure 4a2,d2).
#RiseDecay
R1(t)R2(t)D1(t)D2(t)D2(t)
#11 − 0.5732 − e−2.545t1 − 0.3732 − e−1.596t0.0107 − t−0.920.0289 − t−0.4220.0399 − t−0.022
#1 B1 − 0.0216 − t−1.0251 − 1.4439 − e−5.648t0.0348 − t−0.6560.0933 − t−0.151
#1 G1 − 0.0348 − t−0.6561 − 0.0348 − t−0.6560.0048 − t−1.2530.0064 − t−1.2570.0246 − e−1.239t
#1 R1 − 0.1863 − t−0.3931 − 0.0904 − t−0.9140.0022 − t−0.7610.0308 − e−1.665t0.038 − (1 − 0.0563 − e−3.509t)
#4 1 − 0.0278 − t−0.8510.0018 − t−1.5280.044 − (1 − 0.0123 − e−1.282t)0.044 − (1 − 0.0107 − e−0.75t)
#4 B1 − 0.0028 − t−1.570.0084 − t−1.1680.0677 − t−0.176
#4 G1 − 0.1897 − t−0.392 − 10−09t−5.4540.014 − (1 − 0.0156 − e−2.581t)0.014 − (1 − 0.1211 − e−4.257t)
#4 R1 − 0.0665 − t−0.580.0054 − t−0.7150.045 − (1 − 0.0264 − e−3.81t)
Disclaimer/Publisher’s Note: The statements, opinions and data contained in all publications are solely those of the individual author(s) and contributor(s) and not of MDPI and/or the editor(s). MDPI and/or the editor(s) disclaim responsibility for any injury to people or property resulting from any ideas, methods, instructions or products referred to in the content.