1. Introduction
One of the flexible materials that is above its glass transition temperature (which is lower than the ambient temperature) is silicone rubber. It has multiple uses in our daily lives due to its remarkable flexibility [
1,
2].
BiFeO
3 exhibits remarkable multifunctional properties, which have attracted significant attention from both fundamental and applied research perspectives [
3,
4]. Bismuth-based ferroelectric ceramics, such as bismuth ferrite, could be used in emerging fields like spintronics, information storage, and sensors. An example is BiFeO
3’s narrow bandgap that facilitates light absorption even in the visible spectrum, making it a promising candidate for photovoltaic and photocatalytic applications [
5,
6,
7]. BiFeO
3’s piezoelectric properties are being used for energy harvesting applications, where mechanical energy is converted into electrical energy. These various characteristics indicate BiFeO
3’s potential in developing advanced multifunctional devices [
8,
9,
10,
11]. Previous studies have shown that the presence of secondary or impurity phases can significantly influence the functional properties of BiFeO
3-based materials [
12]. In particular, the presence of a secondary phase enhances the electrical conductivity of BiFeO
3 ceramics by modifying the charge transport mechanisms and introducing additional pathways for carrier mobility. Based on these findings, we considered it is relevant for the current study to focus on the comparative analysis of composites containing different concentrations of the Bi
25FeO
40 phase [
12].
In addition to the BiFeO
3, which is the perovskite-structured bismuth ferrite, there are also two other Bi-Fe-O structures, such as Bi
2Fe
4O
9 and Bi
25FeO
40, each of them having interesting electrical properties [
13,
14]. Bi
2Fe
4O
9 and Bi
25FeO
40, with a mullite-type structure and a sillenite-type structure, respectively, have been studied for their electrical properties, revealing lower conductivity compared to BiFeO
3 [
15,
16,
17]. This suggests that any leakage conductivity in BiFeO
3 is not due to the presence of these secondary phases [
18,
19,
20]. The diverse properties of these bismuth ferrites have led to their exploration in various industrial applications, particularly in the fields of photocatalysis and photovoltaics. For instance, BiFeO
3 nanoparticles have demonstrated potential in photocatalytic hydrogen generation from water splitting and in degrading organic contaminants under visible-light irradiation [
5,
21].
Composite materials are engineered by combining two or more distinct materials to create a new material with enhanced properties not found in the individual components [
22]. This synergistic approach allows for the design of materials with tailored characteristics, offering advantages such as increased strength, reduced weight, and improved durability [
23]. For instance, carbon fiber reinforced polymers merge the high tensile strength of carbon fibers with the flexibility of polymer matrices, resulting in lightweight yet robust structures ideal for aerospace and automotive applications [
24]. Similarly, the integration of materials like quartz fibers with resin has led to composites that are several times stronger than stainless steel while allowing for vibrant coloration, expanding their use in luxury watchmaking. The ability to customize the properties of composite materials by selecting appropriate constituent materials and their configurations has revolutionized material engineering, leading to innovations across various industries.
One of silicone rubber’s qualities is its heat resistance with respect to natural rubber [
25,
26]. When it came to heat resistance, silicone rubber outperformed organic rubbers, because nearly no changes in properties occur at 150 °C, so it can be used semi-permanently. Additionally, silicone rubber can be used continuously for over 10,000 h at 200 °C. For short durations, it can withstand temperatures up to 300 °C [
27]. Also, silicone rubbers are incredibly weatherproof. Moreover, while most organic rubbers are quickly degraded by ozone, silicone rubber is essentially unaffected. Another important physical characteristic of the silicone rubber is that it hardly alters even after prolonged exposure to wind, rain, and UV radiation [
28,
29,
30].
In this study, we focus on analyzing the properties of a composite material obtained by mixing BiFeO3/Bi25FeO40 powders (with Bi25FeO40 as secondary phase of various concentration of 10%, 20%, and 30%) into a matrix of silicone rubber. The aim was to determine the overall performance of the materials by investigating the structural, morphological, and electrical characteristics of these composites. The electrical response of the composites will be used to understand the potential for applications in flexible electronics, sensors, and other multifunctional devices.
2. Materials and Methods
In the hydrothermal synthesis used to obtain BiFeO3/Bi25FeO40, 1 mmol (0.485 g) of Bi(NO3)3·5H2O and 1 mmol (0.404 g) of Fe(NO3)3·9H2O were each dissolved in 5 mL of distilled water. The two resulting solutions were then mixed together and homogenized by magnetic stirring for 15 min in a 60 mL Teflon-lined autoclave, forming a brownish-yellow mixture. Only after this step, 10 mL of 1 M sodium hydroxide (NaOH) solution was added to the mixture. The final solution was heated at 200 °C for 12 h to complete the synthesis. The powder samples were thoroughly washed to eliminate any impurities or residual by-products, then dried in an oven at 60 °C for 1 h. By varying the precursor ratios, we obtained mixed phases consisting of BiFeO3 and Bi25FeO40 in different concentrations.
The samples were analyzed and identified at room temperature using an XRD PANalytical X’Pert PROMPD Diffractometer (Almelo, The Netherlands). The XRD characterizations were carried out over the scanning range of 10° to 80° using Cu Ka radiation at 40 kV and 30 mA. X-ray diffraction (XRD) patterns were recorded using a step size of 0.013° (2θ), with a counting time of 175 s per step in the continuous scan mode to ensure high-resolution data acquisition.
To investigate the morphology and microstructure of the Bi-Fe-oxide samples, scanning electron microscopy (SEM/EDX, Inspect S model, Eindhoven, The Netherlands) was used, at the accelerating voltage of 30 kV without using a conductive layer.
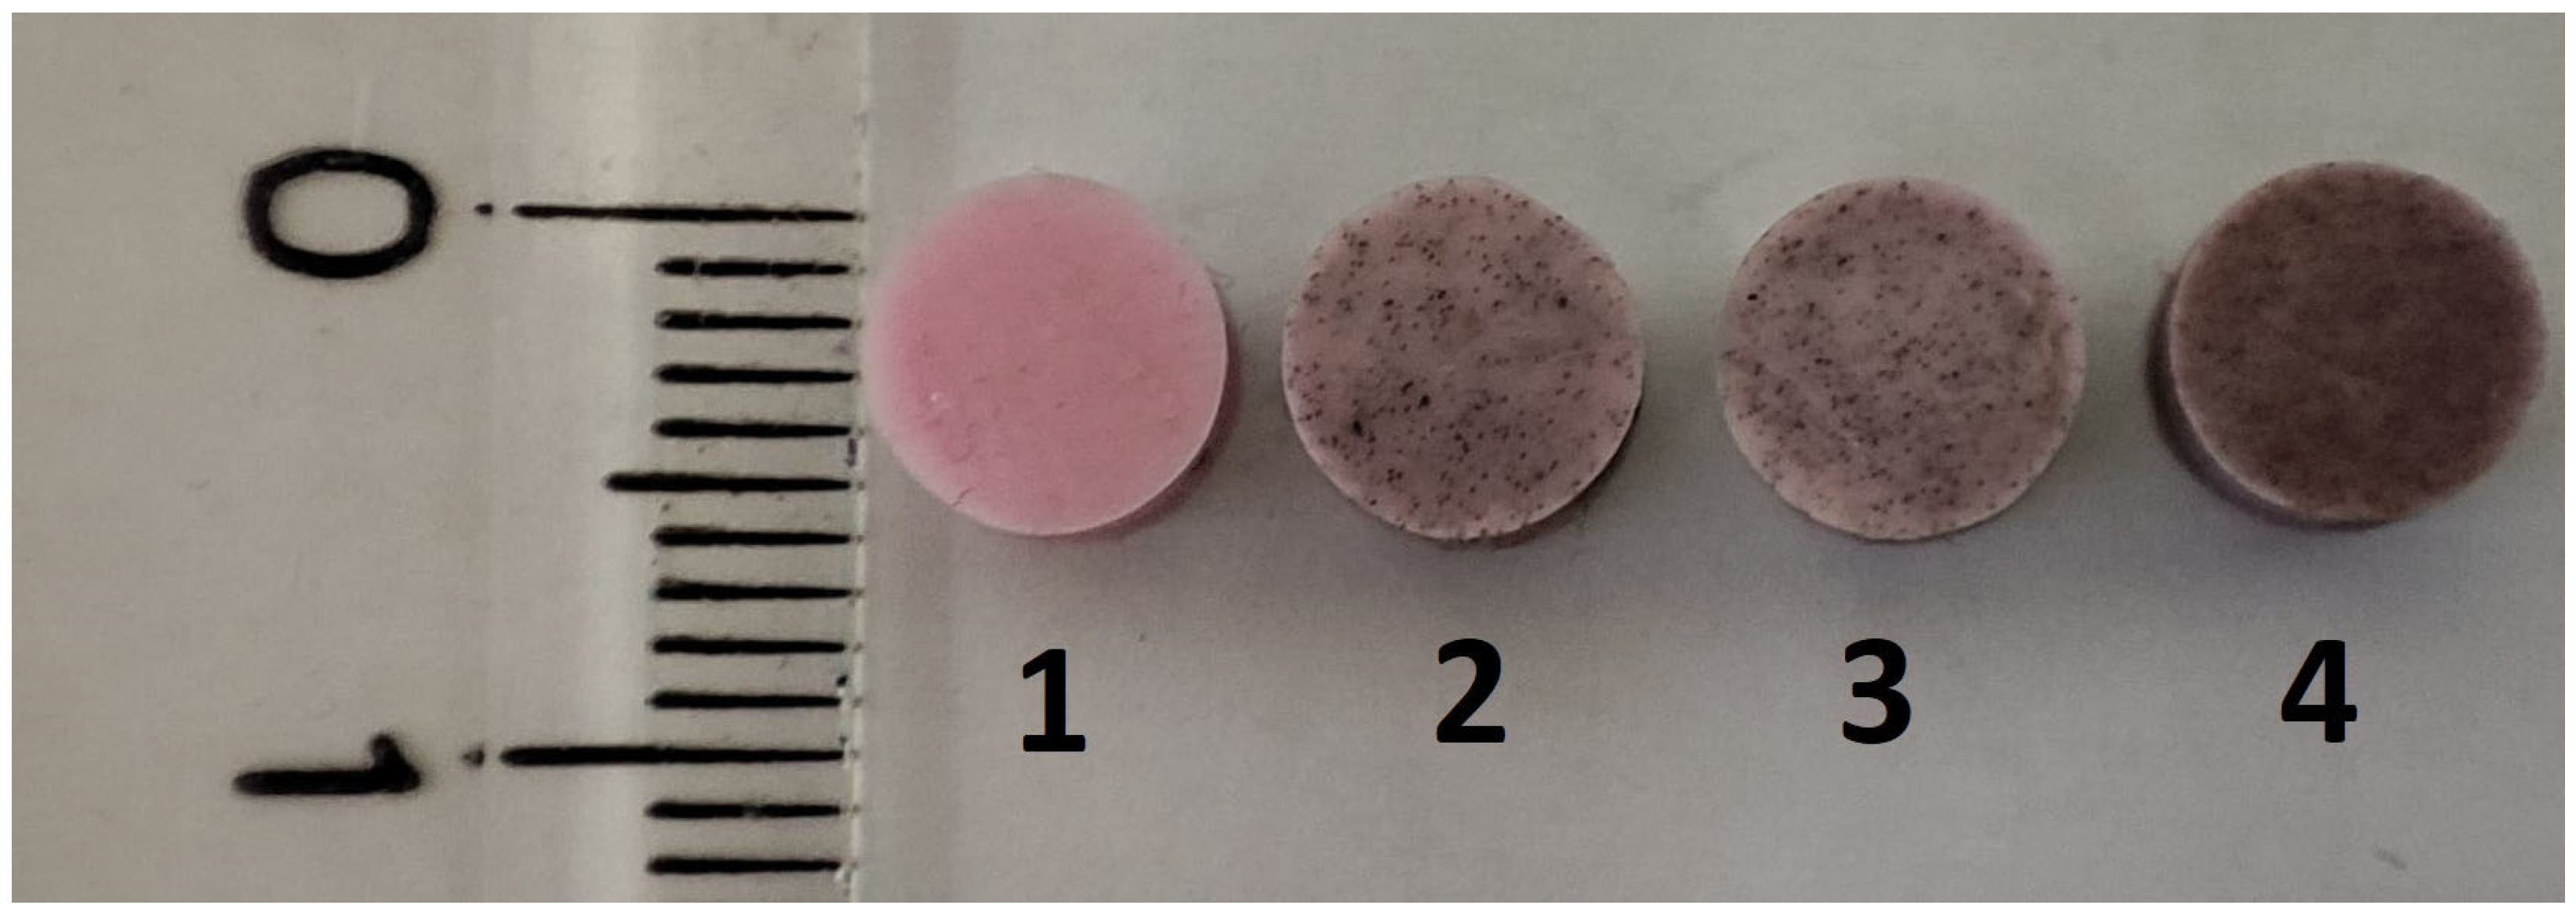
Commercial RTV-530 silicone rubber (SR) from Prochima and Bi-Fe-oxide particles were combined to create three elastomer-type composite samples. The BiFeO
3/Bi
25FeO
40 powder mixture was gradually added to a silicone rubber matrix and continuously mixed for 10 min to ensure uniform dispersion of the filler. The resulting mixture was then cast and cured under ambient conditions. The sample denoted by SR is silicone rubber, the sample denoted by SR-BFO1 is a composite consisting of silicone rubber and 5 wt% BiFeO
3/Bi
25FeO
40 powder (90 wt% BiFeO
3 and 10 wt% Bi
25FeO
40), the sample denoted by SR-BFO2 is a composite composed of silicone rubber and 5 wt% BiFeO
3/Bi
25FeO
40 powder (80 wt% BiFeO
3 and 20 wt% Bi
25FeO
40), and the sample denoted by SR-BFO3 and is a composite composed of silicone rubber and 5 wt% BiFeO
3/Bi
25FeO
40 powder (70 wt% BiFeO
3 and 30 wt% Bi
25FeO
40). The four elastomer samples are shown in
Figure 1Using an instrument called a LABSYS Evo (Setaram Instrumentation, Caluire-et-Cuire, France) with a weighing precision of ±0.01 percent in air or Ar as purge gas with an average flow rate of 30 mL min−1, the DTA curve of the sample was obtained. The samples weighed around 20.0 mg and were heated at rates of 2 °C/min and 10 °C/min between 30 and 200 °C using an alumina crucible.
The frequency and temperature dependencies for both the resistance, R, and the inductive reactance, X, of all samples were measured at frequencies between 0.5 kHz and 2 MHz using an LCR meter (TEGAM, Inc., Geneva, OH, USA). For this purpose, each composite sample was placed in a parallel-plate capacitor with circular plates, 4 cm in diameter, and spaced 1 mm apart.
3. Results
3.1. XRD Characterizations
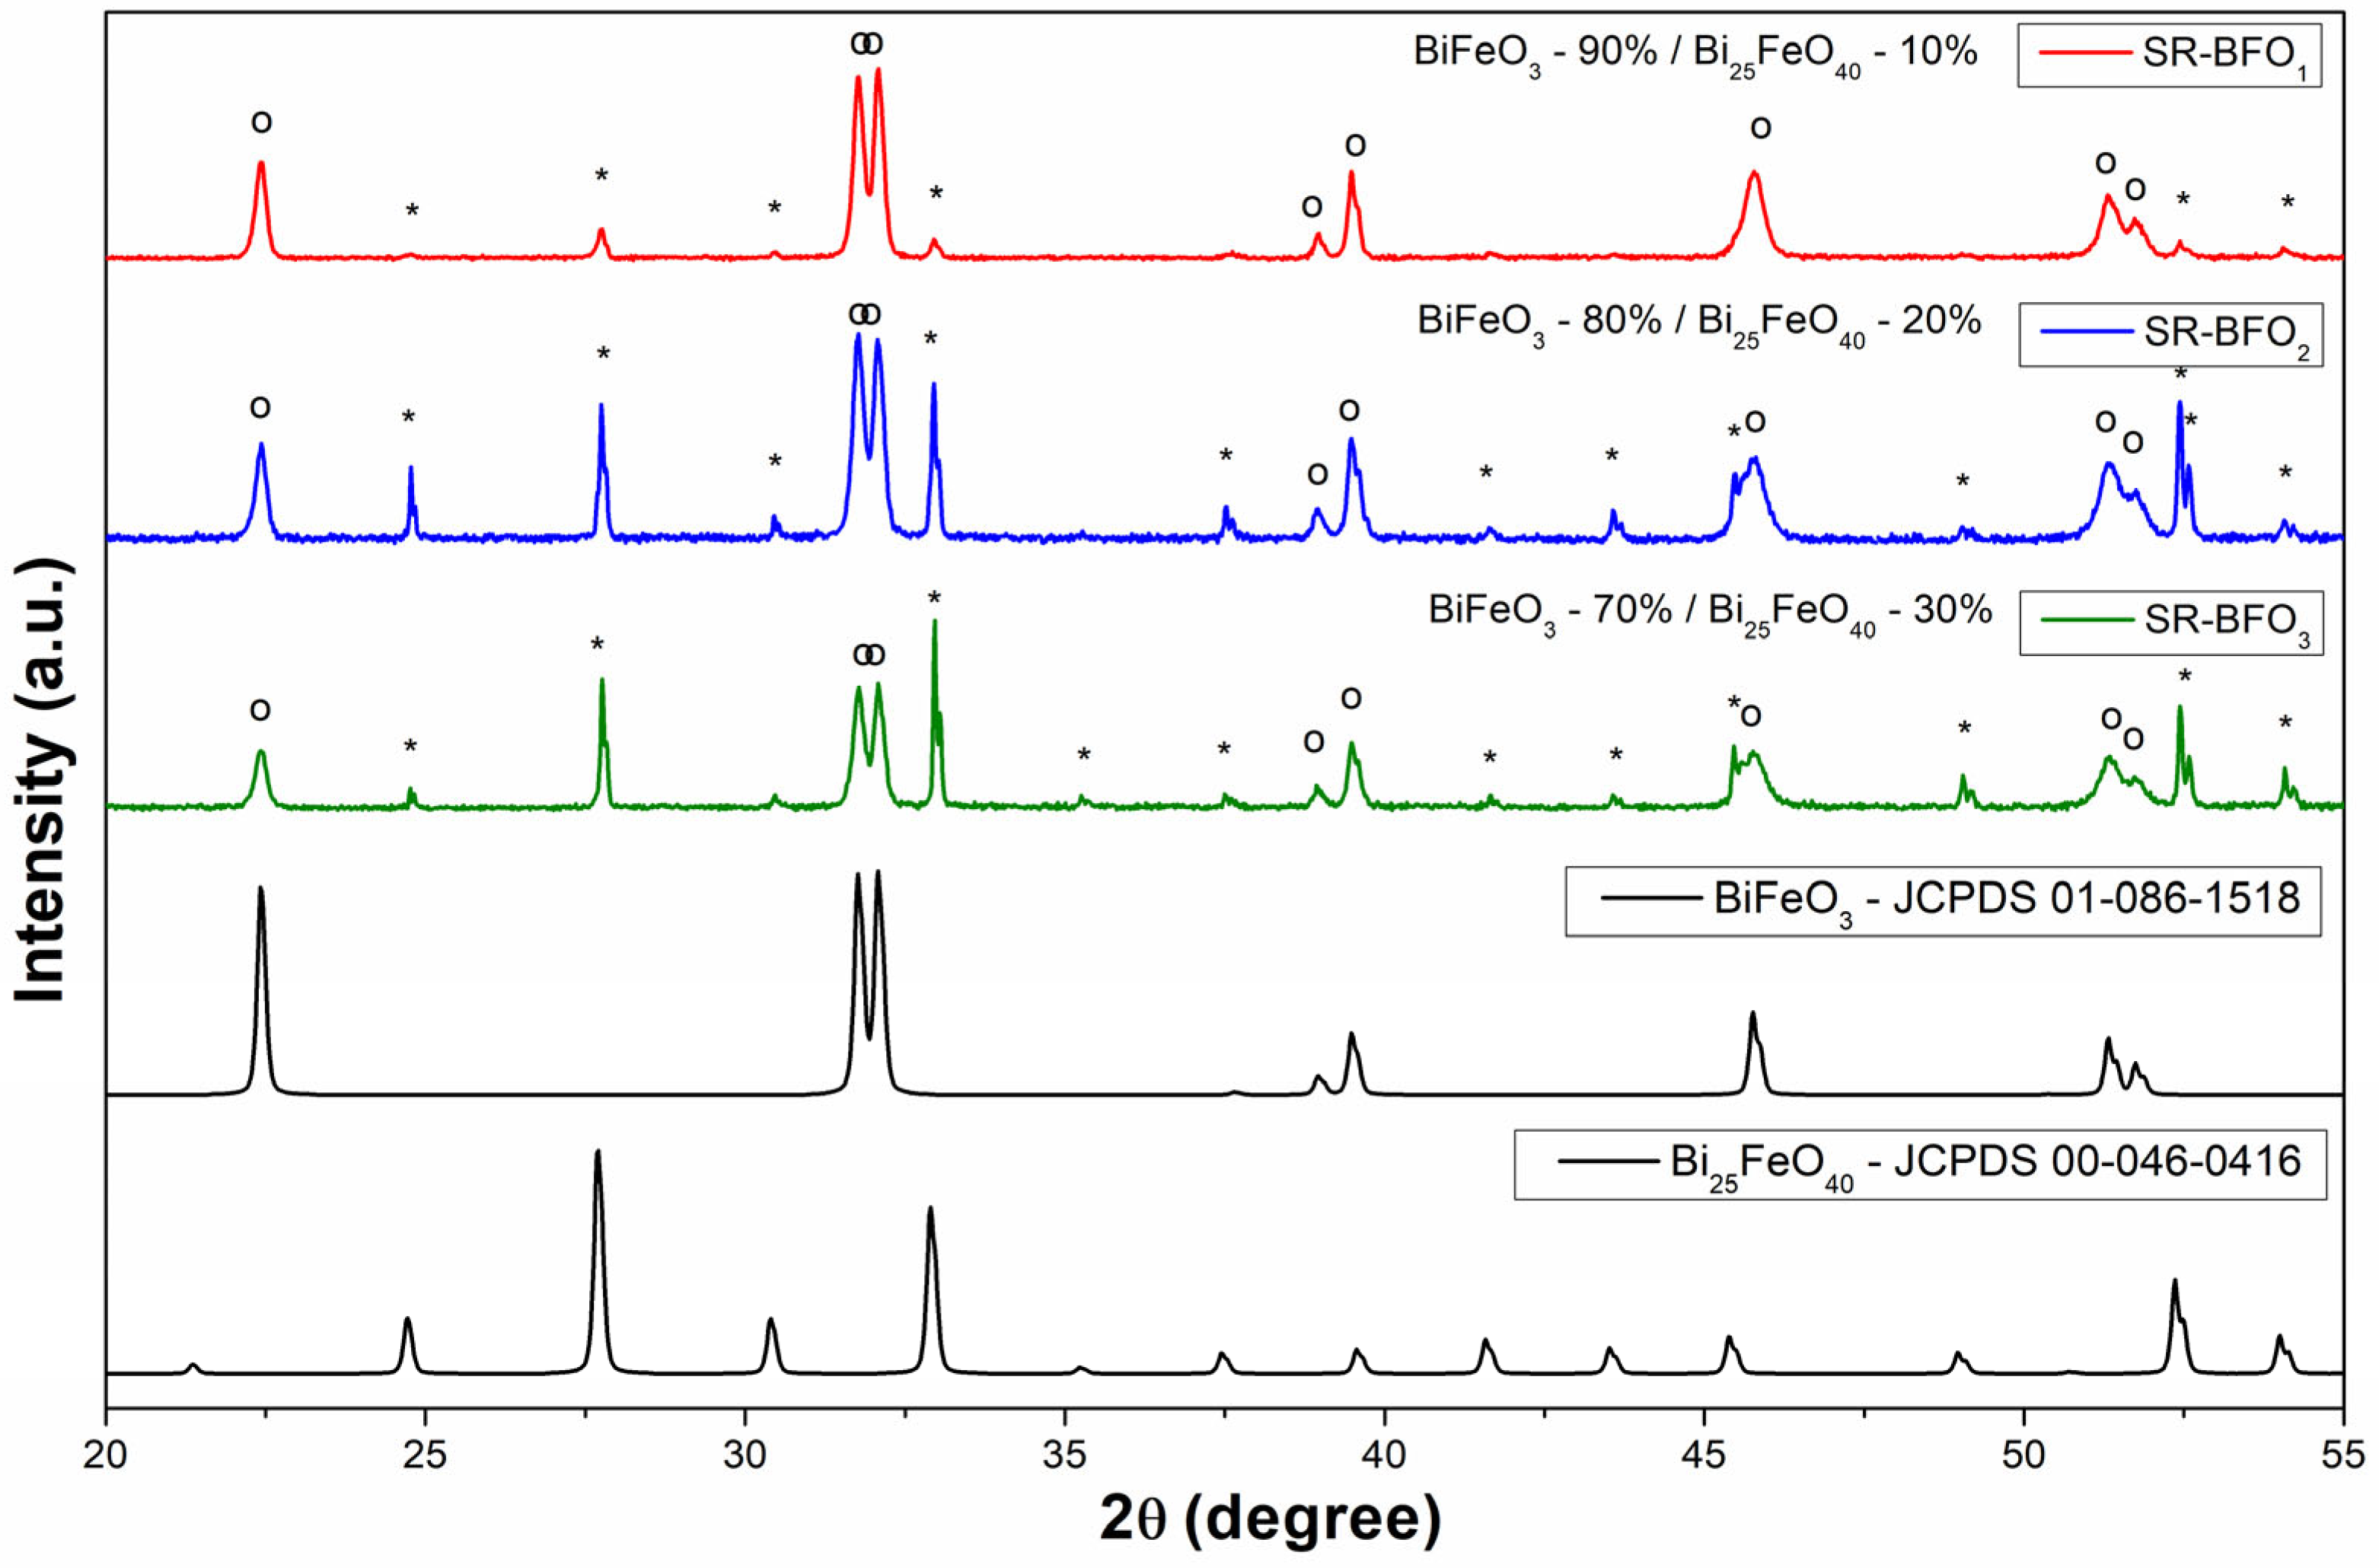
The XRD patterns of Bi-Fe-oxide samples, presented in
Figure 2, confirm the presence of BiFeO
3 as the primary phase in all samples. In addition, a secondary phase, Bi
25FeO
40, is detected in varying amounts. Phase identification of the powder samples was carried out using the X’Pert HighScore Plus, based on comparison with reference patterns from the ICDD database. The corresponding database codes are indicated in the figure for clarity. In addition to qualitative phase identification, the software was also employed to perform a quantitative analysis of the powder composition. The secondary phase’s concentration increases progressively from 10% in the sample denoted by SR-BFO1 to 20% in that denoted by SR-BFO2 and reaches 30% in the sample denoted by SR-BFO3. The increasing intensity of the Bi
25FeO
40 peaks suggests a direct correlation between the synthesis conditions and the formation of this phase. These findings indicate that while BiFeO
3 remains the dominant phase, the presence of Bi
25FeO
40 should be considered in understanding the overall electrical and structural properties of the composites. Variations in the local microstructural environment, such as lattice strain or partial amorphization, may also affect the diffraction efficiency of specific crystallographic planes, which could explain the observed intensity differences in the Bi
25FeO
40 peaks around 25° and 33°.
3.2. SEM Analysis
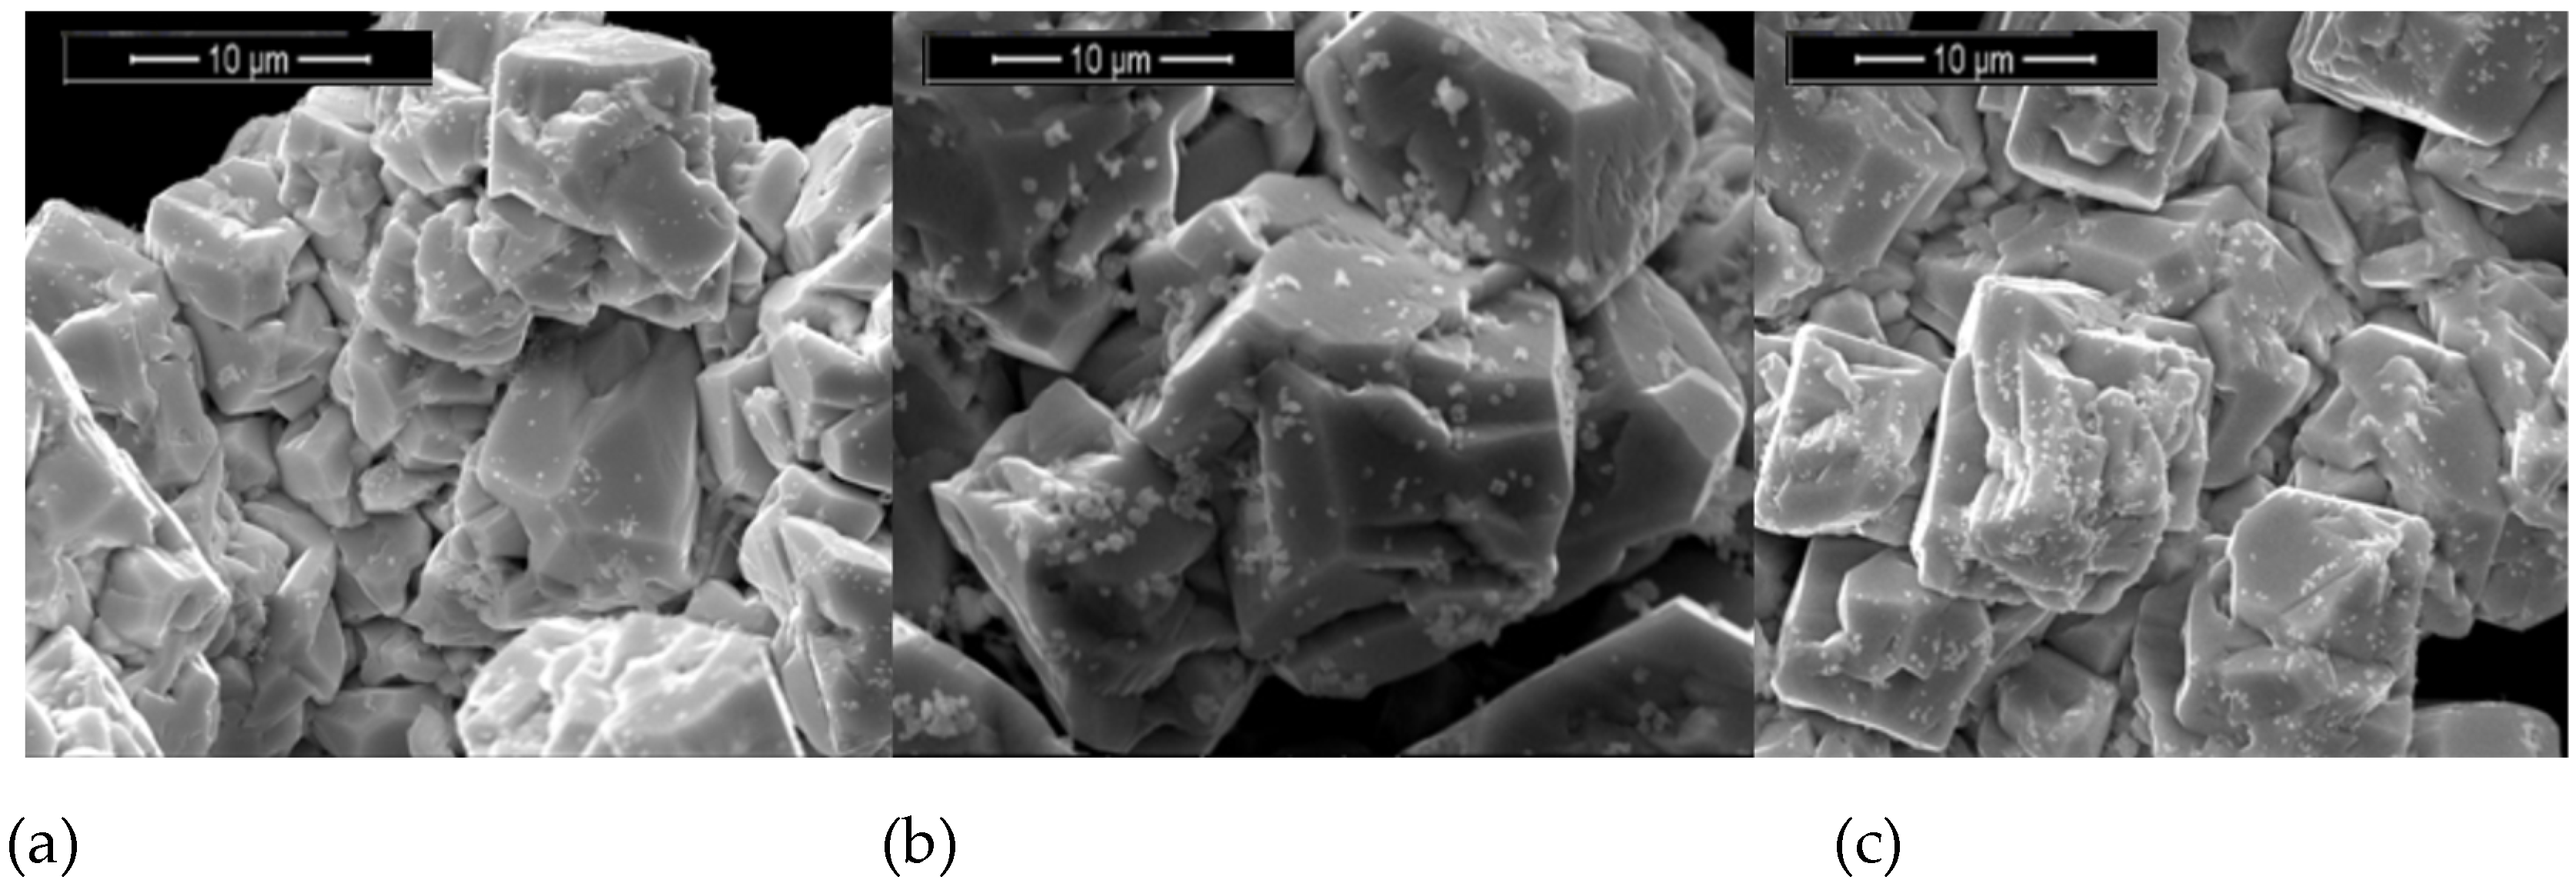
SEM analysis performed on the Bi–Fe–O powders showed the presence of small secondary phases on the BiFeO
3 grain surfaces. These secondary phases appear as small, lighter particles distributed across the surfaces of the larger BiFeO
3 grains and are attributed to the Bi
25FeO
40 phase. The presence of small grains in varying amounts, as observed in
Figure 3a–c, supports the XRD results and confirms the coexistence of two distinct phases within the material.
3.3. TG-DTA
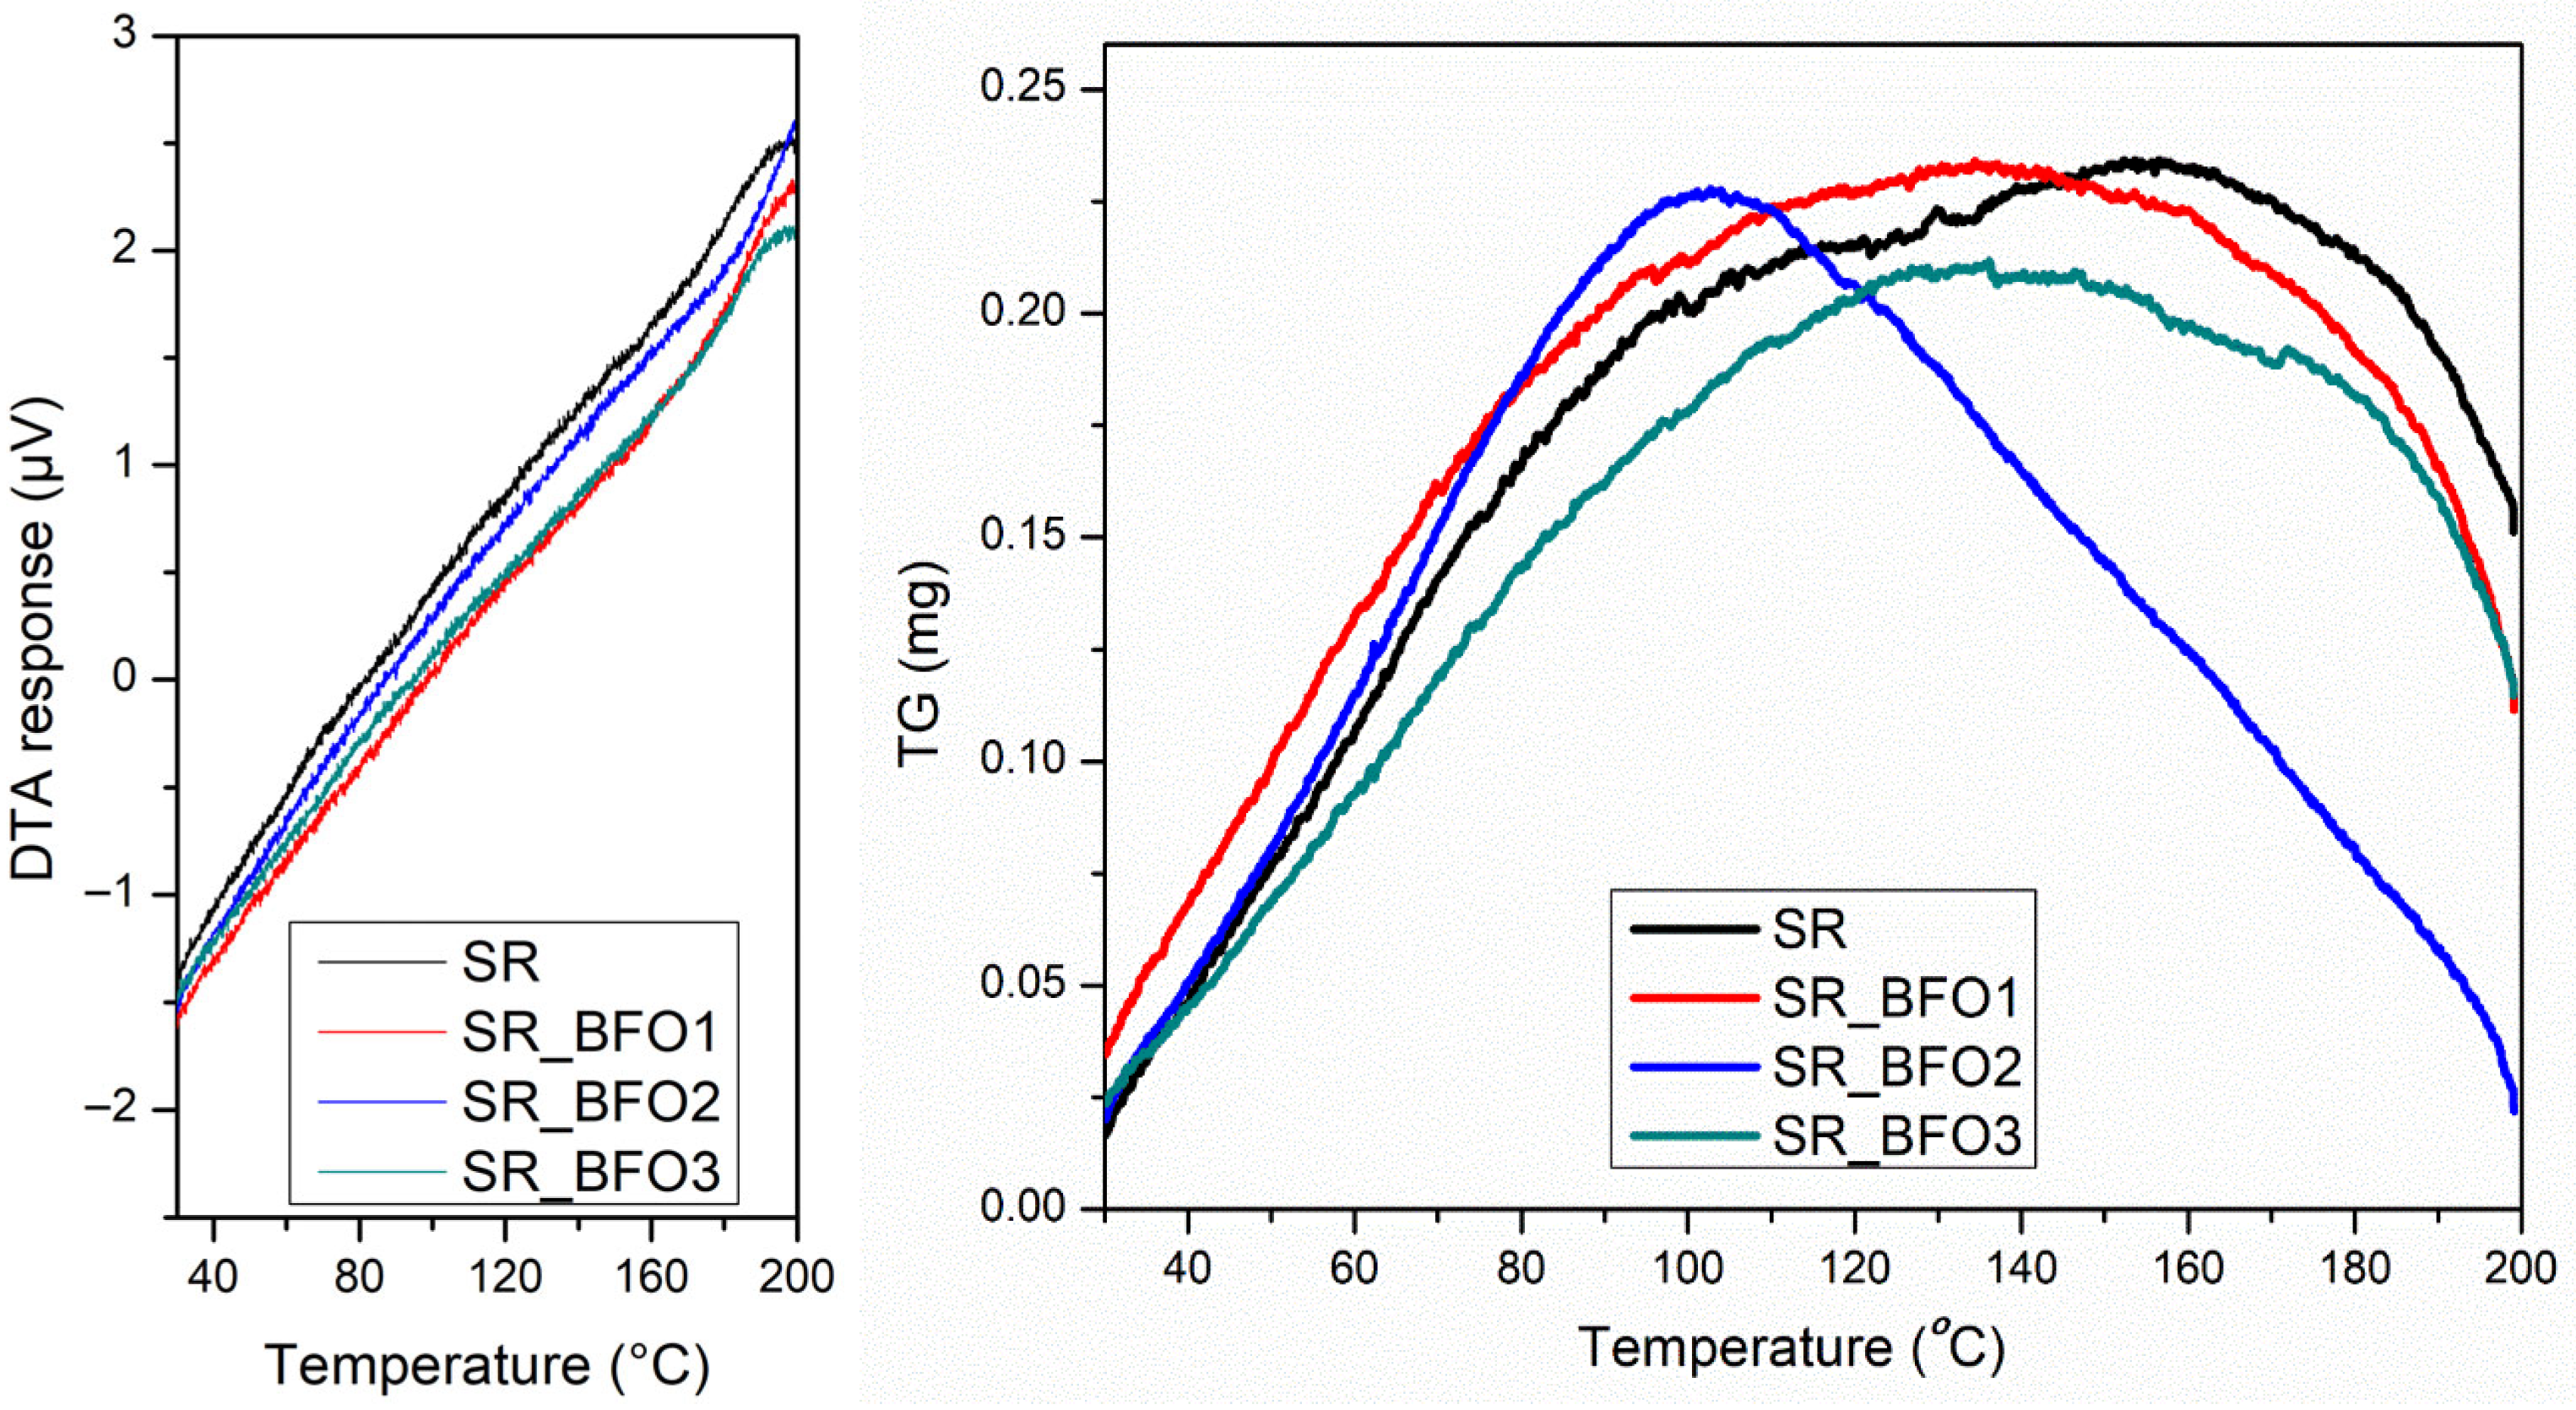
Figure 4 illustrates the TG-DTA results for the four samples. These results indicate good thermal stability up to 200 °C. Although the TG curve of the SR_BFO2 sample shows a slightly different shape compared to the other samples, the overall mass change remains below 1% for all cases; therefore, this variation is considered negligible and does not indicate any significant thermal or compositional difference having no corresponding features observed in the DTA heat flow signals. The absence of endothermic or exothermic events in the DTA curves implies that no phase transition or other significant thermal transformations occurred within this temperature range.
3.4. Frequency Dependence of Conductivity
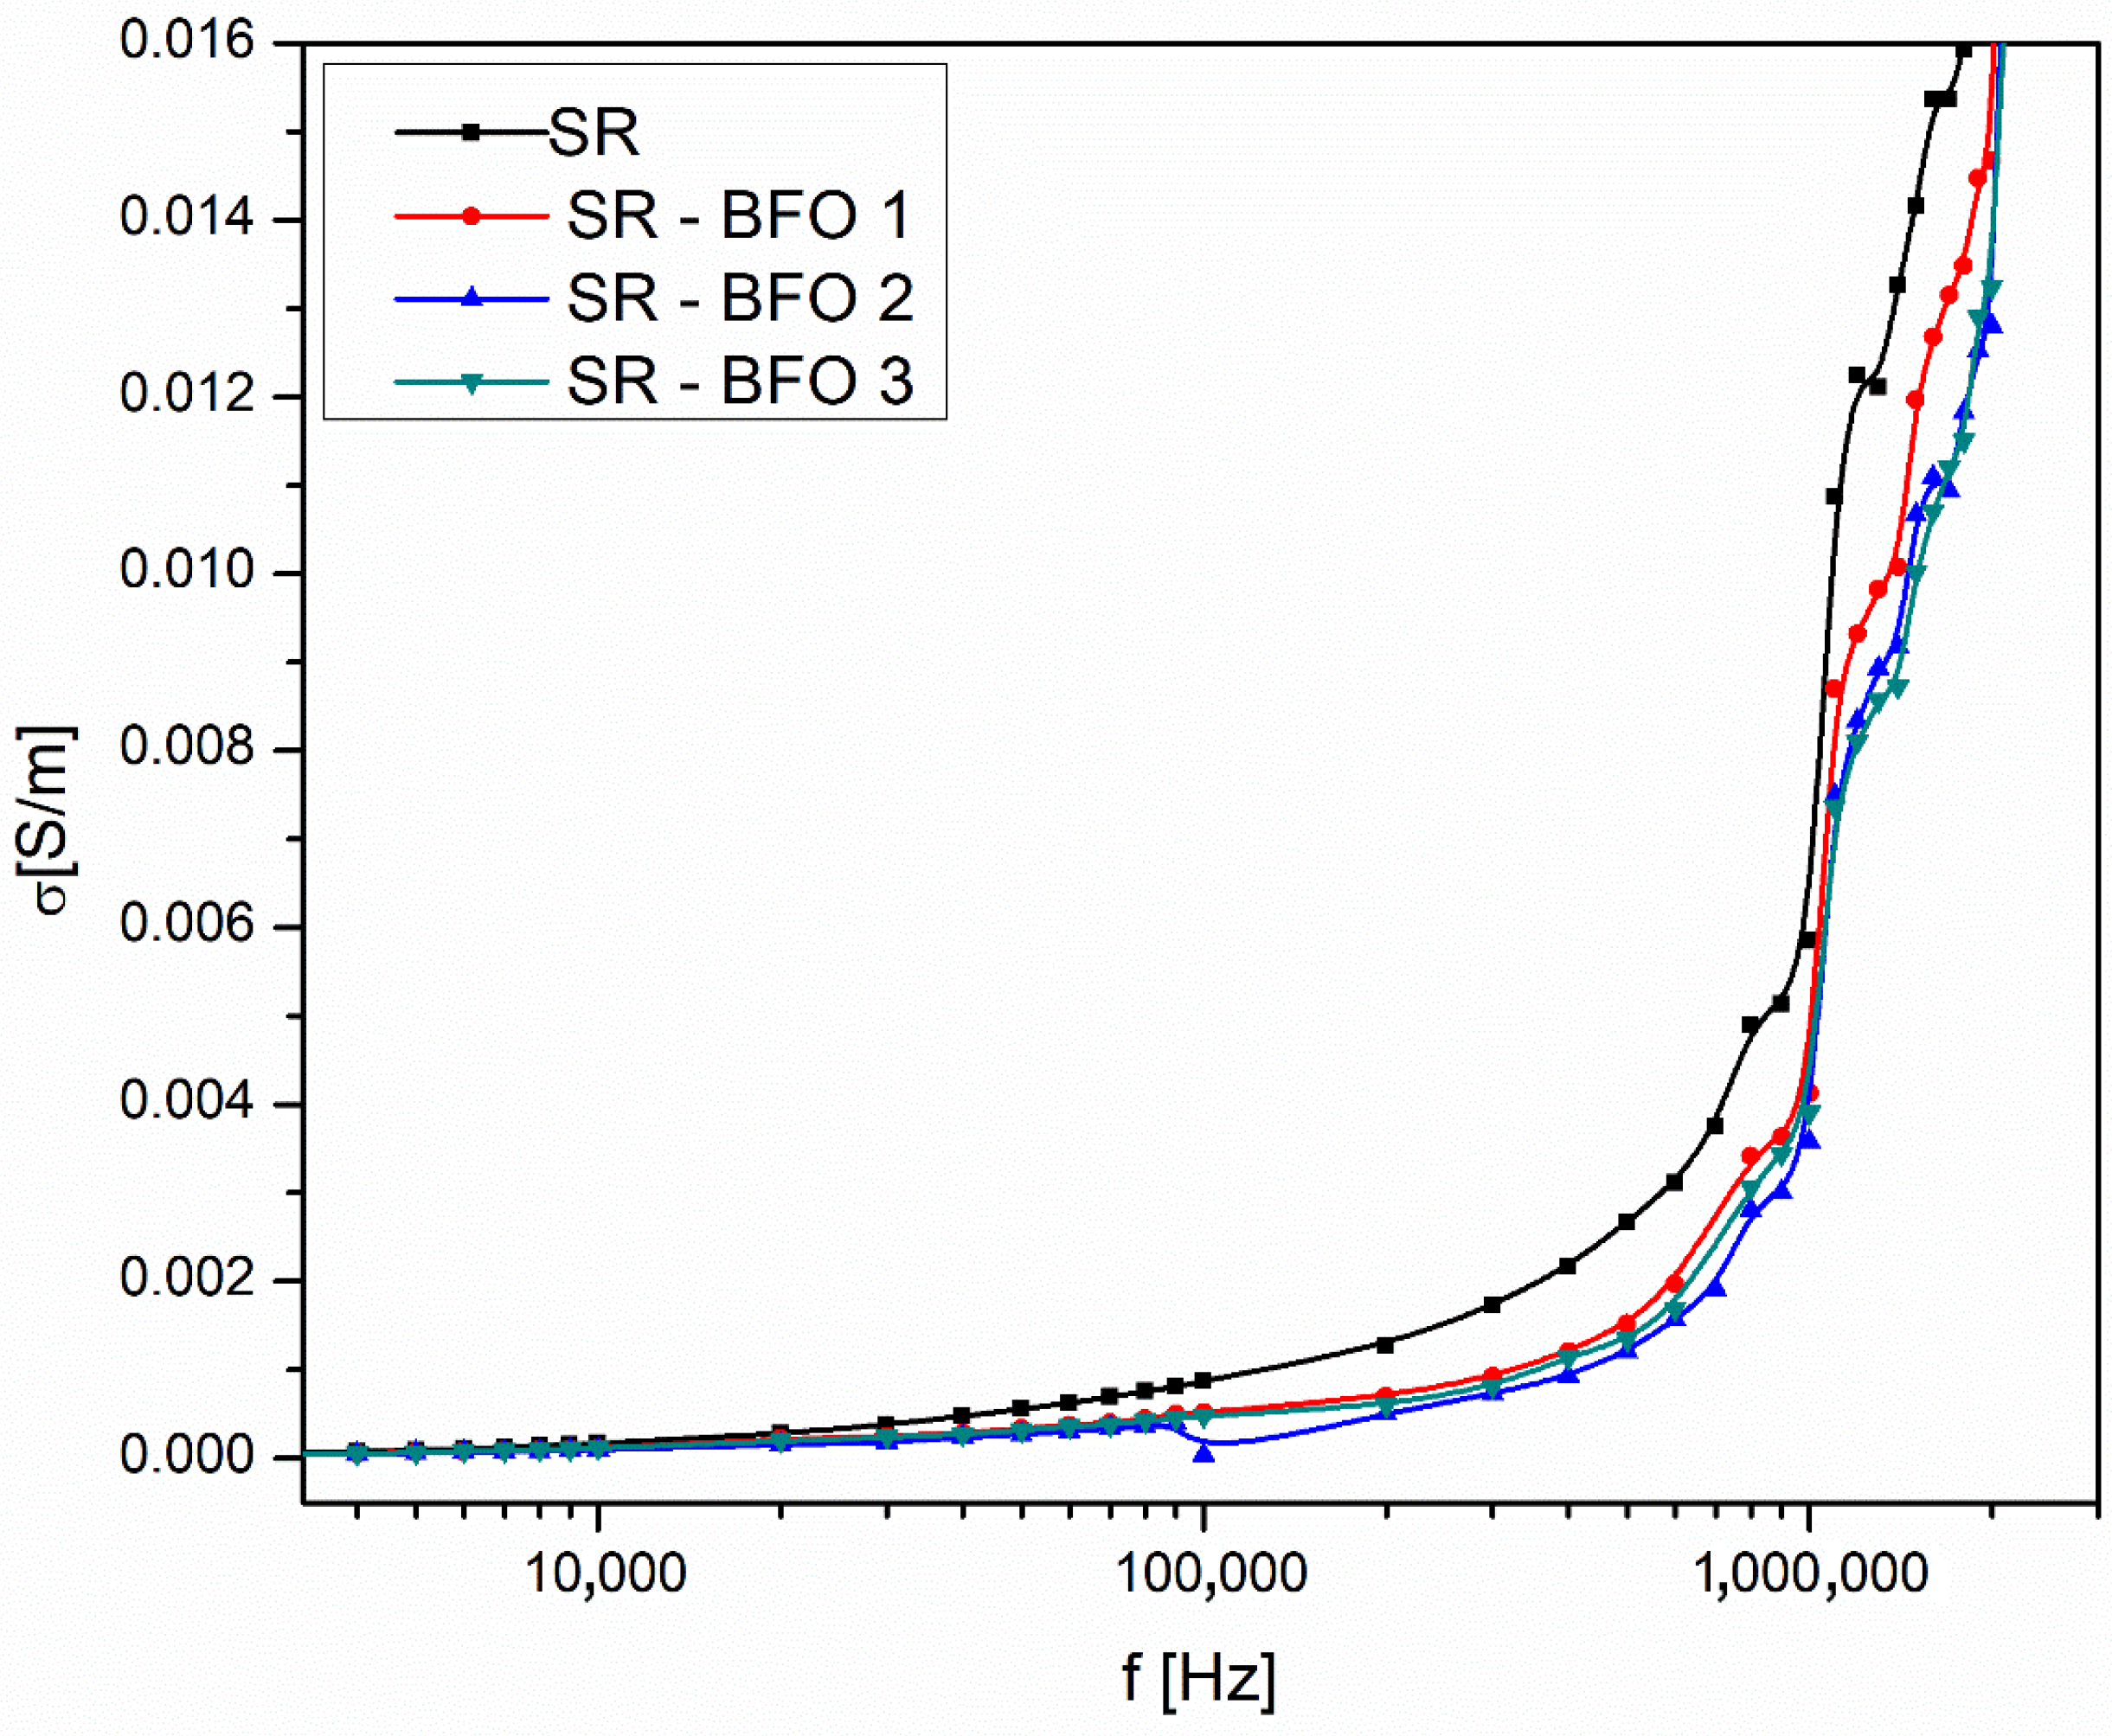
From the frequency dependence of conductivity (
Figure 5), we determined the DC conductivity (σ
DC) for all samples by identifying the low-frequency plateau region, and the results are presented in
Table 1.
While BiFeO
3 has a higher electrical conductivity compared to Bi
25FeO
40, the samples with a higher concentration of Bi
25FeO
40 exhibit better overall conductivity in this study (see
Table 1). This phenomenon can be attributed to the significantly smaller particle size of Bi
25FeO
40 in our case, which allows for improved dispersion within the silicone rubber matrix. The finer Bi
25FeO
40 particles create a more uniform distribution throughout the composite, leading to enhanced connectivity between conductive pathways. In contrast, the larger BiFeO
3 particles tend to agglomerate, reducing the effective charge transport network. Therefore, the improved dispersion of Bi
25FeO
40 allows for more effective charge flow inside the polymer, which ultimately results in increased conductivity.
According to the correlated barrier hopping (CBH) model [
31], the frequency dependence of the conductivity (σ(ω)) is described by the following expression:
where A(T) is a temperature-dependent parameter, and the exponent parameter n is a frequency exponent with values between 0 and 1. In the dispersion region corresponding to high frequencies (f > 100 kHz, in
Figure 5), the alternating conductivity follows this equation. By taking the logarithm of this equation, the following relationship is obtained:
which shows a linear dependence between ln(σ
AC) and ln(ω).
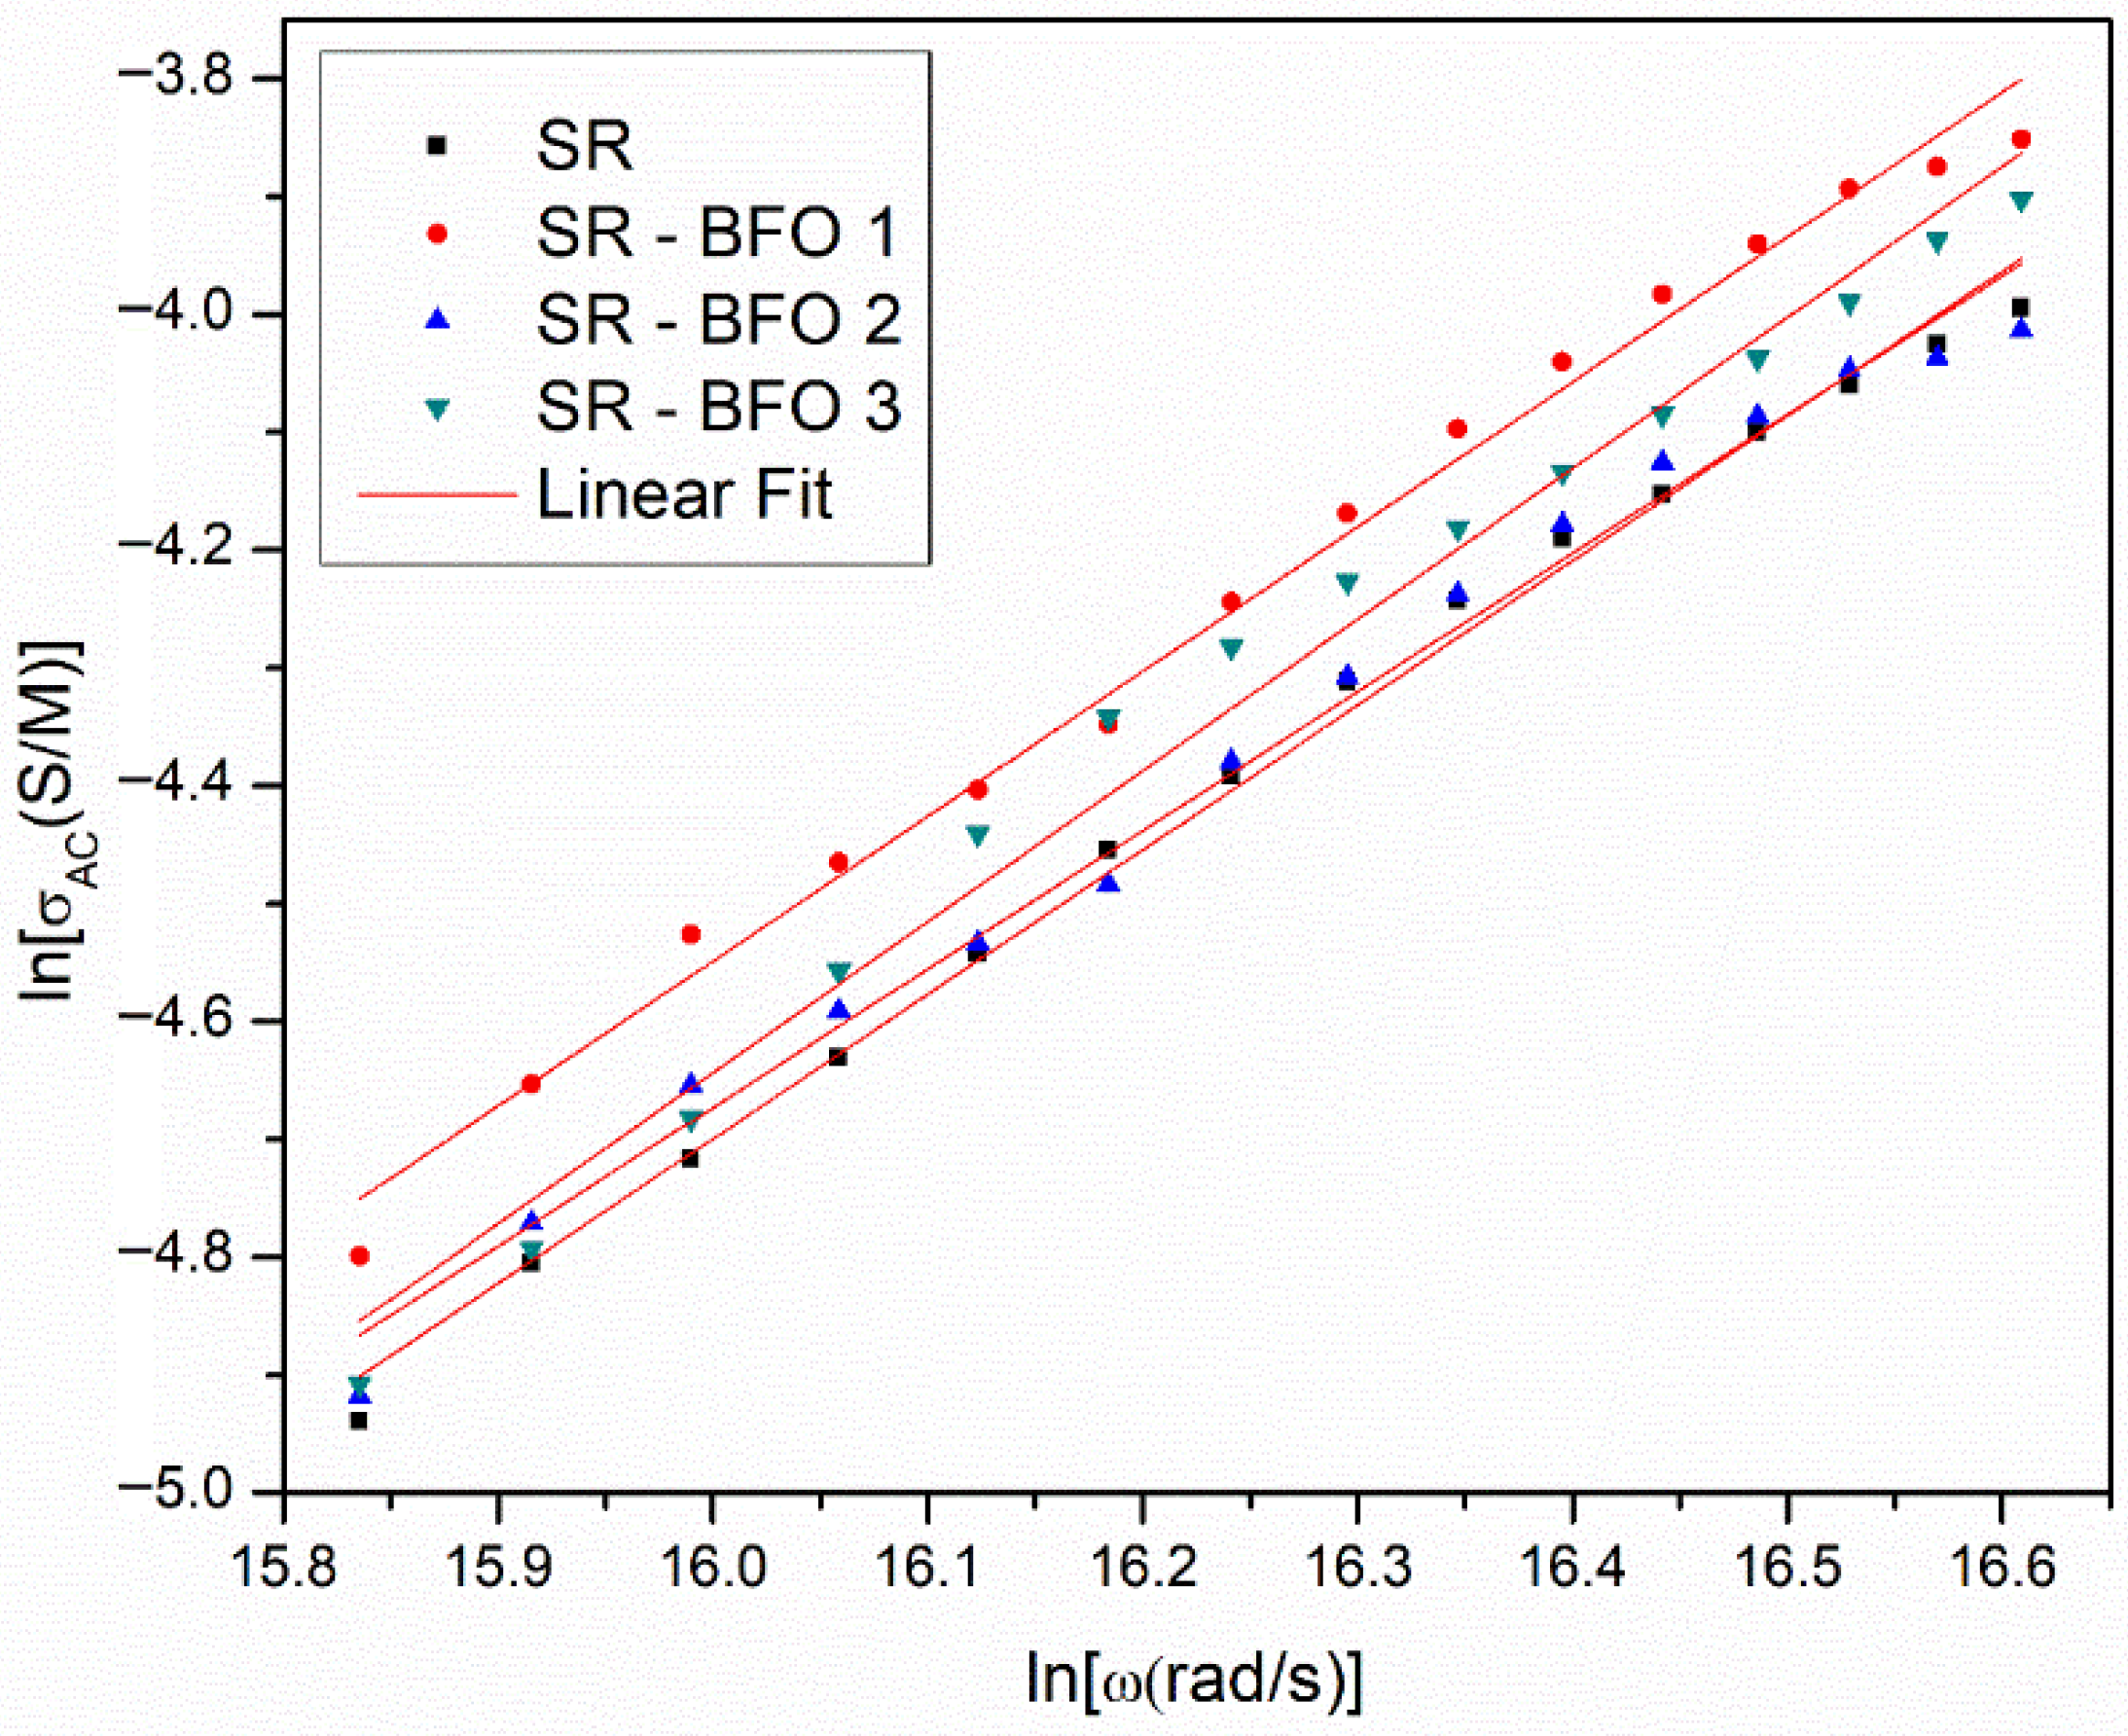
Figure 6 illustrates the experimental dependence of ln(σ
AC) and ln(ω) for each sample at room temperature and in the high-frequency range (f > 100 kHz), where the equation is valid. By fitting the experimental data points in
Figure 6 with a linear dependence, the slope obtained from the fit corresponds to the exponent n, and the intercept corresponds to ln(A).
Following the CBH model, the exponent n can be approximated as:
where W
m is the maximum energy of the potential barrier. Knowing the value of the exponent n and assuming T = 300 K, the values presented in
Table 1 are obtained for each of the 4 samples.
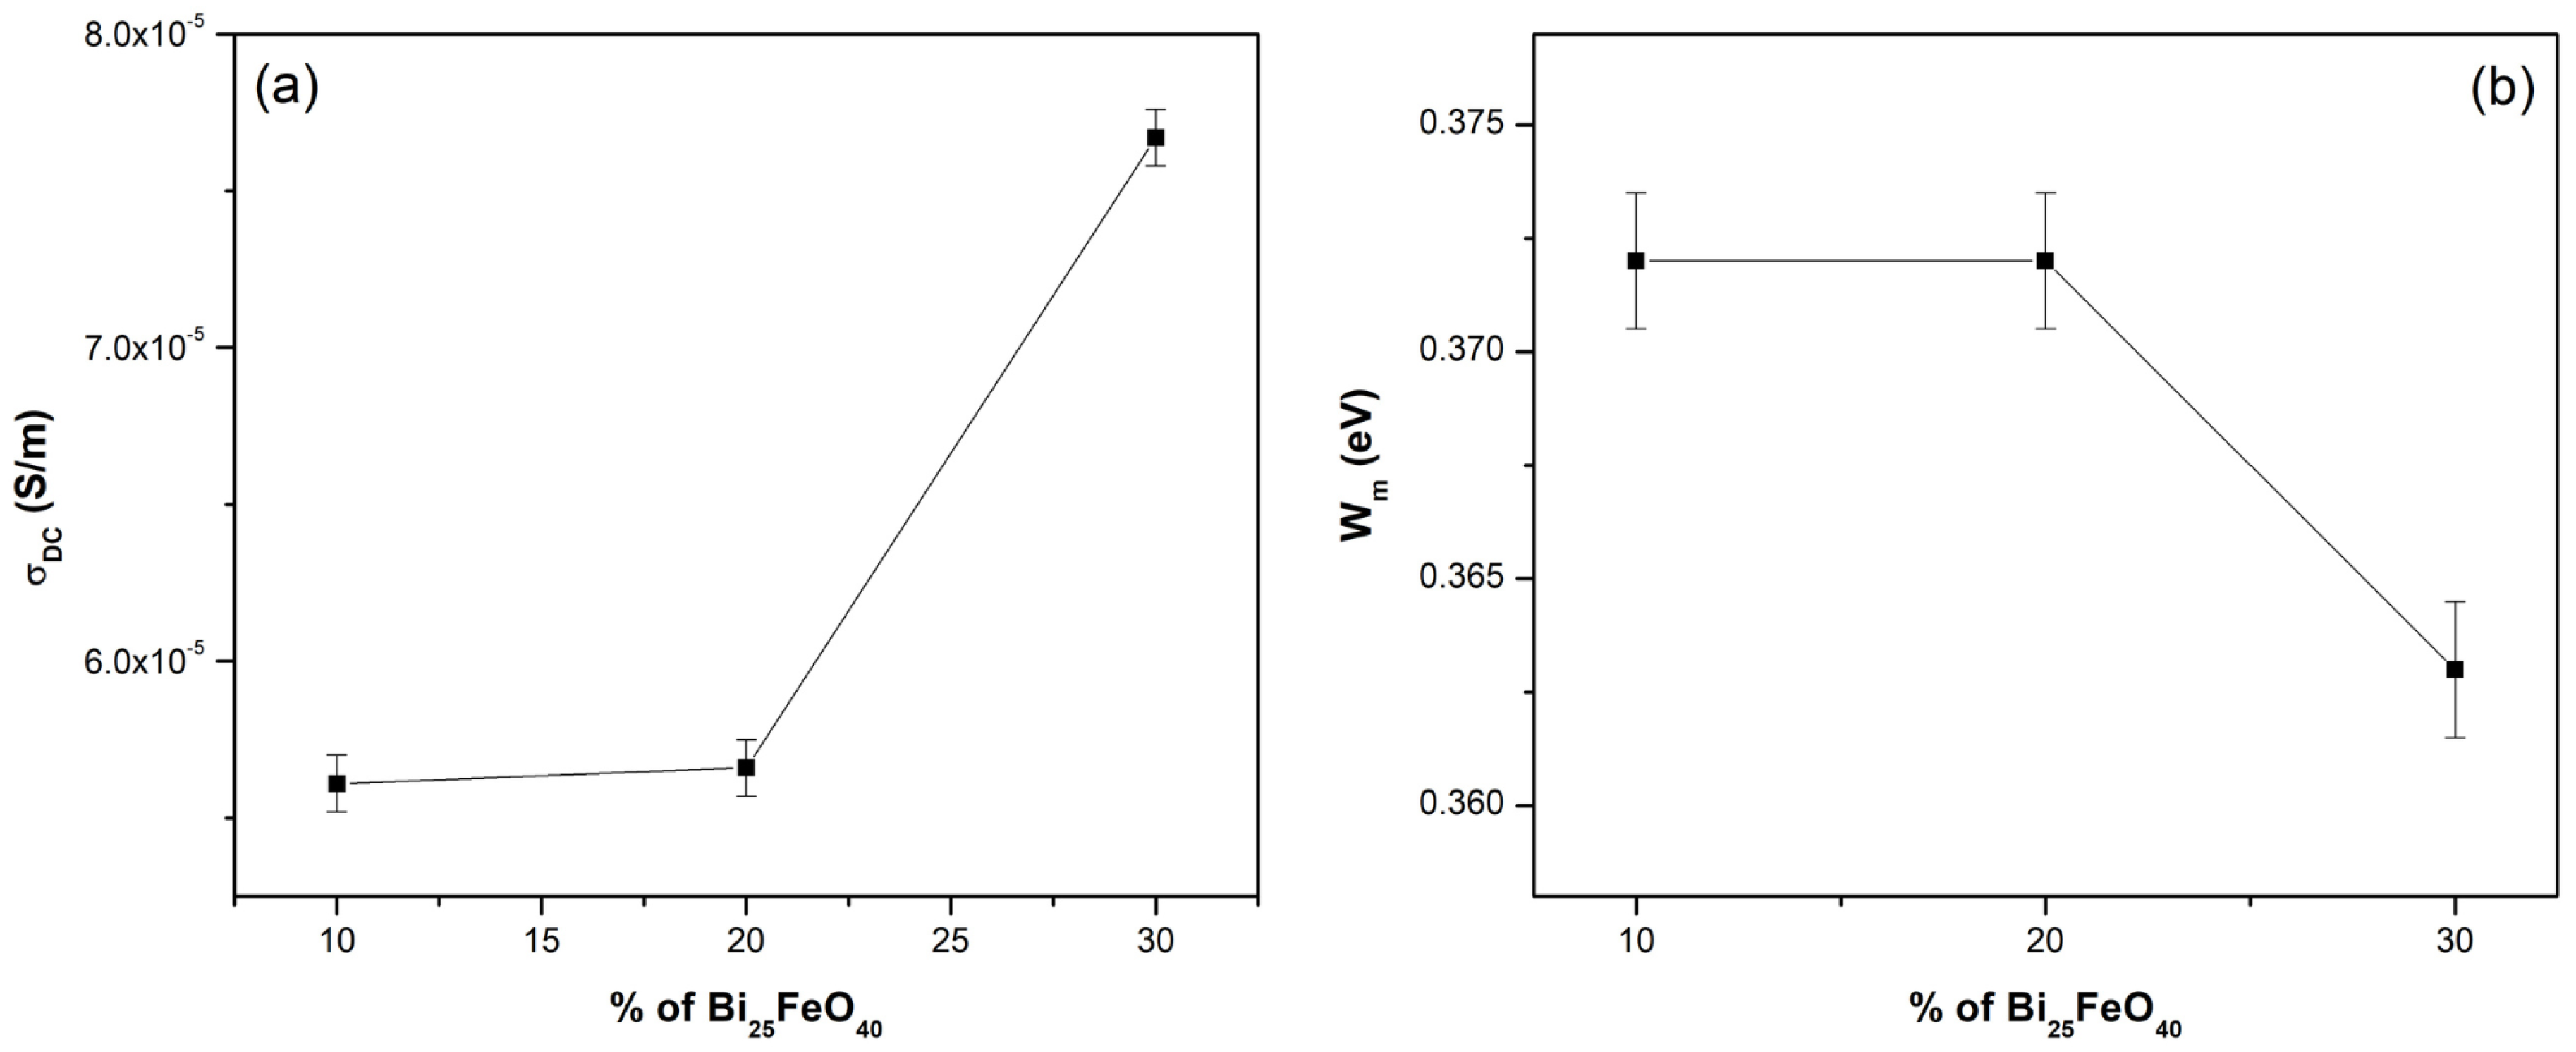
To have a suggestive picture of the dependence of σ
DC and W
m on the secondary phase concentration (Bi
25FeO
40), the experimental results were graphically presented in
Figure 7. The experimental data are spline-interpolated, providing a smooth representation of the trend. It shows that sample SR-BFO
3 exhibits the lowest energy of the potential barrier among the compared materials, indicating a reduced energy requirement for charge carrier excitation. This narrower band gap is consistent with the enhanced electrical conductivity observed in previous measurements, suggesting that SR-BFO
3 allows more efficient carrier transport.
3.5. Temperature Dependence of Conductivity
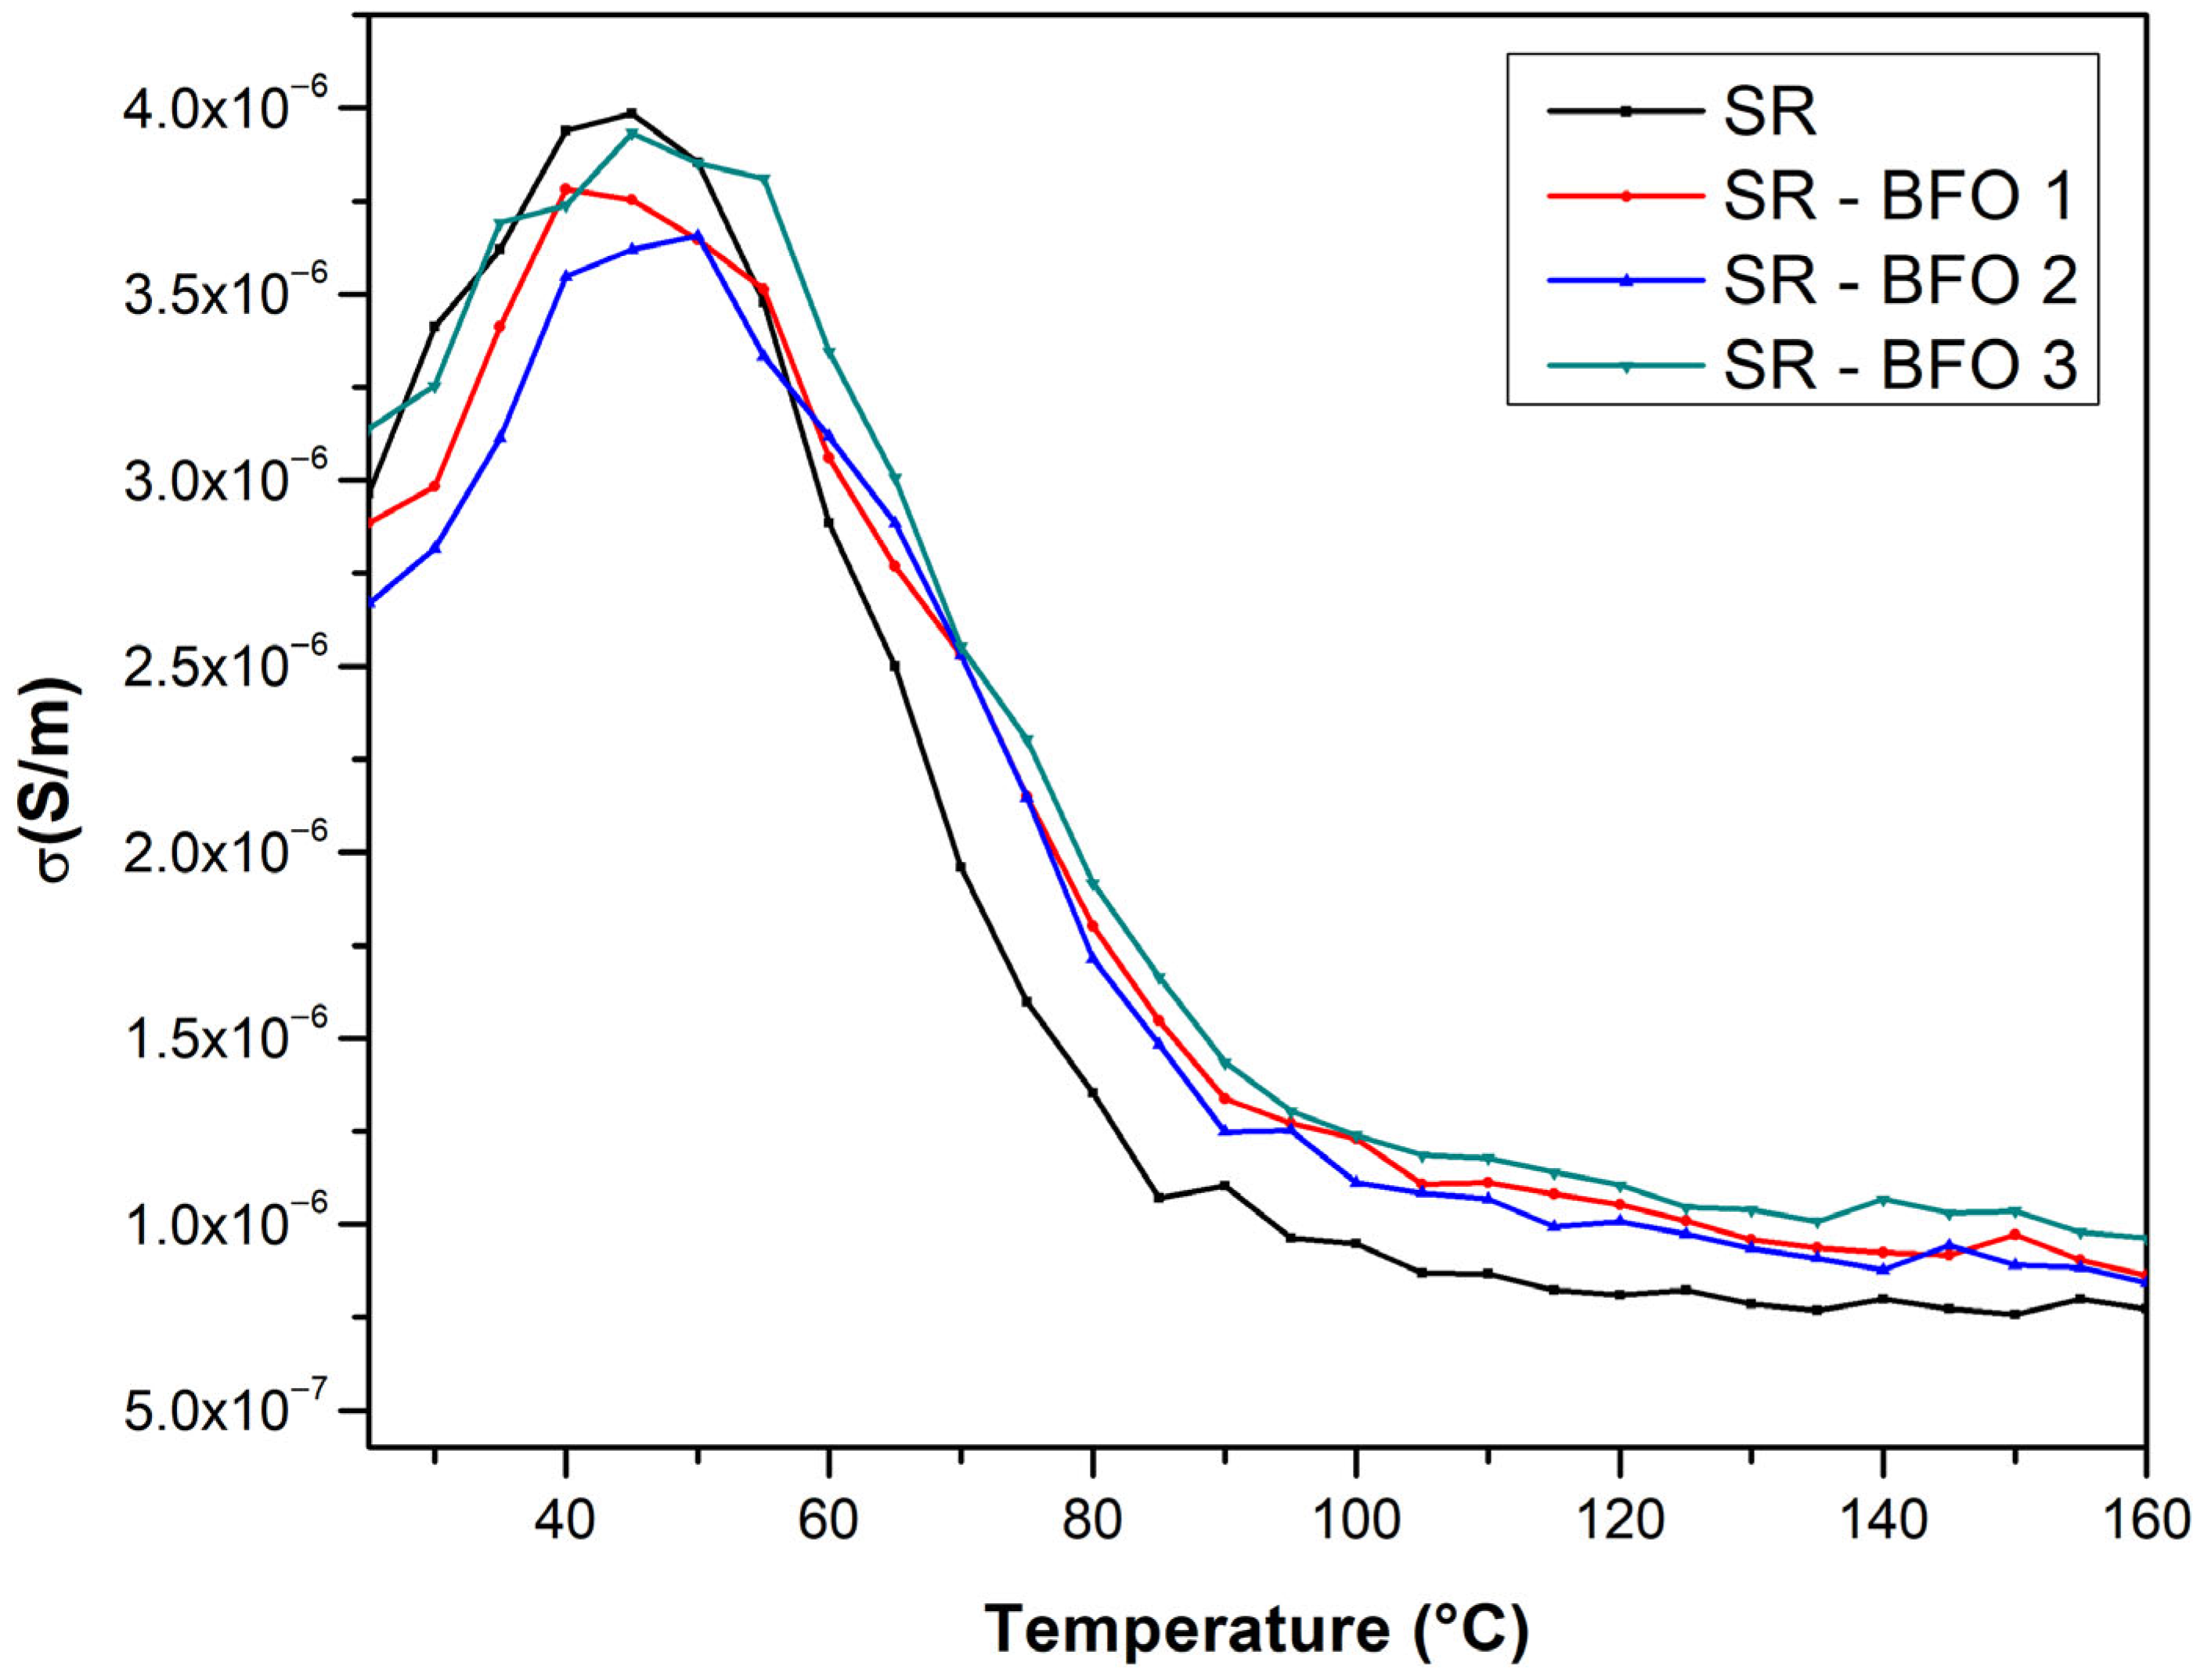
The temperature dependence of the electrical conductivity of the samples was also measured, from room temperature to 160 °C, and plotted in
Figure 8.
From the temperature dependence of the electrical conductivity of samples, two distinct conduction regimes can be identified. At lower temperatures, the electrical conductivity increases with temperature, thus exhibiting a semiconductor behavior up to approximately 50 °C. As the temperature increases, electrical conductivity decreases with temperature, revealing a metal-like behavior.
To determine the activation energy for electrical conduction, over the region with semiconductor-like behavior, the Arrhenius model was applied for the first part of the temperature range:
Calculating the logarithm for Equation (4), we obtain:
By plotting ln(σ) versus , a linear fit was performed, and the activation energy Ea was extracted from the slope . This approach enables a direct evaluation of the energy barrier associated with thermally activated conduction over the semiconductor-like behavior of the studied samples.
To further investigate the conduction mechanism at higher temperatures, the small polaron hopping (SPH) model [
32] was applied. According to this model, the temperature dependence of conductivity is given by:
Taking the natural logarithm of Equation (6) results in:
By plotting ln
versus
, a linear fit was performed to extract the activation energy, E
a, from the slope. Compared to the Arrhenius analysis at lower temperatures, which indicated a smaller activation energy, this polaron-based model reveals a higher energy barrier in the high-temperature region as shown in
Table 2. The increase in E
a suggests a transition to a conduction mechanism where carriers require additional energy to hop between more localized states, likely influenced by increased structural constraints or stronger localization effects within the composite matrix.
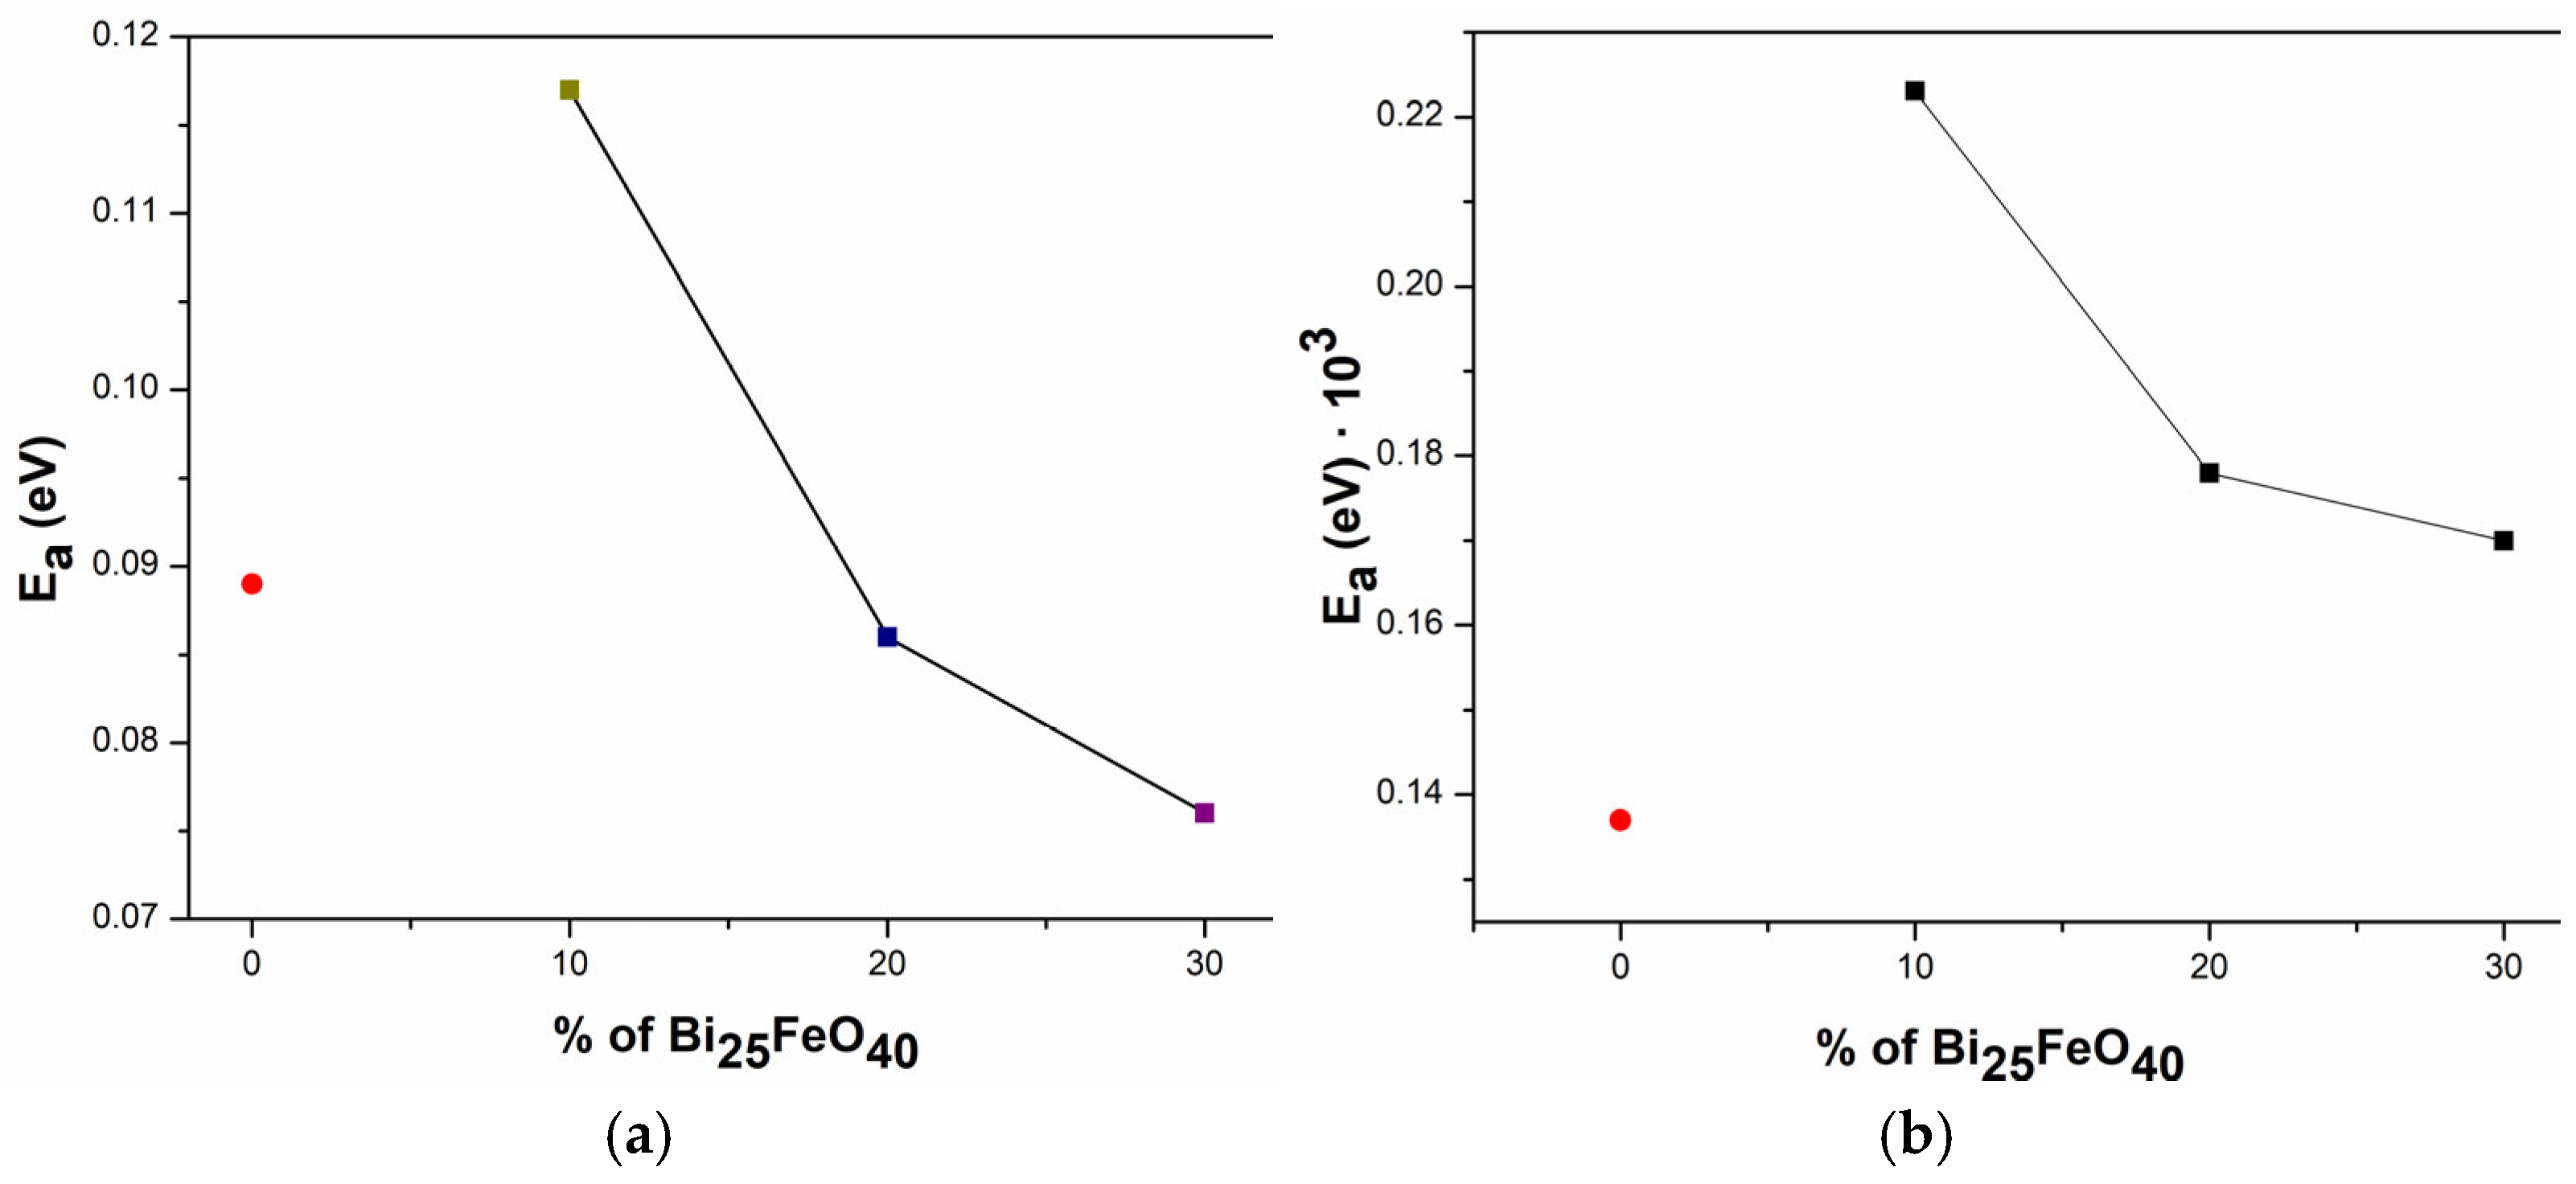
Figure 9a presents the activation energy (
Ea) values determined using the Arrhenius model, while
Figure 9b presents the activation energy (
Ea) values extracted using the polaron hopping model, revealing a clear correlation between electrical conductivity and thermal activation behavior. The sample exhibiting the lowest E
a also demonstrates the highest electrical conductivity, indicating that charge carriers require less thermal energy to participate in conduction.
3.6. Aging and Thermal Stability
A silicone rubber composite sample was subjected to a single thermal activation cycle, heated from room temperature to 200 °C at a constant rate of 2 °C/min. Upon reaching the target temperature, it was held for a fixed duration before being allowed to cool to room temperature under ambient conditions. This procedure was used to simulate aging effects under controlled thermal stress. The same electrical measurements were conducted again after this controlled temperature degradation cycle that simulates thermal aging.
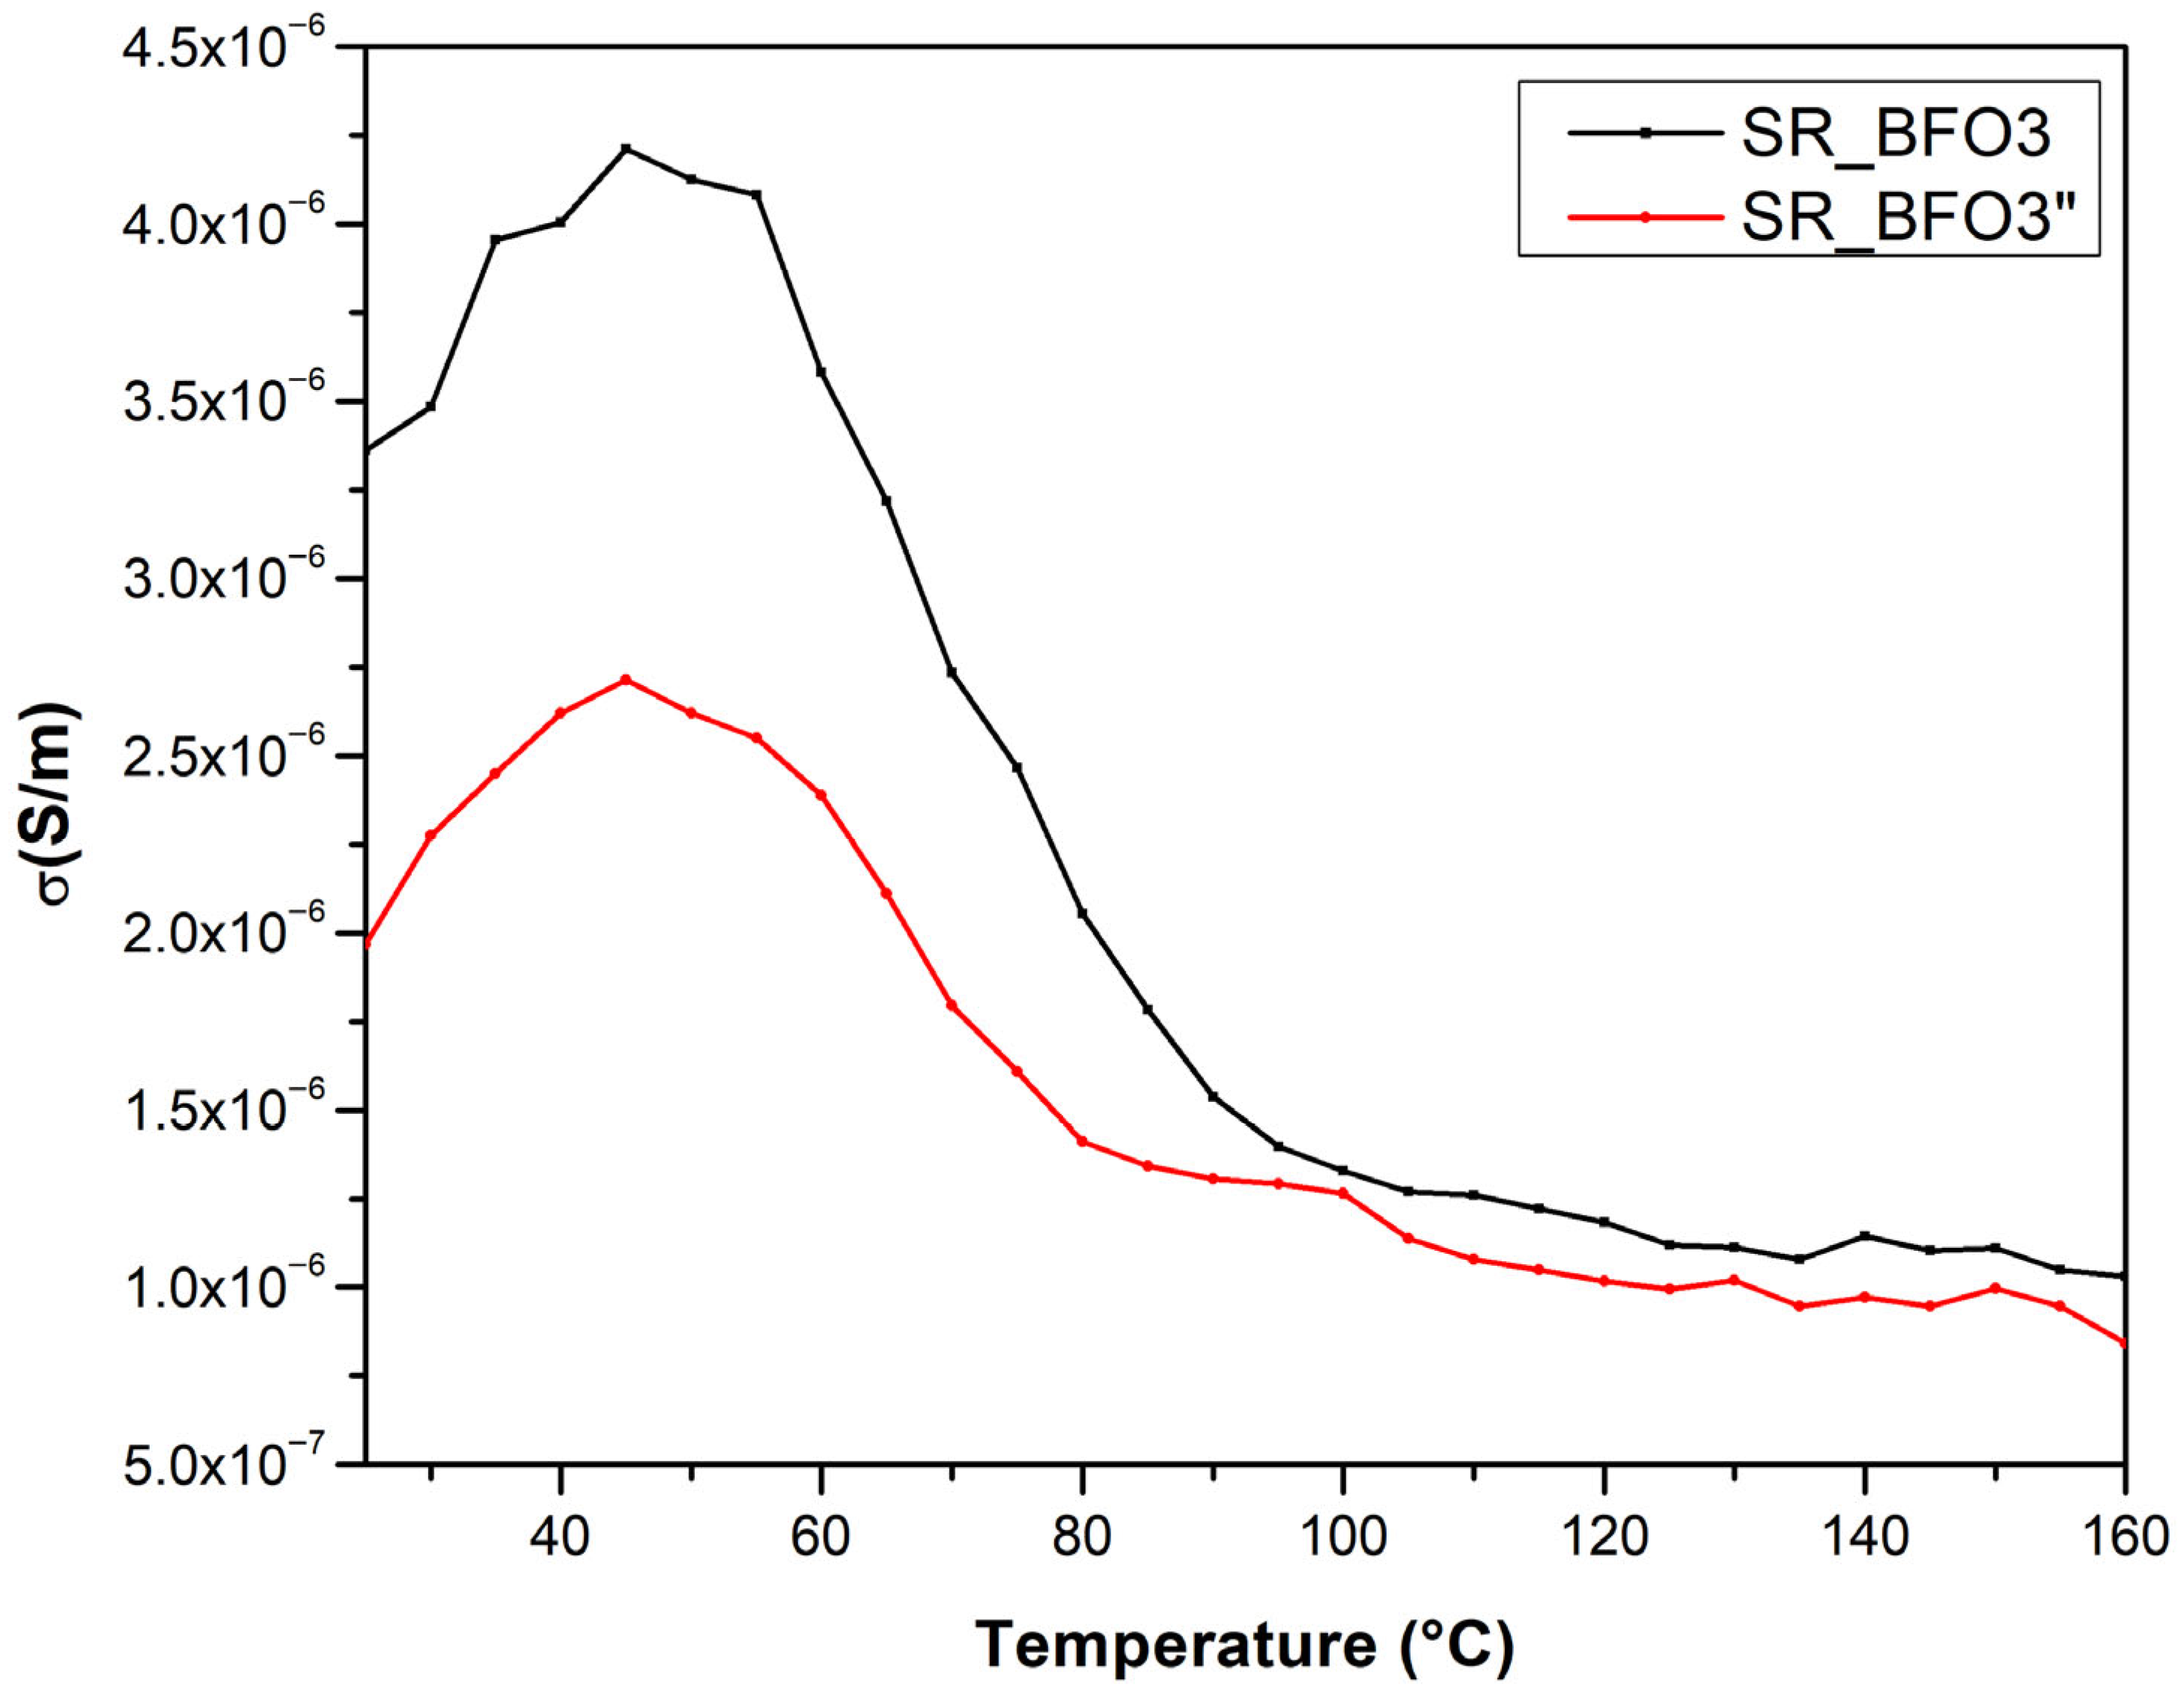
Electrical performance dropped as a result of the degradation process, which also caused an obvious decrease in conductivity values (
Figure 10). This implies that the electrical characteristics of the Bi-Fe-O-doped silicone rubber have been negatively impacted by thermal degradation, most likely as a result of the silicone rubber’s high coefficient of thermal expansion.
Expansion and contraction of the silicon matrix and conductive fillers (B-Fe-O) under temperature cycling can significantly reorganize the conductive pathways, increasing resistivity. Long-term exposure to high temperatures can further chemically or physically alter the polymer-filler interface, which can further impact charge transport and lower overall conductivity.
While electrical conductivity exhibits a pronounced degradation upon repeated thermal cycling, TG-DTA data show no significant mass change, indicating that the deterioration cannot be attributed to mass loss or major structural disintegration. Instead, these observations suggest that subtler mechanisms, such as microcrack formation, chain scission, crosslinking, or defect migration within the polymer matrix, may be responsible for the progressive decline in conductivity. Such processes can compromise charge transport pathways without manifesting as measurable mass variation in the DTA profile.
4. Conclusions
In this study, three composite samples were manufactured by inserting the same amount of BiFeO3/Bi25FeO40 powders (each powder having a different concentration of the secondary phase, Bi25FeO40: 10%, 20%, and 30%) into a silicone rubber (SR) matrix. Based on frequency and temperature dependencies for both the resistance, R, and the inductive reactance, X, of all samples that were measured at frequencies between 0.5 kHz to 2 MHz, we determined electrical conductivity (σ) for SR and the three composite samples.
The frequency dependence of conductivity, σ(f), shows two main regions: a low-frequency region where the conductivity is nearly constant, corresponding to the DC conductivity (σDC), and a high-frequency region where the conductivity increases with frequency due to AC effects (σAC). An increase in Bi25FeO40 concentration, from 10% to 30%, resulted in a rise in DC conductivity from 5.61 × 10⁻⁵ S/m to 7.67 × 10⁻⁵ S/m across the composite samples. These results indicate that silicone rubber filled with Bi-Fe-O powders creates a framework that can be adjusted to create elastic composites that have certain electrical properties.
Using both Jonscher’s universal response and the correlated barrier hopping (CBH) model, we investigated the energy barrier for electrical conduction (Wm) in all samples. In addition, at higher temperatures, we used the polaron model to further calculate the energy barrier for charge transport. The results indicate that the energy barrier varies with bismuth ferrite concentration, suggesting that microstructural mechanisms—such as defects, microcracks, or other structural disorders—contribute to the conductivity changes in these materials.
Furthermore, an aging analysis revealed a degradation of the sample, reflecting a decline in its conductive properties over time.
This understanding can help design elastomeric composite materials with tailored conductive properties by adjusting the amount of bismuth ferrite. The potential of producing a new generation of flexible electronics and energy storage systems using Bi-Fe-O-silicone rubber composites has been proven in this work. While maintaining the silicone matrix’s mechanical flexibility, the addition of Bi-Fe-O particles significantly enhances conductivity.
Future research should investigate hybrid materials and morphologies to enhance conductivity.
Author Contributions
Conceptualization, C.C., I.M. and C.N.M.; Methodology, C.C., I.M. and C.N.M.; Software, D.U.; Validation, M.M. and C.N.M.; Formal analysis, C.C., D.U. and C.N.M.; Investigation, C.C. and C.N.M.; Data curation, C.C. and D.U.; Writing—original draft, C.C.; Writing—review & editing, M.M., I.M. and C.N.M.; Supervision, M.M. and I.M. All authors have read and agreed to the published version of the manuscript.
Funding
This research was funded by West University of Timișoara.
Data Availability Statement
The original contributions presented in this study are included in the article. Further inquiries can be directed to the corresponding author.
Acknowledgments
This work was supported by the West University of Timișoara.
Conflicts of Interest
The authors declare no conflicts of interest.
Abbreviations
The following abbreviations are used in this manuscript:
| SR | Silicone rubber |
| CBH | Correlated barrier hopping |
| TG-DTA | Thermogravimetry Differential Thermal Analysis |
| XRD | X-ray diffraction |
| SEM | Scanning electron microscope |
References
- Jiang, M.-J.; Dang, Z.-M.; Xu, H.-P. Enhanced electrical conductivity in chemically modified carbon nanotube/methylvinyl silicone rubber nanocomposite. Eur. Polym. J. 2007, 43, 4924–4930. [Google Scholar] [CrossRef]
- Wang, G.; Li, A.; Zhao, W.; Xu, Z.; Ma, Y.; Zhang, F.; Zhang, Y.; Zhou, J.; He, Q. A review on fabrication methods and research progress of superhydrophobic silicone rubber materials. Adv. Mater. Interfaces 2021, 8, 2001460. [Google Scholar] [CrossRef]
- Zak, A.K.; Hashim, A.M. Recent advances in BiFeO3-based nanostructures: Properties and applications. Coord. Chem. Rev. 2025, 523, 216297. [Google Scholar]
- Li, M.; Ning, M.; Ma, Y.; Wu, Q.; Ong, C.K. Room temperature ferroelectric, ferromagnetic and magnetoelectric properties of ba-doped BiFeO3 thin films. J. Phys. D: Appl. Phys. 2007, 40, 1603. [Google Scholar] [CrossRef]
- Gao, T.; Chen, Z.; Huang, Q.; Niu, F.; Huang, X.; Qin, L.; Huang, Y. A review: Preparation of bismuth ferrite nanoparticles and its applications in visible-light induced photocatalyses. Rev. Adv. Mater. Sci. 2015, 40, 97–109. [Google Scholar]
- Yang, S.; Martin, L.; Byrnes, S.; Conry, T.; Basu, S.; Paran, D.; Reichertz, L.; Ihlefeld, J.; Adamo, C.; Melville, A. Photovoltaic effects in BiFeO3. Appl. Phys. Lett. 2009, 95, 062909. [Google Scholar] [CrossRef]
- Gao, F.; Chen, X.; Yin, K.; Dong, S.; Ren, Z.; Yuan, F.; Yu, T.; Zou, Z.; Liu, J.M. Visible-light photocatalytic properties of weak magnetic BiFeO3 nanoparticles. Adv. Mater. 2007, 19, 2889–2892. [Google Scholar] [CrossRef]
- Wang, J.; Neaton, J.; Zheng, H.; Nagarajan, V.; Ogale, S.; Liu, B.; Viehland, D.; Vaithyanathan, V.; Schlom, D.; Waghmare, U. Epitaxial BiFeO3 multiferroic thin film heterostructures. Science 2003, 299, 1719–1722. [Google Scholar] [CrossRef]
- Valant, M.; Axelsson, A.-K.; Alford, N. Peculiarities of a solid-state synthesis of multiferroic polycrystalline BiFeO3. Chem. Mater. 2007, 19, 5431–5436. [Google Scholar] [CrossRef]
- Qi, J.; Ma, N.; Ma, X.; Adelung, R.; Yang, Y. Enhanced photocurrent in BiFeO3 materials by coupling temperature and thermo-phototronic effects for self-powered ultraviolet photodetector system. ACS Appl. Mater. Interfaces 2018, 10, 13712–13719. [Google Scholar] [CrossRef] [PubMed]
- Mushtaq, F.; Chen, X.; Hoop, M.; Torlakcik, H.; Pellicer, E.; Sort, J.; Gattinoni, C.; Nelson, B.J.; Pane, S. Piezoelectrically enhanced photocatalysis with BiFeO3 nanostructures for efficient water remediation. Iscience 2018, 4, 236–246. [Google Scholar] [CrossRef]
- Casut, C.; Malaescu, I.; Marin, C.N.; Miclau, M. The effect of Bi2O3 and Fe2O3 impurity phases in bifeo3 perovskite materials on some electrical properties in the low-frequency field. Materials 2022, 15, 4764. [Google Scholar] [CrossRef]
- Song, Y.-J.; Bi, X.-Y.; Xia, P.; Sun, F.; Chen, Z.-X.; Zhang, X.-Y.; Zhang, T. A simple one-pot method for the synthesis of BiFeO3/Bi25FeO40 heterojunction for high-performance photocatalytic degradation applications. Int. J. Mol. Sci. 2024, 26, 196. [Google Scholar] [CrossRef]
- Wu, R.; Hou, H.; Liu, X.; Bai, C.; Yu, X.; Xiong, S. In-situ sulfurization of Bi2Fe4O9/Bi25FeO40 electrode for high-performance supercapacitors. J. Mol. Struct. 2025, 1332, 141704. [Google Scholar] [CrossRef]
- Jebari, H.; Tahiri, N.; Boujnah, M.; Bounagui, O.E.; Boudad, L.; Taibi, M.; Ez-Zahraouy, H. Structural, optical, dielectric, and magnetic properties of iron-sillenite Bi25FeO40. Appl. Phys. A 2022, 128, 842. [Google Scholar] [CrossRef]
- Wang, L.; Zeng, P.; Zhu, C.; Yu, G.; Cui, H.; Wang, R. Insight into the low-temperature electrical polarization behavior of multiferroic Bi2Fe4O9. Ceram. Int. 2023, 49, 38264–38269. [Google Scholar] [CrossRef]
- Pooladi, M.; Sharifi, I.; Behzadipour, M. A review of the structure, magnetic and electrical properties of bismuth ferrite (Bi2Fe4O9). Ceram. Int. 2020, 46, 18453–18463. [Google Scholar] [CrossRef]
- Perejón, A.; Gil-González, E.; Sánchez-Jiménez, P.E.; West, A.R.; Pérez-Maqueda, L.A. Electrical properties of bismuth ferrites: Bi2Fe4O9 and Bi25FeO39. J. Eur. Ceram. Soc. 2019, 39, 330–339. [Google Scholar] [CrossRef]
- Orr, G.; Gorychev, A.; Ishai, P.B. Complex dielectric behaviours in BiFeO3/Bi2Fe4O9 ceramics. Appl. Phys. A 2022, 128, 1095. [Google Scholar] [CrossRef]
- Kirsch, A.; Strapasson, G.B.; Lefeld, N.; Gogolin, M.; Videbæk, M.C.; Banerjee, S.; Bordallo, H.N.; Jensen, K.M. Control of crystallization pathways in the BiFeO3–Bi2Fe4O9 system. Chem. Mater. 2024, 37, 338–348. [Google Scholar] [CrossRef] [PubMed]
- Catalan, G.; Scott, J.F. Physics and applications of bismuth ferrite. Adv. Mater. 2009, 21, 2463–2485. [Google Scholar] [CrossRef]
- Clyne, T.W.; Hull, D. An Introduction to Composite Materials; Cambridge University Press: Cambridge, UK, 2019. [Google Scholar]
- Han, R.; Li, Y.; Zhu, Q.; Niu, K. Research on the preparation and thermal stability of silicone rubber composites: A review. Compos. Part C Open Access 2022, 8, 100249. [Google Scholar] [CrossRef]
- Kumar, V.; Alam, M.N.; Manikkavel, A.; Song, M.; Lee, D.-J.; Park, S.-S. Silicone rubber composites reinforced by carbon nanofillers and their hybrids for various applications: A review. Polymers 2021, 13, 2322. [Google Scholar] [CrossRef]
- Polmanteer, K. Current perspectives on silicone rubber technology. Rubber Chem. Technol. 1981, 54, 1051–1080. [Google Scholar] [CrossRef]
- Qian, H.; Jiang, B. Silicone resin applications for heat-resistant coatings: A review. Polym. Sci. Ser. C 2023, 65, 206–219. [Google Scholar] [CrossRef]
- Kashi, S.; Varley, R.; De Souza, M.; Al-Assafi, S.; Di Pietro, A.; de Lavigne, C.; Fox, B. Mechanical, thermal, and morphological behavior of silicone rubber during accelerated aging. Polym.-Plast. Technol. Eng. 2018, 57, 1687–1696. [Google Scholar] [CrossRef]
- Ghanbari-Siahkali, A.; Mitra, S.; Kingshott, P.; Almdal, K.; Bloch, C.; Rehmeier, H.K. Investigation of the hydrothermal stability of cross-linked liquid silicone rubber (lsr). Polym. Degrad. Stab. 2005, 90, 471–480. [Google Scholar] [CrossRef]
- Zhou, W.; Qi, S.; Tu, C.; Zhao, H. Novel heat-conductive composite silicone rubber. J. Appl. Polym. Sci. 2007, 104, 2478–2483. [Google Scholar] [CrossRef]
- Bi, M.; Qiu, R.; Duan, S.; Deng, R.; Chen, X.; Jiang, T. Effects of hygrothermal conditions on corona aging of silicone rubber. IEEE Trans. Dielectr. Electr. Insul. 2024, 32, 992–1000. [Google Scholar] [CrossRef]
- Pike, G. Ac conductivity of scandium oxide and a new hopping model for conductivity. Phys. Rev. B 1972, 6, 1572. [Google Scholar] [CrossRef]
- Natanzon, Y.; Azulay, A.; Amouyal, Y. Evaluation of polaron transport in solids from first-principles. Isr. J. Chem. 2020, 60, 768–786. [Google Scholar] [CrossRef]
| Disclaimer/Publisher’s Note: The statements, opinions and data contained in all publications are solely those of the individual author(s) and contributor(s) and not of MDPI and/or the editor(s). MDPI and/or the editor(s) disclaim responsibility for any injury to people or property resulting from any ideas, methods, instructions or products referred to in the content. |
© 2025 by the authors. Licensee MDPI, Basel, Switzerland. This article is an open access article distributed under the terms and conditions of the Creative Commons Attribution (CC BY) license (https://creativecommons.org/licenses/by/4.0/).
