Article

First-Principles Study of Structural, Elastic, and Optical Properties of Trigonal CaCO3 Under Pressure

1
School of Materials Engineering, Yancheng Institute of Technology, Yancheng 224051, China
2
College of Electronic and Information Engineering, Yangtze Normal University, Chongqing 408000, China
*
Author to whom correspondence should be addressed.
Crystals 2025, 15(8), 712; https://doi.org/10.3390/cryst15080712 (registering DOI)
Submission received: 17 June 2025 / Revised: 23 July 2025 / Accepted: 30 July 2025 / Published: 4 August 2025

Abstract

Calcium carbonate (CaCO3) has attracted considerable attention owing to its structural versatility and broad applications in materials science and geochemistry. In this study, we employed Density Functional Theory (DFT) simulations to systematically investigate the structural, elastic, and dynamic properties of trigonal CaCO3 under hydrostatic pressures ranging from 0 to 1.2 GPa. The optimized lattice constants closely align with previous theoretical and experimental values, thereby confirming the reliability of the computational approach. Mechanical stability was validated across the entire pressure range, with elastic constants and moduli demonstrating gradual increases under compressive strain. Elastic anisotropy was rigorously quantified using universal anisotropy indices, three-dimensional surface visualizations, and directional projections of elastic moduli. These analyses revealed pronounced pressure-dependent anisotropy. Furthermore, optical properties, including refractive indices and dielectric functions, were analyzed to clarify pressure-induced variations in electromagnetic interactions. These findings offer valuable insights into the pressure behavior of CaCO3, advancing its potential applications in advanced functional materials and geophysical research.

1. Introduction

Calcium carbonate (CaCO3), a ubiquitous natural mineral, plays a pivotal role in the CaO-CO2 system [1]. Crystallographic analysis reveals its polymorphism, with three anhydrous forms—calcite (trigonal), aragonite (orthorhombic), and vaterite (hexagonal)—and three hydrated forms: ikaite (CaCO3·6H2O), monohydrocalcite (CaCO3·1H2O, MHC), and calcium carbonate hemihydrate (CaCO3·½H2O, CCHH) [2]. Widely extracted from limestone or synthesized via carbonation, CaCO3 is extensively used as a functional filler in the plastics and rubber industries, where it enhances mechanical stiffness, reduces production costs, and improves the thermal stability of composite materials [3,4]. In construction, CaCO3 facilitates cement carbonation hardening and lime mortar production [5,6]. Furthermore, CO2-sequestered CaCO3 suspensions reduce emissions while enhancing the performance of cement-based materials [7]. Recent biomedical advances leverage its biocompatibility for pH-responsive drug delivery systems and bone graft composites [8,9]. Additionally, CaCO3 synthesized in situ within polyacrylamide hydrogel films exhibits high transparency, excellent toughness, and tunable optical anisotropy, endowing the material with unique optical properties suitable for applications such as information encryption [10].
The physical properties of calcium carbonate (CaCO3) have garnered significant attention from theorists due to its wide range of applications in materials science and geochemistry. The crystallographic parameters of the R-3c phase of the CaCO3 compound were reported as a = b = 4.970 Å, c = 16.845 Å, and the formation enthalpy is ΔHf = −2.53 eV/atom in the open quantum materials database record [11]. Furthermore, the lattice parameters and enthalpies of generation of the same phases were recorded as a = b = 5.01 Å, c = 16.99 Å, ΔHf = −2.688 eV/atom in the material project [12]. Notably, A. K. SINGH et al. [13] observed that calcite-I transforms into calcite-II at a pressure of 1.45 GPa and a temperature of 25 °C. Similarly, D. Vo Thanh and A. Lacam [14] reported this transformation at 1.46 GPa. Furthermore, Merrill et al. [15] found the same phase transition in calcite through X-ray diffraction experiments at 1.5 GPa and 20 °C. M.G. Brik [16] employed first-principles calculations to investigate the structural, electronic, optical, and elastic properties of calcite (CaCO3) and further analyzed the effects of hydrostatic pressure on these properties. Prencipe et al. [17] successfully simulated the vibrational spectrum of calcite using ab initio quantum mechanical calculations and compared it with experimental data, demonstrating the reliability of the computational approach. Using X-ray diffraction and thermal expansion measurements, Chessin et al. [18] determined the oxygen atom positions, thermal parameters, and lattice constants in calcite, analyzing their temperature dependence to gain insights into the carbonate ion’s structure and properties. Pilati et al. [19] demonstrated the successful application of lattice dynamics to calcite, revealing insights into its vibrational and thermodynamic properties through a combination of crystallographic data and empirical potentials. Maslen et al. [20] utilized synchrotron radiation X-ray diffraction to reveal that the electron density and optical anisotropy of natural rhombohedral CaCO3 are closely related to its crystal structure and electron density distribution.
While the behavior of trigonal CaCO3 (calcite) under pressure has been studied, existing research often lacks the comprehensive scope required to fully unravel its complex response. To avoid phase transitions in calcite, this study focuses on the 0–1.2 GPa pressure range and distinguishes itself by conducting a systematic, multi-faceted investigation, explicitly incorporating detailed analysis of its elastic anisotropy and pressure-induced optical properties. This holistic approach is designed to uncover novel insights beyond those offered by previous, more limited examinations. Understanding these interlinked structural, anisotropic elastic, and optical changes is crucial for accurately modeling deep Earth processes and for exploiting pressure as a tool to discover unique functional behaviors relevant to advanced materials design. Our findings are anticipated to provide distinct perspectives and deeper understanding, thereby informing innovative applications in geophysics and materials science.

2. Method

For this study, Density Functional Theory (DFT), as implemented in the CASTEP code [21,22], was employed to perform calculations on CaCO3. The Perdew-Burke-Ernzerhof generalized gradient approximation (GGA) [23] and norm-conserving pseudopotentials [24] were used to describe electronic exchange–correlation interactions and ion–electron interactions, respectively. A plane-wave energy cutoff of 630 eV was applied throughout all calculations. Sampling of the irreducible Brillouin zone (BZ) was conducted using a Monkhorst–Pack k-point grid of 8 × 8 × 2. During geometry optimization with CASTEP, the lattice parameters were constrained to maintain trigonal symmetry (a = b, α = β = 90°, γ = 120°). The key parameters employed include an electronic energy convergence tolerance of 5.0 × 10⁻⁶ eV/atom, alongside ionic convergence criteria of a maximum force of 0.01 eV/Å, maximum stress of 0.02 GPa, and maximum displacement of 5.0 × 10⁻⁴ Å. These parameters ensured excellent convergence accuracy.

3. Results and Discussion

3.1. Structural Properties

A representation of the trigonal crystal system CaCO3 with the space group R-3c is presented in Figure 1. The CaCO3 crystal comprises three distinct atomic sites, namely C at 6a, Ca at 6b, and O at 18e. The initial step involved optimizing the crystal structure. The optimized equilibrium lattice constants (a, c), density (ρ), and volume (V) of CaCO3 are presented in Table 1, alongside corresponding experimental values and theoretical simulations for comprehensive comparison and analysis.
Table 1 delineates the structural parameters, volume (V), and density (ρ) of CaCO3 across various pressure conditions. It is evident from the table that the density of the aforementioned material undergoes a substantial increase as the pressure rises, whereas the volume experiences a gradual decline. Through geometrical optimization at 0 GPa, the lattice constants of CaCO3 were ascertained to be a = b = 5.0473 Å and c = 17.2499 Å. Under high-pressure conditions, a notable decrease in the lattice constant is observed. The computational findings presented in Table 1 are predominantly in harmony with those documented in prior theoretical studies [16,17,25] and experimental investigations [18,19,20,26]. Some discrepancies in the calculated results can be attributed to the selection of different parameters. Consequently, it can be inferred that the theoretical data presented in this study is feasible, and the parameters chosen are appropriate, thereby providing a suitable basis for further data analysis.
The pressure dependence of the lattice parameters is shown in Figure 2a. The lattice compression of CaCO3 exhibits remarkable anisotropy, with linear compressibility coefficients of K a = 2.695 TPa−1 for the a-axis and K c = 8.127 TPa−1 for the c-axis. The compressibility of K c is significantly higher than that of K a , indicating that the crystal is more easily compressed along the c-axis. These coefficients are calculated using the formula [27]:
K i   =   1 a i 0 ( d a i dP ) T
The pressure-dependent evolution of unit cell volume is presented in Figure 2b, where open circles represent interpolated values derived from Birch–Murnaghan equation of state fitting. The equation is expressed as [28]:
P   =   3 2 B 0 ( x   7 3 x   5 3 ) [ 1 + ( B 4 ) ( x   2 3 1 ) ]
where x = V/V0 denotes relative volume change, B 0 represents the bulk modulus ( B 0   =   V ( dP / dV ) T ), and B corresponds to its pressure derivative ( B   =   V ( d B 0 / dP ) T ). The calculated results are B 0 = 72.3(5) GPa and B = 2.89(2); this is in good agreement with the values obtained by M.G. Brik ( B 0 = 66.917 GPa, B = 2.698) [16].

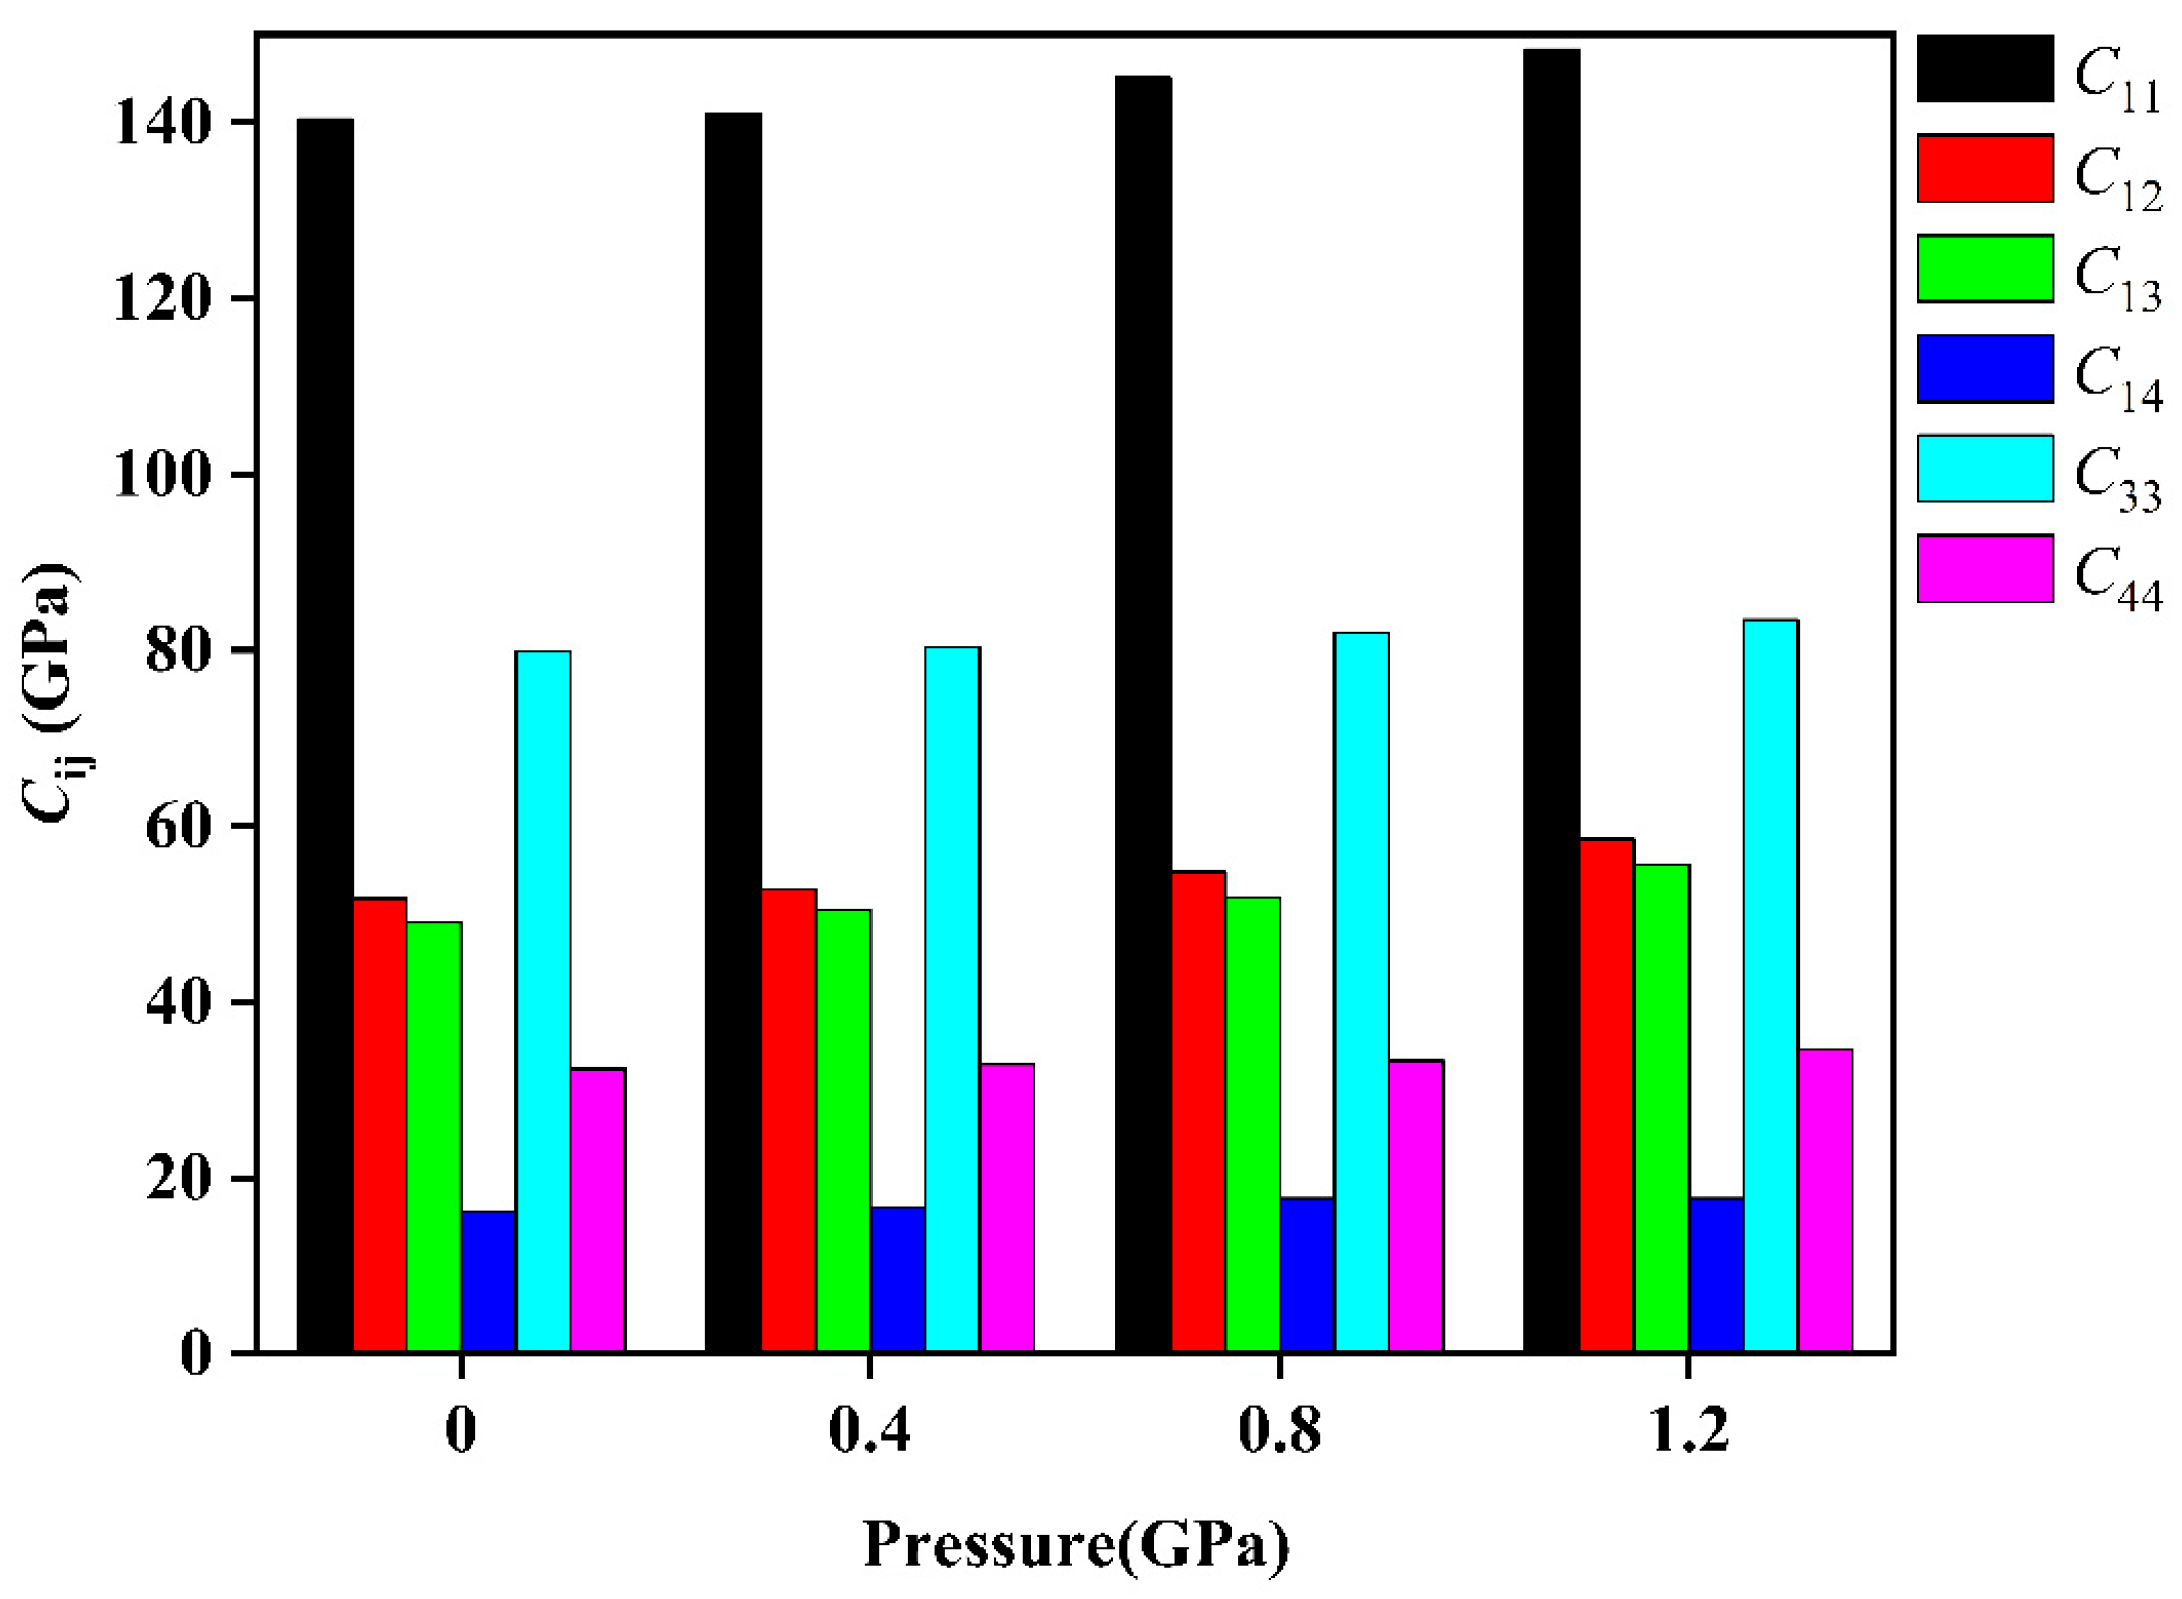
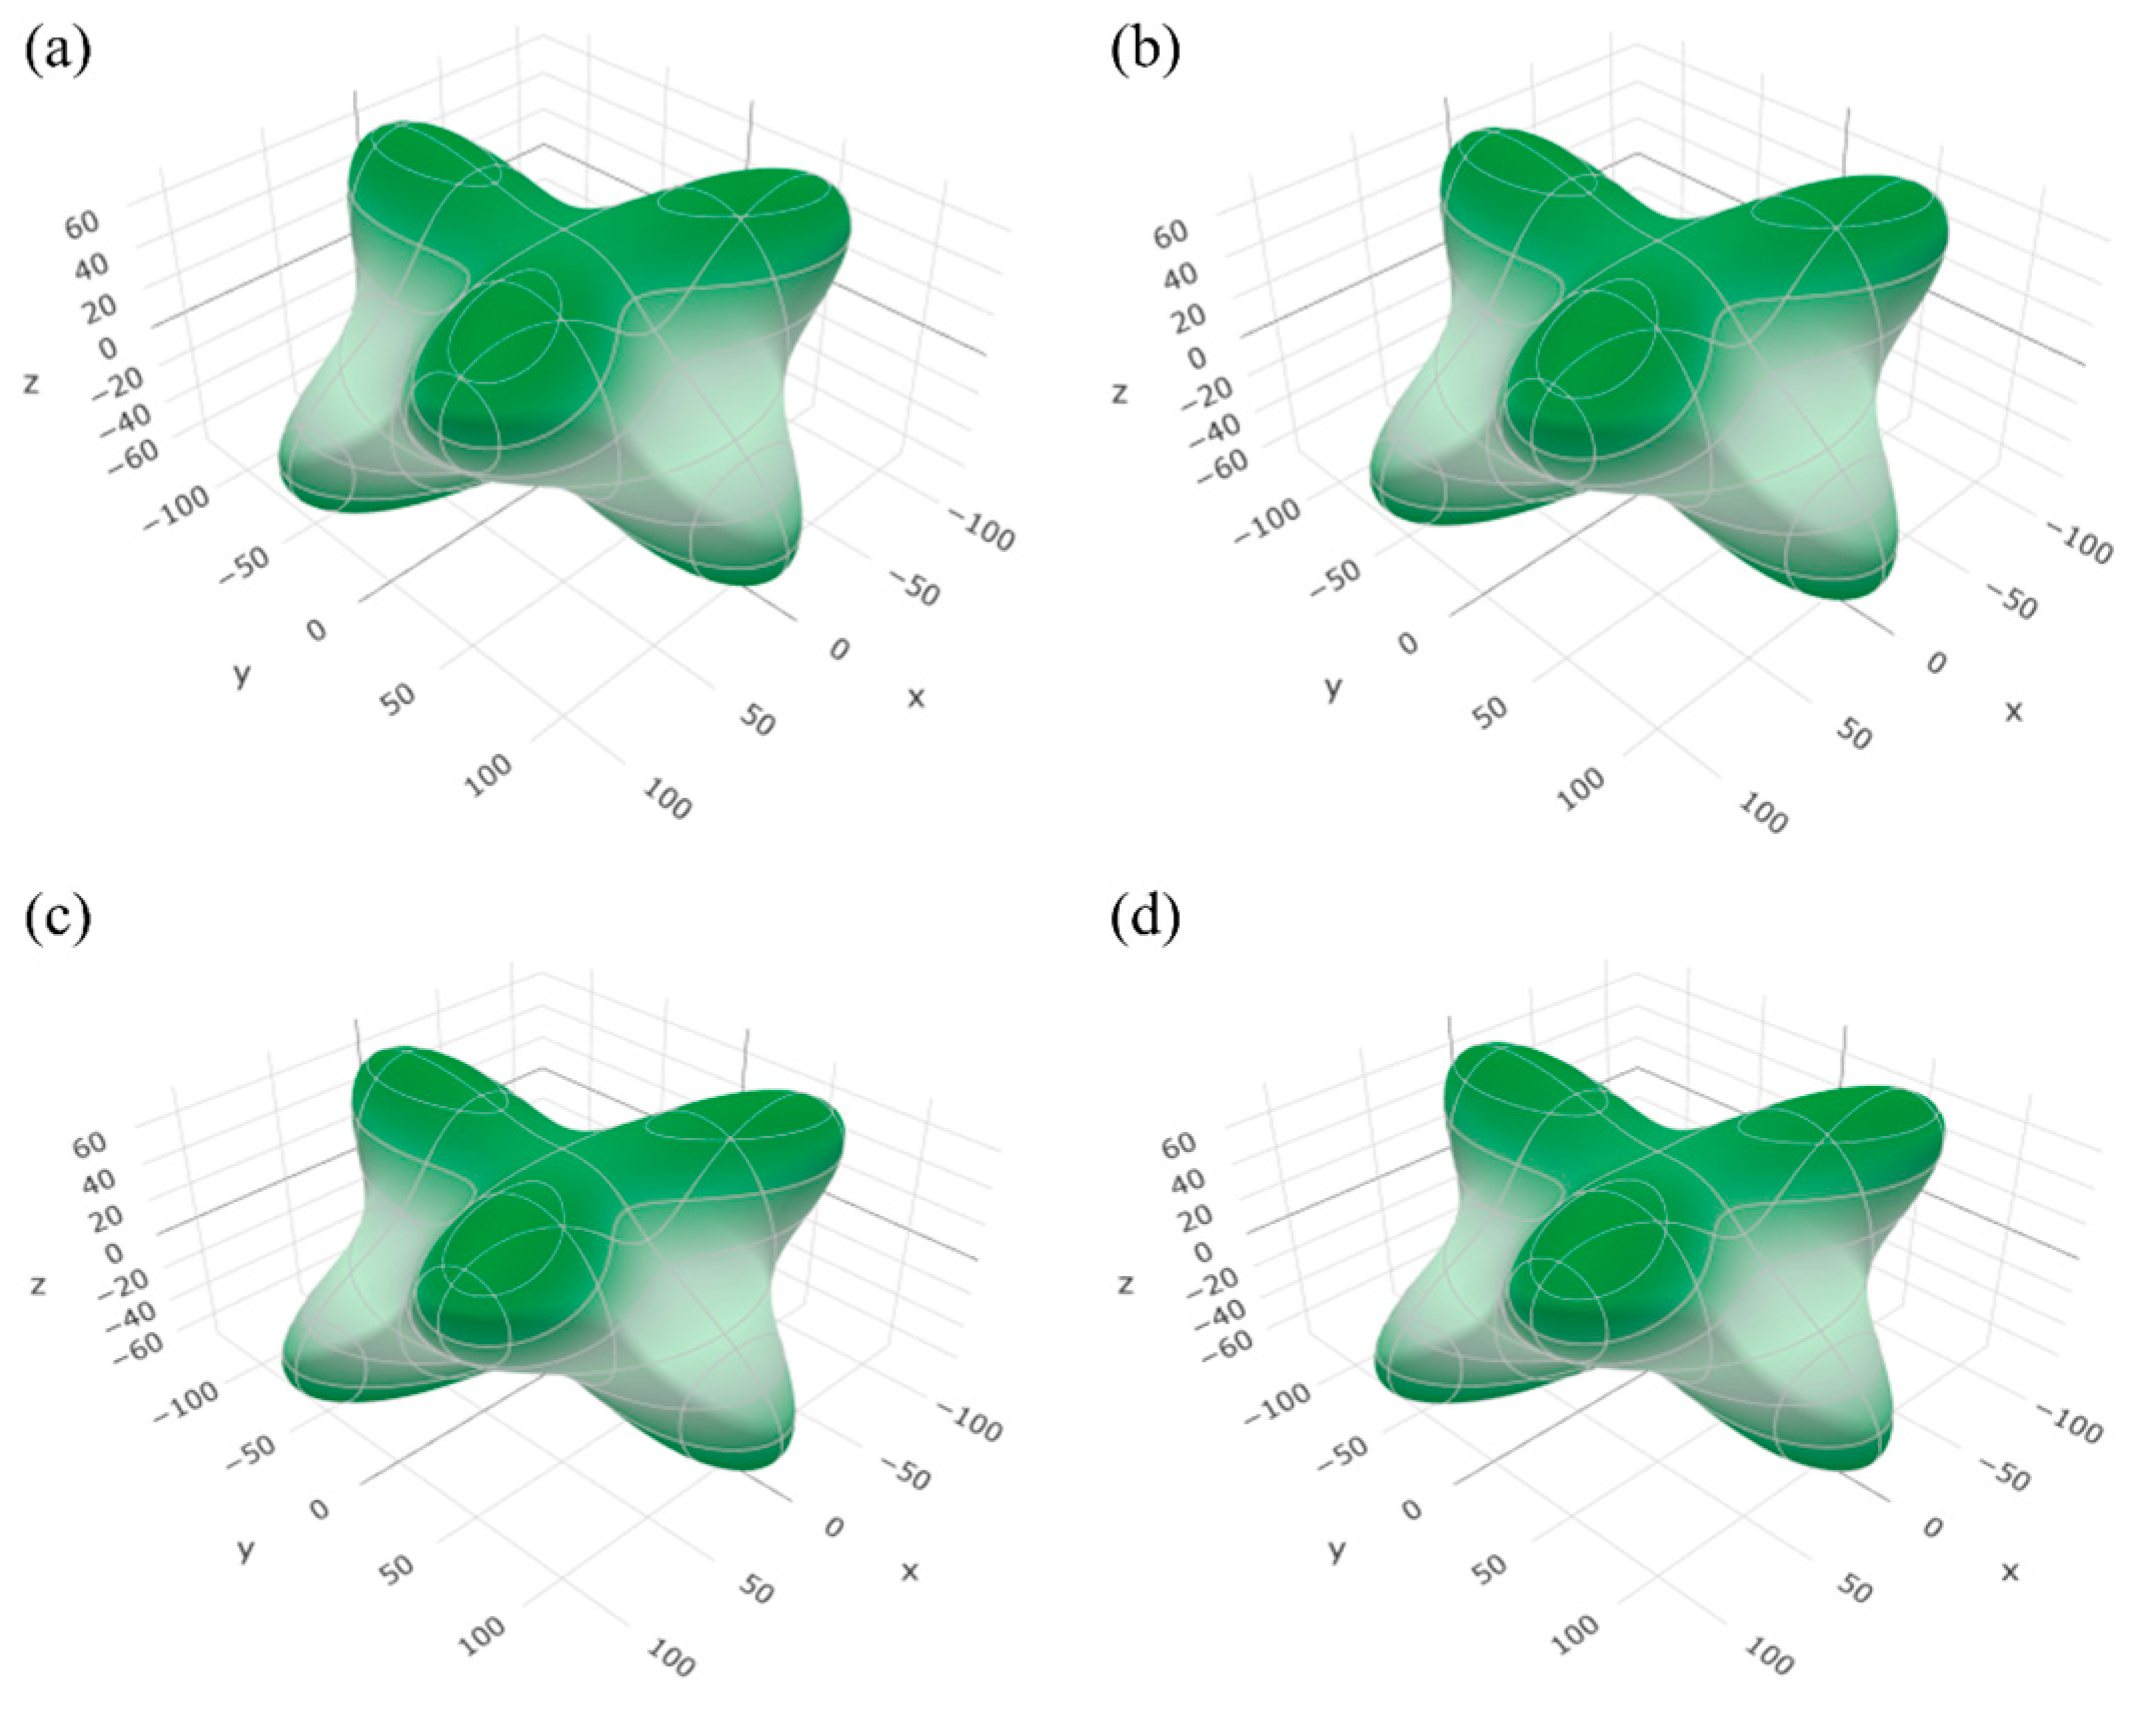
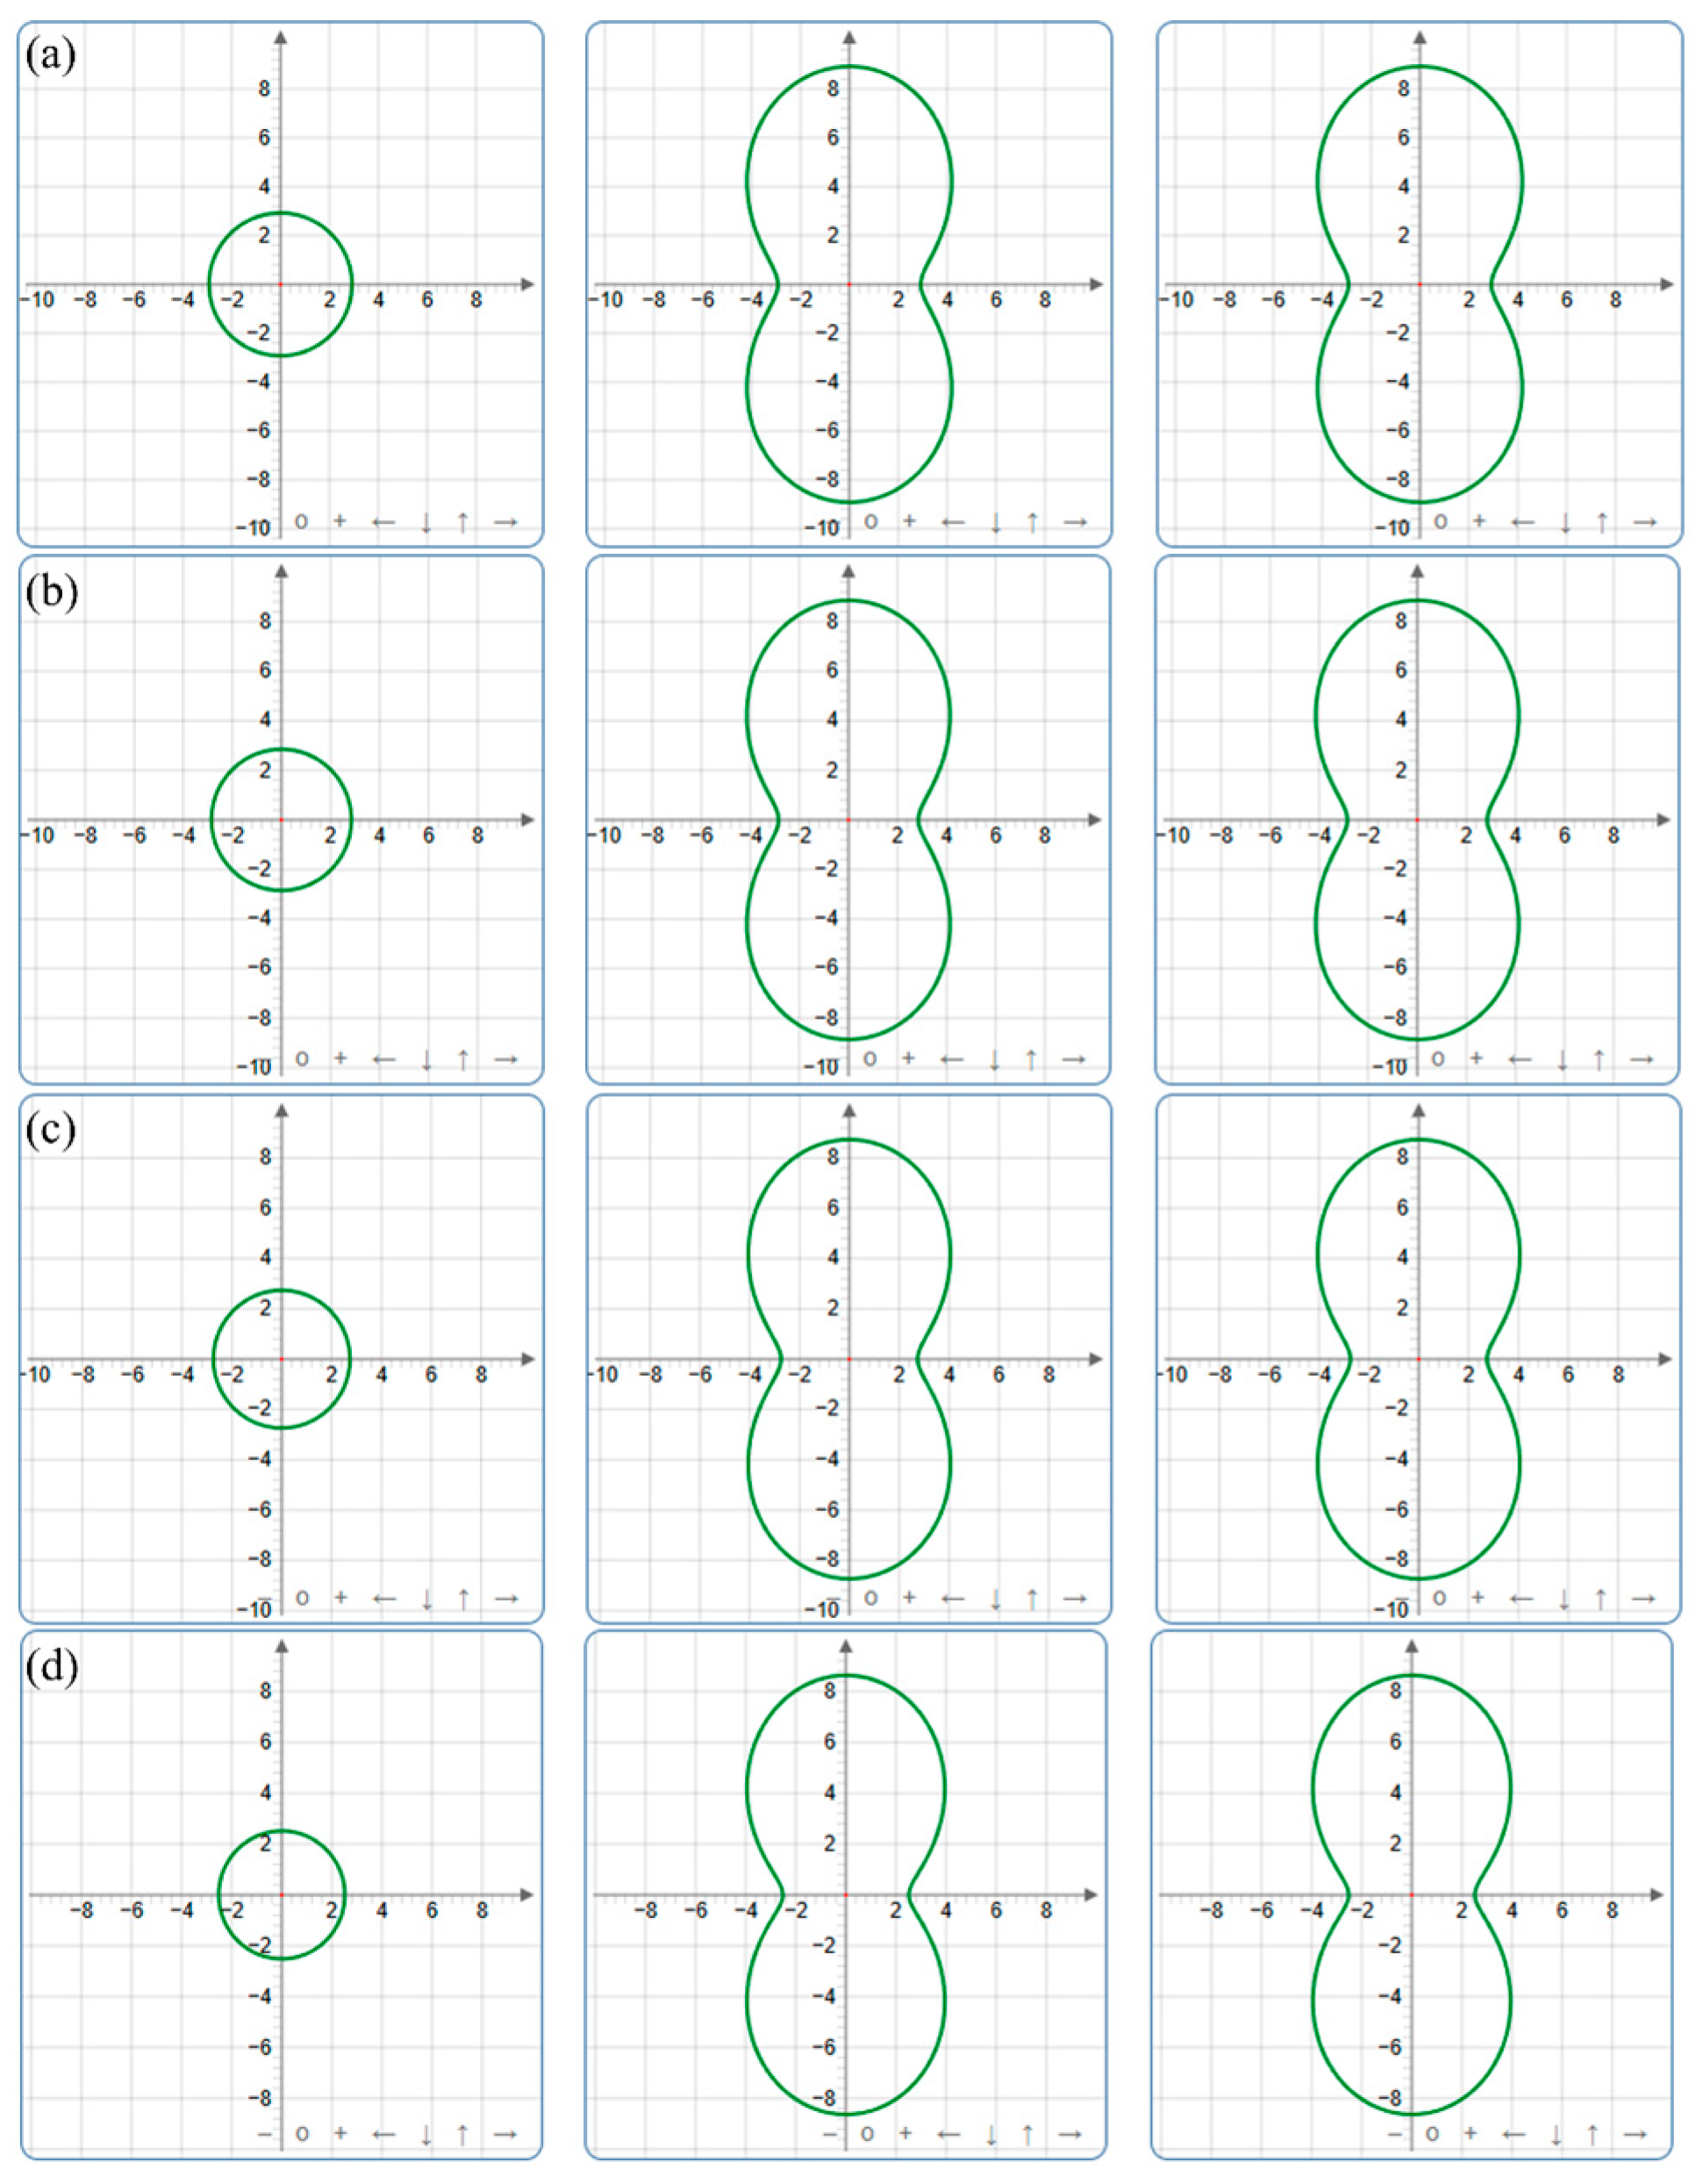
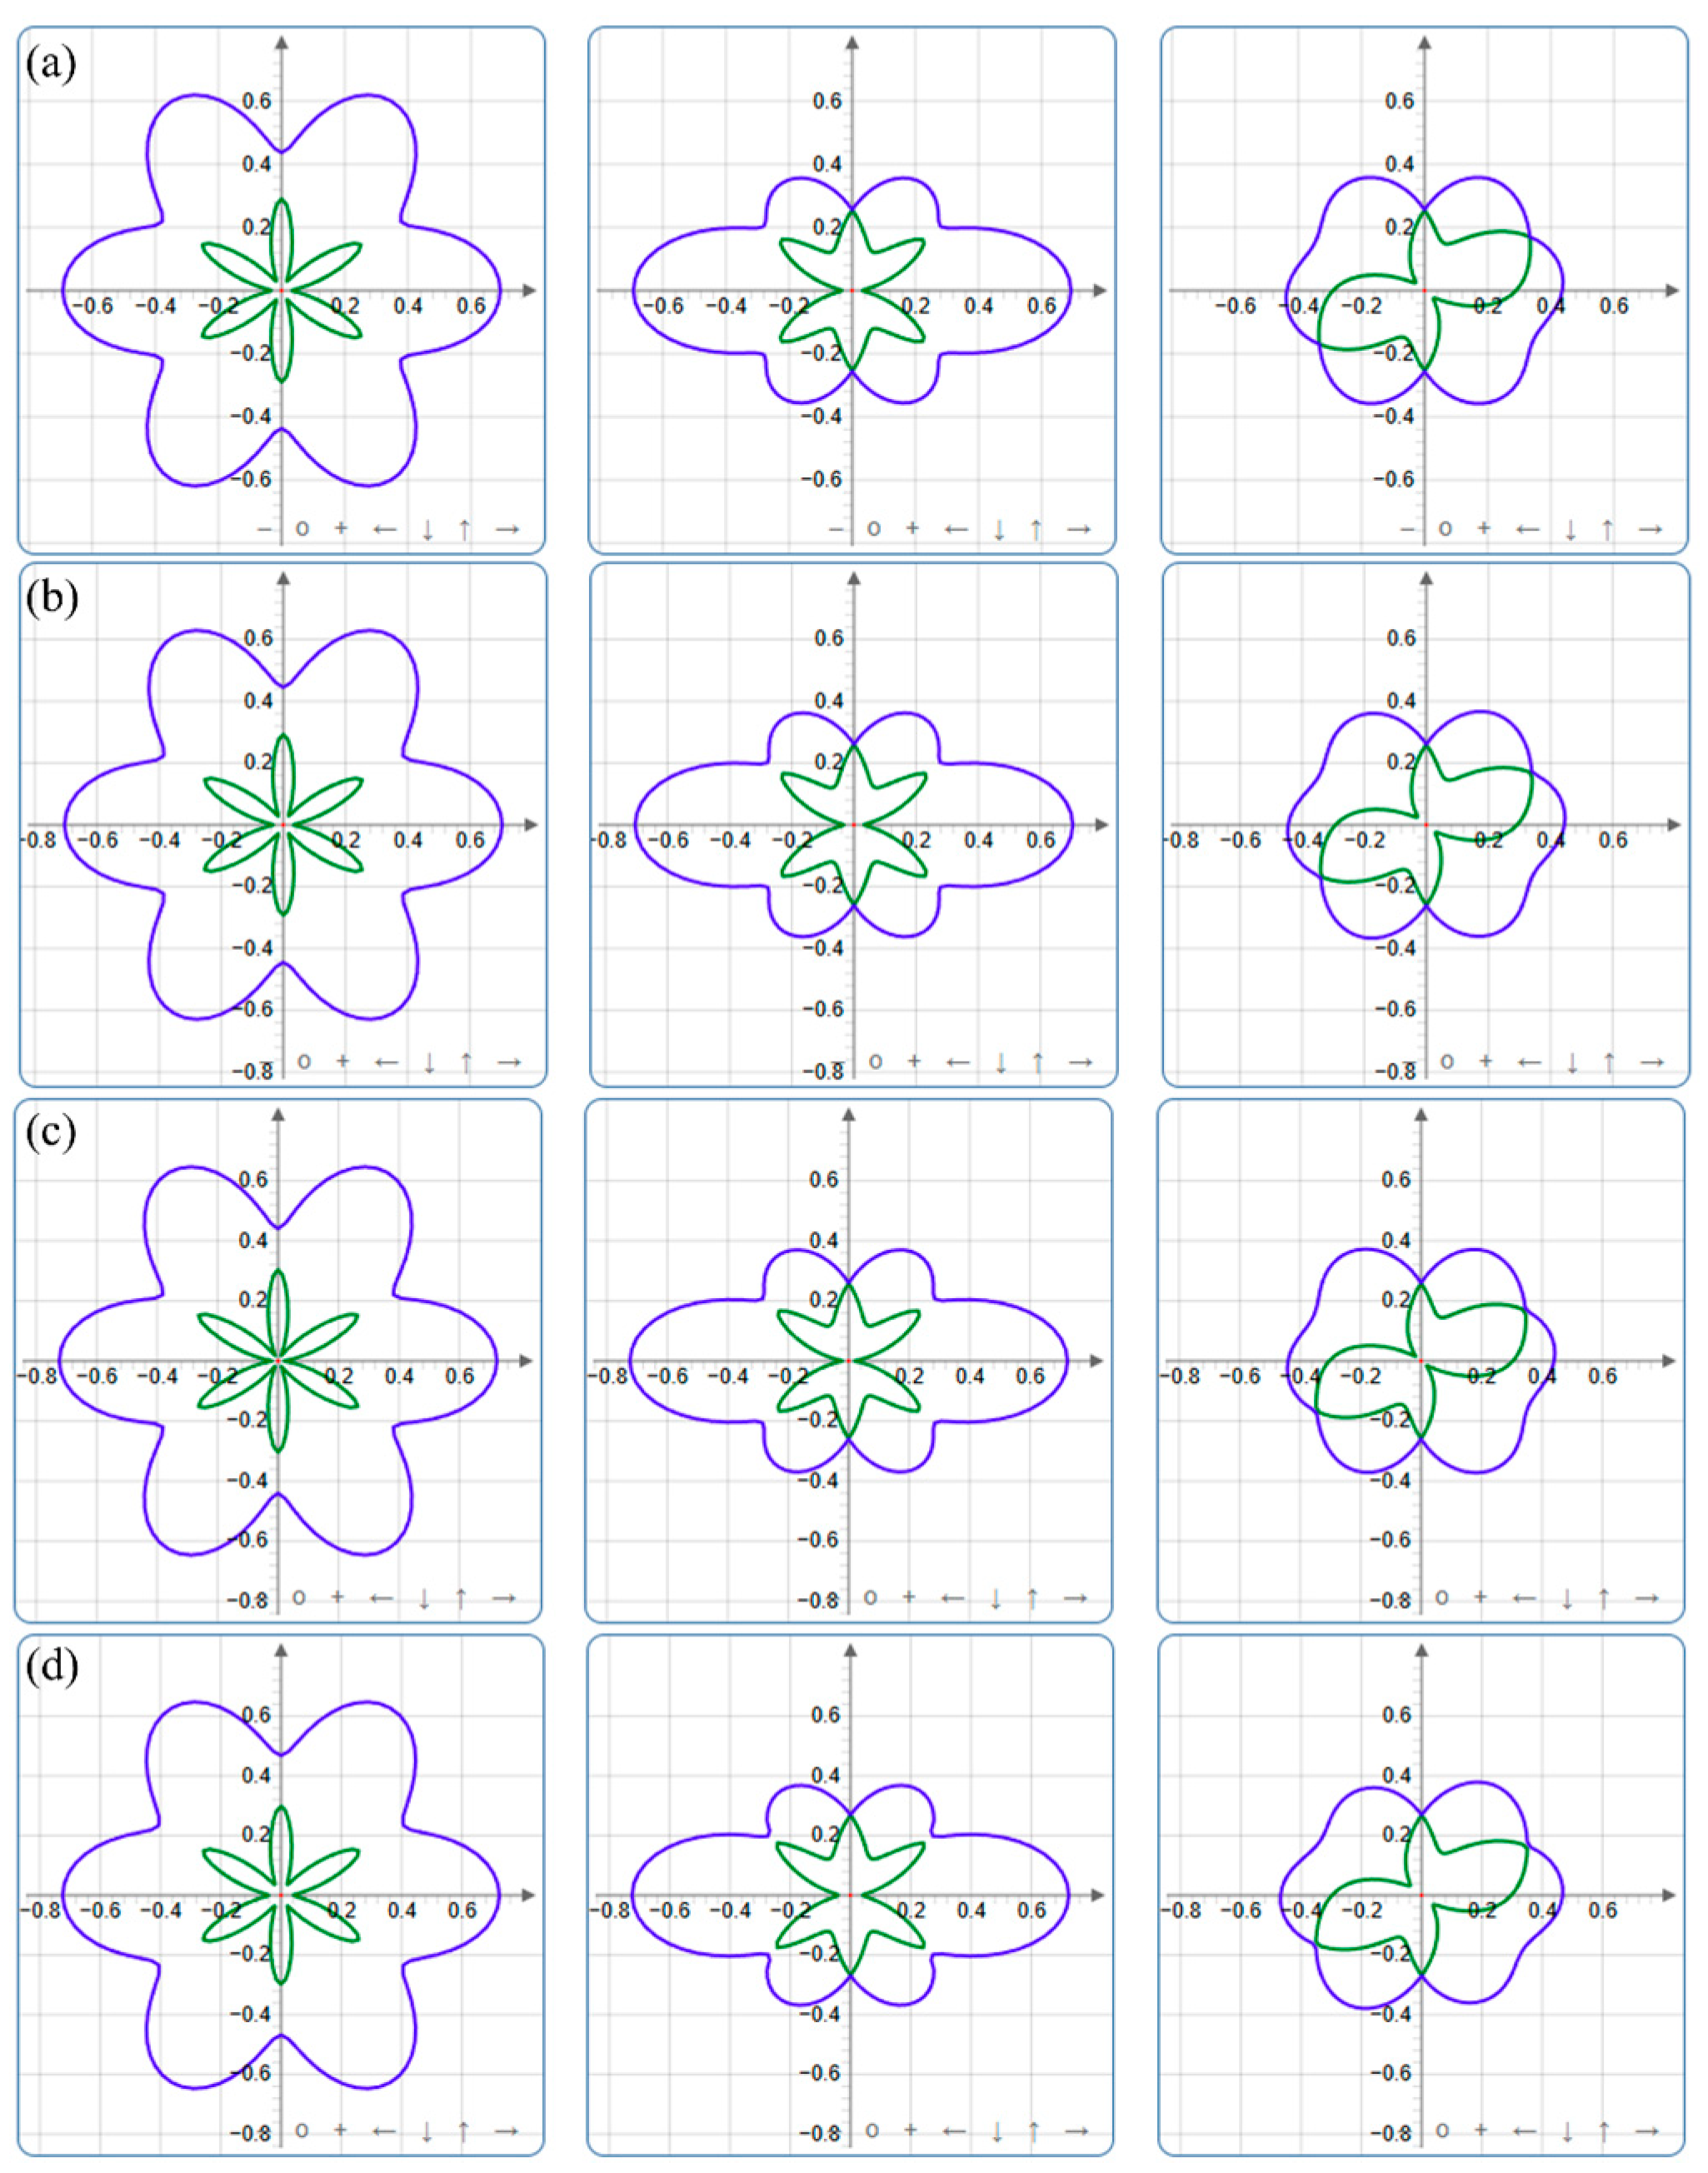
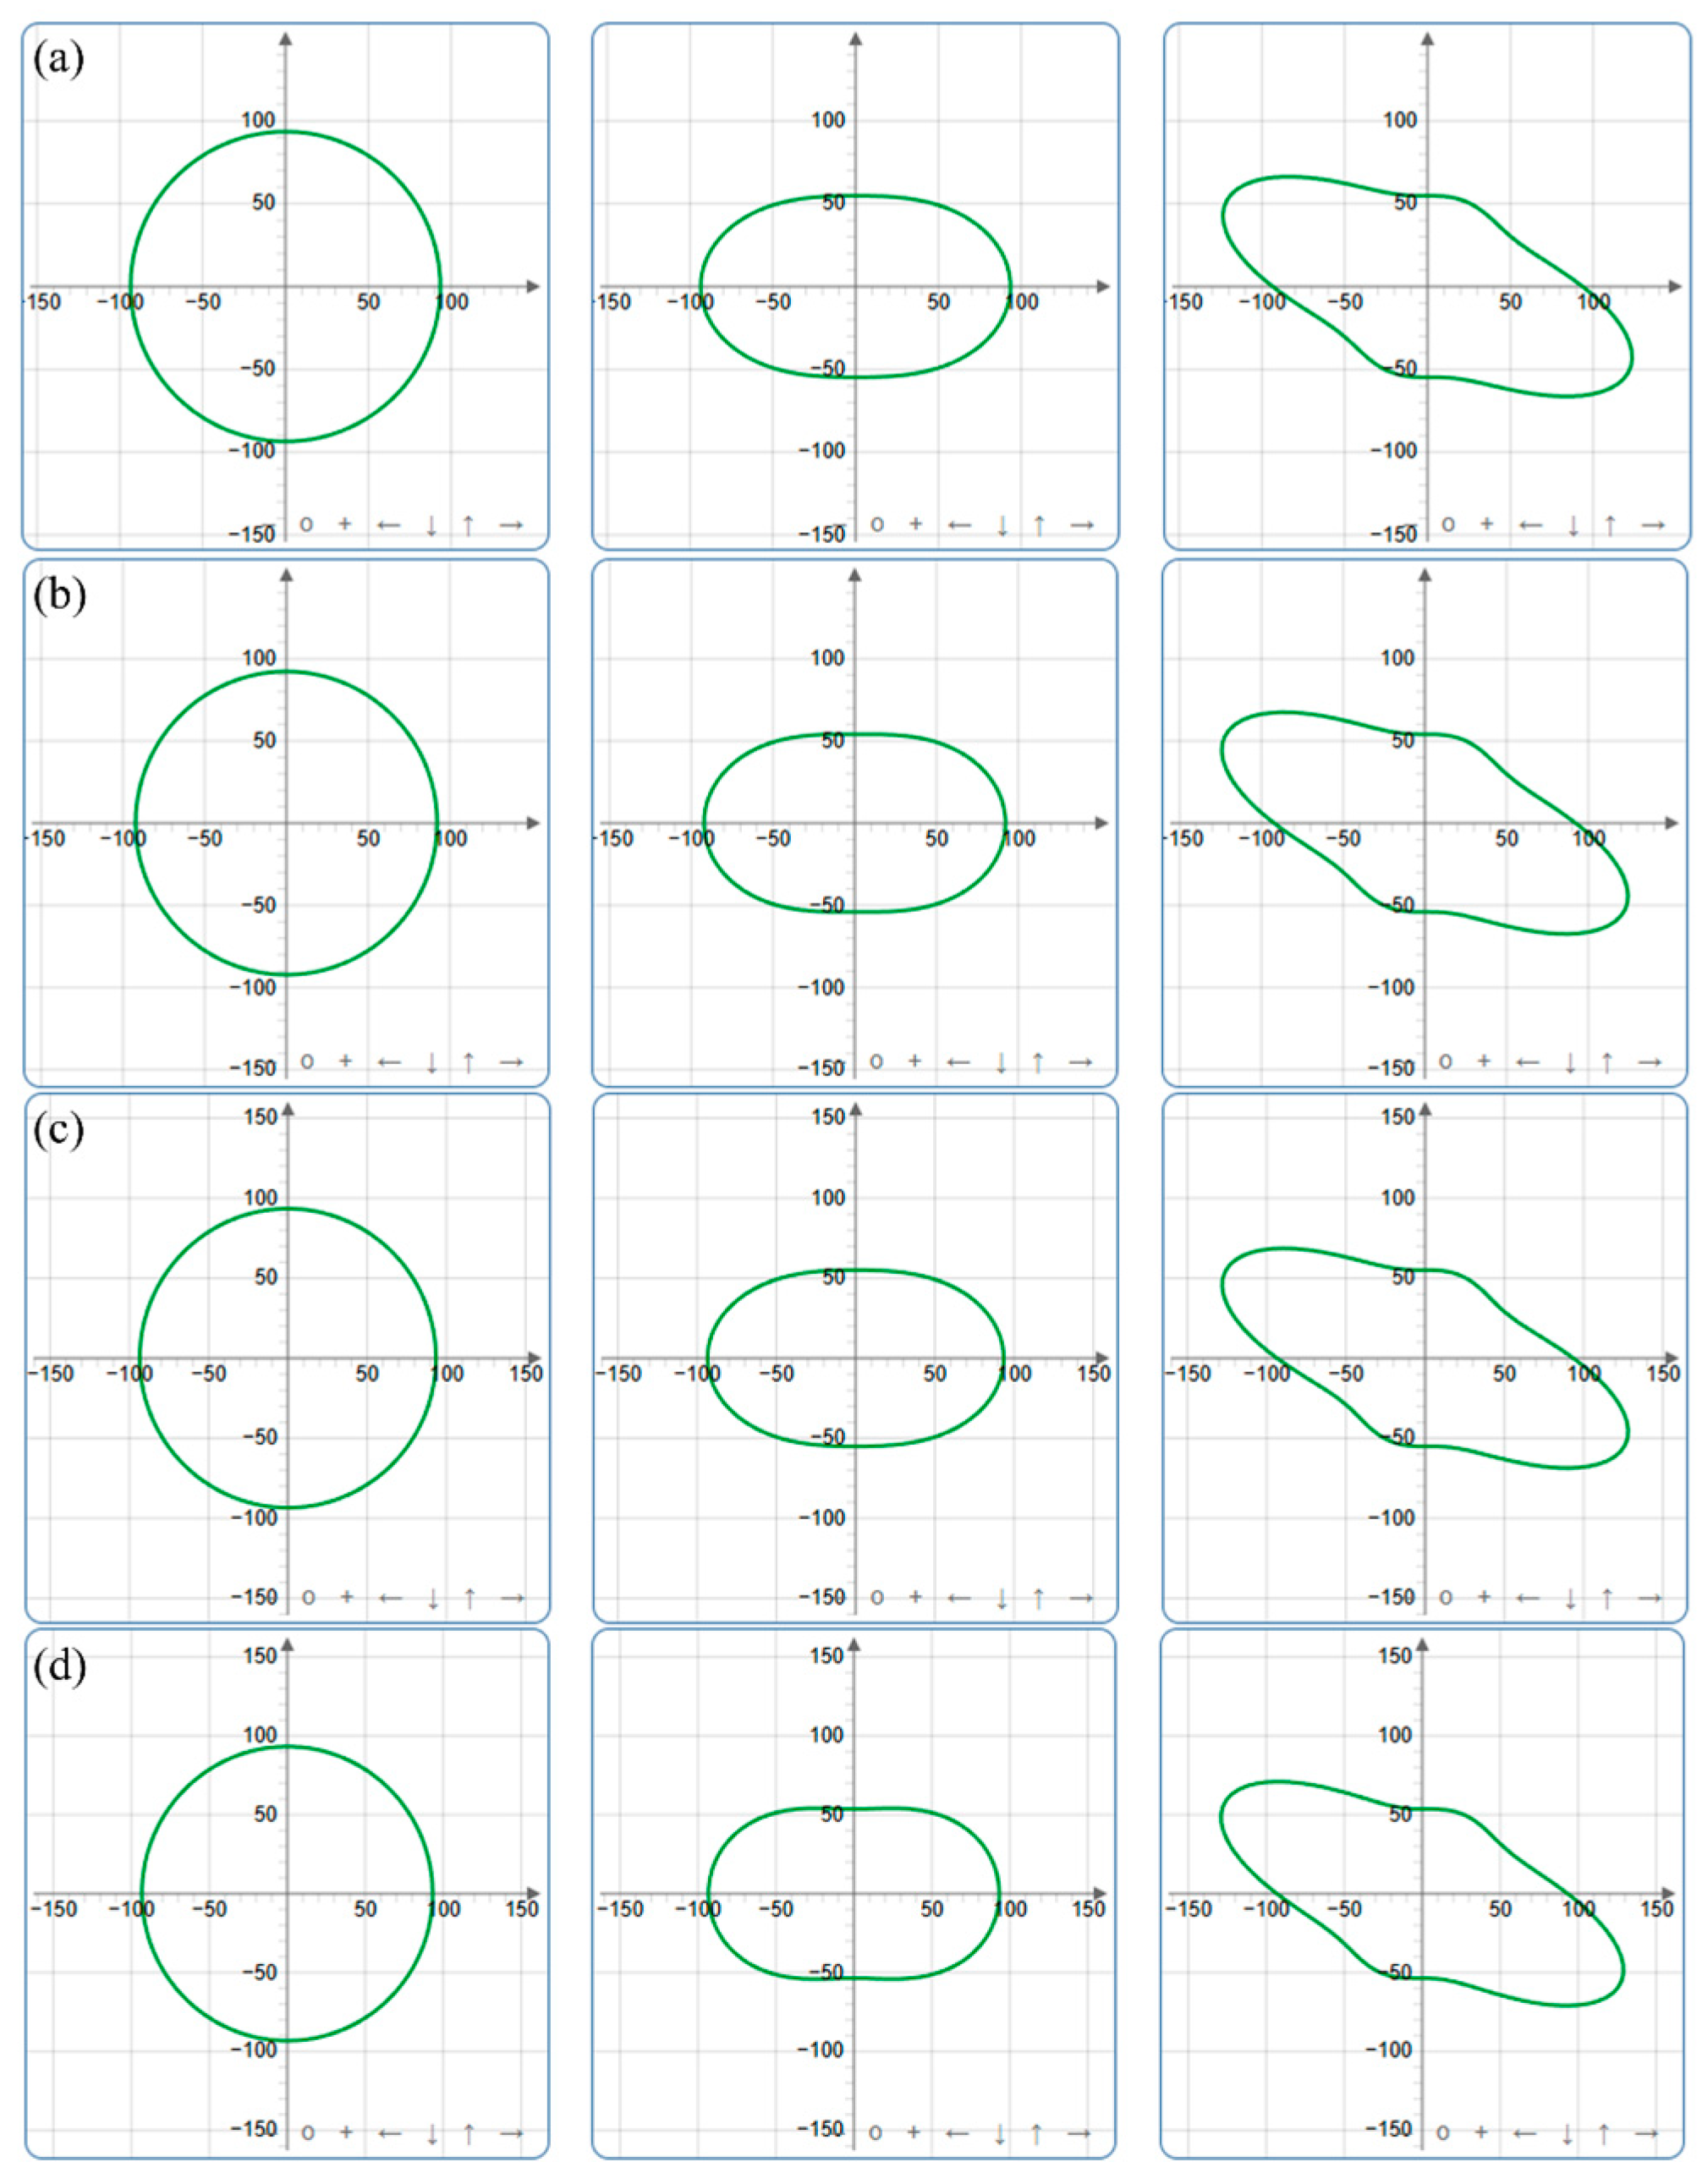
3.2. Elastic Properties

A comprehensive investigation was conducted to evaluate the structural stability of CaCO3 and to gain further insight into its anisotropic behavior under hydrostatic pressure. The trigonal crystal has six independent elastic components, namely C 11 , C 12 , C 13 , C 14 , C 33 , and C 44 . Furthermore, the computed elastic constants must conform to the stipulated mechanical stability conditions [29].
C 44 P   >   0 ,   C 11 P C 12 + P   >   0
( C 33 P ) C 11 + C 12 2 ( C 13 + P ) 2   >   0
  ( C 44 P ) C 11   C 12 2 P 2 C 14 2   >   0
As demonstrated by the data in Table 2 and Figure 3, CaCO3 satisfies the mechanical stability criteria across the 0–1.2 GPa pressure range, thereby indicating that CaCO3 is mechanically stable within the aforementioned pressure range.
The mechanical attributes of materials are often characterized by the bulk modulus ( B ), shear modulus ( G ), and Young’s modulus ( E ). Subsequently, the Reuss–Voight–Hill approximation is employed to determine the bulk modulus ( B ), shear modulus ( G ), and Young’s modulus ( E ) of CaCO3 [32,33,34]. The values of B and G are determined through the application of the following expressions [35]:
B   =   B V   +   B R 2 ,     G   =   G V   +   G R 2  
where
B V = 2 C 11 + C 33 + 2 C 12 + 4 C 13 9 ,     B R = 1 ( 2 S 11 + S 33 ) + 2 ( S 12 + 2 S 13 )
G V = 2 C 11 + C 33 ( C 12 + 2 C 13 ) + 3 ( 2 C 44 + C 11 C 12 2 ) 5
G R = 15 4 2 S 11 + S 33 4 ( S 12 + 2 S 13 ) + 6 ( S 44 + S 11 S 12 )
The Young’s modulus ( E ) can be defined in terms of the bulk modulus ( B ) and the shear modulus ( G ) as follows [35]:
E   =   9 BG 3 B + G
The hardness ( H V ) of orthorhombic CaCO3 is calculated by [36]; the units of G, B, and HV are all GPa:
H V   =   0.92 ( G B ) 1.137 G 0.708
As illustrated in Table 3, the values of B , G , and E for CaCO3 at 0–1.2 GPa are presented. It can be observed that the modulus of elasticity ( B , G , E ) of CaCO3 exhibits a gradual and uninterrupted increase with rising pressure within the specified pressure range.
The Poisson’s ratio ( v ) and the B / G ratio can serve as reliable indicators of the brittle or ductile nature of a material [37]. A Poisson’s ratio of less than 0.26 and a B / G ratio of less than 1.75 indicate brittleness. As evidenced in Table 3, the ductility of CaCO3 increases gradually with increasing pressure. Vickers hardness ( H V ) is a useful criterion for distinguishing between soft and hard materials [36]. A material is considered to exhibit soft characteristics if its Vickers hardness is less than 10 GPa, while a material with a hardness above this threshold is classified as hard [37]. Table 3 illustrates that CaCO3 exhibits softening behavior as the pressure increases.
The longitudinal wave velocity Vl, transverse wave velocity Vt, and mean wave velocity Vm of CaCO3 at pressures of 0–1.2 GPa have been calculated according to Navier’s equations [38,39] and displayed in Table 4. As shown in Table 4, the Vl, Vt, and Vm of CaCO3 are calculated to be 6.5861 km/s, 3.5125 km/s, and 3.9241 km/s at 0 GPa pressure, respectively.
V l = ( B + 4 3 G ) 1 ρ ,     V T = G ρ
V m = [ 1 3 ( 2 V T 3 + 1 V l 3 ) ] 1 3
Studies of mechanical properties in materials typically consider the influence of microfractures and lattice deformations on their behavior, with elastic anisotropy recognized as a critical factor influencing both phenomena. Consequently, analyzing elastic anisotropy is essential for improving the structural resilience of engineered materials. The description of elastic anisotropy can be achieved through the utilization of the anisotropy index ( A U ) and anisotropy percentage ( A B , A G ). The aforementioned parameters can be derived from the following equation [40,41]:
A B   =     B V     B R B V   +   B R ,     A G   =   G V     G R G V   +   G R ,     A E = E V     E R E V   +   E R
A U = 5 G V G R + B V B R 6     0
In this context, B V and B R represent the bulk modulus of the Voigt and Reuss models, respectively, while E V and E R denote the Young’s modulus of the aforementioned models. Similarly, G V and G R signify the shear modulus of the Voigt and Reuss models. The values of A B , A E , and A G are employed to ascertain the extent of anisotropy in the bulk, Young’s, and shear moduli of the materials, respectively. The calculated values of A B , A E   , and A G for different pressures are presented in Table 5. In the case of elastically isotropic materials, the values of A B , A E , and A G are all equal to zero. Conversely, a value of one for A B , A E , and A G indicates the maximum possible elastic anisotropy. From the table, it can be observed that the bulk modulus, Young’s modulus, and shear modulus of CaCO3 exhibit varying degrees of anisotropy. A U represents the universal elastic anisotropy index for all crystalline phases, with A U = 0 indicating isotropic behavior in single crystals. The degree of anisotropy in the material is quantified by the magnitude of the deviation of A U   from 0. It is apparent that the anisotropy of CaCO3 grows progressively with rising pressure.
The linear compressibility, Poisson’s ratio, shear modulus, and Young’s modulus of CaCO3 at pressures of 0 GPa, 0.4 GPa, 0.8 GPa, and 1.2 GPa were visualized in three-dimensional (3D) and two-dimensional (2D) formats using the ELATE program [42], enabling a comprehensive analysis of elastic anisotropy. For isotropic crystals, 3D representations adopt a perfectly spherical geometry, whereas anisotropic crystals display deviations from spherical symmetry that correlate directly with the degree of elastic anisotropy. Figure 4, Figure 5, Figure 6 and Figure 7 illustrate the 3D plots of these properties (linear compressibility, Poisson’s ratio, shear modulus, and Young’s modulus) at the specified pressures. All four properties exhibit marked deviations from spherical symmetry, confirming pronounced anisotropic behavior in CaCO3 under pressure. In contrast, isotropic materials would retain circular/spherical geometries; thus, observed deviations underscore the material’s directional dependence.
However, the anisotropy observed at varying pressures cannot be fully characterized solely through three-dimensional surface structures. To systematically quantify the elastic anisotropy of CaCO3, two-dimensional projections of these 3D representations were analyzed. Figure 8, Figure 9, Figure 10 and Figure 11 present the projections of linear compressibility, Poisson’s ratio, shear modulus, and Young’s modulus on the xy, xz, and yz planes across the studied pressure range. These projections enable a clearer visualization of directional elastic behavior. Notably, the xy-plane projections of linear compressibility and Young’s modulus exhibit circular symmetry (indicative of isotropy), while pronounced irregularities on the xz and yz planes confirm anisotropy in these orientations. The remaining elastic moduli (shear modulus and Poisson’s ratio) display marked anisotropy across all planes (xy, xz, and yz) under pressure.
While Figure 4, Figure 5, Figure 6, Figure 7, Figure 8, Figure 9, Figure 10 and Figure 11 visualize the anisotropy of CaCO3, the pressure-induced changes are too subtle to discern clearly in these plots. To deepen our understanding of the elastic anisotropy in CaCO3 at pressures of 0 GPa, 0.4 GPa, 0.8 GPa, and 1.2 GPa, we performed calculations of the directional elastic modulus along the three main axes. The computed data is tabulated in Table 6. The deviations of the linear compressibility β , Poisson’s ratio v , shear modulus G , and Young’s modulus E of CaCO3 at 0 GPa, 0.4 GPa, 0.8 GPa, and 1.2 GPa were compared using the ratios β max / β min , υ max / υ min , G max / G min , and E max / E min . An increase in the value of β max / β min results in a corresponding increase in linear compressibility anisotropy, as do the ratios of the other principal components: υ max / υ min , G max / G min and E max / E min . At 0 GPa, 0.4 GPa, 0.8 GPa, and 1.2 GPa, the β max / β min is 3.05, 3.11, 3.19, and 3.43, respectively. Similarly, the values of G max / G min are 2.63, 2.68, 2.72, and 2.80, while the values of E max / E min are 2.41, 2.47, 2.49, and 2.60. It is apparent that the values of β, G , and E tend to increase overall when the pressure is between 0 and 1.2 GPa. The analysis of the above data indicates that the degree of anisotropy of β , G , and E increases when the pressure varies from 0 to 1.2 GPa.

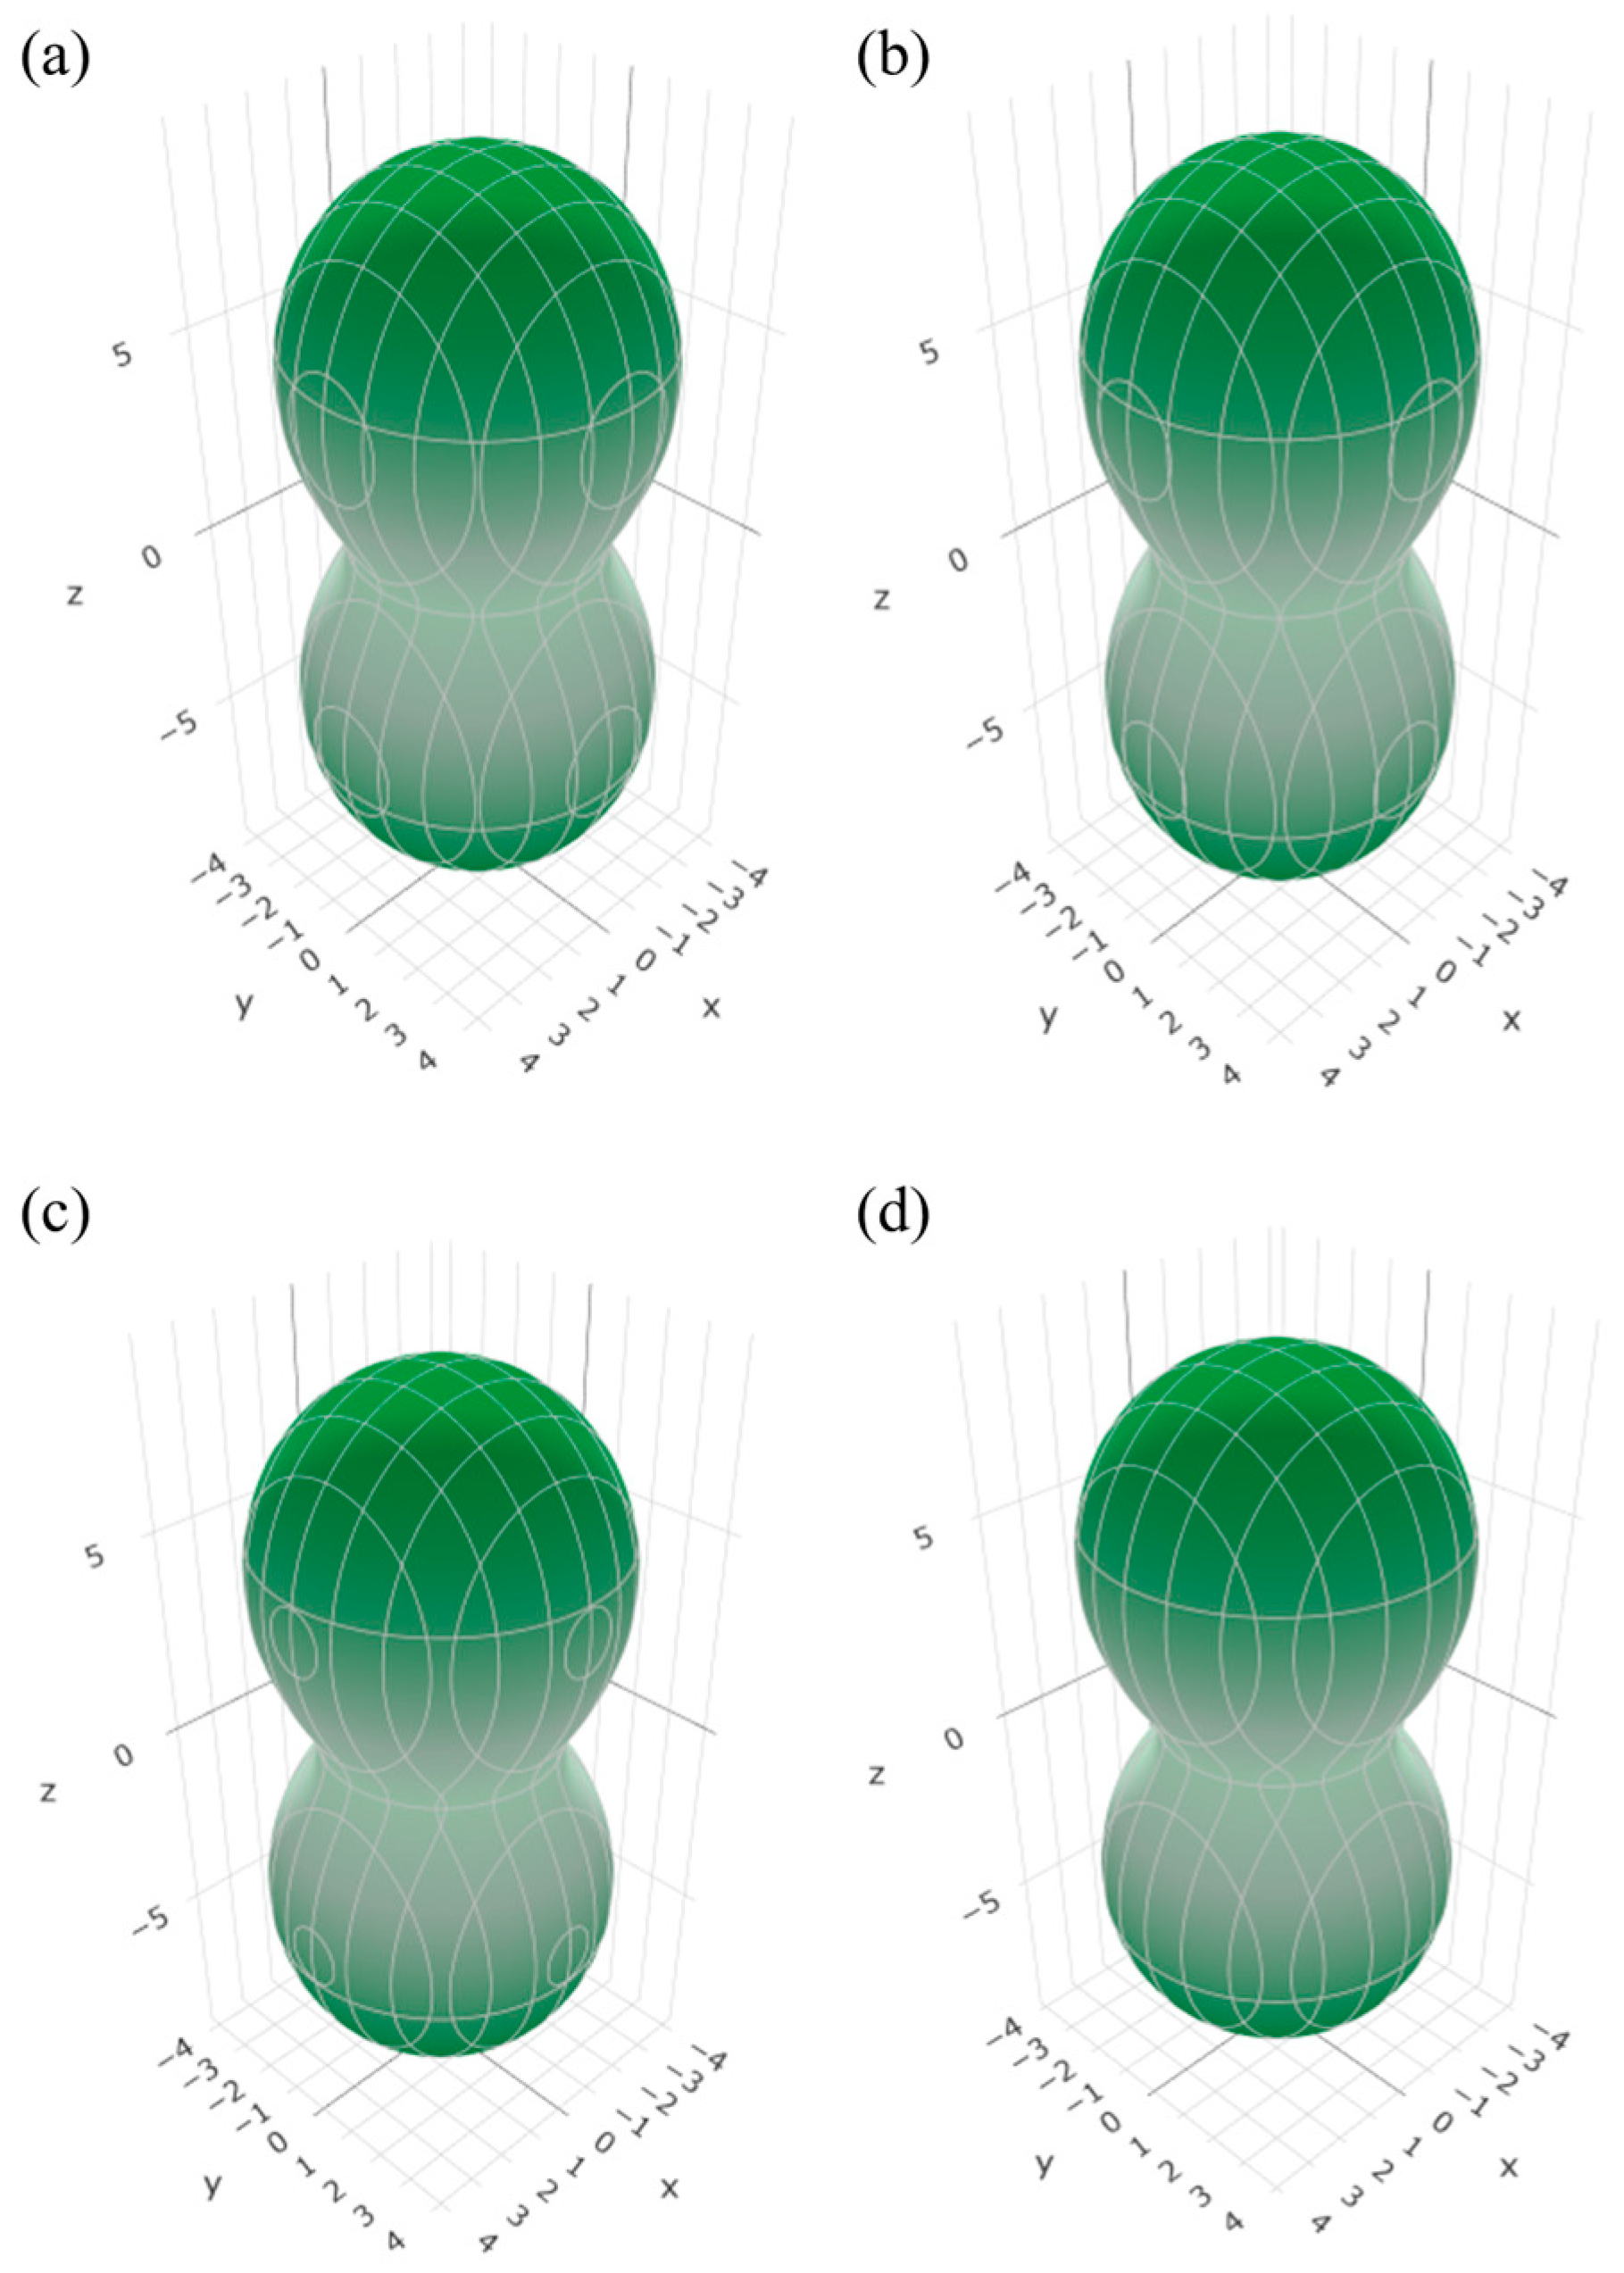
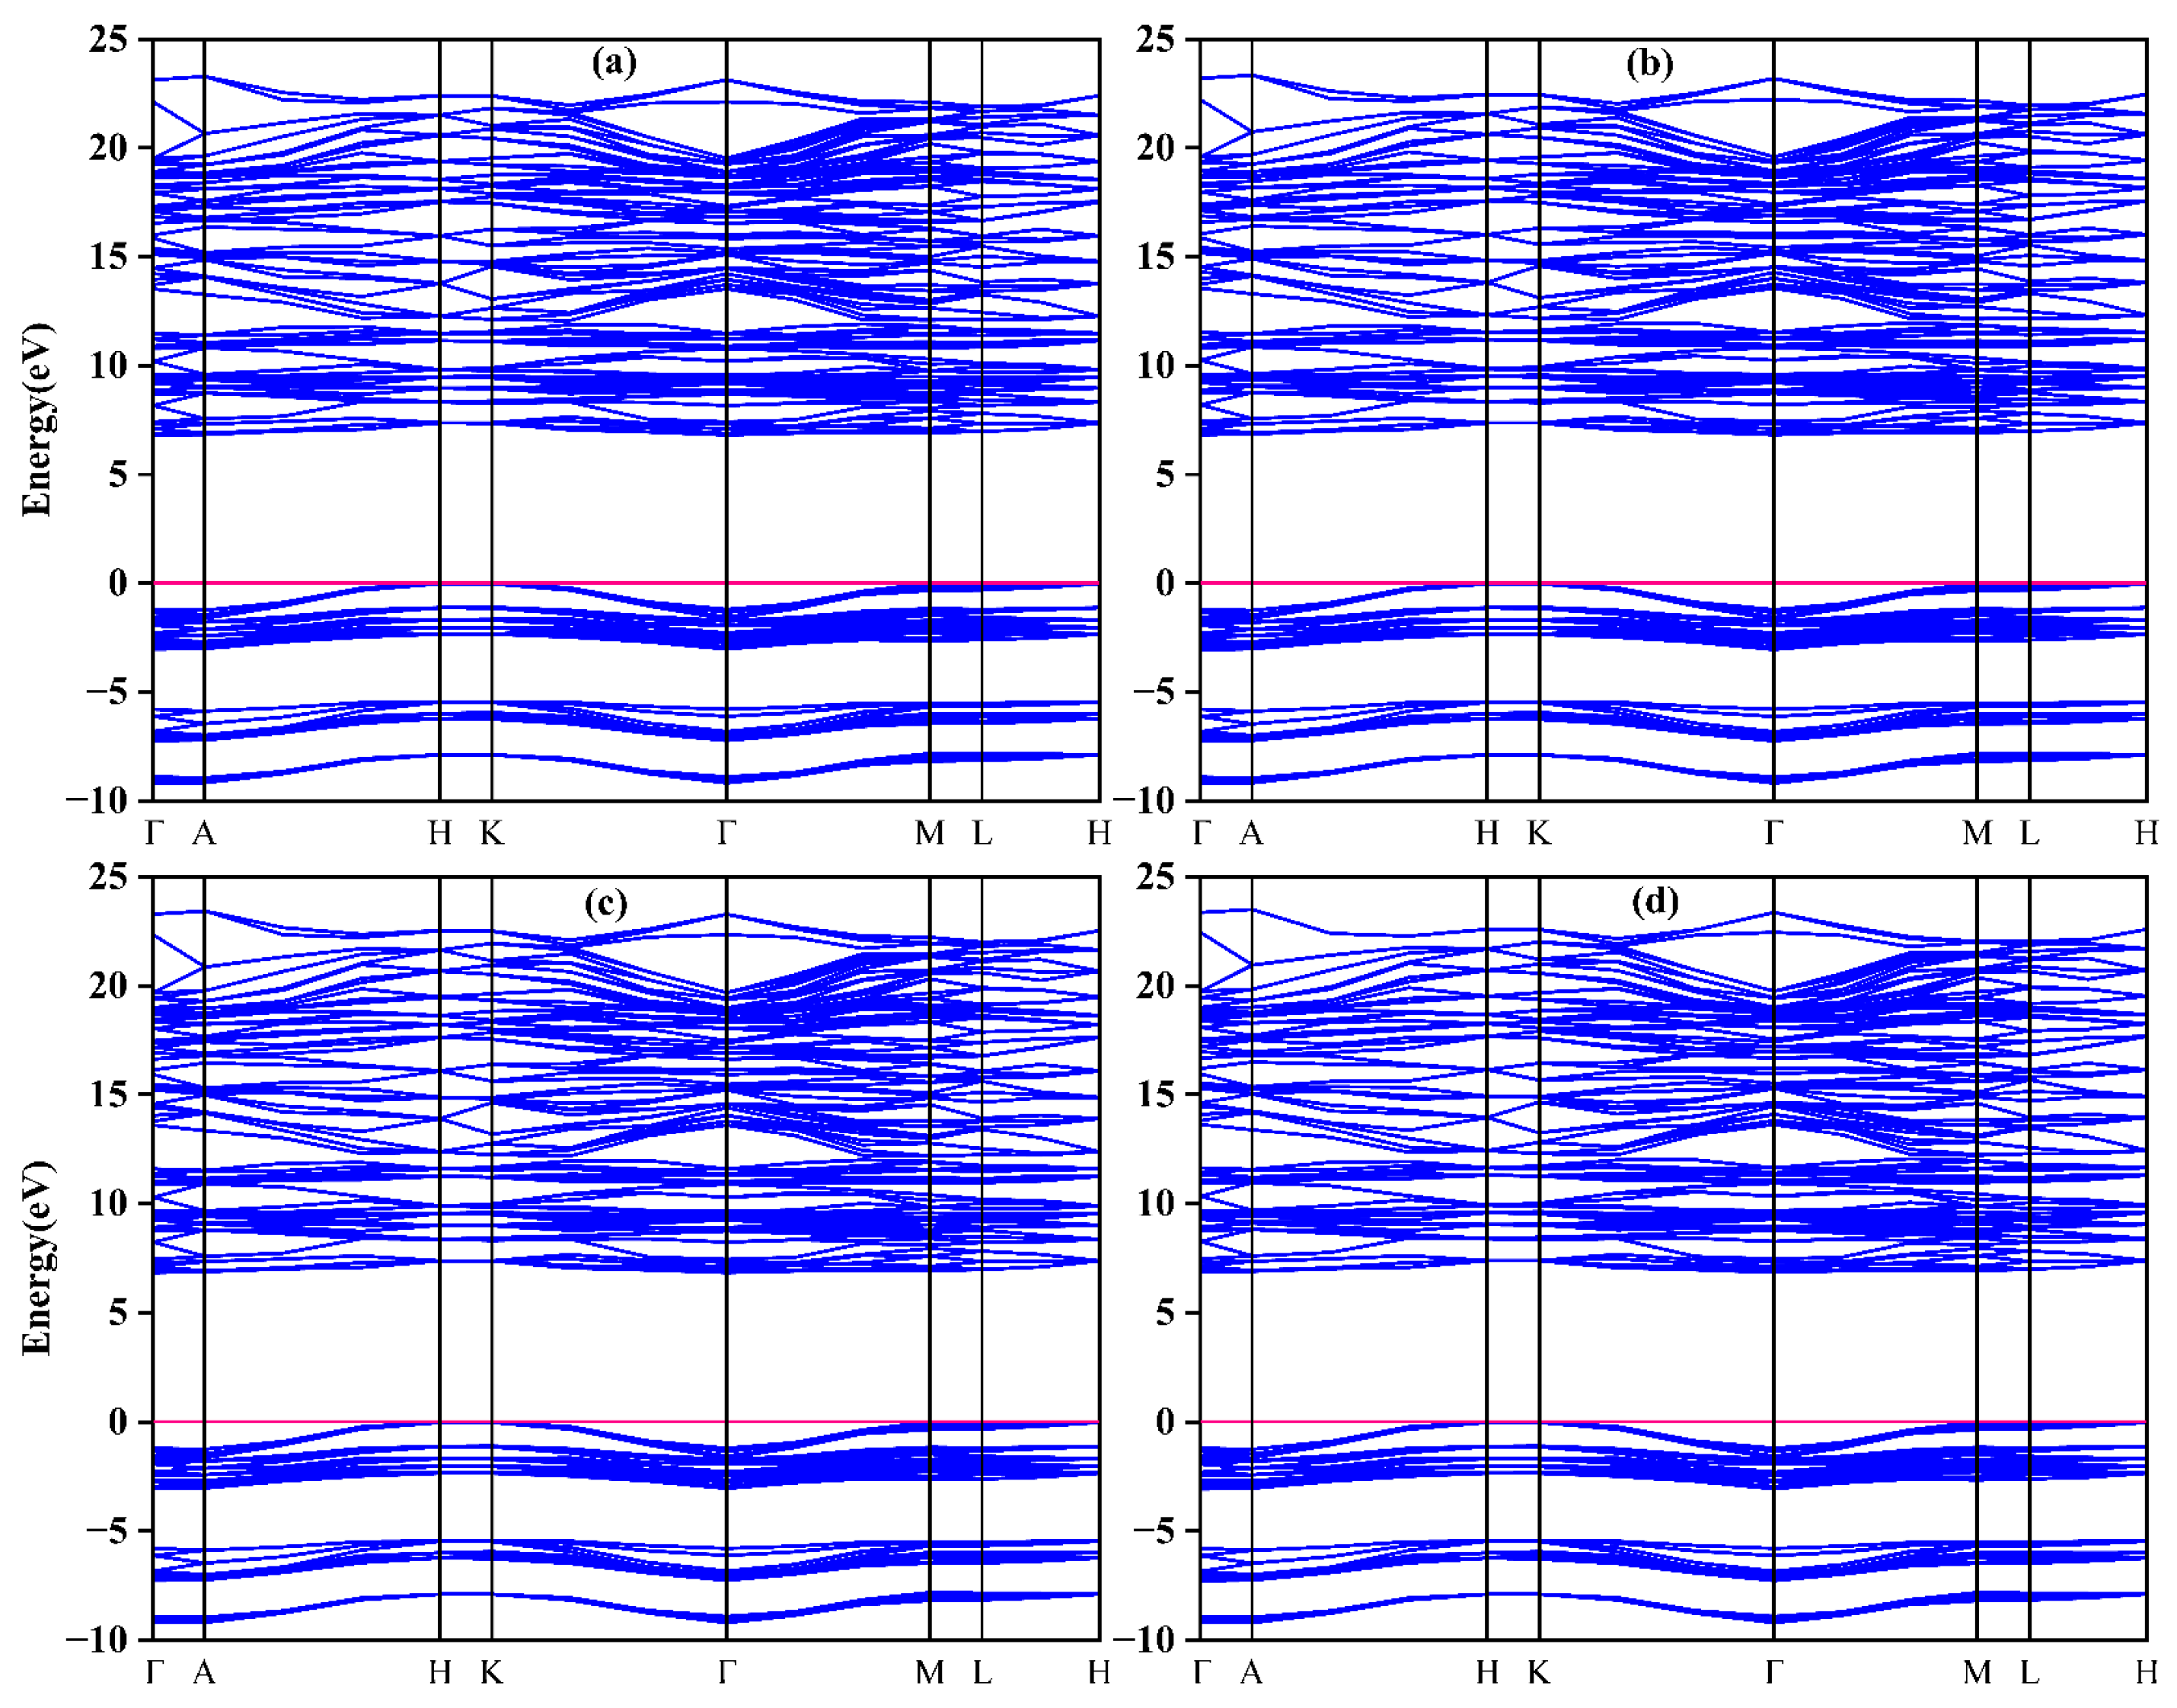
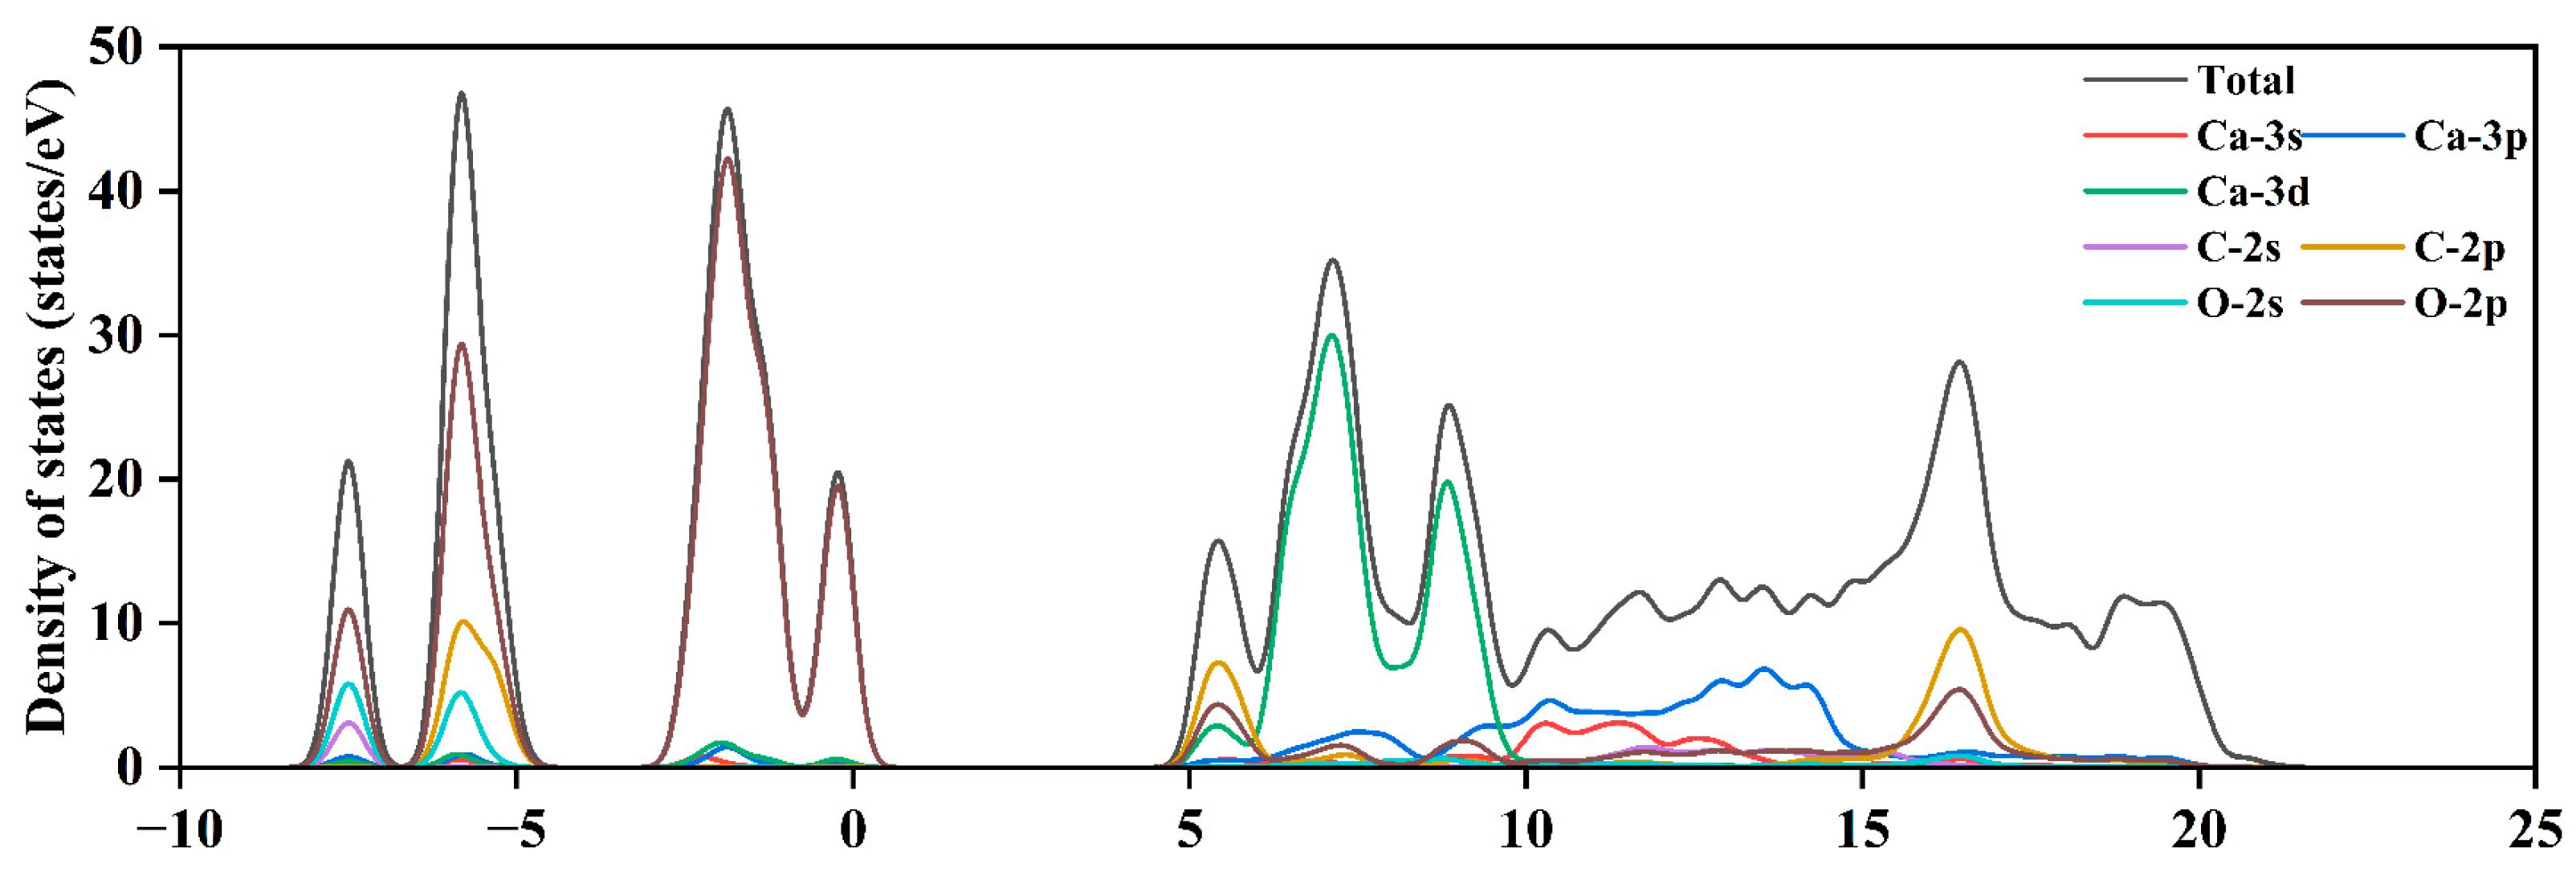
3.3. Electronic Properties

A thorough discussion of the electronic structure is essential for understanding the relationship between the crystal structure and optical properties of CaCO3. Figure 12 presents the pressure-dependent band structures of CaCO3, where the horizontal red line indicates the Fermi level within the Brillouin zone. As shown in Figure 12, the principal energy dispersion range of the band structure expands significantly with increasing pressure. The calculated band gap at ambient pressure is 6.312 eV, which aligns well with the experimental result of 6 eV [43].
To further analyze the electronic characteristics, we performed density of states (DOS) calculations, as illustrated in Figure 13. The DOS profiles reveal the orbital-specific electronic distributions and, when combined with partial density of states (PDOS) and band structure analyses, enable identification of atomic contributions to the conduction and valence bands. Figure 13 demonstrates that the lower valence band primarily consists of O-2p orbitals with minor contributions from C-2p and O-2s states, while the upper valence band is dominated by O-2p states. The conduction band within the 5–10 eV energy range is predominantly composed of Ca-3d states, while the 10–15 eV and 15–20 eV intervals exhibit primary contributions from Ca-3p and C-2p orbitals, respectively. Notably, while pressure variations do not alter the fundamental orbital composition of the valence and conduction bands, they induce energy range modifications; however, under the four applied pressures, the changes are very small and visually indistinguishable, so only Figure 13 is shown.

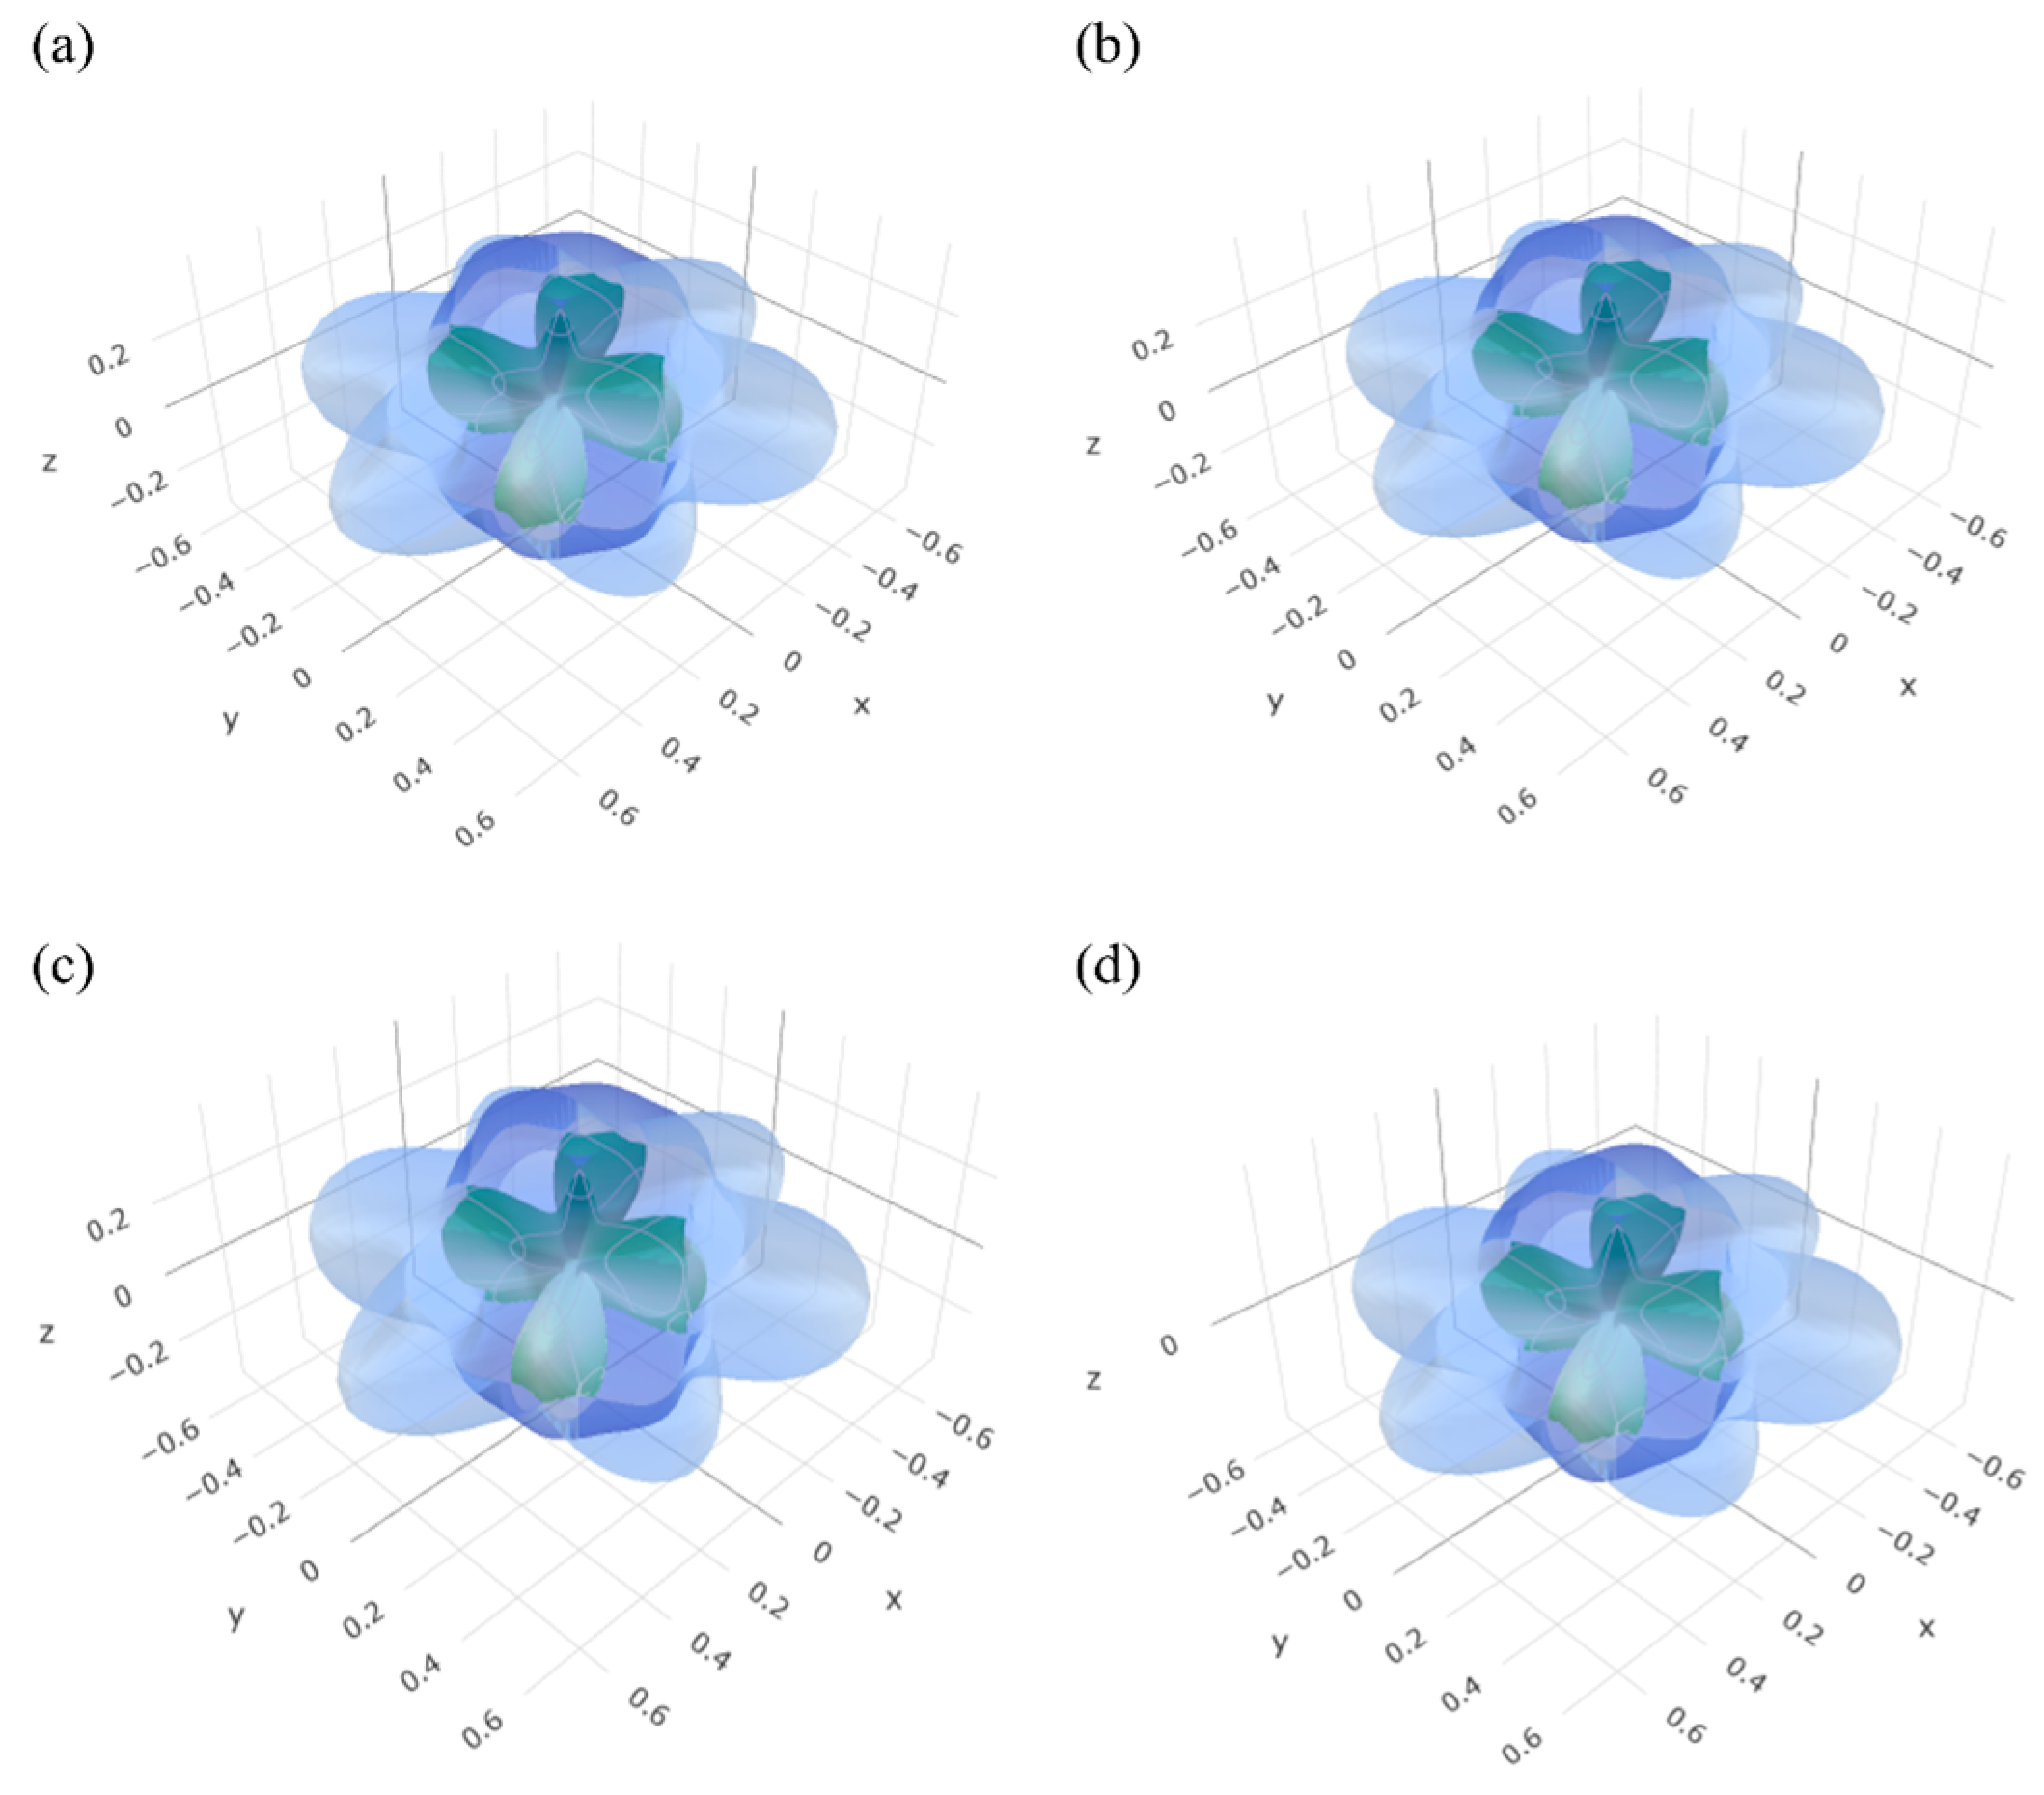
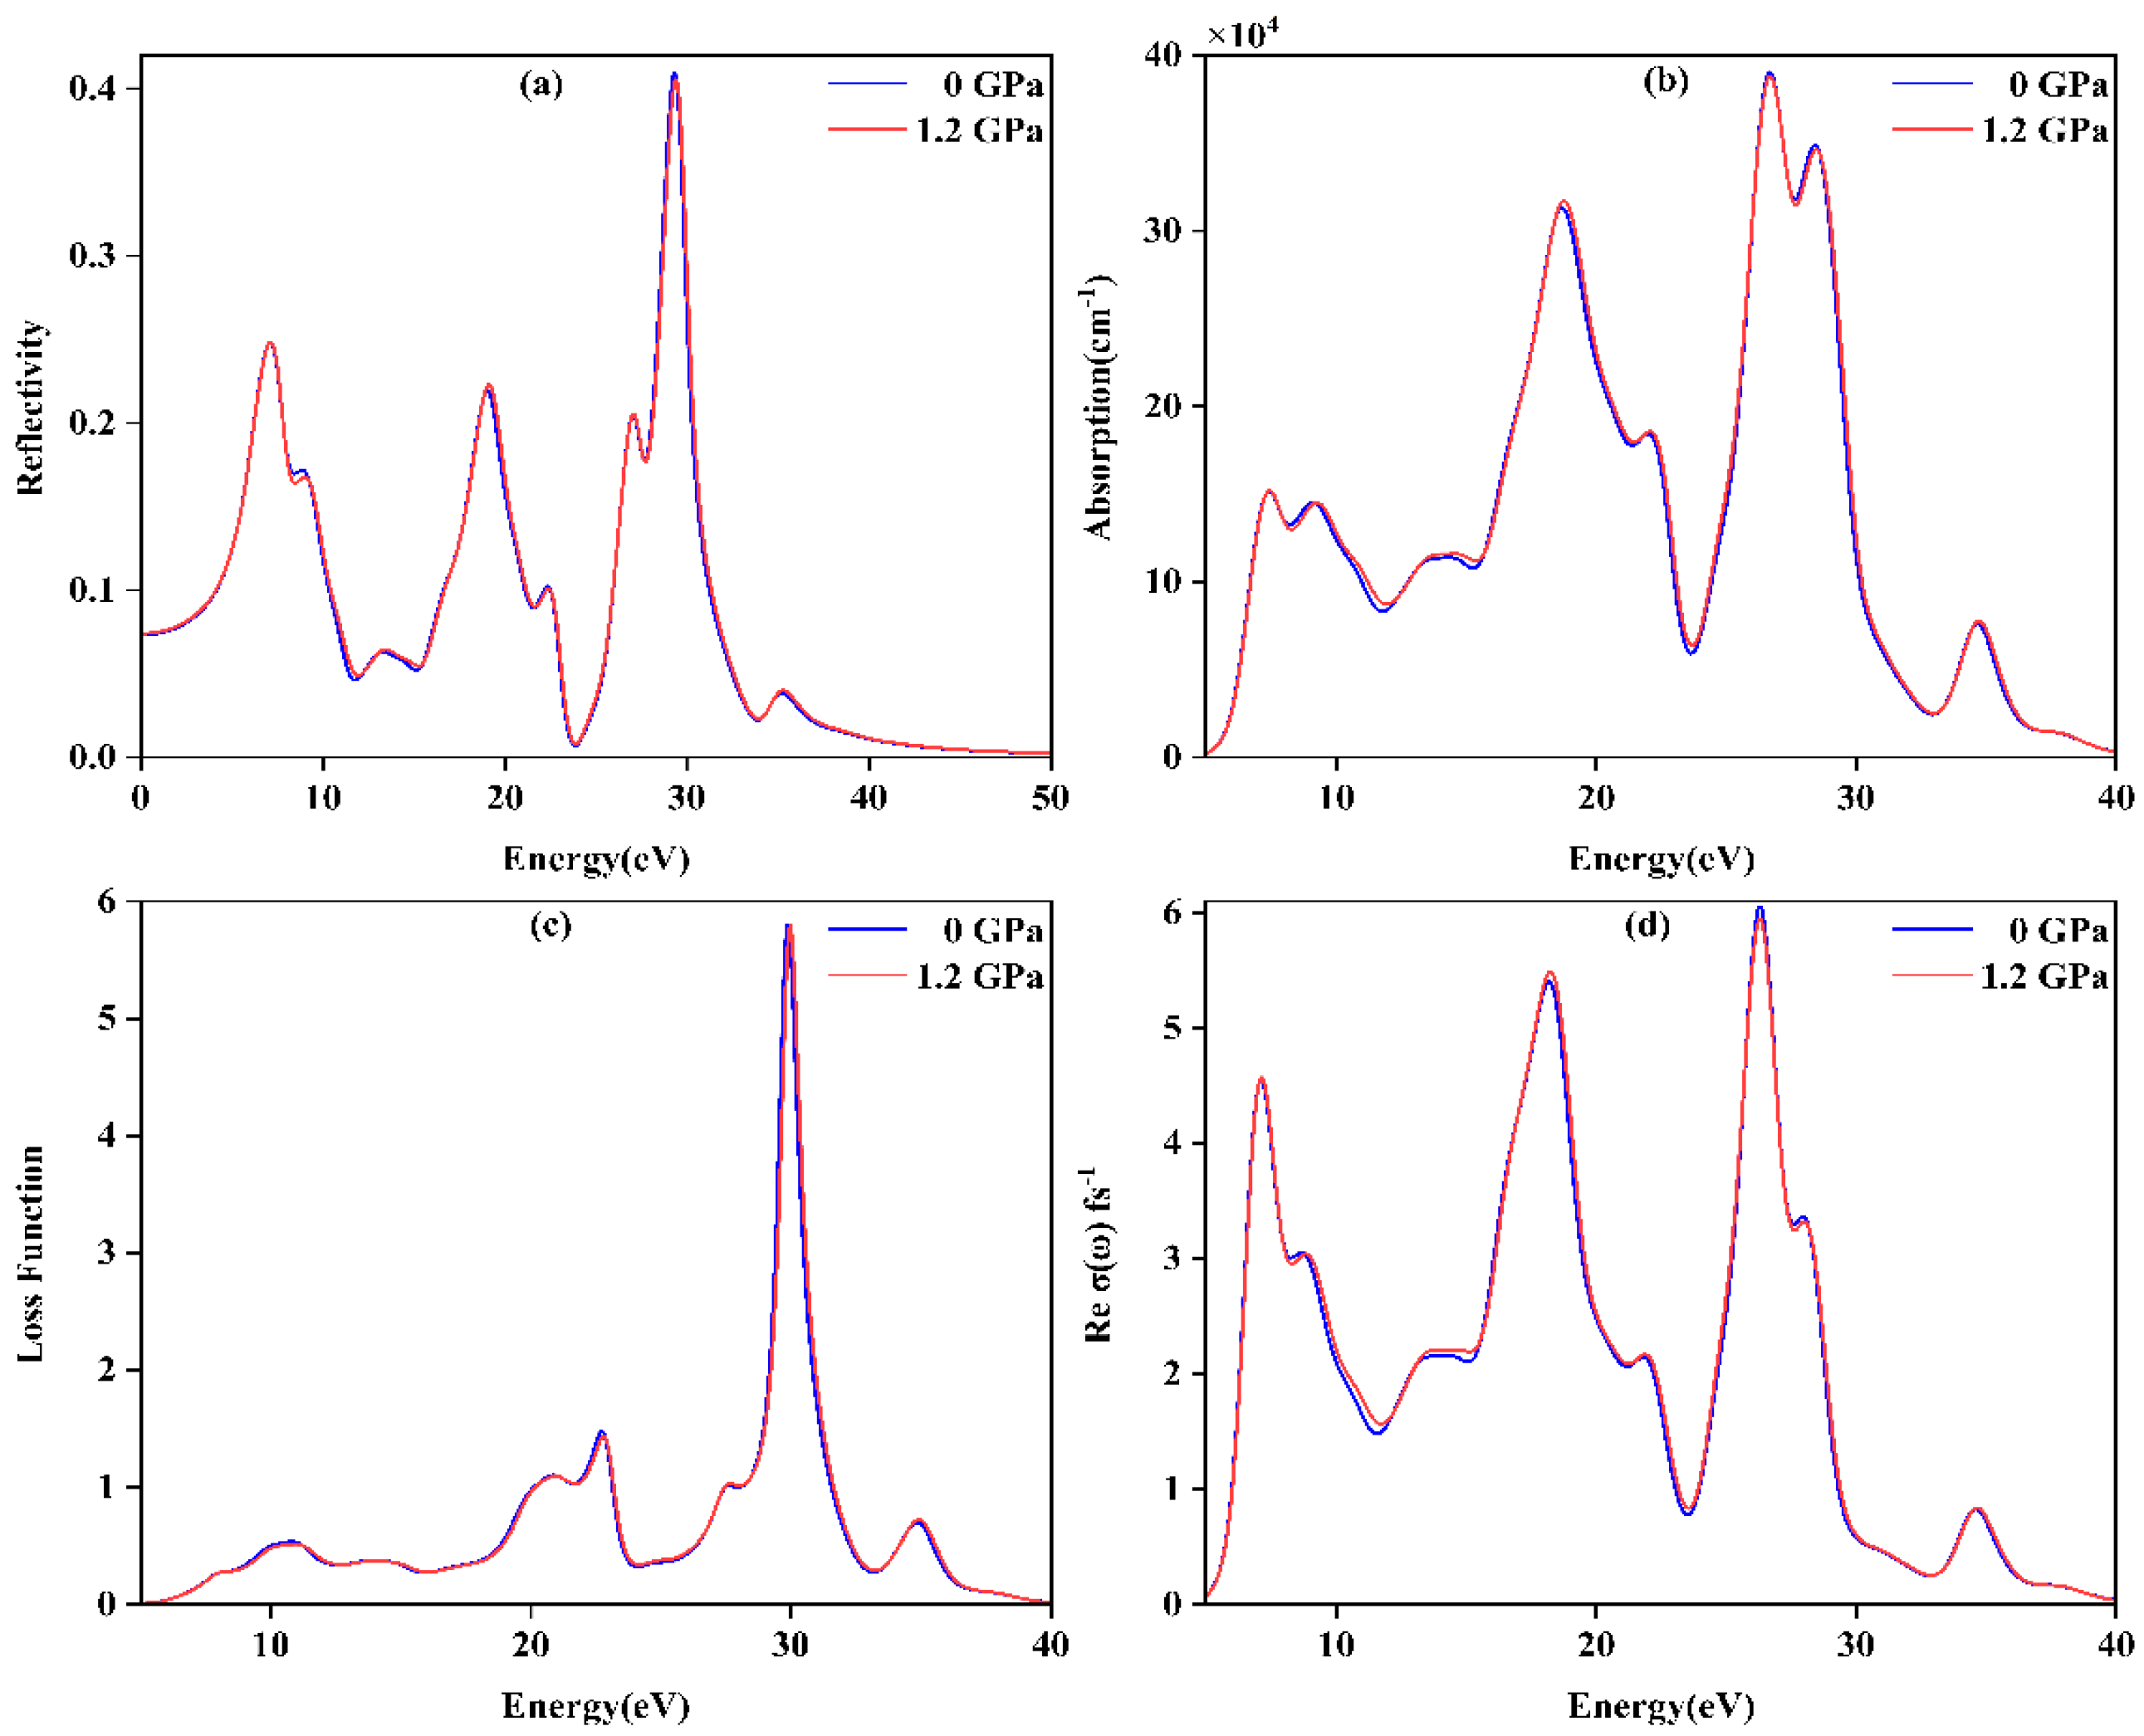
3.4. Optical Properties

The interaction between a material’s structure and electromagnetic radiation is directly related to its optical properties, which are crucial in determining its photophysical behavior and impact on absorption, transmission, and reflection spectra. From an optoelectronic perspective, the interaction with visible light is particularly significant. The response to incident radiation is wholly contingent upon a multitude of energy-dependent (frequency) optical parameters, including the real and imaginary components of the dielectric constant ε 1 ( ω ) and ε 2 ( ω ), the real component of the refractive index n ( ω ), and so forth. Furthermore, the imaginary part of the optical index k ( ω ); the loss function L ( ω ); the real and imaginary parts of the photoconductivity, respectively; the reflectance R ( ω ); and the absorption coefficient α ( ω ) are also of significance. The theoretical underpinnings and computational methodologies enable deriving these critical optical constants from first principles [44]. In this investigation, we have focused on the optical parameters when the electric field polarization vector is aligned with the [100] direction and the light propagates along the [001] direction. The results obtained for the calculations of CaCO3 at 0 GPa, 0.4 GPa, 0.8 GPa, and 1.2 GPa are presented in Figure 14 and Figure 15.
The figures demonstrate how the real and imaginary parts of the dielectric function, the refractive index, and the extinction coefficient of CaCO3 vary with pressure. These variations are illustrated in Figure 14. The phase velocity of the electromagnetic wave within the sample is dictated by the real component of the refractive index, while the measured attenuation is given by the imaginary component. As illustrated, the refractive index n ( ω ) exhibits a similar trajectory to that of ε 1 ( ω ), while the imaginary part of the optical index k ( ω ) displays a comparable trend to that of ε 2 ( ω ). In accordance with the principles of optics, the real and imaginary parts of the refractive index are inextricably linked to the dielectric constant, as demonstrated by the following equation: ε 1 ω   =   n 2 ω k 2 ω and ε 2 ω   =   2 n ω k ω [45].
The rate of decrease in the real part ε 1 ω of the dielectric function governs the magnitude of the imaginary part ε 2 ω peak, which directly correlates with optical absorption and quantifies the extent of electron excitation transitions. The peak position corresponds to the photon energy, with the variation as shown in Figure 14d. Comparative analysis reveals a pronounced increase in photon energy with elevated pressure. By integrating band structure (Figure 12) and density of states (Figure 13) analyses, the dielectric peaks in CaCO3 are linked to electronic transitions between valence and conduction bands. Figure 14d reveals three distinct absorption peaks, with the feature centered at ~7 eV demonstrating markedly enhanced intensity relative to the other two. This spectral characteristic is predominantly attributed to electronic transitions from O-2p to Ca-3d orbitals. The observation aligns consistently with orbital-resolved DOS profiles, where O-2p states dominate the valence band edge, while Ca-3d orbitals contribute significantly to the conduction band at higher energy levels.
The reflectivity is defined as the ratio of the energy of the reflected wave to the energy of the incident wave. The reflectivity spectrum is illustrated in Figure 15a. The reflectivity exhibits peaks at 5 eV, 20 eV, and 30 eV, with the highest at 20 eV under 1.2 GPa and at 30 eV under 0 GPa. The peak at 6 eV is likely due to interband transitions or excitonic effects consistent with the intrinsic bandgap of calcite. The peaks at 20 eV and 30 eV may arise from collective electron oscillations (plasmons) or many-body excited states. Further theoretical calculations and high-precision experiments are required to validate this phenomenon.
In the analysis of a material’s optical characteristics, the energy-dependent loss function is a crucial parameter, as depicted in Figure 15c. The energy loss function, L ( ω )   = Im ( 1 ε 2 ( ω ) ) , quantifies the energy dissipated by a material per unit of frequency. It facilitates comprehension of the shielded excitation spectrum, particularly the collective excitation generated by fast charges traversing a solid. Energy loss reaches a maximum at a particular incident light frequency (energy), which is designated as the bulk screened plasma frequency. As illustrated in Figure 15c, a pronounced electromagnetic loss peak is evident. This suggests that the fundamental excitation spectrum is relatively monochromatic.
Figure 15b illustrates the absorption spectrum. The absorption coefficient indicates the level of penetration that light at a particular wavelength can undergo within the material before it is absorbed, and it also offers insights into the potential for optimal solar energy conversion efficiency. A comparison of Figure 15b,d reveals a striking similarity between the absorption coefficient curves and the real parts of the photoconductivity curves, particularly in terms of their overall trend. The curves of α ( ω ) in the 0–40 eV range exhibit no discernible broad peaks, indicating that the coupling between the electronic leaps in the material and the lattice vibrations or other electrons is markedly weak and contributes to the propagation of the photons in CaCO3.

4. Conclusions

This study employs first-principles calculations to systematically investigate the structural, elastic, dynamic, and optical properties of trigonal calcium carbonate (CaCO3) under hydrostatic pressures of 0–1.2 GPa. Optimized lattice parameters align closely with established theoretical and experimental values, confirming the reliability of the computational approach. Calculated elastic constants and moduli show steady increases with pressure while adhering to the Born–Huang criteria for mechanical stability, verifying CaCO3′s robust mechanical integrity under pressure conditions. By quantifying elastic anisotropy through the universal anisotropy index, three-dimensional elastic modulus surfaces, and two-dimensional projections, we demonstrate pronounced pressure-dependent anisotropy, which intensifies progressively with compression. Additionally, pressure-induced variations in optical properties clarify the modulation mechanisms of electromagnetic interactions. These findings establish theoretical foundations for understanding CaCO3’s structural responses, mechanical behavior, and optical functionalization potential in pressure environments. The computational insights presented here may guide future experimental studies and inform strategies for optimizing this material’s performance.

Author Contributions

Investigation, supervision, S.F.; writing—review and editing, writing—original draft, X.Z.; formal analysis, Q.L.; methodology, writing—review and editing, H.H.; software, H.G. All authors have read and agreed to the published version of the manuscript.

Funding

This research was funded by WEBEST INTERLINING (NANTONG) CO., LTD., grant number YG20240326005.

Data Availability Statement

The original contributions presented in the study are included in the article. Further inquiries can be directed to the corresponding author.

Acknowledgments

We gratefully acknowledge the technical support from the School of Materials Science and Engineering, Yancheng Institute of Technology.

Conflicts of Interest

The authors declare that this study received funding from WEBEST INTERLINING (NANTONG) CO., LTD. The funder was not involved in the study design, collection, analysis, interpretation of data, the writing of this article or the decision to submit it for publication.

References

  1. Yao, X.; Xie, C.; Dong, X.; Oganov, A.R.; Zeng, Q. Novel high-pressure calcium carbonates. Phys. Rev. B 2018, 98, 014108. [Google Scholar] [CrossRef]
  2. Schmidt, C.A.; Tambutté, E.; Venn, A.A.; Zou, Z.; Alvarez, C.C.; Devriendt, L.S.; Bechtel, H.A.; Stifler, C.A.; Anglemyer, S.; Breit, C.P.; et al. Myriad Mapping of nanoscale minerals reveals calcium carbonate hemihydrate in forming nacre and coral biominerals. Nat. Commun. 2024, 15, 1812. [Google Scholar] [CrossRef]
  3. Zhou, J.; Chen, H.; Guo, Y.; Chen, Q.; Ren, H.; Tao, Y. Changes in metal adsorption ability of microplastics upon loss of calcium carbonate filler masterbatch through natural aging. Sci. Total Environ. 2022, 832, 155142. [Google Scholar] [CrossRef]
  4. Mishra, S.; Shimpi, N.G.; Mali, A.D. Influence of stearic acid treated nano-CaCO3 on the properties of silicone nanocomposites. J. Polym. Res. 2011, 18, 1715–1724. [Google Scholar] [CrossRef]
  5. Zhu, C.; Fang, Y.; Wei, H. Carbonation-cementation of recycled hardened cement paste powder. Constr. Build. Mater. 2018, 192, 224–232. [Google Scholar] [CrossRef]
  6. Rada, R.; Manea, D.L.; Nowakowski, A.; Rada, S. Nanocomposites Derived from Construction and Demolition Waste for Cement: X-ray Diffraction, Spectroscopic and Mechanical Investigations. Nanomaterials 2024, 14, 890. [Google Scholar] [CrossRef] [PubMed]
  7. Liu, Z.; Du, J.; Meng, W. Achieving low-carbon cementitious materials with high mechanical properties using CaCO3 suspension produced by CO2 sequestration. J. Clean. Prod. 2022, 373, 133546. [Google Scholar] [CrossRef]
  8. Fu, J.; Leo, C.P.; Show, P.L. Recent advances in the synthesis and applications of pH-responsive CaCO3. Biochem. Eng. J. 2022, 187, 108446. [Google Scholar] [CrossRef]
  9. Remy, M.T.; Ding, Q.; Krongbaramee, T.; Hu, J.; Mora Mata, A.V.; Haes, A.J.; Amendt, B.A.; Sun, H.; Buchakjian, M.R.; Hong, L. Plasmid Encoding miRNA-200C Delivered by CaCO3-Based Nanoparticles Enhances Rat Alveolar Bone Formation. Nanomedicine 2022, 17, 1339–1354. [Google Scholar] [CrossRef] [PubMed]
  10. Tao, T.; Zhu, Z.; Jia, S.; Tang, W.; Gong, J. Bioinspired transparent ultratough birefringent photonic films with engineerable interference colors derived from in-situ synthesis of CaCO3. Chem. Eng. J. 2024, 498, 155148. [Google Scholar] [CrossRef]
  11. Available online: https://oqmd.org/materials/entry/3547 (accessed on 4 March 2025).
  12. Available online: https://materialsproject.org/materials/mp-3953/ (accessed on 4 March 2025).
  13. Singh, A.K.; Kennedy, G.C. Compression of Calcite to 40 kbar. J. Geophys. Res. 1974, 79, 2615–2622. [Google Scholar] [CrossRef]
  14. Thanh, D.V.; Lacam, A. Experimental study of the elasticity of single crystalline calcite under high pressure (the calcite I–calcite II transition at 14.6 kbar). Phys. Earth Planet. Inter. 1984, 34, 195–203. [Google Scholar] [CrossRef]
  15. Merrill, L.; Bassett, W.A. The Crystal Structure of CaCO3(II), a High-Pressure Metastable Phase of Calcium Carbonate. Acta Cryst. B 1975, 31, 343–349. [Google Scholar] [CrossRef]
  16. Brik, M.G. First-principles calculations of structural, electronic, optical and elastic properties of magnesite MgCO3 and calcite CaCO3. Phys. B 2011, 406, 1004–1012. [Google Scholar] [CrossRef]
  17. Prencipe, M.; Pascale, F.; Zicovich-Wilson, C.M.; Saunders, V.R.; Orlando, R.; Dovesi, R. The vibrational spectrum of calcite (CaCO3): An ab initio quantum-mechanical calculation. Phys. Chem. Miner. 2004, 31, 559–564. [Google Scholar] [CrossRef]
  18. Chessin, H.; Hamilton, W.C.; Post, B. Position and thermal parameters of oxygen atoms in calcite. Acta Cryst. 1965, 18, 689–693. [Google Scholar] [CrossRef]
  19. Pilati, T.; Demartin, F.; Gramaccioli, C.M. Lattice-Dynamical Estimation of Atomic Displacement Parameters in Carbonates: Calcite and Aragonite CaCO3, Dolomite CaMg(CO3)2 and Magnesite MgCO3. Acta Cryst. B 1998, 54, 515–523. [Google Scholar] [CrossRef]
  20. Maslen, E.N.; Streltsov, V.A.; Streltsova, N.R.; Ishizawa, N. Electron density and optical anisotropy in rhombohedral carbonates. III. Synchrotron X-ray studies of CaCO3, MgCO3 and MnCO3. Acta Cryst. B 1995, 51, 929–939. [Google Scholar] [CrossRef]
  21. Payne, M.C.; Teter, M.P.; Allan, D.C.; Arias, T.A.; Joannopoulos, A.J. Iterative minimization techniques for ab initio total-energy calculations: Molecular dynamics and conjugate gradients. Rev. Mod. Phys. 1992, 64, 1045–1097. [Google Scholar] [CrossRef]
  22. Clark, S.J.; Segall, M.D.; Pickard, C.J.; Hasnip, P.J.; Probert, M.I.; Refson, K.; Payne, M.C. First principles methods using CASTEP. Z. Kristallogr. 2005, 220, 567–570. [Google Scholar] [CrossRef]
  23. Perdew, J.P.; Burke, K.; Ernzerhof, M. Generalized Gradient Approximation Made Simple. Phys. Rev. Lett. 1996, 77, 3865–3868. [Google Scholar] [CrossRef]
  24. Lin, J.S.; Qteish, A.; Payne, M.C.; Heine, V. Optimized and transferable nonlocal separable ab initio pseudopotentials. Phys. Rev. B 1993, 47, 4174–4180. [Google Scholar] [CrossRef]
  25. Catti, M.; Pavese, A.; Apra, E.; Roetti, C. Quantum-mechanical Hartree-Fock study of calcite (CaCO3) at variable pressure, and comparison with magnesite (MgCO3). Phys. Chem. Miner. 1993, 20, 104–110. [Google Scholar] [CrossRef]
  26. Markgraf, S.A.; Reeder, R.J. High-temperature structure refinements of calcite and magnesite. Am. Mineral. 1985, 70, 590–600. [Google Scholar]
  27. Golosova, N.O.; Kozlenko, D.P.; Kichanov, S.E.; Lukin, E.V.; Dubrovinsky, L.S.; Mammadov, A.I.; Mehdiyeva, R.Z.; Jabarov, S.H.; Liermann, H.P.; Glazyrin, K.V.; et al. Structural, magnetic and vibrational properties of multiferroic GaFeO3 at high pressure. J. Alloys Compd. 2016, 684, 352–358. [Google Scholar] [CrossRef]
  28. Birch, F.J. Equation of State and Thermodynamic Parameters of NaC1 to 300 kbar in the High-Temperature Domain. J. Geophys. Res. 1986, 91, 4949–4954. [Google Scholar] [CrossRef]
  29. Gao, J.; Liu, Q.J.; Tang, B. Elastic stability criteria of seven crystal systems and their application under pressure: Taking carbon as an example. J. Appl. Phys. 2023, 133, 135901. [Google Scholar] [CrossRef]
  30. Pavese, A.; Catti, M.; Parker, S.C.; Wall, A. Modelling of the thermal dependence of structural and elastic properties of calcite, CaCO3. Phys. Chem. Miner. 1996, 23, 89–93. [Google Scholar] [CrossRef]
  31. Dandekar, D.P. Pressure Dependence of the Elastic Constants of Calcite. Phys. Rev. 1968, 172, 873–877. [Google Scholar] [CrossRef]
  32. Voigt, W. Lehrbuch der Kristallphysik (mit Ausschluss der Kristalloptik); Vieweg+Teubner Verlag: Wiesbaden, Germany, 1928; Volume XXVI, p. 979. [Google Scholar] [CrossRef]
  33. Reuss, A. Berechnung der Fließgrenze von Mischkristallen auf Grund der Plastizitätsbedingung für Einkristalle. Z. Angew. Math. Mech. 1929, 9, 49–58. [Google Scholar] [CrossRef]
  34. Hill, R. The Elastic Behaviour of a Crystalline Aggregate. Proc. Phys. Soc. A 1952, 65, 349–354. [Google Scholar] [CrossRef]
  35. Liu, Z.J.; Sun, X.W.; Zhang, C.R.; Zhang, S.J.; Zhang, Z.R.; Jin, N.Z. First-principles calculations of high-pressure physical properties anisotropy for magnesite. Sci. Rep. 2022, 12, 3691. [Google Scholar] [CrossRef] [PubMed]
  36. Tian, Y.; Xu, B.; Zhao, Z. Microscopic theory of hardness and design of novel superhard crystals. Int. J. Refract. Met. Hard Mater. 2012, 33, 93–106. [Google Scholar] [CrossRef]
  37. Pugh, S.F. Relations between the elastic moduli and the plastic properties of polycrystalline pure metals. Philos. Mag. 1954, 45, 823–843. [Google Scholar] [CrossRef]
  38. Yang, J.; Shahid, M.; Wan, C.; Jing, F.; Pan, W. Anisotropy in elasticity, sound velocities and minimum thermal conductivity of zirconia from first-principles calculations. J. Eur. Ceram. Soc. 2017, 37, 689–699. [Google Scholar] [CrossRef]
  39. Panda, K.B.; Chandran, K.S.R. Determination of elastic constants of titanium diboride (TiB2) from first principles using FLAPW implementation of the density functional theory. Comput. Mater. Sci. 2006, 35, 134–150. [Google Scholar] [CrossRef]
  40. Ranganathan, S.I.; Ostoja-Starzewski, M. Universal elastic anisotropy index. Phys. Rev. Lett. 2008, 101, 055504. [Google Scholar] [CrossRef]
  41. Vahldiek, F.W.; Mersol, S.A. Anisotropy in Single-Crystal Refractory Compounds; Springer: Berlin/Heidelberg, Germany, 1968. [Google Scholar] [CrossRef]
  42. Gaillac, R.; Pullumbi, P.; Coudert, F.X. ELATE: An open-source online application for analysis and visualization of elastic tensors. J. Phys. Condens. Matter 2016, 28, 275201. [Google Scholar] [CrossRef]
  43. Baer, D.R.; Blanchard, D.L., Jr. Studies of the calcite cleavage surface for comparison with calculation. Appl. Surf. Sci. 1993, 72, 295–300. [Google Scholar] [CrossRef]
  44. Sun, H.G.; Zhou, Z.X.; Yuan, C.X.; Yang, X.N. Research with KNbO3 Bulk and Surface Properties Based on Density Functional Theory. Chin. Phys. Lett. 2013, 30, 027302. [Google Scholar] [CrossRef]
  45. Kittel, C.; Masi, J.F. Introduction to Solid State Physics. Phys. Today 1953, 7, 18–19. [Google Scholar] [CrossRef]
Figure 1. Crystal structure of CaCO3.
Crystals 15 00712 g001
Figure 2. The pressure dependences of lattice parameters (a) and unit cell volume (b) of CaCO3.
Crystals 15 00712 g002
Figure 3. Influence of pressure on the C ij   of CaCO3 versus pressure.
Crystals 15 00712 g003
Figure 4. Illustration of the three-dimensional linear compressibility for CaCO3 at 0 GPa, 0.4 GPa, 0.8 GPa, and 1.2 GPa ((a,b,c,d), respectively).
Crystals 15 00712 g004
Figure 5. Illustration of the three-dimensional Poisson’s ratio for CaCO3 at 0 GPa, 0.4 GPa, 0.8 GPa, and 1.2 GPa ((a,b,c,d), respectively).
Crystals 15 00712 g005
Figure 6. Illustration of the three-dimensional shear modulus for CaCO3 at 0 GPa, 0.4 GPa, 0.8 GPa, and 1.2 GPa ((a,b,c,d), respectively).
Crystals 15 00712 g006
Figure 7. Illustration of the three-dimensional Young’s modulus for CaCO3 at 0 GPa, 0.4 GPa, 0.8 GPa, and 1.2 GPa ((a,b,c,d), respectively).
Crystals 15 00712 g007
Figure 8. Projections of linear compressibility for CaCO3 at 0 GPa, 0.4 GPa, 0.8 GPa, and 1.2 GPa ((a,b,c,d), respectively) onto xy, xz, and yz planes.
Crystals 15 00712 g008
Figure 9. Projections of Poisson’s ratio for CaCO3 at 0 GPa, 0.4 GPa, 0.8 GPa, and 1.2 GPa ((a,b,c,d), respectively) onto xy, xz, and yz planes.
Crystals 15 00712 g009
Figure 10. Projections of shear modulus for CaCO3 at 0 GPa, 0.4 GPa, 0.8 GPa, and 1.2 GPa ((a,b,c,d), respectively) onto xy, xz, and yz planes.
Crystals 15 00712 g010
Figure 11. Projections of Young’s modulus for CaCO3 at 0 GPa, 0.4 GPa, 0.8 GPa, and 1.2 GPa ((a,b,c,d), respectively) onto xy, xz, and yz planes.
Crystals 15 00712 g011
Figure 12. Electronic band structures of CaCO3 at 0 GPa (a), 0.4 GPa (b), 0.8 GPa (c), and 1.2 GPa (d).
Crystals 15 00712 g012
Figure 13. Total and partial density of states of CaCO3.
Crystals 15 00712 g013
Figure 14. The (a) refractive index n ( ω ) and (b) imaginary part of the optical index k ( ω ) and the (c) real and (d) imaginary parts of the dielectric function of the CaCO3 under various pressures.
Crystals 15 00712 g014
Figure 15. The (a) reflectivity, (b) absorption, (c) loss function, and (d) the real part of optical conductivity of the CaCO3 under various pressures.
Crystals 15 00712 g015
Table 1. Lattice parameters, density, and volume of CaCO3 crystal structures at different pressures.
Pressure (GPa) a (Å)c (Å)ρ (g/cm3)V3)
0Present5.047317.24992.62032380.564
Ref. [16]5.053317.3260-383.2
Ref. [17]5.049217.3430-382.9
Ref. [25]5.04517.504-385.9
Ref. [18]4.99316.9169-365.24
Ref. [19]4.99117.062-368.07
Ref. [20]4.98817.068-367.76
Ref. [26]4.98417.121-368.31
0.4Present5.039217.21272.63441378.530
0.8Present5.036117.13732.64919376.418
1.2Present5.030217.08812.66313374.447
Table 2. The elastic constants C ij (GPa) of CaCO3 were calculated at respective pressures of 0, 0.4, 0.8, and 1.2 GPa.
Pressure (GPa) C 11 (GPa) C 12 (GPa) C 13 (GPa) C 14 (GPa) C 33 (GPa) C 44 (GPa)
0Present140.3851.7649.1216.1779.8932.41
Ref. [30]1535550138237
Ref. [31]146.2659.7050.76−20.7685.3134.05
0.4Present141.0152.8050.5216.6680.3632.93
0.8Present145.0954.7751.8617.6382.0133.31
1.2Present148.2958.4855.5917.6683.4534.64
Table 3. Calculated bulk modulus B (GPa), shear modulus G (GPa), Young’s modulus E   (GPa), Poisson’s ratio v , and   B / G of CaCO3 under pressures varying between 0 and 1.2 GPa.
Pressure B V (GPa) B R (GPa) B (GPa) G V (GPa) G R (GPa) G (GPa) E (GPa) ν B / G H V
073.40467.70570.55535.86928.78932.32984.3610.30072.17574.4382
0.474.45068.67971.56435.89628.76632.33184.2980.30372.21354.3676
0.876.57370.38673.47936.60528.86632.73585.5080.30612.24474.3367
1.279.93173.19576.56336.86029.20133.03186.6340.31142.31794.2079
Table 4. Calculated wave velocities V l , V T , and V m ( km / s ) of CaCO3 under pressures of 0, 0.4, 0.8, and 1.2 GPa.
Pressure V m   ( km / s ) V l   ( km / s ) V t   ( km / s )
03.92416.58613.5125
0.43.91496.59763.5032
0.83.92946.64923.5152
1.23.93956.72953.5218
Table 5. Calculated elastic anisotropic indexes A B , A G , A E , and A U under different pressures.
Pressure A B A G A E A U
00.04030.10950.09741.3138
0.40.04040.11030.10121.3233
0.80.04210.11590.10691.4035
1.20.04390.11820.10851.4284
Table 6. The β min (TPa−1), β max (TPa−1), υ min , υ max , G min (GPa), G max (GPa), E min (GPa), and E max   (GPa) of 0 GPa, 0.4 GPa, 0.8 GPa, and 1.2 GPa.
Pressure (GPa) β min  (TPa−1) β max  (TPa−1) v min v max G min  (GPa) G max  (GPa) E min  (GPa) E max  (GPa)
02.92358.92290.03690.693421.12955.59154.773131.99
0.42.85028.86020.03780.704420.94356.09354.023133.27
0.82.73788.73170.02320.723820.63857.83955.090137.37
1.22.51558.63110.04130.724321.38558.16053.551139.26
Disclaimer/Publisher’s Note: The statements, opinions and data contained in all publications are solely those of the individual author(s) and contributor(s) and not of MDPI and/or the editor(s). MDPI and/or the editor(s) disclaim responsibility for any injury to people or property resulting from any ideas, methods, instructions or products referred to in the content.

