Article

Pressure Response of Crystalline Fluoranthene Probed by Raman Spectroscopy

by
Olga Karabinaki
1,
Stylianos Papastylianos
1,2,
Nayra Machín Padrón
2,3,4,
Antonios Hatzidimitriou
5,
Dimitrios Christofilos
1 and
John Arvanitidis
2,*
1
School of Chemical Engineering & Laboratory of Physics, Faculty of Engineering, Aristotle University of Thessaloniki, 54124 Thessaloniki, Greece
2
Physics Department, Aristotle University of Thessaloniki, 54124 Thessaloniki, Greece
3
Departamento de Física, Universidad de La Laguna, 38204 Tenerife, Spain
4
Instituto de Óptica ‘Daza de Valdés’, Spanish National Research Council (CSIC), 28006 Madrid, Spain
5
Chemistry Department, Aristotle University of Thessaloniki, 54124 Thessaloniki, Greece
*
Author to whom correspondence should be addressed.
Crystals 2025, 15(8), 697; https://doi.org/10.3390/cryst15080697 (registering DOI)
Submission received: 29 June 2025 / Revised: 24 July 2025 / Accepted: 29 July 2025 / Published: 30 July 2025

Abstract

The pressure response and structural stability of fluoranthene crystals up to 8 GPa are investigated using Raman spectroscopy. The vast majority of the Raman peaks upshift with pressure, either sublinearly (intermolecular modes) or quasilinearly (intramolecular modes), reflecting the bond hardening upon volume contraction. The frequency shifts, accompanied by intensity redistribution among the Raman peaks, are by far larger for the former than those for the latter vibrations, compatible with their nature: weak intermolecular van der Waals interactions and strong intramolecular covalent bonds. For pressures higher than 2 GPa, changes in the linear pressure coefficients of the Raman peak frequencies, mainly towards lower values, are observed. These are more pronounced for intermolecular and C–H stretching vibrations. For P > 4.7 GPa, the pressure coefficients are further reduced, while all the observed pressure-induced changes are fully reversible upon pressure release. These changes may be interpreted either as two structural transitions at ~2 and ~4.7 GPa or as a single, but sluggish, structural phase transition in the pressure range 2–4.7 GPa, featuring the reorientation and different stacking of the molecules. From the high-pressure Raman data in the low-pressure phase, a bulk modulus of ~7 GPa at ambient pressure is estimated for solid fluoranthene.

Graphical Abstract

1. Introduction

Molecular materials are ubiquitous across materials science and engineering, chemistry, and life sciences. Under specific pressure-temperature conditions, the crystalline structures they adopt are primarily determined by the packing of the molecules and thus significantly vary from material to material depending on the molecular shapes and mutual interactions. Since the intermolecular binding forces—van der Waals, π−π stacking, C–H···π and dipole-dipole interactions, or hydrogen and halogen bonding—are typically much weaker than the intramolecular covalent ones, the covalent frameworks of many molecules often remain very similar in the solid and gas phases [1]. Polycyclic aromatic hydrocarbons (PAHs)—consisting only of carbon and hydrogen atoms, with at least two aromatic rings in their structure—and their derivatives are a significant class of organic molecules forming molecular crystals [2,3]. Depending on the molecular structure and weight, PAHs are categorized into low-molecular-weight (LMW) and high-molecular-weight (HMW) PAHs. The latter—comprised of four or more benzene rings—are less soluble in water, more stable and more toxic than the former [2,3,4]. PAHs are usually byproducts of the incomplete combustion of biomass and fossil fuels, while the accelerating growth of the global economy has led to a significant increase in their emission [2,5,6]. They can be detected in the atmosphere, fresh and sea water, soil, sediments, or even in food as process residues, and they constitute enduring toxic pollutants, harmful to human health and ecosystems [3,4,5,6,7,8,9,10,11,12,13]. Nevertheless, despite their toxicity, PAHs and their derivatives have applications in a diverse array of industrial products, among which are drugs, plastics, dyes, semiconductors, liquid crystals, and optoelectronics [14,15,16,17,18]. Their prominence in the aforementioned fields arises from their unique physical and chemical properties, mainly resulting from the delocalization of π-electrons in the aromatic rings, significantly affected by their molecular structure [7,9,14,15,16,17,18,19,20].
Fluoranthene (C16H10) is a condensed PAH composed of four fused rings, including three aromatic six-membered rings and one non-aromatic five-membered ring (non-alternant compound) [8,21], whose classification as LMW or HMW is not clear because it sits on their boundary [22,23]. Its molecule is approximately planar with C2v symmetry and can be qualitatively viewed as a fused system resembling a phenyl ring joined to a naphthalene-like core [24,25]. In fluoranthene, the rigid planarized biphenyl moiety results in a wide bandgap, featuring intense blue fluorescence emission in the solid state and in solution, and it thermally and electrochemically stabilizes the system [25,26,27]. These properties make fluoranthene and its derivatives interesting systems for blue organic light-emitting diodes and solar cells, fluorescent probing and biological imaging, or optical waveguiding and integrated optical circuits [27,28,29,30,31]. In the solid state, fluoranthene has a monoclinic structure (space group: P21/n, lattice parameters: a = 19.907 Å, b = 6.211 Å, c = 18.349 Å, β = 109.86°, Z = 8), with the two independent molecules in the asymmetric unit slightly deviating from planarity [32]. Noticeably, the degrees of planarity and of molecular overcrowding and aggregation in the crystalline state affect PAHs’ carcinogenic activity and their efficiency for optoelectronic devices [30,33].
Pressure application is the “clean” method of choice to modify the conformation of molecules and their packing in the crystalline structure of molecular crystals, having a more profound effect on the relatively weak intermolecular interactions with respect to the strong intramolecular bonding [34,35,36]. Raman spectroscopy, directly probing both intermolecular (external) and intramolecular (internal) vibrations, is commonly the preferred technique for studying the response of molecular crystals and the evolution of the corresponding interactions with pressure [37,38,39]. Several crystalline LMW and HMW PAHs have been studied by Raman spectroscopy at high pressure, revealing subtle phase transitions even at low or moderate pressures (up to 8 GPa) [40,41,42,43,44,45,46,47,48,49,50,51,52]. These transitions are usually sluggish and reversible, and they are associated with symmetry and structural changes, molecular reorientations and stacking rearrangements, charge transfer processes, or changes in the π–electron density. On the other hand, phase transitions that occur at higher pressures are seldom reversible and they are attributed to severe structural and molecular alterations, such as dimerization and polymerization or even amorphization.
In the present study, the high-pressure response of fluoranthene crystals is examined through Raman spectroscopy, aiming to complement the existing knowledge in the field, regarding the corresponding behavior of quasi-planar PAHs in the solid state. This information for such systems is useful for their potential applications in the various fields mentioned above. As a first step, the fluoranthene samples were structurally and vibrationally characterized at ambient pressure. High pressure was then applied by means of a diamond anvil cell using glycerol as a pressure transmitting medium. Two distinct and reversible changes in the linear pressure coefficients of the Raman peak frequencies—mostly towards lower values—are observed, at ~2 and ~4.7 GPa. These are attributed to the structural modification of solid fluoranthene and the enhancement of the intermolecular interactions, without any significant alterations of the molecular shape. The pressure-induced structural modification is possibly associated with the molecular reorientation and stacking rearrangement at elevated pressures. Additionally, from the present high-pressure Raman data, a value of ~7 GPa for the bulk modulus of the crystalline fluoranthene at ambient pressure is also deduced.

2. Materials and Methods

The studied fluoranthene crystals (C16H10, purity > 98%) were purchased from Tokyo Chemical Industry Co., Ltd. (TCI, Tokyo, Japan) and used as received, without any further treatment/purification. The sample was structurally characterized by means of X-ray diffraction (XRD). For this purpose, a suitable single crystal of fluoranthene was mounted on a thin glass fiber with the aid of epoxy resin. XRD data were recorded on a Bruker Kappa Apex II CCD area-detector diffractometer (Bruker, Madison, WI, USA), equipped with a Mo Ka (λ = 0.71073 Å) sealed tube source operating at 50 kV and 30 mA and a Triumph monochromator at 295 K, using the φ and ω scans technique. The program Apex2 (Bruker AXS, 2006) (Bruker, Madison, WI, USA) was used for data collection and cell refinement. The collected data were integrated with the Bruker SAINT software package, version 1.0 [53], using a narrow-frame algorithm. Data were corrected for absorption using the numerical method SADABS [54], based on the crystal dimensions. The structure was solved using the SUPERFLIP package [55] and refined with full-matrix least-squares on F2 using the Crystals program package version 14.61 build 6236 [56]. Anisotropic displacement parameters were applied for all non-hydrogen atoms. Hydrogen atoms were found and refined using a riding model with isotropic displacement parameters Uiso (H) = 1.2Ueq (C) at C–H distances of 0.95 Å. Details of crystal data and structure refinement parameters are shown in Table S1 (Supplementary Materials).
Raman spectra were recorded by means of a micro-Raman LabRAM HR spectrometer (HORIBA, Kyoto, Japan), using the 632.8 nm line of a He-Ne laser for excitation. The excitation beam—at a low power of 0.4 mW to minimize laser heating—was focused on the studied sample by means of a 100× (focusing spot diameter: ~1 μm) or a 50× super-long-working-distance objective (focusing spot diameter: ~2 μm) for the ambient and the high-pressure measurements, respectively. The elastically scattered light from the sample was eliminated by means of an edge filter, appropriate for the excitation wavelength used, while the inelastically scattered light was dispersed by a 600 grooves/mm grating. The spectral width of the system was ~3.5 cm−1, while prior to each measurement a Ne reference lamp was employed for frequency calibration. Several fluoranthene crystals were examined by Raman spectroscopy at ambient conditions, exhibiting the same Raman peak frequencies—although with varying relative intensities—thus confirming the homogeneity of the sample. The density functional theory (DFT) calculations for the fluoranthene molecule in the C2v symmetry were performed using the Gaussian 16 package [57]. The Becke 3-Lee-Yang-Parr (B3LYP) hybrid functional with the 6-311+G(d,p) basis set was used [58,59,60]. Following the work of K. K. Onchoke et al. [61,62], all the calculated vibrational frequencies were uniformly scaled by 0.98, and the results are presented in Table S2 (Supplementary Materials).
The high-pressure Raman measurements were carried out using a mechanical Mao-Bell-type diamond anvil cell (DAC), equipped with a stainless-steel gasket pre-indented to a thickness of ~90 μm and featuring a central hole of ~140 μm in diameter as the sample chamber [63,64]. For consistency, the Raman spectra at various pressures were collected from the same spot of a randomly oriented fluoranthene crystal. Ruby chips were also inserted into this sample chamber for in situ pressure calibration, following the well-known R1 fluorescence line method [65,66]. The pressure transmitting medium (PTM) used in this study was pure glycerol (C3H5(OH)3, also commonly called glycerine), which was found not to interact with the fluoranthene crystals. Glycerol is a highly viscous fluid that solidifies at ~5.5 GPa at room temperature (glass transition), exhibiting very good hydrostaticity since the standard deviation of pressure remains smaller than 0.015 GPa up to the solidification pressure. At higher pressures—although the standard deviation increases quasilinearly, reaching the value of ~0.15 GPa at a mean pressure of ~8 GPa—it still remains a quite good hydrostatic medium in the pressure range of interest [67,68].

3. Results and Discussion

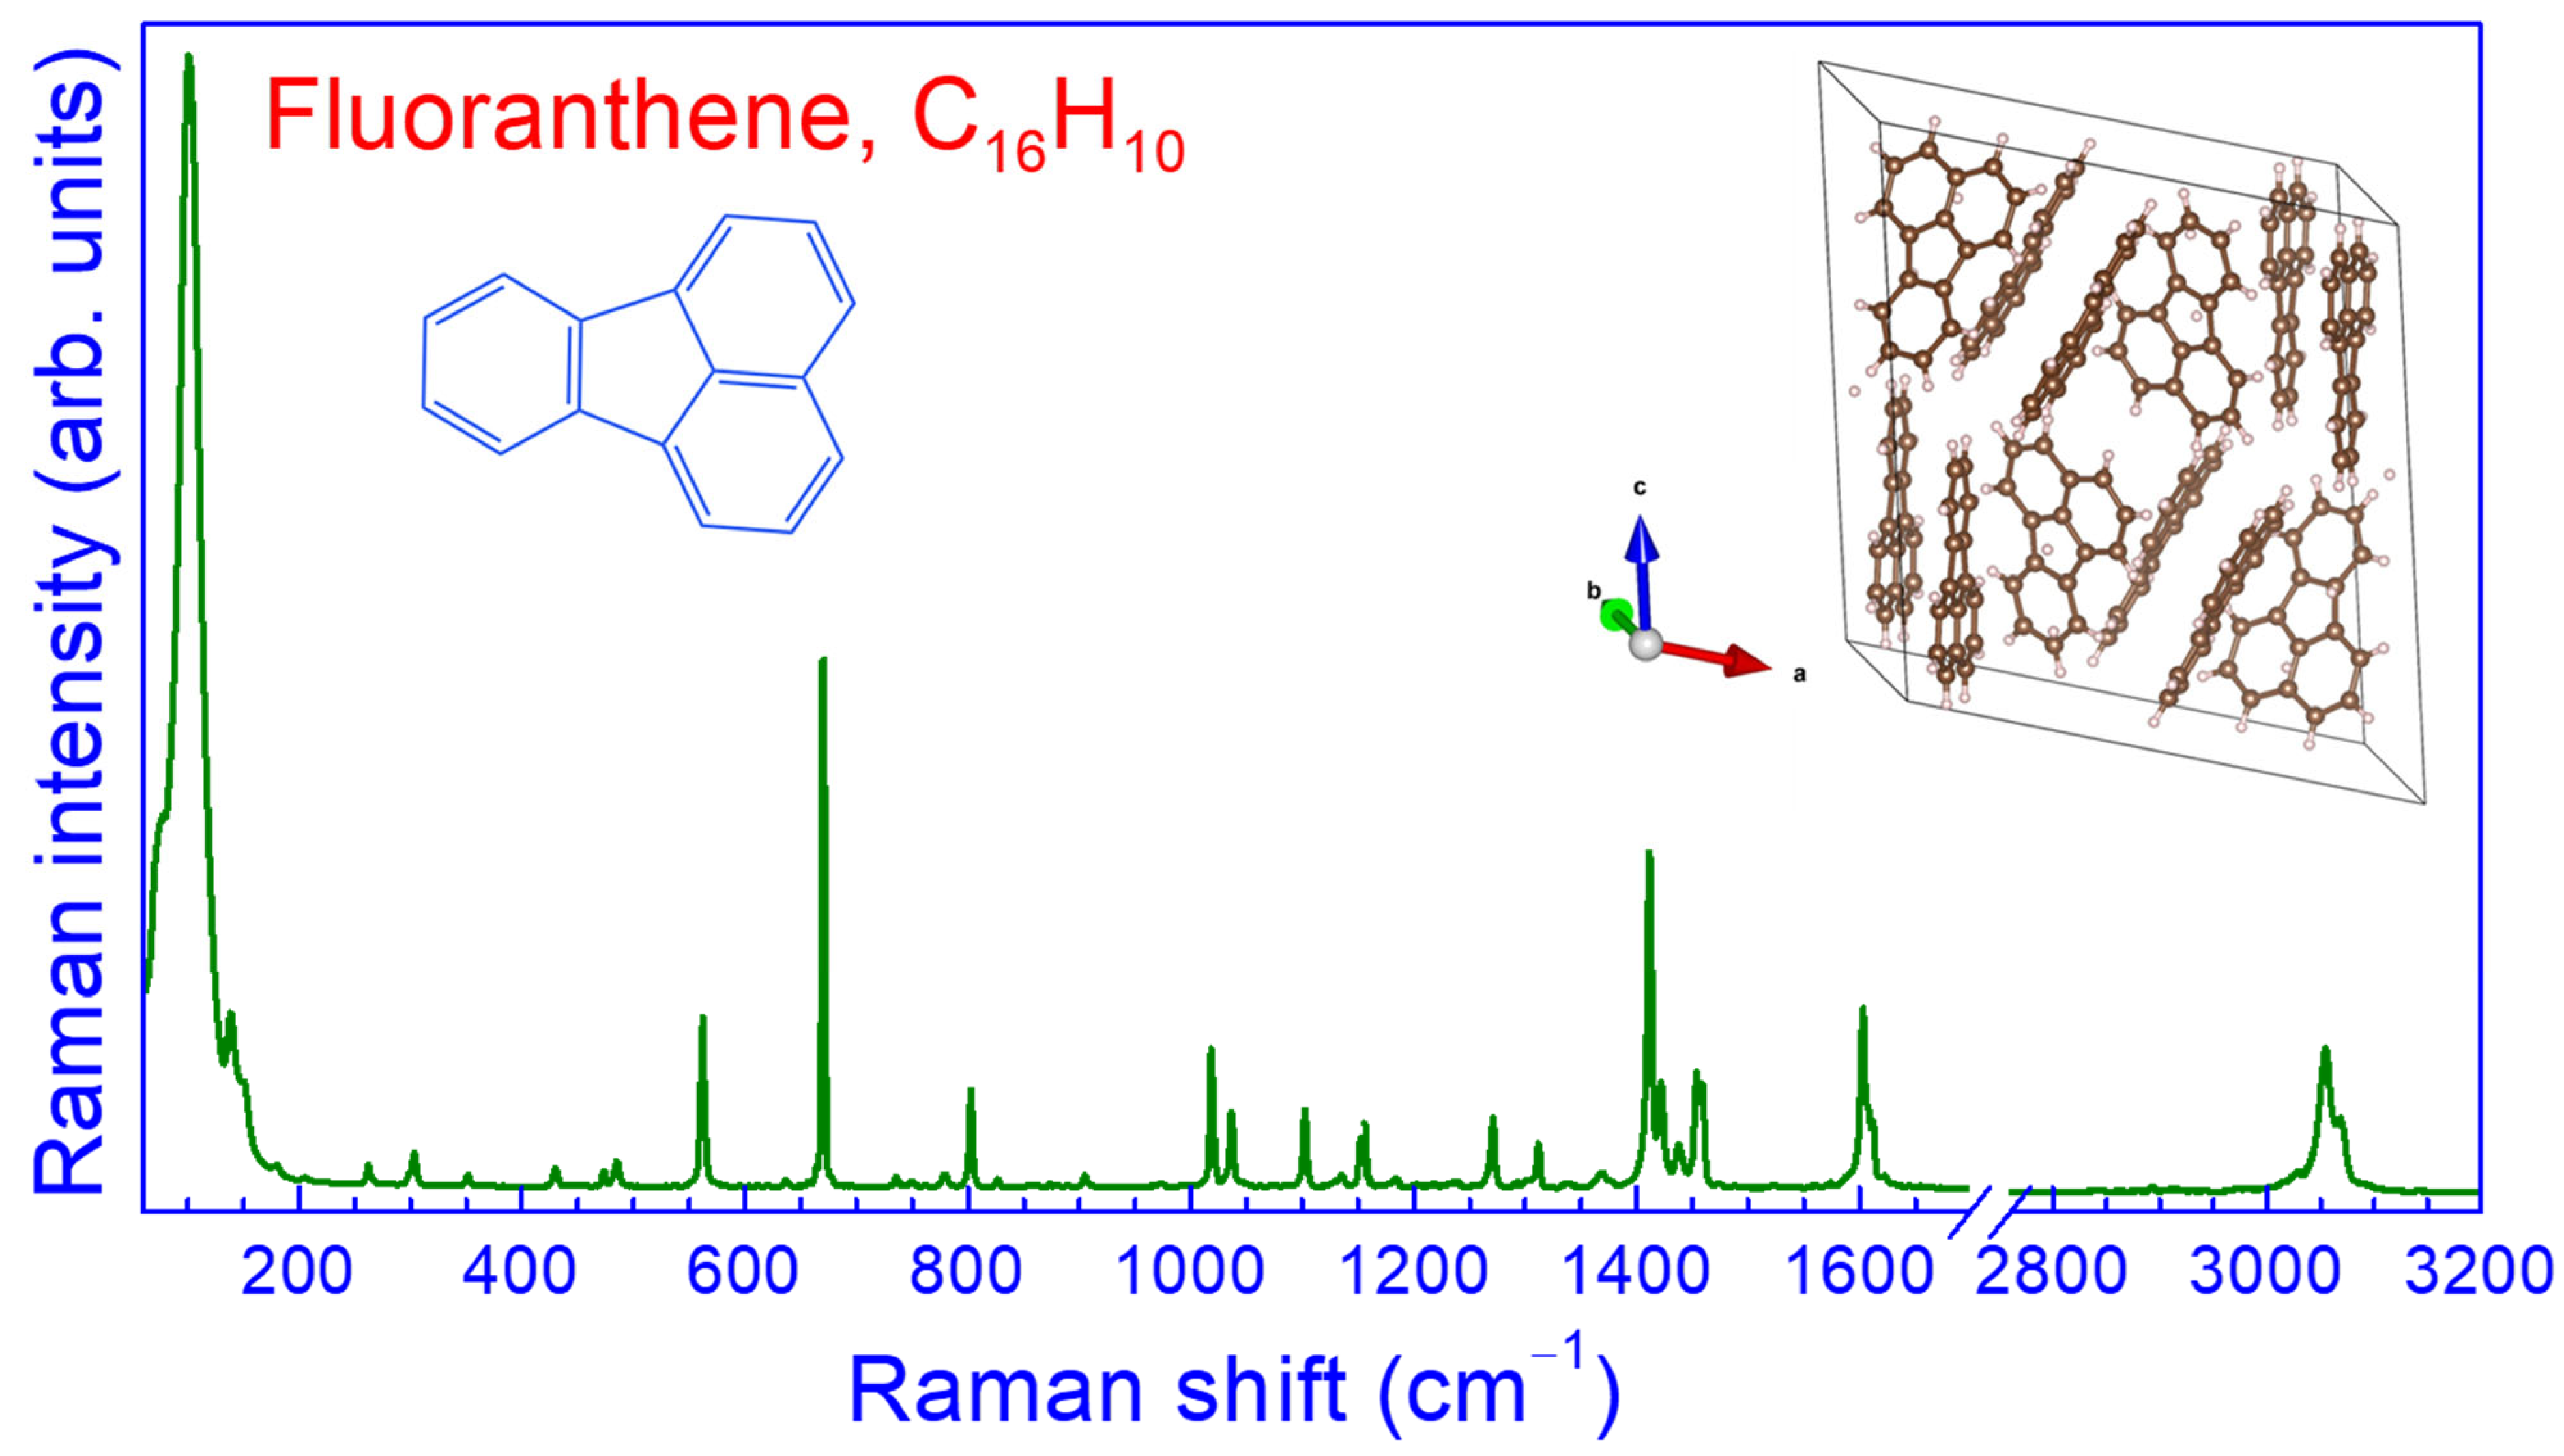
3.1. Crystal Structure and Raman Spectrum of Fluoranthene

From the analysis of the XRD data obtained for the studied fluoranthene sample at ambient conditions, a monoclinic crystal structure is deduced (space group: P21/n, with lattice parameters: a = 18.373(4) Å, b = 6.2292(11) Å, c = 19.881(4) Å, β = 109.964(6)° and Z = 8, Table S1), in full agreement with earlier investigations [32,69,70,71]. The unit cell of the crystal structure is depicted as an inset in Figure 1, using VESTA software, version 3.5.8 [72]. In this structure, the fluoranthene molecules remain quasi-planar (the maximum deviation from the best molecular plane is 0.05 Å), and they are arranged in a herringbone motif, minimizing the repulsive interactions and maximizing the van der Waals contacts. The angle between the best planes of the neighbor molecules is 63.52°, while that between those of the two molecules in the asymmetric unit is 71.11°. The herringbone molecular pattern and the absence of hydrogen bonding make the fluoranthene crystal a rather soft molecular solid.
The Raman spectrum of fluoranthene at ambient pressure is illustrated in Figure 1, and it is in good agreement with the corresponding literature [24,69]. It can be divided into three main spectral ranges: (i) the low-frequency range (ω < 200 cm−1), where mainly the intermolecular (lattice, external) vibrational modes—involving relative motions of species with heavier masses (molecules) and weak van der Waals interactions between them—are located; (ii) the intermediate-frequency range (200–1650 cm−1), where the intramolecular (internal) vibrational modes—involving relative motions of species with lighter masses (atoms) and strong covalent bonding between them—can be found; (iii) the high-frequency range (2900–3250 cm−1), containing the C–H stretching intramolecular vibrations and higher order vibrational modes (overtones and combinations).
For the isolated, planar fluoranthene molecule with 26 atoms, 72 optical normal modes of vibration are expected, distributed in the C2v point group among the various symmetry species according to the following:
Γvib = 25A1 + 11A2 + 12B1 + 24B2,
where A1 and Β2 vibrations are in plane, while A2 and Β1 vibrations are out of plane [24]. All vibrations are active in both Raman and infrared (IR) spectroscopy [61]. The experimentally observed Raman peaks were assigned in the literature to specific atomic vibrations in the molecule by means of a normal coordinate analysis and DFT calculations [24,61,62]. The vibrational frequencies calculated by the DFT method in the present work are in good agreement with the previous works [61,62,73] and were used in Table S2 to assign the various peaks in the Raman spectrum of fluoranthene.
Based on Porto’s group theoretical methods [74], for the crystalline fluoranthene with the P21/n space group and Z = 8, 621 optical modes of vibration are expected—excluding the 1Au + 2Bu translational modes—with the following symmetry species:
Γopt = 156Ag + 156Bg + 155Au + 154Bu.
From the 621 optical modes, 45 are expected with the following symmetry species:
Γext = 12Ag + 12Bg + 11Au + 10Bu
which can be considered as external (intermolecular modes). All the gerade (g) modes (symmetric with respect to inversion) are Raman active, whereas all the ungerade (u) modes (antisymmetric with respect to inversion) are IR active due to the presence of the inversion center of symmetry. Noticeably, the total number of the observed peaks in the Raman spectrum of the fluoranthene crystals at ambient pressure (Figure 1 and Table S2) is significantly smaller than that theoretically predicted. This is mainly due to weak intermolecular interactions that cause accidental degeneracies in the Raman peak frequencies, justifying the assignment of the peaks to the symmetry of the molecular modes from which they originate. However, pressure application can discriminate some of the accidentally degenerate modes because of the different pressure coefficients of their frequencies due to the enhancement of the intermolecular interactions at elevated pressures (vide infra).

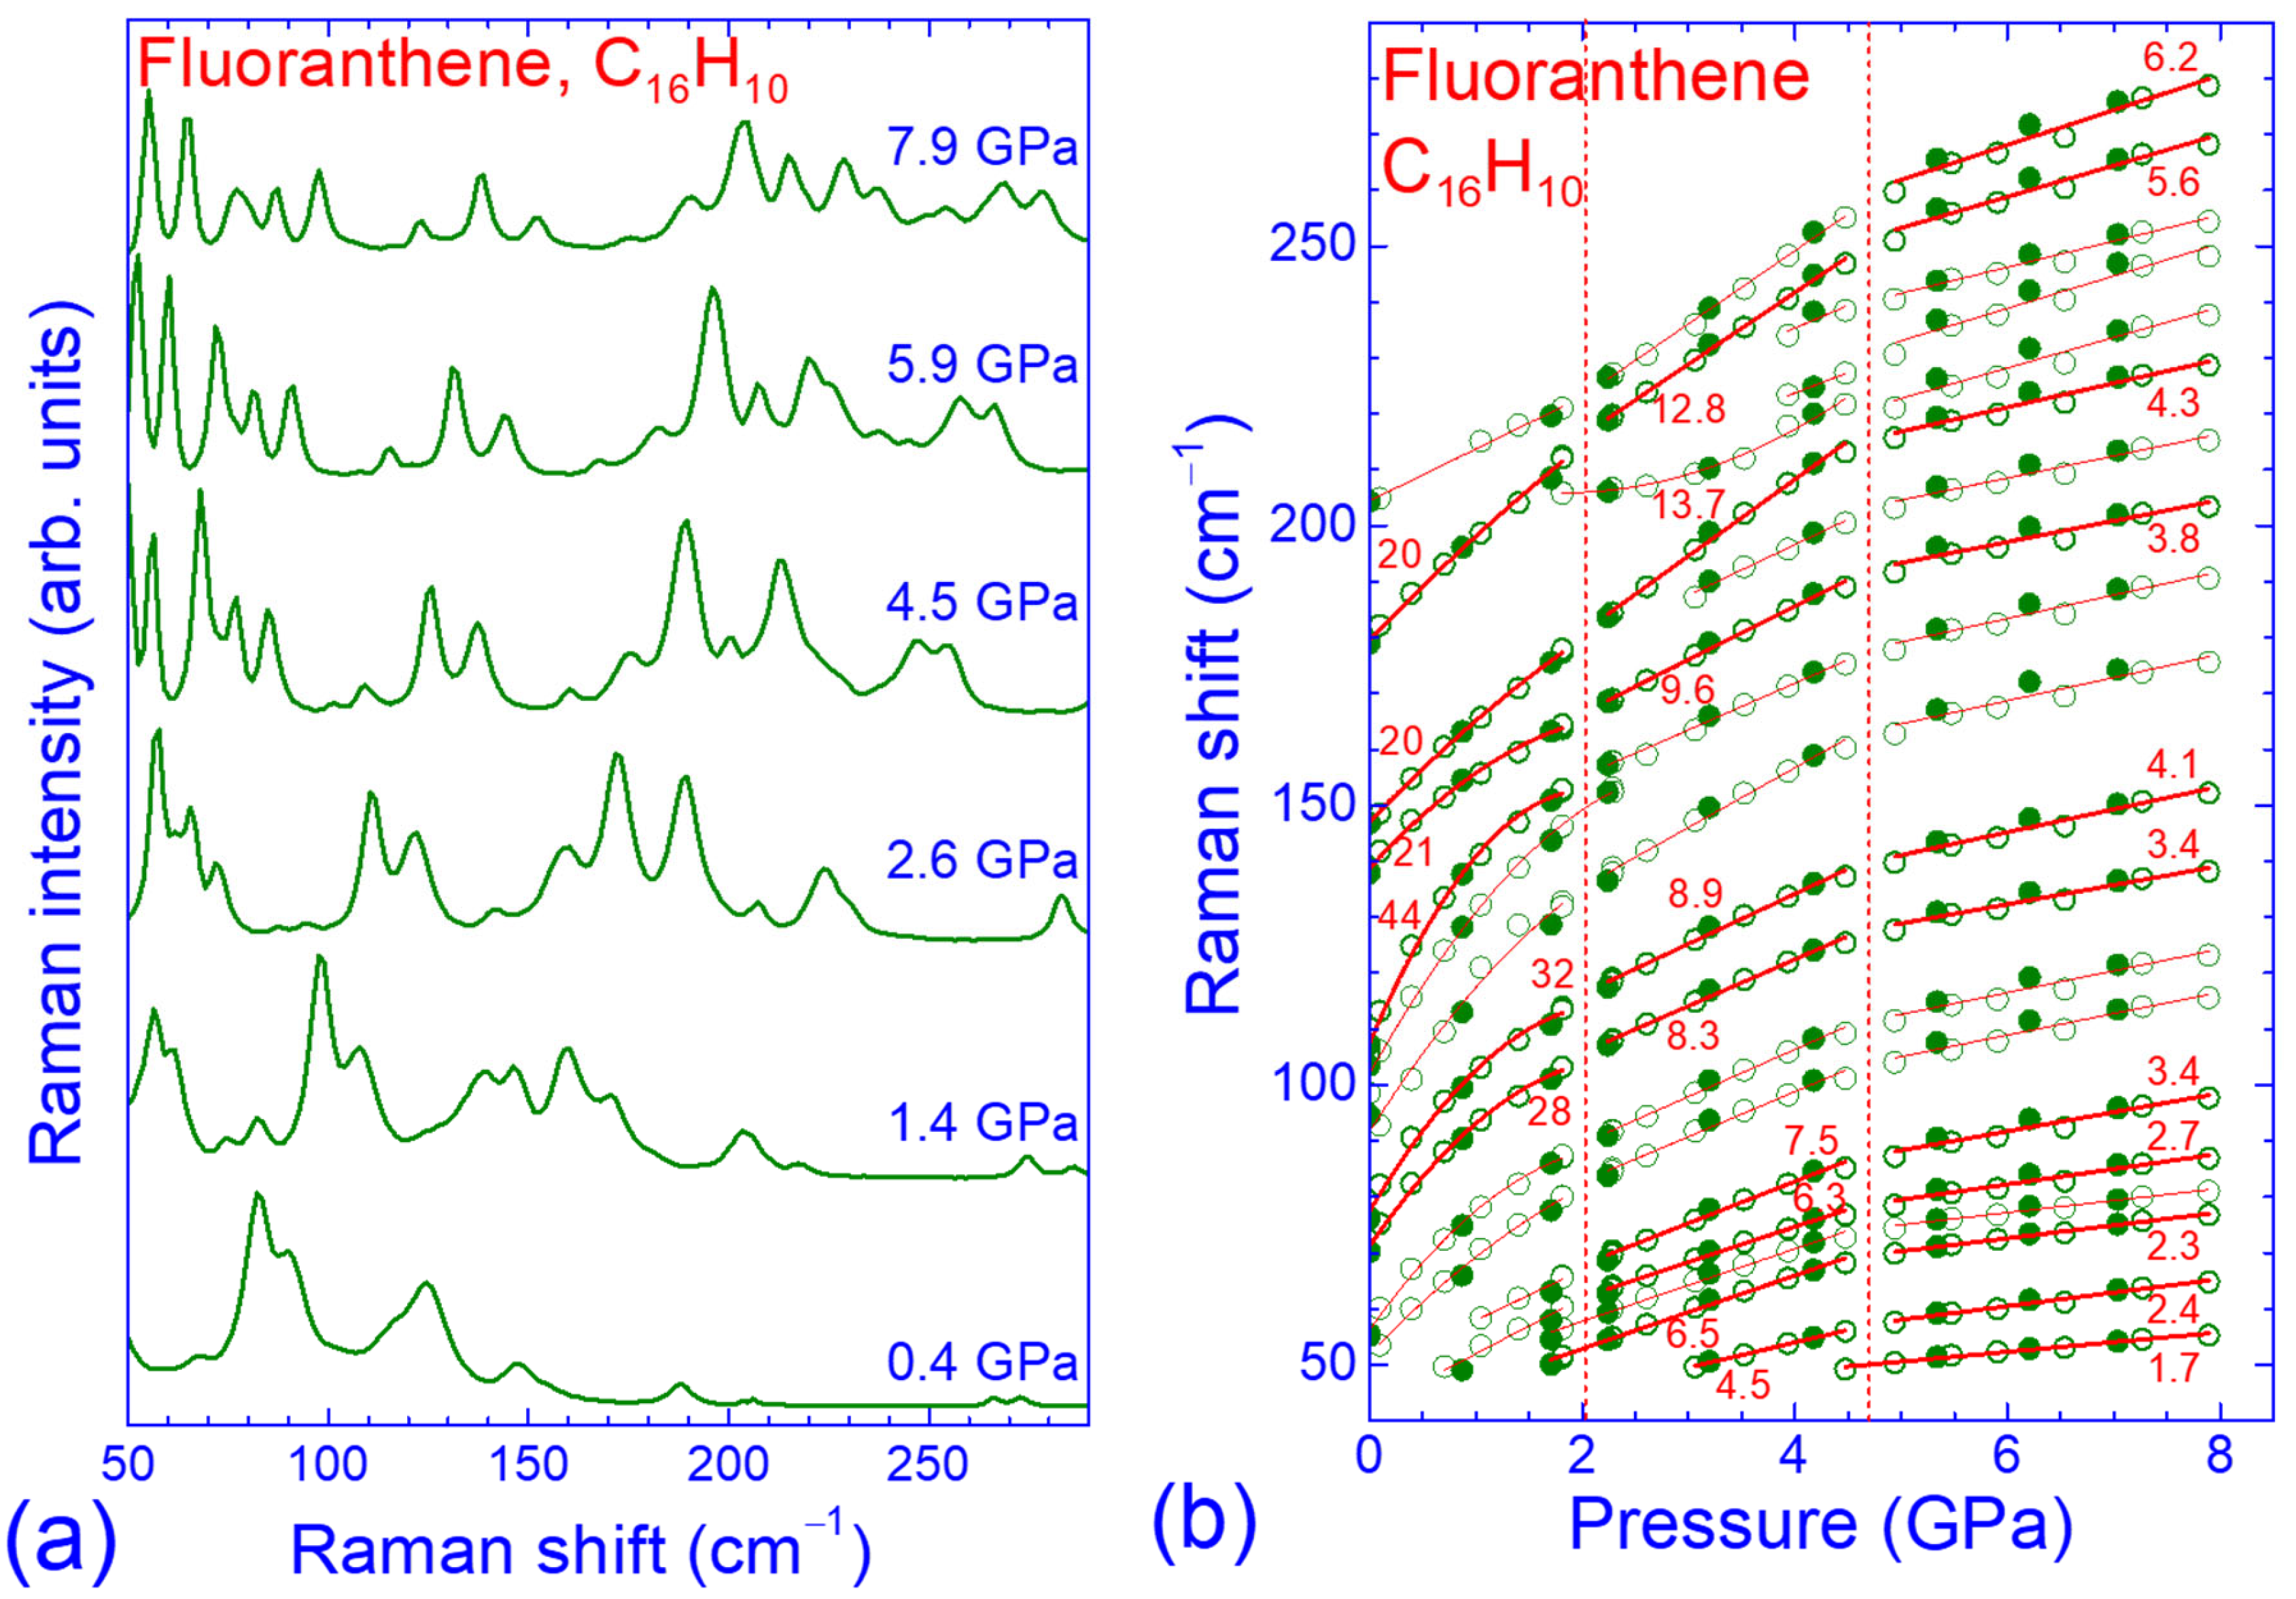
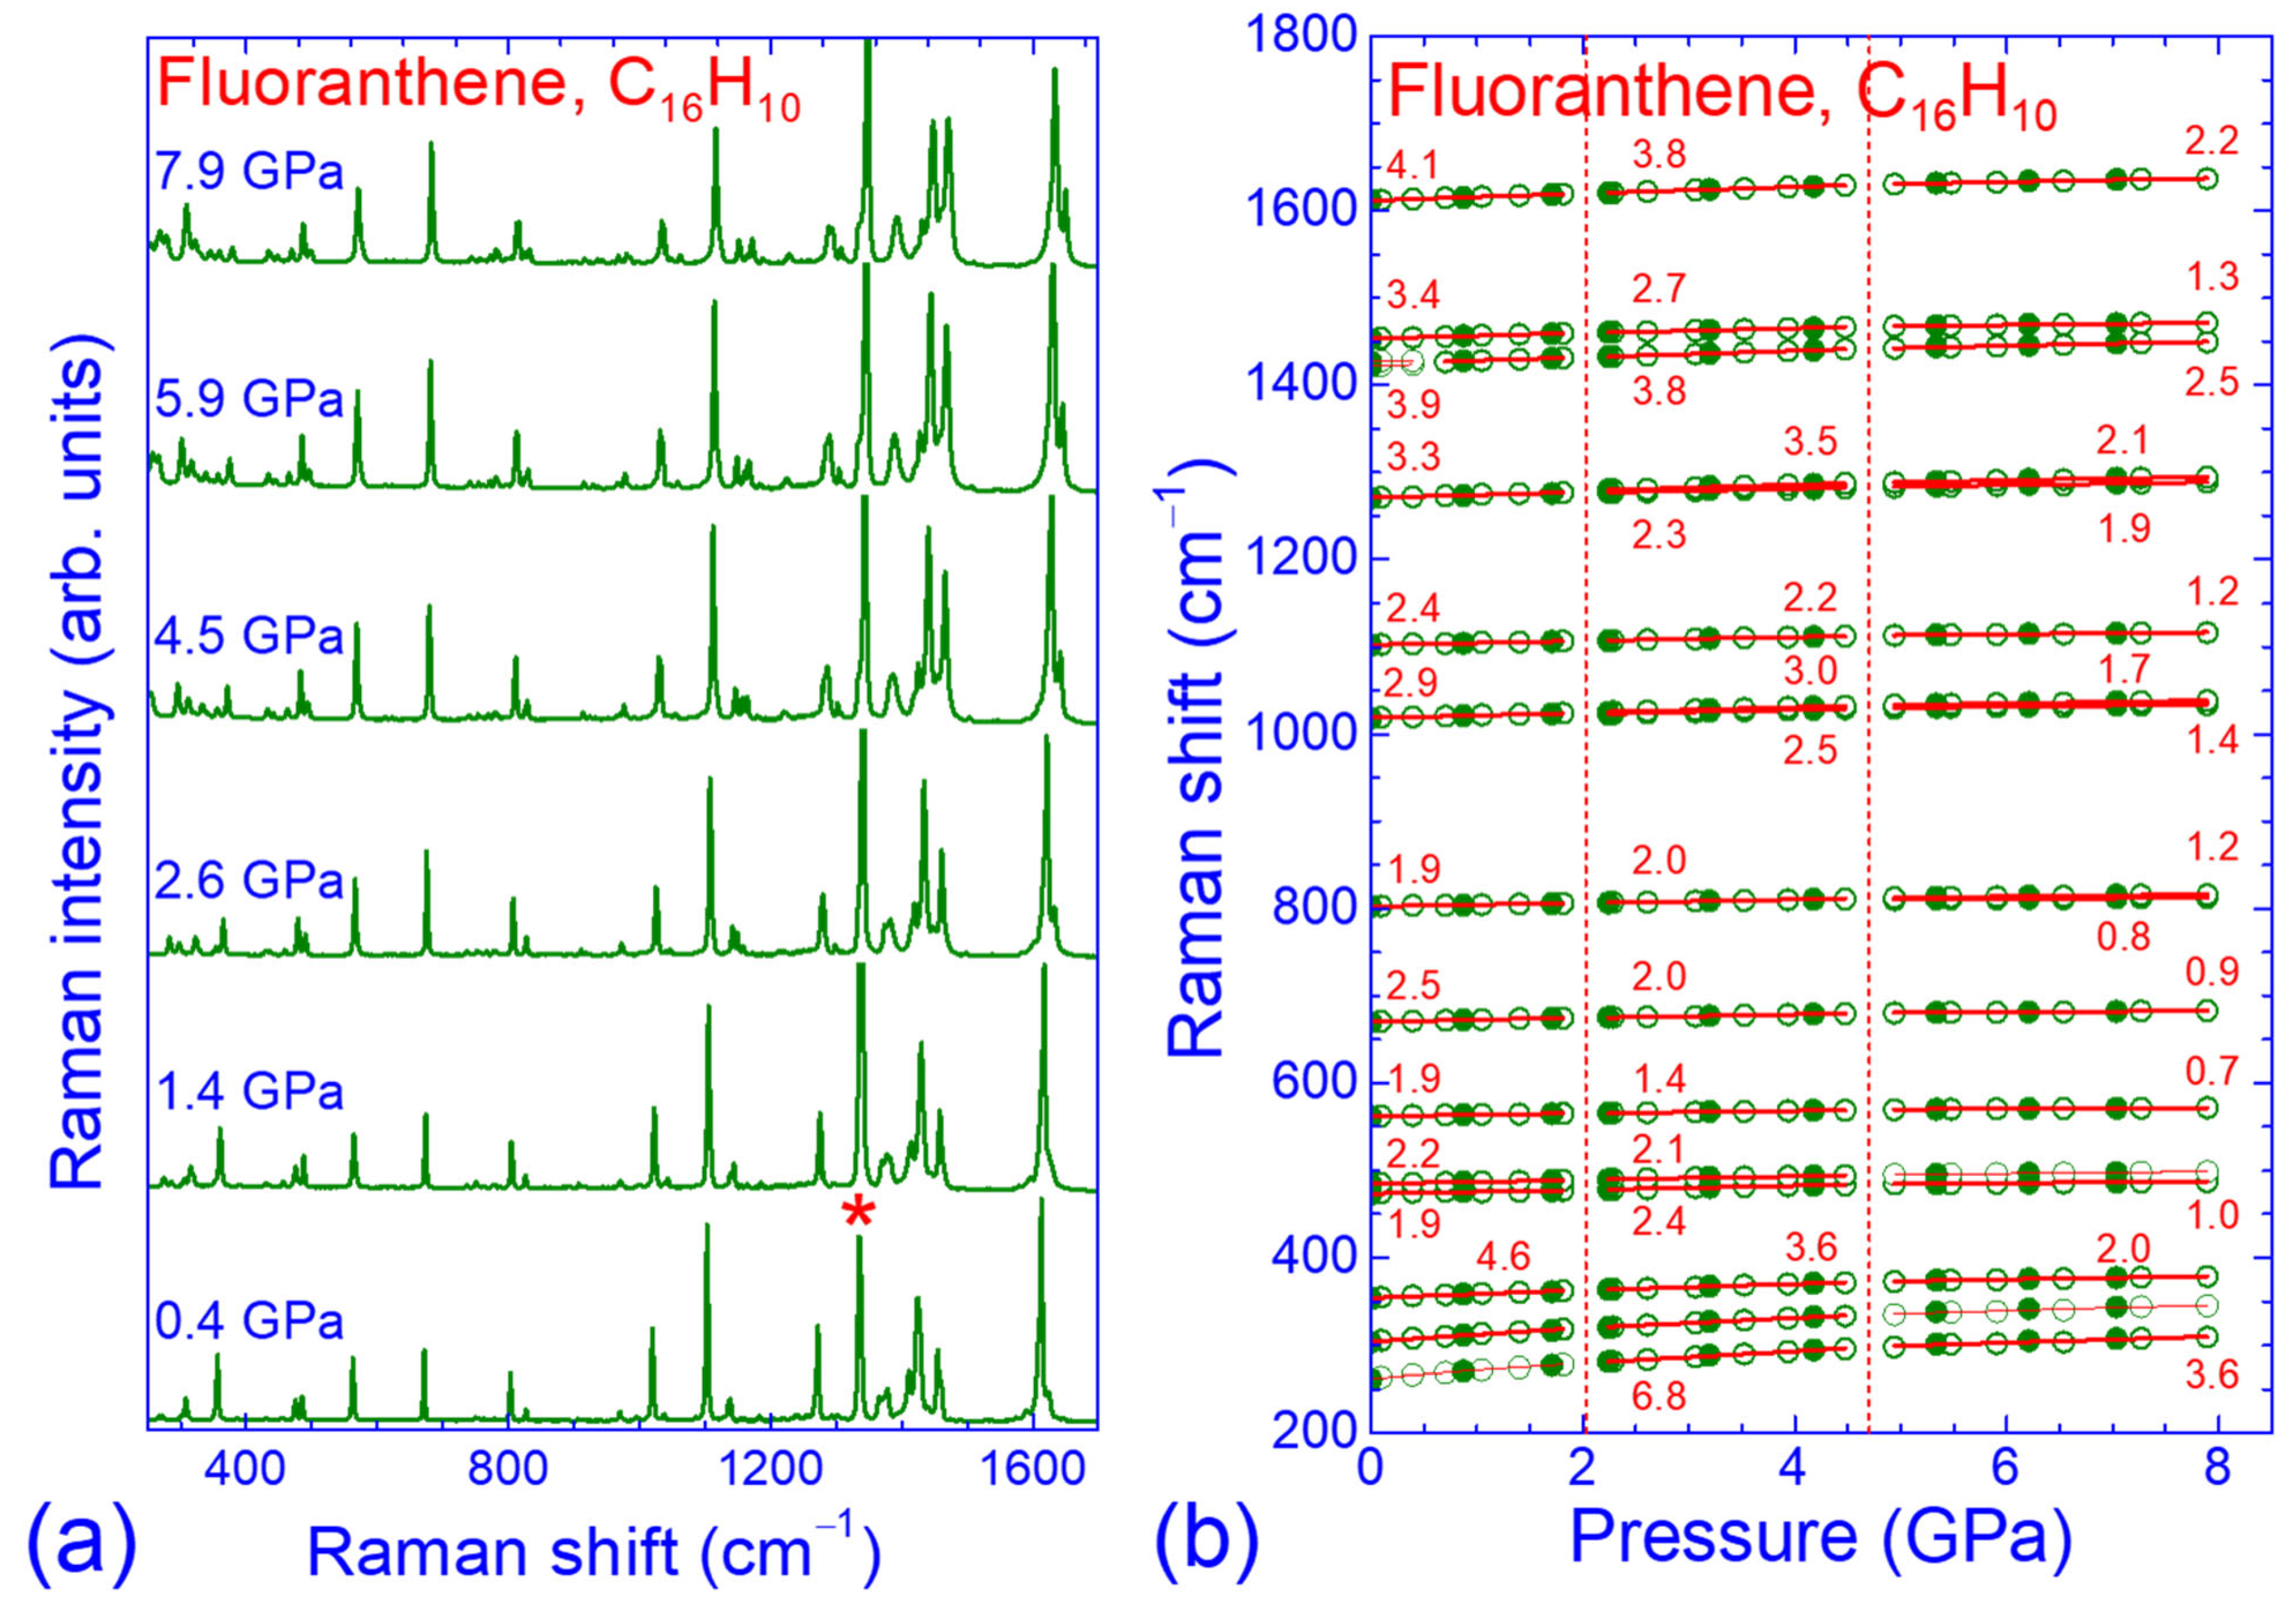
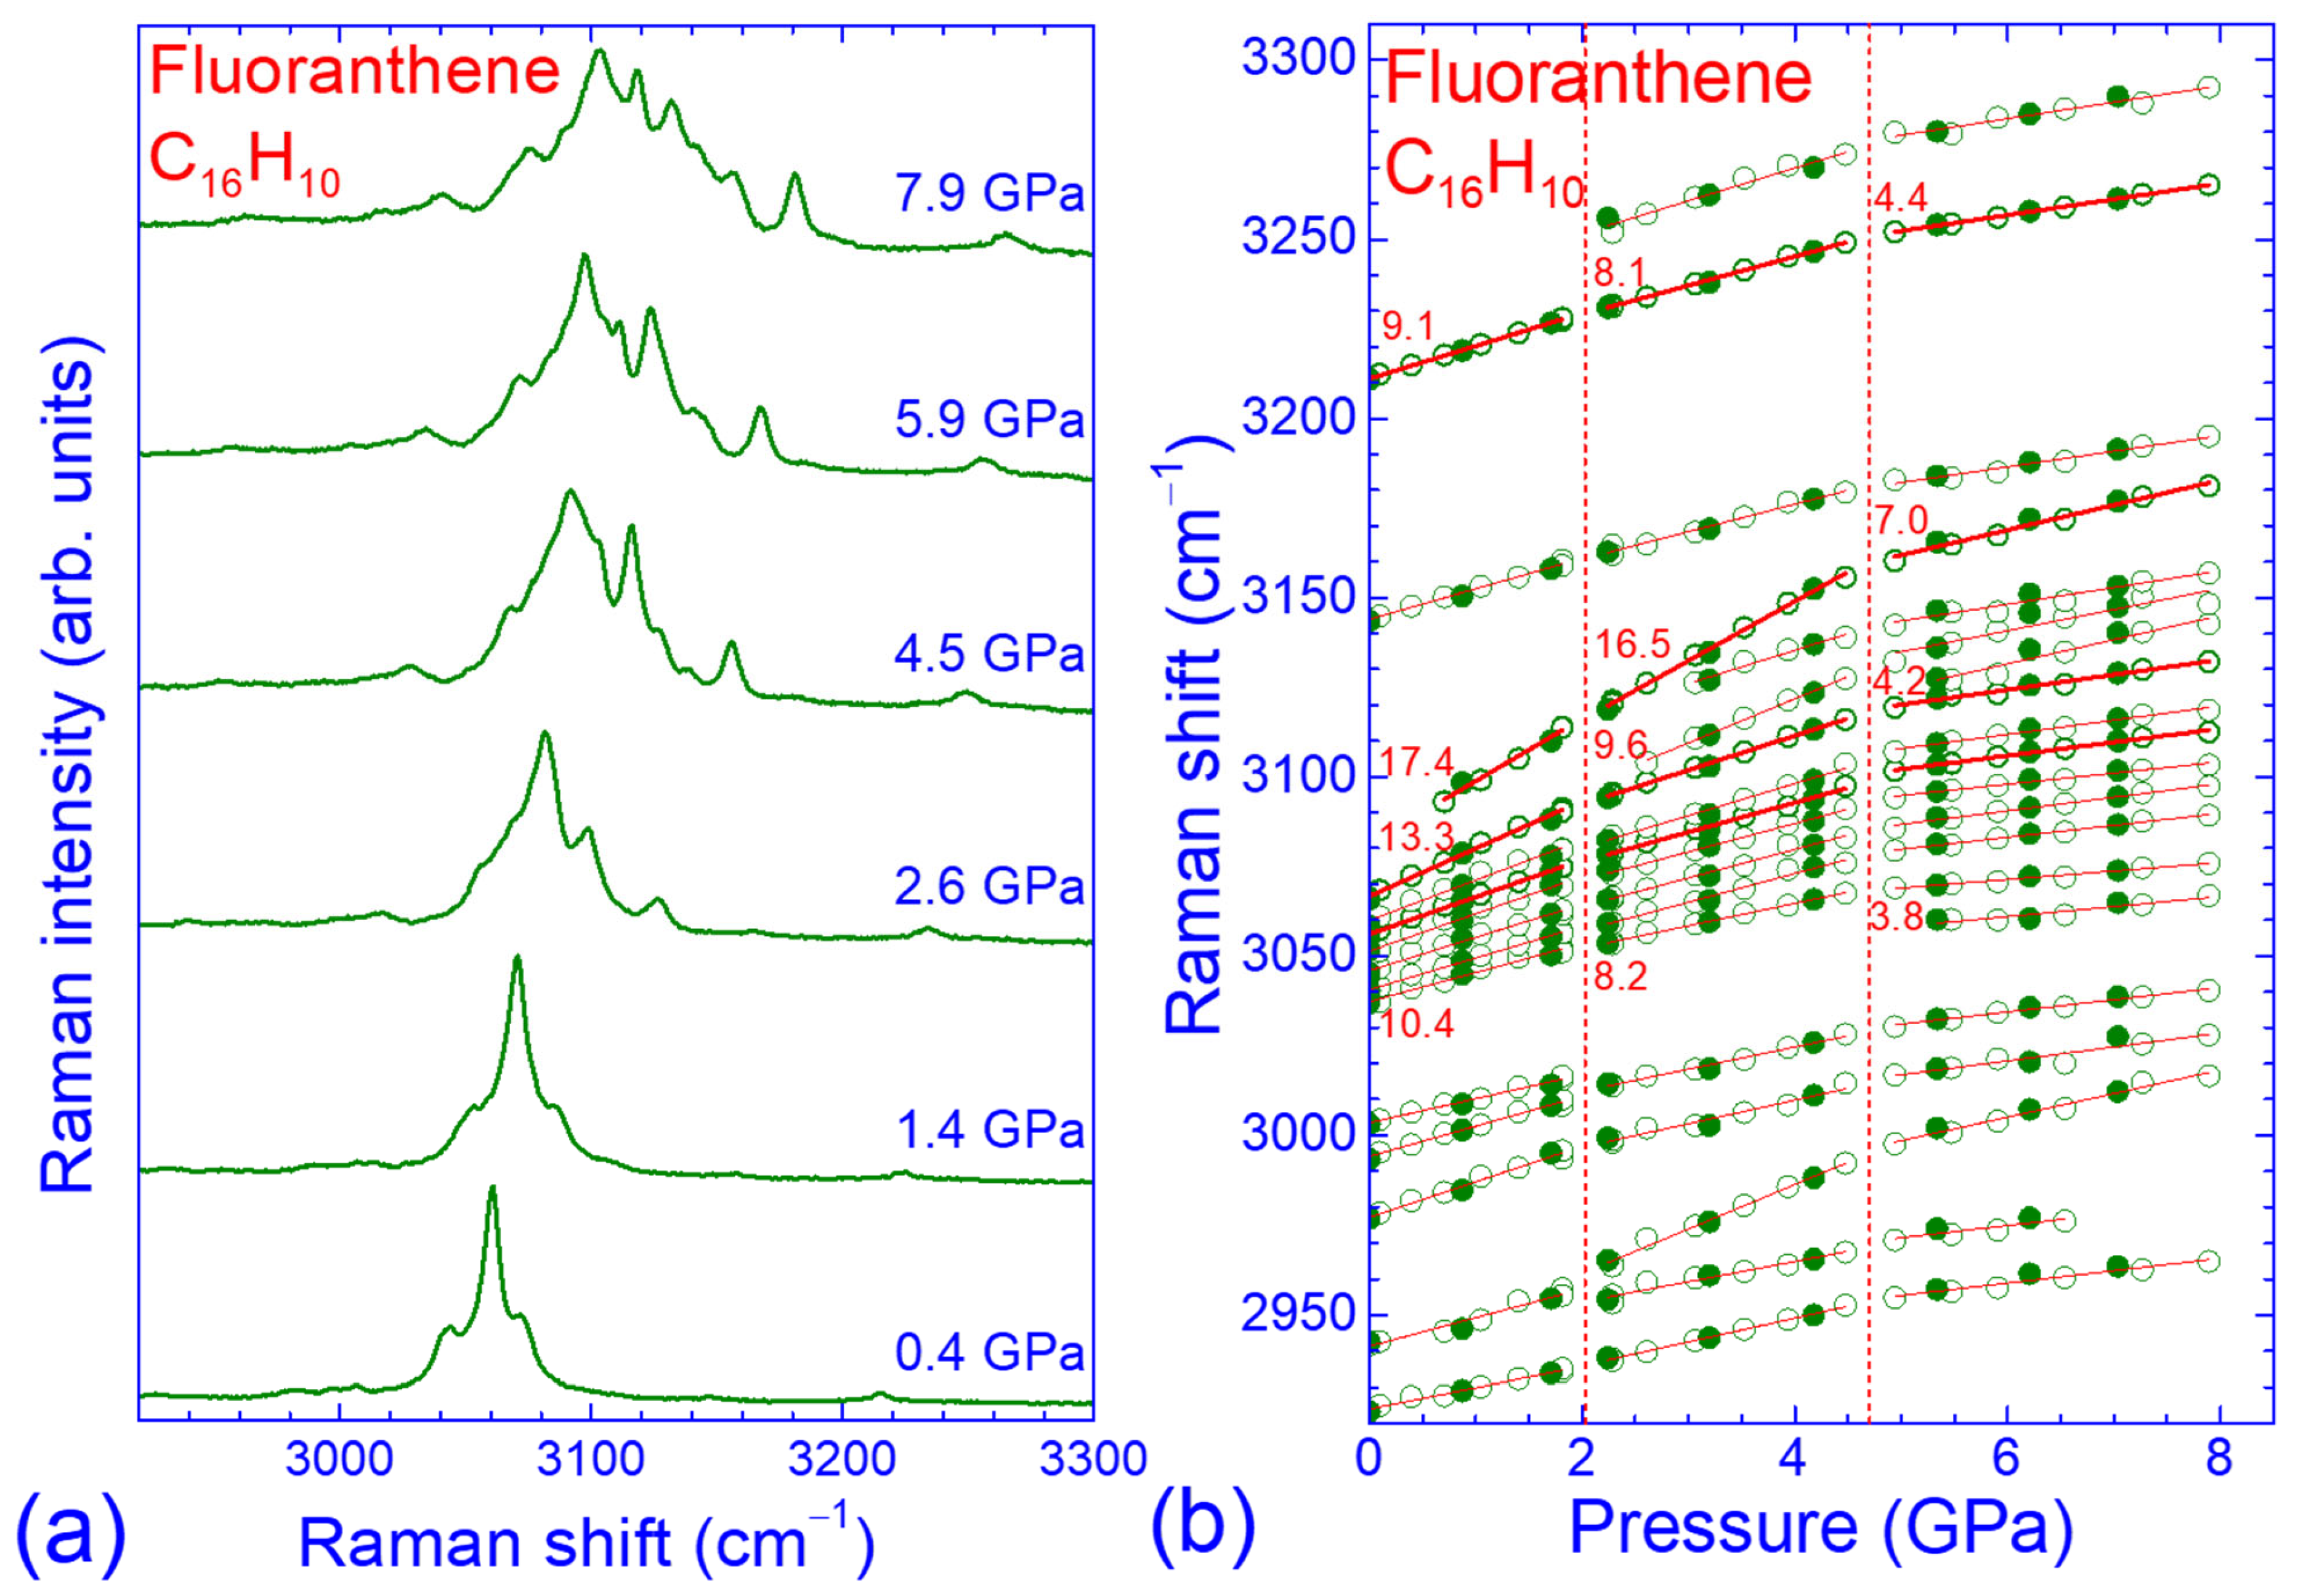
3.2. Pressure Dependence of the Raman Spectrum of Fluoranthene

First, we examine the pressure response of the Raman spectrum of the fluoranthene crystals in the low-frequency range (50–250 cm−1, where the lowest frequency value of 50 cm−1 was determined by the cut-off limit of the edge filter used in the spectrometer to eliminate the elastically scattered light from the sample). As mentioned in the previous subsection, this frequency range mainly corresponds to intermolecular vibrations, as well as to low-energy intramolecular vibrations that are principally attributed to molecular torsions with small force constant values involved (Table S2). DFT calculations for the fluoranthene molecule can be exploited in order to identify possible low-frequency intramolecular modes in this frequency range of the Raman spectrum. According to these calculations, five intramolecular modes are expected for ω < 250 cm−1, at 99, 118, 161, 203, and 248 cm−1. From these, only two peaks at similar frequencies appear in the Raman spectra of fluoranthene in the present work: one at ~102 cm−112 peak in Table S2) and one at ~204 cm−121 peak in Table S2). The ω21 peak was also observed in the Raman spectrum of solid fluoranthene reported by Klaeboe et al. and they also attributed it to an intramolecular vibration [24]. On the other hand, it cannot be safely concluded whether the ω12 peak is associated with an intramolecular or—most probably—with an intermolecular vibration, particularly taking into account the strong sublinear behavior and the large linear pressure coefficient of its frequency (b1 and b2 parameters in Table S2). All the other Raman peaks that appeared in the low-frequency range are attributed in our work to intermolecular vibrations. Noticeably, most of them were also observed by Klaeboe et al. at similar frequencies [24]. The external character of these vibrations, along with the weak van der Waals interactions between the fluoranthene molecules, render the corresponding Raman peaks by far more sensitive to volume contraction and pressure-induced phase transitions in the system compared to the intramolecular vibrations in the intermediate-frequency range.
Representative low-frequency Raman spectra of fluoranthene at selected pressures are illustrated in Figure 2a. With increasing pressure, considerable intensity redistribution among the observed Raman peaks takes place within the three lower pressure spectra. At the same time, all Raman peaks gradually shift to higher frequencies due to the bond hardening caused by the volume contraction. Because of the pressure-induced frequency upshift, several additional peaks enter the spectral window from lower frequencies and their evolution with pressure can be subsequently followed (ω1–ω6 peaks in Table S2, which can also be attributed to intermolecular vibrations).
The pressure dependence of the frequencies of the observed Raman peaks in the low-frequency range is presented in Figure 2b. For pressures up to 2 GPa, the pressure-induced frequency shifts of all the Raman peaks are rather large and parabolic (sublinear), with the exception of the Raman peaks entering the spectrum at higher pressures and hence the corresponding data points are not sufficient to be fitted by parabolic functions. These peaks were fitted by linear functions. A linear fit was also applied to the weak ω21 peak at ~204 cm−1 (1 bar) assigned to an intramolecular vibration. The strong sublinear pressure dependence of the Raman peak frequencies is compatible with what is expected for the external modes in molecular crystals, where the initially weak intermolecular interactions quickly strengthen with pressure [39]. The solid lines through the experimental ω vs. P data in Figure 2b are their linear or parabolic least-square fits, using the following functions accordingly:
ω = ω0 + b1P
and
ω = ω0 + b1P + b2P2
and the corresponding parameters are also given in Table S2. As it can be inferred from the corresponding values in the low-pressure regime (below 2 GPa), both the linear pressure coefficients b1 (also given in Figure 2b for the stronger and well-resolved Raman peaks) and the negative (sublinear) parabolic pressure coefficients b2 are relatively large for the intermolecular modes. This behavior indeed suggests that the initially weak intermolecular interactions are much more vulnerable to pressure application and that they are gradually enhanced at elevated pressures.
For pressures higher than 2 GPa, discontinuities in the pressure evolution of the Raman peak frequencies are observed since the ω vs. P dependencies become linear for all the peaks with significantly reduced pressure coefficient b1 values. This reflects the stiffening of the intermolecular interactions, caused by a pressure-induced structural modification at ~2 GPa. The only exception from this behavior is the pressure response of the ω17 peak with a frequency of ~206 cm−1 at 2.0 GPa. This peak—possibly originating from the intermolecular mode with frequency ~180 cm−1 at ambient pressure—exhibits a superlinear behavior with b1 = −8.7 cm−1GPa−1 and b2 = 2.38 cm−1GPa−2 (Table S2), suggesting an anomalous force constant decrease with increasing pressure. Noticeably, a similar pressure response has also been observed in the case of the crystalline 9,9′-spirobifluorene (SBF) PAH for a Raman peak with a frequency of ~217 cm−1 at 1.1 GPa, although in that case this peak seemed to originate from a ring deformation intramolecular mode. This peculiar response was observed after the pressure-induced structural transition of the SBF at ~1.3 GPa, associated with possible molecular reorientations and anisotropic shifts from their initial positions in the unit cell [52]. Similarly, in the case of naphthalene, high-pressure XRD measurements reported a minor structural irregularity at ~2 GPa [75], possibly associated with anomalies observed at 2–3 GPa in the pressure evolution of the intermolecular and the C–H stretching vibration frequencies according to the corresponding Raman data [45]. In line with our interpretation for fluoranthene, upon pressure application on naphthalene crystals up to 2 GPa, volume contraction is mainly accommodated by the structural voids, while the interlayer contacts are the first to strengthen. Further volume reduction led to a more predominant contraction along the herringbone layer [75].
As the applied pressure on fluoranthene increases from 2 to 4.5 GPa, three additional Raman peaks gradually emerge in the frequency range 180–220 cm−1 due to their intensity enhancement and/or their different pressure coefficients from the initial peaks. This difference in the pressure coefficients was probably caused by the structural modification at ~2 GPa, which led to the removal of various initial accidental degeneracies at higher pressures. As mentioned above, these degeneracies at ambient and low pressures were a consequence of the quite large number of molecules in the unit cell and the weak intermolecular interactions. The pressure coefficients of the Raman peak frequencies further decrease for P > 4.7 GPa (Figure 2b), suggesting another pressure-induced structural alteration of crystalline fluoranthene towards a stiffer structure. Since the number of the Raman peaks below and above 4.7 GPa is retained, along with the absence of any abrupt frequency position changes in this pressure range, the structural alteration most probably does not involve a change in the crystal symmetry. In the absence of any high-pressure XRD data for fluoranthene in the literature and in order to shed more light on the observed structural changes with pressure, we can look back at the case of the related orthorhombic fluorene (space group: Pnma), a LMW PAH whose molecule is composed of two aromatic hexagonal rings connected by a non-aromatic pentagonal ring that are also arranged into a quasi-planar configuration. A detailed high pressure XRD study has shown that for P > 3 GPa, fluorene exhibits a pressure-induced phase transition, associated with the rearrangement of the molecules from their low-pressure herringbone pattern towards their high-pressure π−π stacking, resulting in abrupt changes in the lattice parameters without a change in the crystallographic space group [76]. Both phases coexist up to ~5 GPa, at which point solid fluorene is fully transformed to its high-pressure stiffer phase. This structural transition was also observed by Raman spectroscopy using a different PTM (Daphne 7474 oil vs. nitrogen and helium for XRD). Two distinct reversible changes of the pressure slopes of the Raman peak frequencies, mostly towards lower values, were observed at ~2.5 and ~6 GPa, but without any spectral indications for phase coexistence in the pressure range 2.5–6 GPa [50]. Taking into account the similar herringbone pattern of fluoranthene with weak van der Waals intermolecular interactions at ambient pressure together with its considerable stiffening above 2 and 4.7 GPa, the same scenario could also be the case for the overall pressure response of the Raman peak frequencies. Namely, the reversible changes in their pressure coefficients (solid symbols in Figure 2b), instead of two distinct transitions, could be alternatively attributed to a single—but sluggish—structural phase transition in the pressure range 2–4.7 GPa, which is characterized by the reorientation of the fluoranthene molecules and their π−π stacking in the high-pressure phase.
Next, we examine the pressure response of the Raman peaks of crystalline fluoranthene attributed to intramolecular vibrations in the intermediate-frequency range. Representative Raman spectra in the frequency range 250–1700 cm−1 are illustrated for selected pressures in Figure 3a. As evident, the vast majority of the Raman peaks in this frequency range also shift to higher frequencies upon compression, though with reduced rates compared with the intermolecular Raman peaks. Additionally, the changes in the overall spectral profile—intensity redistribution among the various Raman peaks—are also considerably less pronounced, being compatible with the internal character of these vibrations. The pressure dependence of the frequencies of the stronger and well-resolved Raman peaks within this frequency range is presented in Figure 3b, while the corresponding dependencies for all the observed peaks are illustrated in Figures S1–S4 (Supplementary Materials). Apart from the sublinear ω-P dependence for the two low-frequency Raman peaks at 262 and 266 cm−1, which cannot be assigned to intramolecular vibrations and could originate even from second-order Raman scattering involving intermolecular vibrations, the ω vs. P data for all the other peaks exhibit quasilinear behavior up to 2 GPa and were fitted using Equation (4). All the pressure coefficients b1 of the Raman peak frequencies are positive (Table S2), except those for the intramolecular vibrations at 612, 779 and 827 cm−1, which show zero to marginally small negative values (−0.1 cm−1GPa−1).
Similarly to the intermolecular vibrations, the intramolecular ones also exhibit reversible changes—mainly towards lower values—in the pressure coefficients of their frequencies at ~2.0 and ~4.7 GPa. However, these changes are again less pronounced than those for the external Raman peaks, while the reduction in the b1 values is larger above 4.7 GPa. The absence of significant and abrupt alterations in the pressure evolution of the intramolecular Raman peaks suggests that there are no considerable modifications of the molecular conformations upon the structural transitions revealed by the intermolecular peaks. For P > 2 GPa, where the pressure-induced structural modifications of crystalline fluoranthene are initiated, some Raman peaks attributed to intramolecular vibration in the intermediate-frequency range appear to split into two components. For example, the relatively strong Raman peaks with frequencies ~802, ~1018 and ~1271 cm−1 at ambient pressure split into two peaks at 810/812 (at 4.7 GPa), 1023/1025 (at 2.0 GPa) and 1277/1279 cm−1 (at 2.0 GPa), respectively Figure 3b, Figures S2 and S3). As mentioned before, these components can be resolved in the high-pressure phase(s) due to the enhancement of the intermolecular interactions and the concomitant differences in the pressure coefficients of their frequencies.
Finally, we focus on the pressure response of the Raman peaks of fluoranthene in the high-frequency range, containing the intramolecular C–H stretching vibrations and higher order vibrational modes. Selected high-pressure Raman spectra of the fluoranthene sample in the frequency range 2920–3300 cm−1, as well as the pressure evolution of the corresponding Raman peak frequencies, are presented in Figure 4. All the ω-P dependencies are quasilinear in the three pressure ranges: P < 2.0 GPa, 2.0 < P < 4.7 GPa, and P > 4.7 GPa. Thus, the corresponding data were again fitted using Equation (4).
Among the intramolecular modes, the C–H stretching vibrations exhibit the largest pressure-induced frequency shifts, consistent with the peripheral location of the hydrogen atoms in the fluoranthene molecule. As expected, the pressure-induced frequency shifts are also large for the rest of the Raman peaks in the high-frequency range due to their second-order Raman nature. Moreover, the Raman peaks in this frequency range—similarly to the intermolecular vibrations—exhibit considerable intensity redistribution with pressure, revealing their enhanced sensitivity to volume contraction and molecular reorientations upon the structural changes. Finally, the pressure-induced structural modifications of fluoranthene at ~2 and ~4.7 GPa again cause a general reduction—more pronounced at 4.7 GPa—in the pressure coefficients of the Raman peak frequencies, compatible with the considerable crystal stiffening in the high-pressure phase. All the pressure effects on the intramolecular vibrations are fully reversible upon pressure release.

3.3. Force Constant Hierarchy and Stifness of Fluoranthene

The logarithmic pressure coefficients Γi of the vibrational mode frequencies,
Γi = ∂(lnωi)/∂P = (1/ωi0)·(∂ωi/∂P),
which are proportional to the mode Grüneisen parameters γi,
γi = B0·∂(lnωi)/∂P = B0·(1/ωi0)·(∂ωi/∂P) = B0·Γi,
where B0 is the bulk modulus and ωi is the frequency of the ith vibrational mode (ωi0 is its frequency at ambient pressure), are convenient for expressing—apart from the mode anharmonicity—the hierarchy of the bond strengths (force constants) in molecular crystals [37,38,39,52]. More specifically, although in a molecular crystal the Grüneisen approximation—according to which all γi parameters for the various modes in a network crystal are approximately equal to the same γ value, leading to a uniform spectral expansion upon compression since ω~V–γ—holds for the intermolecular modes but not for the intramolecular ones, where a rough γi~ ω i 0 2 dependence is exhibited [37,38,77].
The positive normalized pressure slopes Γi of the first-order Raman peaks of fluoranthene below 2 GPa (open symbols) or above 4.7 GPa (solid symbols) with respect to their frequencies at 0.0 or 4.7 GPa, respectively, are illustrated in Figure 5. As a consequence of the co-existence of the weak van der Waals intermolecular interactions and the strong covalent intramolecular bonding in crystalline fluoranthene, the Γi parameter values in its low-pressure phase span more than three orders of magnitude. In accordance with the above, the Γi parameters are nearly constant (Γi~0.30 GPa−1) for the Raman peaks originating from intermolecular vibrations (solid blue line in Figure 5) and roughly show a Γi~ ω i 0 2 dependence for the intramolecular modes with zero pressure frequencies up to 700 cm−1 (solid olive line in Figure 5). For the intramolecular peaks with ωi0 > 700 cm−1—including the C–H stretching vibrations—the Γi parameters can also be considered as almost constant around 3.2 × 10⁻³ GPa−1 (dashed blue line in Figure 5), indicating the similar force constants involved. Since the volume contraction upon pressure application is predominantly accommodated by the compression of the intermolecular voids, we can roughly estimate the bulk modulus of fluoranthene at ambient conditions from the averaged Γi parameter value of 0.30 GPa−1 for the intermolecular modes by means of Equation (7). Thus, assuming a reasonable value of ~2 for the Grüneisen parameter γ [37,38,39,52], we obtain B0~7 GPa for crystalline fluoranthene, which is compatible with its soft molecular solid nature. It is worth noting that this B0 value is somewhat smaller than that we have recently obtained using the same method for crystalline SBF (~9 GPa), where the intermolecular space—and hence its compressibility—should be smaller since it is a spiro-compound [52]. Moreover, the B0~7 GPa value for fluoranthene is even smaller than the one we have obtained by the same method for trans-cinnamic acid crystals (~11 GPa), where the intermolecular interactions also included hydrogen bonding, making them stiffer [39]. More importantly, the value B0~7 GPa is in remarkably good agreement with the value of ~6 GPa that can be extracted from the volume contraction data with pressure for solid fluoranthene by Bridgman [78], using the Murnaghan equation of state [79,80]. In addition, from our older high-pressure Raman data for the related PAH fluorene [50]—also of quasi-planar molecules with weak van der Waals intermolecular interactions and similar herringbone molecular pattern in the solid state—we practically extract the same value of ~7 GPa for B0. Indeed, the high-pressure XRD study of fluorene yielded a value for its bulk modulus at zero pressure of 5.9 ± 0.4 GPa [76], which is very close to that of fluoranthene. All these findings further confirm the applicability of our simple approach towards the experimental estimation of the bulk modulus in molecular crystals solely by optical spectroscopy (Raman and/or IR) under high pressure.
In the high-pressure phase of fluoranthene at 4.7 GPa, the average value of the Γi parameters for the Raman peaks originating from intermolecular vibrations is reduced by a factor of 10, to ~0.03 (solid red line in Figure 5), suggesting the considerable stiffening of the system that is mainly caused by the strengthening of the intermolecular interactions. Note that in the case of fluorene, the high-pressure XRD data have shown that this molecular crystal also became stiffer in its high-pressure phase (B0 = 11.3 GPa and B 0 = 5.4) due to reorientation and π−π stacking of the molecules compared to the softer low-pressure phase (B0 = 5.9 GPa and B 0 = 7.5) featuring a herringbone molecular arrangement [76]. Similarly to the case of SBF [52], the strong reduction in the intermolecular Γi parameters of fluoranthene at 4.7 GPa also renders them more comparable to those of the intramolecular modes. This indicates a more homogenized state—in terms of force constants—of the fluoranthene crystal in the high-pressure phase. Nevertheless, in contrast to the behavior of the high-frequency intramolecular Raman peaks of SBF, where the Γi parameters are lying around 2.6 × 10⁻³ GPa−1 both at 0.0 in its low-pressure phase and at 4.2 GPa in its high-pressure phase [52], in the case of fluoranthene, the mean value of the corresponding Γi parameters decreases from 3.2 × 10⁻³ GPa−1 at 0.0 GPa (dashed blue line in Figure 5) to 1.4 × 10⁻³ GPa−1 at 4.7 GPa (dashed red line in Figure 5). This difference could be attributed to the larger strengthening of the intermolecular interactions in the high-pressure phase of fluoranthene compared to that of SBF—possibly due to the reorientation and π−π stacking of the molecules—that can also cause the stiffening of the fluoranthene molecule to a certain degree. Finally, another interesting point in the case of the high-pressure phase of fluoranthene at 4.7 GPa is that the Γi parameters for the C–H stretching vibrations extend to a larger value range (solid squares in Figure 5) than that in the low-pressure phase (open squares in Figure 5). Taking into account that the hydrogen atoms are located in the periphery of the molecule, the broader distribution of the corresponding force constants in the high-pressure phase indicates the stronger differentiation of the intermolecular binding forces in the studied system.

4. Conclusions

Here, we reported the results of our high-pressure (up to 8 GPa) Raman study of crystalline fluoranthene by means of a DAC with glycerol as PTM. At ~2.0 and ~4.7 GPa, reversible changes in the pressure evolution of the Raman peak frequencies are observed, being more pronounced for the intermolecular and the C–H stretching vibrations than those for the intermediate-frequency intramolecular ones. These changes are possibly associated with the structural transition(s) of the studied material from its initial herringbone molecular arrangement towards π−π stacking, without any significant modification of the quasi-planar molecular shape, as previously reported for fluorene [76]. The considerable stiffening of fluoranthene in its high-pressure phase mainly emanates from the significant enhancement of the initially weak intermolecular interactions, owing to the molecular rearrangements in the crystal structure. Moreover, a value of ~7 GPa for the bulk modulus of the studied molecular crystal at ambient pressure is estimated from the logarithmic pressure coefficients of the intermolecular mode frequencies in the low-pressure phase, in very good agreement with the literature. From a comparison between the current and our previous data on different relevant systems, in conjunction with the corresponding literature, a simple method is established for the reliable estimation of the ambient pressure bulk modulus of molecular crystals exclusively by high-pressure vibrational spectroscopy.

Supplementary Materials

The following supporting information can be downloaded at: https://www.mdpi.com/article/10.3390/cryst15080697/s1, CCDC deposition number 2449797 contains the supplementary crystallographic data for the compound. These data can be obtained free of charge via https://www.ccdc.cam.ac.uk/ (or from the Cambridge Crystallographic Data Centre, 12 Union Road, Cambridge CB21EZ, UK; fax: (+44) 1223-336-033; or deposit@ccdc.cam.ac.uk). Table S1: Crystallographic and refinement details for crystalline fluoranthene.; Table S2: Mode symmetry in the C2v point group, assignment and potential energy distribution (%PED), calculated (ωcalc, cm−1) and experimental (ωIR and ωR, cm−1) frequencies of the vibrational modes of the fluoranthene molecule as calculated in the present work and/or obtained from the literature. The frequencies (ωi0 at 0.0 GPa, ωj0 at 2.0 GPa and ωk0 at 4.7 GPa extracted from the least squares fits to the corresponding ω vs. P data of the present work, along with their linear (b1, cm−1GPa−1) and quadratic pressure coefficients (b2, cm−1GPa−2), are also presented. The corresponding data for the well-resolved Raman peaks are shown in bold. The approximate mode description and ωcalc for the Raman peaks tentatively assigned in this work are shown in italics; Figure S1: (a) Raman spectra of fluoranthene in the 240–720 cm−1 frequency range, recorded at various pressures. (b) Pressure dependence of the frequencies of the intramolecular modes within this range. Open (solid) symbols represent data obtained during pressure increase (decrease). Solid lines through the experimental data are their linear or parabolic least-square fits, while the numbers indicate the linear pressure coefficients for the clearly defined Raman peak frequencies (denoted by thicker symbols and lines). The vertical dashed lines approximately mark the pressures at which changes in the pressure coefficients of the Raman peak frequencies occur; Figure S2: (a) Raman spectra of fluoranthene in the 720–1080 cm−1 frequency range, recorded at various pressures. (b) Pressure dependence of the frequencies of the intramolecular modes within this range. Open (solid) symbols represent data obtained during pressure increase (decrease). Solid lines through the experimental data are their linear least-square fits, while the numbers indicate the pressure coefficients for the clearly defined Raman peak frequencies (denoted by thicker symbols and lines). The vertical dashed lines approximately mark the pressures at which changes in the pressure coefficients of the Raman peak frequencies occur; Figure S3: (a) Raman spectra of fluoranthene in the 1060–1320 cm−1 frequency range, recorded at various pressures. (b) Pressure dependence of the frequencies of the intramolecular modes within this range. Open (solid) symbols represent data obtained during pressure increase (decrease). Solid lines through the experimental data are their linear least-square fits, while the numbers indicate the pressure coefficients for the clearly defined Raman peak frequencies (denoted by thicker symbols and lines). The vertical dashed lines approximately mark the pressures at which changes in the pressure coefficients of the Raman peak frequencies occur; Figure S4: (a) Raman spectra of fluoranthene in the 1350–1700 cm−1 frequency range, recorded at various pressures. (b) Pressure dependence of the frequencies of the intramolecular modes within this range. Open (solid) symbols represent data obtained during pressure increase (decrease). Solid lines through the experimental data are their linear least-square fits, while the numbers indicate the pressure coefficients for the clearly defined Raman peak frequencies (denoted by thicker symbols and lines). The vertical dashed lines approximately mark the pressures at which changes in the pressure coefficients of the Raman peak frequencies occur; Supplementary Files: SF1: CIF for crystalline fluoranthene; SF2: CheckCIF report for fluoranthene crystal.

Author Contributions

Conceptualization, O.K., A.H., D.C. and J.A.; methodology, S.P., A.H., D.C. and J.A.; investigation, O.K., S.P., N.M.P. and J.A.; formal analysis, S.P., N.M.P., A.H., D.C. and J.A.; writing—original draft preparation, O.K. and J.A.; writing—review and editing, O.K., A.H., D.C. and J.A.; supervision, J.A. All authors have read and agreed to the published version of the manuscript.

Funding

This research received no external funding.

Data Availability Statement

The original contributions presented in this study are included in the article/Supplementary Material. Further inquiries can be directed to the corresponding author.

Acknowledgments

The authors acknowledge the Center of Interdisciplinary Research and Innovation of the Aristotle University of Thessaloniki (CIRI-AUTH) for the access to the Raman instrumentation. The theoretical results presented in this work have been produced using the Aristotle University of Thessaloniki (AUTh) High Performance Computing Infrastructure and Resources.

Conflicts of Interest

The authors declare no conflicts of interest.

Abbreviations

The following abbreviations are used in this manuscript:
PAHPolycyclic aromatic hydrocarbon
LMWLow-molecular-weight
HMWHigh-molecular-weight
XRDX-ray diffraction
DFTDensity functional theory
B3LYPBecke 3-Lee-Yang-Parr
DACDiamond anvil cell
PTMPressure transmitting medium
IRInfrared
SBF9,9′-spirobifluorene

References

  1. Desiraju, G.R. Crystal Engineering: The Design of Organic Solids; Elsevier Scientific Publishers: New York, NY, USA, 1989. [Google Scholar]
  2. Mirza Alizadeh, A.; Mohammadi, M.; Hashempour-baltork, F.; Hosseini, H.; Shahidi, F. Process-induced toxicants in food: An overview on structures, formation pathways, sensory properties, safety and health implications. Food Prod. Process. Nutr. 2025, 7, 7. [Google Scholar] [CrossRef]
  3. Vaz-Ramos, J.; Le Calvé, S.; Begin, S. Polycyclic aromatic hydrocarbons in water environments: Impact, legislation, depollution processes and challenges, and magnetic iron oxide/graphene-based nanocomposites as promising adsorbent solutions. J. Hazard. Mater. 2025, 490, 137726. [Google Scholar] [CrossRef] [PubMed]
  4. Hu, W.; Zhang, J.; Li, D.; Yuan, Y.; Tang, Y.; Hui, K.; Jiang, Y.; Tan, W. Study on factors influencing the transport and transformation of polycyclic aromatic hydrocarbons in soil-groundwater systems. Emerg. Contam. 2025, 11, 100472. [Google Scholar] [CrossRef]
  5. Wu, S.; Mou, B.; Liu, G.; Liu, R.; Wang, X. Contamination, risk assessment, and reduction strategies for hazardous polycyclic aromatic hydrocarbons in food. Curr. Opin. Food Sci. 2025, 62, 101270. [Google Scholar] [CrossRef]
  6. Zhang, Z.-F.; Chen, J.-C.; Zhao, Y.-X.; Wang, L.; Teng, Y.-Q.; Cai, M.-H.; Zhao, Y.-H.; Nikolaev, A.; Li, Y.-F. Determination of 123 polycyclic aromatic hydrocarbons and their derivatives in atmospheric samples. Chemosphere 2022, 296, 134025. [Google Scholar] [CrossRef]
  7. Harvey, R.G. Polycyclic Aromatic Hydrocarbons; Wiley-VCH: New York, NY, USA, 1997. [Google Scholar]
  8. Neilson, A.H. (Ed.) PAHs and Related Compounds, Chemistry; Springer: New York, NY, USA, 1998. [Google Scholar]
  9. Bandeira, G.C.; Meneses, H.E. (Eds.) Handbook of Polycyclic Aromatic Hydrocarbons: Chemistry, Occurrence and Health Issues; Nova Science Publishers: Hauppauge, NY, USA, 2012. [Google Scholar]
  10. Lawal, A.T. Polycyclic aromatic hydrocarbons. A review. Cogent Environ. Sci. 2017, 3, 1339841. [Google Scholar] [CrossRef]
  11. Ifegwu, O.C.; Anyakora, C. Chapter six—Polycyclic aromatic hydrocarbons: Part I. Exposure. Adv. Clin. Chem. 2015, 72, 277–304. [Google Scholar]
  12. Keyte, I.J.; Harrison, R.M.; Lammel, G. Chemical reactivity and long-range transport potential of polycyclic aromatic hydrocarbons—A review. Chem. Soc. Rev. 2013, 42, 9333–9391. [Google Scholar] [CrossRef]
  13. Gachanja, A.N. Polycyclic aromatic hydrocarbons, Environmental Applications. In Encyclopedia of Analytical Science, 2nd ed.; Worsfold, P.J., Poole, C.F., Eds.; Elsevier Ltd.: Waltham, MA, USA, 2005. [Google Scholar]
  14. Anthony, J.E. Functionalized acenes and heteroacenes for organic electronics. Chem. Rev. 2006, 106, 5028–5048. [Google Scholar] [CrossRef]
  15. Ye, Q.; Chi, C. Recent highlights and perspectives on acene based molecules and materials. Chem. Mater. 2014, 26, 4046–4056. [Google Scholar] [CrossRef]
  16. Delouche, T.; Hissler, M.; Bouit, P.-A. Polycyclic aromatic hydrocarbons containing heavy group 14 elements: From synthetic challenges to optoelectronic devices. Coord. Chem. Rev. 2022, 464, 214553. [Google Scholar] [CrossRef]
  17. Ma, L.; Han, Y.; Shi, O.; Huang, H. The design, synthesis and application of rubicene based polycyclic aromatic hydrocarbons (PAHs). J. Mater. Chem. C 2023, 11, 16429–16438. [Google Scholar] [CrossRef]
  18. Mathur, C.; Gupta, R.; Bansal, R.K. Organic donor-acceptor complexes as potential semiconducting materials. Chem. Eur. J. 2024, 30, e202304139. [Google Scholar] [CrossRef]
  19. Ahn, T.K.; Kim, K.S.; Kim, D.Y.; Noh, S.B.; Aratani, N.; Ikeda, C.; Osuka, A.; Kim, D. Relationship between two-photon absorption and the π-conjugation pathway in porphyrin arrays through dihedral angle control. J. Am. Chem. Soc. 2006, 128, 1700–1704. [Google Scholar] [CrossRef]
  20. Yadav, B.; Ravikanth, M. Porphyrinoid framework embedded with polycyclic aromatic hydrocarbons: New synthetic marvels. Org. Biomol. Chem. 2024, 22, 1932–1960. [Google Scholar] [CrossRef] [PubMed]
  21. Monte, M.J.S.; Notario, R.; Pinto, S.P.; Lobo Ferreira, A.I.M.C.; Ribeiro da Silva, M.D.M.C. Thermodynamic properties of fluoranthene: An experimental and computational study. J. Chem. Thermodyn. 2012, 49, 159–164. [Google Scholar] [CrossRef]
  22. Kanaly, R.A.; Harayama, S. Biodegradation of high-molecular-weight polycyclic aromatic hydrocarbons by bacteria. J. Bacteriol. 2000, 182, 2059–2067. [Google Scholar] [CrossRef] [PubMed]
  23. Gundlapalli, M.; Sivagami, K.; Gopalakrishnan, M.; Harshini, P.; Janjaroen, D.; Ganesan, S. Biodegradation of low molecular weight polycyclic aromatic hydrocarbons in soil: Insights into bacterial activities and bioremediation techniques. Sustain. Chem. Environ. 2024, 7, 100146. [Google Scholar] [CrossRef]
  24. Klaeboe, P.; Cyvin, S.J.; Phongsatha Asbjørnsen, A.; Cyvin, B.N. Condensed aromatics—XIV. Fluoranthene. Spectrochim. Acta A 1981, 37, 655–661. [Google Scholar] [CrossRef]
  25. Bark, K.-M.; Force, R.K. Fluorescence properties of fluoranthene as a function of temperature and environment. Spectrochim. Acta A 1993, 49, 1605–1611. [Google Scholar] [CrossRef]
  26. Slodek, A.; Maron, A.; Pajak, M.; Matussek, M.; Grudzka-Flak, I.; Malecki, J.G.; Switlicka, A.; Krompiec, S.; Danikiewicz, W.; Grela, M.; et al. Luminescent-substituted fluoranthenes—Synthesis, structure, electrochemistry, and optical properties. Chem. Eur. J. 2018, 24, 9622–9631. [Google Scholar] [CrossRef]
  27. Kumar, S.; Kumar, D.; Patil, Y.; Patil, S. Fluoranthene derivatives as blue fluorescent materials for non-doped organic light-emitting diodes. J. Mater. Chem. C 2016, 4, 193–200. [Google Scholar] [CrossRef]
  28. Jia, C.; Wang, L.; Ma, Y.-N.; Duan, Z. Synthesis and electronic properties of arene-fused o-carborane. Organometallics 2025, 44, 938–943. [Google Scholar] [CrossRef]
  29. Debnath, S.; Mohanty, A.; Naik, P.; Salzner, U.; Dasgupta, J.; Patil, S. Deciphering intramolecular charge transfer in fluoranthene derivatives. J. Mater. Chem. C 2024, 12, 9200–9209. [Google Scholar] [CrossRef]
  30. Liang, Y. Core-modified of fluoranthene with “propeller” structure for highly sensitive detection of nitroaromatic compounds. Spectrochim. Acta A 2019, 206, 474–483. [Google Scholar] [CrossRef]
  31. Hino, Y.; Matsuo, T.; Hayashi, S. Unique 2D face topologies in naphthyl-appended naphtho[k] fluoranthene-based 3D crystals for optical waveguide. Adv. Opt. Mater. 2023, 11, 2201810. [Google Scholar] [CrossRef]
  32. Hazell, A.C.; Jones, D.W.; Sowden, J.M. The crystal structure of fluoranthene, Cl6H10: A Study by X-ray and neutron diffraction. Acta Cryst. B 1977, 33, 1516–1522. [Google Scholar] [CrossRef]
  33. Jones, D.W.; Matthews, R.S. 4 Carcinogenicity and structure in polycyclic hydrocarbons. Progr. Med. Chem. 1974, 10, 159–203. [Google Scholar] [CrossRef]
  34. Orgzall, I.; Emmerling, F.; Schulz, B.; Franco, O. High-pressure studies on molecular crystals—Relations between structure and high-pressure behavior. J. Phys. Condens. Matter 2008, 20, 295206. [Google Scholar] [CrossRef]
  35. Meyer, B.; Barthel, S.; Mace, A.; Vannay, L.; Guillot, B.; Smit, B.; Corminboeuf, C. DORI reveals the influence of noncovalent interactions on covalent bonding patterns in molecular crystals under pressure. J. Phys. Chem. Lett. 2019, 10, 1482–1488. [Google Scholar] [CrossRef]
  36. Guan, J.; Zhang, C.; Gao, D.; Tang, X.; Dong, X.; Lin, X.; Wang, Y.; Wang, X.; Wang, L.; Lee, H.H.; et al. Drastic photoluminescence modulation of an organic molecular crystal with high pressure. Mater. Chem. Front. 2019, 3, 1510–1517. [Google Scholar] [CrossRef]
  37. Zallen, R. Pressure-Raman effects and vibrational scaling laws in molecular crystals: S8 and As2S3. Phys. Rev. B 1974, 9, 4485–4496. [Google Scholar] [CrossRef]
  38. Zallen, R.; Slade, M.L. Influence of pressure and temperature on phonons in molecular chalcogenides: Crystalline As4S4 and S4N4. Phys. Rev. B 1978, 18, 5775–5798. [Google Scholar] [CrossRef]
  39. Marinopoulou, A.; Christopoulou, V.; Karabinaki, O.; Christofilos, D.; Arvanitidis, J. The high-pressure response of trans-cinnamic acid crystals studied by Raman spectroscopy. Appl. Res. 2024, 3, e202300129. [Google Scholar] [CrossRef]
  40. Zallen, R.; Griffiths, C.H.; Slade, M.L.; Hayek, M.; Brafman, O. The solid state transition in pyrene. Chem. Phys. Lett. 1976, 39, 85–89. [Google Scholar] [CrossRef]
  41. Zhao, L.; Baer, B.J.; Chronister, E.L. High-pressure Raman study of anthracene. J. Phys. Chem. A 1999, 103, 1728–1733. [Google Scholar] [CrossRef]
  42. Venuti, E.; Guido Della Valle, R.; Farina, L.; Brillante, A.; Masino, M.; Girlando, A. Phonons and structures of tetracene polymorphs at low temperature and high pressure. Phys. Rev. B 2004, 70, 104106. [Google Scholar] [CrossRef]
  43. Sun, B.; Dreger, Z.A.; Gupta, Y.M. High-pressure effects in pyrene crystals: Vibrational spectroscopy. J. Phys. Chem. A 2008, 112, 10546–10551. [Google Scholar] [CrossRef]
  44. Zhou, M.; Wang, K.; Mena, Z.; Gao, S.; Li, Z.; Sun, C. Study of high-pressure Raman intensity behavior of aromatic hydrocarbons: Benzene, biphenyl and naphthalene. Spectrochim. Acta A 2012, 97, 526–531. [Google Scholar] [CrossRef]
  45. Meletov, K.P. Phonon spectrum of a naphthalene crystal at a high pressure: Influence of shortened distances on the lattice and intramolecular vibrations. Phys. Solid State 2013, 55, 581–588. [Google Scholar] [CrossRef]
  46. O’Bannon, E., III; Williams, Q. Vibrational spectra of four polycyclic aromatic hydrocarbons under high pressure: Implications for stabilities of PAHs during accretion. Phys. Chem. Miner. 2016, 43, 181–208. [Google Scholar] [CrossRef]
  47. Zhao, X.-M.; Zhong, G.-H.; Zhang, J.; Huang, Q.-W.; Goncharov, A.F.; Lin, H.Q.; Chen, X.-J. Combined experimental and computational study of high-pressure behavior of triphenylene. Sci. Rep. 2016, 6, 25600. [Google Scholar] [CrossRef]
  48. Capitani, F.; Höppner, M.; Malavasi, L.; Marini, C.; Dore, P.; Boeri, L.; Postorino, P. The effect of high pressure on the lattice structure and dynamics of phenacenes. J. Phys. Conf. Ser. 2017, 950, 042017. [Google Scholar] [CrossRef]
  49. Du, M.; Dong, J.; Zhang, Y.; Yang, X.; Li, Z.; Wang, M.; Liu, R.; Liu, B.; Zhou, Q.; Wei, T.; et al. Vibrational properties and polymerization of corannulene under pressure, probed by Raman and infrared spectroscopies. J. Phys. Chem. C 2019, 123, 23674–23681. [Google Scholar] [CrossRef]
  50. Terzidou, A.G.V.; Sorogas, N.; Pinakidou, F.; Paloura, E.C.; Arvanitidis, J. The pressure-induced structural phase transition of fluorene studied by Raman spectroscopy. Vib. Spectrosc. 2021, 115, 103272. [Google Scholar] [CrossRef]
  51. Zhao, X.; Suo, T.; Mao, Q.; Zhao, Z.; Wang, S.; Wan, B.; Liu, J.; Zhang, L.; Liang, X.; Xu, A.; et al. Structure and piezochromism of chrysene at high pressures. Dyes Pigm. 2024, 227, 112161. [Google Scholar] [CrossRef]
  52. Siavou, M.-T.; Siapaka, K.; Karabinaki, O.; Christofilos, D.; Arvanitidis, J. The high-pressure response of 9,9′-spirobifluorene studied by Raman spectroscopy. Molecules 2025, 30, 638. [Google Scholar] [CrossRef]
  53. Bruker Analytical X-ray Systems, Inc. Apex2, Version 2 User Manual; M86-E01078; Bruker: Madison, WI, USA, 2006. [Google Scholar]
  54. Siemens Industrial Automation Inc. SADABS: Area-Detector Absorption Correction; Siemens Industrial Automation, Inc.: Madison, WI, USA, 1996. [Google Scholar]
  55. Palatinus, L.; Chapuis, G. SUPERFLIP—A computer program for the solution of crystal structures by charge flipping in arbitrary dimensions. J. Appl. Crystallogr. 2007, 40, 786–790. [Google Scholar] [CrossRef]
  56. Betteridge, P.W.; Carruthers, J.R.; Cooper, R.I.; Prout, K.; Watkin, D.J. CRYSTALS version 12: Software for guided crystal structure analysis. J. Appl. Crystallogr. 2003, 36, 1487. [Google Scholar] [CrossRef]
  57. Frisch, M.J.; Trucks, G.W.; Schlegel, H.B.; Scuseria, G.E.; Robb, M.A.; Cheeseman, J.R.; Scalmani, G.; Barone, V.; Petersson, G.A.; Nakatsuji, H.; et al. Gaussian 16, Revision C.02; Gaussian, Inc.: Wallingford, CT, USA, 2019. [Google Scholar]
  58. Hariharan, P.C.; Pople, J.A. The influence of polarization functions on molecular orbital hydrogenation energies. Theor. Chim. Acta 1973, 28, 213–222. [Google Scholar] [CrossRef]
  59. Lee, C.; Yang, W.; Parr, R.G. Development of the Colle-Salvetti correlation-energy formula into a functional of the electron density. Phys. Rev. B 1988, 37, 785–789. [Google Scholar] [CrossRef] [PubMed]
  60. Becke, A.D. A new mixing of Hartree-Fock and local density-functional theories. J. Chem. Phys. 1993, 98, 1372–1377. [Google Scholar] [CrossRef]
  61. Onchoke, K.K.; Parks, M. Experimental and theoretical study of vibrational spectra of 3-nitrofluoranthene. J. Mol. Struct. 2011, 999, 22–28. [Google Scholar] [CrossRef]
  62. Onchoke, K.K.; Ojeda, J.J. A DFT study of vibrational spectra and mutagenicity predictions of mononitrated fluoranthenes. J. Mol. Struct. 2013, 33, 473–500. [Google Scholar] [CrossRef]
  63. Jayaraman, A. Ultrahigh pressures. Rev. Sci. Instrum. 1986, 57, 1013–1031. [Google Scholar] [CrossRef]
  64. Dunstan, D.J. Theory of the gasket in diamond anvil high-pressure cells. Rev. Sci. Instrum. 1989, 60, 3789–3795. [Google Scholar] [CrossRef]
  65. Mao, H.K.; Xu, J.; Bell, P.M. Calibration of the ruby pressure gauge to 800 kbar under quasi-hydrostatic conditions. J. Geophys. Res. 1986, 91, 4673–4676. [Google Scholar] [CrossRef]
  66. Syassen, K. Ruby under pressure. High Press. Res. 2008, 28, 75–126. [Google Scholar] [CrossRef]
  67. Osakabe, T.; Kakurai, K. Feasibility tests on pressure-transmitting media for single-crystal magnetic neutron diffraction under high pressure. Jpn. J. Appl. Phys. 2008, 47, 6544–6547. [Google Scholar] [CrossRef]
  68. Klotz, S.; Takemura, K.; Strassle, T.; Hansen, T. Freezing of glycerol-water mixtures under pressure. J. Phys. Condens. Matter 2012, 24, 325103. [Google Scholar] [CrossRef]
  69. Śmiszek-Lindert, W.; Michta, A.; Tyl, A.; Małecki, G.; Chełmecka, E.; Maślanka, S. X-ray, Hirshfeld surface analysis, spectroscopic and DFT studies of polycyclic aromatic hydrocarbons: Fluoranthene and acenaphthene. J. Serb. Chem. Soc. 2015, 80, 1489–1504. [Google Scholar] [CrossRef]
  70. Li, L.; Wang, H.; Wang, W.; Jin, W.J. Interactions between haloperfluorobenzenes and fluoranthene in luminescent cocrystals from π-hole⋯π to σ-hole⋯π bonds. CrystEngComm 2017, 19, 5058–5067. [Google Scholar] [CrossRef]
  71. Hu, R.; Lin, S.; Huang, H.; Xie, W.; Wang, M.; Li, R.; Tian, M.; Shuai, Z.; Wei, Y. A family of planar luminogens with active photoluminescence in both dispersion and aggregation states. ChemPhotoChem 2022, 6, e202200079. [Google Scholar] [CrossRef]
  72. Momma, K.; Izumi, F. VESTA 3 for three-dimensional visualization of crystal, volumetric and morphology data. J. Appl. Crystallogr. 2011, 44, 1272–1276. [Google Scholar] [CrossRef]
  73. Bauschlicher, C.W., Jr.; Ricca, A.; Boersma, C.; Allamandola, L.J. The NASA Ames PAH IR spectroscopic database: Computational version 3.00 with updated content and the introduction of multiple scaling factors. Astrophys. J. Suppl. Ser. 2018, 234, 32. [Google Scholar] [CrossRef]
  74. Rousseau, D.L.; Bauman, R.P.; Porto, S.P.S. Normal mode determination in crystals. J. Raman Spectrosc. 1981, 10, 253–290. [Google Scholar] [CrossRef]
  75. Likhacheva, A.Y.; Rashchenkoa, S.V.; Litasov, K.D. High-pressure structural properties of naphthalene. J. Appl. Crystallogr. 2014, 47, 984–991. [Google Scholar] [CrossRef]
  76. Heimel, G.; Hummer, K.; Ambrosh-Draxl, C.; Chunwachirasiri, W.; Winokur, M.J.; Hanfland, M.; Oehzelt, M.; Aichholzer, A.; Resel, R. Phase transition and electronic properties of fluorene: A joint experimental and theoretical high-pressure study. Phys. Rev. B 2006, 73, 024109. [Google Scholar] [CrossRef]
  77. Grüneisen, E. Handbuch der Physik; Springer: Berlin, Germany, 1926; Volume 10. [Google Scholar]
  78. Bridgman, P.W. Further rough compressions to 40,000 Kg/cm2, especially certain liquids. Proc. Am. Acad. Arts Sci. 1949, 77, 129–146. [Google Scholar] [CrossRef]
  79. Murnaghan, F.D. Finite deformations of an elastic solid. Am. J. Math. 1937, 59, 235–260. [Google Scholar] [CrossRef]
  80. Murnaghan, F.D. The compressibility of media under extreme pressures. Proc. Natl. Acad. Sci. USA 1944, 30, 244–247. [Google Scholar] [CrossRef]
Figure 1. Typical Raman spectrum of fluoranthene crystals at ambient pressure, excited with λexc = 632.8 nm. The fluoranthene molecule and the unit cell of the crystal structure are also depicted.
Crystals 15 00697 g001
Figure 2. (a) Raman spectra of fluoranthene in the frequency range of the intermolecular modes recorded at various pressures. (b) Pressure dependence of the corresponding Raman peak frequencies. Open (solid) symbols represent data obtained during pressure increase (decrease). Solid lines through the experimental data are their linear or parabolic least-square fits, while the numbers indicate the linear pressure coefficients for the clearly defined Raman peak frequencies (denoted by thicker symbols and lines). The vertical dashed lines approximately mark the pressures at which changes in the pressure coefficients of the Raman peak frequencies occur.
Crystals 15 00697 g002
Figure 3. (a) Raman spectra of fluoranthene in the 250–1700 cm−1 frequency range, recorded at various pressures. Asterisk marks the strong phonon peak of the diamond anvil. (b) Pressure dependence of the frequencies of the well-resolved Raman peaks within this range originating from intramolecular modes. Open (solid) symbols represent data obtained during pressure increase (decrease). Solid lines through the experimental data are their linear least-square fits, while the numbers indicate the pressure coefficients for the clearly defined Raman peak frequencies (denoted by thicker symbols and lines). The vertical dashed lines approximately mark the pressures at which changes in the pressure coefficients of the Raman peak frequencies occur.
Crystals 15 00697 g003
Figure 4. (a) Raman spectra of fluoranthene in the frequency range of the C–H stretching vibrations recorded at various pressures. (b) Pressure dependence of the corresponding Raman peak frequencies. Open (solid) symbols represent data obtained during pressure increase (decrease). Solid lines through the experimental data are their linear least-square fits, while the numbers indicate the pressure coefficients for the clearly defined Raman peak frequencies (denoted by thicker symbols and lines). The vertical dashed lines approximately mark the pressures at which changes in the pressure coefficients of the Raman peak frequencies occur.
Crystals 15 00697 g004
Figure 5. Frequency normalized pressure slopes Γi = (1/ωi0)·∂ωi/∂P of the Raman peaks of fluoranthene as a function of their frequency ωi0 at 0.0 GPa (open symbols—Γi values of the Raman peaks for P < 2.0 GPa) or 4.7 GPa (solid symbols—Γi values of the Raman peaks for P > 4.7 GPa). Rhombi, circles and squares refer to the intermolecular, intermediate frequency intramolecular and C–H stretching vibrations, respectively. The solid lines through the data correspond to Γi = constant (intermolecular modes) and Γi~ ω i 0 2 (intramolecular modes), while the dashed line corresponds to Γi = constant for the internal modes with ωi0 > 700 cm−1.
Crystals 15 00697 g005
Disclaimer/Publisher’s Note: The statements, opinions and data contained in all publications are solely those of the individual author(s) and contributor(s) and not of MDPI and/or the editor(s). MDPI and/or the editor(s) disclaim responsibility for any injury to people or property resulting from any ideas, methods, instructions or products referred to in the content.

