Article

Eu-Tb-Doped Y-BTC MOF: A Step Towards Optimization of an Energy Conversion System

by
Francesca Lo Presti
1,
Anna Lucia Pellegrino
1,*,
Francesca Loschi
2,
Emil Milan
2,
Adolfo Speghini
2 and
Graziella Malandrino
1
1
Dipartimento Scienze Chimiche, Università degli Studi di Catania, INSTM UdR Catania, Viale Andrea Doria 6, 95125 Catania, Italy
2
Nanomaterials Research Group, Department of Biotechnology, University of Verona and INSTM RU Verona, Strada Le Grazie 15, 37134 Verona, Italy
*
Author to whom correspondence should be addressed.
Crystals 2025, 15(6), 572; https://doi.org/10.3390/cryst15060572
Submission received: 6 May 2025 / Revised: 10 June 2025 / Accepted: 13 June 2025 / Published: 17 June 2025

Abstract

:
Lanthanide-based metal–organic frameworks (Ln-MOFs) represent a key material in various optical applications. Thus, they offer the possibility of fine-tuning their functional properties by adjusting the composition, stoichiometry, and ligand nature. This work reports for the first time the environmentally friendly one-pot synthesis of Eu-Tb-doped yttrium-1,3,5-benzenetricarboxylate MOF, i.e., Y-BTC: Eu (10%), Tb (10%), under mild conditions of temperature and pressure. Structural and morphological investigations were conducted through ATR-IR, XRD, and FE-SEM characterization. The doping percentage was analyzed by EDX spectroscopy. The luminescence properties confirm the down-shifting behavior of the MOF, paving the way for using this Eu-Tb-doped Y-BTC system in photovoltaic technology.

1. Introduction

Due to their unique structural and functional characteristics, lanthanide-based metal–organic frameworks (Ln-MOFs) have attracted much attention. These properties make them suitable for a variety of applications, including drug delivery [1], gas storage [2,3], catalysis [4,5], sensing [6,7,8,9,10], and photovoltaics [11,12,13]. Fine-tuning metal centers, organic linkers, and guest molecules can readily modify their structure to optimize optical properties.
The physicochemical properties of lanthanide elements are constant across the series and include similar ionic radii, redox potentials and a common trivalent oxidation state [14]. Their luminescence is usually modest in simple salts due to electronic transitions being mostly unaffected by the surrounding chemical environment [14,15]. However, when the element is coordinated in more complex systems, such as three-dimensional networks as in MOFs, where a direct metal–carbon interaction is present, the “antenna effect” can occur [16,17]. In this case, organic ligands absorb radiation and transfer energy to the metal electronic states, enhancing the luminescence and increasing emission in the visible or near-IR region. This phenomenon has led to numerous practical applications, including optical sensing [18,19], temperature sensing [17,20,21,22,23,24], bioimaging [8,25], anticounterfeiting [26,27], and lighting [28,29,30].
In the context of photovoltaics, one of the key challenges remains increasing the energy conversion efficiency, which is limited by the incomplete exploitation of the solar spectrum, particularly photons whose energies do not match the bandgap of the active layer (typically silicon) [31]. To address this limitation, energy conversion approaches such as up-conversion (UC), down-conversion (DC), and down-shifting (DS) have been explored [32,33]. These processes rely on the possibility of integrating materials capable of absorbing solar radiation and converting them into a spectral range more suitable for a photovoltaic device. Lanthanide-based MOFs, thanks to their peculiar structure and tunability together with efficient luminescent properties, represent an attractive class of hybrid materials for implementing these mechanisms. Specifically, the presence of organic ligands within the supramolecular structure that sensitize lanthanide metal center emission can mimic DS behavior by converting UV radiation into visible light with high transfer efficiency [12]. Furthermore, co-doping multiple lanthanide ions within the MOF framework can promote intermetallic energy transfer, potentially enabling DC processes [12]. Despite these promising features, only one study has investigated the direct integration of luminescent MOFs into photovoltaic devices specifically for down-shifting and down-conversion applications [12].
Most Ln-MOFs are synthesized using solvothermal or hydrothermal methods, often in toxic solvents like DMF [20,34,35,36,37,38], at high temperatures and pressures over extended periods. In contrast, greener synthesis approaches involve using water–ethanol mixtures, low-temperature synthesis [29,39,40], ultrasonic-assisted processes, and mechanical synthetic techniques that do not require solvents [23,41].
Our work presents a green synthetic method for producing Y-BTC: Eu (10%), Tb (10%) (H3-BTC = 1,3,5-benzenetricarboxylic acid) in a mild, environmentally friendly one-pot process. It involves a simple approach for synthesizing Ln-doped MOFs without using toxic solvents, in contrast to other works that mainly depend on conventional solvothermal techniques. The present Ln-MOF was characterized using Fourier transform infrared spectroscopy (FTIR) and powder X-ray diffraction (PXRD) to evaluate its structural and vibrational properties. Furthermore, the morphology was examined using field emission scanning electron microscopy (FE-SEM), and the compositional study was conducted through EDX microanalysis. The luminescence properties in the visible region were also investigated to test the MOF’s properties as a DS system.

2. Materials and Methods

2.1. Starting Reagents

Yttrium(III) acetate hydrate, europium(III) acetate hydrate, and terbium carbonate hydrate, Tb2(CO3)3(H2O)n, were supplied by STREM Chemicals. Glacial acetic acid was obtained from Panreac AppliChem ITW Reagents, while 1,3,5-benzenetricarboxylic acid was obtained from Sigma-Aldrich. Every chemical was used straightaway, without any further purifying procedures.

2.2. Y-BTC: Eu (10%), Tb (10%) Synthesis

Fifty milliliters of deionized water were mixed with 3.2 mmol Y(CH3COO)3⋅xH2O in a ground-neck glass balloon, along with 0.4 Eu(CH3COO)3⋅xH2O and 0.4 mmol of Tb2(CO3)3(H2O)n. Then, 2.4 mmol of glacial acetic acid was added to remove all carbonates and bicarbonates found in the salts. In a separate beaker, 4 mmol of 1,3,5-benzenetricarboxylic acid was dissolved in 50 mL of 96% ethanol. The two solutions were then mixed together in a ground-neck glass balloon. After that, the reaction mixture was refluxed for 24 h at 80 °C. The reaction was followed by filtering, rinsing with a water/ethanol combination, and letting the product air-dry. Details of the synthetic procedure are reported in ref. [40].

2.3. Characterizations

To assess the morphological and structural characteristics, the synthesized material underwent extensive characterization. The crystalline structure of the samples was determined by X-ray diffraction (XRD) using a Smartlab Rigaku diffractometer (Rigaku corporation, Akishima-shi, Tokyo, Japan) with a rotating Cu Kα anode at 45 kV and 200 mA. With a 0.02° step increase, XRD patterns were acquired in Bragg–Brentano geometry. Fourier transform infrared (FTIR) spectra in ATR mode of powder samples were recorded on a Thermo Scientific Nicolet iS50 FTIR spectrometer (Thermo-Fisher Scientific, Madison, WI, USA).
A ZEISS SUPRA 55VP field-emission scanning electron microscope was employed for morphological characterization. The samples were prepared by mounting them onto aluminum stubs with double-sided adhesive graphite tapes. Using an INCA Oxford windowless detector with a resolution of 127 eV based on the full-width half-maximum (FWHM) of the Mn Kα peak, EDX analysis was used to ascertain the atomic composition of the samples.
The excitation spectra were collected with a spectrofluorimeter (Fluorolog 3, Horiba-Jobin Yvon, Horiba Ltd, Kyoto, Japan) with a Xe lamp and a single emission monochromator (mod. HR320), detected using a photomultiplier in photon counting mode (spectral resolution of 1 nm). The same experimental setup was used for the decay curve with an Xe microsecond pulsed lamp as the excitation source.
The emission spectra of the Y-BTC: Eu (10%), Tb (10%) MOF were excited with an LED flashlight centered at 385 nm coupled with a bandpass filter (centered at 390 nm), a 488 nm diode laser, and a UV lamp emitting around 300 nm. The emission spectra were recorded at 90° geometry with a 4x microscope objective using a half-meter Czerny–Turner monochromator (Shamrock 500i, Andor, Oxford Instruments plc, Abingdon, United Kingdom, grating 1200 lines/mm) with a spectral resolution of 0.07 nm. A CCD camera (iDus 420, Andor, Oxford Instruments) cooled to −80 °C was used to collect the signal.

3. Results

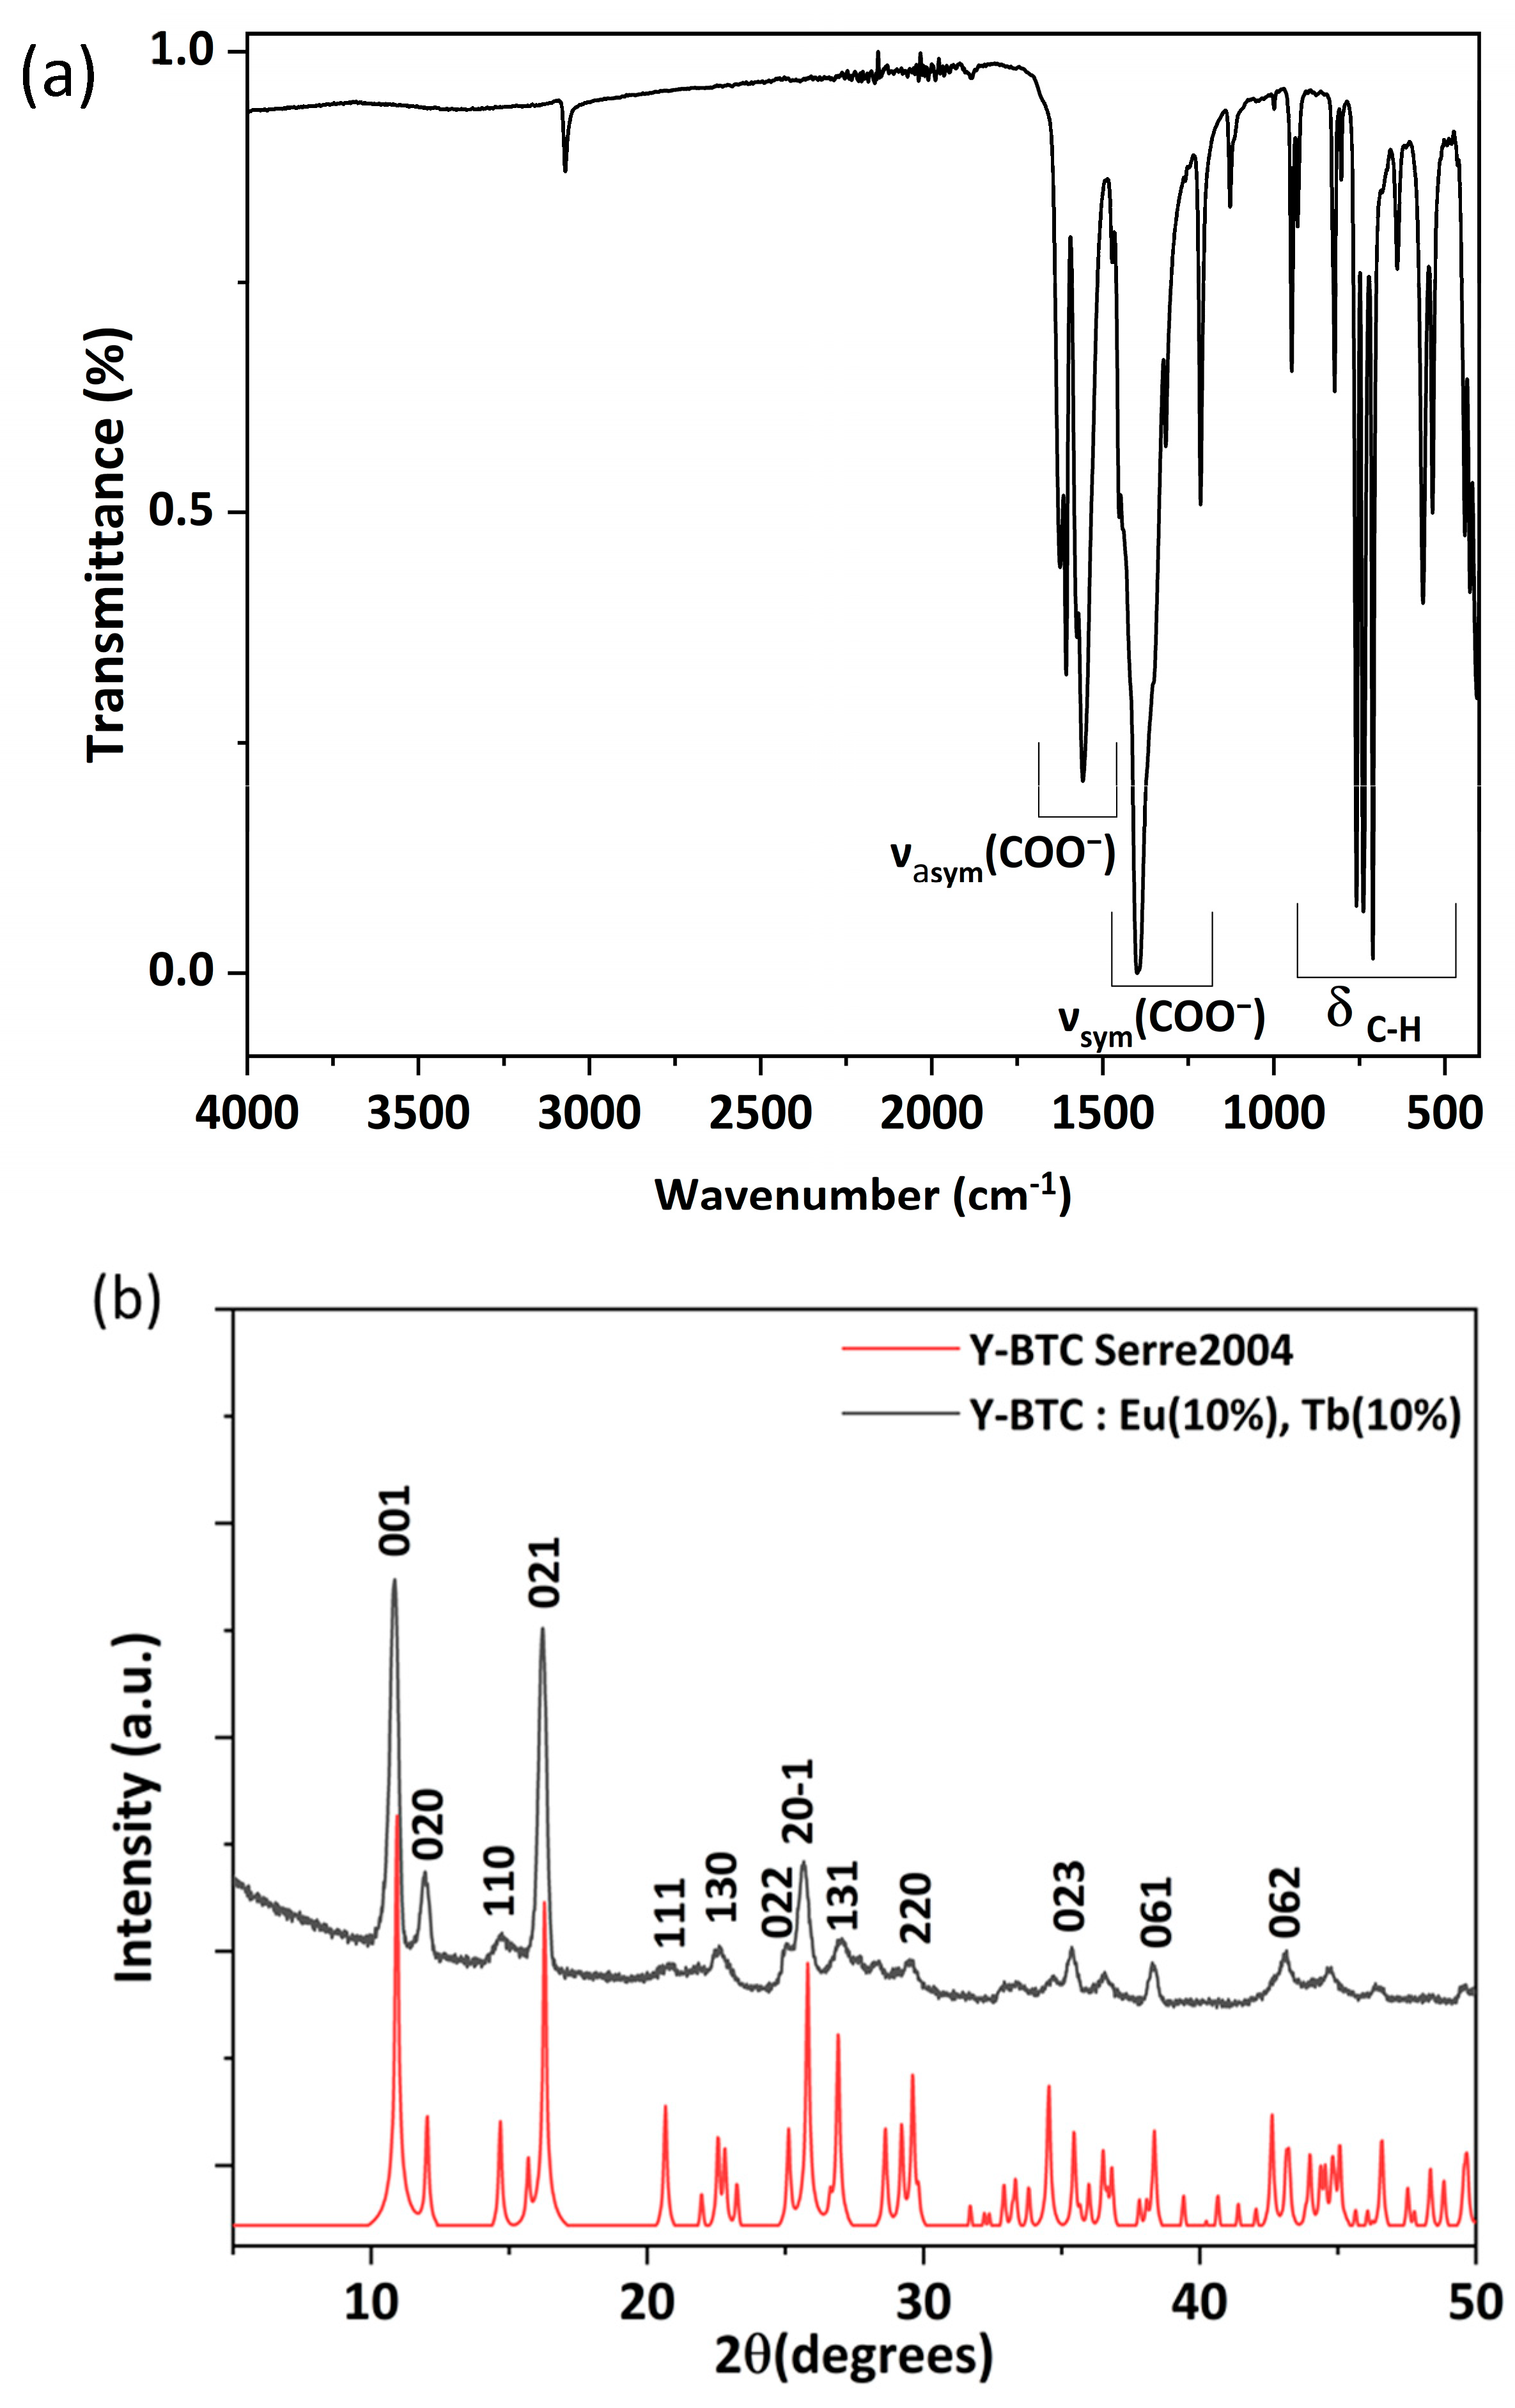
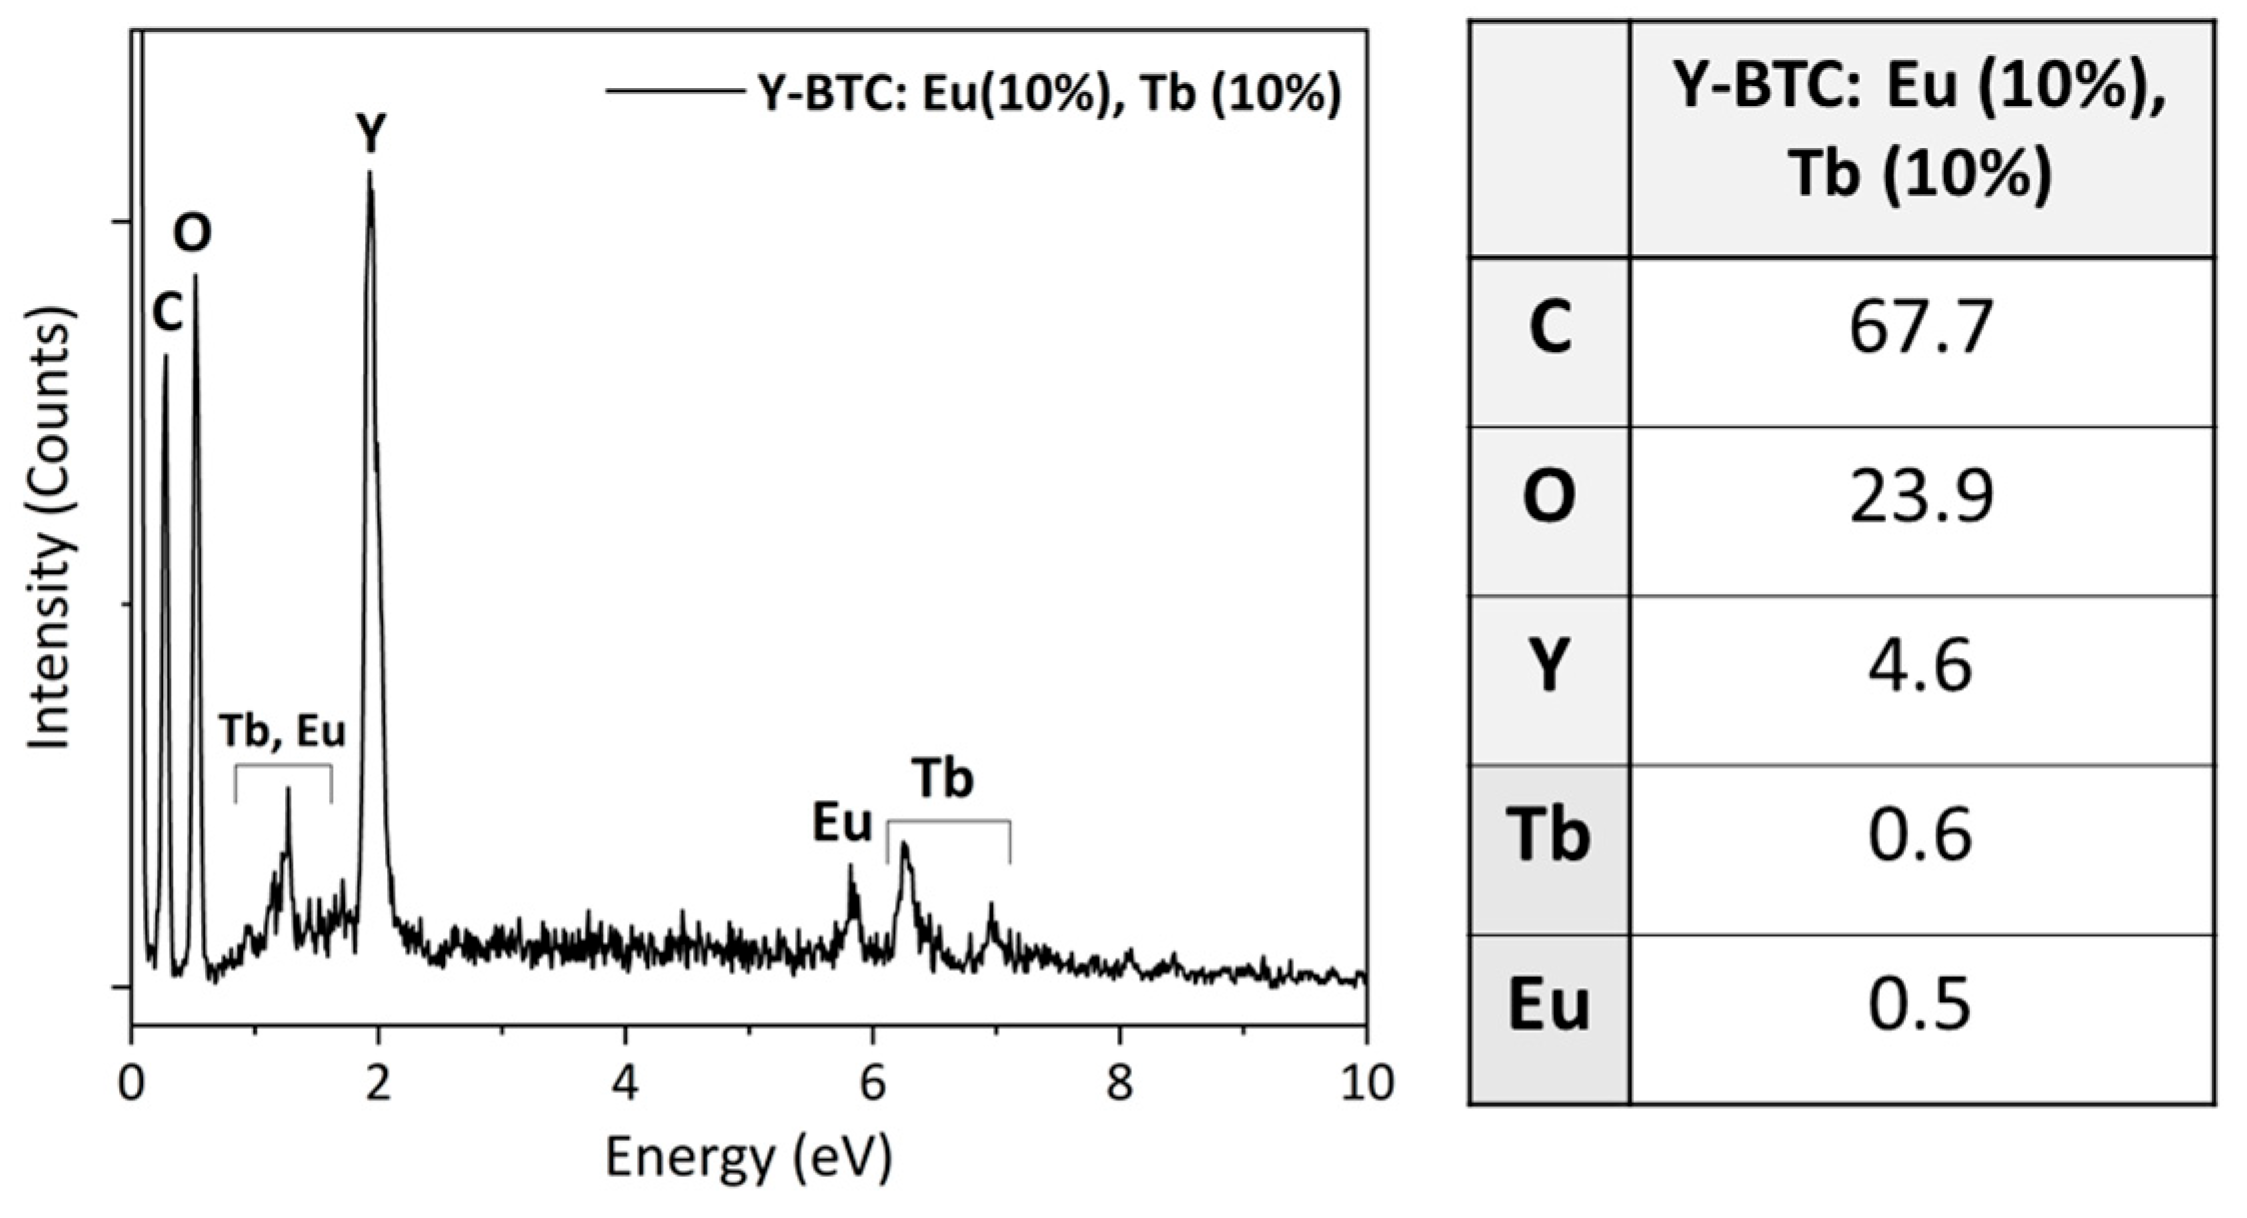
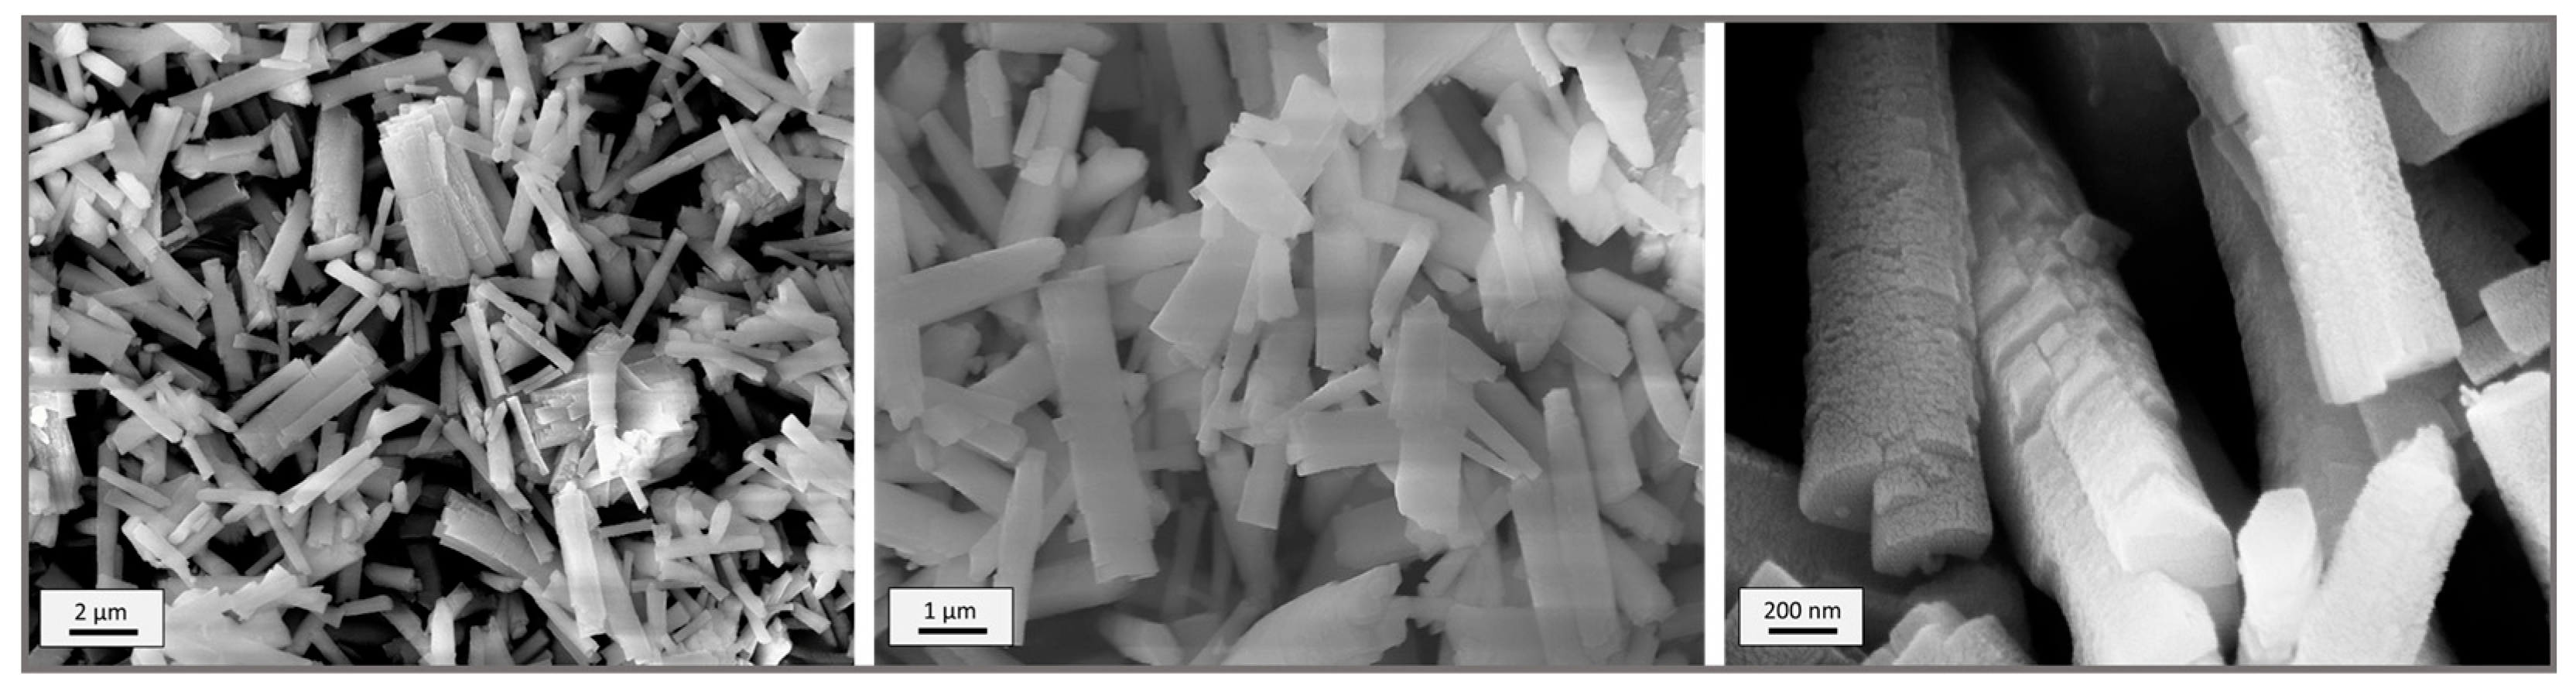
3.1. Y-BTC: Eu (10%), Tb (10%)

Following a previously described protocol for the synthesis of Y-BTC [40], the lanthanide-doped MOF was produced using mild conditions of temperature and pressure and reduced time using commercially available chemicals. With the H3-BTC organic linker, the synthesis was produced in a 1:1 mixture of Et-OH/H2O as solvents using the luminescent element concentration according to the following equation:
0.8   Y ( CH 3 COO ) 3 · xH 2 O + 0.1   Eu ( CH 3 COO ) 3 · xH 2 O + 0.1   Tb 2 ( CO 3 ) 3 ( H 2 O ) n + H 3 - BTC     [ Y 0.8 Eu 0.1 Tb 0.1 ( BTC ) 3 ] + 3 CH 3 COOH + CO 2 + y   H 2 O
FTIR and PXRD analyses were performed to investigate the vibrational and structural characteristics of Y-BTC: Eu (10%), Tb (10%) MOFs.
The FTIR spectrum of the synthesized MOF (Figure 1a) revealed substantial changes compared to that of the free ligand H3-BTC. Specifically, the disappearance of the characteristic carbonyl ν(C=O) band at 1700 cm−1 and of the broad hydroxyl ν(O–H) band between 3300–3500 cm−1 suggests the deprotonation and coordination of carboxylic groups. New vibrational bands instead appeared at 1612–1555 cm−1 and 1442–1383 cm−1, corresponding to the asymmetric and symmetric stretching vibrations of coordinated carboxylates (COO), confirming the successful coordination of Ln3+ with BTC, as reported in ref. [42]. Additional peaks in the 1000–700 cm−1 fingerprint region can be attributed to the vibrational modes of the benzene rings of the BTC organic linker. No bands around 3500 cm−1 due to -OH stretching were visible, indicating that no coordinated or crystallized water molecules were present in our sample.
Figure 1b reports the PXRD pattern of the Y-BTC: Eu (10%), Tb (10%) sample, which closely matches the data reported in ref. [43] for a MIL78(Y, Eu) MOF (red line) with the chemical formula Y1.952Eu0.048O12C18H6. Several peaks of the Y-BTC: Eu (10%), Tb (10%) sample perfectly match the ones reported in [43] related to the Rietveld refinement PXRD of MIL78(Y, Eu). The most intense peaks at 10.83°, 11.96°, 16.23°, and 25.68° are related to the 001, 020, 021, and 20-1 reflection peaks, respectively.
This kind of MOF does not contain coordinated or crystallization water, corroborating the findings from the measured FTIR spectrum. The crystalline structure is consistent with that found by Serre et al. [43], where eight oxygen atoms from the BTC groups surround each metal ion (Y, Eu, and Tb). Then, by analogy with ref. [43], we can deduce that, in our sample, the Eu3+ and Tb3+ ions substitute the Y3+ ones in the crystalline lattice. Moreover, such an assumption is also supported by the fact that Y3+, Eu3+, and Tb3+ in the square antiprismatic coordination have similar ionic radii of 1.019 Å, 1.066 Å, and 1.040 Å, respectively [44].
The characterization through EDX microanalysis confirmed the presence of all the lanthanide metals (Y, Tb, and Eu) in the structure, along with C and O from the organic linker. The EDX spectrum for the Y-BTC: Eu (10%), Tb (10%) MOF is shown in Figure 2. The X-ray L lines of Eu, Tb, and Y were observed in the range of 5.8–7.0 keV and at 1.92 keV, in addition to the C K peak at 0.28 keV and the O K peak at 0.52 keV. Quantitative analysis indicated doping levels of approximately 9% for Eu and 10% for Tb, consistent with the nominal composition.
The FE-SEM images of Y-BTC: Eu (10%), Tb (10%) are shown in Figure 3. The sample exhibited elongated microplate structures of varying sizes and sub-micron widths. The predominant morphology consisted of needle-like structures with lengths ranging from 2 to 4 µm. At higher magnifications, these needle-like structures revealed a circular structure rather than a plate-like one, indicating the formation of parallelepipeds with dimensions not exceeding 500 nm but with considerable length.

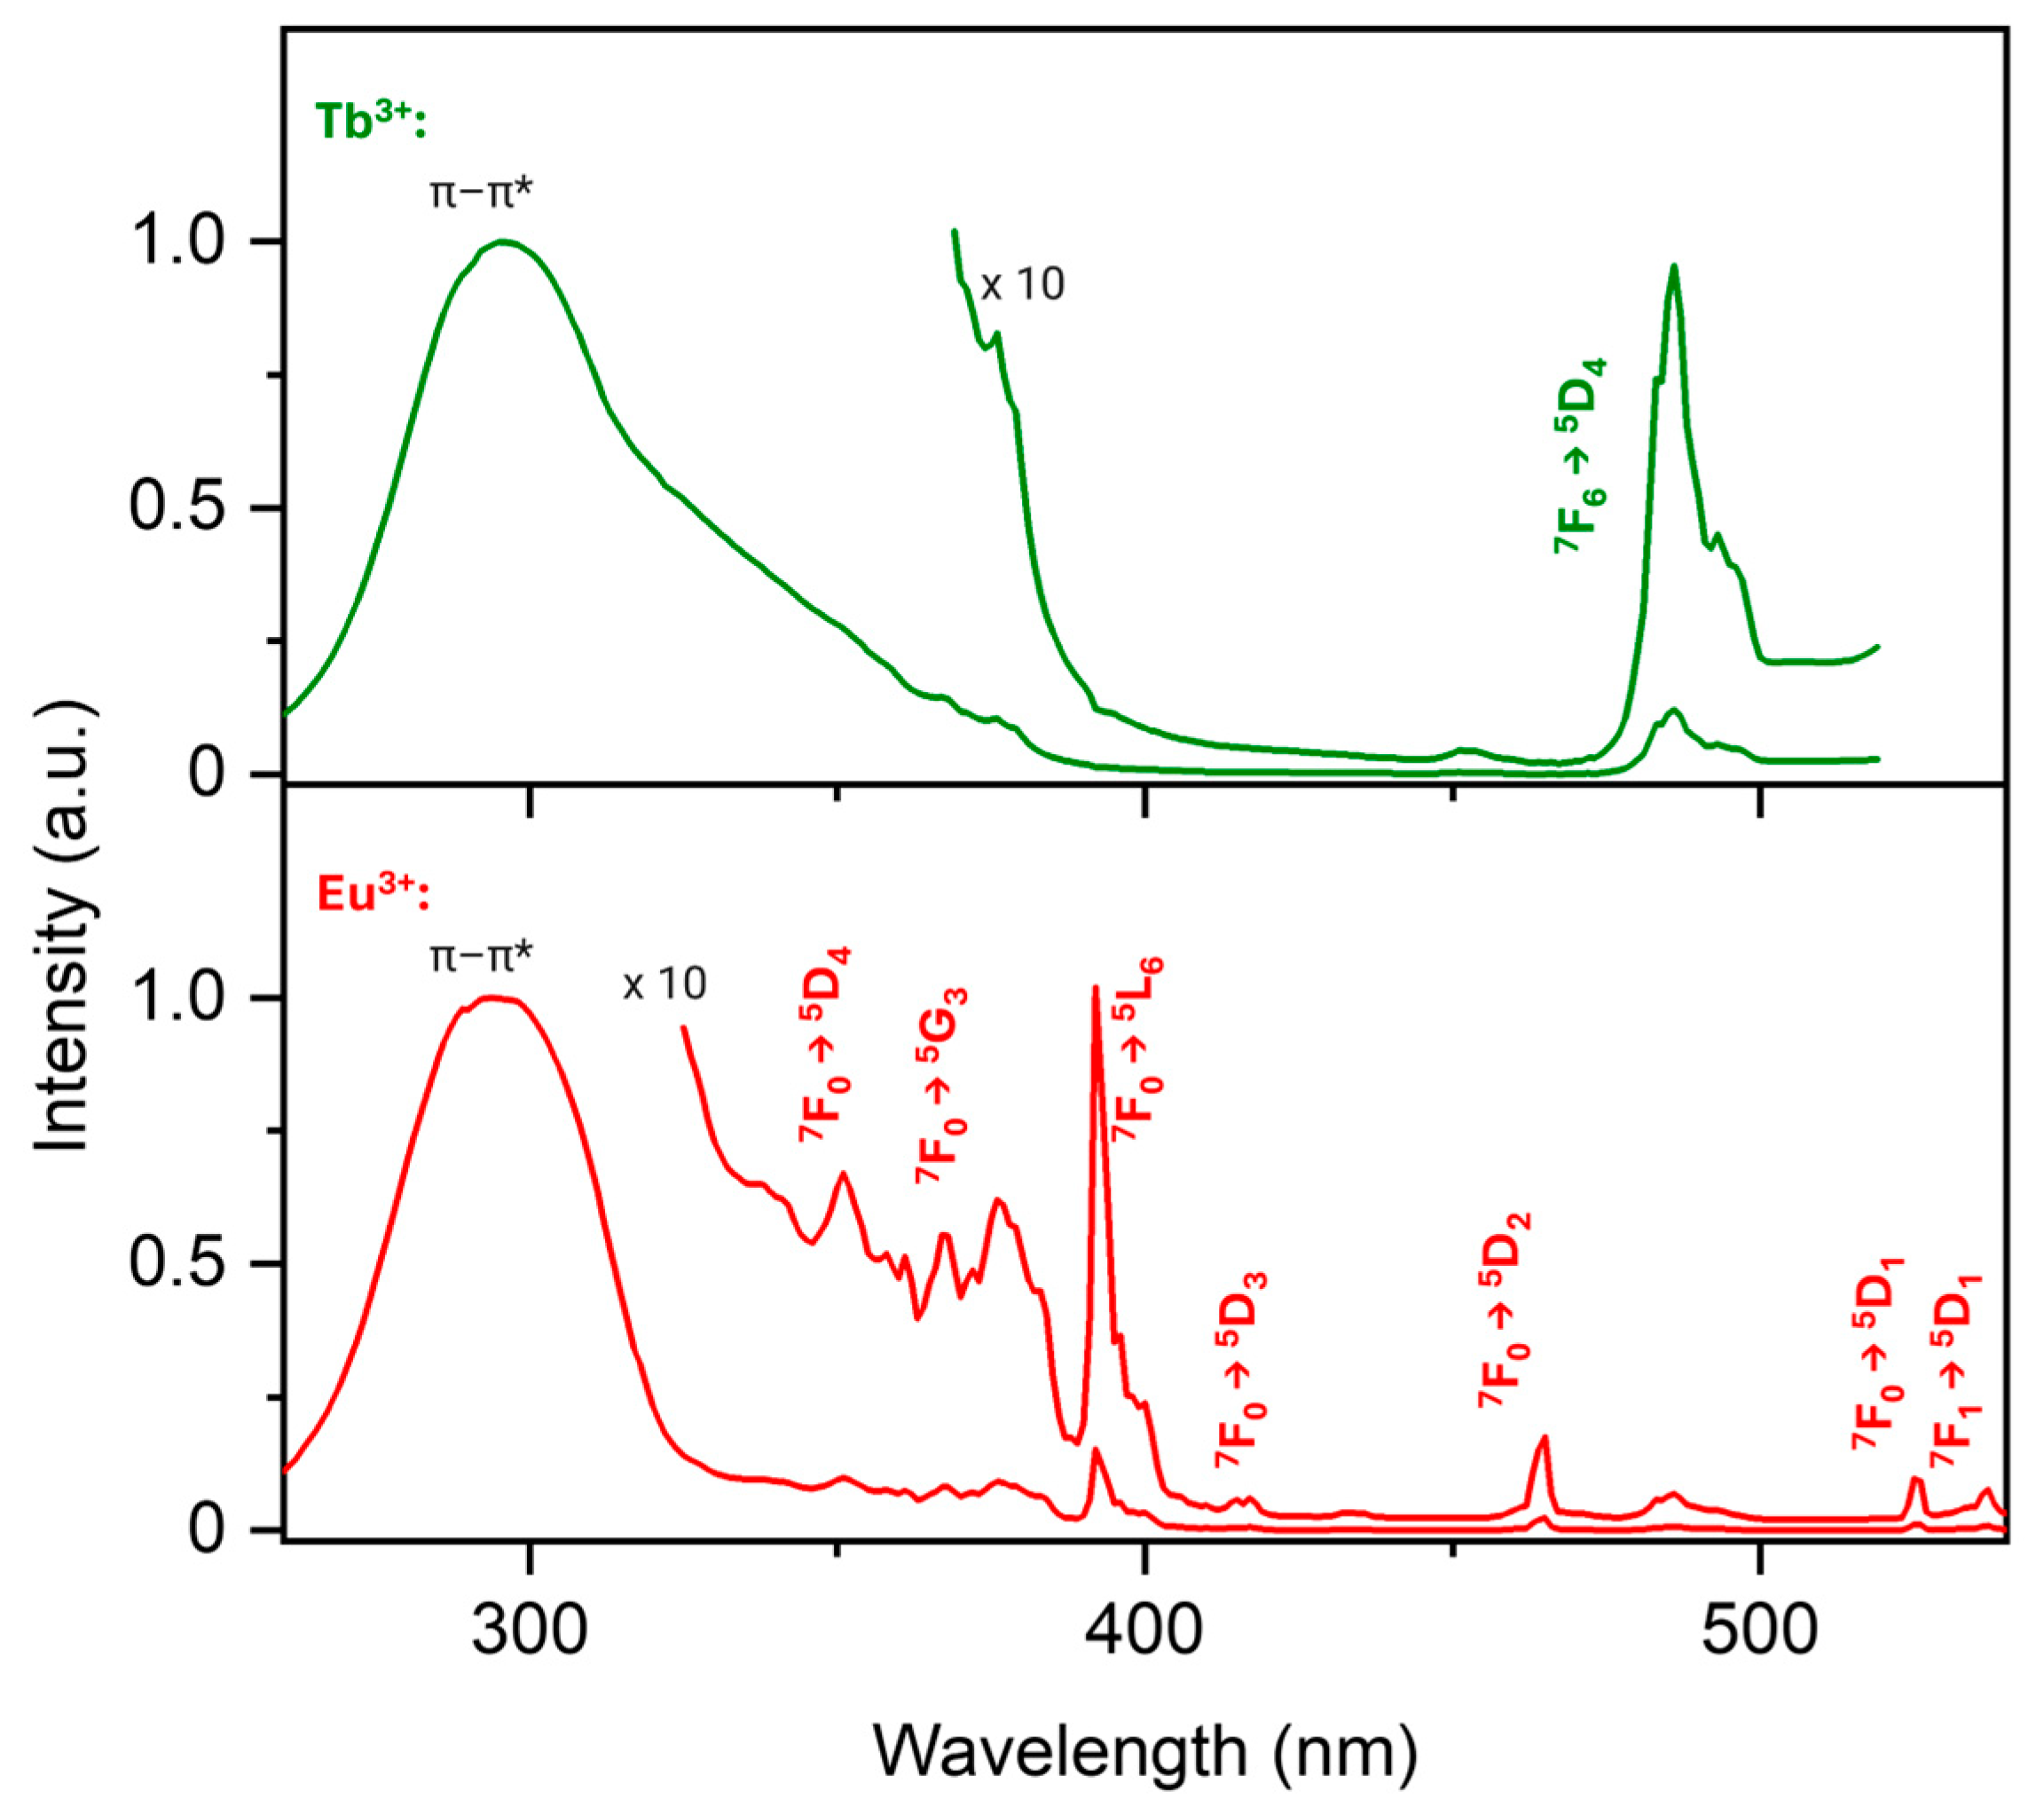
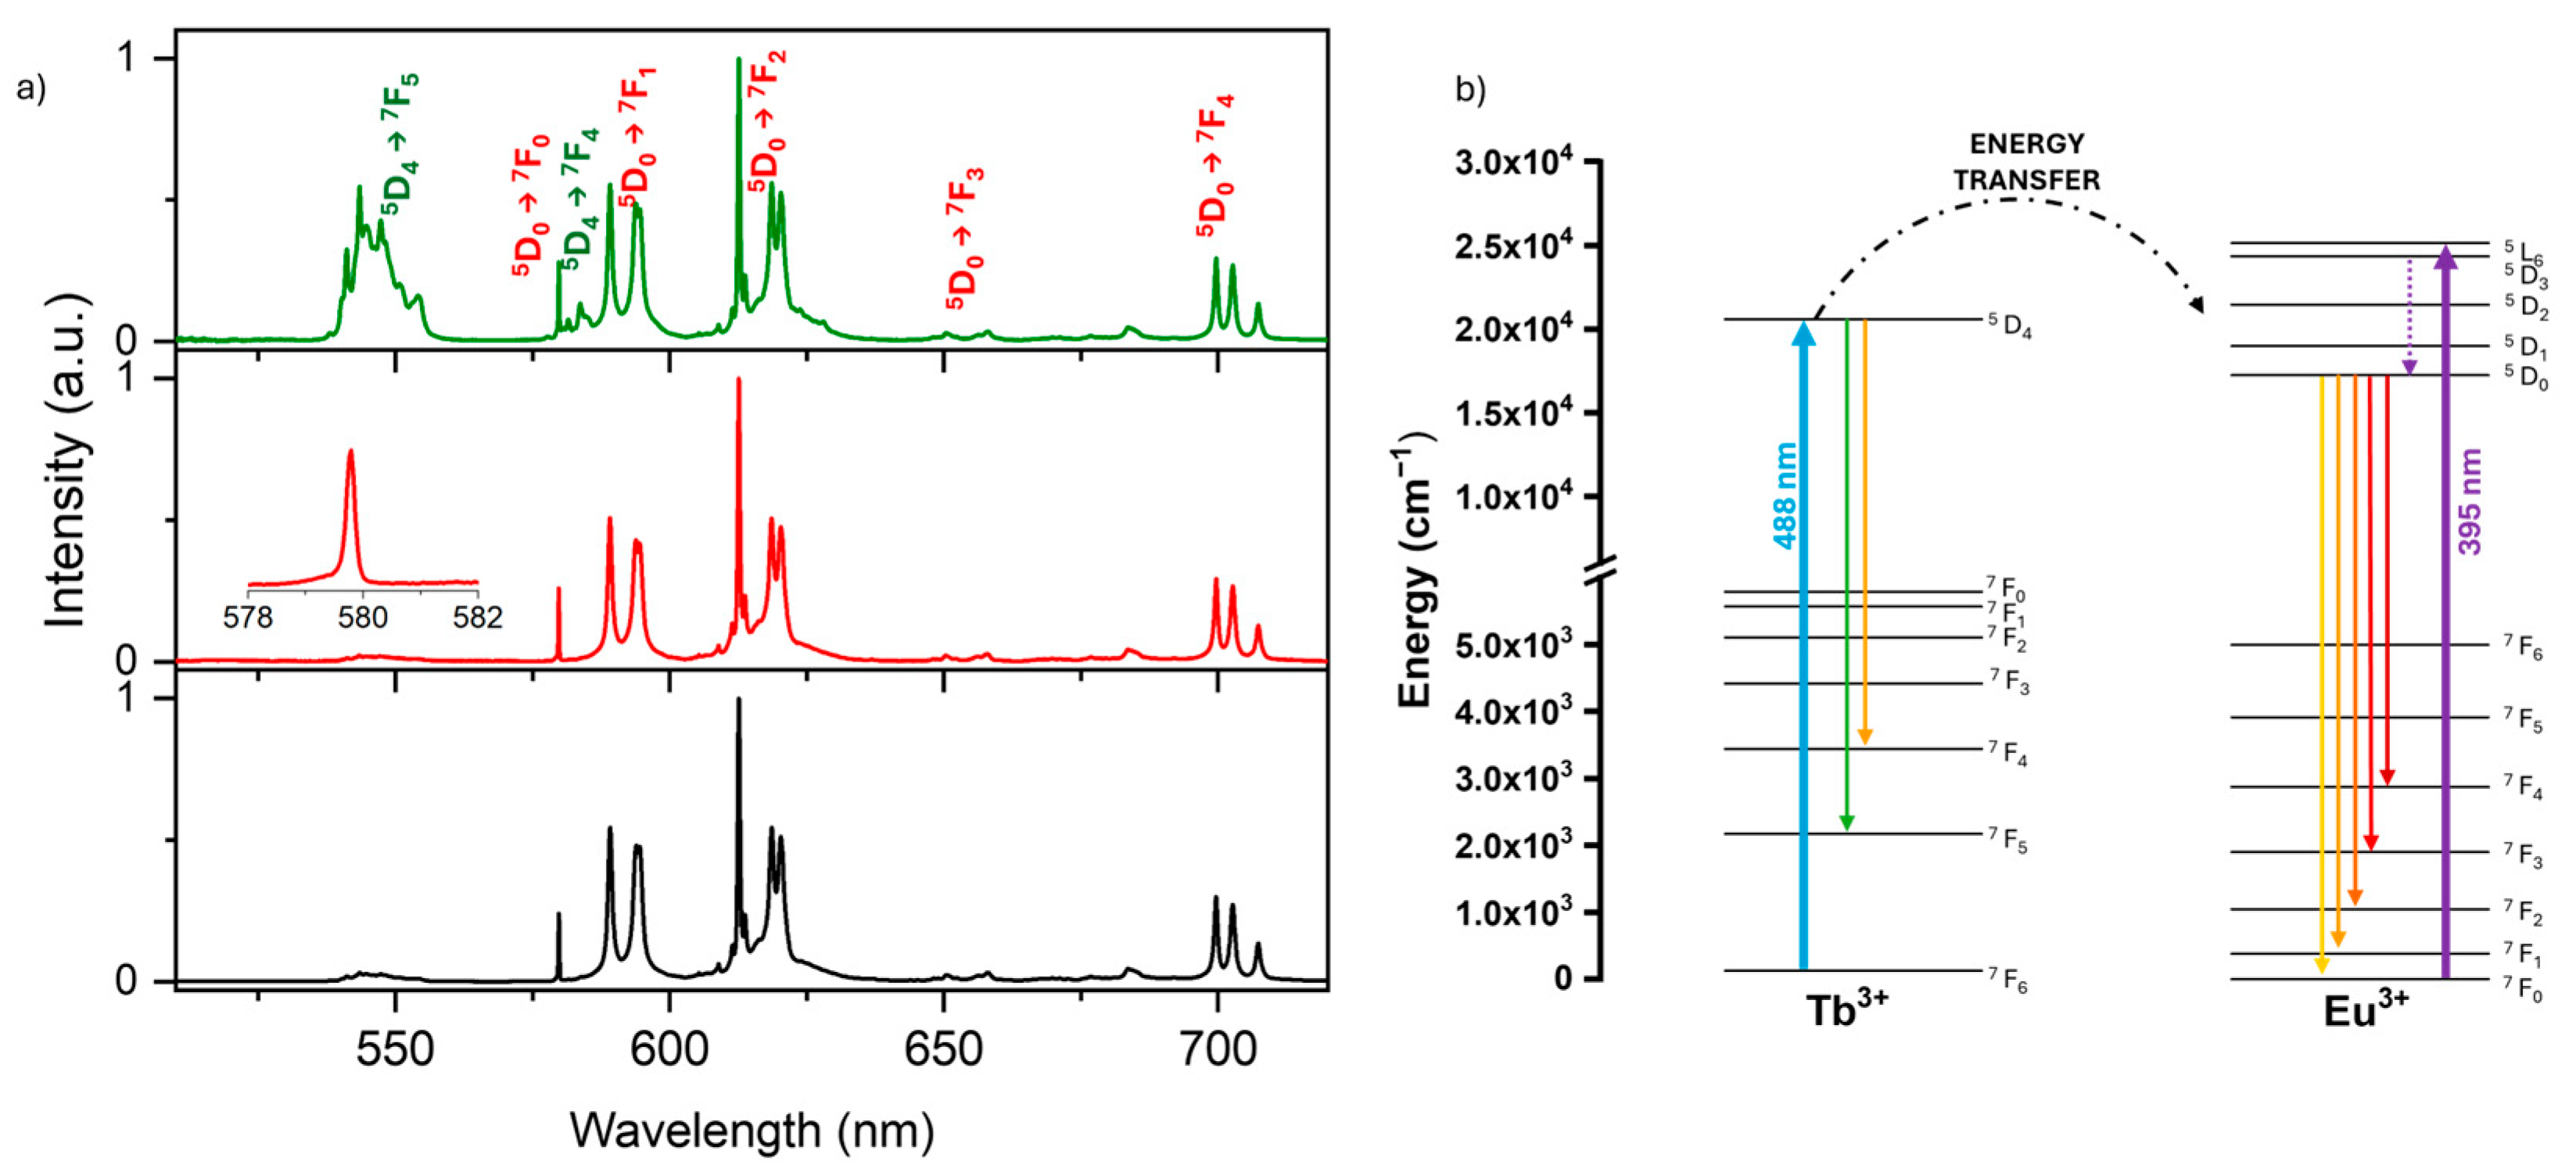
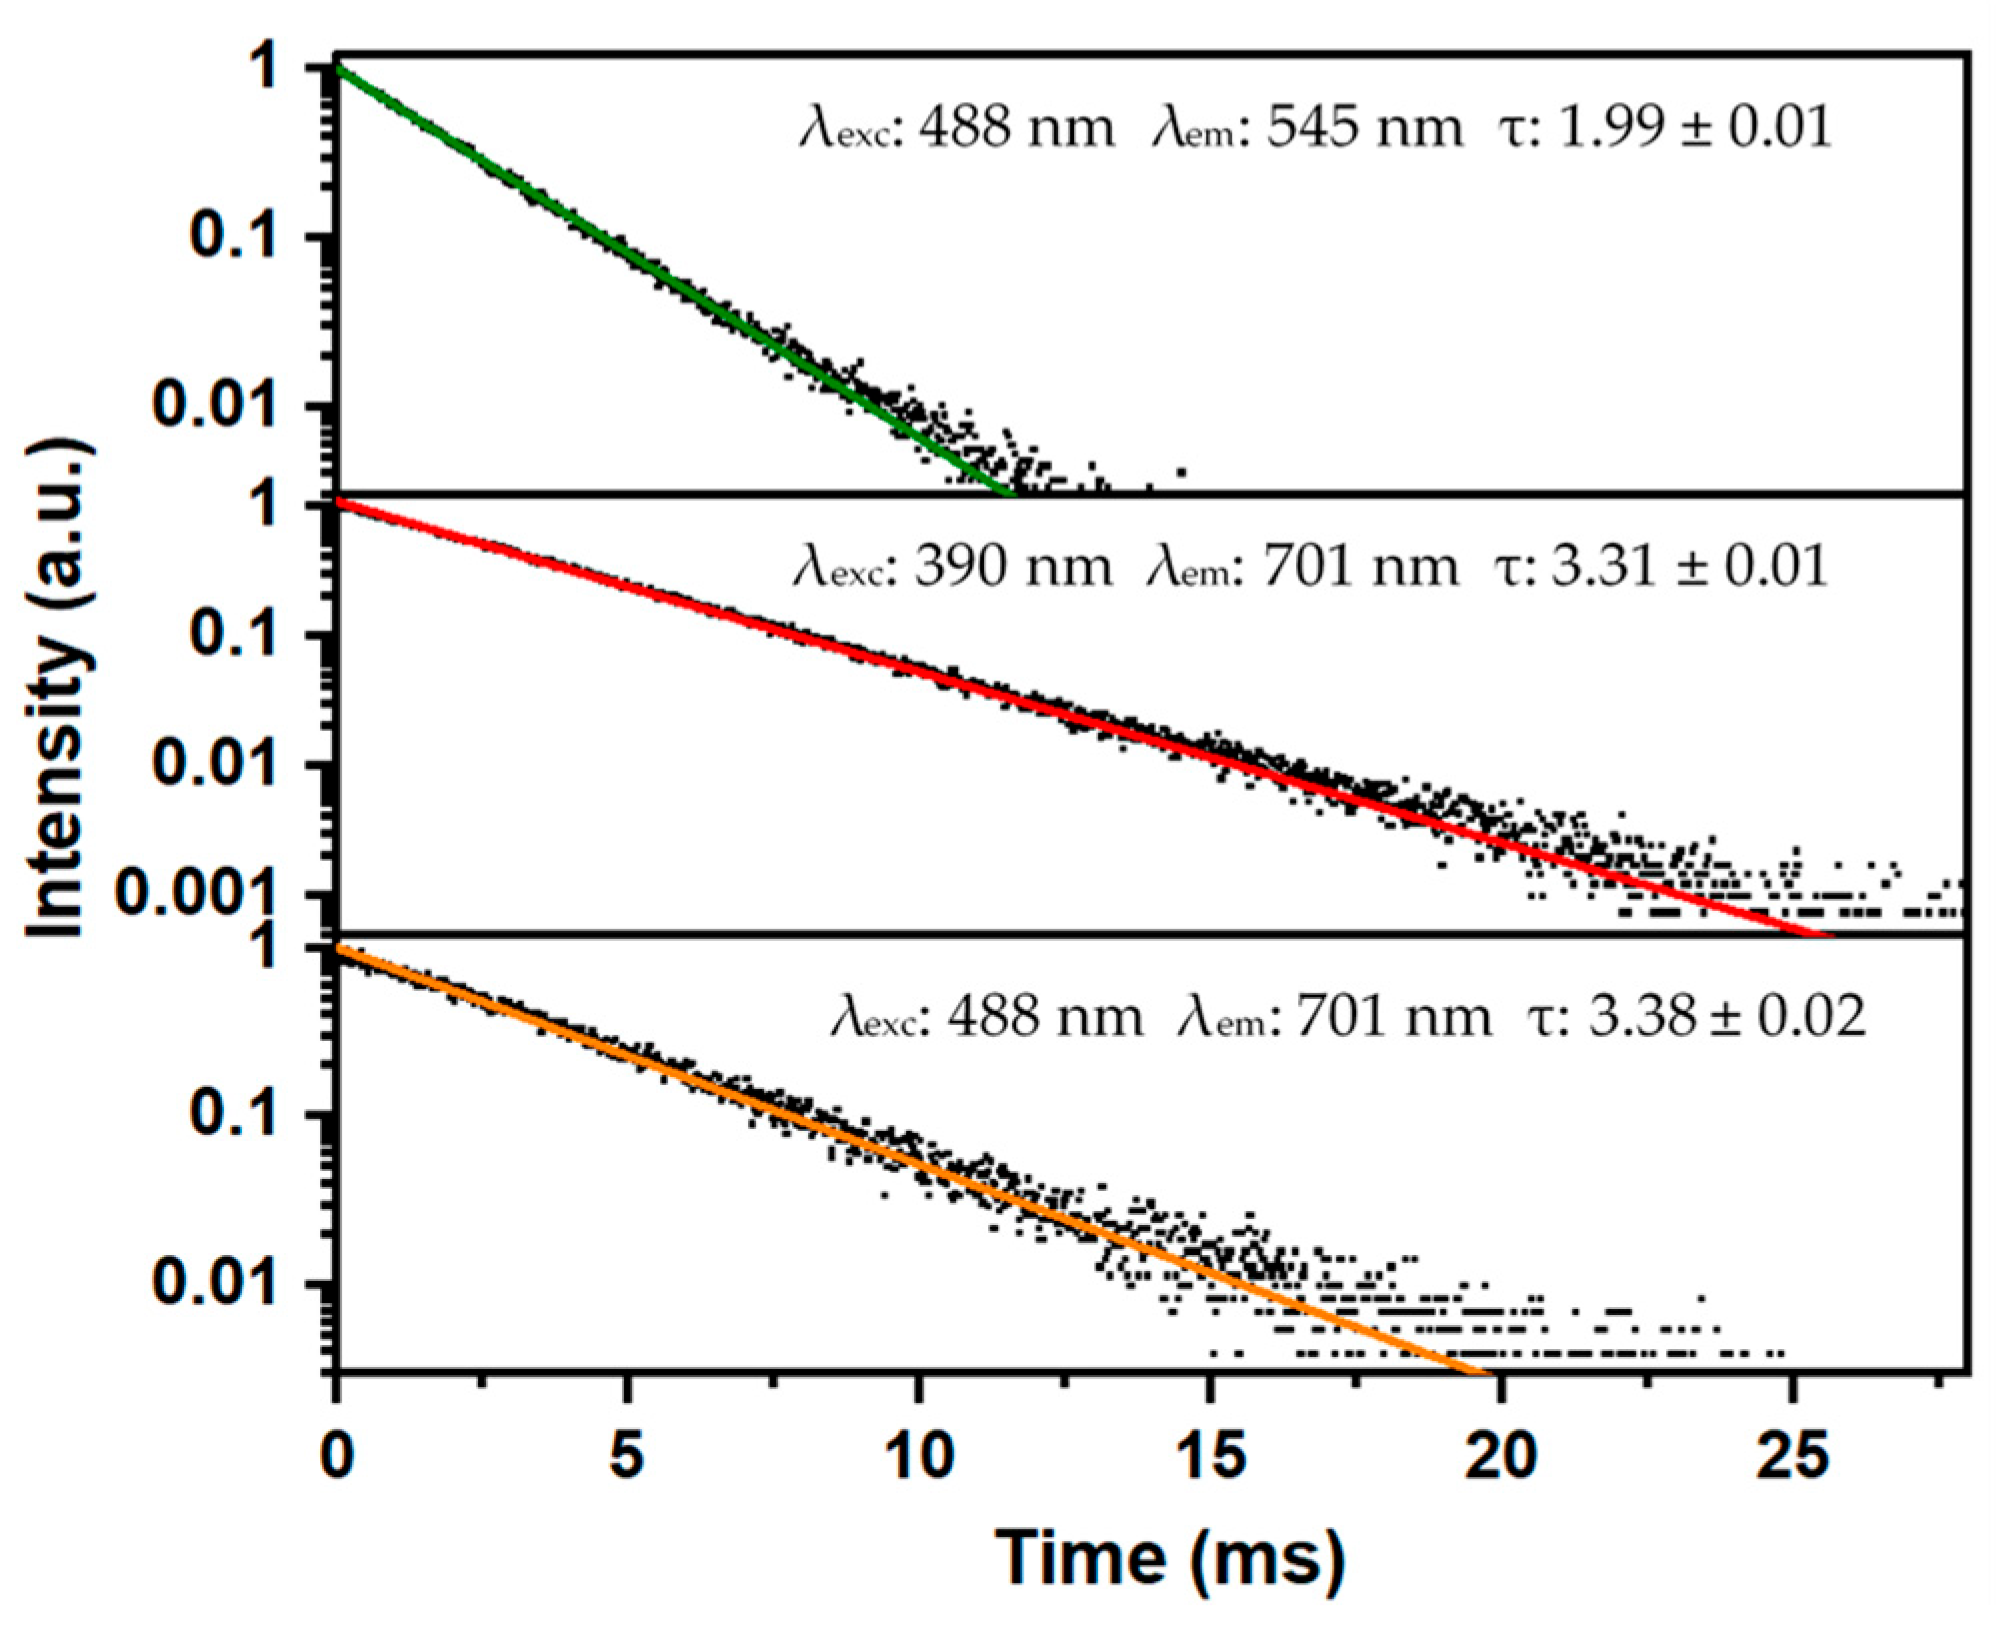
3.2. Luminescence Properties

Excitation spectra (Figure 4) were acquired at room temperature, monitoring the emission at 702 nm (red line) assigned to the 5D07F4 transition of Eu3+ ions and the one at 543 nm (green line) due to the 5D47F5 transition of Tb3+ ions. The broad band centered at 294 nm is attributed to BTC’s π-π* electron transition, while much weaker bands in the visible region are assigned to the 4f-4f transitions of Eu3+ and Tb3+ ions [45]. An intense band for Tb3+ was observed around 488 nm due to the 7F65D4 transition. Characteristic narrow bands due to transitions for the Eu3+ ions, i.e., 7F05L6 centered at 392 nm, 7F05D2 centered at 465 nm, and 7FJ5D1 (J = 0,1) centered around 530 nm, were identified.
The broad band observed in the Eu3+ excitation spectrum (Figure 4, red line) around 488 nm indicates an energy transfer from Tb3+ to Eu3+ ions. Emission spectra for the Y-BTC: Eu (10%), Tb (10%) sample were monitored at room temperature (Figure 5) by exciting into the π-π* electron transition of the BTC ligand at 300 nm (black line), into the 7F05L6 excitation band of Eu3+ at 390 nm (red line), and into the 7F65D4 excitation band of Tb3+ at 488 nm (green line). By exciting into the Eu3+ absorption band at 390 nm, the emission spectrum showed several bands assigned to the 5D07FJ (J = 0, 1, 2, 3, 4) transitions typical of Eu3+ ions (see Figure 5, red line). The Eu3+ emission spectrum was very similar to that observed by Serre et al. for a MIL78(Y, Eu) sample [43], confirming the crystal structure indicated by the PXRD pattern and the FTIR results. In particular, the Lorentzian-shaped band peaking at 579.80 ± 0.05 nm can be assigned to the 5D07F0 transition (see inset of Figure 5a), showing that the Eu3+ ions are accommodated in one main site, as also found by Serre et al. [43]. It is worth noting that by exciting the 7F65D4 transition of Tb3+ ions using a diode laser at 488 nm (see Figure 5a, green line), emissions from both Eu3+ and Tb3+ ions were observed. In particular, the bands around 550 and 585 nm are due to Tb3+ ions, which correspond to the 5D07F5 and 5D07F4 transitions, respectively. These results indicate that the Tb3+ ions sensitize the emission of Eu3+ ions due to energy transfer processes (i.e., dipole–dipole, exchange mechanisms, and so on), as reported by many authors [46,47]. An energy level scheme of the lanthanide ions and energy transfer is shown in Figure 5b.
To obtain further insight into the dynamics of the spectroscopic processes, we measured the decay curves for the Y-BTC: Eu (10%), Tb (10%) MOF, considering excitation into Eu3+ and Tb3+ energy levels (at 390 nm and 488 nm, respectively), as shown in Figure 6. The decay curves can be well fitted using a single-exponential function. The values of the lifetimes τ (ms) are reported in the figure. The Eu3+ emission in this MOF has a relatively long lifetime (3.31 ± 0.01 ms), which agrees with the absence of water molecules in the Eu3+ coordination sphere that would act as emission quenchers, favoring nonradiative decays [48].
Meng et al. [49] calculated the radiative lifetime τR of Eu3+ in a MOF using the following equation:
1 τ R = A M D , 0 n 3   I t o t I M D
where n is the refractive index of the medium, AMD,0 is the spontaneous emission probability for the 5D07F1 transition in vacuo (value of 14.65 s−1), and ITot/IMD is the ratio of the integrated emission intensity of the Eu3+ emission (ITot) to the area of the emission due to the 5D07F1 transition [50]. According to Meng et al. [49] and Chong et al. [51], we assumed the refractive index of our Y-BTC MOF to be 1.4. From the calculated ITot/IMD ratio, the radiative lifetime τR of Eu3+ is estimated as 7.0 ms. Considering the measured lifetime for the Eu3+ ions, around 3.4 ms (see Figure 6), the intrinsic quantum yield for Eu3+ can be evaluated by the following formula:
Φ i n t E u = τ τ r
The calculated value Φ i n t E u was around 49%, which is an excellent value compared to the one found for MOF-76 doped with Eu3+ ions (26%, [49]). This value also aligns with the absence of water molecules as quenchers around the Eu3+ ions.

4. Discussion

The current work produced and studied luminescent metal–organic frameworks (MOFs) based on yttrium-1,3,5-benzenetricarboxylate (Y-BTC) doped with lanthanide ions, namely, terbium (Tb3+) and europium (Eu3+). Specifically, the goal was the fabrication of MOFs with controlled luminescent characteristics and the examination of their structural and morphological peculiarities.
The main advantages of the present approach are related to the possibility of obtaining a highly crystalline arrangement of doped MOF using a green approach under mild conditions of temperature and pressure starting from commercially available reagents. The added value of this material compared to the Y-BTC counterpart is related to the high luminescent properties arising from the Eu and Tb doping ions while maintaining the same crystalline structure, as confirmed by literature comparison of the pattern. Furthermore, an important advantage of this MOF is related to the high photostability due to the highly stable lanthanide luminescent active centers [21,52].
The morphology analyzed by FE-SEM displayed a needle-like structure quite different from the one found in the Y-BTC MOF obtained under similar synthetic conditions [40], in which a plate-like structure was formed. This difference can be likely attributed to the doping component’s effect in the synthesis’s starting mixture.
A key aspect of this study was the investigation of luminescent properties of this luminescent MOF in solid-state for energy conversion applications. Compared to conventional materials used for spectral conversion—such as quantum dots, organic dyes, and inorganic phosphors—MOFs offer advantages in terms of stability, modular synthesis, and reduced toxicity, making them compelling candidates for enhancing solar energy harvesting technologies. To examine the materials’ optical performance, emission spectra were acquired, emphasizing the energy transfer between Eu3+ and Tb3+ ions and the effect of the BTC ligand as an antenna. The possibility to use these lanthanide-doped MOFs in cutting-edge luminous technologies is further highlighted by the observed sensitization of Eu3+ emission by Tb3+ ions, as demonstrated by energy transfer processes. Interestingly, the long decay lifetime of Eu3+, together with information from the ATR-IR spectrum, excludes the presence of water molecules in the Eu3+ coordination sphere that otherwise would have acted as quenching channels, favoring nonradiative decays.
Eu3+ and Tb3+’s distinctive emission bands were visible in the data, indicating that the MOFs were successfully doped with both ions to produce a multi-color emission profile. Relatively narrow emission bands and variations in intensity ratios imply that the materials’ emission properties may be adjusted, paving the way to customize luminescence in a wide range of sensing and imaging applications in the optical region.

5. Conclusions

This work reports for the first time the fabrication of Eu–Tb-doped yttrium-1,3,5-benzenetricarboxylate MOF, i.e., Y-BTC: Eu (10%), Tb (10%). A deep investigation assessed the material’s structural and morphological aspects. In particular, ATR-IR and XRD measurements confirmed the crystalline arrangement of the MOF, which is isostructural with the MIL-78(Y, Eu) MOF, where eight oxygen atoms from the BTC3− groups surround each Y3+, Eu3+, or Tb3+ ion. The FE-SEM analyses showed the formation of needle-like structures with lengths ranging from 2 to 4 µm, while the EDX spectrum confirmed the stoichiometry of the doping ions. Interestingly, the luminescence measurement demonstrated the functional properties of the Y-BTC: Eu (10%), Tb (10%), showing an intense emission of the Eu and Tb moieties and the effect of the BTC ligand.
The co-doping within the MOF framework promotes energy transfer, potentially enabling DC processes. In this context, the present study represents a first step towards a very attractive direct integration of luminescent MOFs into photovoltaic devices for down-shifting and down-conversion applications.

Supplementary Materials

The following supporting information can be downloaded at: https://www.mdpi.com/article/10.3390/cryst15060572/s1.

Author Contributions

Writing—original draft preparation and conceptualization, F.L.P.; methodology, validation, and writing—review and editing, A.S. and G.M.; investigation and data curation, F.L. and E.M.; formal analysis, supervision, and visualization, A.L.P. All authors have read and agreed to the published version of the manuscript.

Funding

F.L.P. and G.M. thank the European Union (NextGeneration EU) for financial support through the MUR-PNRR within the SAMOTHRACE project (ECS00000022) and the Galileo 2022 project G22_141. A.L.P. thanks the Ministero dell’Università e della Ricerca within the PON FSE REACT-EU 2014–2020 Azioni IV.4. This work was also supported by the PRIN-PNRR project for Mission 4-Component 2-Investment 1.1, financed by the European Union Next-Generation EU, project no. P2022XMF43 “OPTIMISE”, Italian Ministry of University and Research (MUR), Italy. This work was also supported by #NEXTGENERATIONEU (NGEU) and funded by the Italian Ministry of University and Research, National Recovery and Resilience Plan (PNRR) under M4C2-I1.3, project no. PE00000019 “HEAL ITALIA”.

Data Availability Statement

The original contributions presented in this study are included in the article/Supplementary materials. Further inquiries can be directed to the corresponding author.

Acknowledgments

The authors thank the Bionanotech Research and Innovation Tower (BRIT) Laboratory of the University of Catania (Grant no. PONa3_00136, financed by the Italian Ministry for Education, University and Research, MIUR) for the diffractometer facility. The authors thank the Technological Platform Center (CPT) of the University of Verona for allowing the use of experimental facilities.

Conflicts of Interest

The authors declare no conflicts of interest.

References

  1. Younis, S.A.; Bhardwaj, N.; Bhardwaj, S.K.; Kim, K.-H.; Deep, A. Rare Earth Metal–Organic Frameworks (RE-MOFs): Synthesis, Properties, and Biomedical Applications. Coord. Chem Rev. 2021, 429, 213620. [Google Scholar] [CrossRef]
  2. Ay, B.; Yildiz, E.; Enomoto, M.; Okazawa, A.; Kojima, N. Crystal Structures, Gas Storage and Magnetic Properties of Lanthanide-Organic Frameworks Built up from Dicarboxylates, [Ln2(2,5-Pydc)2(2,5-Pipdc)(H2O)2]n (Ln = Ce, Pr, Eu) and (H2pip)n[Ln2(2,6-Pydc)4(H2O)2]n (Ln = Ce, Pr, Eu, Sm). Polyhedron 2022, 226, 116110. [Google Scholar] [CrossRef]
  3. Patra, K.; Pal, H. Lanthanide-Based Metal–Organic Frameworks (Ln-MOFs): Synthesis, Properties and Applications. RSC Sustain. 2025, 3, 629–660. [Google Scholar] [CrossRef]
  4. Alzard, R.H.; Alsaedi, S.; Alseiari, S.; Aljasmi, S.; El-Maghraby, H.F.; Poulose, V.; Hassan, A.; Kamel, M.; Ali, A.; Abdel-Hafiez, M.; et al. Heterogeneous Acetalization of Benzaldehyde over Lanthanide Oxalate Metal–Organic Frameworks. ACS Omega 2024, 9, 37386–37395. [Google Scholar] [CrossRef]
  5. Li, L.; Wang, Z.; Zhao, L.; Liu, H.; Li, Y. Lanthanide-Based Photocatalysts for CO2 Conversion: Are They a Better Choice for Realizing Sustainability? Coord. Chem. Rev. 2025, 522, 216223. [Google Scholar] [CrossRef]
  6. Barroso, N.; Andreo, J.; Beobide, G.; Castillo, O.; Luque, A.; Pérez-Yáñez, S.; Wuttke, S. Magnetic Sustentation as an Adsorption Characterization Technique for Paramagnetic Metal-Organic Frameworks. Commun. Chem. 2023, 6, 4. [Google Scholar] [CrossRef]
  7. Puglisi, R.; Pellegrino, A.L.; Fiorenza, R.; Scirè, S.; Malandrino, G. A Facile One-Pot Approach to the Synthesis of Gd-Eu Based Metal-Organic Frameworks and Applications to Sensing of Fe3+ and Cr2O72− Ions. Sensors 2021, 21, 1679. [Google Scholar] [CrossRef]
  8. Wu, N.; Bo, C.; Guo, S. Luminescent Ln-MOFs for Chemical Sensing Application on Biomolecules. ACS Sens. 2024, 9, 4402–4424. [Google Scholar] [CrossRef] [PubMed]
  9. Zhao, P.; Liu, Y.; He, C.; Duan, C. Synthesis of a Lanthanide Metal–Organic Framework and Its Fluorescent Detection for Phosphate Group-Based Molecules Such as Adenosine Triphosphate. Inorg. Chem. 2022, 61, 3132–3140. [Google Scholar] [CrossRef]
  10. Li, Q.; Zhou, Y.; Zou, W.; Wu, Q.; Sun, R.; Liu, H.; Zhang, Z.; Zhao, Q. An Acid-Resistant Lanthanide Metal–Organic Framework Based on Tetraphenylethylene as an Electrochemical Nitrite Sensor. Inorg. Chem. 2024, 63, 23354–23362. [Google Scholar] [CrossRef]
  11. Liu, C.; Eliseeva, S.V.; Luo, T.-Y.; Muldoon, P.F.; Petoud, S.; Rosi, N.L. Near Infrared Excitation and Emission in Rare Earth MOFs via Encapsulation of Organic Dyes. Chem. Sci. 2018, 9, 8099–8102. [Google Scholar] [CrossRef] [PubMed]
  12. Imran, T.; Aziz, H.S.; Iftikhar, T.; Ahmad, M.; Xie, H.; Su, Z.; Yan, P.; Liu, Z.; Liang, G.; Chen, W.; et al. Interfacial Band Bending and Suppressing Deep Level Defects via Eu-MOF-Mediated Cathode Buffer Layer in an MA-Free Inverted Perovskite Solar Cell with High Fill Factor. Energy Environ. Sci. 2024, 17, 7234–7246. [Google Scholar] [CrossRef]
  13. Lee, C.C.; Chen, C.-I.; Liao, Y.-T.; Wu, K.C.-W.; Chueh, C.-C. Enhancing Efficiency and Stability of Photovoltaic Cells by Using Perovskite/Zr-MOF Heterojunction Including Bilayer and Hybrid Structures. Adv. Sci. 2019, 6, 1801715. [Google Scholar] [CrossRef]
  14. Cotton, S. Lanthanide and Actinide Chemistry; John Wiley & Sons: Hoboken, NJ, USA, 2024; ISBN 978-1-118-87346-5. [Google Scholar]
  15. Binnemans, K. Lanthanide-Based Luminescent Hybrid Materials. Chem. Rev. 2009, 109, 4283–4374. [Google Scholar] [CrossRef]
  16. Hasegawa, M.; Ohmagari, H.; Tanaka, H.; Machida, K. Luminescence of Lanthanide Complexes: From Fundamental to Prospective Approaches Related to Water- and Molecular-Stimuli. J. Photochem. Photobiol. C Photochem. Rev. 2022, 50, 100484. [Google Scholar] [CrossRef]
  17. Hu, S.; Liu, J.; Wang, Y.; Liang, Z.; Hu, B.; Xie, J.; Wong, W.-L.; Wong, K.-Y.; Qiu, B.; Peng, W. A New Fluorescent Biosensor Based on Inner Filter Effect and Competitive Coordination with the Europium Ion of Non-Luminescent Eu-MOF Nanosheets for the Determination of Alkaline Phosphatase Activity in Human Serum. Sens. Actuators B Chem. 2023, 380, 133379. [Google Scholar] [CrossRef]
  18. Mayeuski, A.V.; Poloneeva, D.Y.; Toshcheva, E.A.; Bardakova, A.V.; Shuruhina, A.V.; Emeline, A.V.; Bahnemann, D.W. UV-Induced Alteration of Luminescence Chromaticity of Ln-Based MOF-76. J. Lumin. 2021, 235, 117970. [Google Scholar] [CrossRef]
  19. Li, Y.; Wang, F.; Liang, M.; Sun, M.; Xia, L.; Qu, F. Fabrication of a Two-Dimensional Bi-Lanthanide Metal-Organic Framework as a Ratiometric Fluorescent Sensor Based on Energy Competition. Talanta 2024, 278, 126456. [Google Scholar] [CrossRef]
  20. Zhang, L.; Xie, Y.; Xia, T.; Cui, Y.; Yang, Y.; Qian, G. A Highly Sensitive Luminescent Metal–Organic Framework Thermometer for Physiological Temperature Sensing. J. Rare Earths 2018, 36, 561–566. [Google Scholar] [CrossRef]
  21. Zhao, Y.; Li, D. Lanthanide-Functionalized Metal–Organic Frameworks as Ratiometric Luminescent Sensors. J. Mater. Chem. C 2020, 8, 12739–12754. [Google Scholar] [CrossRef]
  22. Sun, J.; Zhang, P.; Yan, K.; Pan, A.; Chen, F.; Hong, J.; Zhao, C.; Chen, X.; Xiong, W. Europium/1,3,5-Benzenetricarboxylic Acid Metal–Organic Framework Nanorods Decorated with CdSe Quantum Dots as Coatings for Noncontact Ratiometric Optical Temperature Sensing. ACS Appl. Nano Mater. 2023, 6, 12087–12094. [Google Scholar] [CrossRef]
  23. Liu, T.; Zhou, S.-T.; Zhao, S.-S.; Zhang, H.; Tian, P.; Zhao, Z. Facile Preparation of Codoped Lanthanide Metal–Organic Frameworks with Efficient Energy Transfer for Ratiometric Temperature Sensing. J. Mater. Sci. 2023, 58, 7690–7701. [Google Scholar] [CrossRef]
  24. Rocha, J.; Brites, C.D.S.; Carlos, L.D. Lanthanide Organic Framework Luminescent Thermometers. Chem. A Eur. J. 2016, 22, 14782–14795. [Google Scholar] [CrossRef] [PubMed]
  25. Gong, L.; Chen, L.; Lin, Q.; Wang, L.; Zhang, Z.; Ye, Y.; Chen, B. Nanoscale Metal–Organic Frameworks as a Photoluminescent Platform for Bioimaging and Biosensing Applications. Small 2024, 20, 2402641. [Google Scholar] [CrossRef]
  26. Yu, X.; Ryadun, A.A.; Pavlov, D.I.; Guselnikova, T.Y.; Potapov, A.S.; Fedin, V.P. Ln-MOF-Based Hydrogel Films with Tunable Luminescence and Afterglow Behavior for Visual Detection of Ofloxacin and Anti-Counterfeiting Applications. Adv. Mater. 2024, 36, 2311939. [Google Scholar] [CrossRef]
  27. Simões, R.; Rodrigues, J.; Granadeiro, C.M.; Rino, L.; Neto, V.; Monteiro, T.; Gonçalves, G. Boosting the Optical Properties of Polylactic Acid/ Lanthanide-Based Metal-Organic Framework Composites. Mater. Today Chem. 2023, 29, 101436. [Google Scholar] [CrossRef]
  28. Ajoyan, Z.; Bicalho, H.A.; Donnarumma, P.R.; Antanovich, A.; Howarth, A.J. Tuning the Rare-Earth UiO-66 Metal–Organic Framework Platform for White Light Emission. J. Mater. Chem. C 2023, 11, 8929–8934. [Google Scholar] [CrossRef]
  29. Kang, H.; Peng, J.; Zhang, Z.; Zhou, W. Fluorescent Strengthening Effect of Co-Doped Inert Rare Earth Ions (La3+, Gd3+, Lu3+) on White-Light-Emitting of Eu–Tb(Btc) Coordination Polymers. J. Lumin. 2022, 247, 118904. [Google Scholar] [CrossRef]
  30. Psalti, A.E.; Andriotou, D.; Diamantis, S.A.; Chatz-Giachia, A.; Pournara, A.; Manos, M.J.; Hatzidimitriou, A.; Lazarides, T. Mixed-Metal and Mixed-Ligand Lanthanide Metal–Organic Frameworks Based on 2,6-Naphthalenedicarboxylate: Thermally Activated Sensitization and White-Light Emission. Inorg. Chem. 2022, 61, 11959–11972. [Google Scholar] [CrossRef]
  31. Best Research-Cell Efficiency Chart | Photovoltaic Research|NREL. Available online: https://www2.nrel.gov/pv/cell-efficiency (accessed on 16 April 2025).
  32. Zheng, B.; Fan, J.; Chen, B.; Qin, X.; Wang, J.; Wang, F.; Deng, R.; Liu, X. Rare-Earth Doping in Nanostructured Inorganic Materials. Chem. Rev. 2002, 122, 5519. [Google Scholar] [CrossRef]
  33. Sun, J.; Yang, X.; Sun, S.; Zhao, L.; Wang, S.; Li, Y. Recent Progress of Rare Earth Conversion Material in Perovskite Solar Cells: A Mini Review. Inorg. Chem. Comm. 2022, 143, 109731. [Google Scholar] [CrossRef]
  34. Yan, Z.; Zhao, T.; He, X.; Pu, Y.; Zhu, D. Ratiometric Fluorescence Temperature Sensing of Dual-Lanthanide MOFs (Eu1-xTbx-BTC) Prepared by Solvothermal Method. Mater. Chem. Phys. 2024, 319, 129379. [Google Scholar] [CrossRef]
  35. Djanffar, E.; Bicalho, H.A.; Ajoyan, Z.; Howarth, A.J.; Serier-Brault, H. Rare-Earth UiO-66 for Temperature Sensing near Room Temperature. J. Mater. Chem. C 2024, 12, 8024–8029. [Google Scholar] [CrossRef]
  36. Guan, H.; Qi, M.; Shi, L.; Liu, W.; Yang, L.; Dou, W. Ratiometric Luminescent Thermometer Based on the Lanthanide Metal–Organic Frameworks by Thermal Curing. ACS Appl. Mater. Interfaces 2023, 15, 18114–18124. [Google Scholar] [CrossRef]
  37. Zhou, X.; Chen, L.; Feng, Z.; Jiang, S.; Lin, J.; Pang, Y.; Li, L.; Xiang, G. Color Tunable Emission and Low-Temperature Luminescent Sensing of Europium and Terbium Carboxylic Acid Complexes. Inorg. Chim. Acta 2018, 469, 576–582. [Google Scholar] [CrossRef]
  38. Wu, R.-Z.; Yang, X.; Zhang, L.-W.; Zhou, P.-P. Luminescent Lanthanide Metal–Organic Frameworks for Chemical Sensing and Toxic Anion Detection. Dalton Trans. 2017, 46, 9859–9867. [Google Scholar] [CrossRef]
  39. Brunckova, H.; Mudra, E.; Rocha, L.; Nassar, E.; Nascimento, W.; Kolev, H.; Kovalcikova, A.; Molcanova, Z.; Podobova, M.; Medvecky, L. Preparation and Characterization of Isostructural Lanthanide Eu/Gd/Tb Metal-Organic Framework Thin Films for Luminescent Applications. Appl. Surf. Sci. 2021, 542, 148731. [Google Scholar] [CrossRef]
  40. Lo Presti, F.; Borzì, A.; Pellegrino, A.L.; Rossi, P.; Paoli, P.; Malandrino, G. Morphology Controlled Synthesis of Yttrium Metal–Organic Frameworks with a Tritopic Ligand. Results Chem. 2022, 4, 100640. [Google Scholar] [CrossRef]
  41. Kumari, P.; Kareem, A.; Jhariat, P.; Senthilkumar, S.; Panda, T. Phase Purity Regulated by Mechano-Chemical Synthesis of Metal–Organic Frameworks for the Electrocatalytic Oxygen Evolution Reaction | Inorganic Chemistry. Available online: https://pubs.acs.org/doi/10.1021/acs.inorgchem.2c03609 (accessed on 3 March 2025).
  42. Zhao, L.; Song, X.; Ren, X.; Wang, H.; Fan, D.; Wu, D.; Wei, Q. Ultrasensitive Near-Infrared Electrochemiluminescence Biosensor Derived from Eu-MOF with Antenna Effect and High Efficiency Catalysis of Specific CoS2 Hollow Triple Shelled Nanoboxes for Procalcitonin. Biosens. Bioelectron. 2021, 191, 113409. [Google Scholar] [CrossRef]
  43. Serre, C.; Millange, F.; Thouvenot, C.; Gardant, N.; Pellé, F.; Férey, G. Synthesis, Characterisation and Luminescent Properties of a New Three-Dimensional Lanthanide Trimesate: M((C6 H3)–(CO2)3) (M = Y, Ln) or MIL-78. J. Mater. Chem. 2004, 14, 1540–1543. [Google Scholar] [CrossRef]
  44. Shannon, R.D. Revised Effective Ionic Radii and Systematic Studies of Interatomic Distances in Halides and Chalcogenides. Acta Crystallogr. Sect. A 1976, 32, 751–767. [Google Scholar] [CrossRef]
  45. Liu, K.; You, H.; Zheng, Y.; Jia, G.; Zhang, L.; Huang, Y.; Yang, M.; Song, Y.; Zhang, H. Facile Shape-Controlled Synthesis of Luminescent Europium Benzene-1,3,5-Tricarboxylate Architectures at Room Temperature. CrystEngComm 2009, 11, 2622–2628. [Google Scholar] [CrossRef]
  46. Li, Z.; Núñez, R.; Light, M.E.; Ruiz, E.; Teixidor, F.; Viñas, C.; Ruiz-Molina, D.; Roscini, C.; Planas, J.G. Water-Stable Carborane-Based Eu3+/Tb3+ Metal–Organic Frameworks for Tunable Time-Dependent Emission Color and Their Application in Anticounterfeiting Bar-Coding. Chem. Mater. 2022, 34, 4795–4808. [Google Scholar] [CrossRef] [PubMed]
  47. Li, Z.; Roscini, C.; Núñez, R.; Teixidor, F.; Viñas, C.; Ruiz, E.; Planas, J.G. Rationalizing the Carborane versus Phenyl-Driven Luminescence in Related Dicarboxylic Ligands and Their Antenna Effect for Their Eu3+ and Tb3+ Metal–Organic Frameworks: A Combined Experimental and Computational Study. J. Mater. Chem. C 2024, 12, 2101–2109. [Google Scholar] [CrossRef]
  48. Lucena, M.A.M.; Oliveira, M.F.L.; Arouca, A.M.; Talhavini, M.; Ferreira, E.A.; Alves, S., Jr.; Veiga-Souza, F.H.; Weber, I.T. Application of the Metal–Organic Framework [Eu(BTC)] as a Luminescent Marker for Gunshot Residues: A Synthesis, Characterization, and Toxicity Study. ACS Appl. Mater. Interfaces 2017, 9, 4684–4691. [Google Scholar] [CrossRef]
  49. Meng, D.; Zhao, T.; Busko, D.; Cosgun Ergene, A.; Richards, B.S.; Howard, I.A. Tb and Eu in MOF-76: Elucidating the Mechanisms Responsible for the Divergent Excellent and Poor Photoluminescence Quantum Yields. Adv. Opt. Mater. 2024, 12, 2300867. [Google Scholar] [CrossRef]
  50. Werts, M.H.V.; Jukes, R.T.F.; Verhoeven, J.W. The Emission Spectrum and the Radiative Lifetime of Eu3+ in Luminescent Lanthanide Complexes. Phys. Chem. Chem. Phys. 2002, 4, 1542–1548. [Google Scholar] [CrossRef]
  51. Chong, X.; Kim, K.-J.; Ohodnicki, P.R.; Li, E.; Chang, C.-H.; Wang, A.X. Ultrashort Near-Infrared Fiber-Optic Sensors for Carbon Dioxide Detection. IEEE Sens. J. 2015, 15, 5327–5332. [Google Scholar] [CrossRef]
  52. Nguyen, T.N.; Ebrahim, F.M.; Stylianou, K.C. Photoluminescent, Upconversion Luminescent and Nonlinear Optical Metal-Organic Frameworks: From Fundamental Photophysics to Potential Applications. Coord. Chem. Rev. 2018, 377, 259–306. [Google Scholar] [CrossRef]
Figure 1. (a) FTIR spectrum for Y-BTC: Eu (10%), Tb (10%) MOF; (b) PXRD pattern of the Y-BTC: Eu (10%), Tb (10%) MOF compared with the powder pattern derived from the CIF file of the Y MIL78(Y, Eu) MOF studied by Serre et al. [43].
Crystals 15 00572 g001
Figure 2. EDX spectrum of Y-BTC: Eu (10%), Tb (10%) MOFs and the percentage of elements contained in the MOF.
Crystals 15 00572 g002
Figure 3. FE-SEM images of Y-BTC: Eu (10%), Tb (10%) MOFs at different magnifications.
Crystals 15 00572 g003
Figure 4. Excitation spectra of the Y-BTC: Eu (10%), Tb (10%) MOF monitored at 702 nm (Eu3+ emission, red line and transitions) and at 543 nm (Tb3+, green line and transitions).
Crystals 15 00572 g004
Figure 5. (a) Emission spectra of the Y-BTC: Eu (10%), Tb (10%) MOF: λexc = 488 nm (green line); λexc = 390 nm (red line); λexc = 300 nm (black line). (b) Energy level scheme for Eu3+ and Tb3+ ions and Tb3+-Eu3+ energy transfer process.
Crystals 15 00572 g005
Figure 6. Experimental emission decays and mono-exponential fits for Tb3+ and Eu3+ ions in the Y-BTC: Eu3+ 10%,Tb3+ 10% MOF: λexc = 488 nm, λem = 545 nm (5D47F5 of Tb3+), green line; λexc = 488 nm, λem = 701 nm (5D07F4 of Eu3+), red line; λexc = 390 nm, λem = 701 nm (5D07F4 of Eu3+), orange line.
Crystals 15 00572 g006
Disclaimer/Publisher’s Note: The statements, opinions and data contained in all publications are solely those of the individual author(s) and contributor(s) and not of MDPI and/or the editor(s). MDPI and/or the editor(s) disclaim responsibility for any injury to people or property resulting from any ideas, methods, instructions or products referred to in the content.

