Article

Time-Dependent Rheological Behavior of Surface-Coated Calcite Powder: Implications for Industrial Applications

1
Department of Geological Engineering, Faculty of Engineering, Hacettepe University, Ankara 06800, Türkiye
2
R&D Department, Niğtaş Inc., Niğde 51100, Türkiye
*
Author to whom correspondence should be addressed.
Crystals 2025, 15(6), 568; https://doi.org/10.3390/cryst15060568
Submission received: 21 March 2025 / Revised: 30 May 2025 / Accepted: 6 June 2025 / Published: 17 June 2025

Abstract

In this study, the effects of stearic acid coating concentration (0.85%, 1%, and 1.15% wt.) and storage duration (up to 30 days) on the flow properties of surface-modified micronized calcite powder were investigated to evaluate their implications for critical industrial processes including transportation, feeding, dispersion, and production capacity. The results demonstrated that both stearic acid concentration and storage duration significantly influenced the rheological properties of the coated calcite powders, suggesting that the calcite surfaces had dynamic characteristics. The Conditioned Bulk Density (CBD) values increased significantly from day 1 to day 30, indicating efficient packing of the powders. Although stearic acid-coated calcite powders initially demonstrated enhanced flowability (SE: 5.1→3.7 mJ/g; BFE: 77→59.3 mJ) within the first 8 days, a subsequent increase (SE: 4.6 mJ/g; BFE: 74.3 mJ) by day 30 indicated a time-dependent surface reorganization of the coated particles. The reduction in the Flow Rate Index (FRI) values after a 30-day period indicated a decrease in cohesiveness. The stability index (SI) values initially indicated instability but improved after 30 days. These findings highlight the importance of considering the coating amount and time-dependent behavior when designing experiments, formulating products, and establishing quality control procedures involving calcite fillers.

1. Introduction

The behavior of powders is typically influenced by three primary factors: (1) intrinsic physical properties, including particle size, density, shape, roughness, and porosity; (2) bulk powder properties, such as size distribution, bulk density, distribution of forces, and cohesive and frictional interactions; and (3) external conditions or processing environments, including temperature and humidity, bed voidage, and state of compaction [1,2]. These factors collectively influence powder behavior, which in turn affects the stability of the powder flow. The stability of powder flow plays a crucial role in numerous industrial processes, affecting both the efficiency of operations and the quality of final products. Unstable powder flow can lead to issues such as segregation, caking, and uneven distribution of materials, which can compromise product integrity and process reliability. However, achieving and maintaining stable powder flow presents several challenges. To address these challenges and ensure stable powder flow, it is crucial to understand the underlying factors that influence flow behavior. This understanding is particularly important in industrial settings, where powder flow characteristics directly affect equipment design and processing efficiency. By incorporating this knowledge into process design and equipment selection, industries can mitigate flow-related issues and optimize their operations accordingly. Engineers and process designers must consider flow properties when developing equipment such as hoppers, conveyors, feeders, and mixers to prevent issues such as bridging, ratholing, and irregular discharge. By maintaining stable powder flow, industries can reduce downtime, minimize waste, and improve overall product consistency, ultimately enhancing operational efficiency and product quality across a wide range of applications [2].
The surface composition significantly influences the cohesion and adhesion properties of the powders. The chemical and physical characteristics of particle surfaces determine the strength and nature of interparticle interactions, which, in turn, affect the flowability, compressibility, and tendency of the powder to agglomerate. Factors such as surface energy, polarity, and the presence of functional groups contribute to the cohesive and adhesive forces between particles and between particles and surrounding surfaces. The impact of surface composition on powder behavior extends to numerous industrial and scientific domains. For instance, in pharmaceutical manufacturing, the surface properties of drug particles can affect their dissolution rates, bioavailability, and drug stability. In materials science, the surface composition influences the sintering behavior of metal and ceramic powders. In food processing, the surface characteristics of powdered ingredients can affect their dispersibility, wettability, and overall product quality. Therefore, understanding and controlling the surface composition is crucial for optimizing powder performance and developing tailored solutions for specific applications.
In industrial contexts, a filler is defined as a material incorporated into a product, mixture, or process to enhance its properties, reduce costs, or achieve specific functionality without substantially altering the primary characteristics of the product. Fillers are typically used in powder form to ensure uniform dispersion within the host material, enhance processability, and achieve consistent performance in the final product. One of the most commonly used fillers is calcium carbonate (CaCO3), also known as calcite [3,4]. Although initially employed primarily for cost reduction, it has evolved into a material tailored to meet the diverse needs of contemporary products [5]. Its widespread adoption stems from its cost-effectiveness, abundance, ease of production, whiteness, reinforcing qualities, and ability to enhance the mechanical properties of composites, such as strength, modulus, and toughness [6,7]. The interface between the inorganic calcite surface and polymer matrix plays a crucial role in determining the properties and performance of composite materials. Enhanced interfacial adhesion and better dispersion of the calcite particles in the polymer matrix can improve the mechanical properties (e.g., tensile strength and impact resistance) of the final composite material. The interfacial adhesion strength depends on the compatibility between the calcite surface and polymer matrix. Fatty acids, particularly stearic acid (SA), are commonly used as surface modifiers for calcite particles [3,4,6,8,9,10,11,
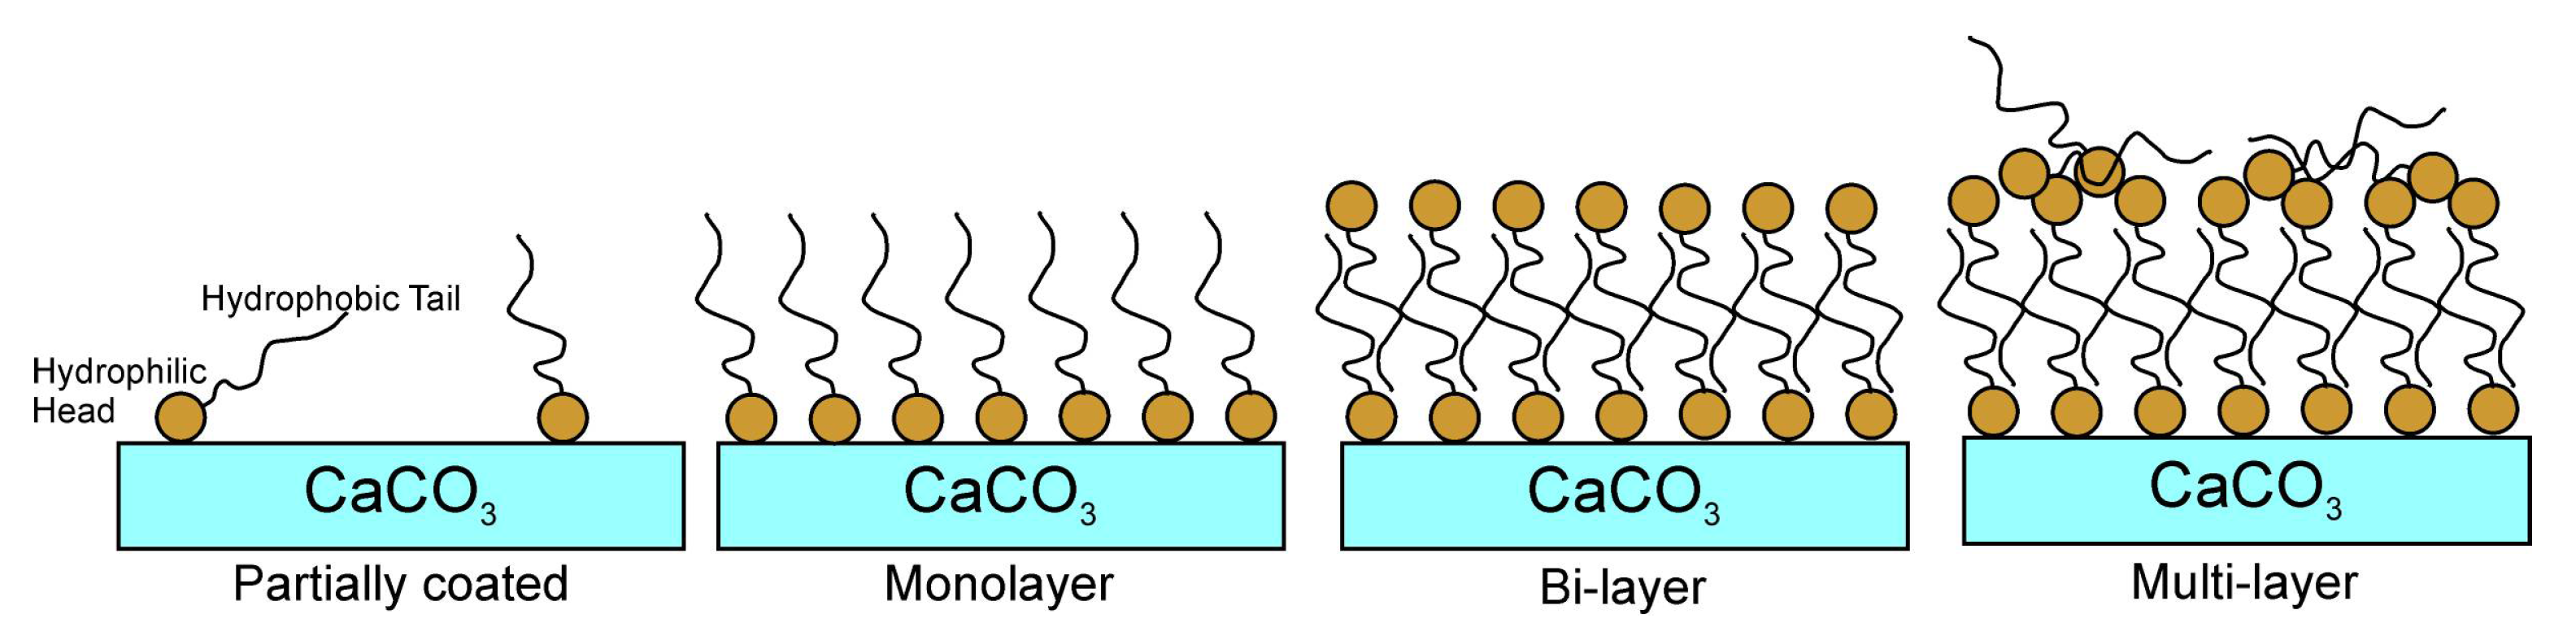
12]. Industrial surface modification of calcite using fatty acids employs two main approaches: dry and wet methods. The carboxylic acid group of stearic acid interacts with calcium ions on the calcite surface, forming a self-assembled monolayer. This coating creates a hydrophobic surface, improving compatibility with nonpolar polymer matrices [4,13]. The optimal SA concentration is critical for forming a monolayer in which each SA molecule binds to a single Ca2+ ion on the surface (Figure 1). The alkyl chains of these molecules are vertically oriented, restricting their movement and providing a uniform and stable coating on the surface. Excess SA results in unattached molecules, disrupting the coating properties and causing surface inconsistencies. Thus, precise control of the SA concentration is essential for achieving the desired monolayer and optimizing the surface properties of the coated calcite particles [4,14].
The measurement of the flow performance of surface-coated calcite powders, which are widely used in industry, is crucial for optimizing industrial processes and product quality. Various testing methods have been developed and refined to address these issues. Reliable prediction of flow performance requires reliable information on the volume, flowability, and processability of the powders [15]. The absence of a universally effective, consistent, and versatile flowability test can be attributed to the extensive range of granular substances and the effects of handling procedures on measurement accuracy [16]. Despite this qualitative understanding, quantifying the kinematics of dry powders with different surface compositions is a highly complex problem, given the extensive range of parameters that affect the bulk cohesion [17,18]. The enhancement of traditional powder testing techniques, such as shear and bulk property testing, through modern instrumentation and methodologies has maintained their relevance in contemporary analytical toolkits. Shear properties are particularly valuable for hopper design and the characterization of consolidated, cohesive powders. Conversely, bulk properties, such as density, permeability, and compressibility, provide general insights into powder behavior, essential data for process design, and predictions of performance in specific processes. Recently, dynamic powder testing has emerged, offering significant opportunities for a more comprehensive understanding of powder behavior. Dynamic characterization involves measuring the forces acting on a blade in both the axial and rotational directions as it moves through a sample along a predetermined helical path [19]. Powder rheometers include various dynamic characterization methods that allow the measurement of the powder response to various environments, thus simulating the range of processing conditions more closely [2,15].
This study systematically investigates how stearic acid coating concentrations (0.85–1.15 wt.%) and post-coating storage duration (up to 30 days) influence the flow properties of micronized calcite powder. The primary objectives of this study were to (1) quantify the time-dependent rheological changes in surface-modified calcite, (2) establish the relationship between coating concentration and powder flowability, and (3) provide practical guidelines for industries utilizing calcite fillers in polymer composites and other applications where consistent powder flow is critical. By elucidating these processing–structure–property relationships, this study aims to enable manufacturers to optimize both the coating parameters and storage conditions to achieve the target flow characteristics while advancing the fundamental understanding of mineral powder surface modification dynamics.

2. Materials and Methods

Calcite (CaCO3) powder (Niğtaş-65) was supplied by Niğtaş Co. (Niğde, Türkiye). The sample was ground by Niğtaş in a horizontal ball mill in dry form using grinding aid chemicals. Triple-pressed stearic acid (C18-65) was obtained from Suriachem Sdn. Bhd. (Selangor, Malaysia).
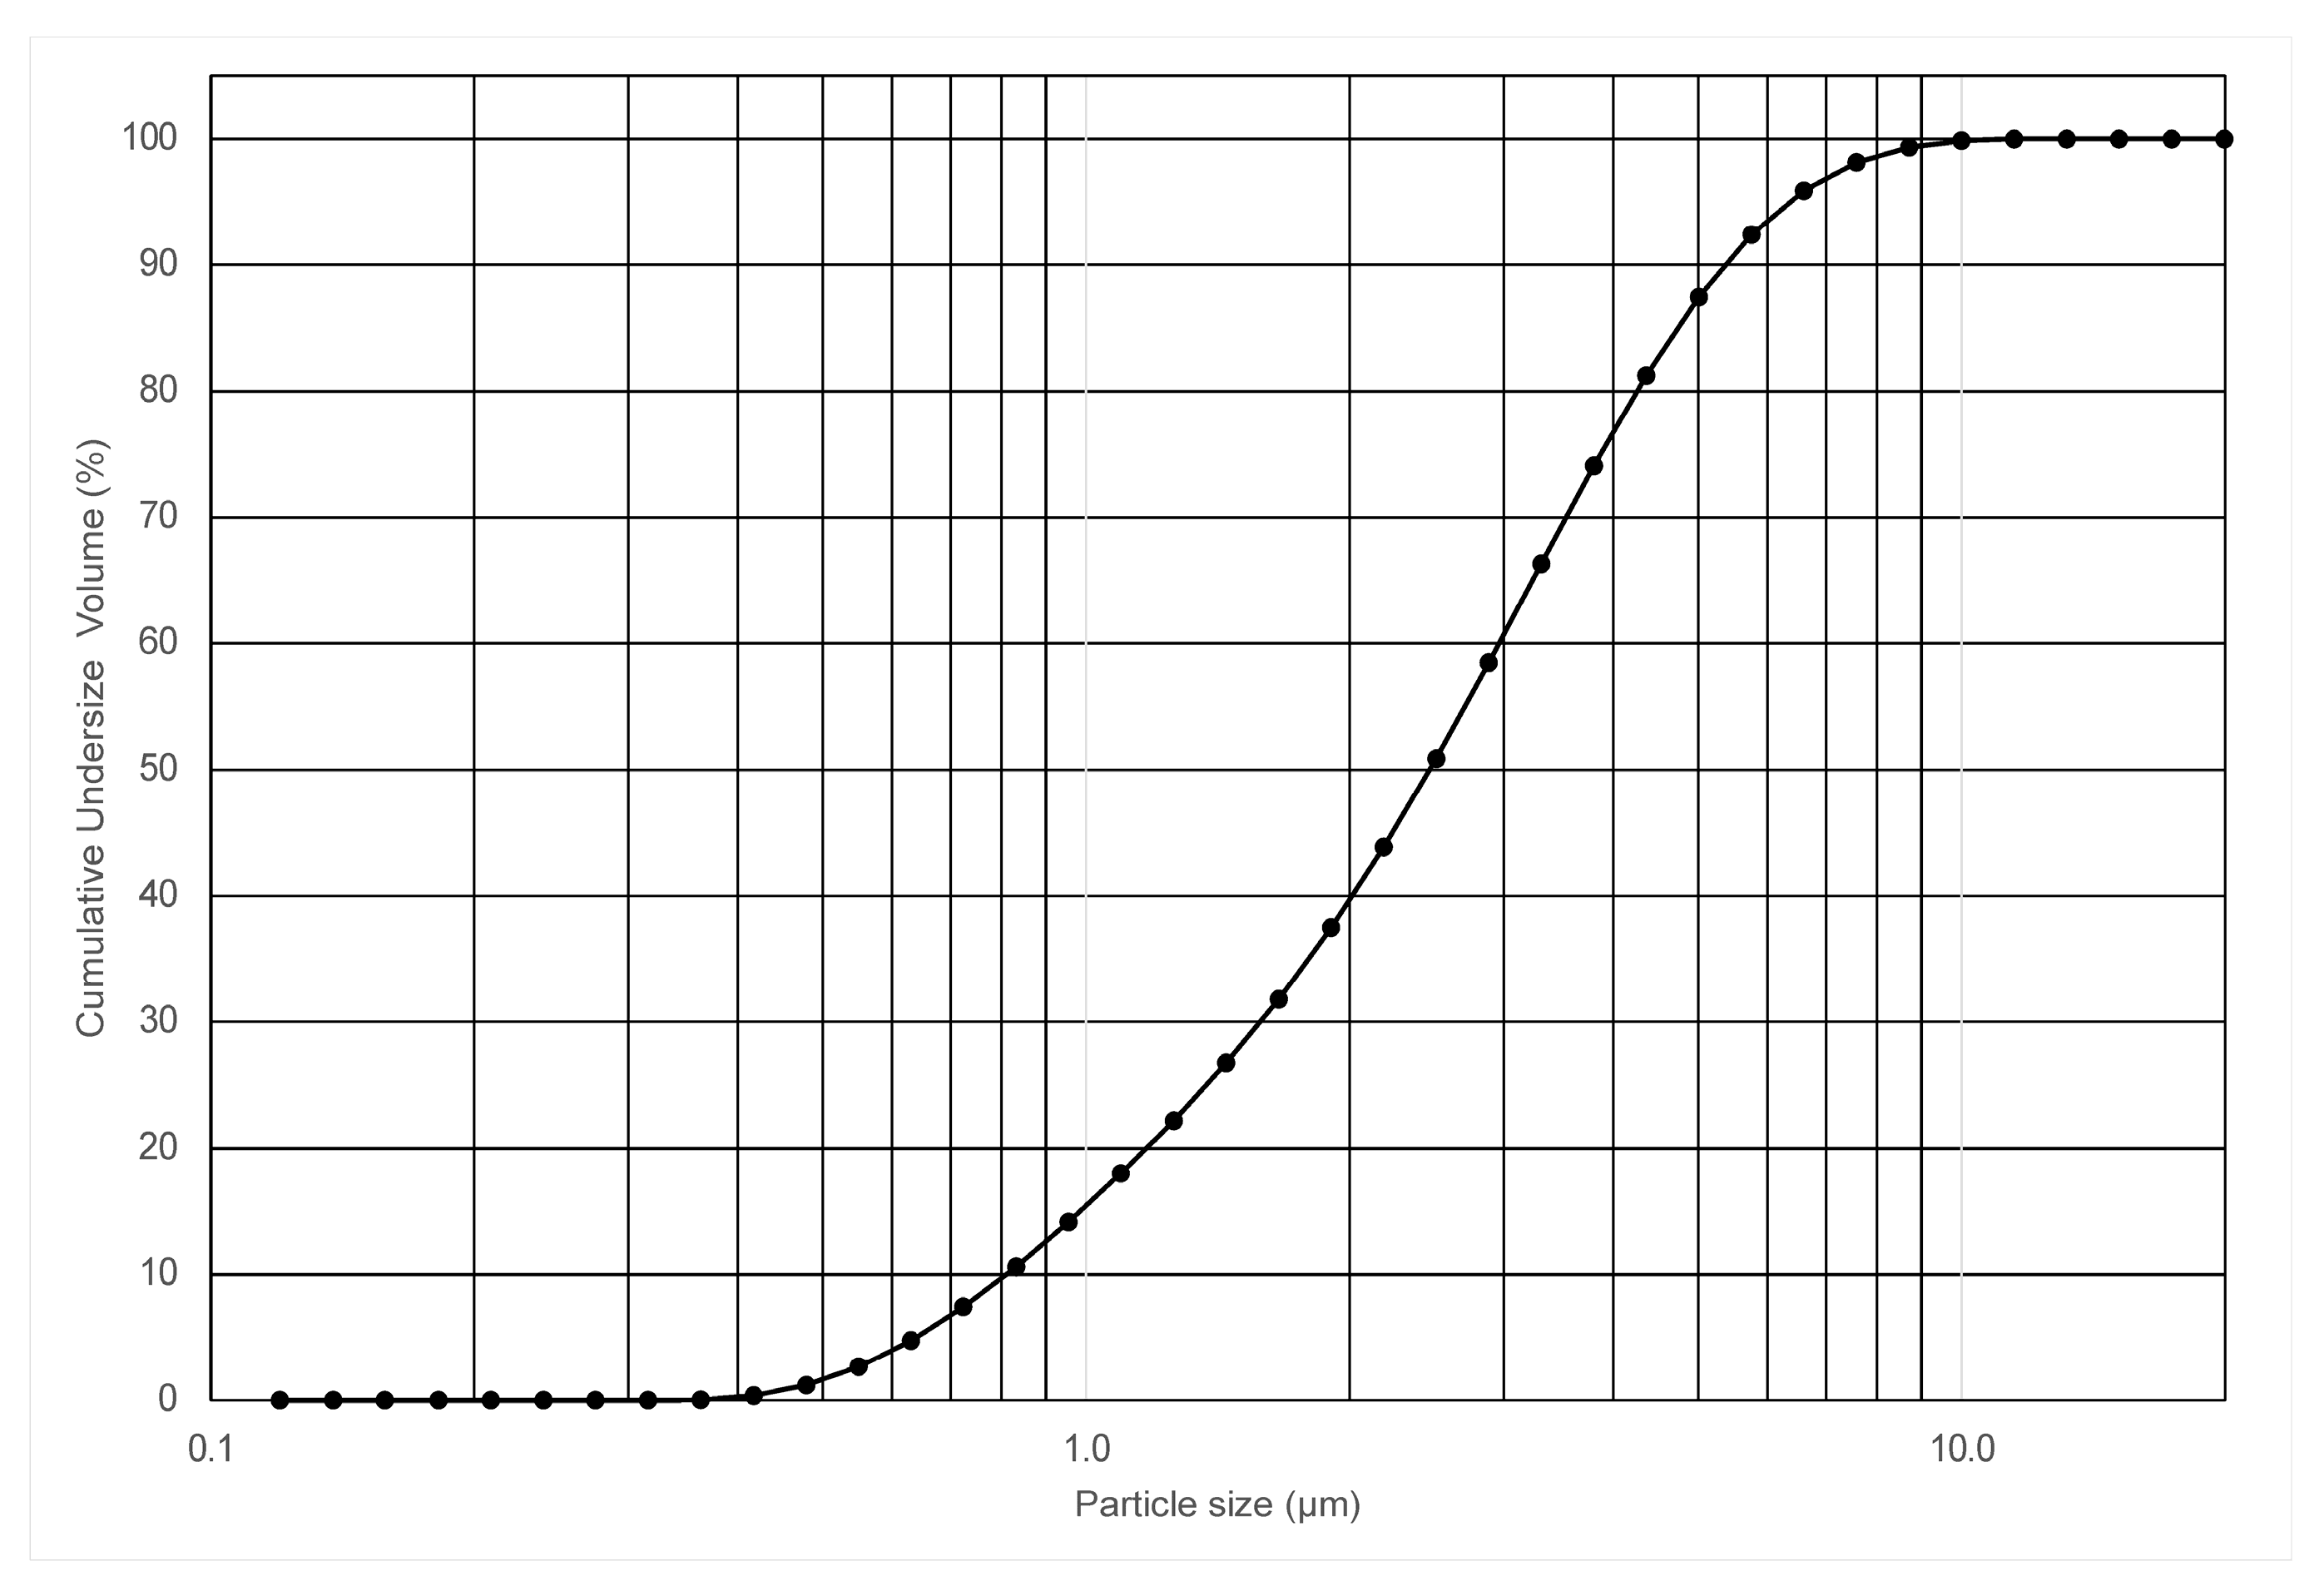
The particle size distribution of the calcite powder samples was analyzed using a laser particle size diffraction analyzer (Mastersizer 2000, Malvern Instruments Ltd., Worcestershirecity, UK).
The color parameters of the powder were determined using a color spectrophotometer (Elrepho, DataColor, Trenton, NJ, USA) as defined by the Commission Internationale de l’Eclairage (CIE). L* indicates whiteness, a* indicates the red/green coordinate, and b* indicates the yellow/blue coordinate [20]. Ry is the luminous reflectance factor, expressed as a % ratio, and is primarily used for white or neutral colors as an overall indicator of reflectance. Ry is equivalent to Y Brightness [21].
Brunauer–Emmett–Teller (BET) measurements were used to assess the precise surface area of the CaCO3 powder sample using the gas (nitrogen) adsorption method and a surface area analyzer (Quadrasorb-Evo, Quantachrome, Boynton Beach, FL, USA).
For the dry surface treatment of CaCO3, a high-speed mixer designed for laboratory use (MTI Mischtechnik, Zeppelin Systems GmbH, Detmold, Germany) was employed. CaCO3 was initially agitated at 2000 rpm in the mixer until the friction caused the temperature to increase to 70 °C. Subsequently, stearic acid was added, and the mixture was agitated at 2000 rpm for 5 min. The temperature inside the mixer reached approximately 90 °C. The coated CaCO3 was then left in the mixer and cooled to room temperature before its removal.
The vertical orientation of the alkyl chains of the SA molecules on the CaCO3 surface ensures that the alkyl chains are positioned close to the CaCO3 surface, forming a monolayer and a stable coating. This is possible by coating with an optimum amount of SA. Coating with less than the optimum amount of stearic acid leaves uncoated areas on the CaCO3 surface, whereas coating with more stearic acid causes the alkyl chains to align parallel to the CaCO3 surface and form a bilayer. In this study, we attempted to estimate the optimum amount of SA that could be adsorbed on the calcite surface. The calculated value is an estimate that approaches the actual optimal value. The following equation was used to determine the optimum amount of stearic acid [4,12]:
Γ = S A σ ×   N A
where Γ is the amount of SA that can be adsorbed as a monolayer on the CaCO3 surface (μmolg−1), σ is the surface area per SA molecule (nm2), SA is the specific surface area of CaCO3 (m2g/1), and NA is the Avogadro constant. The specific surface area of the uncoated calcite powder was measured as 5.28 m2/g. The molecular weight of SA (Mw) was used to calculate the optimum coating amount of stearic acid by weight % as follows:
Γ = 100 × ( S A × M w σ × N A )
The surface area per SA molecule was assumed to be 2.80 nm2 for the dry coating of the CaCO3 surface [22]. As a result of this assumption, the optimum SA coating amount was calculated as 1% by weight. CaCO
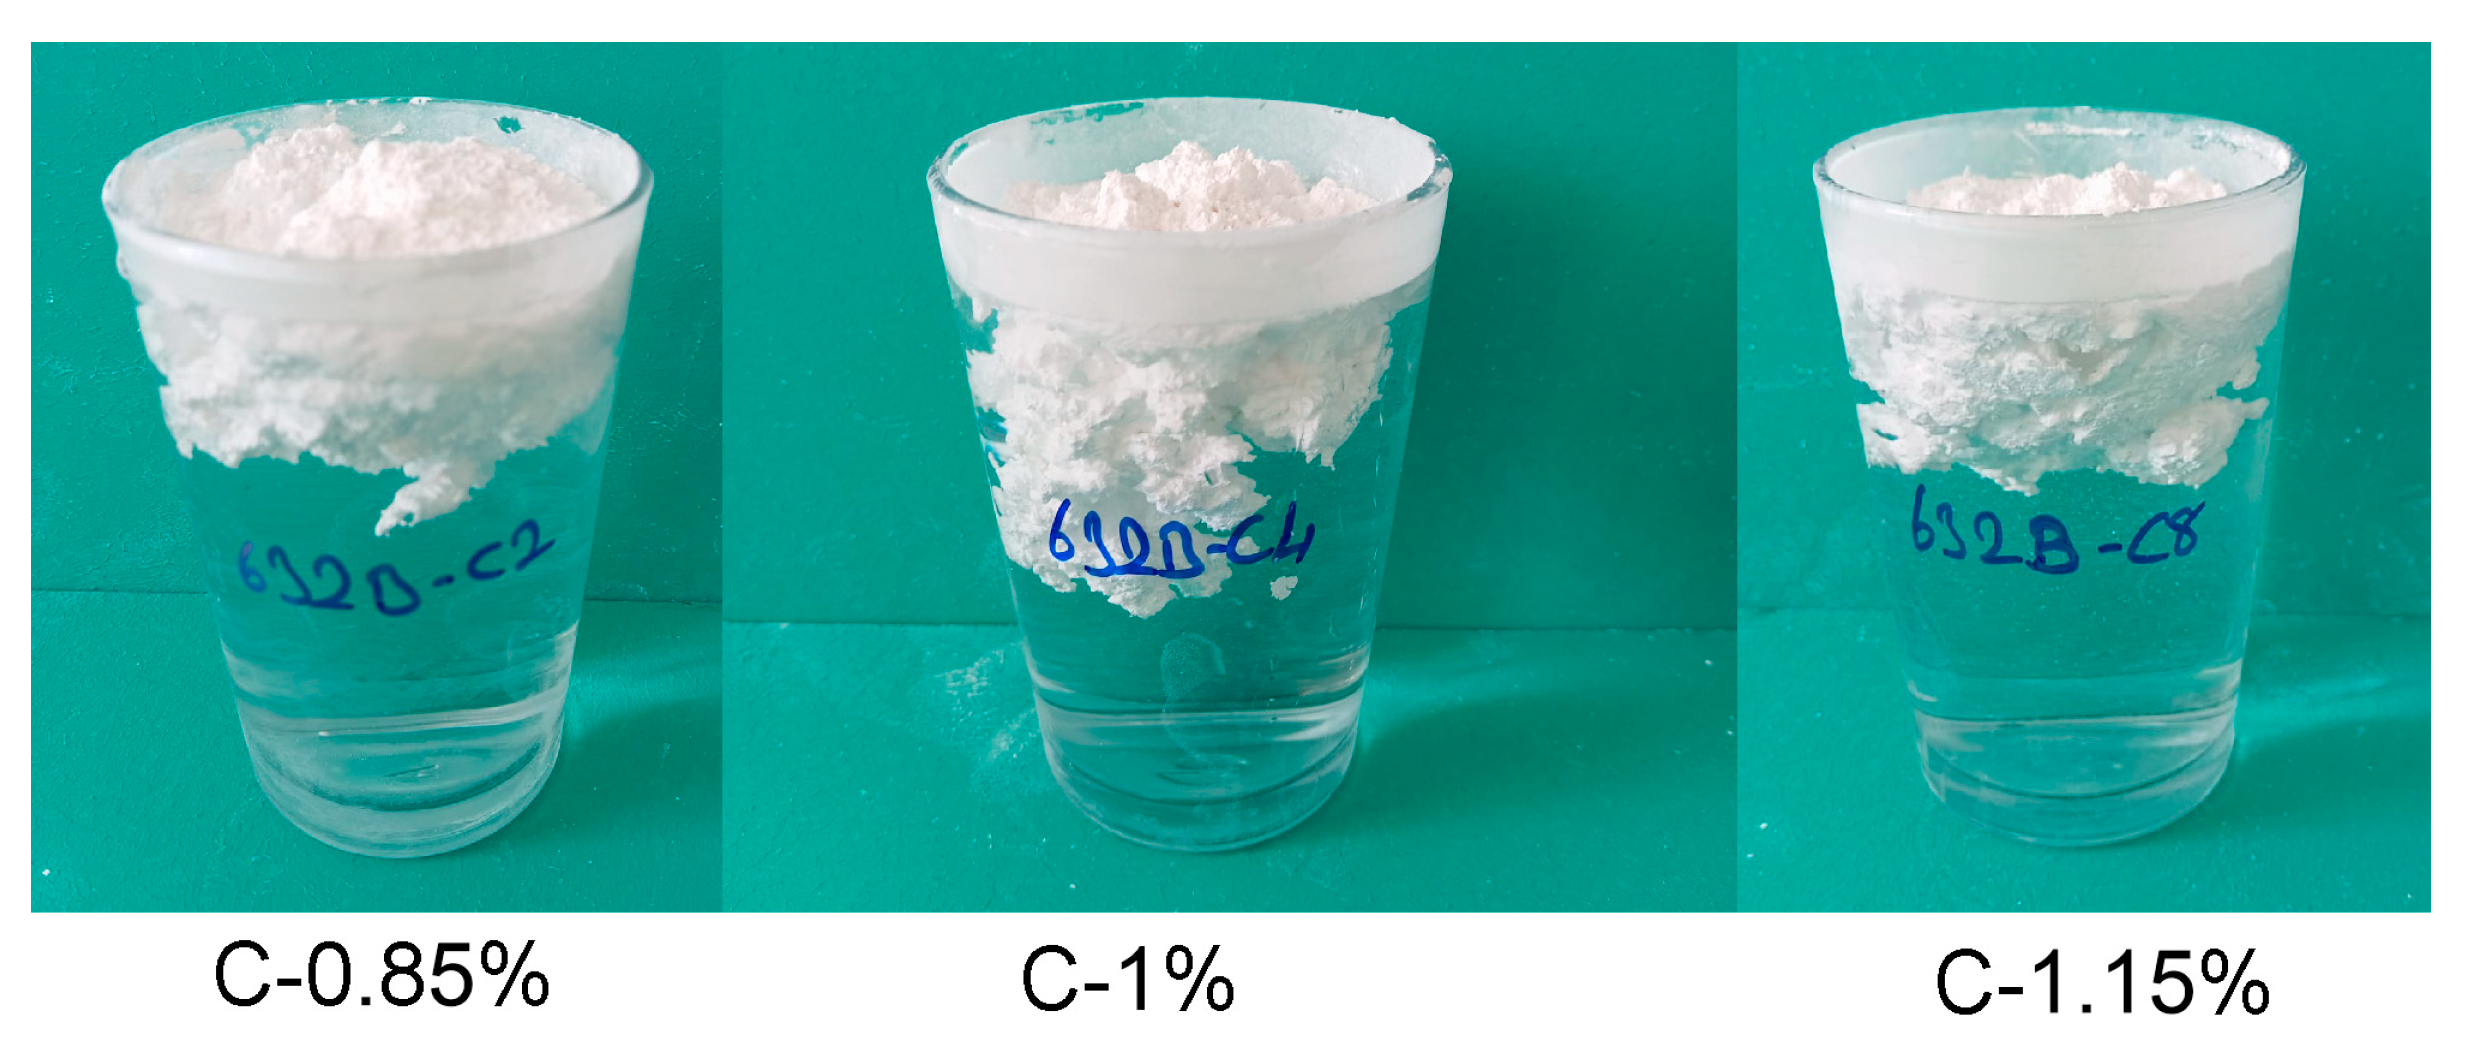
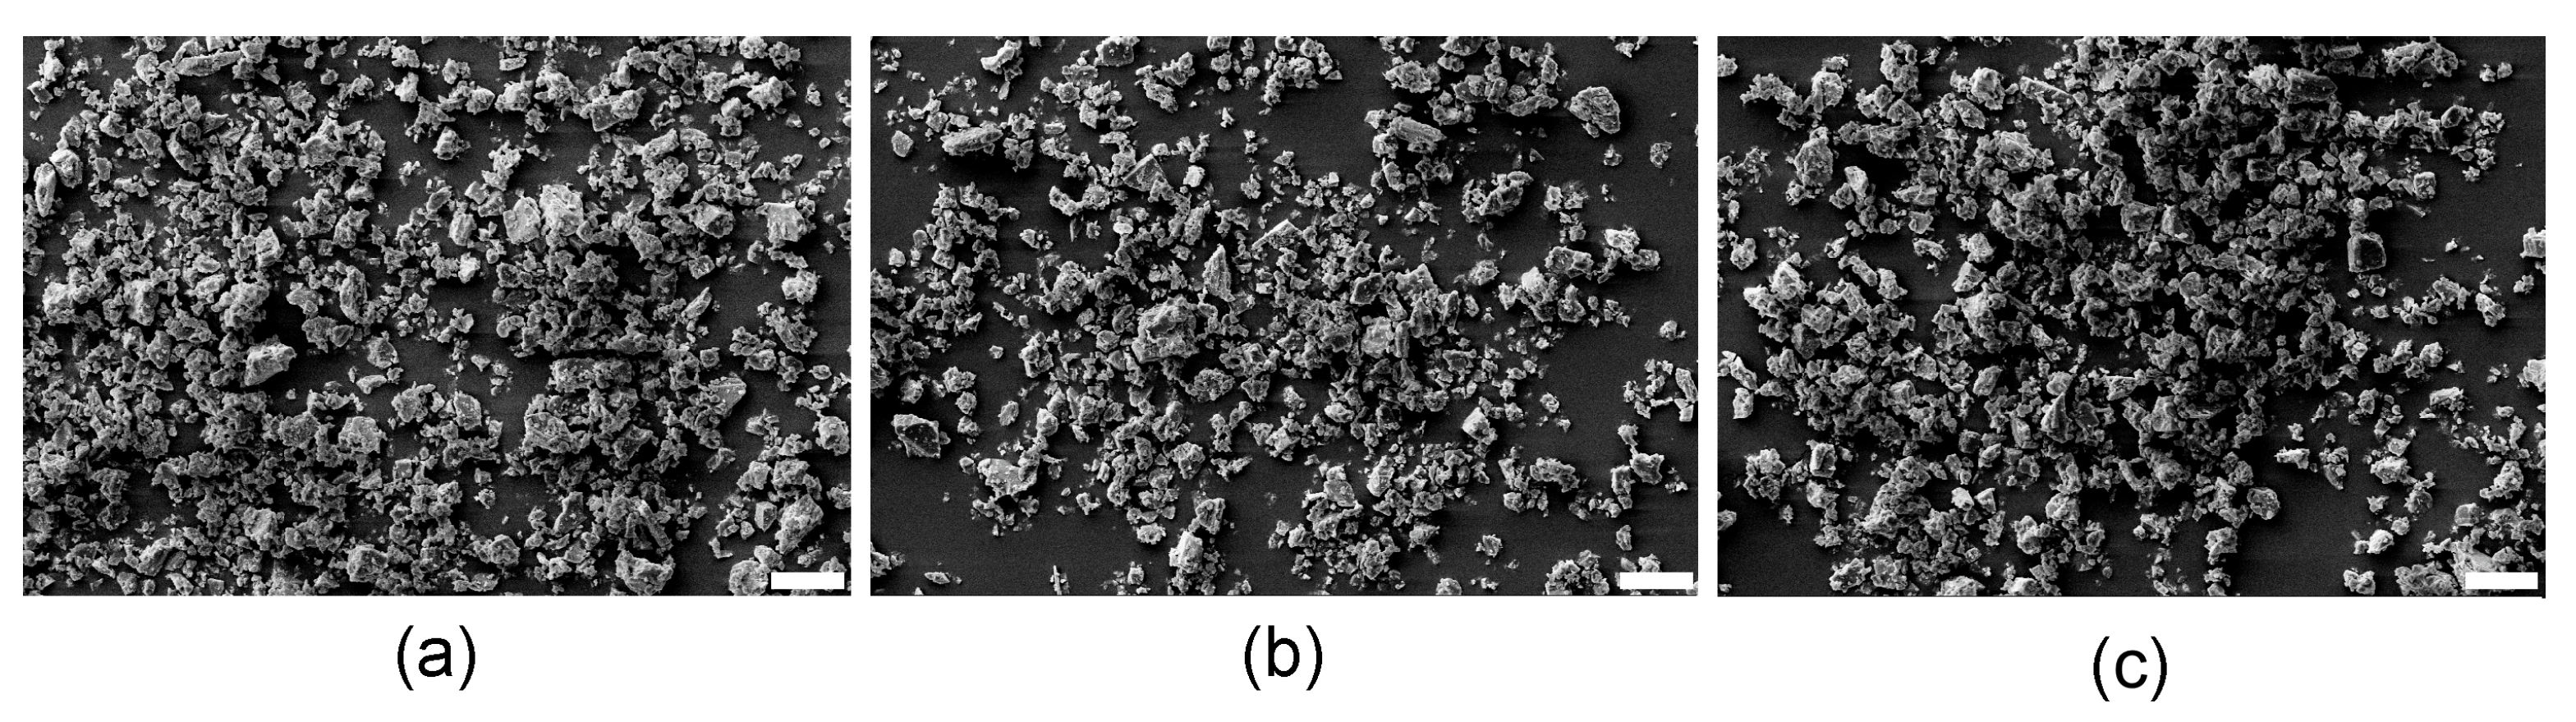
3 powders were coated with SA at an optimal concentration of 1% by weight, as well as at concentrations 15% lower (0.85% by weight) and 15% higher (1.15% by weight) than the optimal level. The uncoated calcite powder was designated as “UC”, whereas the coated calcite powder samples were designated as “C-0.85%”, “C-1%”, and “C-1.15%” to denote the respective coating ratios.
A floating test, as described by Sheng et al. [23], was used to assess the impact of surface modification. This method involves calculating the proportion of the product that floats relative to the total sample weight after vigorous agitation in water. This proportion is referred to as the active ratio (AR).
Each coated powder sample (600 g) was placed in a polyethylene sample bag and stored in a closed container for 30 days at 20 °C and 10% relative humidity. The samples were placed side by side, and no load was applied during the 30-day waiting period to prevent crushing or attrition. The moisture content of the samples was determined using a halogen moisture analyzer (MB45, OHAUS Europe GmbH, Uster, Switzerland).
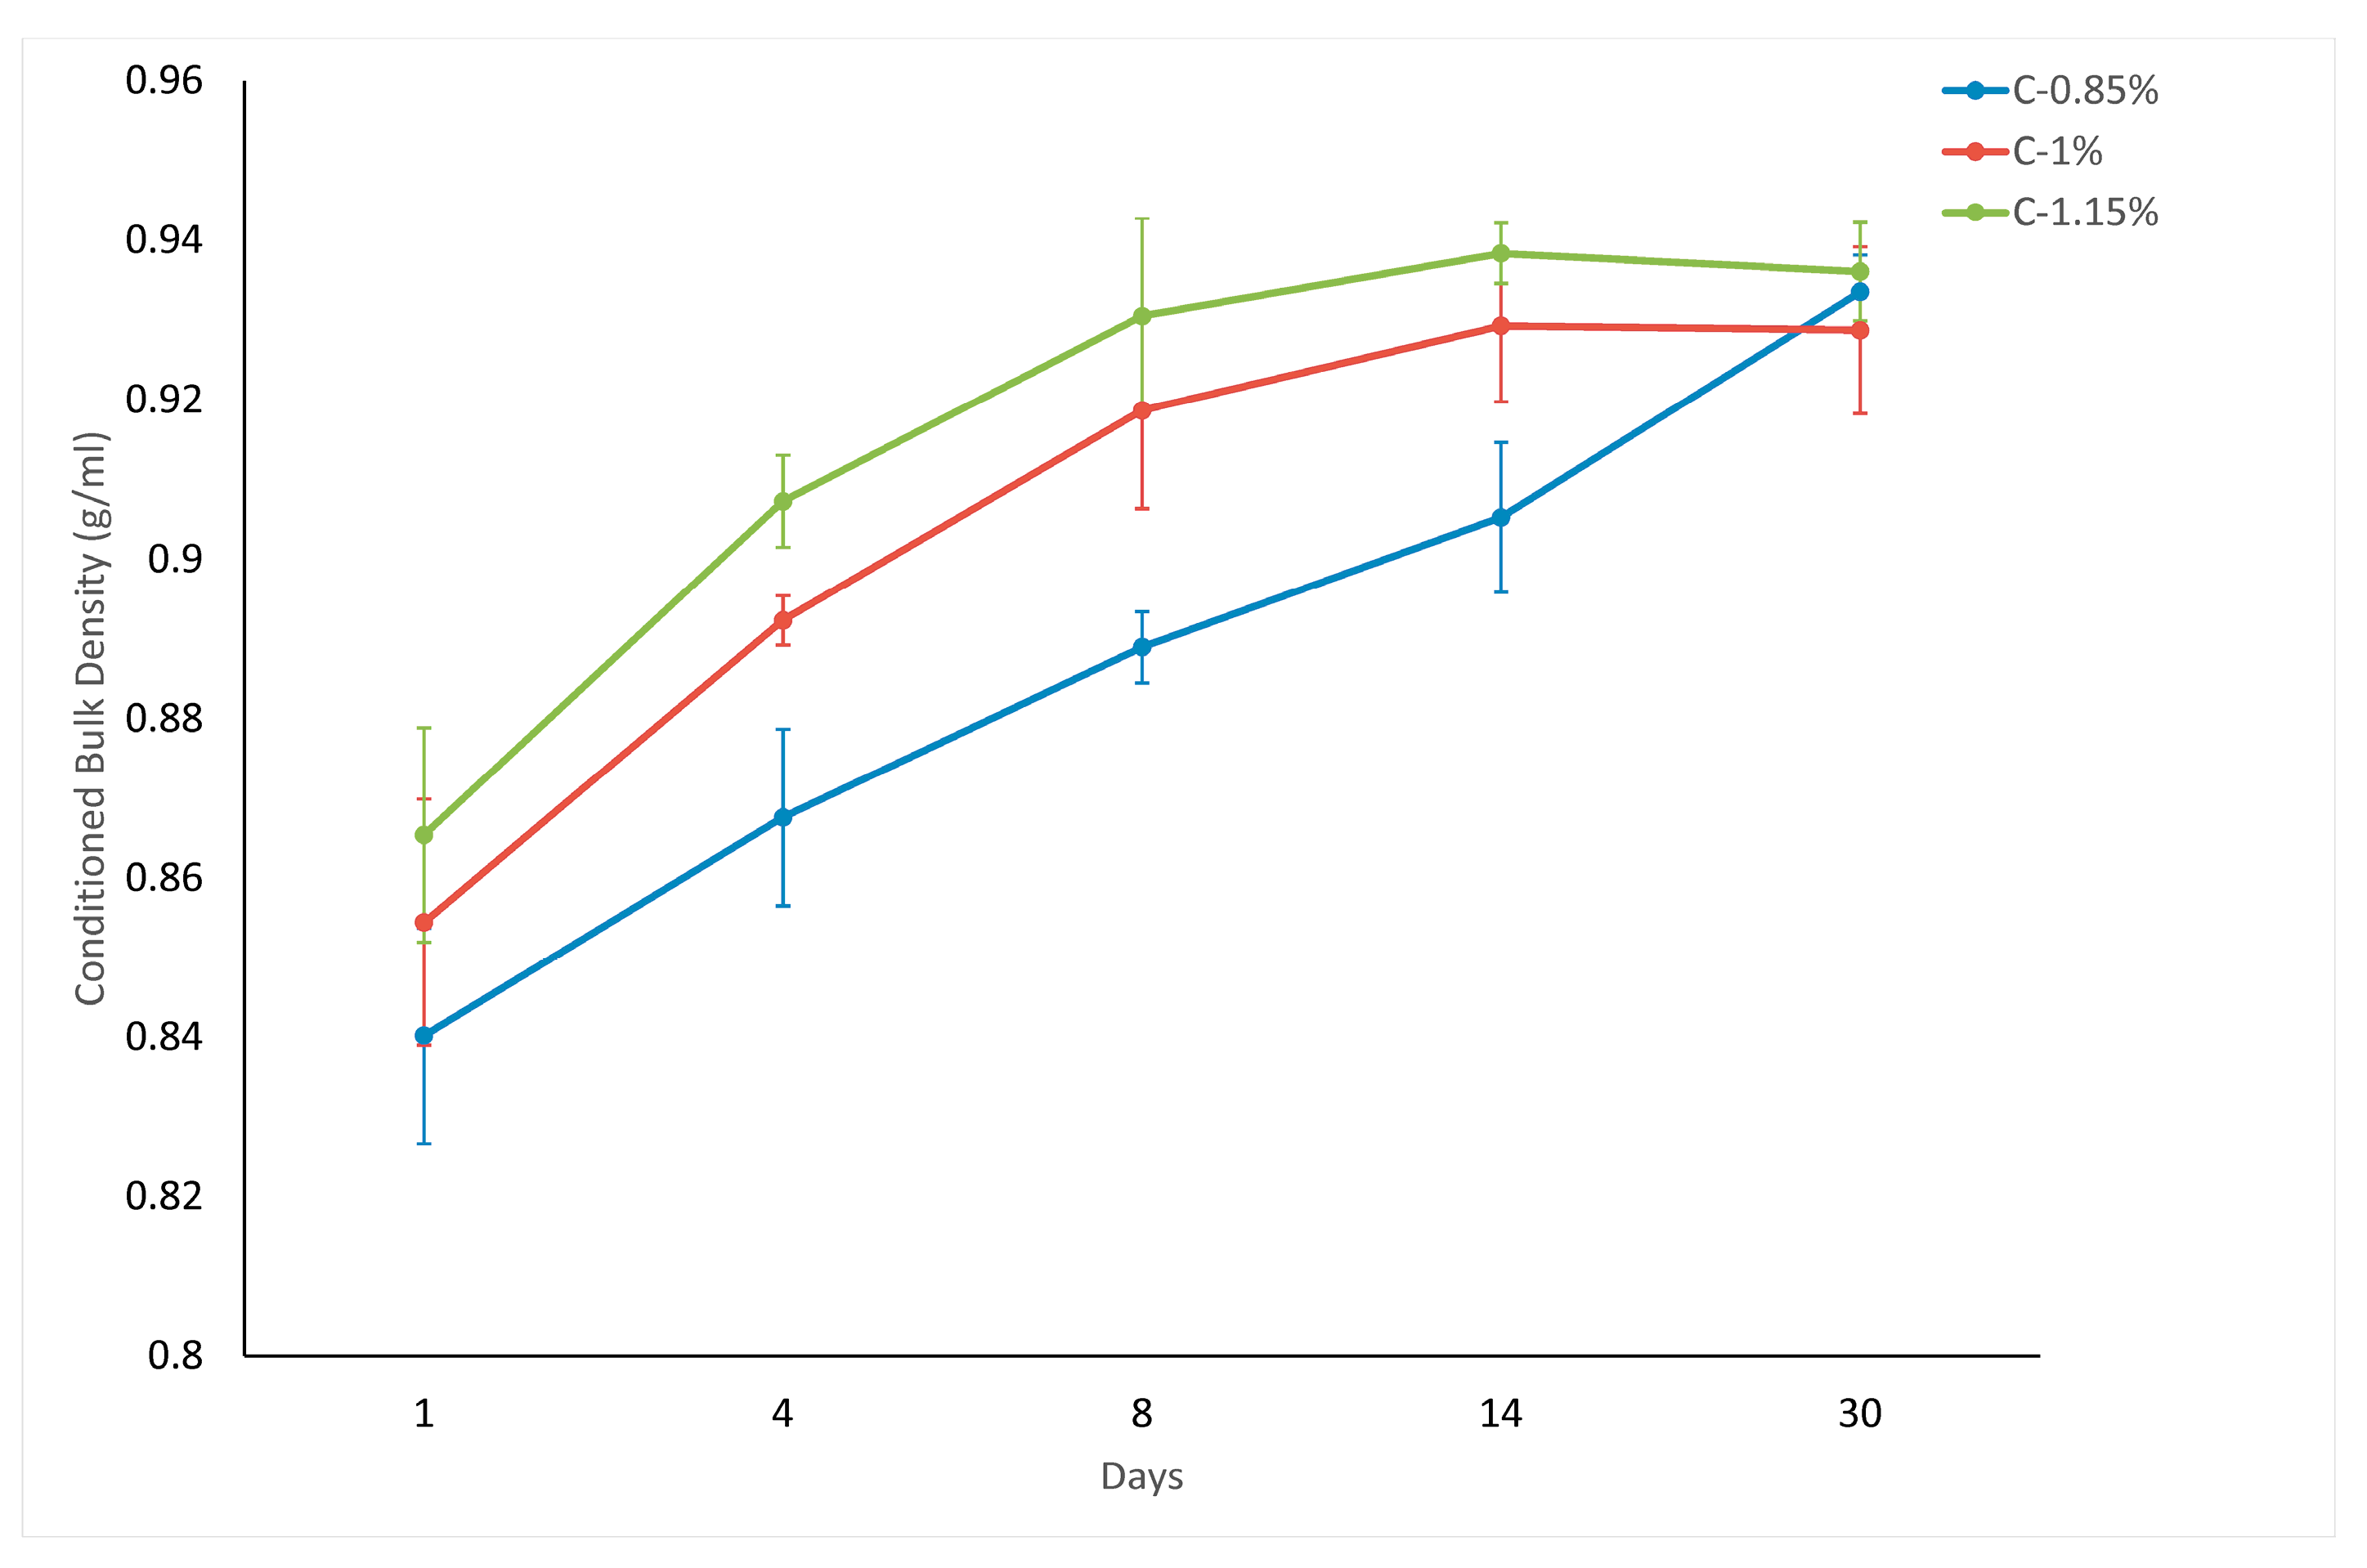
The mass of the powder divided by its volume is known as the bulk density. This characteristic varies depending on the consolidation state of the powder, resulting in significant differences between the aerated and tapped density values [24]. The bulk volume variation during tapping was measured using a tap density meter (Autotap, Quantachrome, Boynton Beach, FL, USA). The fluidization behavior of fine powders can be effectively assessed using the Hausner Ratio (HR) [25,26]. This ratio reflects the particle–particle friction in a moving mass of powder rather than in a static state [
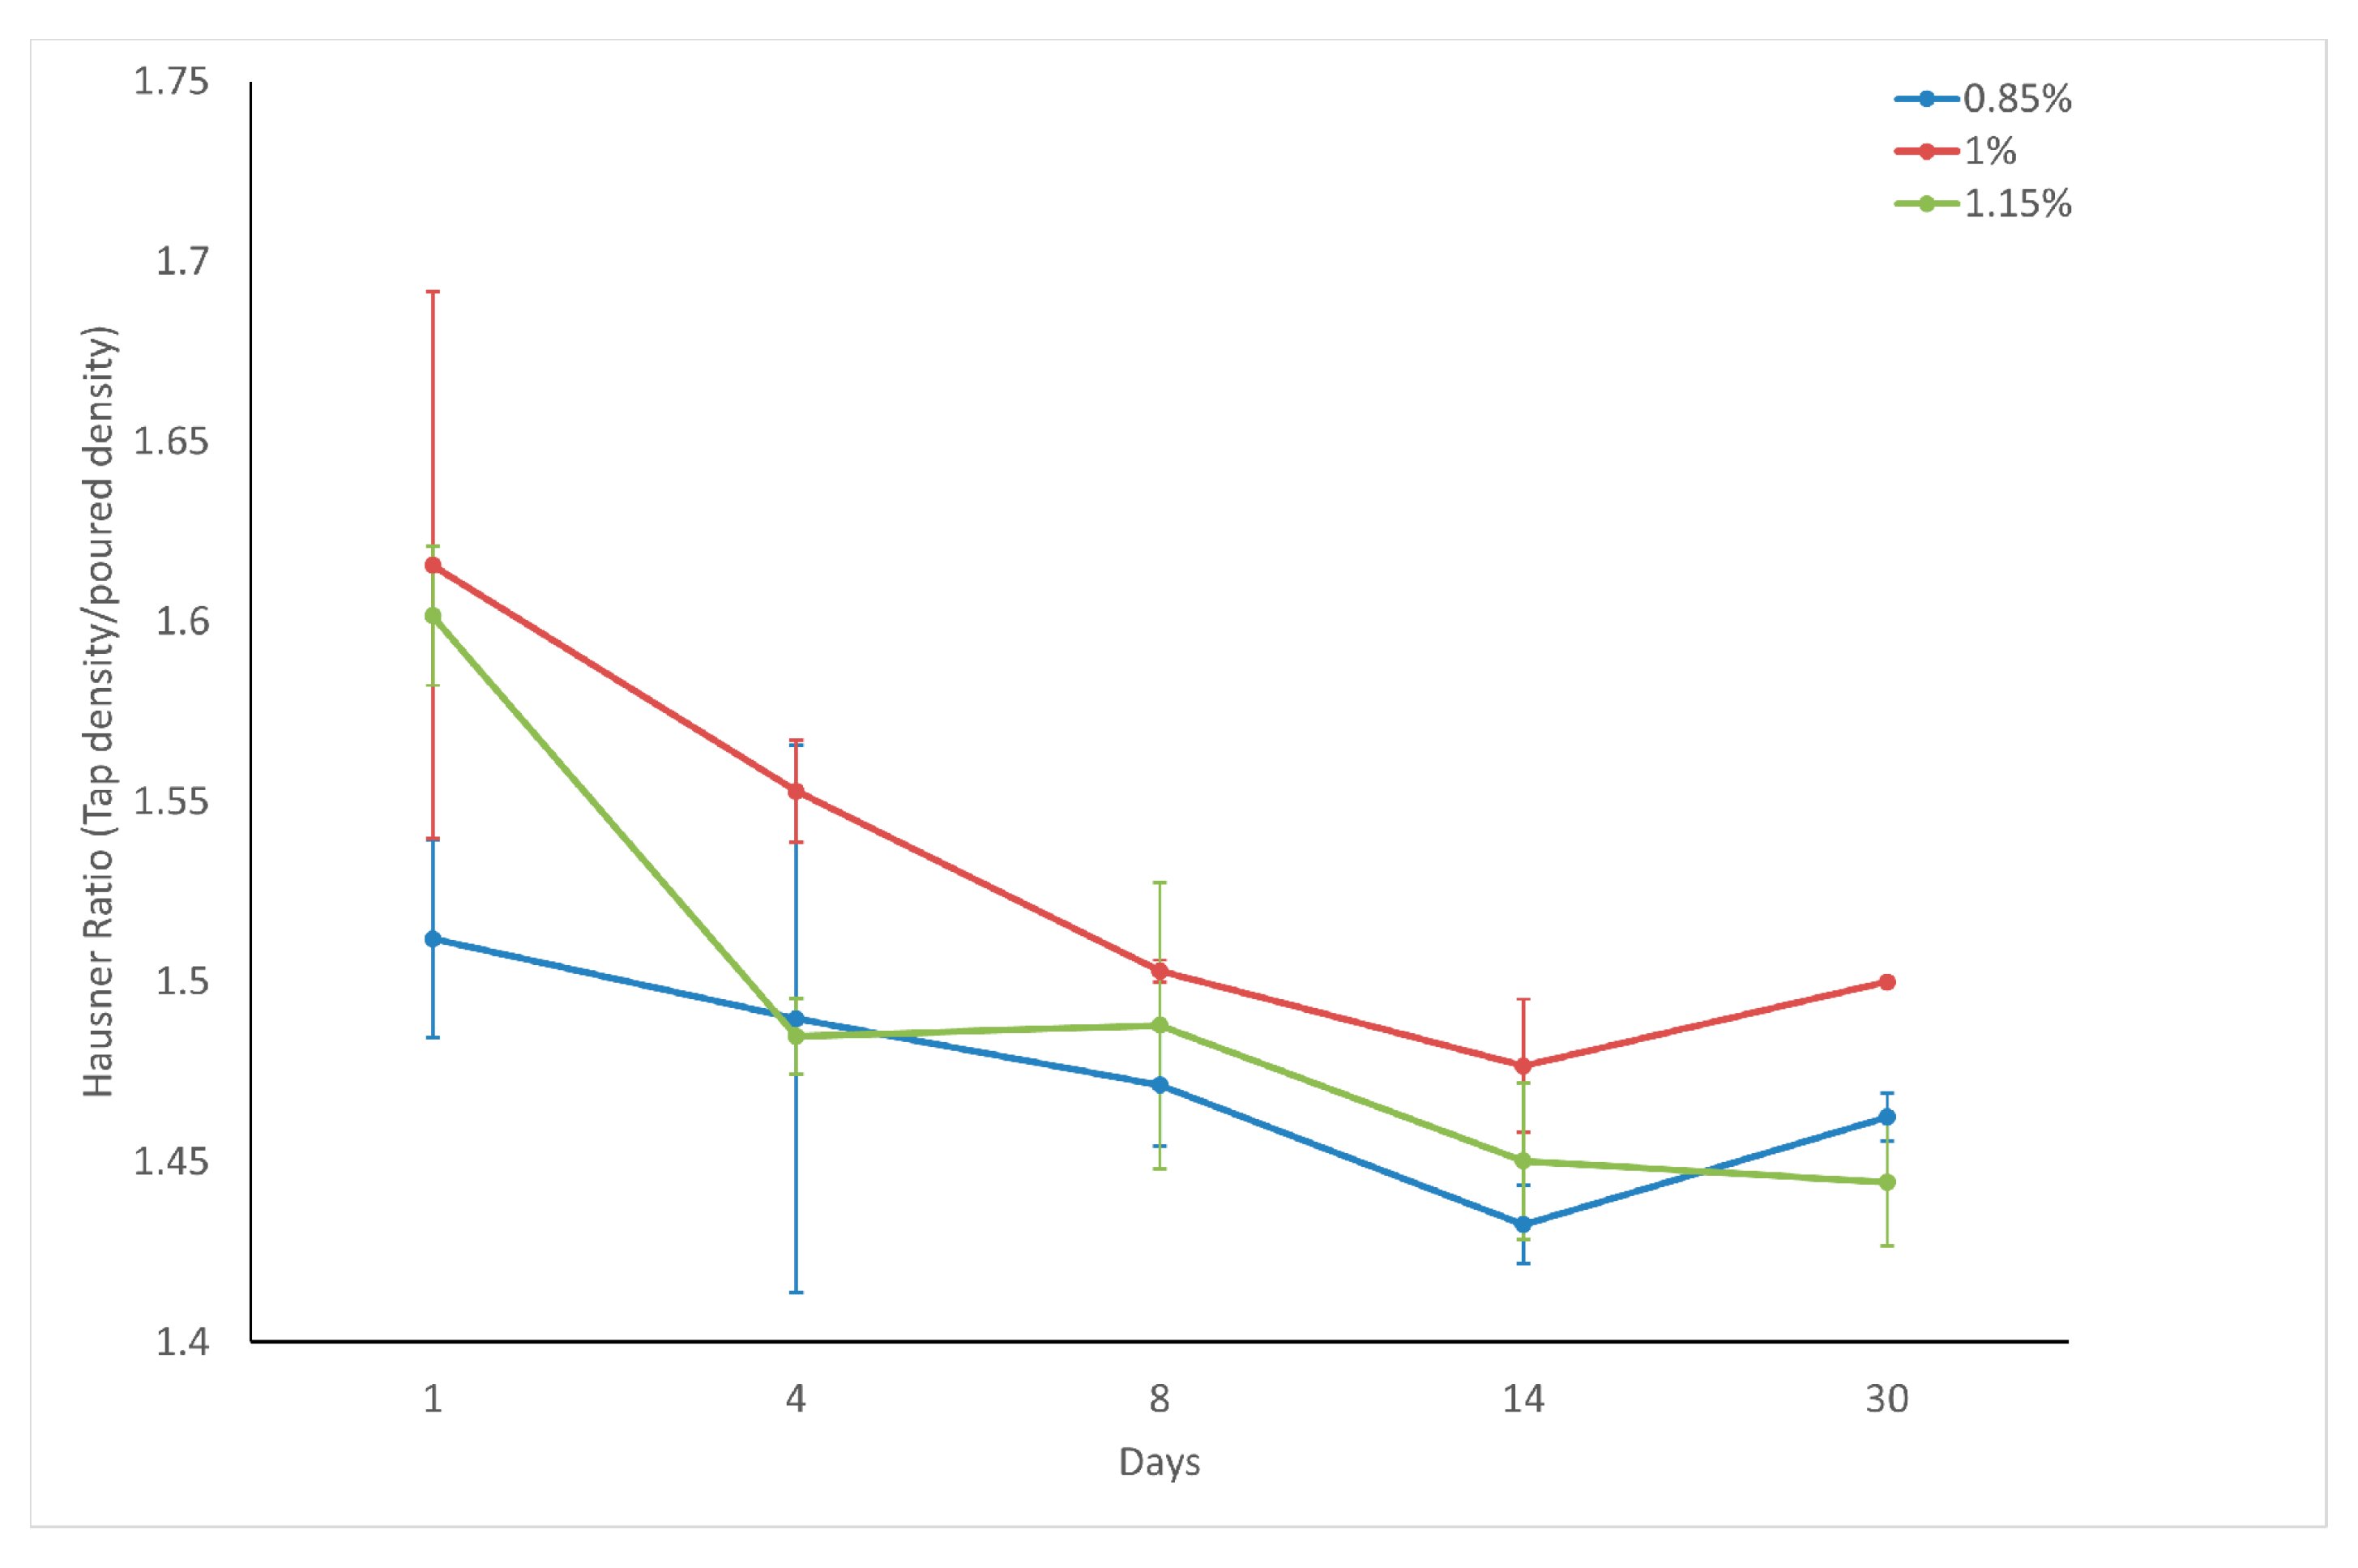
24]. This ratio was calculated by dividing the tapped density by the poured (aerated) density, providing valuable insights into the powder characteristics. The classification of powders based on their HR values is as follows: those with HR values exceeding 1.4 are considered non-flowing or cohesive; powders with HR values ranging from 1.25 to 1.4 are categorized as fairly free-flowing; and those with HR values between 1 and 1.25 are deemed free-flowing [26].
A powder rheometer (FT4, Freeman Technology Ltd., Tewkesbury, UK) was used to determine the powder rheology. The system employs dynamic measurement technology that simultaneously monitors axial and rotational forces while the blade penetrates the powder bed at controlled velocities (maximum 30 mm/s). The modular design allows interchangeable tooling (blades, shear heads and pistons) for different test protocols, with real-time measurement of normal and shear stresses under user-defined control modes (velocity, force, or torque) [15]. In total, 25 mL of powdered samples was tested in a 25 mm bore borosilicate glass vessel using 23.5 mm diameter twisted blade. The instrument’s ‘conditioning’ method was used to prepare the samples. This process involves a gentle blade movement that disrupts the powder bed, resulting in a uniformly and lightly compacted test sample that can be consistently replicated. All rheological parameter measurements were performed in triplicate (n = 3), and mean values with standard deviations were reported. The error bars in the respective figures represent the standard deviation of the repeated measurements.
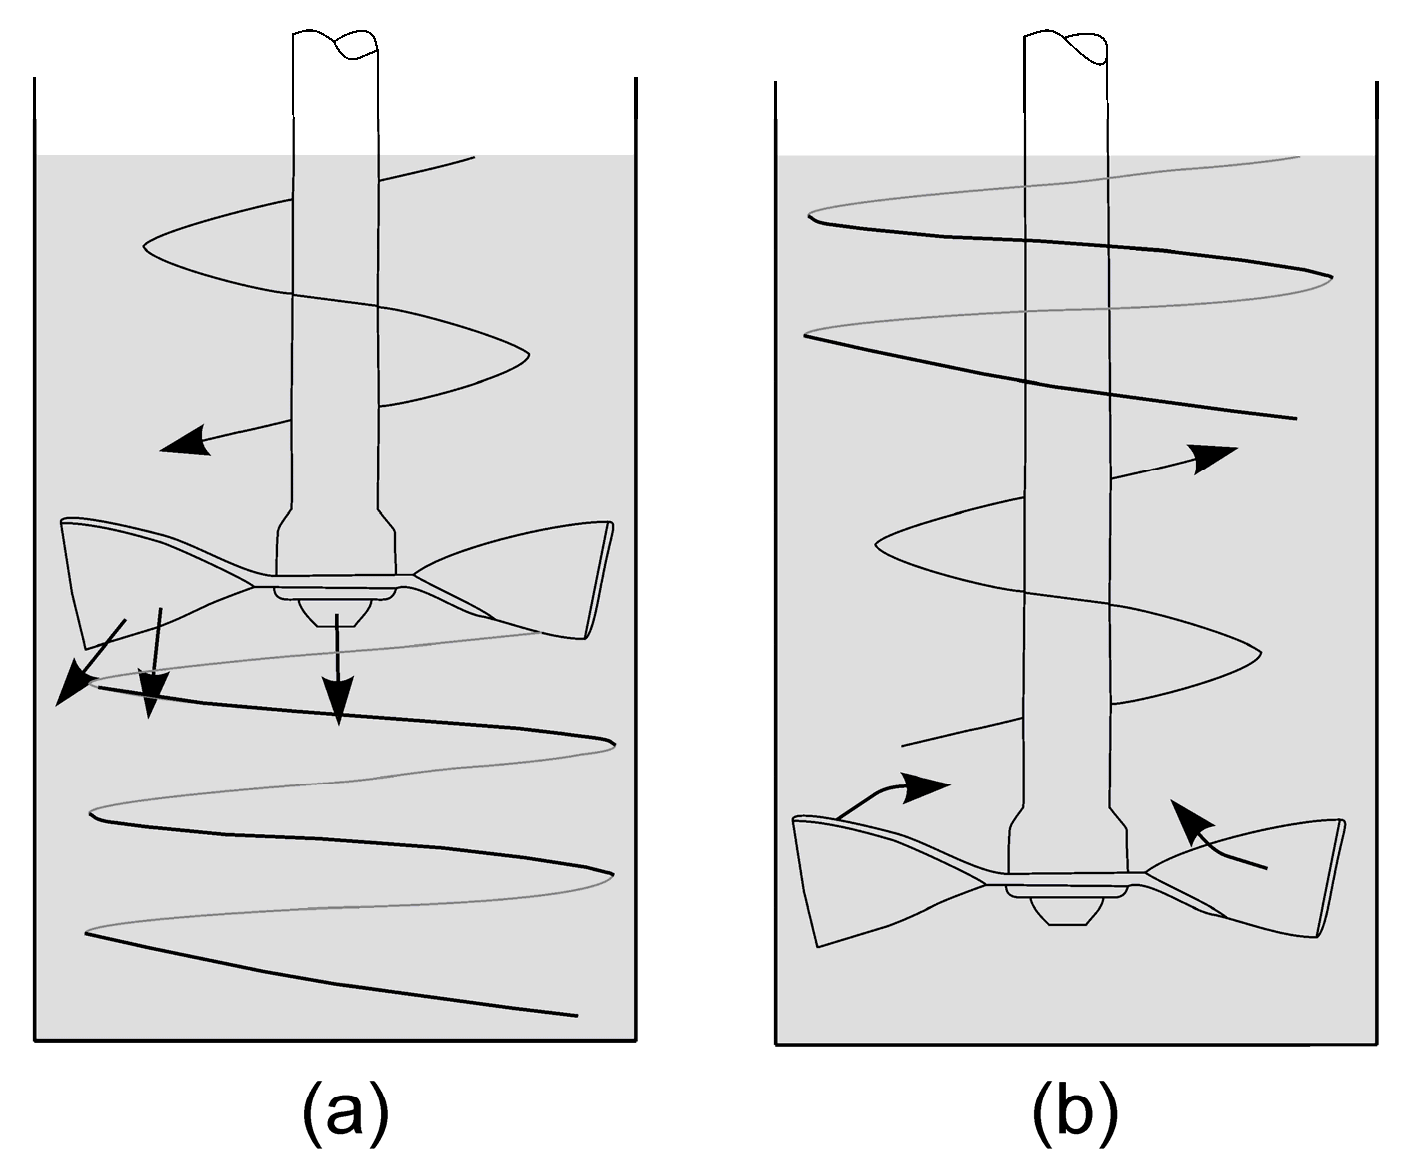
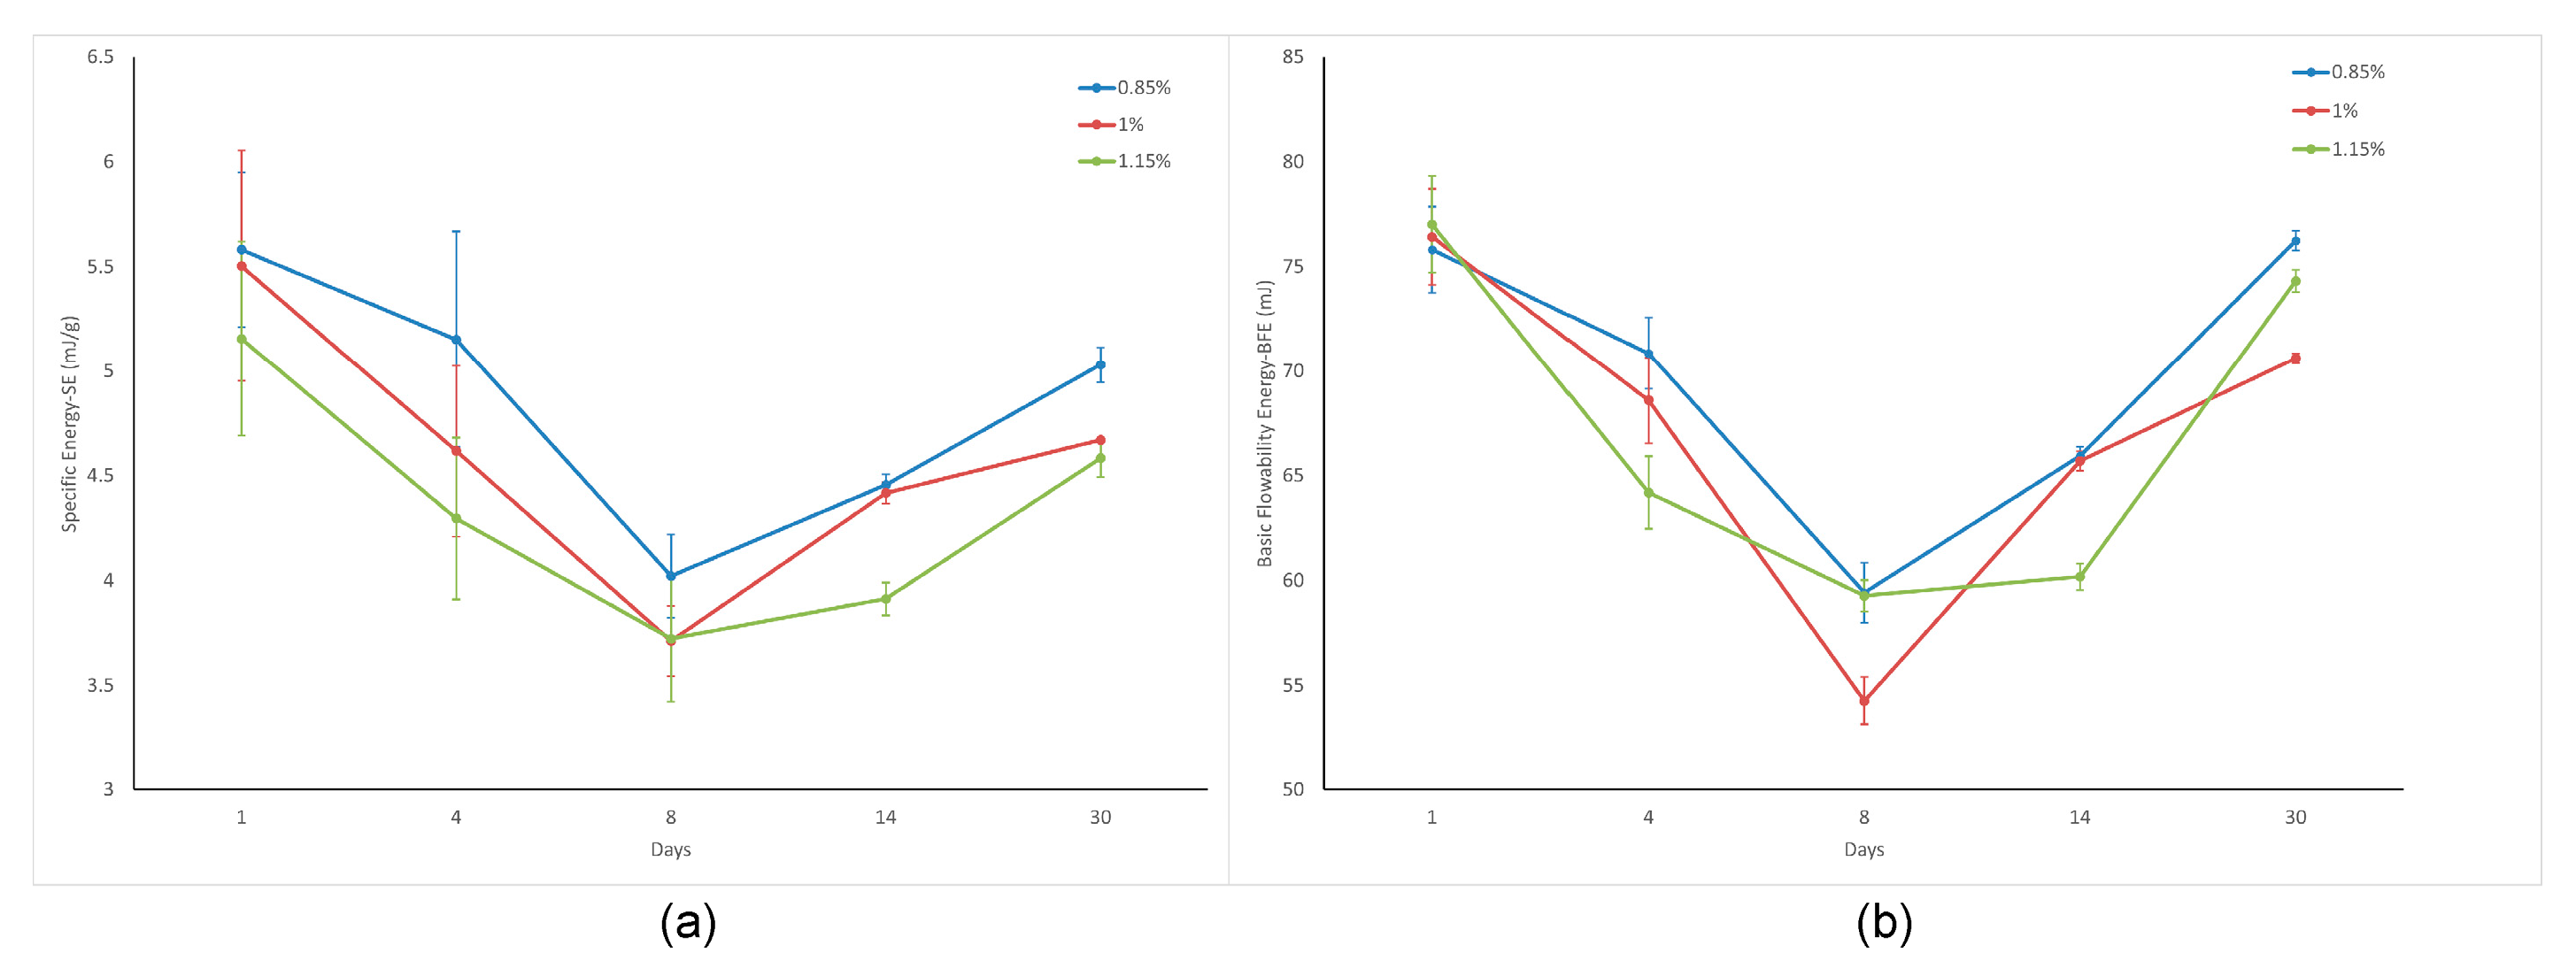
The Basic Flowability Energy (BFE) measures the amount of energy required to create a particular flow pattern in a conditioned, precise volume of powder. This pattern involved the blade moving downward in a counterclockwise direction, resulting in a compressive flow mode that subjected the powder to a relatively high stress (Figure 2a). The BFE indicates the extent to which a powder resists downward flow. BFE measurements are highly differentiating and are a good indicator of how the powder will flow under ‘forced’ conditions, such as when it is distributed in a feeder or extruded [19,27].
The Specific Energy (SE) represents the energy of the flow measured as the blade moves upward through a prepared, unconfined sample (Figure 2b). Owing to the unconfined nature of the powder, the measured energies were primarily influenced by interparticle friction and mechanical interlocking rather than by factors such as compressibility. The SE effectively indicates how the powder flows without applied stress, such as when it is poured from a container or flows into an empty die [19].
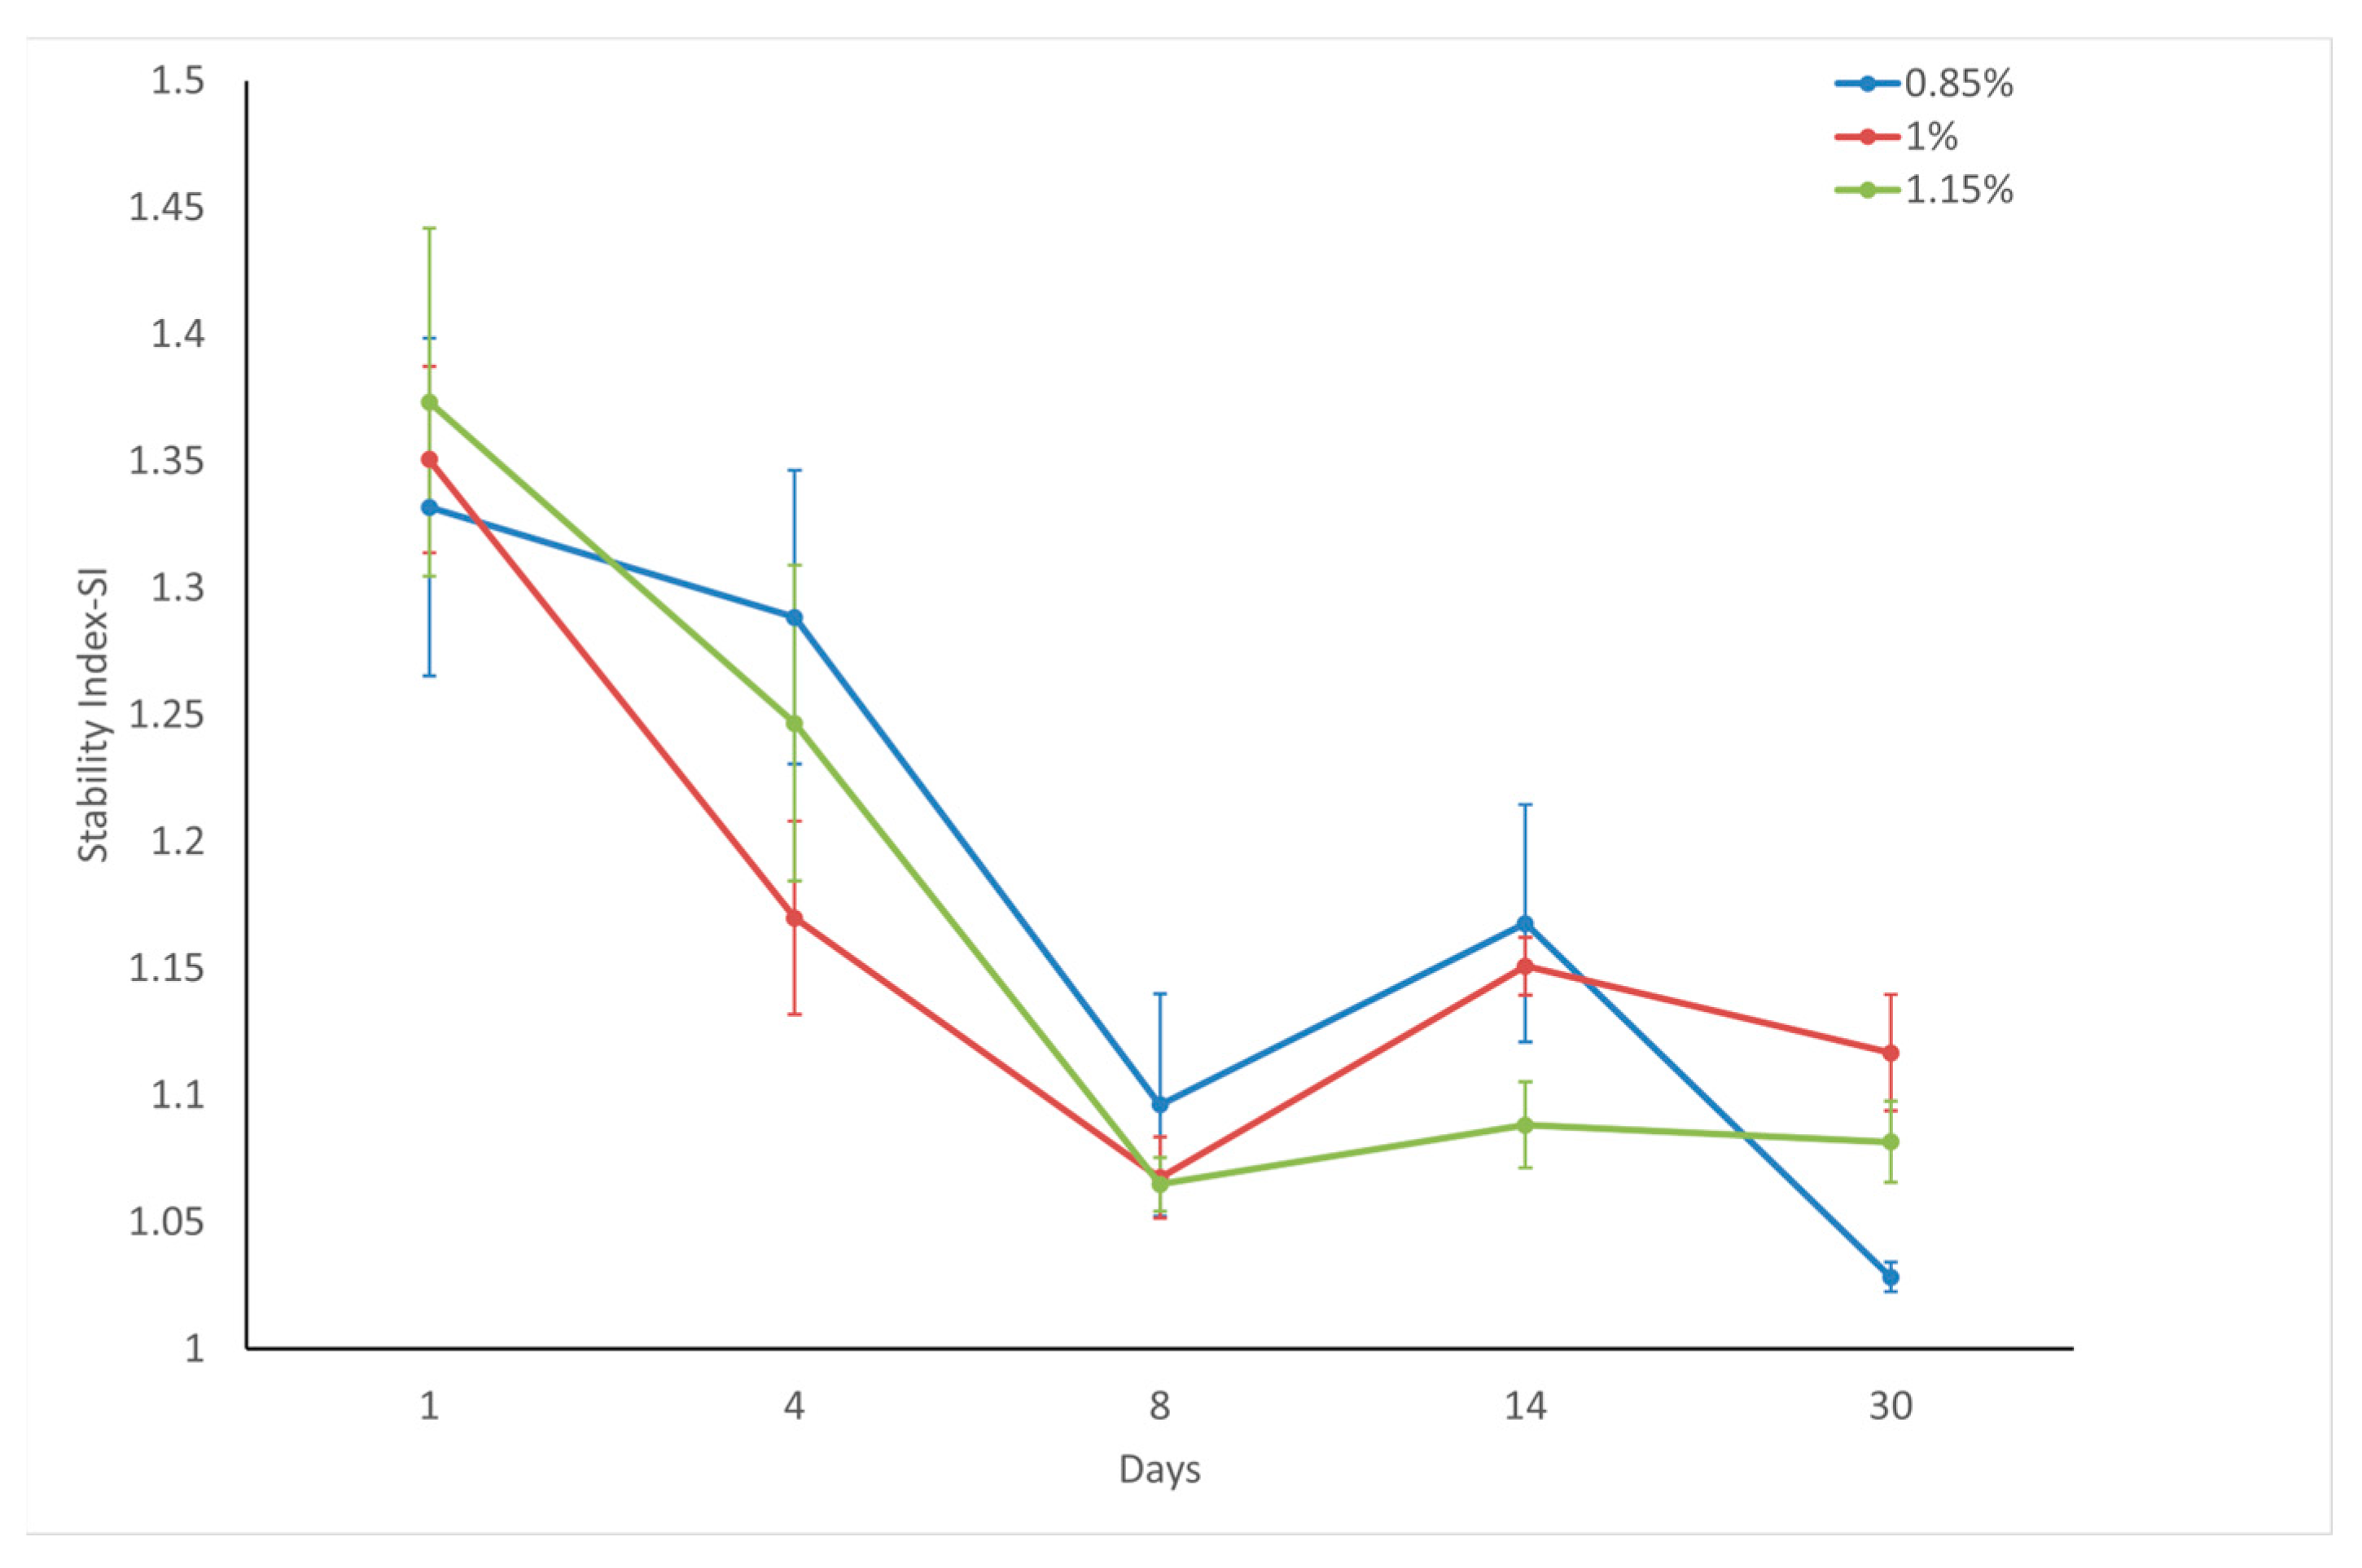
The stability index (SI) measures the consistency of the powder flow after repeated handling, with SI ≈ 1 indicating stability, SI > 1 suggesting increased resistance due to changes such as agglomeration, and SI < 1 indicating decreased resistance due to factors such as attrition or deagglomeration. External variables such as flow rate and air velocity were not considered in this study. Consequently, alterations in flow energy are directly linked to changes in the flow characteristics of the powders [29]. For the stability measurements, all test cycles were conducted at a blade tip speed of 100 mm/s, with the blades moving transversely down the vessel. The SI was calculated using the following equation:
S I = E n e r g y   a t   T e s t   7 E n e r g y   a t   T e s t   1
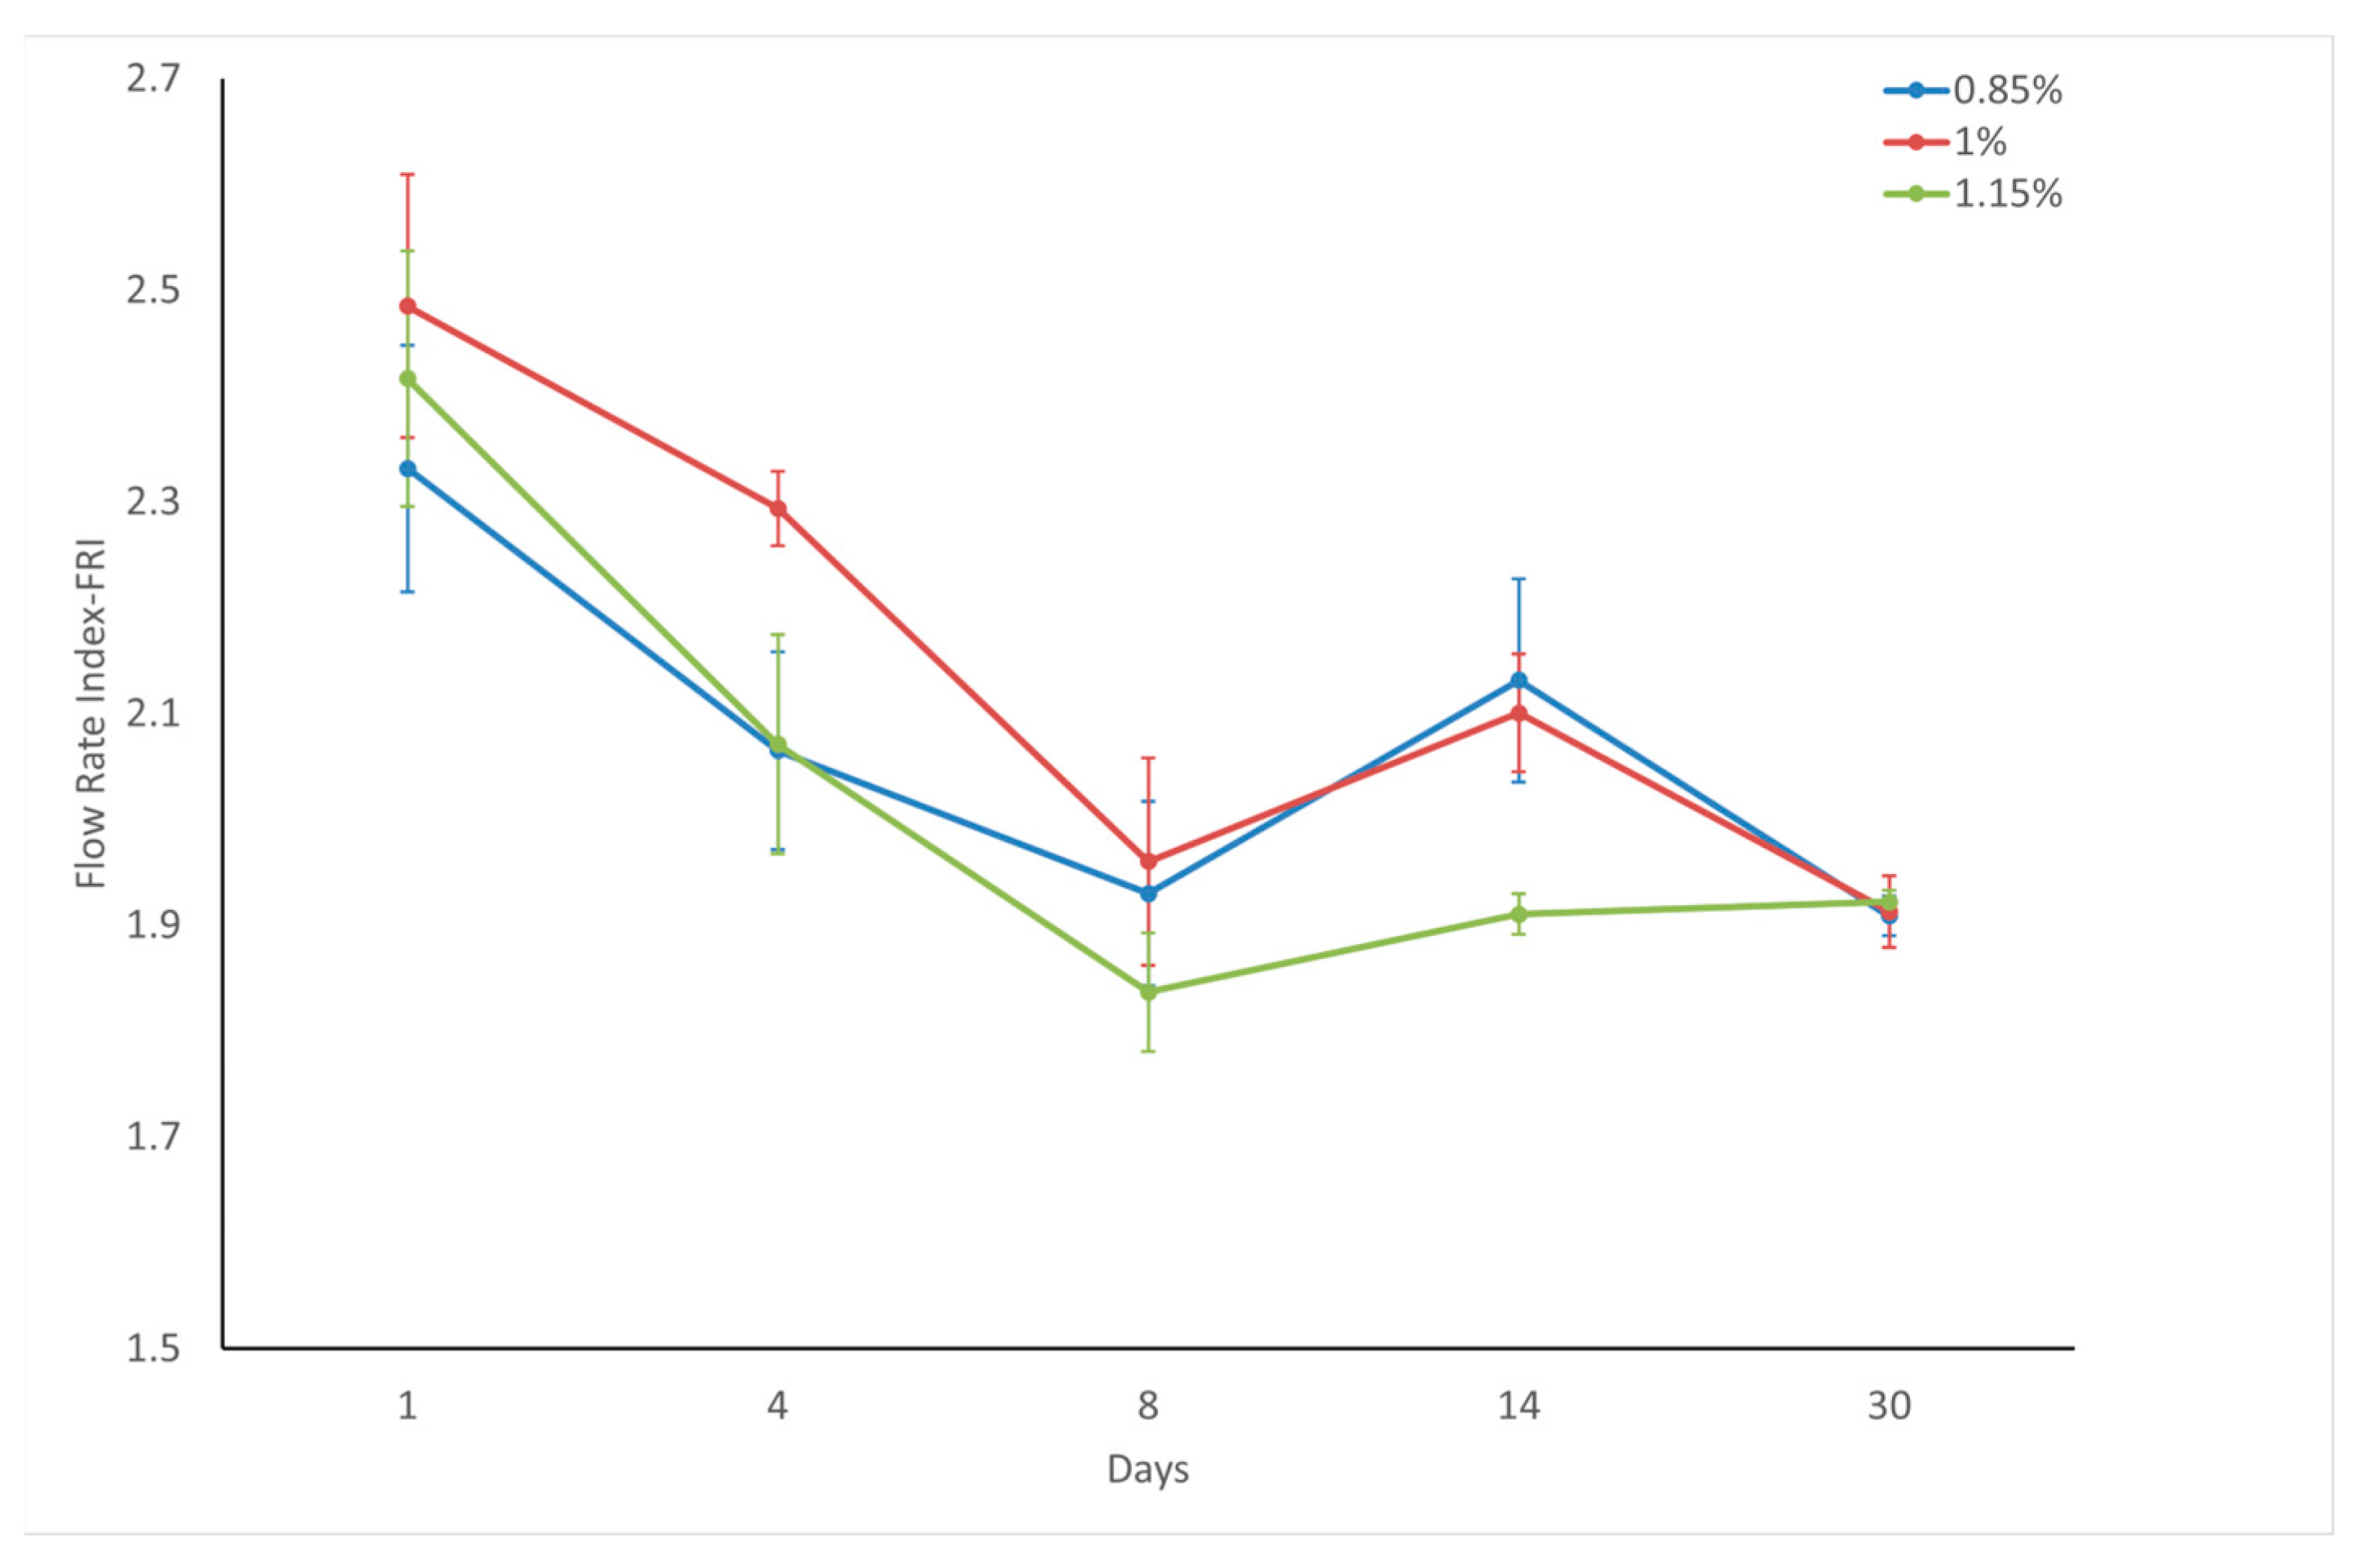
The Flow Rate Index (FRI) quantifies the reaction of powders to alterations in discharge speed. It was calculated by comparing the energy consumed in the final cycle at varying tip velocities to that used in the last cycle at a fixed tip speed of 100 mm/s. Powders with cohesive properties tend to exhibit greater sensitivity to flow rate changes than their non-cohesive counterparts. This heightened responsiveness is primarily attributed to the substantial air content within the cohesive powder beds.

3. Results and Discussion

3.1. Moisture Stability and Hydrophobicity

The effect of the moisture content on the results was eliminated because the samples were kept in a closed sample bag, the humidity level in the environment was not very high (40%), and their surfaces were hydrophobic because they were modified with SA. The uncoated sample exhibited a moisture content of 0.09%, whereas the SA-coated samples exhibited moisture levels ranging from 0.04% to 0.12%. Considering the 0.05% sensitivity of the device, it was concluded that there was no change in the moisture content that could affect the results of this study.
The floating test conducted after coating revealed that all the coated calcite powders achieved 100% active ratio, demonstrating complete flotation in water. The hydrophobic properties were observed at three distinct coating ratios: 0.85, 1, and 1.15 wt.% (Figure 3).

3.2. Particle Size and Morphology

The cumulative grain size distribution of the uncoated calcite powder sample (UC) is shown in Figure 4. The statistical parameters derived from the particle size distributions of the coated and uncoated samples are presented in Table 1. Following the coating process, a marginal reduction in grain size was observed in the calcite specimens. This phenomenon can be attributed to the mechanical abrasion effects resulting from agitation and friction between the grains during the high-speed mixing phase of the coating process. Nevertheless, it is worth considering that the disintegration of particle aggregates or alterations in the optical characteristics (such as the refractive index) of the grains caused by surface modification might also contribute to the observed effect.
When the surface morphology of the grains was examined, no morphological difference was observed before and after coating with stearic acid (Figure 5). No morphological change could be detected in the SEM images of the coated calcites on the 1st and 30th days depending on the deposition durations.

3.3. Colorimetric Properties

No significant changes were observed in the color values of the calcite powders before and after coating (Table 2). All the uncoated and coated powders exhibited high whiteness and brightness, with high L* and Ry values, respectively. The small increase in the b* values after coating indicated that the yellowness of the powders increased slightly.

3.4. Density

The density of calcite powder is a crucial property for various industrial applications, particularly in paint and plastic manufacturing [5]. In the manufacturing of polymer composites, the high density of calcite fillers offers numerous benefits. It enhances storage, transportation, and feeding processes and provides temporal and financial benefits. This is achieved by increasing the melt density during extrusion, which increases the overall output of the extrusion process. The Conditioned Bulk Density (CBD) values exhibited a progressive increase from 0.84–0.86 g/mL (day 1) to 0.93–0.94 g/mL (day 30), representing ~10% densification (Figure 6). Terminal uniformity observed across all coating concentrations reflects time-dependent particle rearrangement and surface stabilization in stearic acid-coated calcite. SA affects the density by altering the surface roughness owing to the accumulation of SA molecules on the surface. In addition to the smoothing of the surface morphology, the lubrication effect [16] of SA may have enabled high densities. The observed SA concentration-dependent increase in CBD directly correlated with the progressive smoothing of the calcite surface morphology and enhanced lubrication efficacy (Figure 6). Several factors likely contributed to the observed increase in density from day 1 to day 30. This change can also be explained by the decreased cohesion in the coated calcite samples, which facilitated the escape of air trapped between particles. As the air content diminishes over time, the powder bed becomes more compact, resulting in a denser and firmer structure [27]. CBD is a crucial metric for evaluating the effectiveness of powder packing [30,31]. The observed increase in CBD values over time suggests that the powders became more efficiently packed during the 30-day waiting period. The interaction between SA and the underlying calcite surface may have resulted in chemical or physical changes that contributed to the observed increase in density over time. These time-dependent processes highlight the importance of considering both immediate and long-term effects when studying the properties of coated samples [13].
Because CBD is calculated independently from the operator and can provide the most reliable results in terms of powder packing [30], it is useful to compare it with other density parameters. After 30 days, the coated calcites exhibited higher values for both poured and tap densities than their initial values on day 1 (Figure 7). Although intermediate fluctuations were observed on days 4, 8, and 14 likely due to transient particle agglomeration and redistribution of stearic acid coatings, the overall trend culminated in a net density increase by day 30, confirming progressive particle rearrangement and surface stabilization. After 30 days, the measured Haussner Ratio (HR) values exhibited a notable reduction (Figure 8). However, the persistence of HR values exceeding 1.4 for the calcite powders indicates that cohesive forces still dominated, resulting in poor flow properties.

3.5. Basic Flowability Parameters (SE and BFE)

Given the well-established relationship between packing and flow efficiency [30,32], allowing the coated powders to rest for a certain period is anticipated to improve their flow characteristics. To illustrate this relationship, Figure 9a shows the Specific Energy (SE) values, which are considered the best indicators of flow efficiency [30,31]. After 30 days of coating, the calcites exhibited lower SE values (4.58–5.03 mJ/g) compared to day 1 (5.15–5.58 mJ/g), confirming improved flowability. In the calcite samples coated with 1 wt.% stearic acid (sample C-1%), it was found that SE values showed a decrease of 15.09% from day 1 to day 30. However, the minimum SE values were achieved on day 8 (3.72–4.02 mJ/g), demonstrating optimal flowability. Particle shape and surface morphology significantly influence the flow characteristics of bulk powder materials [30,33]. Angular and irregular particle shapes contribute to poor flowability because of their tendency to interlock, increase adhesive bonds, and resist the free flow. Spherical and smooth-surfaced particles exhibit better flow efficiency [15,34,35,36]. The coating process likely modifies the surface properties of the calcite particles, reducing the interparticle friction and promoting better flowability. The observation that the lowest SE values were obtained with the highest concentration of stearic acid suggests that the surface-smoothing effect and enhanced boundary lubrication properties of stearic acid become more significant at higher coating levels, thereby directly facilitating particle mobility. This finding is consistent with the observed increase in CBD and further corroborates the dual role of stearic acid in modifying both the surface morphology and interfacial dynamics. Similar to SE, Basic Flowability Energy (BFE) revealed time-dependent flow characteristics. The minimum BFE values were obtained on day 8 (59.23–54.26 mJ), corresponding to the peak flow efficiency (Figure 9b). As with the SE values, the BFE values also increased from day 8 until day 30. Despite the post-day 8 rebound trend, 1 wt.% stearic acid coating (C-1%) reduced BFE by 7.6% over 30 days.
The interpretation of the BFE is complex. A high BFE is often associated with poor flowability, whereas a low BFE is associated with better flowability of the powder. The cohesiveness of the material and the presence of air between the particles can lead to counterintuitive results. For instance, cohesive powders with small particle sizes may exhibit lower BFE values owing to the air trapped between the particles, whereas larger particles that flow freely under gravity may result in higher BFE values. Therefore, BFE interpretation must consider the specific physical and environmental properties of the powder in question, as BFE values can vary depending on the particle size, density, cohesivity, and other factors [27]. The fact that BFE showed less pronounced changes than SE suggests that different aspects of powder flow may be affected to varying degrees by the coating process and the subsequent storage duration. The discrepancy between these two distinct powder flow characteristics may also be attributed to variations in the measurement conditions of the two flow parameters. The BFE represents the energy required to create a high-stress flow pattern in a specific conditioned volume of powder and is determined as the blade moves downward through the powder mass. Conversely, the SE assesses the flow efficiency of the powder or the mechanical interlocking of the particles in an environment without confined stress, and it is determined during the upward motion of the blade [30]. The SE appeared to be more responsive to the interactions between the calcite particles [37]. However, considering the increasing densities and decreasing BFE values of the samples after 30 days, it is difficult to conclude that the BFE is affected by changes in the powder density. In general, a high BFE is associated with poor flowability, whereas a low BFE is associated with better flowability.

3.6. Sensitivity of Powders to Flow Rate

Compared to non-cohesive materials, powders with cohesive properties are typically more responsive to fluctuations in the flow rate, primarily because of the substantial air content in their beds. Cohesive powders that exhibit greater sensitivity to flow rate are characterized by higher Flow Rate Index (FRI) values. The finding that the SA-coated calcite powders exhibited decreased FRI values after a 30-day period supports the hypothesis that these powders removed excess air from between the particles over time (Figure 10). On the first day of coating, no significant relationship was observed between the coating ratio and powder flow properties. Sample C-1% was the most cohesive sample, being the most sensitive to the flow rate. After a rapid decline until the 8th day within 30 days, an increase was observed on the 14th day, and a downward trend was observed again on the 30th day. Having almost equal FRI values at the end of 30 days, all three calcite samples eliminated the maximum amount of air they could eliminate without any external intervention and exhibited the same cohesive behavior.

3.7. Flow Stability of Powders

The flow stability of micronized filler powders is important during both transportation and feeding into the production process (e.g., extrusion). In general, such powders are fed by screws or augers, and gravimetric feeders are used, particularly for sensitive productions. Instability in the flow of the powder can cause problems in the production process and may cause deviations from the desired filler amount in the final product. The stability test comprised repeated conditioning and testing cycles with consistent parameters aimed at evaluating whether a powder undergoes changes in its structure (such as agglomeration, segregation, or breakage) when subjected to flow. This assessment does not incorporate external factors such as flow rate. Consequently, any alterations in the flow energy can be directly attributed to changes in the flow characteristics of the powder [29]. Initially, all powders exhibited instability, with high stability index values (SI > 1) on the first day of coating (Figure 11). However, after a 30-day waiting period, the calcite powder samples became more stable (SI ≈ 1). The SI values did not show a significant relationship with SA concentration on the first day or after 30 days. Among the calcite samples, the one with the lowest SA content (C-0.85%) exhibited the most stable flow characteristics. The increased presence of SA may have led to resistance to flow from Test 1 to Test 7 during the SI measurement owing to aggregation or electrostatic charge effects [38]. As with many rheological parameters (e.g., BFE, SE and FRI), a rapid decrease was observed in the stability index (SI) values towards the 8th day, followed by an increase on the 14th day and a decrease again on the 30th day. Due to the problems that a 30-day storage period may create in terms of economy, logistics and customer satisfaction, a storage period of 8 days is recommended. Since the flow stability on the 8th day is the same in 1% and 1.15% stearic acid-coated samples, it is also suggested that 1% stearic acid coating will be sufficient for economic reasons.

3.8. Time-Dependent Surface Dynamics and Industrial Implications

The dynamic nature of the calcite surfaces revealed by these results suggests that the interaction between the calcite surface and coating matrix evolves with time. Stearic acid treatment of the calcium carbonate particles likely altered their surface properties, affecting the cohesion and adhesion between the particles. This modification may have influenced the flowability and stability of the powders over time. Chemical and physical changes likely occurred at the interface between the calcite particles and SA after the initial coating was applied. Allowing time to elapse post-treatment can yield superior outcomes by facilitating stronger bonds between calcite and the coating material, optimal particle packing, and the completion of surface reactions that enhance coating properties. Manufacturers and researchers should consider this time-dependent behavior when designing experiments, formulating products, or establishing quality control procedures to maximize the potential of calcite fillers. The alteration in the rheological properties of surface-coated calcite powders over 30 days supports the hypothesis that calcite surfaces are dynamic [13]. Investigating these dynamics could provide insights into the long-term stability and performance of calcite-based materials and predict the behavior of calcite-containing formulations in industrial processes. Although the 30-day storage period in this study provides fundamental insights into long-term powder behavior, the industrial implementation of such extended durations is often impractical owing to storage capacity limitations for bulk materials, just-in-time production demands and economic burdens of inventory holding. Our results revealed that the flow properties of the coated calcite powders showed significant improvement within 8 days, indicating that this shorter period may represent the optimum balance between performance and operational feasibility. This underscores the importance of temporal factors in studying or utilizing calcite powders, as their properties may vary over time. Future research should identify the mechanisms driving these changes and explore methods to control or exploit the dynamic nature of calcite surfaces for various applications.

4. Conclusions

In this study, the effects of stearic acid coating concentration (0.85%, 1%, and 1.15% wt.) and storage duration (up to 30 days) on the flow properties of surface-modified micronized calcite powder were investigated. The results revealed significant changes in the rheological properties over a 30-day period, indicating that the calcite surfaces possessed dynamic characteristics. The Conditioned Bulk Density (CBD) values increased substantially from day 1 to day 30, with the highest coating rate (1.15 wt.% stearic acid) showing a density increase from 0.86 g/cm3 to 0.94 g/cm3, representing an 8.2% rise. This trend confirmed that higher coating rates consistently yielded greater densification over time, leading to more efficient particle packing.
The Specific Energy (SE) and Basic Flowability Energy (BFE) values both decreased progressively until day 8 (e.g., SE: from 5.1 to 3.7 mJ/g; BFE: from 77 to 59.3 mJ for C-1.15%), indicating improved flowability during this initial period. However, from days 8 to 30, both parameters rebounded (SE: 4.6 mJ/g; BFE: 74.3 mJ), suggesting a partial reversal of flow enhancement. This non-monotonic behavior underscores the dynamic nature of the surface-modified calcite powders during prolonged storage.
Although the powders exhibited varying cohesiveness (FRI: 2.3–3.1) immediately after surface modification, all samples converged to ~1.9 FRI values after 30 days of storage, demonstrating both reduced and unified cohesiveness behavior over time. Immediately after coating, all samples exhibited stability index (SI) values > 1.3 (range: 1.33–1.37), indicating significant flow instability across all stearic acid concentrations (0.85–1.15 wt.%). However, after 30-day storage, the SI values converged toward 1.0 (1.03–1.12), demonstrating remarkable stabilization of the powder flow. This evolution from initially heterogeneous/unstable to homogeneous/stable behavior underscores the time-dependent reorganization of the modified calcite surfaces. Considering factors such as storage costs, operational difficulties, and customer satisfaction, it is suggested that eight days may be an appropriate waiting period for coated calcite powders, where many flow parameters offer suitable and acceptable values. Considering the flow stability on the 8th day, it was predicted that coating with 1 wt.% stearic acid would be sufficient for economic reasons, since calcite powders coated with 1 to 1.15 wt.% stearic acid had the same stability index.
This study indicates that allowing stearic acid-treated calcite powders to rest can enhance their flow characteristics and stability, which is crucial for optimizing coating procedures and storage times in industrial processes using calcite fillers. These findings highlight the need to consider time-dependent behavior when working with surface-modified calcite in the future. The interaction between calcite surfaces and SA significantly affects the long-term stability and performance of calcite-based materials. This behavior has implications for industrial applications, including experimental design, product formulation, and quality control.
Further research is required to fully understand the mechanisms underlying these time-dependent changes and their implications for various applications. Manufacturers and researchers should consider these findings when developing and implementing calcite-based formulations to maximize the potential of calcite fillers.

Author Contributions

Conceptualization, O.E.; methodology, O.E., H.K. and D.K.G.; validation, O.E., formal analysis, O.E., H.K. and D.K.G.; investigation, O.E., H.K. and D.K.G.; writing—original draft preparation, O.E.; writing—review and editing, O.E.; visualization, O.E.; supervision, O.E.; project administration, O.E. and H.K.; funding acquisition, O.E. All authors have read and agreed to the published version of the manuscript.

Funding

This research was funded by NİĞTAŞ Inc., grant number ARGE-632.

Data Availability Statement

The original contributions presented in this study are included in the article. Further inquiries can be directed to the corresponding author.

Conflicts of Interest

Author H.K. is the business development manager and D.K.G. is an employee of the R&D department of NİĞTAŞ Corporation. Author O.E. was the scientific consultant for NİĞTAŞ Inc.

References

  1. Rios, M. Developments in powder flow testing. Pharm. Technol. 2006, 30, 38–49. [Google Scholar]
  2. Leturia, M.; Benali, M.; Lagarde, S.; Ronga, I.; Saleh, K. Characterization of flow properties of cohesive powders: A comparative study of traditional and new testing methods. Powder Technol. 2014, 253, 406–423. [Google Scholar] [CrossRef]
  3. Papirer, E.; Schultz, J.; Turchi, C. Surface Properties of a Calcium Carbonate Filler Treated with Stearic Acid. Eur. Polym. J. 1984, 20, 1155–1158. [Google Scholar] [CrossRef]
  4. Mihajlović, S.R.; Vučinić, D.R.; Sekulić, Ž.T.; Milićević, S.Z.; Kolonja, B.M. Mechanism of stearic acid adsorption to calcite. Powder Technol. 2013, 245, 208–216. [Google Scholar] [CrossRef]
  5. Wypych, G. Fillers—Origin, Chemical Composition, Properties, and Morphology. In Handbook of Fillers; Chemtec Publishing: Scarborough, ON, Canada, 2016; pp. 13–266. [Google Scholar]
  6. Ersoy, O.; Köse, H. Comparison of the effect of reactive and nonreactive treatments on the dispersion characteristics of a calcium carbonate (calcite) filler in a polypropylene matrix composite. Polym. Compos. 2020, 41, 3483–3490. [Google Scholar] [CrossRef]
  7. Ersoy, O.; Fidan, S.; Köse, H.; Güler, D.; Özdöver, Ö. Effect of Calcium Carbonate Particle Size on the Scratch Resistance of Rapid Alkyd-Based Wood Coatings. Coatings 2021, 11, 340. [Google Scholar] [CrossRef]
  8. Lam, T.D.; Hoang, T.V.; Quang, D.T.; Kim, J.S. Effect of nanosized and surface-modified precipitated calcium carbonate on properties of CaCO3/polypropylene nanocomposites. Mater. Sci. Eng. A 2009, 501, 87–93. [Google Scholar] [CrossRef]
  9. Rahmani, M.; Ghasemi, F.A.; Payganeh, G. Effect of surface modification of calcium carbonate nanoparticles on their dispersion in the polypropylene matrix using stearic acid. Mech. Ind. 2014, 15, 63–67. [Google Scholar] [CrossRef]
  10. Azadi, M.; Olya, M.J.; Vahedi, S.; Sangani, N.F. The effect of the chemical composition and the volume of coated carbonate calcium on epoxy paint properties. Russ. J. Appl. Chem. 2017, 90, 1181–1187. [Google Scholar] [CrossRef]
  11. Deshmukh, G.S.; Pathak, S.U.; Peshwe, D.R.; Ekhe, J.D. Effect of uncoated calcium carbonate and stearic acid coated calcium carbonate on mechanical, thermal and structural properties of poly(butylene terephthalate) (PBT)/calcium carbonate composites. Bull. Mater. Sci. 2010, 33, 277–284. [Google Scholar] [CrossRef]
  12. Mihajlović, S.; Sekulić, Ž.; Daković, A.; Vučinić, D.; Jovanović, V.; Stojanović, J. Surface properties of natural calcite filler treated with stearic acid. Ceram.–Silikáty 2009, 53, 268–275. [Google Scholar]
  13. Claesson, P.M.; Wojas, N.A.; Corkery, R.; Dedinaite, A.; Schoelkopf, J.; Tyrode, E. The dynamic nature of natural and fatty acid modified calcite surfaces. Phys. Chem. Chem. Phys. 2024, 26, 2780–2805. [Google Scholar] [CrossRef] [PubMed]
  14. Li, Y.; Zhao, Z.-f.; Lau, Y.-T.R.; Lin, Y.; Chan, C.-m. Preparation and characterization of coverage-controlled CaCO3 nanoparticles. J. Colloid Interface Sci. 2010, 345, 168–173. [Google Scholar] [CrossRef] [PubMed]
  15. Freeman, R. Measuring the flow properties of consolidated, conditioned and aerated powders—A comparative study using a powder rheometer and a rotational shear cell. Powder Technol. 2007, 174, 25–33. [Google Scholar] [CrossRef]
  16. Santomaso, A.; Lazzaro, P.; Canu, P. Powder flowability and density ratios: The impact of granules packing. Chem. Eng. Sci. 2003, 58, 2857–2874. [Google Scholar] [CrossRef]
  17. Li, H. Impact of Cohesion Forces on Particle Mixing and Segregation. Ph.D. Dissertation, University of Pittsburgh, Pittsburgh, PA, USA, 2005. [Google Scholar]
  18. Jange, C.G.; Ambrose, R.P.K. Effect of surface compositional difference on powder flow properties. Powder Technol. 2019, 344, 363–372. [Google Scholar] [CrossRef]
  19. Armstrong, B.; Clayton, J. Quantifying the Impact of Humidity on Powder Properties; Freeman Technology: Tewkesbury, UK, 2012; pp. 1–10. [Google Scholar]
  20. Zarubica, A.; Miljkovic, M.; Purenovic, M.; Tomic, V. Colour parameters, whiteness indices and physical features of marking paints for horizontal signalization. Facta Univ.—Ser. Phys. Chem. Technol. 2005, 3, 205–216. [Google Scholar] [CrossRef]
  21. Hunterlab. RxRyRz Reflection Factors. Available online: https://support.hunterlab.com/hc/en-us/articles/203284269-RxRyRz-Reflection-Factors-an08-08 (accessed on 1 February 2024).
  22. Gomari, K.A.R.; Denoyel, R.; Hamouda, A.A. Wettability of calcite and mica modified by different long-chain fatty acids (C18 acids). J. Colloid Interface Sci. 2006, 297, 470–479. [Google Scholar] [CrossRef]
  23. Sheng, Y.; Zhou, B.; Zhao, J.; Tao, N.; Yu, K.; Tian, Y.; Wang, Z. Influence of octadecyl dihydrogen phosphate on the formation of active super-fine calcium carbonate. J. Colloid Interface Sci. 2004, 272, 326–329. [Google Scholar] [CrossRef]
  24. Abdullah, E.C.; Geldart, D. The use of bulk density measurements as flowability indicators. Powder Technol. 1999, 102, 151–165. [Google Scholar] [CrossRef]
  25. Geldart, D.; Harnby, N.; Wong, A.C. Fluidization of cohesive powders. Powder Technol. 1984, 37, 25–37. [Google Scholar] [CrossRef]
  26. de Jong, J.A.H.; Hoffmann, A.C.; Finkers, H.J. Properly determine powder flowability to maximize plant output. Chem. Eng. Prog. 1999, 95, 25–34. [Google Scholar]
  27. Freeman Technology. The Basic Flowability Energy. In W Instruction; Freeman Technology: Tewkesbury, UK, 2013; pp. 1–8. [Google Scholar]
  28. Freeman Technology. Specific Energy. In W Instruction; Freeman Technology: Tewkesbury, UK, 2008; pp. 1–2. [Google Scholar]
  29. Bian, Q.; Sittipod, S.; Garg, A.; Ambrose, R.P.K. Bulk flow properties of hard and soft wheat flours. J. Cereal Sci. 2015, 63, 88–94. [Google Scholar] [CrossRef]
  30. Ziegelmeier, S.; Christou, P.; Wöllecke, F.; Tuck, C.; Goodridge, R.; Hague, R.; Krampe, E.; Wintermantel, E. An experimental study into the effects of bulk and flow behaviour of laser sintering polymer powders on resulting part properties. J. Mater. Process. Technol. 2015, 215, 239–250. [Google Scholar] [CrossRef]
  31. Ziegelmeier, S.; Wöllecke, F.; Tuck, C.; Goodridge, R. Characterizing the Bulk & Flow Behaviour of LS Polymer Powders. In Proceedings of the 24th Annual International Solid Freeform Fabrication (SFF) Symposium, Austin, TX, USA, 12–14 August 2013; pp. 354–367. [Google Scholar]
  32. Mullarney, M.P.; Beach, L.E.; Davé, R.N.; Langdon, B.A.; Polizzi, M.; Blackwood, D.O. Applying dry powder coatings to pharmaceutical powders using a comil for improving powder flow and bulk density. Powder Technol. 2011, 212, 397–402. [Google Scholar] [CrossRef]
  33. Bodhmage, A. Correlation Between Physical Properties and Flowability Indicators for Fine Powders. Master’s Thesis, University of Saskatchewan, Saskatoon, SK, Canada, 2006. [Google Scholar]
  34. Lumay, G.; Boschini, F.; Traina, K.; Bontempi, S.; Remy, J.-C.; Cloots, R.; Vandewalle, N. Measuring the flowing properties of powders and grains. Powder Technol. 2012, 224, 19–27. [Google Scholar] [CrossRef]
  35. Fu, X.; Huck, D.; Makein, L.; Armstrong, B.; Willen, U.; Freeman, T. Effect of particle shape and size on flow properties of lactose powders. Particuology 2012, 10, 203–208. [Google Scholar] [CrossRef]
  36. Nyström, C.; Alderborn, G.; Duberg, M.; Karehill, P.-G. Bonding Surface area and Bonding Mechanism-Two Important Factors fir the Understanding of Powder Comparability. Drug Dev. Ind. Pharm. 1993, 19, 2143–2196. [Google Scholar] [CrossRef]
  37. Chipakwe, V.; Hulme-Smith, C.; Karlkvist, T.; Rosenkranz, J.; Chelgani, S.C. Effects of Chemical Additives on Rheological Properties of Dry Ground Ore—A Comparative Study. Miner. Process. Extr. Metall. Rev. 2022, 43, 380–389. [Google Scholar] [CrossRef]
  38. Freeman Technology. Stability Method. In W Instruction; Freeman Technology: Tewkesbury, UK, 2010; pp. 1–8. [Google Scholar]
Figure 1. Schematic representation of stearic acid adsorption on CaCO3 particles at different concentrations.
Crystals 15 00568 g001
Figure 2. Schematic diagram showing the movement of the blade during the measurement of (a) BFE and (b) SE with a powder rheometer (modified from [27,28]).
Crystals 15 00568 g002
Figure 3. Images of stearic acid-coated powders after vigorous agitation in water.
Crystals 15 00568 g003
Figure 4. Cumulative grain size distribution of uncoated calcite powder sample.
Crystals 15 00568 g004
Figure 5. SEM micrographs of (a) uncoated calcite (UC), (b) 1% wt. SA-coated calcite on day 1, and (c) 1% wt. SA-coated calcite on day 30. The lengths of the white bars are equivalent to 10 µm.
Crystals 15 00568 g005
Figure 6. Conditioned Bulk Density (CBD) values of powders from day 1 to day 30. Data points represent mean values of three independent replicates; error bars indicate standard deviation.
Crystals 15 00568 g006
Figure 7. (a) Poured and (b) tap density values of powders from day 1 to day 30. Data points represent mean values of three independent replicates; error bars indicate standard deviation.
Crystals 15 00568 g007
Figure 8. Haussner Ratio (HR) values of powders from day 1 to day 30. Data points represent mean values of three independent replicates; error bars indicate standard deviation.
Crystals 15 00568 g008
Figure 9. (a) Specific Energy (SE) and (b) Basic Flowability Energy (BFE) values of powders from day 1 to day 30. Data points represent mean values of three independent replicates; error bars indicate standard deviation.
Crystals 15 00568 g009
Figure 10. Flow Rate Index (FRI) values of the powders from day 1 to 30. Data points represent mean values of three independent replicates; error bars indicate standard deviation.
Crystals 15 00568 g010
Figure 11. Stability index values of powders from day 1 to 30. Data points represent mean values of three independent replicates; error bars indicate standard deviation.
Crystals 15 00568 g011
Table 1. The statistical parameters were derived from the particle size distributions of the powder samples.
Sampled10d50d97d100<1 µm<2.2 µm
UC0.812.477.0113.1818.0143.86
C-0.85%0.802.236.3010.0019.8348.95
C-1%0.772.176.5311.4821.0050.53
C-1.15%0.792.316.7411.4819.6547.29
d10, d50, d97 and d100 are the 10, 50, 97 and 100% passing particle sizes, respectively. <1 µm and <2.2 µm are the percentages of particles less than 1 and 2.2 µm in size, respectively.
Table 2. Color parameters of powder samples.
SampleRy C/2La*b*
UC0.812.477.0113.18
C-0.85%0.802.236.3010.00
C-1%0.772.176.5311.48
C-1.15%0.792.316.7411.48
Disclaimer/Publisher’s Note: The statements, opinions and data contained in all publications are solely those of the individual author(s) and contributor(s) and not of MDPI and/or the editor(s). MDPI and/or the editor(s) disclaim responsibility for any injury to people or property resulting from any ideas, methods, instructions or products referred to in the content.

