Article

Modulation of Protein Dynamics by Glycerol in Water-Soluble Chlorophyll-Binding Protein (WSCP)

1
Institute of Physics, University of Tartu, 50411 Tartu, Estonia
2
Institute of General Botany, Johannes Gutenberg University Mainz, 55128 Mainz, Germany
3
Institute of Solid State Physics, University of Latvia, LV-1063 Riga, Latvia
4
Paul-Scherrer Institute, 5232 Villigen, Switzerland
5
Forschungs-Neutronenquelle Heinz Maier-Leibnitz (FRM II), Technische Universität München, 85748 Garching, Germany
*
Author to whom correspondence should be addressed.
Crystals 2025, 15(6), 569; https://doi.org/10.3390/cryst15060569
Submission received: 11 May 2025 / Revised: 12 June 2025 / Accepted: 12 June 2025 / Published: 17 June 2025
(This article belongs to the Section Biomolecular Crystals)

Abstract

:
Proteins are inherently dynamic entities that rely on flexibility across multiple timescales to perform their biological functions. The surrounding environment plays a critical role in modulating protein dynamics by exerting plasticizing or stabilizing effects. In order to characterize the conformational dynamics of Water-Soluble Chlorophyll-Binding Protein (WSCP), we measured Quasielastic Neutron Scattering (QENS) spectra over a wide temperature range between 100 and 300 K. The impact of glycerol, a common stabilizer, is investigated by comparing WSCP dissolved in a glycerol–water-containing buffer (WSCPW+G) with WSCP in a water-containing buffer (WSCPW). The results indicate that conformational protein dynamics are widely suppressed below 200 K but increase above this threshold, with the appearance of localized protein motions on the picosecond timescale. Glycerol appears to limit protein mobility between 280 and 300 K due to its high viscosity and hydrogen bonding in contrast to WSCP in water. Inelastic Neutron Scattering (INS) reveals the vibrational dynamics of WSCP with pronounced low-energy protein vibrations observed at about 2.5 and 6 meV. In the presence of glycerol, however, a stiffening of the vibrational motions which shifts the vibrational peaks to higher frequencies is observed.

1. Introduction

Proteins are dynamic entities that continuously fluctuate across multiple timescales and length scales, transitioning among conformational states to execute their biological functions [1]. These dynamic processes, which span from nanoseconds to milliseconds, are essential to specific roles, such as catalysis, signaling, and molecular recognition, and they are strongly influenced by the surrounding environment [2]. This environment—including the nature and concentration of surrounding molecules—can act as either a plasticizer or a stabilizer [3,4]. Plasticizers facilitate transitions between nearly isoenergetic conformational substates, increasing flexibility but often lowering thermal stability [3]. In contrast, stabilizers restrict these transitions, thereby enhancing thermal stability by maintaining structural integrity [4]. From a dynamic perspective, a protein’s ability to sample conformational substates is a direct indicator of its flexibility and functional potential [5].
Polyols such as glycerol and sugars are well-known stabilizers that increase the melting temperature of proteins and suppress denaturation [6]. Conversely, water, being essential to biological activity, acts as a strong plasticizer by enabling conformational flexibility and lowering the thermal threshold for denaturation [7,8]. This delicate balance between stabilization and plasticization is central to understanding protein behavior in varied environments. Molecular dynamics simulations and neutron scattering experiments have demonstrated that fluctuations are integral to biological function and closely linked with unfolding mechanisms [9,10]. A key indicator of this is the dynamical transition, a shift characterized by an anharmonic increase in mean square displacement (MSD) above 200 K, which is sensitive to environmental factors such as hydration and cosolvent composition [11,12].
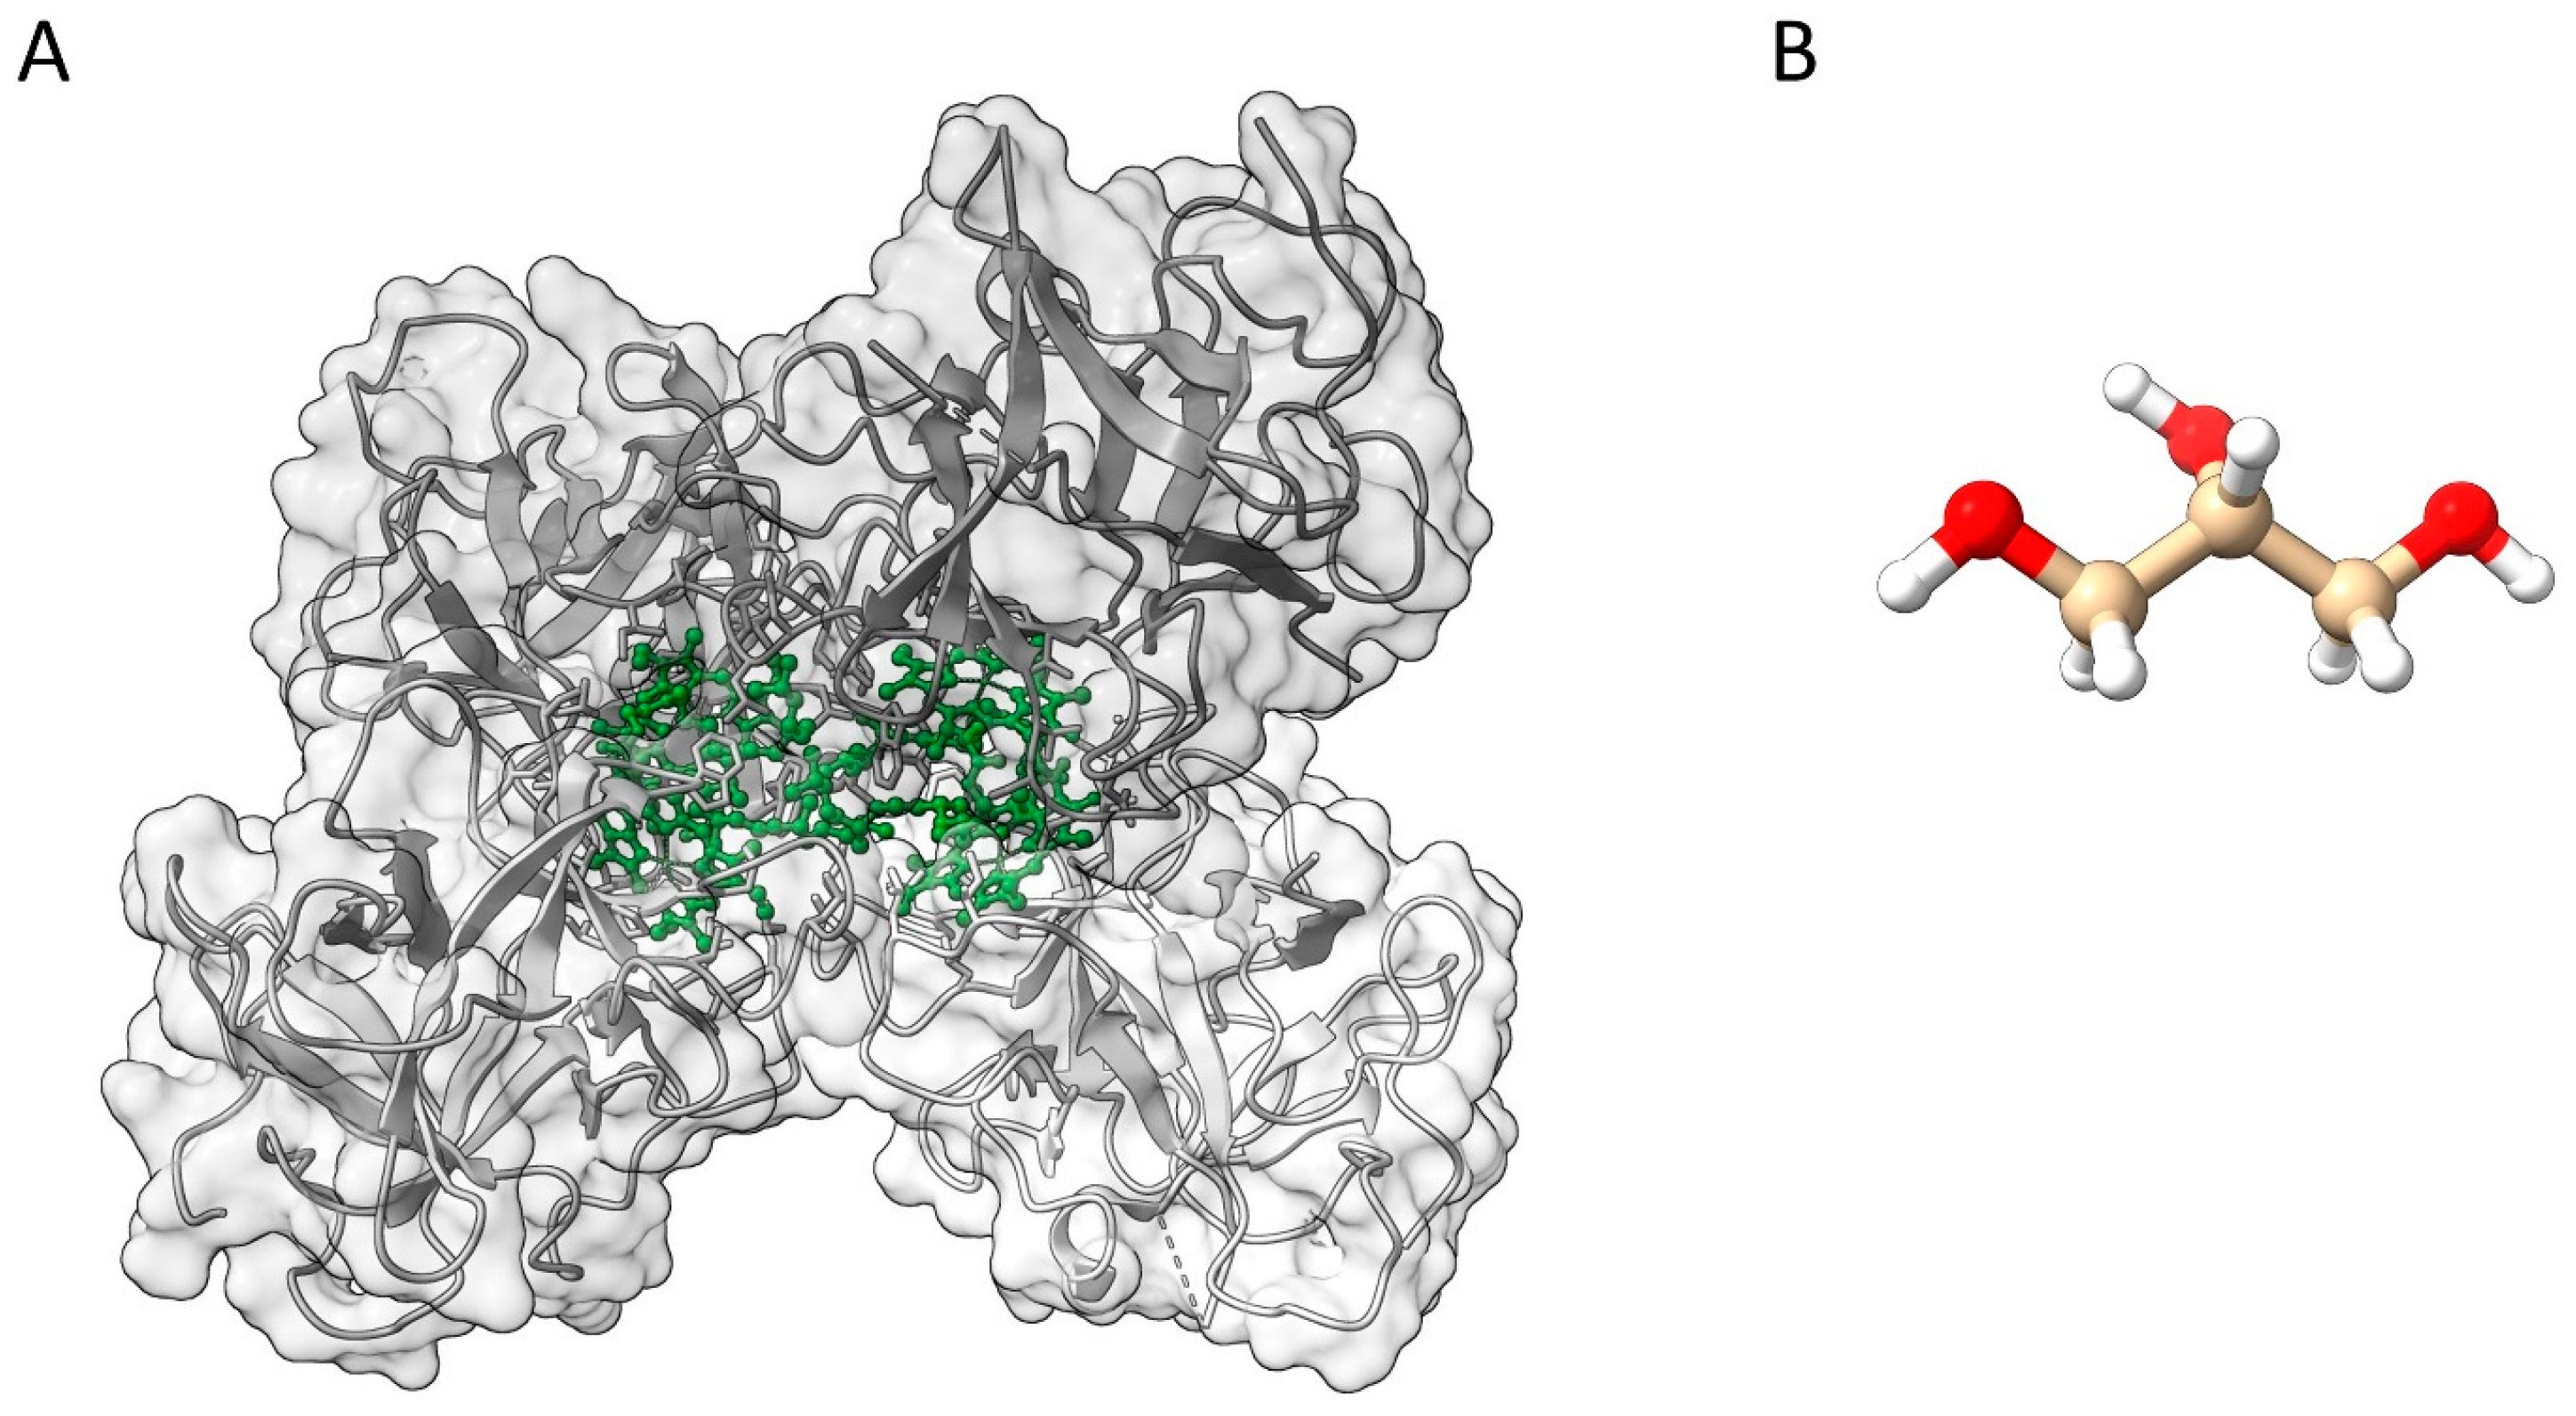
Glycerol, a simple yet multifunctional polyol (Figure 1B), is widely used in structural biology and biophysics to stabilize proteins, modulate dynamics, and preserve hydration [13,14]. Its hygroscopic nature attracts water molecules, forming a protective hydration shell that prevents protein aggregation [15] and preserves solubility under stress conditions like freezing and thawing [16,17]. Glycerol has been widely studied as a cryoprotectant, with multiple mechanisms having been proposed to explain its protective effects at low temperatures [18,19,20,21]. These include (1) preventing ice crystallization by forming a glycerol–water matrix, (2) promoting protein compaction via preferential hydration at the protein surface, (3) strengthening hydrophobic interactions under cold conditions, (4) acting as an amphiphilic mediator between hydrophobic protein regions and the surrounding polar solvent to inhibit aggregation, (5) reducing protein mobility due to its intrinsic high viscosity, and (6) increasing the temperature at which protein dynamics begin, marking the shift from a rigid, harmonic behavior to a more flexible, anharmonic regime [20].
At moderate concentrations, glycerol is preferentially excluded from the protein surface, resulting in a hydration shell enriched with water molecules [22]. This phenomenon, known as preferential hydration, thermodynamically favors the native folded state by minimizing the protein–solvent interfacial energy and disfavoring the increased solvent-accessible surface area of the unfolded form [16,17,23].
As glycerol concentration increases beyond ~50% v/v, the system transitions toward neutral solvation, where glycerol partially replaces hydration-shell water without drastically perturbing the protein structure [24]. This transition enhances thermal stability and structural cooperativity, as shown in both simulations and experiments [24]. Additionally, glycerol’s impact on solvent viscosity and hydrogen bonding dampens global protein dynamics while maintaining local flexibility, preserving structural integrity while allowing for functional motions [24,25,26]. Electrostatic interactions between glycerol and protein surfaces also contribute to its stabilizing effect by orienting glycerol molecules in a way that limits further access, effectively “caging” the protein in a native-like state [24,26]. From a thermodynamic perspective, these effects collectively modulate the chemical potential of water and glycerol, creating osmotic stress that drives proteins toward compact, stable conformations [27,28].
Temperature is another major factor in protein behavior. Elevated temperatures increase molecular flexibility and catalytic potential but also increase the risk of unfolding. In contrast, lower temperatures help preserve structure but may suppress necessary dynamic processes [5,29,30]. Understanding how glycerol modulates these temperature-dependent effects is critical to interpreting protein stability and function under diverse conditions [5].
QENS is particularly well-suited for studying protein dynamics in various environments and over large ranges of timescales and length scales [31]. It is most powerful when combined with molecular dynamics (MD) simulations [32]. The method’s sensitivity to hydrogen atoms provides a unique advantage for tracking the subtle structural fluctuations within the protein matrix that would otherwise be difficult to access. Most importantly, QENS has revealed the impact of various cryoprotectants on protein dynamics. For example, trehalose, a non-reducing disaccharide, was shown by QENS and MD to reduce protein dynamics by forming extensive hydrogen-bond networks with hydration water, leading to structural rigidity [33]. Ethylene glycol was found to induce temperature-dependent effects by stabilizing proteins at low temperatures due to reduction in hydration but promotes unfolding at higher temperatures [34]. In comparison, QENS was used to show that glycerol has a dual impact on lysozyme dynamics. At low hydration, it suppresses internal motions and raises the dynamical transition temperature due to strong coupling with its glassy matrix [35]. With increased hydration, protein flexibility rises, and transition temperature decreases, reflecting glycerol’s role as both a rigidifying agent and a medium permitting anharmonic motion. QENS investigations on PNIPAM [36] and MD simulations [37] further support that glycerol alters both short- and long-range dynamics in a concentration-dependent manner. Additional simulations reveal that glycerol and trehalose modulate lysozyme dynamics via hydrogen bonding and affect the glass transition temperature and molecular packing [38]. These studies collectively underscore the significance of QENS studies, in part combined with MD, in unraveling the effect of cryoprotectants on modulating protein dynamics. Understanding the nuanced effects of different cryoprotectants on protein flexibility and stability is essential to elucidating the fundamental principles governing protein behavior under various environmental conditions.
Returning to the functional importance of protein dynamics, photosynthetic light-harvesting flexible protein residues in the vicinity of pigment molecules are known to affect transition energies, while protein vibrations mediate energy transfer processes (see [39] and references therein). However, photosynthetic pigment–protein complexes are typically highly complex entities and are functionalized by binding multiple pigment molecules, thus rendering investigations of specific pigment–protein interactions difficult to almost impossible. In comparison, Water-Soluble Chlorophyll-Binding Protein (WSCP) appears as a rather minimal but still naturally abundant model system for pigment–protein complexes in photosynthesis [40]. WSCP is a unique plant protein that binds chlorophyll in a soluble and stable form, even outside the chloroplast environment [41,42]. WSCP can be isolated from various plants and distinguished according to its response to illumination. While class-I WSCP exhibits a spectral shift upon excitation, no photoconversion is observed for class-II (for a review, see [43]). Class-II WSCPs are water-soluble and possess a molecular weight of about 20 kDa. Crystal structures obtained by X-ray diffraction are available for WSCP from Lepidium virginicum [44] and for WSCP from Brassicae [45]. According to these studies, WSCP occurs as a tetramer binding four chlorophylls per tetramer (see Figure 1). Recombinant class-IIa WSCP may bind two or four chlorophylls. It has been used to investigate pigment–protein interactions and excitation energy transfer by several spectroscopic techniques, including time-resolved absorption and fluorescence experiments, spectral line narrowing, and 2D electronic spectroscopy [46,47,48,49]. WSCP plays a role in chlorophyll metabolism and photoprotection and serves as a model for pigment–protein interactions, with potential applications in biotechnology, such as stabilizing chlorophyll in non-plant systems and designing light-harvesting complexes [13,41,50].
Figure 1. (A) X-ray structures of WSCP tetramer according to [44] (PDB: 2DRE), with each monomer depicted in different gray shades. Chlorophyll molecules are represented as green balls and sticks. (B) Structure of glycerol from BioMagResBank (BMRB), with carbon atoms depicted in amber, oxygen in red, and hydrogen in white spheres. Figure 1 was created by UCSF ChimeraX [51].
Crystals 15 00569 g001
However, direct studies of protein dynamics of photosynthetic protein complexes including WSCP using QENS are so far very rare. This means that effects stemming from a flexible protein environment and the impact of cryoprotectants established by QENS for many other proteins (see above) are only indirectly visible in functional/spectroscopic studies on WSCP [40].
In the present study, we intend to close the latter gap in our knowledge about WSCP by studying its protein dynamics in two different solvent environments: a water-based buffer (WSCPW) and a buffer containing water and glycerol (WSCPW+G). In the first part of our study, we use QENS to investigate the temperature dependence, the effect of solvent melting, and the impact of glycerol as a stabilizer on the conformational protein dynamics of WSCP. In the second part, we employ INS to examine how glycerol affects the vibrational dynamics of WSCP across a broad temperature range.

2. Materials and Methods

2.1. Sample Preparation

For QENS experiments, WSCP samples were prepared as previously described [47], with minor modifications. In brief, recombinant WSCP (recWSCP) from cauliflower (Brassica oleracea var. botrytis), UniProt ID Q7GDB3, was expressed in the E. coli strain JM101 by using a modified pDS12/RBSII expression vector in which the maltose-binding protein tag was replaced by an N-terminal hexahistidyl (His) tag introduced via synthetic oligonucleotides. Bacterial cultures were induced with IPTG and grown overnight at 28 °C. Cells were lysed using a French press, and the lysate was centrifuged (25 min, 10,000× g, 4 °C). Although some recWSCP was recovered in the supernatant, the majority was present in the pellet as inclusion bodies.
The pellet was resuspended in 10 mM sodium phosphate buffer (pH 9.0) and treated with DNase I to degrade nucleic acids. After incubation at room temperature and 37 °C, the inclusion bodies were pelleted again and redissolved in 50 mM sodium phosphate buffer (pH 7.4) with solid guanidinium hydrochloride (Gnd) to denature the protein.
Pigments (total chlorophyll extract or purified Chl a/b) were obtained from pea plants and stored dry under nitrogen at −20 °C. A 10-fold molar excess of pigment (typically 100 μg) was solubilized in ethanol and mixed with octyl-β-D-glucopyranoside (OG) in reconstitution buffer (100 mM lithium borate at pH 9.0 and 12.5% sucrose). The pigment and denatured protein were combined, vortexed, and incubated briefly at room temperature to allow for reconstitution.
For column-based reconstitution and purification, recWSCP was immobilized on a Ni2⁺-charged Chelating Sepharose™ Fast Flow column equilibrated with 100 mM sodium phosphate buffer (pH 7.8). Pigments (5-fold molar excess) solubilized in ethanol and OG-buffer were added to the column and incubated for 45 min at room temperature in the dark. Unbound pigments were removed by extensive washing with OG-buffer. Detergent was removed by further washing with phosphate buffer alone. Pigmented, refolded recWSCP was eluted with 300 mM imidazole in 10 mM sodium phosphate (NaP) buffer (pH 7.8). The reconstituted WSCP complex had a chlorophyll a/b ratio of 2.7:1, determined by HPLC after pigment extraction with 2-butanol and SDS. Final WSCP samples were concentrated to ~80 mg/mL using a 30 kDa MW cutoff Centricon device.
The integrity of the protein was verified using spectroscopic means as described in [45], and no protein heterogeneity was detected.
For QENS measurements, the purified WSCP was buffer-exchanged into 300 mM imidazole and 20 mM NaP prepared in D2O (pD = 7.5) to minimize solvent scattering. This sample is referred to as WSCPW. To prepare WSCP in the water–glycerol solution (WSCPW+G), 50% (w/v) glycerol was added to the same buffer. In all cases, the final sample volume was 2 mL, and equivalent buffer conditions were used for comparative measurements.

2.2. QENS Experiments

QENS spectra for the WSCP in the water–glycerol mixture were collected across a wide temperature range between 100 and 300 K using the time-of-flight spectrometer TOF-TOF at Heinz Maier-Leibnitz Zentrum (MLZ) in Garching, Germany. The experiment was carried out by employing neutrons with a wavelength of 5 Å. These neutrons provided an elastic resolution ΔE with a full width at half maximum (FWHM) of 75 μeV corresponding to an observation time window between 0.1 ps and 26 ps, while the Q range for this wavelength was 0.25 to 2.3 Å−1. The choppers were operated at 14,000 RPM with a frame-overlap chopper ratio of 4. Each QENS spectrum at a given temperature required four hours of data acquisition. The experimental resolution function was determined by fitting the vanadium spectrum. To account for solvent effects on scattering intensity, measurements were also taken for the buffer solution without the protein at all temperatures.
The Mantid software package [52] (version is v6.11.0) was employed for data processing. After collecting the raw data, all runs were normalized, corrected for the empty cell contribution and detector efficiency, and then transformed to the energy and momentum transfer scales.

2.3. INS Experiments

INS experiments to characterize vibrational protein motions [53] were performed using the time-of-flight spectrometer FOCUS at the Paul-Scherrer Institute in Villigen, Switzerland. The measurement was performed with an incident neutron wavelength of 5 Å, an elastic energy resolution ΔE of 0.123 meV, and a scattering vector Q range of 0.35−2.25 Å−1. The data were corrected for empty cell contribution, normalized, and converted to the energy transfer scale by using the program package DAVE [54].

2.4. QENS Data Analysis

The data analysis followed the procedure described in [55] and involved the determination of an experimental scattering function S e x p Q , ω (see Equation (1)) by convolving the theoretical scattering function for a protonated scatterer S t h e o Q , ω with the instrument resolution function and fitting it to the data by varying the parameters of its elastic and quasielastic components. The analysis allows us to distinguish between different types of dynamics characterizing the investigated protein.
The function S e x p Q , ω consists of a normalization factor F N , the detailed balance factor exp (− ω 2 k T ), and the convolution of the resolution function R (Q, ω) with the theoretical scattering function S t h e o Q , ω   , both of which depend on the energy transfer ω and momentum transfer Q :
S e x p Q , ω = F N exp ω 2 k T R ( Q , ω ) S t h e o ( Q , ω )
The theoretical model for protein dynamics can be expressed as
S t h e o Q , ω = e u 2 Q 2 { A 0 Q δ ω + n A n Q L n H n , ω + S i n Q , ω }
This equation includes a Debye–Waller factor ( e u 2 Q 2 , where u 2 is the mean square displacement of vibrational motions), an elastic term ( A 0 Q δ ω ), a quasielastic contribution ( n A n Q L n H n , ω ), and an inelastic component ( S i n ( Q , ω ) ). For the quasielastic part, a Lorentzian function Ln(Hn, ω) is used with a half width at half maximum (HWHM), H n , linked to the characteristic residence time τR. Generally, a broader line shape (a wider HWHM) corresponds to a shorter residence time. Note that after convolution with a Gaussian resolution function, Lorentzians effectively become Voigt line shapes. The pre-factors A 0 Q and A n Q represent the elastic and quasielastic incoherent structure factors (EISF and QISF), respectively, which sum up to unity satisfying the equation
n A n Q = 1 A 0 ( Q )
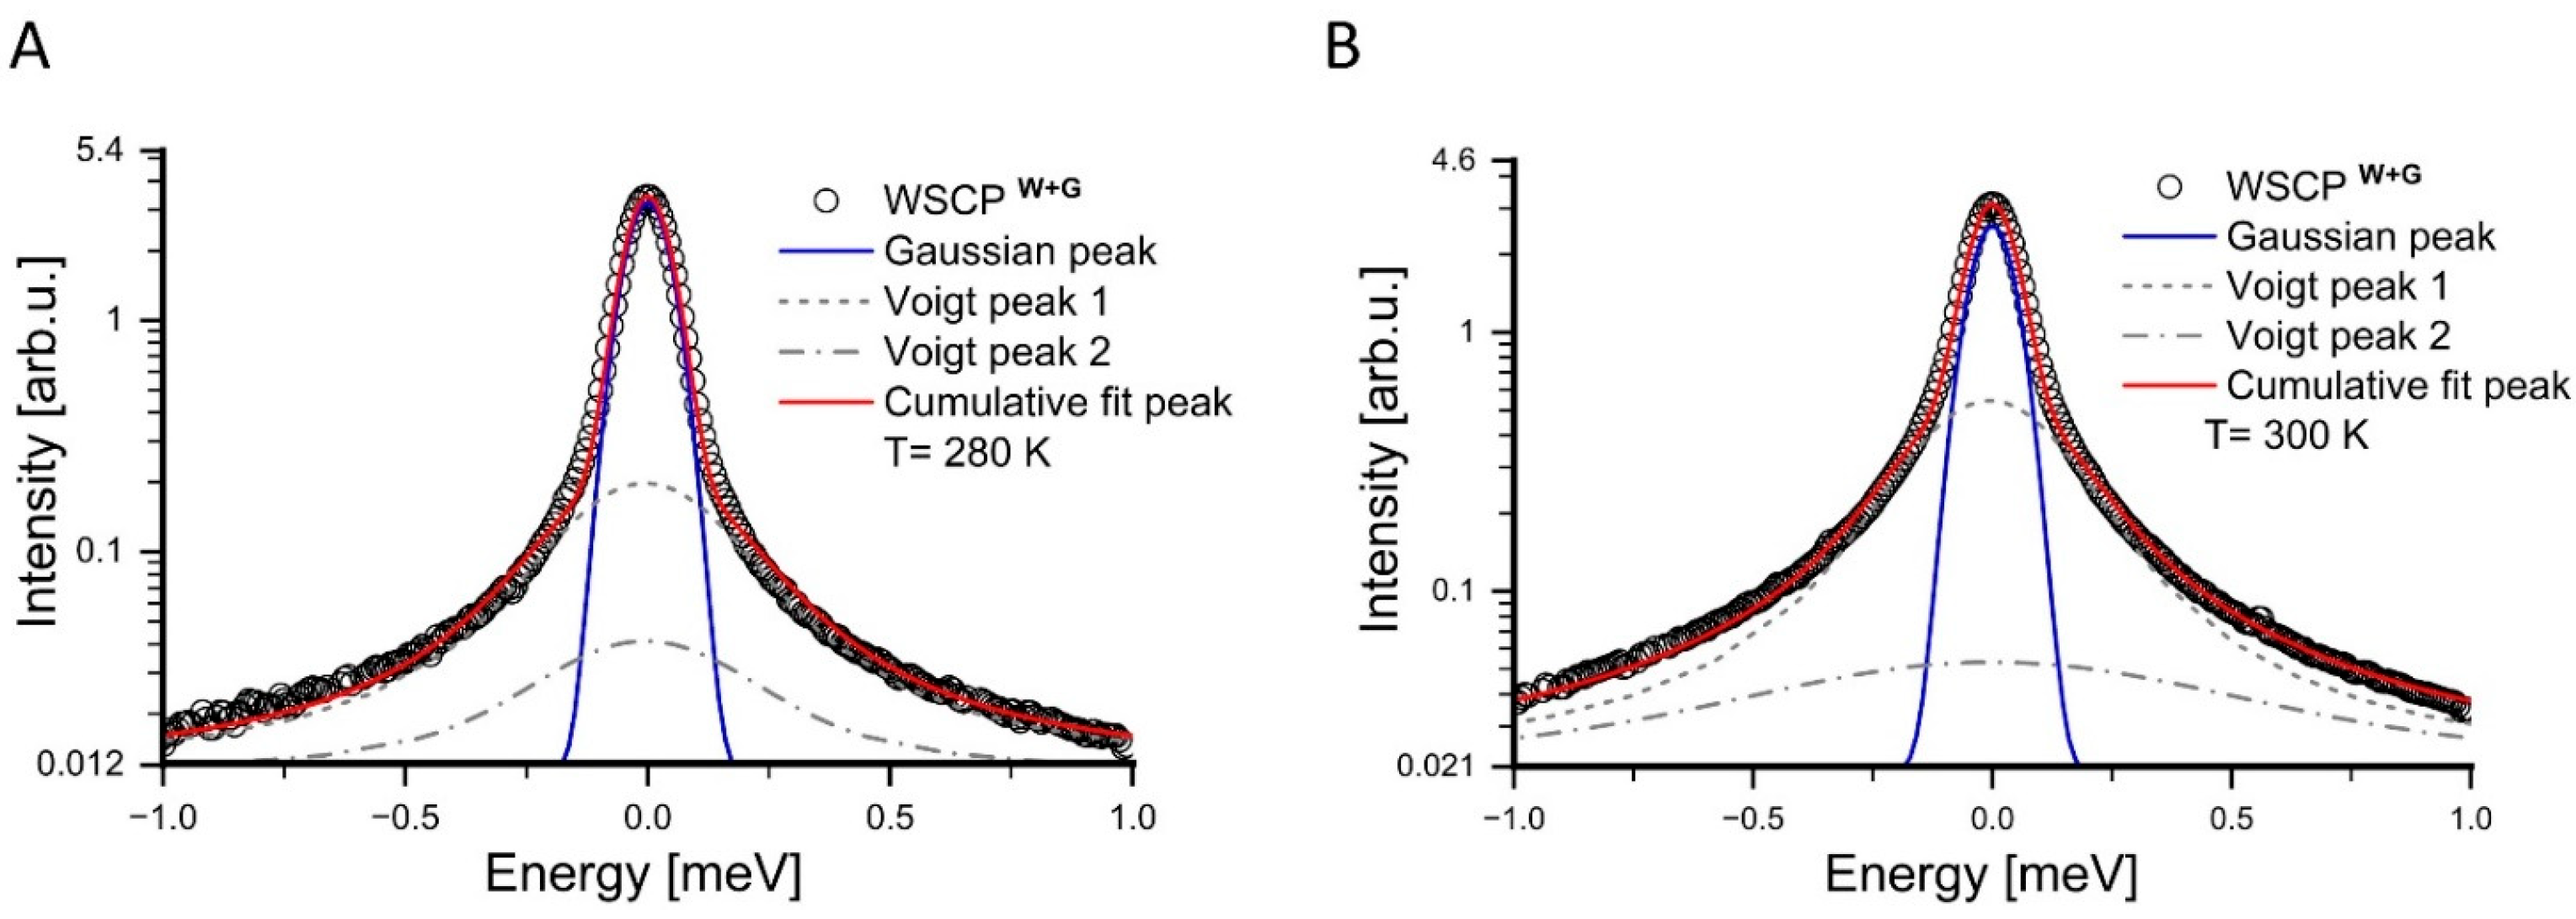
Following the latter approach, each QENS spectrum is fitted using one elastic component and two Voigt functions, representing slow (narrow linewidth) and fast (broad linewidth) motions, respectively, to describe the data for 260 K, 280 K, and 300 K. At temperatures below 260 K, attempts to fit the QENS spectra by using two Voigt functions resulted in high residual errors, indicating that the model did not adequately capture the observed dynamics. Consequently, a single Voigt function was used for data analysis at these temperatures, which better represented the experimental results.
The slow components can be interpreted using the jump diffusion model according to Singwi and Sjölander [56], so that the Lorentzian HWHM is expected to follow
H W H M Q = D Q 2 1 + D Q 2 τ
Here, τ is the residence time during which a proton oscillates around its equilibrium position, and D is the diffusion constant, representing the jump diffusion of protons between equilibrium sites. This model has been widely applied in studies in protein dynamics.
The elastic incoherent structure factor (EISF) provides insights into the geometry of proton motions and the fraction of hydrogen atoms involved. The EISF, which measures the ratio of elastic-to-total intensities, can be calculated as
E I S F = A 0 ( Q ) A 0 Q + A 1 ( Q )
This EISF was compared with various theoretical models. The data analysis followed an unbiased procedure: the scattering law was convolved with the instrument resolution, and elastic and quasielastic components were extracted at all Q values by using least squares fitting. The best fit was achieved using a 4-fold jump model, which assumes a uniaxial rotational jump between four sites arranged in a circle with radius r . The EISF for this model is given by [57]
E I S F = f 1 4 [ 1 + 2 j 0 Q r 2 + j 0 ( 2 Q r ) ] + ( 1 f )
Here, j 0 is the spherical Bessel function of the first order, and r is the radius of the circle. An additional parameter f accounted for the mobile fraction of hydrogen atoms in the given observation time window. The QENS spectra were analyzed using OriginPro 8 (OriginLab Corp.) [58].
In order to analyze the INS part of the data, the inelastic function S i n Q , ω was fitted with suitable line shapes as described below.

2.5. Buffer Subtraction

The scattering signal of a protein sample in solution generally includes contributions from both the protein and the solvent. Therefore, buffer subtraction is essential to obtaining an accurate assessment of the protein’s scattering function. The first step in this process is to measure the pure solvent. Once the solvent’s contribution is known, the protein’s contribution can be isolated by subtracting the solvent data. Buffer subtraction was performed following the procedure described in [55].
Figure 2 illustrates the angular spectrum (or diffractogram) of WSCPW+G, along with a separate buffer measurement. In the sample spectrum, a strong correlation peak is observed at a 2θ angle of approximately 90°, which is also evident in the buffer data. This peak is primarily due to the coherent scattering of D2O, while no similar intensity modulation should be present in an incoherent scatterer, such as the protein or vanadium standard. The WSCP contribution was estimated by applying a buffer subtraction using a scaling factor k , ensuring that the correlation peak disappears and the diffractogram becomes flat.
The buffer-subtracted protein scattering intensity can be calculated as follows [55]:
I P r o t e i n = I S a m p l e k . I B u f f e r
WSCPW was treated analogously. In the present study, the scaling factors k for WSCPW and WSCPW+G were determined to be 0.83 and 0.75, respectively. The resulting QENS spectra are shown in Figure 2B for WSCPW+G at 300 K as an example. All further analysis is restricted to the protein contribution obtained after buffer subtraction.

3. Results

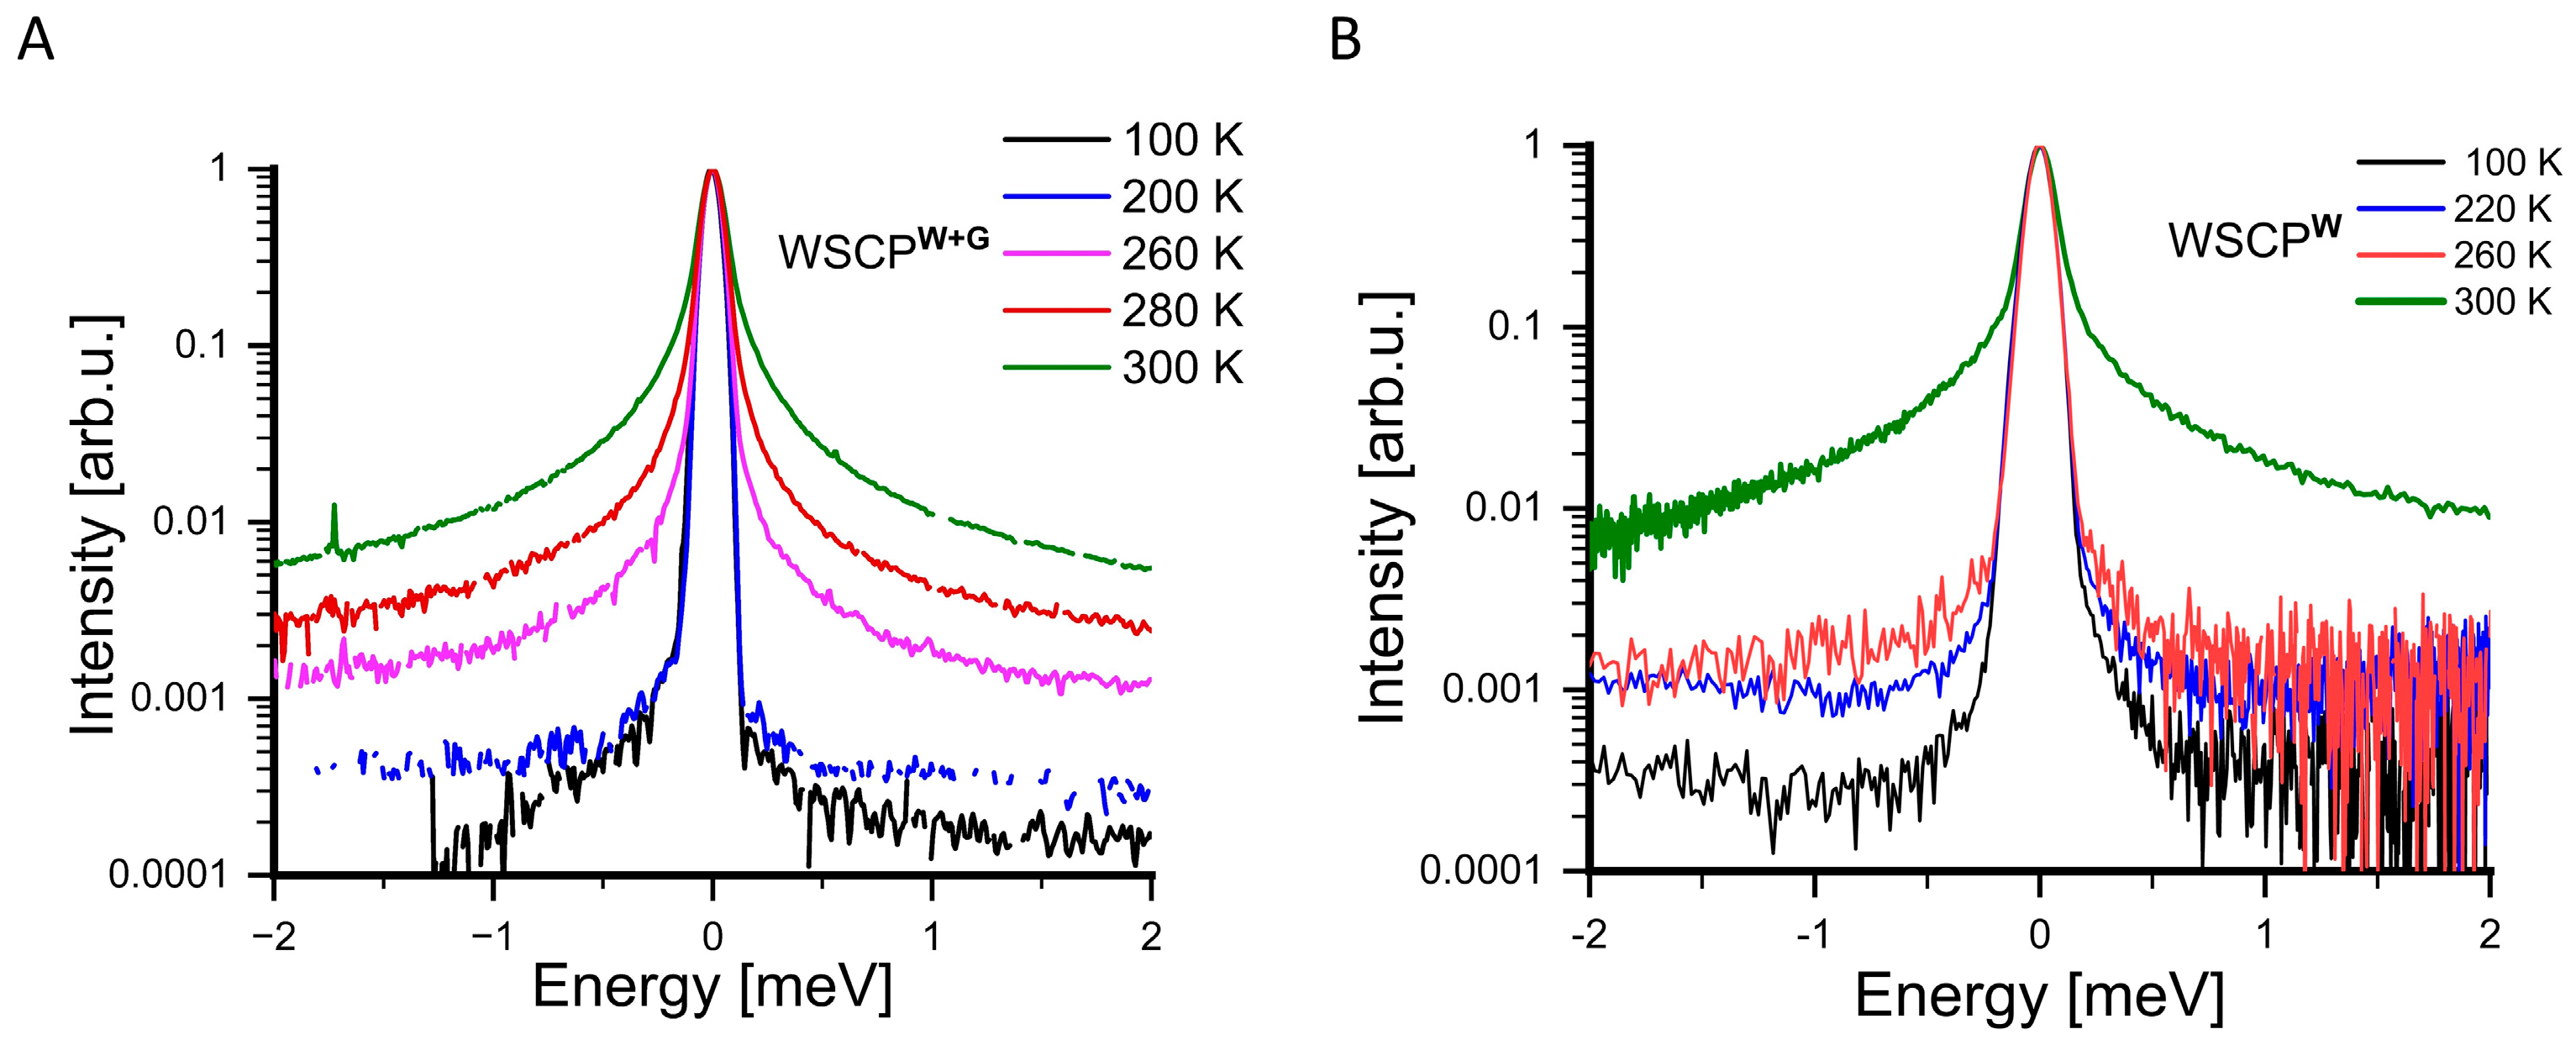
Diffusive (conformational) protein dynamics: QENS is a powerful technique for investigating the conformational dynamics of proteins [59]. It is particularly sensitive to motions on the picosecond-to-nanosecond timescale and over distances of approximately 1 to 10 Å, making it ideal for probing side-chain flexibility and segmental motions [59]. QENS enables the extraction of important parameters such as the jump diffusion coefficient (D) and the residence time (τ), which characterize localized atomic motions [60]. In this study, we employed QENS to explore the temperature-dependent dynamics of WSCP in water (WSCPW) and in a water–glycerol mixture (WSCPW+G) at different temperatures (see Figure 3). At low temperatures (100 and 200 K), the QENS spectra are dominated by elastic scattering, which reflects the static component of the protein structure. Elastic scattering arises when neutrons are scattered without energy exchange, indicating that the atoms within the protein remain essentially immobile on the timescale probed [61]. This suggests that atomic motions are highly restricted, and the system behaves in a largely rigid manner. In contrast, quasielastic broadening (typically observed at higher temperatures) indicates energy exchange between the neutrons and the sample, corresponding to internal motions such as side-chain fluctuations or backbone flexibility [61]. Therefore, the dominance of elastic scattering at 100 and 200 K demonstrates that the dynamic, mobile fraction of the protein is negligible, and the protein remains in a frozen state with suppressed internal dynamics. The QENS spectra obtained at temperatures above 200K clearly exhibit quasielastic broadening corresponding to localized protein motions and can be fitted according to Equation (1) by using two Voigt functions (see above). Representative examples of fits are shown in Figure 4 for selected temperatures. The overall fit quality is excellent.
The broader Voigt function observed at higher temperatures exhibits a constant HWHM and thus most likely represents fast, localized motions, such as a methyl group or other side-chain rotations [62,63,64].
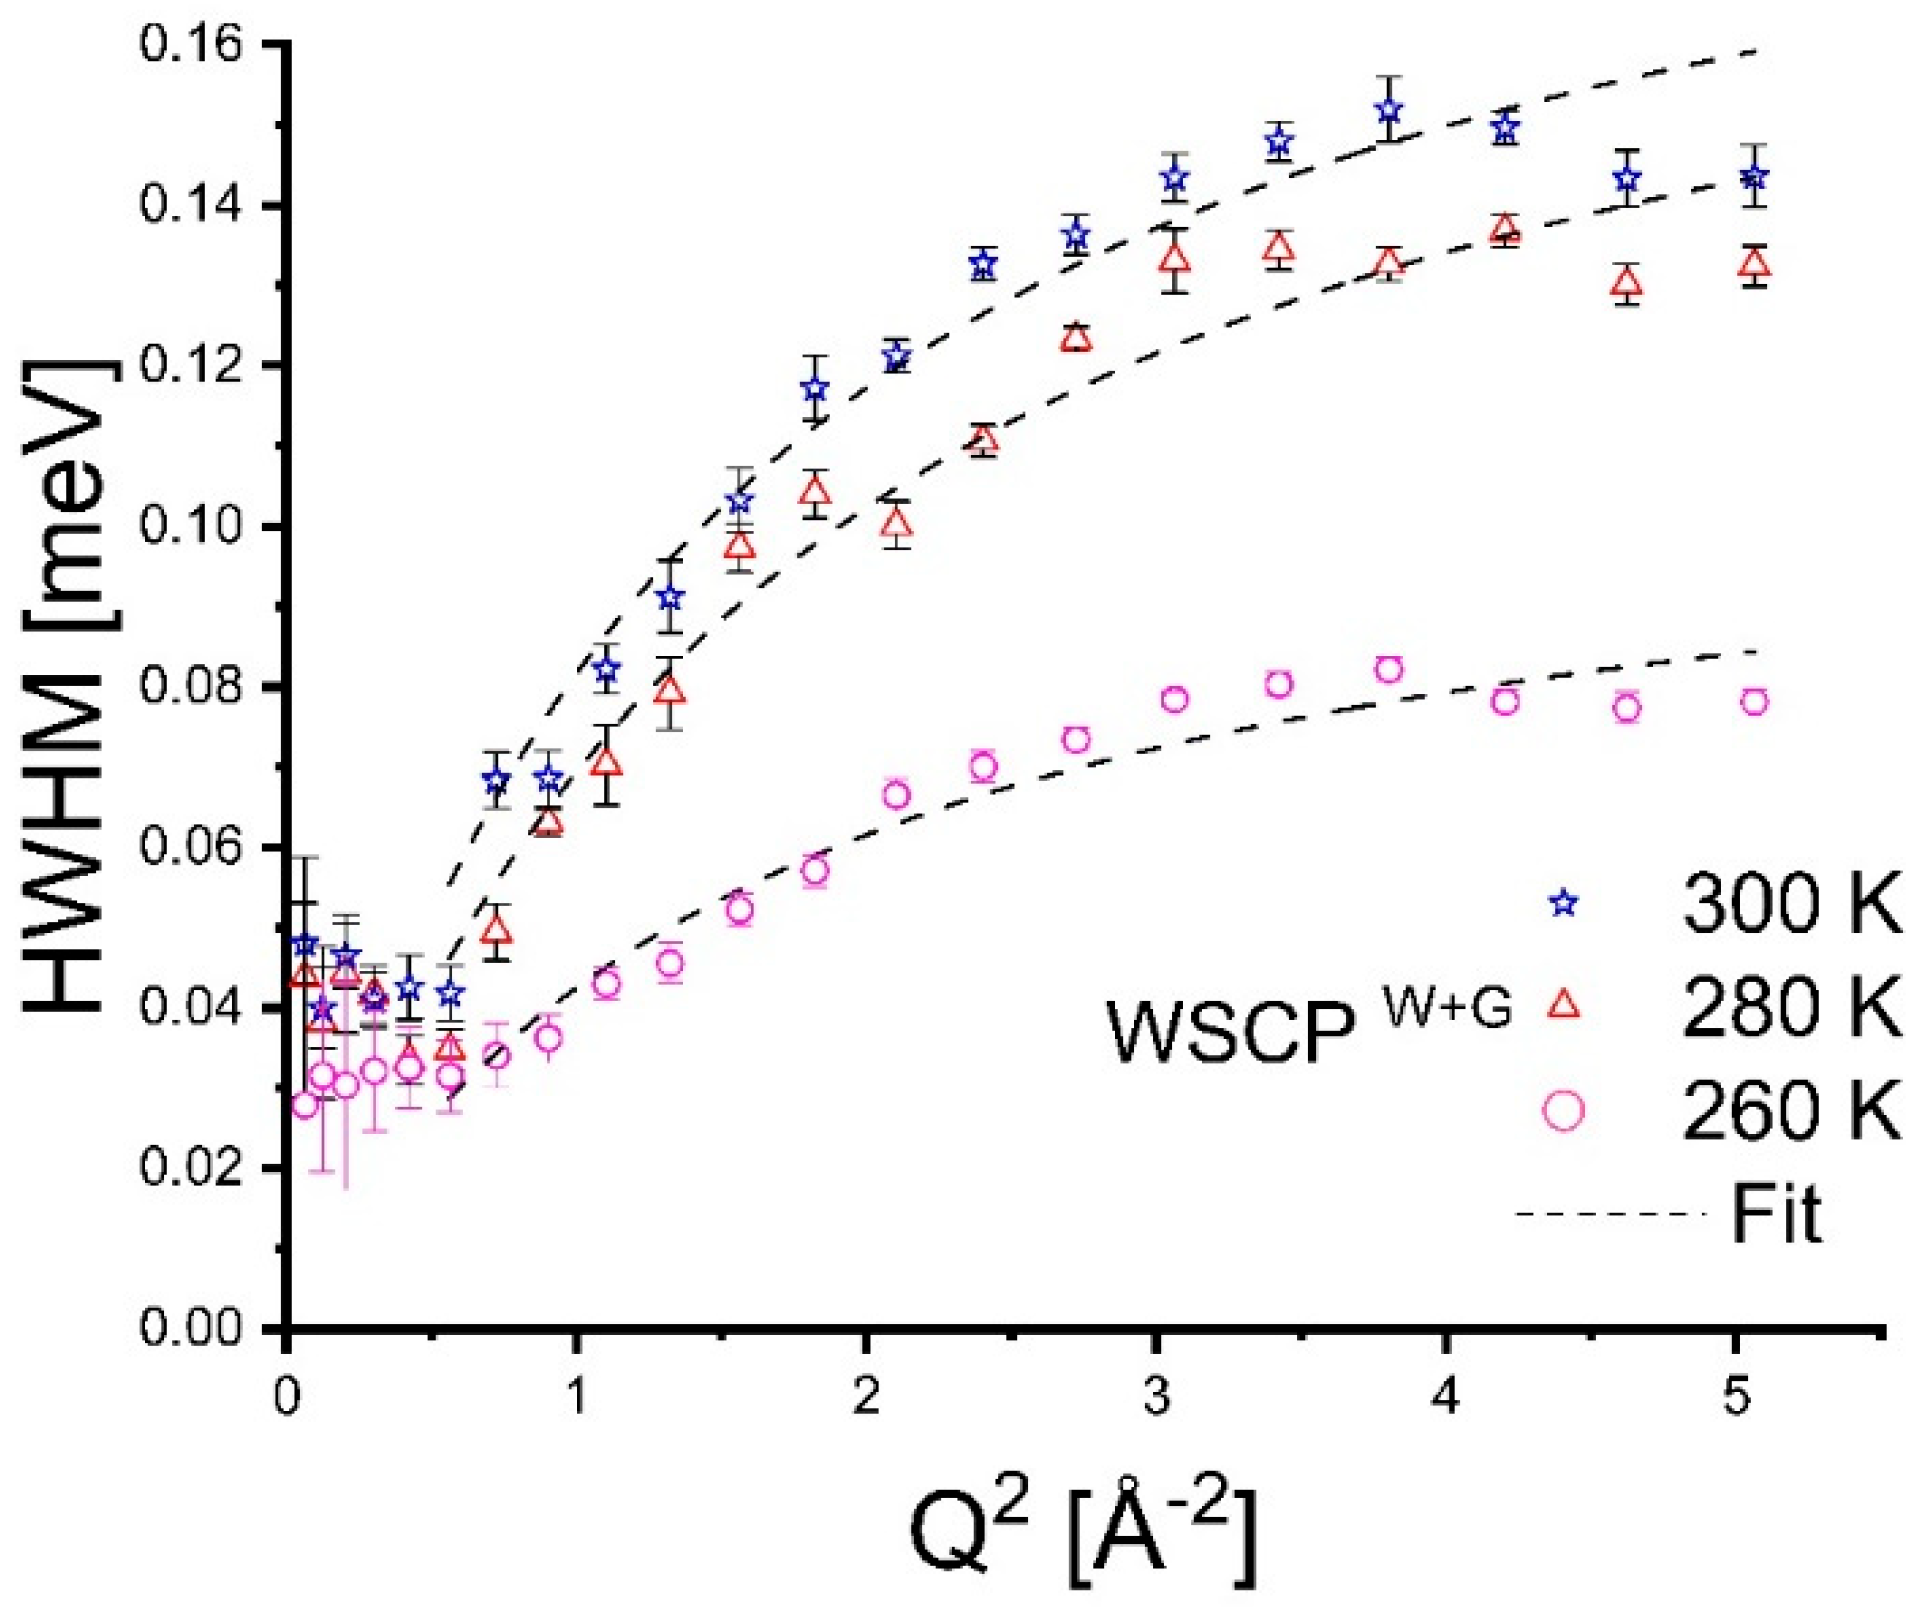
The analysis of the half width at half maximum (HWHM) of the narrow Voigt function (representing slow, localized motions) provides critical information about the D and τ of hydrogen atoms within WSCP according to Equation (4) (see dashed lines in Figure 5). The fit parameters are compiled in Table 1. As the temperature increases, the HWHM broadens, indicating enhanced local atomic mobility [53]. This broadening at higher temperatures (260 K, 280 K, and 300 K) reflects a faster diffusion process [53]. The HWHM values, plotted as a function of the squared momentum transfer (Q2) for WSCPW+G, exhibit significant dependence on temperature. The application of the jump diffusion model according to Equation (4) reveals that the residence time (τ) of hydrogen atoms in WSCPW+G decreases as the temperature rises (see Table 1), confirming increased mobility. The decrease in τ is particularly pronounced between 260 K and 280 K, i.e., correlated with solvent melting, while it becomes less significant when the temperature increases from 280 to 300 K. In addition, there was a steep increase in the jump diffusion constant D upon solvent melting when the temperature rose from 260 K to 280 K and from 280 to 300 K.
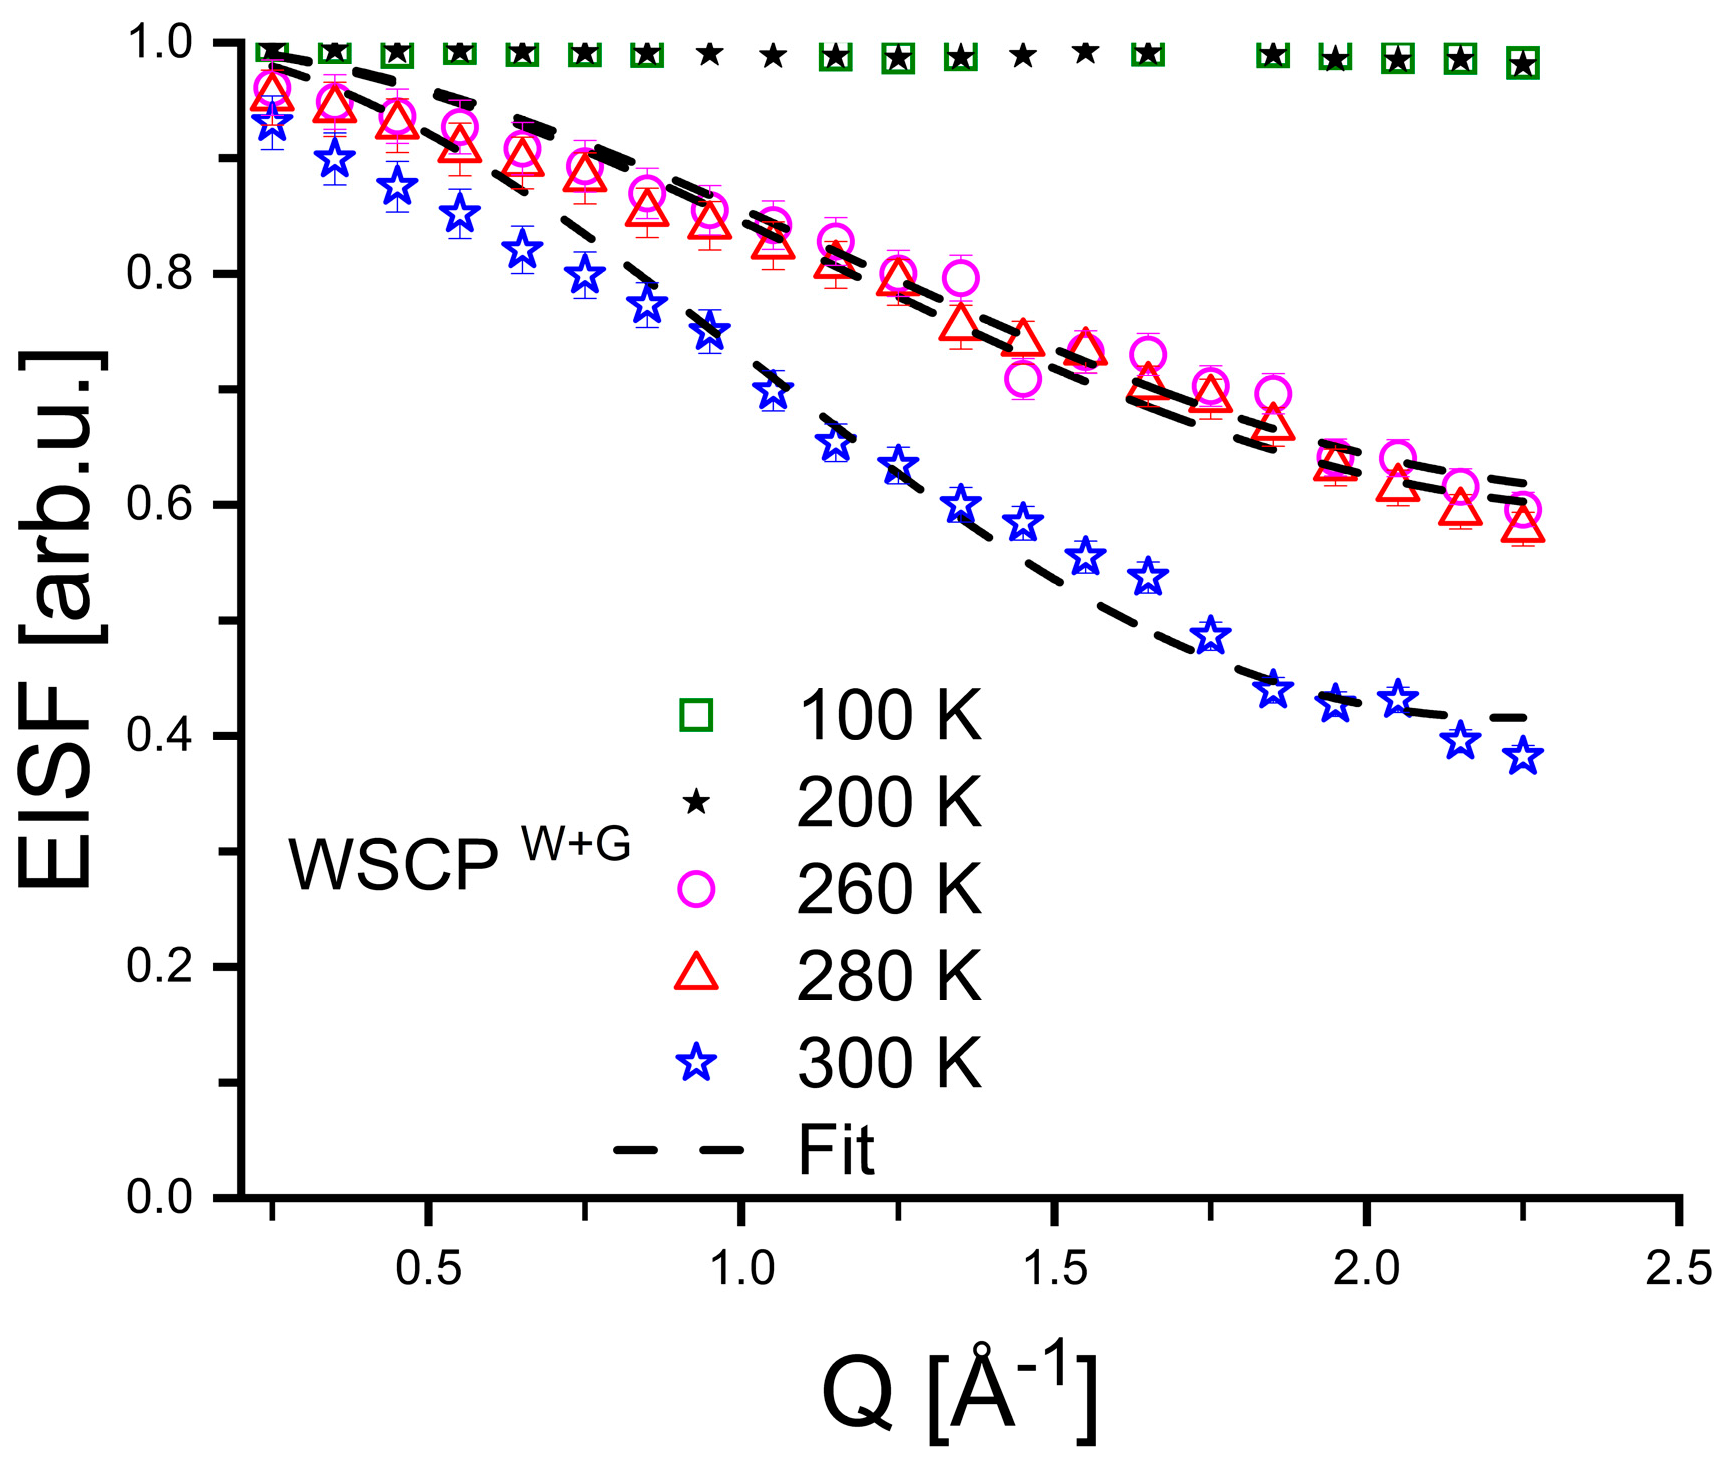
The EISF (which measures the ratio of elastic-to-total scattering intensities) was determined according to Equation (5) and is plotted as a function of temperature in Figure 6. This parameter provides insights into the fraction of hydrogen atoms involved in motion (f) and the corresponding radius of motion (r). At lower temperatures, the EISF values are relatively high, suggesting that a substantial number of hydrogen atoms remain immobile. As the temperature increases, the EISF values decrease, reflecting a greater fraction of mobile hydrogen atoms corresponding to a larger overall flexibility of the protein.
The radius of motion (r), derived from the EISF data by fitting a 4-fold jump model according to Equation (6), indicates that the protein’s hydrogen atoms exhibit a larger effective range of motion at elevated temperatures (Table 1), suggesting increased flexibility and dynamics in WSCPW+G. However, while the transition from 280 K to 300 K results in a noticeable increase in mobile hydrogen atoms and their motion radius, the change is less pronounced when the temperature increases from 260 K to 280 K.
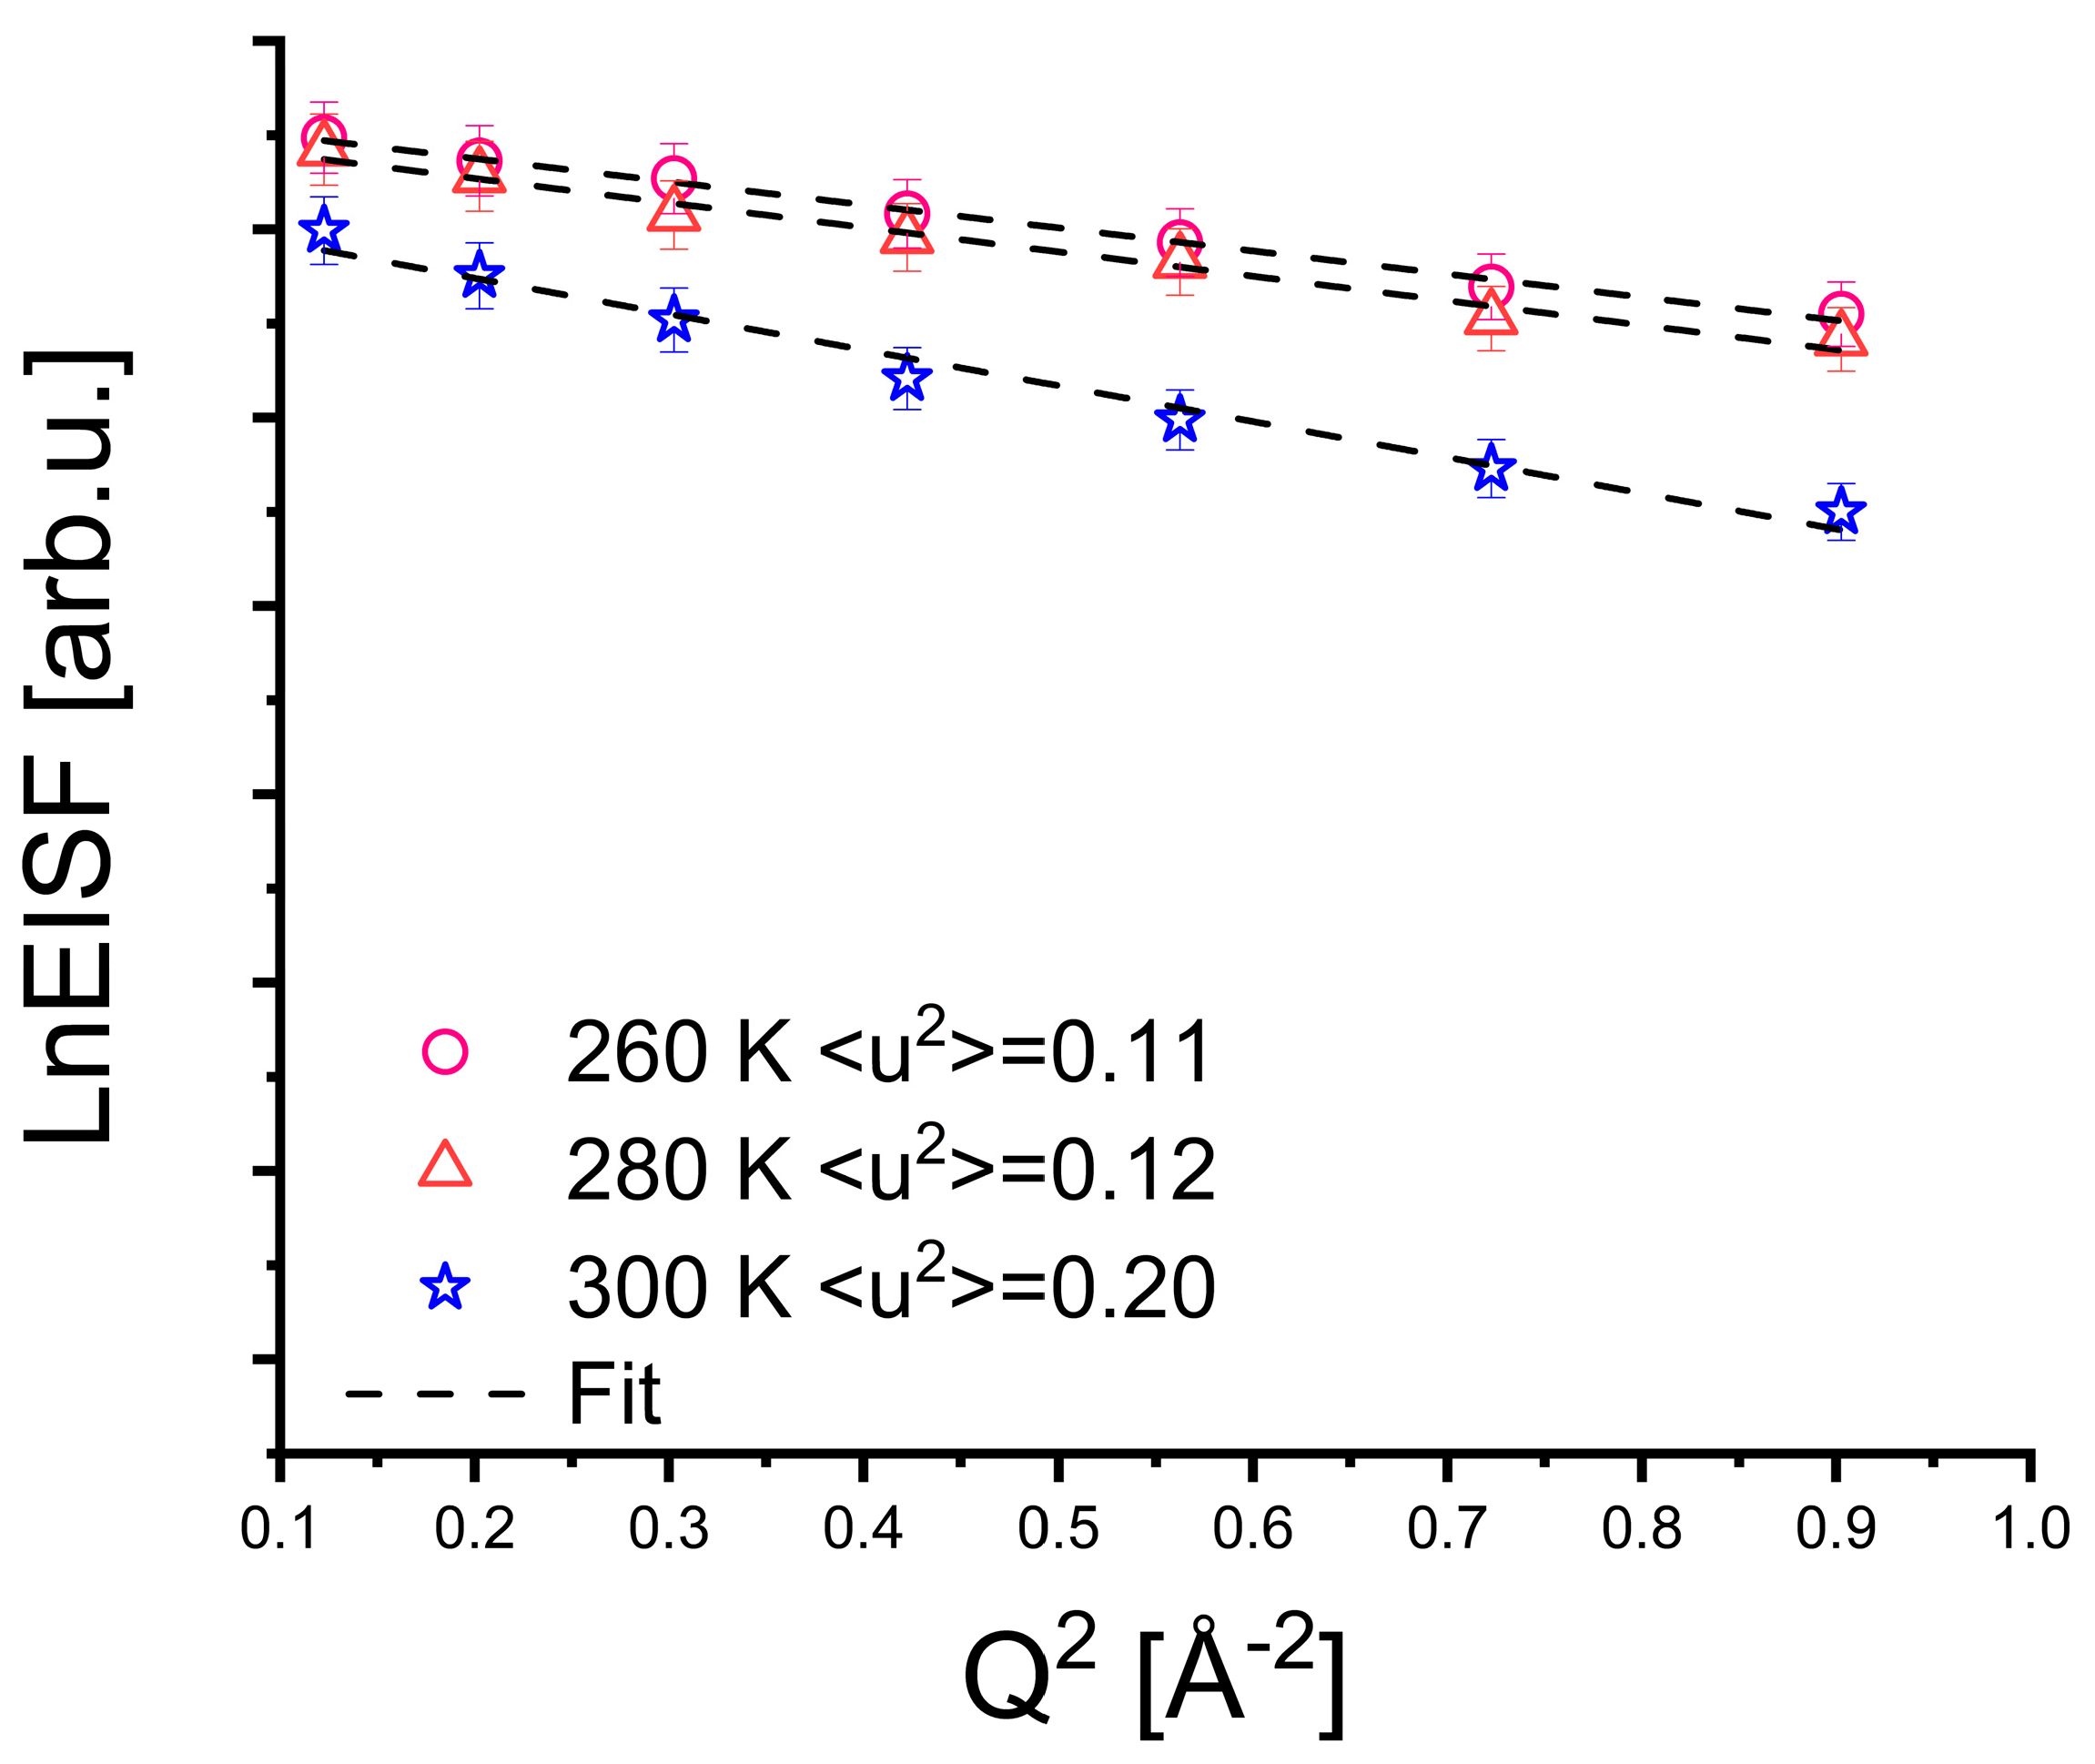
In the next step, we characterize the protein dynamics of WSCPW+G by using mean square displacement (MSD or ⟨u2⟩). MSD can be obtained as the slope of the natural logarithm of the EISF (lnEISF) as a function of Q2 at different temperatures [65]. The ⟨u2⟩ values visible as the slopes of the dashed lines in Figure 7 increase with temperature (see also Table 1), indicating greater atomic displacements and increased protein dynamics at higher temperatures. Similar to the general EISF trend, the ⟨u2⟩ values for 260 K and 280 K show minimal differences, whereas a stronger increase is observed when the temperature rises from 280 K to 300 K.
Origin of temperature dependence of protein dynamics: Several factors contribute to the temperature dependence of the flexibility of WSCPW+G. The increase in flexibility with the increase in temperature can be generally explained by the increasing thermal energy, which allows hydrogen atoms to overcome energy barriers that otherwise restrict their motion [12,66]. At 260 K, the thermal energy is relatively low, meaning that many hydrogen atoms remain confined to their initial positions [12]. Between 260 K and 280 K, the melting of the solvent allows for a noticeable enhancement in mobility, which is especially visible in the decrease in the residence time obtained from fits of the Q-dependence of the HWHM. However, from 280 K to 300 K, the additional thermal energy becomes sufficient to break more hydrogen bonds and disrupt local interactions, leading to a stronger increase in atomic motion. This is reflected in the pronounced decrease in EISF values, indicating a larger fraction of mobile hydrogen atoms, and the significant rise in MSD ⟨u2⟩ [30,67].
Furthermore, the protein itself undergoes structural changes with the increase in temperature. At lower temperatures, hydrogen-bond networks and van der Waals interactions stabilize a relatively rigid conformation. As the temperature rises, these non-covalent interactions weaken, allowing for greater conformational fluctuations and an expansion of the protein’s dynamic range [66]. This results in a larger effective radius of motion for hydrogen atoms, as observed from the EISF-derived radius values. The structural flexibility of WSCPW+G increases notably between 280 K and 300 K, whereas the transition from 260 K to 280 K shows a more gradual change.
Effect of glycerol: Another factor influencing the protein’s flexibility is the presence of glycerol in the solvent. At lower temperatures, the high viscosity of glycerol creates a rigid environment, which limits the diffusion of protein side chains, especially of those exposed to the solvent at the surface of the protein, and thus restricts the conformational flexibility of the protein. This viscosity effect effectively traps the hydrogen atoms in localized positions, leading to higher EISF values and smaller mean square displacements (⟨u2⟩). At temperatures below 280 K, the solvent remains highly viscous, acting as a molecular “cage” that slows down atomic motion. However, as the temperature rises, glycerol’s viscosity decreases significantly, reducing its resistance to diffusion and allowing for increased atomic displacement. This explains the steep increase in the jump diffusion constant D, as the hydrogen atoms can transition between different positions more frequently and with lower residence time [30,67].
Effects upon solvent melting: Between 260 and 280 K, a complex interplay among jump diffusion D, residence time τ, and ⟨u2⟩ is observed, which likely reflects changes in protein–solvent interactions upon solvent melting and, consequently, in the internal dynamics of WSCP as the temperature increases. On one hand, ⟨u2⟩ remains rather similar, indicating that the overall amplitude of atomic motions is rather constrained. However, the observed increase in D suggests that local jump motions become more frequent. This behavior implies that at lower temperatures, the protein is largely trapped in energy minima, and as the temperature increases within this range, the system begins to overcome small energy barriers, allowing for more localized diffusivity without significantly impacting the total displacement seen in ⟨u2⟩. Alongside this, the significant decrease in τ from 260 to 280 K confirms that jump motions happen more frequently, supporting the notion that the system transitions into a more flexible state while still mostly residing within localized energy wells.
In contrast, from 280 to 300 K, a significant increase in ⟨u2⟩ is observed, suggesting that larger-amplitude protein motions are activated, leading to enhanced flexibility. The continued rise in the D indicates that at higher temperatures, not only jump motions occur more frequently, but they may also span larger distances, further contributing to the increase in ⟨u2⟩. Interestingly, despite the persistent increase in jump diffusion, the residence time does not significantly decrease beyond 280 K, suggesting that the system has already transitioned from an activated barrier-crossing regime to a state where mobility is no longer restricted by local energy traps. This shift implies that the energy barriers that previously governed motion have been largely overcome, allowing diffusion to become more continuous rather than being dictated by residence times in local potential energy minima.
These findings suggest that below 280 K, motion remains constrained, and transitions occur as the system gradually overcomes local barriers, leading to a decrease in residence time and an increase in jump frequency. However, beyond 280 K, most barriers have been surpassed, and further temperature increases primarily enhance jump length. This decoupling of local dynamics and diffusion is evident in the distinction between the 260–280 K and 280–300 K regimes. In the lower-temperature range, localized motions increase, while in the higher-temperature range, protein diffusive dynamics become more fluid-like. A potential explanation for this transition lies in the role of the solvent, particularly glycerol, which stabilizes WSCP through a structured hydrogen-bond network. As temperature rises, viscosity decreases, facilitating larger-amplitude protein motions, which explains the observed increase in ⟨u2⟩. However, glycerol’s network may still moderate the frequency of local jumps, leading to the stabilization of residence time beyond 280 K.
These findings support a two-phase transition in WSCPW+G: an initial phase between 260 K and 280 K where motion becomes more frequent but remains spatially limited, followed by a second phase between 280 K and 300 K where both the amplitude and frequency of motion increase. This decoupling of residence time and amplitude of motion underscores the complex interplay of thermal activation, solvent viscosity, and structural flexibility in governing protein dynamics.
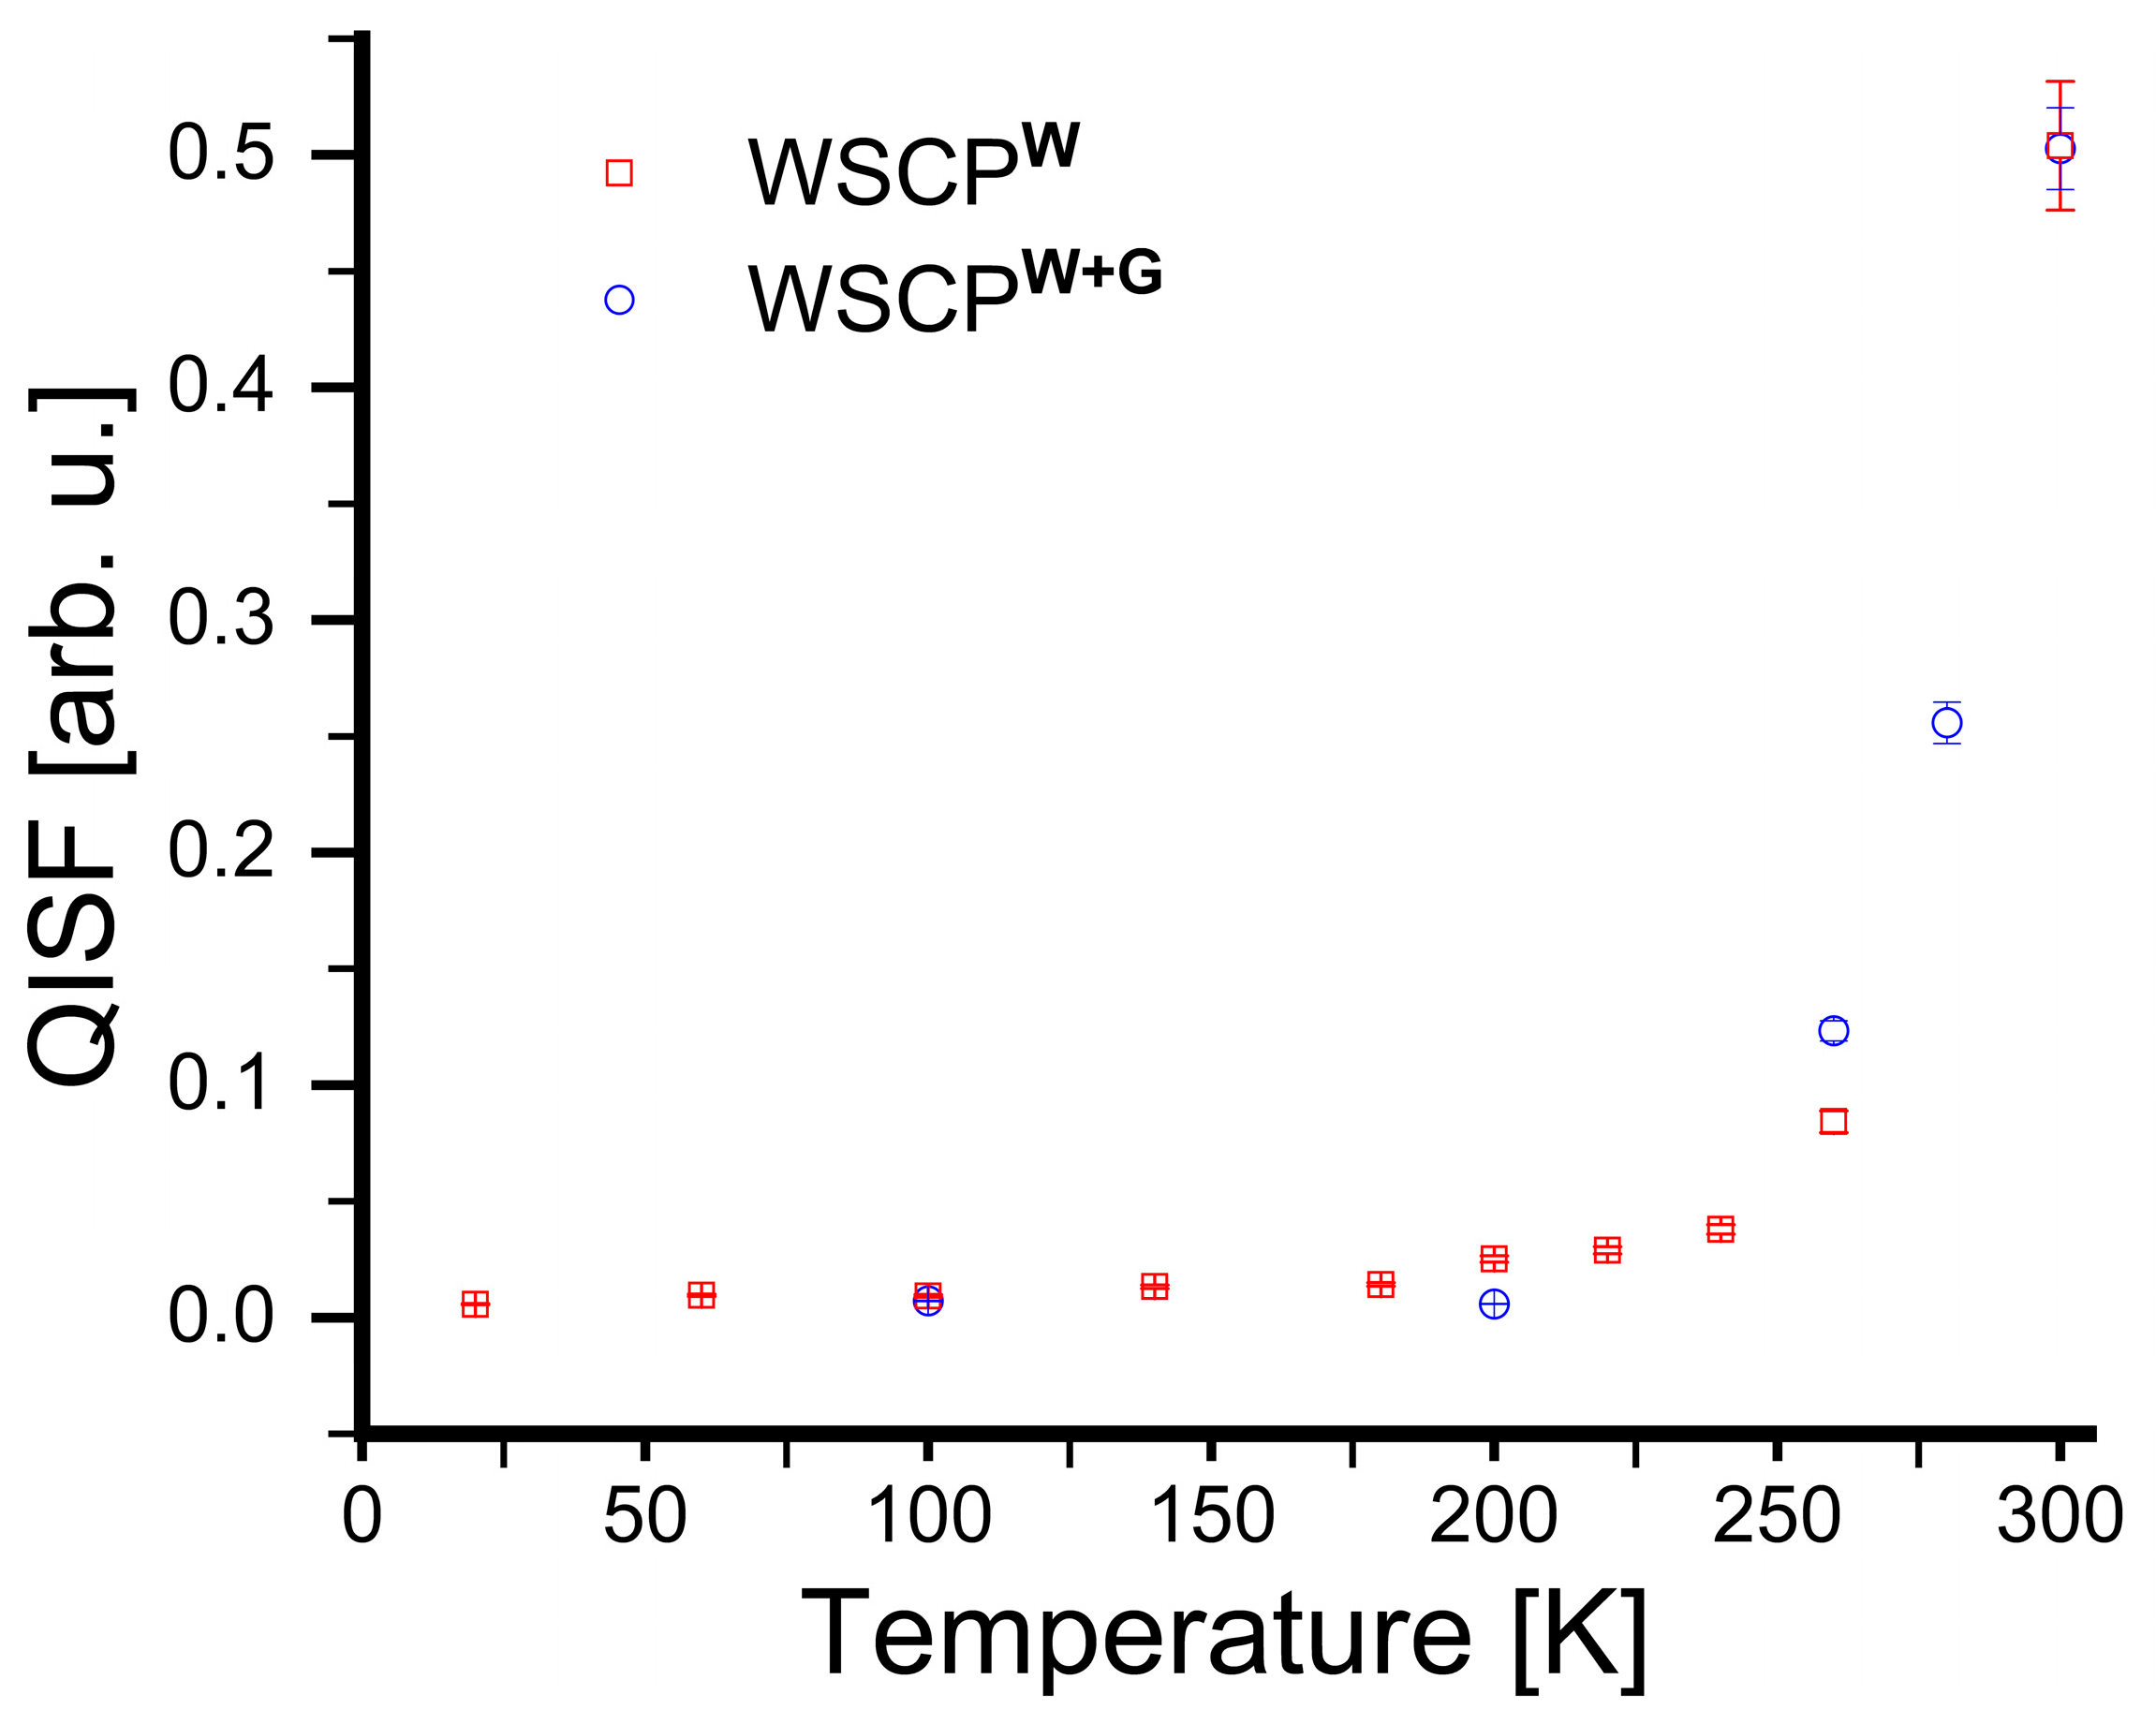
Comparison of WSCPW and WSCPW+G: The temperature-dependence of the QISF averaged over all Q is shown in Figure 8 for both WSCPW and WSCPW+G. Although data are not available for the same temperature values for both samples, a drastic increase in protein dynamics is visible above about 240 K, which was previously referred to as the “dynamical transition” and is observed in approximately the same range for several photosynthetic proteins [5,12,68,69].
At 100 K, the system is in the harmonic regime, where all motions are essentially frozen except for vibrational ones, resulting in negligible protein or solvent dynamics. As a result, the QISF values for WSCP in both pure water and water–glycerol are identical, indicating similar amplitudes of localized motions in both environments. This observation is consistent with the findings obtained by Caliskan et al. [70], whose study demonstrated that as the temperature decreases, the quasielastic scattering in the lysozyme–glycerol system decreases more rapidly than in the lysozyme–trehalose system. Their results suggest that protein dynamics in glycerol are more effectively suppressed upon cooling, leading to a sharper transition from a dynamic to a rigid state.
At 200 K, glycerol’s high viscosity and its extensive hydrogen-bond network act to more effectively restrict protein motions [24,25,26] compared to water, resulting in a lower QISF for WSCP in the glycerol-containing solution. This indicates reduced atomic displacements and suppressed internal dynamics in the presence of glycerol. This observation is consistent with previous findings, where the onset of solvent-coupled protein motion was found to occur at a higher temperature in glycerol solutions than in water [71]. Such behavior reflects glycerol’s greater ability to constrain molecular motions at low temperatures, contributing to its effectiveness as a cryoprotectant. This reduced QISF value at 200 K may also be attributed to the fact that the system is near the glass transition temperature (Tg) of glycerol, which is around 190 K [72]. Around this temperature, glycerol still behaves as a glassy matrix, suppressing molecular motions. As the temperature increases beyond 200 K, glycerol transitions into a supercooled viscous liquid, and by 260 K, it has fully melted. In this dynamic regime, β-relaxations begin to activate, allowing for enhanced internal flexibility within the protein. In contrast, water may still maintain a more structured hydration shell that slightly limits internal protein mobility. This results in a higher QISF for WSCPW+G compared with water at 260 K. Finally, at 300 K, the thermal energy is sufficient to overcome the restraining effects of both solvents, leading to a convergence of QISF values as protein mobility becomes comparable in both environments.
One way to rationalize this effect is by considering the local solvation effects and entropic contributions revealed by simulations [22]. In water–glycerol mixtures, glycerol molecules are not completely excluded from the protein solvation shell, even at moderate concentrations. Instead, they coexist with water near the protein surface, with their distribution being influenced by protein surface topology [22]. Glycerol is generally excluded from narrow cavities but tends to accumulate in broader surface regions. This selective distribution modulates the structure and dynamics of the hydration shell. Notably, glycerol disrupts the more ordered hydrogen-bond network of water, leading to faster local hydrogen dynamics. This manifests as an increase in the QISF, reflecting enhanced local mobility. At lower temperatures, this effect becomes more pronounced: although the bulk solvent remains viscous, the altered hydration environment near the protein promotes local flexibility. The heterogeneous interactions between the protein surface and the mixed solvent thus sustain mobility through the facilitated jump diffusion of hydrogen atoms, despite the otherwise restrictive conditions.
An alternative explanation may be found in a drastic restriction of molecular dynamics as it has been reported for PSII membrane fragments upon the freezing of the solvent below ~276 K [68]. This effect was associated with a substantial aggregation of PSII membrane fragments induced by the formation of ice. Then, it is reasonable to assume that the motional freedom of a protein or membrane becomes restricted due to the congestion with neighboring molecules causing a suppression of the observed MSD. In the present case of WSCP, such suppression of mobility at low temperatures would primarily affect the QISFs of WSCPW, where the formation of structured or even partially frozen hydration layers may reduce internal dynamics. In contrast, glycerol in the WSCPW+G sample acts as a cryoprotectant, preventing ice formation and maintaining the protein in a more hydrated and flexible environment. This behavior is particularly relevant around the glass transition temperature of glycerol (~190 K), where glycerol transitions from a rigid to a more dynamic matrix. As a result, lower QISF values are observed for WSCPW+G at 200 K, while higher QISF values are measured for WSCPW+G once glycerol has entered its melted, dynamic state. These findings highlight the importance of using cryoprotectants such as glycerol for low-temperature QENS studies of proteins in solution, as they help preserve internal mobility and provide a more physiologically relevant dynamical picture.
This adds to the complexity of low-temperature studies in proteins that cold denaturation or damage due to ice crystals may generally be possible [73]. At this stage, we do not have indications for such effects in the case of WSCP. Data from various types of optical spectroscopy indicate that the protein remains intact at very low temperature, although this can only be concluded using the pigment molecules bound by WSCP as a probe for structural integrity [45,46,47,48]. While most of the latter studies were performed using cryoprotectants as glass formers (especially glycerol), fluorescence spectroscopy [45] does not require glycerol and would be sensitive to changes in the tertiary structure of proteins. Therefore, we assume that both WSCPW and WSCPW+G are not affected by cold denaturation nor by damage due to ice crystals.
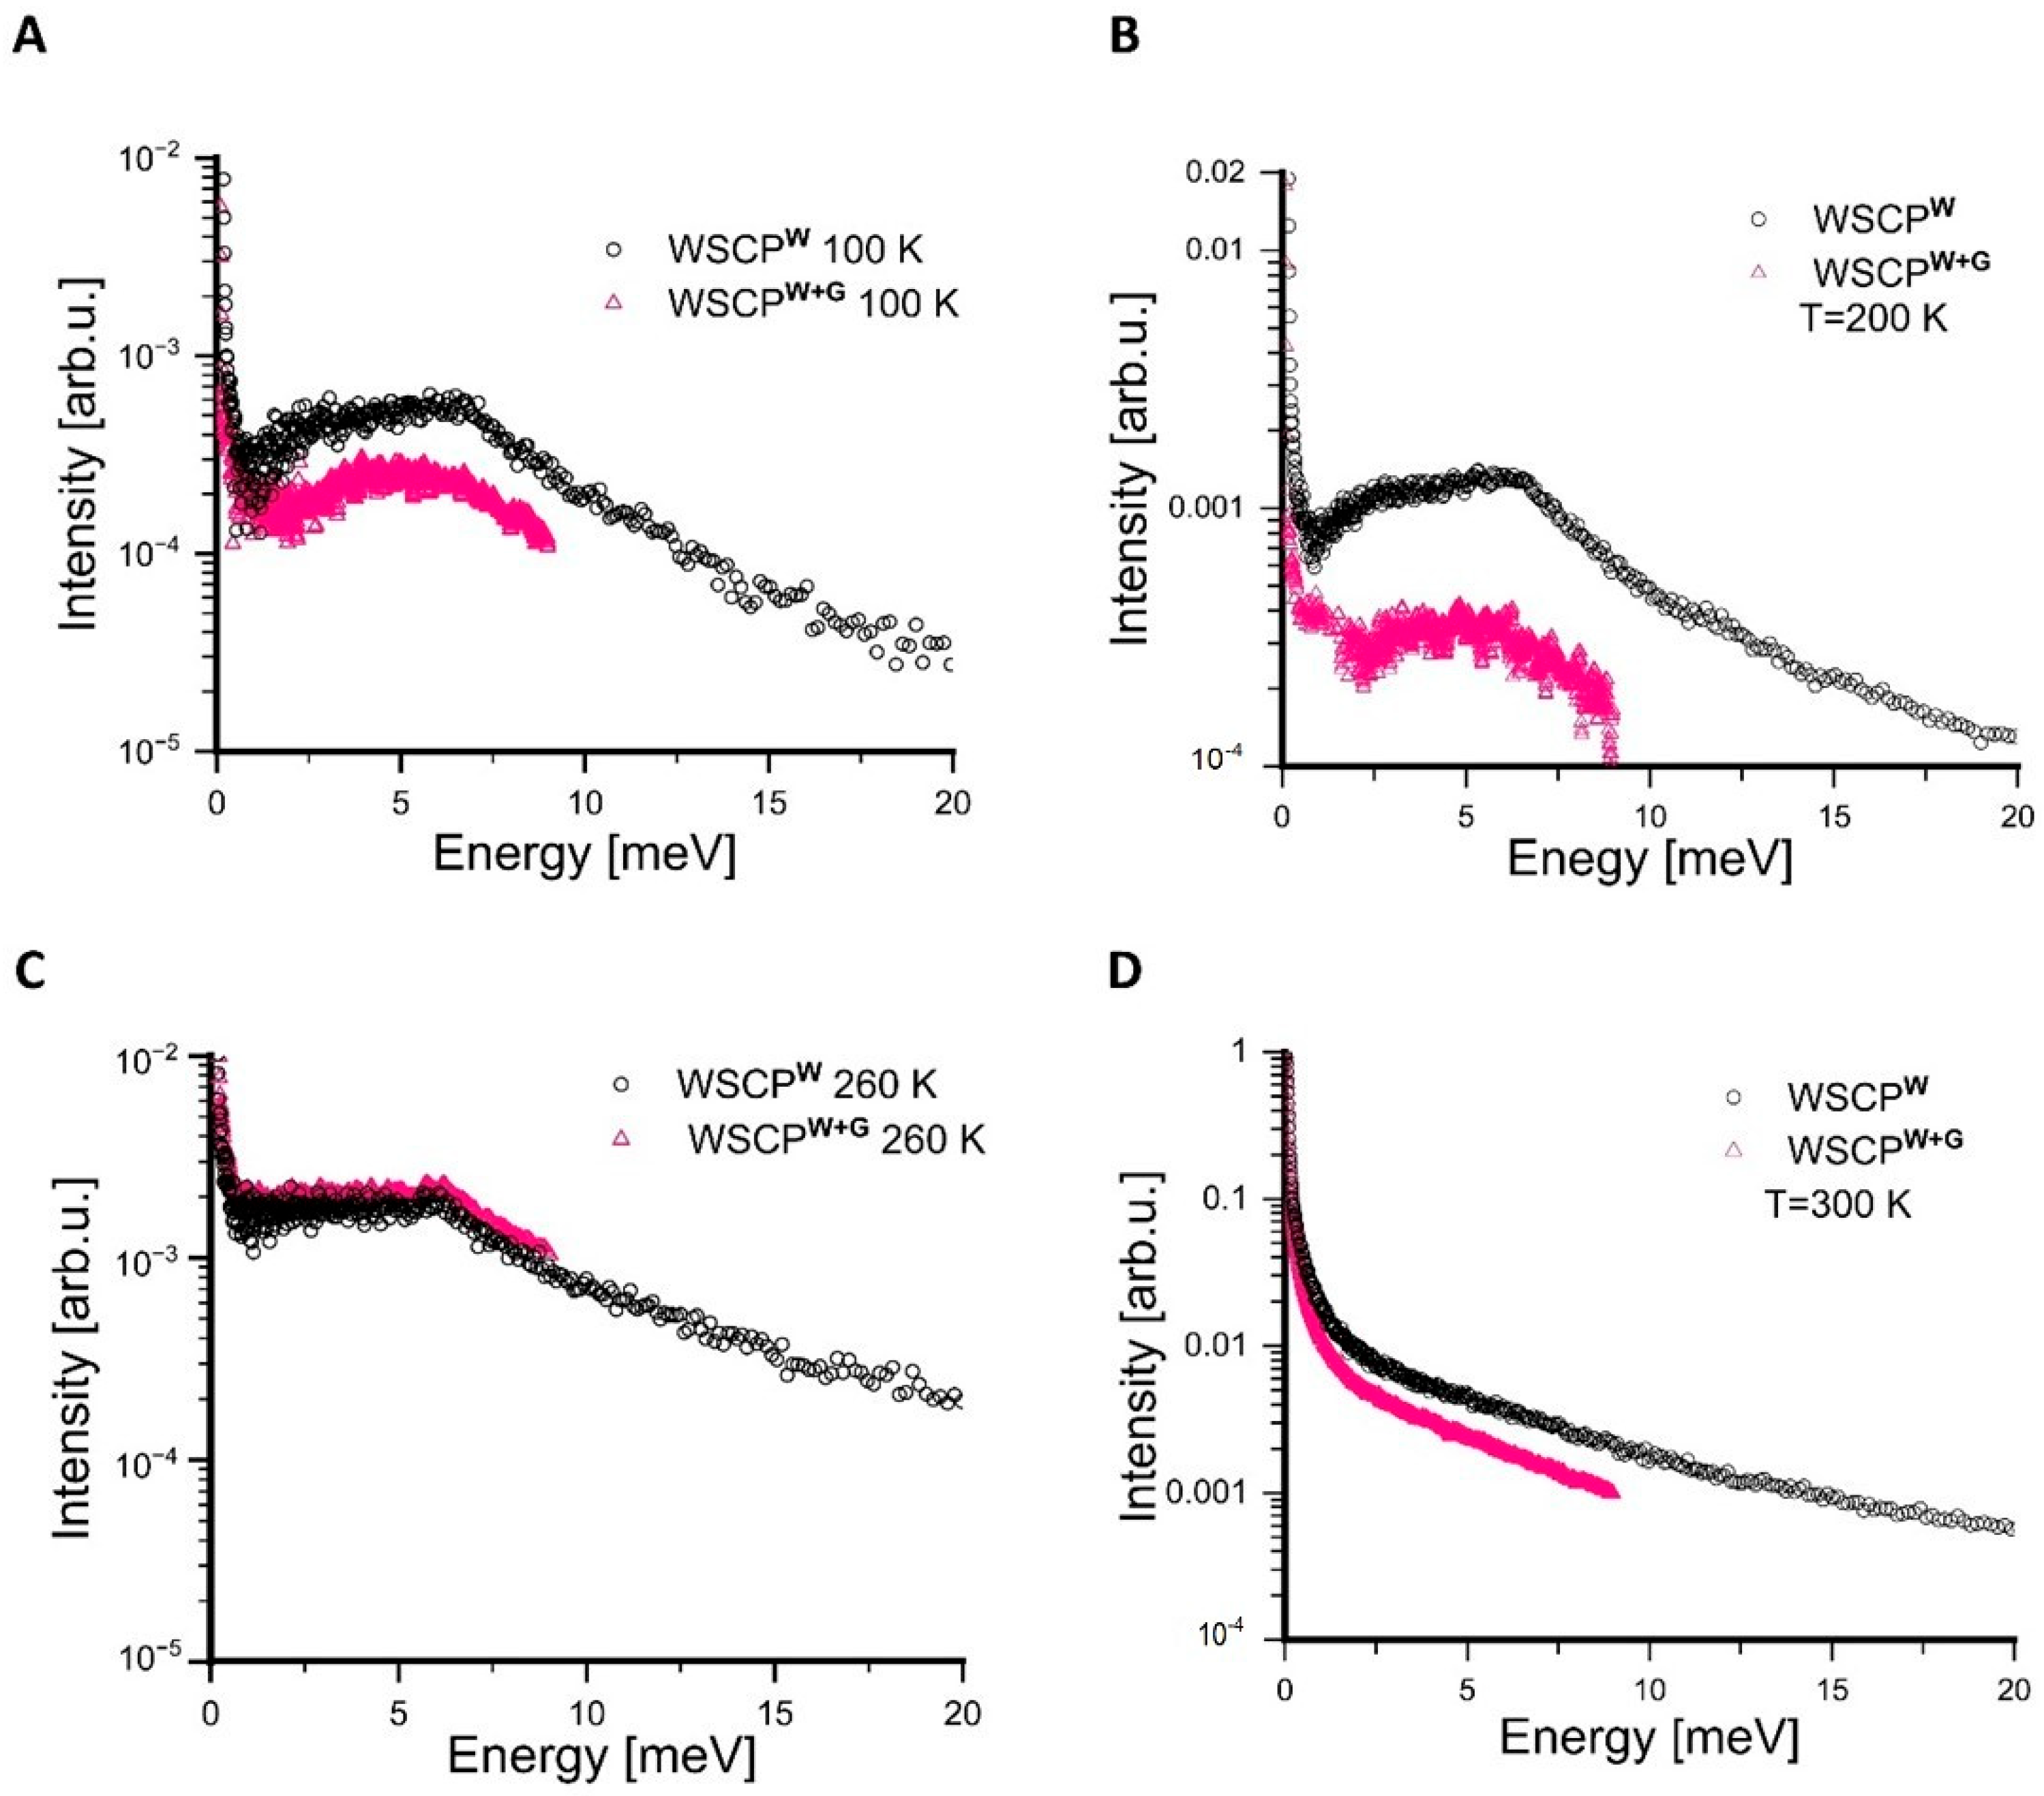
INS experiments: INS is a crucial technique for probing the vibrational dynamics of proteins based on their vibrational spectra [53]. It is particularly valuable for studying proteins like WSCP, as it allows us to examine how different environments—such as water and glycerol—and variations in temperature influence protein dynamics. The INS spectra of WSCPW and WSCPW+G are compared in Figure 9 for four selected temperature values. A closer inspection of the data reveals that the INS spectra do vary with temperature but also with the environment.
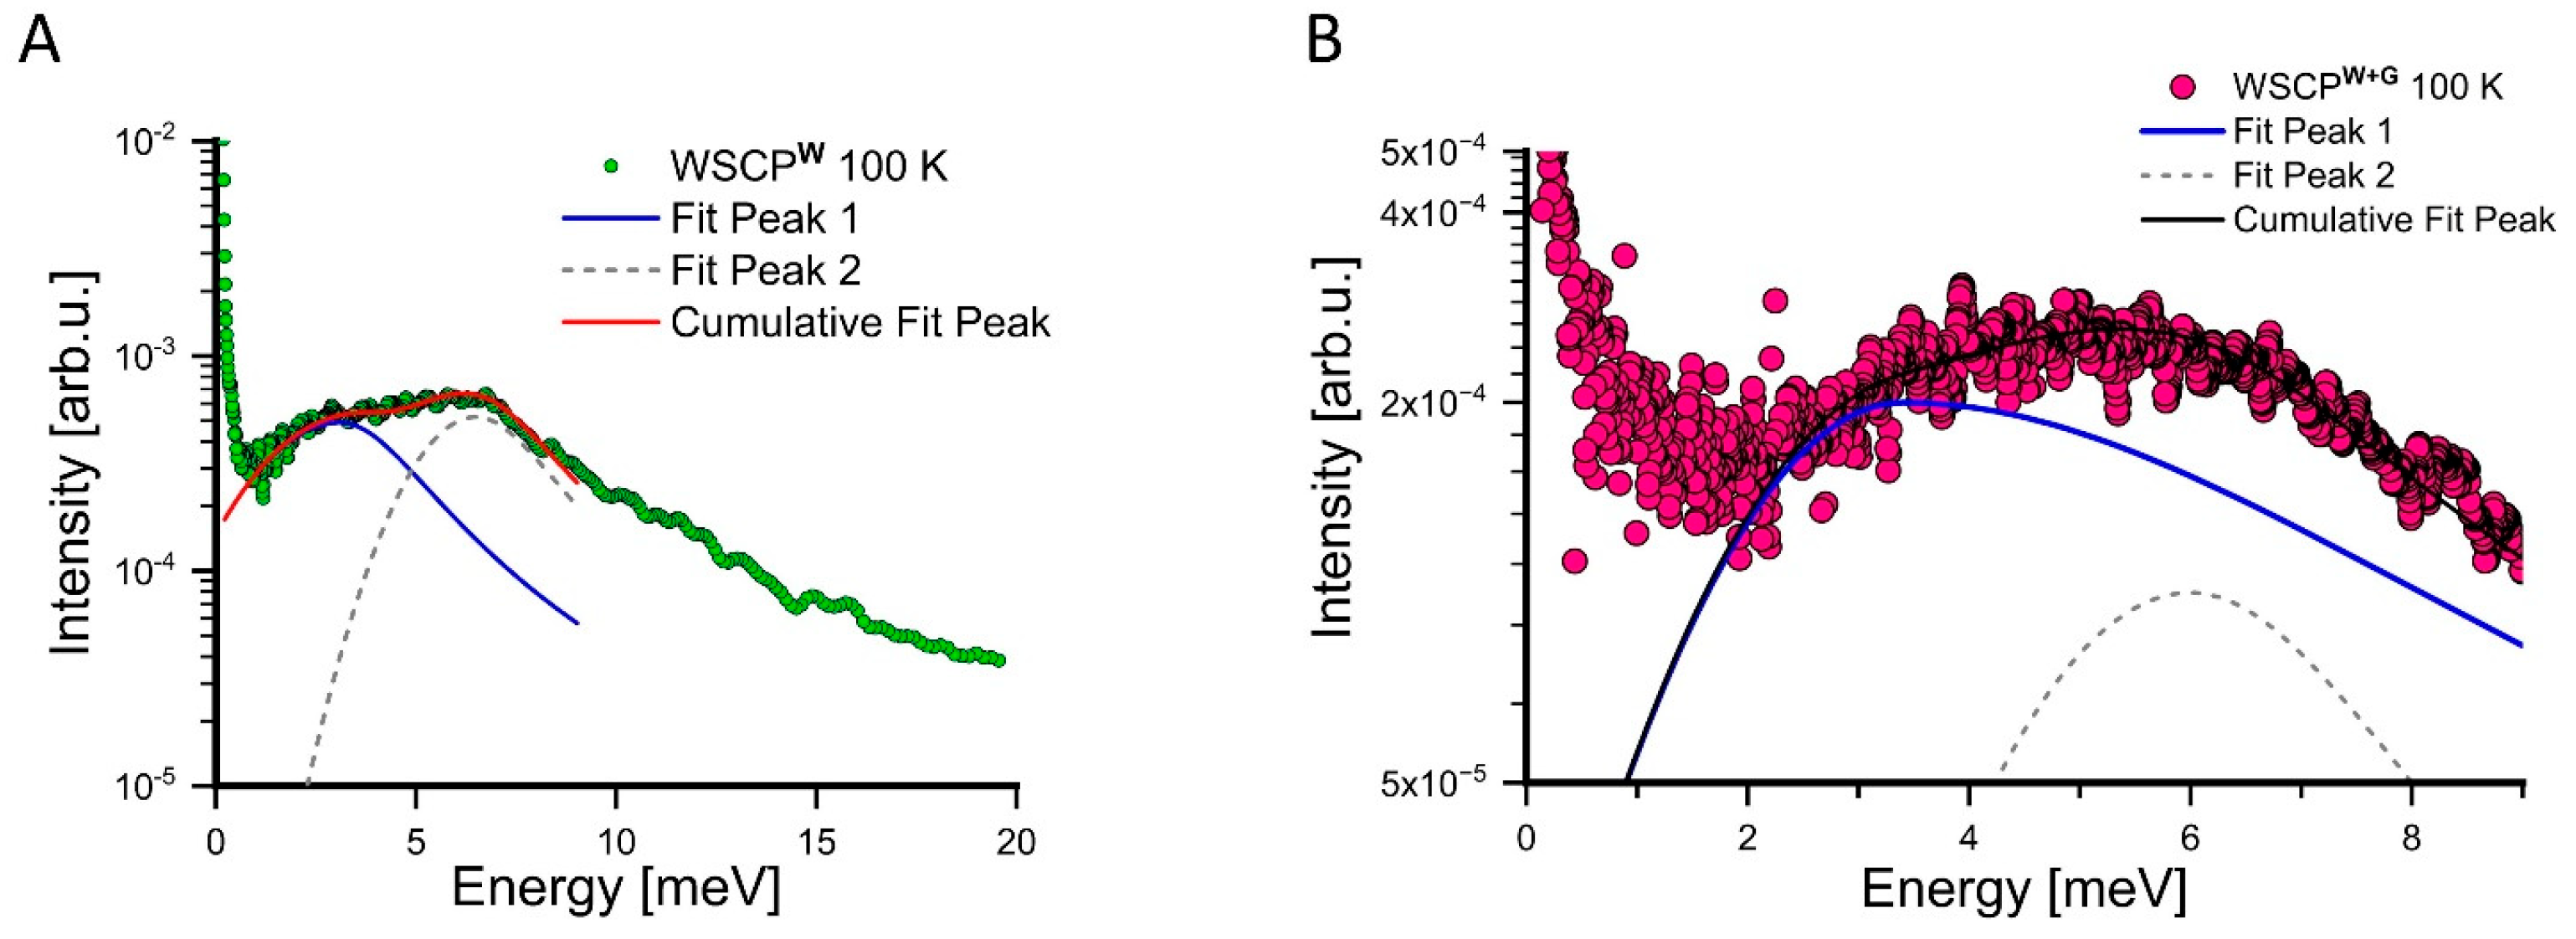
The vibrational spectra obtained in our study—often referred to as the Boson peaks [5,16]—were fitted using appropriate models to extract the positions and intensities of the peaks visible in the spectra (see Figure 10). It has to be mentioned that the vibrational spectra are broad, asymmetric, and widely featureless, because they correspond to a large manifold of individual, energetically closely spaced vibrational modes [5,16]. Nevertheless, in the case of WSCP, the fitted spectra reveal up to two visible peaks, especially in the case of WSCPW, referred to hereafter as Peak 1 and Peak 2. This means that the INS spectra of WSCP are more structured than usually observed for proteins. As a consequence, all spectra were fitted with two asymmetric line shapes consisting of a Gaussian and a Lorentzian shape on the low- and high-energy sides, respectively. Key fitting parameters, such as peak positions and line widths, were analyzed to assess the impact of temperature and glycerol on the vibrational behavior of WSCP. The set of fitting parameters is presented in Table 2 for WSCPW and in Table 3 for WSCPW+G. These parameters include the peak positions (Xc1 for Peak 1 and Xc2 for Peak 2), the Gaussian and Lorentzian width components (Wg and Wl), and the integrated area under each peak (A). To improve the robustness of the fitting process, Wg1 and Wg2 were held constant in both samples, along with the position of the second peak.
In the INS experiments, the Boson peak corresponds to low-energy vibrational modes associated with collective motions in disordered systems, such as proteins in solutions. A key feature observed in our study was the presence of rather structured Boson peaks in both WSCPW and WSCPW+G. However, their position and intensity differed significantly depending on the temperature and on the solvent environment (see Table 2 and Table 3).
When comparing WSCPW vs. WSCPW+G, the first peak shifts to higher energy in glycerol, meaning these low-energy vibrations become stiffer. This is likely due to glycerol’s stabilizing effect, where its hydrogen-bond network restricts the protein’s flexibility and increases the energy required to activate these modes. In contrast, water provides a more dynamic hydration environment, allowing for greater vibrational flexibility and thus lower Boson peak energy. In addition, the intensity of the Boson peak decreases in the glycerol–water mixture compared with the water environment alone, suggesting again that an aqueous environment permits greater vibrational flexibility and thus enhances the scattering signal from low-energy vibrations.
When increasing the temperature in both WSCPW and WSCPW+G systems, the first Boson peak shifts to lower energy (this trend is particularly evident in WSCPW+G, where the peak position drops from 2.5 meV at 260 K to 1.5 meV at 300 K), indicating that the vibrational modes are becoming softer as thermal motion increases. This suggests that higher temperatures reduce the rigidity of the protein–solvent system, allowing for greater atomic displacements and lower vibrational frequencies. Similar effects were reported for PSII [5] and LHCII [39]. Simultaneously, the intensity of the first Boson peak increases with temperature, which is expected due to the higher thermal population of vibrational states [74], leading to increased inelastic scattering.
It is remarkable that the general positions of the two inelastic peaks observed for WSCP at low temperatures, i.e., about 3 and about 6 meV, agree well with vibrational features observed in selective optical spectroscopy [75]. However, the latter types of spectroscopy, called Fluorescence Line Narrowing (FLN) [75] and Spectral Hole Burning (SHB) [48], are restricted to temperatures below about 40 K and are mostly performed at 4.2 k or lower only. This means that temperature dependence of vibrational dynamics—as observed here-—is not accessible to these methods.
In general, in pigment–protein complexes like WSCP, vibrational features can arise from both components, from the larger protein, or from the much smaller pigment molecules. It is generally accepted that chlorophyl vibrations are mostly highly localized and observed at rather high energies between about 800 and 2000 cm−1 (roughly 100–250 meV) [76], while the rather delocalized vibrations of the protein are found at lower energies in the range of the Boson peak (roughly 1–20 meV) [77]. Therefore, the two different peaks observed for WSCP were previously assigned to protein vibrations delocalized either over all four or just two protein subunits of the WSCP tetramer [75]. This would also be consistent with the second peak at about 6 meV appearing like an overtone of the first one at about 3 meV. While this interpretation still appears reasonable, there may also be more delocalized vibrational modes of the pigment molecules, e.g., skeletal motions involving the whole chlorophyll macrocycle or stretching and bending modes of the chlorophyll structure, which may extend into the 40–60 cm−1 frequency range (approximately 5–7 meV) [78,79]. If so, the second boson peak in WSCP may reflect a combination of intrinsic protein vibrations and delocalized chlorophyll dynamics. It has to be added that proper knowledge about the vibrational density of states of photosynthetic pigment–protein complexes is crucial to a decent understanding of light-harvesting and energy transfer processes in photosynthesis.

4. Discussion

The analysis of localized conformational and vibrational dynamics of WSCP in aqueous solution and a glycerol–water mixture highlights the crucial role of glycerol in shaping the protein’s dynamical behavior. One of the most striking observations is that while the jump diffusion constant D continues to change with the increase in temperature, the residence time τ stabilizes between 280 K and 300 K. This apparent decoupling is a direct consequence of glycerol’s physical properties, particularly its high viscosity and strong hydrogen-bond network [15], which remain relatively stable over this temperature range. Diffusion is generally governed by the viscosity of the surrounding medium, with lower-viscosity solvents like water allowing for greater molecular mobility. In contrast, glycerol introduces significant resistance to diffusion due to its high viscosity and its dense, structured nature [80]. At lower temperatures (below 260 K), the system is largely frozen, and only small-scale localized motions are possible [68]. As the temperature rises to 300 K, thermal energy enables the protein to partially overcome glycerol’s viscosity, [81], resulting in an increase in D and a concurrent decrease in τ, consistent with the expected effects of thermal agitation. However, between 280 K and 300 K, τ stabilizes, indicating that the protein’s mobility is no longer dictated purely by thermal energy but is increasingly constrained by glycerol’s viscosity. Even as the temperature rises, the resistance imposed by glycerol prevents further acceleration of the protein’s diffusion.
This restriction can be attributed to glycerol’s interaction with the protein surface. Glycerol forms hydrogen bonds with water, effectively replacing water–water hydrogen bonds and allowing water to retain its full hydrogen-bond capacity regardless of glycerol concentration [82]. In doing so, glycerol alters the hydration dynamics around the protein and limits its ability to diffuse freely by creating a more constrained and structured solvent environment. This explains why jump diffusion appears suppressed while localized internal motions persist. While the bulk solvent may limit diffusion, the protein retains significant internal flexibility, as water molecules still mediate localized motions. This observation aligns with the concept of preferential hydration, where water molecules remain in specific regions of the protein despite the presence of glycerol, allowing internal side-chain reorientations and other localized motions to continue. This selective impact of glycerol is consistent with previous findings by Paciaroni [16]. A key factor contributing to this behavior is the “caging” effect of glycerol, which arises from its extensive hydrogen bonding with water and the protein’s surface residues [83]. This creates a microenvironment where the protein experiences strong viscous resistance. At 280 K, the protein acquires enough thermal energy to partially escape this “cage,” [83,84], allowing D to increase. However, at higher temperatures, glycerol remains sufficiently viscous to prevent further diffusion, leading to the stabilization of τ. This effect primarily influences the diffusive molecular motions that are described in QENS experiments. Conversely, smaller-scale localized dynamics, such as internal side-chain rotations and backbone fluctuations, remain largely unaffected by glycerol’s viscosity. These motions, reflected in the f and r parameters, continue to increase with temperature, as they are driven more by local hydration effects than by bulk solvent viscosity.
This decoupling between diffusion and localized protein dynamics underscores glycerol’s selective impact: it acts as a damping agent for diffusive molecular motions while allowing internal flexibility to persist, particularly above its glass transition temperature. It is important to note that in QENS experiments, the QISF primarily reflects hydrogen atom dynamics [85], due to the dominant incoherent scattering cross-section of hydrogen. Therefore, the observed increase in the QISF for WSCP in water–glycerol mixtures at 260 K may not solely reflect enhanced protein mobility but could also arise from the contribution of mobile hydrogen atoms in glycerol itself. Since glycerol contains multiple hydroxyl groups and contributes significantly to the total hydrogen content in the sample, its local motions (especially reorientational dynamics and internal rotations) can influence the QENS signal. At 200 K, the lower QISF in the glycerol-containing sample may reflect the fact that the system is near the glass transition temperature of glycerol (~190 K), where molecular motions are still suppressed. Once glycerol enters its dynamic regime above Tg, its combined effect (modifying the hydration shell and contributing mobile hydrogens) may account for the elevated QISF at 260 K. At 300 K, the convergence of QISF values between both solvent systems likely reflects a regime in which protein and solvent dynamics are both sufficiently fast and indistinguishable within the resolution of the experiment.
The INS spectra revealed significant shifts in the positions and intensities of vibrational peaks, indicating that the protein’s vibrational behavior is strongly dependent on its solvent environment. The first key observation is that Peak 1 in the INS spectra consistently appears at higher energies in glycerol than in water (Figure 9). This suggests that the structured glycerol environment imposes greater constraints on the protein’s flexibility, effectively creating a stiffer vibrational landscape. Glycerol’s high viscosity and extensive hydrogen-bond network restrict large-scale, low-frequency collective motions, leading to an overall increase in vibrational frequencies.
In contrast, water provides a lower-viscosity, more dynamic environment, allowing the protein to exhibit greater flexibility. The lower energy peaks observed in water correspond to softer, low-frequency vibrations, reflecting a system where the protein–solvent interface is more dynamic and the protein can undergo larger-scale atomic motions. These findings underscore the crucial role of solvent choice in modulating protein dynamics. The interplay of viscosity, hydrogen bonding, and hydration dynamics determines how proteins behave in different environments, offering important insights into solvent effects on biomolecular function and stability.

Author Contributions

Conceptualization and Conceptualization, M.G. and J.P.; Methodology, M.H., M.G., I.B., L.L.R., J.P.E., W.L., H. P. and J.P.; Formal analysis, M.H. and M.G.; Investigation, M.H., M.G., I.B., L.L.R., J.P.E., W.L., H.P. and J.P.; Writing—original draft, M.H.; Writing—review and editing, J.P.; Supervision, M.G. and J.P.; Project administration, J.P. All authors have read and agreed to the published version of the manuscript.

Funding

This work was supported by the Estonian Research Council grant (PRG 2772).

Data Availability Statement

The original contributions presented in the study are included in the article, and further inquiries can be directed to the corresponding author.

Acknowledgments

The authors gratefully acknowledge the allocation of beamtime on the Spectrometer TofTof at MLZ, Garching, Germany, and on the spectrometer Focus at the PSI, Villigen, Switzerland.

Conflicts of Interest

The authors declare no conflicts of interest.

Abbreviations

The following abbreviations are used in this manuscript:
NSneutron scattering
MSDmean square displacement
WSCPWater-Soluble Chlorophyll-Binding Protein
WSCPWWSCP in water
WSCPW+GWSCP in water and glycerol
INSInelastic Neutron Scattering
QENSQuasielastic Neutron Scattering
FWHMfull width at half maximum
HWHMhalf width at half maximum
EISFelastic incoherent structure factor
QISFquasielastic incoherent structure factor
τresidence time
Djump diffusion constant
ffraction of hydrogen atoms involved in motion
rradius of motion
lnEISFlogarithm of the EISF
Chl chlorophyll

References

  1. Nam, K.; Wolf-Watz, M. Protein dynamics: The future is bright and complicated! Struct. Dyn. 2023, 10, 014301. [Google Scholar] [CrossRef] [PubMed]
  2. Cornicchi, E.; Cinelli, S.; Natali, F.; Onori, G.; Paciaroni, A. Elastic neutron scattering study of proton dynamics in glycerol. Phys. B Condens. Matter 2004, 350, E951–E954. [Google Scholar] [CrossRef]
  3. Matveev, Y.I.; Grinberg, V.Y.; Tolstoguzov, V. The plasticizing effect of water on proteins, polysaccharides and their mixtures. Glassy state of biopolymers, food and seeds. Food Hydrocoll. 2000, 14, 425–437. [Google Scholar] [CrossRef]
  4. Kaushik, J.K.; Bhat, R. Thermal stability of proteins in aqueous polyol solutions: Role of the surface tension of water in the stabilizing effect of polyols. J. Phys. Chem. B 1998, 102, 7058–7066. [Google Scholar] [CrossRef]
  5. Pieper, J.; Trapp, M.; Skomorokhov, A.; Natkaniec, I.; Peters, J.; Renger, G. Temperature–dependent vibrational and conformational dynamics of photosystem II membrane fragments from spinach investigated by elastic and inelastic neutron scattering. Biochim. Biophys. Acta (BBA)-Bioenerg. 2012, 1817, 1213–1219. [Google Scholar] [CrossRef]
  6. Jang, K.; Kim, H.G.; Hlaing, S.H.S.; Kang, M.; Choe, H.-W.; Kim, Y.J. A short review on cryoprotectants for 3D protein structure analysis. Crystals 2022, 12, 138. [Google Scholar] [CrossRef]
  7. De Graaf, L.A. Denaturation of proteins from a non-food perspective. J. Biotechnol. 2000, 79, 299–306. [Google Scholar] [CrossRef]
  8. Levine, H.; Slade, L. Water as a plasticizer: Physico-chemical aspects of low-moisture polymeric systems. Water Sci. Rev. 1988, 3, 79–185. [Google Scholar]
  9. Gabel, F.; Bicout, D.; Lehnert, U.; Tehei, M.; Weik, M.; Zaccai, G. Protein dynamics studied by neutron scattering. Q. Rev. Biophys. 2002, 35, 327–367. [Google Scholar] [CrossRef]
  10. Fitter, J. Conformational dynamics of a protein in the folded and the unfolded state. Chem. Phys. 2003, 292, 405–411. [Google Scholar] [CrossRef]
  11. Sacquin-Mora, S.; Sebban, P.; Derrien, V.; Frick, B.; Lavery, R.; Alba-Simionesco, C. Probing the flexibility of the bacterial reaction center: The wild-type protein is more rigid than two site-specific mutants. Biochemistry 2007, 46, 14960–14968. [Google Scholar] [CrossRef] [PubMed]
  12. Lehnert, U.; Reat, V.; Weik, M.; Zaccai, G.; Pfister, C. Thermal motions in bacteriorhodopsin at different hydration levels studied by neutron scattering: Correlation with kinetics and light-induced conformational changes. Biophys. J. 1998, 75, 1945–1952. [Google Scholar] [CrossRef] [PubMed]
  13. Krieger-Liszkay, A.; Fufezan, C.; Trebst, A. Singlet oxygen production in photosystem II and related protection mechanism. Photosynth. Res. 2008, 98, 551–564. [Google Scholar] [CrossRef] [PubMed]
  14. Hill, J.J.; Shalaev, E.Y.; Zografi, G. Thermodynamic and dynamic factors involved in the stability of native protein structure in amorphous solids in relation to levels of hydration. J. Pharm. Sci. 2005, 94, 1636–1667. [Google Scholar] [CrossRef]
  15. Ali, F.; Manzoor, U.; Khan, F.I.; Lai, D.; Khan, M.K.A.; Chandrashekharaiah, K.; Singh, L.R.; Dar, T.A. Effect of polyol osmolytes on the structure-function integrity and aggregation propensity of catalase: A comprehensive study based on spectroscopic and molecular dynamic simulation measurements. Int. J. Biol. Macromol. 2022, 209, 198–210. [Google Scholar] [CrossRef]
  16. Paciaroni, A.; Orecchini, A.; Cinelli, S.; Onori, G.; Lechner, R.; Pieper, J. Protein dynamics on the picosecond timescale as affected by the environment: A quasielastic neutron scattering study. Chem. Phys. 2003, 292, 397–404. [Google Scholar] [CrossRef]
  17. Gekko, K.; Timasheff, S.N. Thermodynamic and kinetic examination of protein stabilization by glycerol. Biochemistry 1981, 20, 4677–4686. [Google Scholar] [CrossRef]
  18. Zachariassen, K.E. The mechanism of the cryoprotective effect of glycerol in beetles tolerant to freezing. J. Insect Physiol. 1979, 25, 29–32. [Google Scholar] [CrossRef]
  19. Mitchell, D.E.; Fayter, A.E.; Deller, R.C.; Hasan, M.; Gutierrez-Marcos, J.; Gibson, M.I. Ice-recrystallization inhibiting polymers protect proteins against freeze-stress and enable glycerol-free cryostorage. Mater. Horiz. 2019, 6, 364–368. [Google Scholar] [CrossRef]
  20. Ye, Y.; Zheng, L.; Hong, L.; García Sakai, V.; de Souza, N.R.; Teng, D.; Wu, B.; Xu, Y.; Cai, J.; Liu, Z. Direct Observation of the Mutual Coupling Effect in the Protein–Water–Glycerol Mixture by Combining Neutron Scattering and Selective Deuteration. J. Phys. Chem. B 2024, 128, 405–414. [Google Scholar] [CrossRef]
  21. Liu, Z.; Yang, W.; Wei, H.; Deng, S.; Yu, X.; Huang, T. The mechanisms and applications of cryoprotectants in aquatic products: An overview. Food Chem. 2023, 408, 135202. [Google Scholar] [CrossRef] [PubMed]
  22. Chéron, N.; Naepels, M.; Pluhařová, E.; Laage, D. Protein preferential solvation in water: Glycerol mixtures. J. Phys. Chem. B 2020, 124, 1424–1437. [Google Scholar] [CrossRef] [PubMed]
  23. Gekko, K.; Timasheff, S.N. Mechanism of protein stabilization by glycerol: Preferential hydration in glycerol-water mixtures. Biochemistry 1981, 20, 4667–4676. [Google Scholar] [CrossRef] [PubMed]
  24. Hirai, M.; Ajito, S.; Sugiyama, M.; Iwase, H.; Takata, S.-i.; Shimizu, N.; Igarashi, N.; Martel, A.; Porcar, L. Direct evidence for the effect of glycerol on protein hydration and thermal structural transition. Biophys. J. 2018, 115, 313–327. [Google Scholar] [CrossRef] [PubMed]
  25. Vagenende, V.; Yap, M.G.; Trout, B.L. Mechanisms of protein stabilization and prevention of protein aggregation by glycerol. Biochemistry 2009, 48, 11084–11096. [Google Scholar] [CrossRef]
  26. Caliskan, G.; Briber, R.M.; Thirumalai, D.; Garcia-Sakai, V.; Woodson, S.A.; Sokolov, A.P. Dynamic transition in tRNA is solvent induced. J. Am. Chem. Soc. 2006, 128, 32–33. [Google Scholar] [CrossRef]
  27. Davis-Searles, P.R.; Saunders, A.J.; Erie, D.A.; Winzor, D.J.; Pielak, G.J. Interpreting the effects of small uncharged solutes on protein-folding equilibria. Annu. Rev. Biophys. Biomol. Struct. 2001, 30, 271–306. [Google Scholar] [CrossRef]
  28. Rösgen, J.; Pettitt, B.M.; Bolen, D.W. An analysis of the molecular origin of osmolyte-dependent protein stability. Protein Sci. 2007, 16, 733–743. [Google Scholar] [CrossRef]
  29. Daniel, R.M.; Peterson, M.E.; Danson, M.J.; Price, N.C.; Kelly, S.M.; Monk, C.R.; Weinberg, C.S.; Oudshoorn, M.L.; Lee, C.K. The molecular basis of the effect of temperature on enzyme activity. Biochem. J. 2010, 425, 353–360. [Google Scholar] [CrossRef]
  30. Ringe, D.; Petsko, G.A. The ‘glass transition’in protein dynamics: What it is, why it occurs, and how to exploit it. Biophys. Chem. 2003, 105, 667–680. [Google Scholar] [CrossRef]
  31. Grimaldo, M.; Roosen-Runge, F.; Zhang, F.; Schreiber, F.; Seydel, T. Dynamics of proteins in solution. Q. Rev. Biophys. 2019, 52, e7. [Google Scholar] [CrossRef]
  32. Vural, D.; Hu, X.; Lindner, B.; Jain, N.; Miao, Y.; Cheng, X.; Liu, Z.; Hong, L.; Smith, J.C. Quasielastic neutron scattering in biology: Theory and applications. Biochim. Biophys. Acta (BBA)-Gen. Subj. 2017, 1861, 3638–3650. [Google Scholar] [CrossRef] [PubMed]
  33. Ahlgren, K.; Olsson, C.; Ermilova, I.; Swenson, J. New insights into the protein stabilizing effects of trehalose by comparing with sucrose. Phys. Chem. Chem. Phys. 2023, 25, 21215–21226. [Google Scholar] [CrossRef] [PubMed]
  34. Naidu, K.T.; Prabhu, N.P. Polyols, increasing global stability of cytochrome c, destabilize the thermal unfolding intermediate. J. Biomol. Struct. Dyn. 2022, 40, 11216–11228. [Google Scholar] [CrossRef]
  35. Paciaroni, A.; Cinelli, S.; Onori, G. Effect of the environment on the protein dynamical transition: A neutron scattering study. Biophys. J. 2002, 83, 1157–1164. [Google Scholar] [CrossRef]
  36. Rosi, B.P.; D’Angelo, A.; Buratti, E.; Zanatta, M.; Tavagnacco, L.; Natali, F.; Zamponi, M.; Noferini, D.; Corezzi, S.; Zaccarelli, E. Impact of the environment on the pnipam dynamical transition probed by elastic neutron scattering. Macromolecules 2022, 55, 4752–4765. [Google Scholar] [CrossRef]
  37. GhattyVenkataKrishna, P.K.; Carri, G.A. Effect of glycerol–water binary mixtures on the structure and dynamics of protein solutions. J. Biomol. Struct. Dyn. 2014, 32, 424–437. [Google Scholar] [CrossRef]
  38. Lerbret, A.; Affouard, F. Molecular packing, hydrogen bonding, and fast dynamics in lysozyme/trehalose/glycerol and trehalose/glycerol glasses at low hydration. J. Phys. Chem. B 2017, 121, 9437–9451. [Google Scholar] [CrossRef]
  39. Golub, M.; Rusevich, L.; Irrgang, K.D.; Pieper, J. Rigid versus Flexible Protein Matrix: Light-Harvesting Complex II Exhibits a Temperature-Dependent Phonon Spectral Density. J. Phys. Chem. B 2018, 122, 7111–7121. [Google Scholar] [CrossRef]
  40. Renger, G.; Pieper, J.; Theiss, C.; Trostmann, I.; Paulsen, H.; Renger, T.; Eichler, H.; Schmitt, F.-J. Water soluble chlorophyll binding protein of higher plants: A most suitable model system for basic analyses of pigment–pigment and pigment–protein interactions in chlorophyll protein complexes. J. Plant Physiol. 2011, 168, 1462–1472. [Google Scholar] [CrossRef]
  41. Maleeva, Y.V.; Neverov, K.; Obukhov, Y.N.; Kritsky, M. Water soluble chlorophyll-binding proteins of plants: Structure, properties and functions. Mol. Biol. 2019, 53, 876–888. [Google Scholar] [CrossRef]
  42. Palm, D.M.; Agostini, A.; Pohland, A.-C.; Werwie, M.; Jaenicke, E.; Paulsen, H. Stability of water-soluble chlorophyll protein (WSCP) depends on phytyl conformation. ACS Omega 2019, 4, 7971–7979. [Google Scholar] [CrossRef] [PubMed]
  43. Satoh, H.; Uchida, A.; Nakayama, K.; Okada, M. Water-soluble chlorophyll protein in Brassicaceae plants is a stress-induced chlorophyll-binding protein. Plant Cell Physiol. 2001, 42, 906–911. [Google Scholar] [CrossRef] [PubMed]
  44. Horigome, D.; Satoh, H.; Itoh, N.; Mitsunaga, K.; Oonishi, I.; Nakagawa, A.; Uchida, A. Structural mechanism and photoprotective function of water-soluble chlorophyll-binding protein. J. Biol. Chem. 2007, 282, 6525–6531. [Google Scholar] [CrossRef]
  45. Agostini, A.; Meneghin, E.; Gewehr, L.; Pedron, D.; Palm, D.M.; Carbonera, D.; Paulsen, H.; Jaenicke, E.; Collini, E. How water-mediated hydrogen bonds affect chlorophyll a/b selectivity in Water-Soluble Chlorophyll Protein. Sci. Rep. 2019, 9, 18255. [Google Scholar] [CrossRef]
  46. Theiss, C.; Trostmann, I.; Andree, S.; Schmitt, F.; Renger, T.; Eichler, H.; Paulsen, H.; Renger, G. Pigment-pigment and pigment-protein interactions in recombinant water-soluble chlorophyll proteins (WSCP) from cauliflower. J. Phys. Chem. B 2007, 111, 13325–13335. [Google Scholar] [CrossRef]
  47. Schmitt, F.-J.; Trostmann, I.; Theiss, C.; Pieper, J.; Renger, T.; Fuesers, J.; Hubrich, E.; Paulsen, H.; Eichler, H.; Renger, G. Excited state dynamics in recombinant water-soluble chlorophyll proteins (WSCP) from cauliflower investigated by transient fluorescence spectroscopy. J. Phys. Chem. B 2008, 112, 13951–13961. [Google Scholar] [CrossRef]
  48. Pieper, J.; Rätsep, M.; Trostmann, I.; Schmitt, F.-J.; Theiss, C.; Paulsen, H.; Eichler, H.; Freiberg, A.; Renger, G. Excitonic energy level structure and pigment-protein interactions in the recombinant water-soluble chlorophyll protein. II. Spectral hole-burning experiments. J. Phys. Chem. B 2011, 115, 4053–4065. [Google Scholar] [CrossRef]
  49. Alster, J.; Lokstein, H.; Dostál, J.; Uchida, A.; Zigmantas, D. 2D spectroscopy study of water-soluble chlorophyll-binding protein from Lepidium virginicum. J. Phys. Chem. B 2014, 118, 3524–3531. [Google Scholar] [CrossRef]
  50. Damaraju, S.; Schlede, S.; Eckhardt, U.; Lokstein, H.; Grimm, B. Functions of the water soluble chlorophyll-binding protein in plants. J. Plant Physiol. 2011, 168, 1444–1451. [Google Scholar] [CrossRef]
  51. Meng, E.C.; Goddard, T.D.; Pettersen, E.F.; Couch, G.S.; Pearson, Z.J.; Morris, J.H.; Ferrin, T.E. UCSF ChimeraX: Tools for structure building and analysis. Protein Sci. 2023, 32, e4792. [Google Scholar] [CrossRef] [PubMed]
  52. Arnold, O.; Bilheux, J.-C.; Borreguero, J.M.; Buts, A.; Campbell, S.I.; Chapon, L.; Doucet, M.; Draper, N.; Leal, R.F.; Gigg, M.A. Mantid—Data Analysis and Visualization Package for Neutron Scattering and μ SR Experiments; Elsevier: Amsterdam, The Netherlands, 2014. [Google Scholar]
  53. Berrod, Q.; Lagrené, K.; Ollivier, J.; Zanotti, J.-M. Inelastic and quasi-elastic neutron scattering. Application to soft-matter. EPJ Web Conf. 2018, 188, 05001. [Google Scholar] [CrossRef]
  54. Azuah, R.T.; Kneller, L.R.; Qiu, Y.; Tregenna-Piggott, P.L.; Brown, C.M.; Copley, J.R.; Dimeo, R.M. DAVE: A comprehensive software suite for the reduction, visualization, and analysis of low energy neutron spectroscopic data. J. Res. Natl. Inst. Stand. Technol. 2009, 114, 341. [Google Scholar] [CrossRef] [PubMed]
  55. Golub, M.; Moldenhauer, M.; Schmitt, F.J.; Lohstroh, W.; Maksimov, E.G.; Friedrich, T.; Pieper, J. Solution Structure and Conformational Flexibility in the Active State of the Orange Carotenoid Protein. Part II: Quasielastic Neutron Scattering. J. Phys. Chem. B 2019, 123, 9536–9545. [Google Scholar] [CrossRef]
  56. Singwi, K.; Sjölander, A. Diffusive motions in water and cold neutron scattering. Phys. Rev. 1960, 119, 863. [Google Scholar] [CrossRef]
  57. Rodriguez-Velamazan, J.A.; Gonzalez, M.A.; Real, J.A.; Castro, M.; Munoz, M.C.; Gaspar, A.B.; Ohtani, R.; Ohba, M.; Yoneda, K.; Hijikata, Y.; et al. A switchable molecular rotator: Neutron spectroscopy study on a polymeric spin-crossover compound. J. Am. Chem. Soc. 2012, 134, 5083–5089. [Google Scholar] [CrossRef]
  58. Stevenson, K.J. Review of OriginPro 8.5. J. Am. Chem. Soc. 2011, 133, 5621. [Google Scholar] [CrossRef]
  59. Telling, M.T. Quasi-Elastic Neutron Scattering-A Tool for the Study of Biological Molecules and Processes. In Dynamics of Biological Macromolecules by Neutron Scattering; Bentham Science Publishers: Sharjah, United Arab Emirates, 2012; pp. 4–21. [Google Scholar]
  60. Suetake, I.; Sharma, R.K.; Hojo, H. Analytical Techniques for the Elucidation of Protein Function; John Wiley & Sons: Hoboken, NJ, USA, 2023. [Google Scholar]
  61. Russo, D.; Wurm, F.; Teixeira, J. Unlocking complexity through neutron scattering: Structure and dynamics of protein–polymer conjugates. Protein Sci. 2025, 34, e70137. [Google Scholar] [CrossRef]
  62. Fitter, J.; Lechner, R.; Buldt, G.; Dencher, N. Internal molecular motions of bacteriorhodopsin: Hydration-induced flexibility studied by quasielastic incoherent neutron scattering using oriented purple membranes. Proc. Natl. Acad. Sci. USA 1996, 93, 7600–7605. [Google Scholar] [CrossRef]
  63. Roh, J.; Curtis, J.; Azzam, S.; Novikov, V.; Peral, I.; Chowdhuri, Z.; Gregory, R.; Sokolov, A.P. Influence of hydration on the dynamics of lysozyme. Biophys. J. 2006, 91, 2573–2588. [Google Scholar] [CrossRef]
  64. Shirley, W.M.; Bryant, R.G. Proton-nuclear spin relaxation and molecular dynamics in the lysozyme-water system. J. Am. Chem. Soc. 1982, 104, 2910–2918. [Google Scholar] [CrossRef]
  65. Golub, M.; Pieper, J. The Unusual Functional Role of Protein Flexibility in Photosynthetic Light Harvesting: Protein Dynamics Studied Using Neutron Scattering. Crystals 2024, 14, 743. [Google Scholar] [CrossRef]
  66. Doster, W.; Settles, M. The dynamical transition in proteins: The role of hydrogen bonds. NATO ASI Ser. A Life Sci. 1999, 305, 177–194. [Google Scholar]
  67. Pieper, J.; Hauss, T.; Buchsteiner, A.; Renger, G. The Effect of Hydration on Protein Flexibility in Photosystem II of Green Plants Studied by Quasielastic Neutron Scattering. Eur. Biophys. J. EBJ 2008, 37, 657–663. [Google Scholar] [CrossRef] [PubMed]
  68. Golub, M.; Koppel, M.; Pikma, P.; Frick, B.; Pieper, J. Dynamics-Function Correlation in Photosystem II: Molecular Dynamics in Solution. Crystals 2023, 13, 1441. [Google Scholar] [CrossRef]
  69. Hajizadeh, M.; Golub, M.; Moldenhauer, M.; Lohstroh, W.; Friedrich, T.; Pieper, J. The Dynamical Properties of Three Different Variants of the Orange Carotenoid Protein: A Quasielastic Neutron Scattering Study. Crystals 2024, 14, 361. [Google Scholar] [CrossRef]
  70. Caliskan, G.; Mechtani, D.; Roh, J.; Kisliuk, A.; Sokolov, A.; Azzam, S.; Cicerone, M.T.; Lin-Gibson, S.; Peral, I. Protein and solvent dynamics: How strongly are they coupled? J. Chem. Phys. 2004, 121, 1978–1983. [Google Scholar] [CrossRef]
  71. Jansson, H.; Bergman, R.; Swenson, J. Protein and solvent dynamics as studied by QENS and dielectric spectroscopy. J. Non-Cryst. Solids 2006, 352, 4410–4416. [Google Scholar] [CrossRef]
  72. Chen, Z.; Huang, C.; Yao, X.; Benmore, C.J.; Yu, L. Structures of glass-forming liquids by X-ray scattering: Glycerol, xylitol, and D-sorbitol. J. Chem. Phys. 2021, 155, 244508. [Google Scholar] [CrossRef]
  73. Bischof, J.C.; He, X. Thermal stability of proteins. Ann. N. Y. Acad. Sci. 2006, 1066, 12–33. [Google Scholar] [CrossRef]
  74. Yannopoulos, S.; Andrikopoulos, K.; Ruocco, G. On the analysis of the vibrational Boson peak and low-energy excitations in glasses. J. Non-Cryst. Solids 2006, 352, 4541–4551. [Google Scholar] [CrossRef]
  75. Pieper, J.; Rätsep, M.; Trostmann, I.; Paulsen, H.; Renger, G.; Freiberg, A. Excitonic energy level structure and pigment-protein interactions in the recombinant water-soluble chlorophyll protein. I. Difference fluorescence line-narrowing. J. Phys. Chem. B 2011, 115, 4042–4052. [Google Scholar] [CrossRef] [PubMed]
  76. Lutz, M. Resonance Raman spectra of chlorophyll in solution. J. Raman Spectrosc. 1974, 2, 497–516. [Google Scholar] [CrossRef]
  77. Gryliuk, G.; Rätsep, M.; Hildebrandt, S.; Irrgang, K.-D.; Eckert, H.-J.; Pieper, J. Excitation energy transfer and electron-vibrational coupling in phycobiliproteins of the cyanobacterium Acaryochloris marina investigated by site-selective spectroscopy. Biochim. Biophys. Acta (BBA)-Bioenerg. 2014, 1837, 1490–1499. [Google Scholar] [CrossRef]
  78. Coquillat, D.; O’Connor, E.; Brouillet, E.V.; Meriguet, Y.; Bray, C.; Nelson, D.J.; Faulds, K.; Torres, J.; Dyakonova, N. Investigating the low-frequency vibrations of chlorophyll derivatives using terahertz spectroscopy. In Proceedings of the Terahertz Emitters, Receivers, and Applications XII, San Diego, CA, USA, 1–5 August 2021; pp. 30–33. [Google Scholar]
  79. Du, J.; Teramoto, T.; Nakata, K.; Tokunaga, E.; Kobayashi, T. Real-time vibrational dynamics in chlorophyll a studied with a few-cycle pulse laser. Biophys. J. 2011, 101, 995–1003. [Google Scholar] [CrossRef]
  80. Morris, G.J.; Goodrich, M.; Acton, E.; Fonseca, F. The high viscosity encountered during freezing in glycerol solutions: Effects on cryopreservation. Cryobiology 2006, 52, 323–334. [Google Scholar] [CrossRef]
  81. Tsai, A.M.; Udovic, T.J.; Neumann, D.A. The inverse relationship between protein dynamics and thermal stability. Biophys. J. 2001, 81, 2339–2343. [Google Scholar] [CrossRef]
  82. Towey, J.; Soper, A.; Dougan, L. Molecular insight into the hydrogen bonding and micro-segregation of a cryoprotectant molecule. J. Phys. Chem. B 2012, 116, 13898–13904. [Google Scholar] [CrossRef]
  83. Capaccioli, S.; Ngai, K.; Ancherbak, S.; Paciaroni, A. Evidence of coexistence of change of caged dynamics at T g and the dynamic transition at T d in solvated proteins. J. Phys. Chem. B 2012, 116, 1745–1757. [Google Scholar] [CrossRef]
  84. Tarek, M.; Tobias, D. Role of protein-water hydrogen bond dynamics in the protein dynamical transition. Phys. Rev. Lett. 2002, 88, 138101. [Google Scholar] [CrossRef]
  85. Kruteva, M. Dynamics studied by quasielastic neutron scattering (QENS). Adsorption 2021, 27, 875–889. [Google Scholar] [CrossRef]
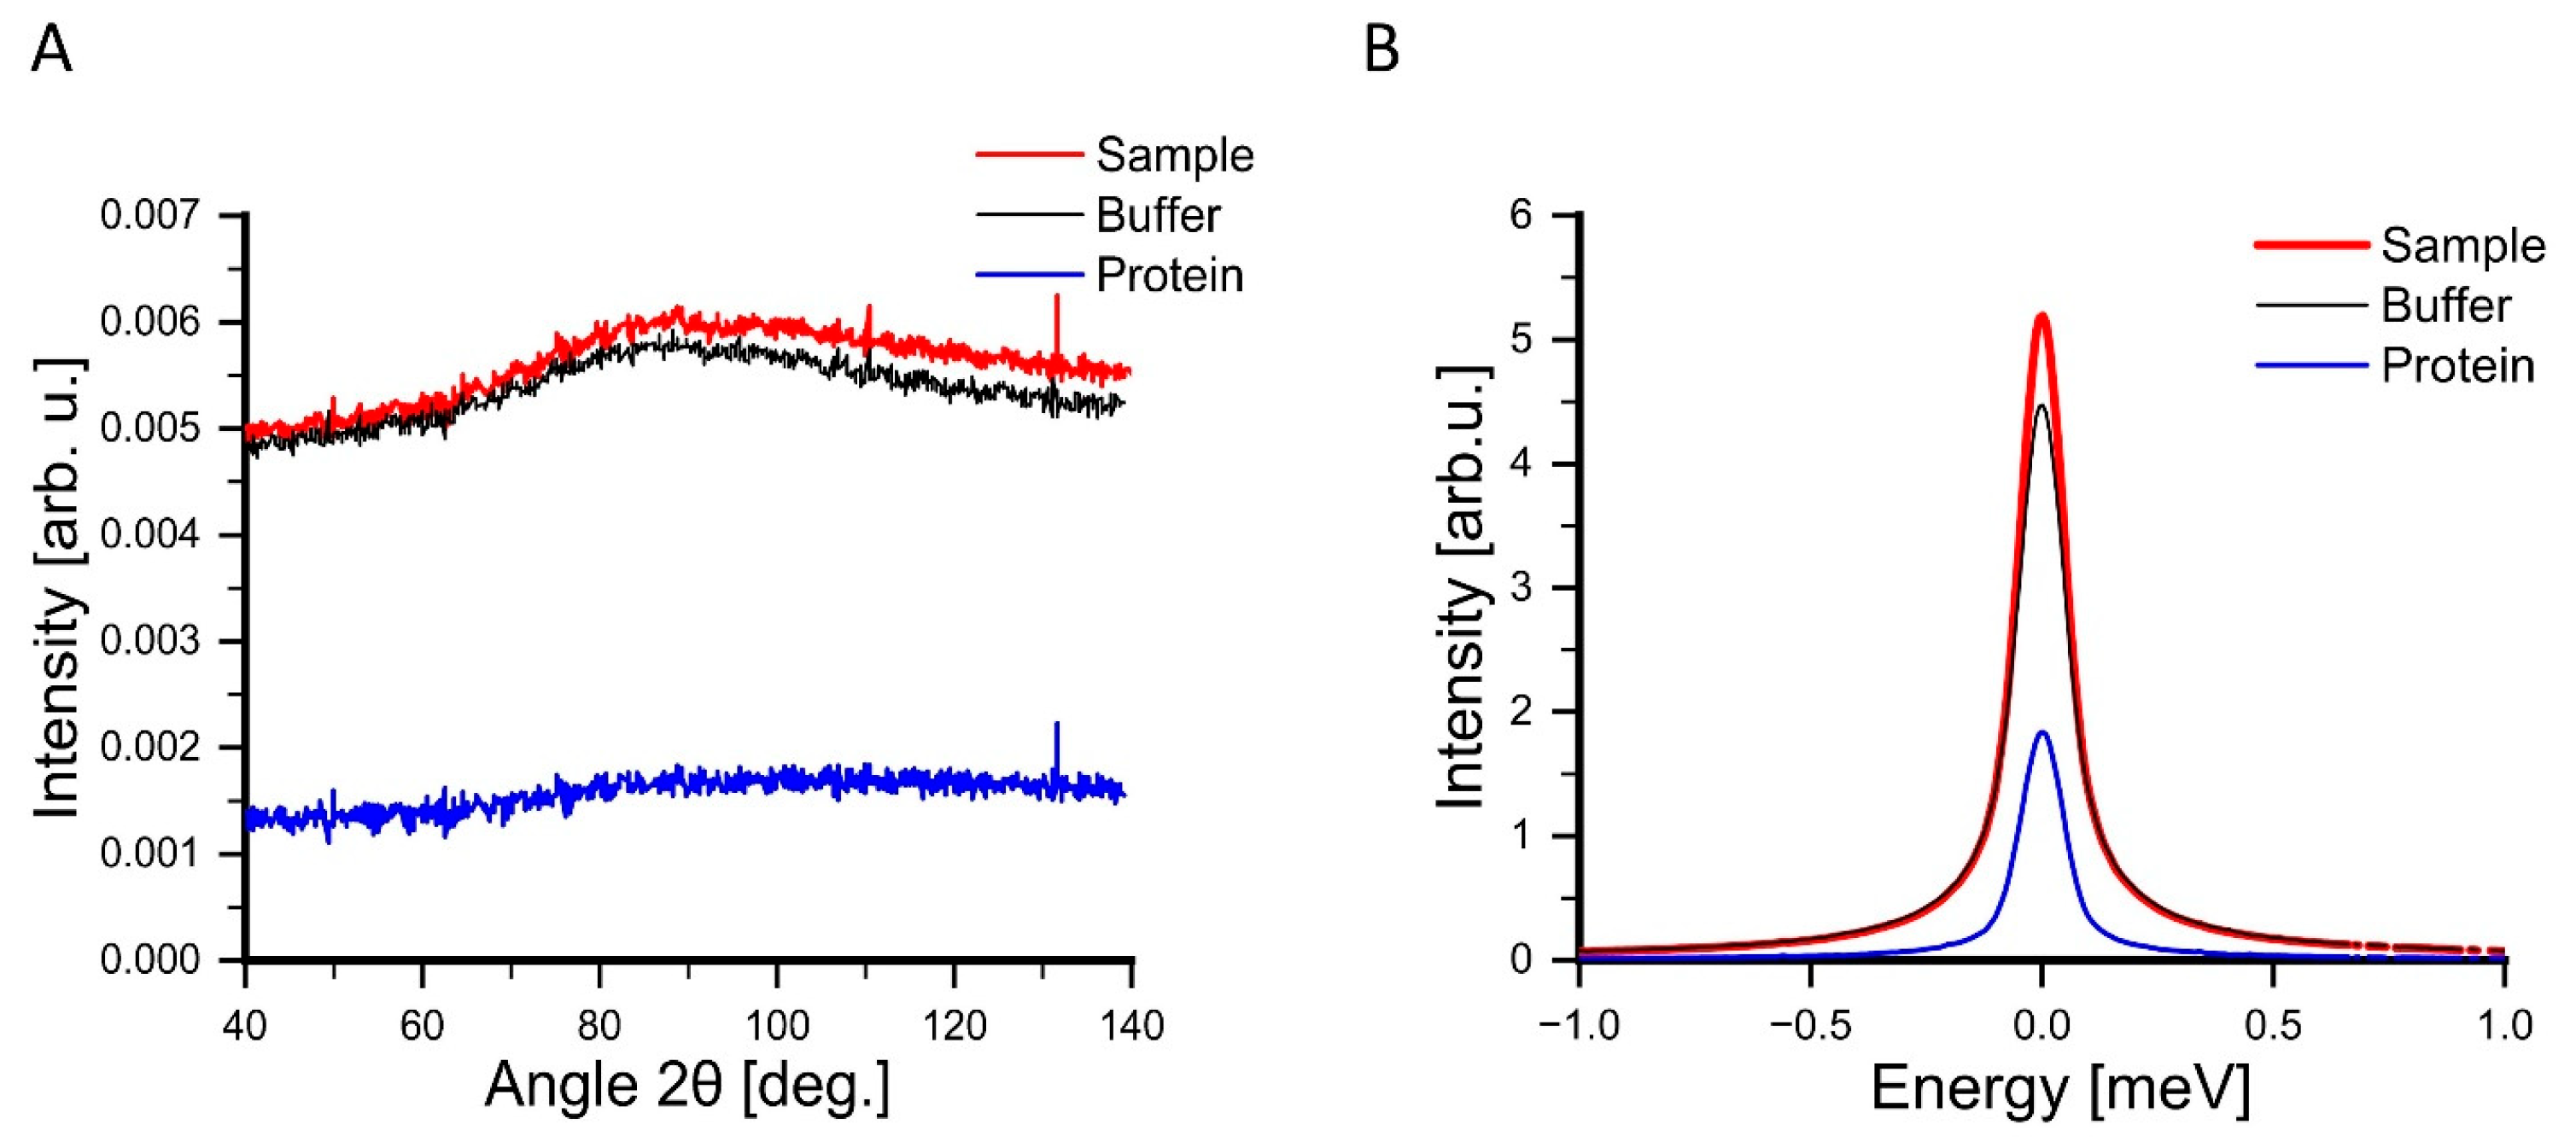
Figure 2. (A) Buffer subtraction for the case of WSCPW+G: Angular spectra (diffractograms) of WSCP+ buffer (red line), with a separate buffer measurement (black line), collected at 300 K. Each data point represents the scattering intensity at a specific angle, averaged across all neutron energies. The protein contribution (blue line), is isolated by subtracting the buffer signal from the sample data, ensuring that the coherent peak, which appears around 90°, disappears from the final diffractogram (it must be noted that subtraction with glycerol does not perfectly work, and we still see small peak around 90°). (B) QENS spectra of WSCPW+G +buffer (red line), buffer (black line), and the difference spectrum corresponding to WSCP (blue line) at 300 K.
Crystals 15 00569 g002
Figure 3. QENS spectra of WSCPW+G (A) and WSCPW (B) at different temperatures; see legends for values. To be able to compare peak intensity and shapes, we normalized the data to a peak intensity of one.
Crystals 15 00569 g003
Figure 4. Example of a theoretical fit for the case of the WSCPW+G QENS spectrum (black empty spheres) at 280 K (A) and 300 K (B). The elastic contribution is shown as a blue line, and the two quasielastic (Voigtian) contributions are displayed as gray short-dashed and dashed–dotted lines. The final fit is shown as a red line.
Crystals 15 00569 g004
Figure 5. The HWHM of the Lorentzian function describes the internal motions as a function of Q2. Magenta circles are the HWHM of WSCPW+G at 260 K, red triangles are the HWHM of WSCPW+G at 280 K, and blue stars are the HWHM of WSCPW+G at 300 K. Dashed black lines are the jump diffusion fits.
Crystals 15 00569 g005
Figure 6. Comparison of EISF from Lorentzian fits of QENS spectra of WSCPW+G at different temperatures (100 K, green squares; 200 K, black stars; 260 K, magenta circles; 280 K, red tringles; 300 K, blue stars) as a function of Q. Dashed black lines are fits according to Equation (5).
Crystals 15 00569 g006
Figure 7. Determination of MSDs of WSCPW+G at different temperatures (260 K, magenta circles; 280 K, red triangles; 300 K, blue stars). Linear fits of the data are shown as black dashed lines.
Crystals 15 00569 g007
Figure 8. Temperature dependence of QISF for WSCPW (empty red squares) and WSCPW+G (blue-filled circles).
Crystals 15 00569 g008
Figure 9. (AD) INS spectra of WSCPW (black) and WSCPW+G (pink) at different temperatures for comparison. To be able to compare peak intensity and shapes, we normalized the data to 1. The INS spectra were collected on the energy gain side, though they are presented here with a positive energy axis.
Crystals 15 00569 g009
Figure 10. Examples of theoretical fits for the cases of WSCPW (Frame (A)) and WSCPW+G (Frame (B)) at 100 K. The model curves have been built as a superposition of two half Gaussian–half Lorentz peaks (see text). To compare peak intensity and shapes, we normalized the data to unity.
Crystals 15 00569 g010
Table 1. Dynamical parameters extracted from the fit of EISF and HWHM data of the narrow Lorentzian component for WSCPW+G. The fraction of mobile hydrogen atoms (f), radius of motion (r), jump diffusion constant (D), residence time (τ), and mean square displacements (⟨u2⟩) are listed. Letters a, b, and c label parameters that are valid below solvent melting (a), change upon solvent melting (b), and change due to temperature increase (c).
260 K280 K300 K
f0.39 ± 0.02 a0.41 ± 0.02 a0.59 ± 0.02 c
r [Å]0.92 ± 0.05 a0.95 ± 0.05 a1.06 ± 0.04 c
D [meVÅ2]0.07 ± 0.01 a0.11 ± 0.01 b0.14 ± 0.02 c
Γ [meV−1]9.0 ± 0.5 a5.1 ± 0.3 b4.8 ± 0.3 b
D [10−5 cm2/s]1.05 ± 0.1 a1.6 ± 0.2 b2.1 ± 0.2 c
τ [ps]5.9 ± 0.3 a3.3 ± 0.2 b3.1 ± 0.2 b
⟨u2⟩ [Å−2]0.11 ± 0.01 a0.12 ± 0.01 b0.20 ± 0.01 c
Table 2. Boson peak parameters for WSCPW. Xc1: peak position for Peak 1; Xc2: peak position for Peak 2; Wl1: the Lorentzian width components for the first peak; H1: the peak amplitude for Peak 1; H2: the peak amplitude for Peak 2; A1: the integrated area under the first peak. To enhance the robustness of the fitting process, Wg1 and Wg2 were held constant at 4 and 3, respectively. Additionally, Xc2 was set to 6.5, and the Lorentzian width component for the second peak, Wl2, was fixed at 4. Letters a–g label parameters that reveal statistically significant changes upon temperature increase.
T
(K)
Xc1
(meV)
Wl1
(meV)
A1
(%)
203.1 ± 0.1 a3.6 ± 0.3 a54
603.1 ± 0.1 a3.6 ± 0.2 a54
1003.1 ± 0.1 a4.3 ± 0.1 b55
1403.0 ± 0.1 b4.7 ± 0.1 c58
1802.9 ± 0.1 c5.2 ± 0.1 d60
2002.8 ± 0.1 d6.4 ± 0.1 e66
2202.8 ± 0.1 e7.0 ± 0.1 f69
2402.6 ± 0.1 f8.0 ± 0.1 g73
2602.4 ± 0.1 g8.1 ± 0.1 h77
Table 3. Boson peak parameters WSCPW+G. Xc1: peak position for Peak 1; Xc2: peak position for Peak 2; Wl1: the Lorentzian width components for the first peak; A1: the integrated area under the first peak. To enhance the robustness of the fitting process, Wg1 and Wg2 were held constant at 3. Additionally, Xc2 was set to 6, and the Lorentzian width component for the second peak, Wl2, was fixed at 4. Letters a–e label parameters that reveal statistically significant changes upon temperature increase.
T
(K)
Xc1
(meV)
Wl1
(meV)
A1
(%)
1003.4 ± 0.1 a9.3 ± 0.3 a75.5
2003.2 ± 0.1 b10 ± 0.6 b82.7
2602.5 ± 0.1 c6.7 ± 0.9 b91
2801.8 ± 0.1 d7.5 ± 0.1 b92
3001.5 ± 0.1 e7.8 ± 0.2 b95
Disclaimer/Publisher’s Note: The statements, opinions and data contained in all publications are solely those of the individual author(s) and contributor(s) and not of MDPI and/or the editor(s). MDPI and/or the editor(s) disclaim responsibility for any injury to people or property resulting from any ideas, methods, instructions or products referred to in the content.