1. Introduction
Luminescent organic and organometallic compounds have emerged as promising functional materials for various applications—particularly in optoelectronic devices such as organic light-emitting diodes, sensors, and bioimaging platforms. A key breakthrough in this field was the discovery of aggregation-induced emission (AIE) by Tang et al. in 2001, which enabled the design of luminophores with enhanced emissions in the aggregated state due to restricted intramolecular motion and suppressed nonradiative decay pathways [
1,
2,
3,
4,
5,
6,
7,
8]. Among the various AIE-active systems, Au(I) complexes have attracted considerable attention owing to their unique photophysical characteristics. The heavy-atom effect of Au facilitates efficient intersystem crossing, enabling the utilization of triplet excitons and thus leading to room-temperature phosphorescence (RTP). In addition, aurophilic (d
10–d
10) interactions play a crucial role in governing the packing arrangements and excited-state behavior in the solid state [
4,
5,
9,
10].
In our previous studies, we explored various Au(I) complexes comprising
N-heterocyclic carbene (NHC) and acetylide ligands and found that their emission properties are highly sensitive to both the molecular structure and aggregation state. In particular, rod-like Au(I) complexes featuring rigid π-conjugated backbones and long alkyl chains exhibited not only efficient RTP but also liquid crystalline (LC) behavior, which is attributed to their high aspect ratio and anisotropic molecular geometry [
11]. LC phases—characterized by the coexistence of molecular ordering and fluidity—provide tunable optical responses to external stimuli such as temperature, mechanical stress, and electric fields [
11,
12,
13,
14,
15,
16,
17,
18,
19,
20,
21,
22]. However, realizing thermodynamically stable LC phases in luminescent metal complexes remains a significant challenge.
In a prior study, we developed an Au(I)–NHC complex with hexyloxy-substituted ligands that exhibited a monotropic LC phase; however, its thermal stability and mesophase range were limited [
23]. These limitations motivated us to investigate molecular design strategies for enhancing both LC behavior and RTP performance. In the present study, we synthesized a series of Au(I)–NHC complexes incorporating long dodecyloxy chains, aimed at increasing the molecular aspect ratio and flexibility. Complex
1 featured an extended NHC framework, while complexes
2a and
2b were further modified with phenyl acetylide ligands bearing hexyl and dodecyl ether substituents, respectively. We systematically characterized their thermotropic LC behavior and photophysical properties. Our results indicated that introducing long alkoxy chains on both ligands promotes the formation of Smectic A (SmA) mesophases with thermal stability maintained over a wide temperature range and significantly enhances RTP efficiency in the solid state. This work provides a simple and effective strategy for designing multifunctional Au(I) materials that synergistically combine luminescence and liquid crystallinity, paving the way for their application in next-generation optoelectronic devices.
2. Materials and Methods
2.1. Materials
The Au(I) complexes bearing NHC and phenyl acetylide ligands were synthesized according to previously reported procedures [
23,
24]. The synthetic pathways for the ligands are illustrated in
Schemes S1 and S2 in the
Supporting Information. Complex
1 was obtained via a transmetalation reaction from the corresponding benzimidazolium salt (NHC precursor). Complexes
2a and
2b were subsequently synthesized from complex
1 via treatment with the respective phenyl acetylide ligands. The overall synthetic route for the Au(I) complexes is depicted in
Scheme 1.
All reagents and solvents were purchased from commercial suppliers and used as received, unless otherwise specified. The 1H and 13C NMR spectra were recorded in CDCl3 using a JEOL ECS-400 spectrometer operating at 400 and 100 MHz, respectively. The chemical shifts (δ) are reported in parts per million (ppm) relative to the residual proton signals of the deuterated solvent. Elemental analyses were performed using a Micro Corder JM10 (J-SCIENCE, Tokyo, Japan). Mass spectrometric measurements were performed with a Bruker micrOTOF II instrument (JEOL, Tokyo, Japan).
2.2. Synthesis of Au(I) Complex 1
A mixture of 5,6-bis(dodecyloxy)-1,3-dimethyl-1H-benzimidazol-3-ium chloride (0.20 g, 0.30 mmol) and silver(I) oxide (0.04 g, 0.15 mmol) was stirred in a solvent mixture of dichloromethane (10 mL) and ethanol (10 mL) under an Ar atmosphere in the dark at room temperature (rt) for 5 h. Subsequently, (tht)AuCl (tht = tetrahydrothiophene; 0.10 g, 0.30 mmol) was added, and the reaction was continued for an additional 20 h under the same conditions. The resulting suspension was filtered through a Celite pad, and the filtrate was concentrated under reduced pressure. The crude residue was purified via column chromatography on silica gel using a dichloromethane/n-hexane mixture (2:1 v/v) as an eluent. Recrystallization from dichloromethane/n-hexane (1:2 v/v) afforded the product as a white solid in 62% yield (0.14 g, 0.18 mmol). m.p: 116 °C. 1H NMR (400 MHz, CDCl3, δ): 6.87 (s, 2H; 4,7-H in benzimidazole), 4.15 (t, J = 6.7 Hz; 4H; (OCH2)2), 3.95 (s, 6H; (NCH3)2), 1.85 (quin, J = 6.8 Hz; 4H; (OCH2CH2)2), 1.45 (m, 4H; (O(CH2)2CH2)2), 1.35–1.20 (m, 32H; (O(CH2)3(CH2)8)2), 0.85 (t, J = 6.9 Hz; 6H; (O(CH2)11CH3)2). 13C NMR (100 MHz, CDCl3, δ): 176.4 (2-C in benzimidazole), 148.5 (5,6-C in benzimidazole), 127.6 (ring fusion C in benzimidazole), 95.9 (4,7-C in benzimidazole), 70.1 (OCH2), 35.1 (N-CH3 in benzimidazole), 32.0 (OCH2CH2), 29.8 (OCH2CH2CH2), 29.7 (O(CH2)3(CH2)2), 29.5 (O(CH2)5(CH2)2), 29.4 (O(CH2)7CH2), 29.2 (O(CH2)8CH2), 26.1 (O(CH2)9CH2), 22.8 (O(CH2)10CH2), 14.23 (O(CH2)11CH3). ESI-MS m/z: [M+Na]+ calcd. for C33H58AuNaClN2O2, 769.3750; found, 769.3745. Anal. calcd. for C33H58AuClN2O2: C, 53.04; H, 7.82; N, 3.75; Au, 26.36; found: C, 52.47; H, 7.63; N, 3.76; ash, 26.3.
2.3. Synthesis of Au(I) Complex 2a
Chloro [5,6-bis(dodecyloxy)-1,3-dimethylbenzimidazolin-2-ylidene]Au(I) (complex 1; 0.10 g, 0.13 mmol) and 1-ethynyl-4-(hexyloxy)benzene (81 mg, 0.40 mmol) were dissolved in dichloromethane (10 mL). A solution of NaOH (17 mg, 0.42 mmol) in methanol (10 mL) was added dropwise under ambient conditions. The reaction mixture was stirred at room temperature (rt) for 20 h. After completion, the solvent was removed under reduced pressure. The residue was extracted with dichloromethane, washed sequentially with water and brine, and dried over anhydrous sodium sulfate. The organic phase was concentrated, and the crude product was purified via recrystallization from a dichloromethane/n-hexane mixture (1:2 v/v), affording complex 2a as white needle-like crystals in 78% yield (92 mg, 0.10 mmol). m.p.: 215 °C. 1H NMR (400 MHz, CDCl3, δ): 7.43 (d, J = 8.3 Hz; 2H; 3,5-H in phenyl), 6.83 (s, 2H; 4,7-H in benzimidazole), 6.76 (d, J = 8.7 Hz; 2H; 2,6-H in phenyl), 4.01 (t, J = 6.5 Hz; 4H; (OCH2)2 in benzimidazole), 3.96 (s, 6H; (NCH3)2), 3.91 (t, J = 6.5 Hz; 2H; OCH2 in phenyl), 1.85 (quin, J = 6.5 Hz; 4H; (OCH2CH2)2 in benzimidazole), 1.74 (quin, J = 6.5 Hz; 2H; OCH2CH2 in phenyl), 1.50–1.24 (m, 42 H, (O(CH2)2(CH2)9)2 in benzimidazole and (O(CH2)2(CH2)3 in phenyl), 0.86 (t, J = 6.8 Hz; 9H; (O(CH2)11CH3)2 in benzimidazole and (O(CH2)5CH3) in phenyl). 13C NMR (100 MHz, CDCl3, δ): 192.7 (2-C in benzimidazole), 157.89 (4-C in phenyl), 148.37 (5,6-C in benzimidazole), 133.68 (ring fusion C in benzimidazole), 127.95 (2,6-C in phenyl), 114.05 (4,6-C in benzimidazole), 95.98 (Au-C≡C-Ph), 70.19 (Au-C≡C-Ph), 67.96 (OCH2 in phenyl and benzimidazole), 34.84 (N-CH3 in benzimidazole), 32.0 (OCH2CH2 in benzimidazole and phenyl), 31.6 (O(CH2)2CH2 in benzimidazole and phenyl), 29.8 (O(CH2)3CH2 in benzimidazole and phenyl), 29.7 (O(CH2)4(CH2)2 in benzimidazole, 29.5 (O(CH2)5CH2 in benzimidazole), 29.2 (O(CH2)6CH2 in benzimidazole), 26.1 (O(CH2)7CH2 in benzimidazole), 25.8 (O(CH2)8CH2 in benzimidazole and O(CH2)4CH2 in phenyl), 22.7 (O(CH2)9(CH2)2 in benzimidazole), 14.2 (O(CH2)11CH3 in benzimidazole and O(CH2)5CH3 in phenyl). ESI-MS m/z: [M+Na]+ calcd. for C47H75AuNaN2O3, 935.5341; found, 935.6092. Anal. calcd. for C33H58AuClN2O2: C, 61.82; H, 8.28; N, 3.07; Au, 21.57; found: C, 61.10; H, 8.22; N, 3.09; ash, 22.1.
2.4. Synthesis of Au(I) Complex 2b
The same procedure described for the synthesis of complex 2a was followed for the synthesis of complex 2b using chloro(5,6-bis(dodecyloxy)-1,3-dimethylbenzimidazolin-2-ylidene)Au(I), 1, (50 mg, 0.06 mmol) and 1-ethynyl-4-(dodecyloxy)benzene (57 mg, 0.2 mmol) as the starting materials. The product was obtained as white, needle-shaped crystals in 87% yield (58 mg, 0.058 mmol). m.p.: 216 °C. 1H NMR (400 MHz, CDCl3, δ): 7.43 (d, J = 9.0 Hz; 2H; 3,5-H in phenyl), 6.83 (s, 2H; 4,7-H in benzimidazole), 6.76 (d, J = 8.7 Hz; 2H; 2,6-H in phenyl), 4.01 (t, J = 6.5 Hz; 4H; (OCH2)2 in benzimidazole), 3.96 (s, 6H; (NCH3)2), 3.91 (t, J = 6.5 Hz; 2H; OCH2 in phenyl), 1.85 (quin, J = 6.5 Hz; 4H, (OCH2CH2)2 in benzimidazole), 1.74 (quin, J = 6.8 Hz; 2H; O(CH2)2CH2 in phenyl), 1.52–1.24 (m, 54H; (O(CH2)2(CH2)9)2 in benzimidazole and O(CH2)2(CH2)9 in phenyl), 0.85 (t, J = 6.8 Hz; 9H; (O(CH2)11CH3)2 in benzimidazole and O(CH2)11CH3 in phenyl). 13C NMR (100 MHz, CDCl3, δ): 192.7 (2-C in benzimidazole), 157.8 (4-C in phenyl), 148.3 (5,6-C in benzimidazole), 133.6 (ring fusion C in benzimidazole), 127.9 (2,6-C in phenyl), 117.6 (4,6-C in benzimidazole), 114.0, 94.98 (Au-C≡C-Ph), 70.1 (Au-C≡C-Ph), 67.9 (OCH2 in phenyl and benzimidazole), 34.8 (N-CH3 in benzimidazole), 32.0 (OCH2CH2 in benzimidazole and phenyl), 29.80 (O(CH2)2CH2 in benzimidazole and phenyl), 29.7 (O(CH2)3(CH2)2 in benzimidazole and phenyl), 29.5 (O(CH2)4CH2 in benzimidazole and phenyl), 29.4 (O(CH2)5CH2 in benzimidazole and phenyl), 29.3 (O(CH2)6(CH2)2 in benzimidazole and phenyl), 29.2 (O(CH2)8(CH2)2 in benzimidazole and phenyl), 26.1 (O(CH2)10CH2 in phenyl), 22.7 (O(CH2)10CH2 in benzimidazole), 14.2 (O(CH2)11CH3 in benzimidazole and O(CH2)11CH3 in phenyl). ESI-MS m/z: [M+Na]+ calcd. for C53H87AuNaN2O3, 1019.6280; found, 1019.7044. Anal. calcd. for C33H58AuClN2O2: C, 63.83; H, 8.79; N, 2.81; Au, 19.75; found: C, 61.84; H, 8.64; N, 2.73; ash, 20.9.
2.5. Thermodynamic Properties and Phase-Transition Behavior Analysis
The thermal stability of the complexes was evaluated using a thermogravimetric/differential thermal analyzer (TG-DTA; DTG-60AH, Shimadzu, Kyoto, Japan). Measurements were conducted under an N2 atmosphere at a constant heating rate of 5 °C min−1. Phase-transition behavior and thermodynamic parameters were investigated via differential scanning calorimetry (DSC; SII X-DSC7000, Tokyo, Japan). Three heating–cooling cycles were conducted to confirm the reversibility of the phase transitions. LC phase transitions were further examined using polarized optical microscopy (POM; BX51, Olympus, Tokyo, Japan) equipped with a programmable heating and cooling stage (Instec HCS302 hot stage and mK2000 precision controller). The samples were sandwiched between a glass slide and a cover slip, with the gap estimated to be less than a few micrometers. The prepared samples were then placed on the heating and cooling stage and observed under crossed polarizers at various temperatures.
2.6. Photophysical Properties
The photophysical properties of the complexes were studied in both solution and solid states. Ultraviolet (UV)–visible absorption spectra in a dilute solution were recorded using a V-550 spectrophotometer (JASCO, Tokyo, Japan). Steady-state photoluminescence spectra were acquired with an F-7000 fluorescence spectrophotometer (Hitachi, Tokyo, Japan). Crystalline samples were sandwiched between two quartz plates (2 cm × 2 cm), and photoluminescence measurements—including excitation, emission, quantum yield, and lifetime—were carried out. An unpolarized excitation light source was used for all measurements. Temperature-dependent photoluminescence (PL) measurements were performed using a custom-built temperature-controlled stage with an Omron E5CB temperature controller. Absolute quantum yields (Φ) were determined using an integrating-sphere system (Hitachi, Tokyo, Japan). The PL lifetimes (τ) and decay profiles were measured using a Quantaurus-Tau time-resolved spectrometer (C11347-01, Hamamatsu Photonics, Hamamatsu, Japan).
2.7. Variable-Temperature Powder X-Ray Diffraction
Variable-temperature powder X-ray diffraction (PXRD) measurements were performed using a Malvern Panalytical AERIS powder X-ray diffractometer equipped with a basic temperature stage (BTS) unit (BTS 500 benchtop heating stage).
2.8. Language Editing
To assist with improving the clarity and readability of the manuscript, ChatGPT-4 (OpenAI, 2025) was used exclusively for English grammar and syntax refinement. All scientific content, data interpretation, and conclusions were developed by the authors and thoroughly reviewed and approved by them before submission.
3. Results and Discussion
3.1. Synthesis and Structural Characterization
Complex
1 was obtained as a white solid, whereas complexes
2a and
2b were isolated as white, needle-like crystals through recrystallization. The synthetic procedures for all complexes proceeded smoothly with moderate-to-high yields, and the products were fully characterized by
1H and
13C NMR spectroscopy, high-resolution ESI mass spectrometry, and elemental analysis (see
Section 2.2,
Section 2.3 and
Section 2.4).
Attempts to grow single crystals suitable for X-ray diffraction analysis were unsuccessful for all complexes, despite repeated efforts using various solvent systems and crystallization conditions. The inability to obtain high-quality single crystals is attributed to the long, flexible alkyl chains present on both the NHC and acetylide ligands, which are known to reduce crystallinity by introducing conformational disorder.
3.2. Thermodynamic Properties
TG/DTA was conducted under an N
2 atmosphere to evaluate the thermal stability of the complexes. Measurements were performed from room temperature (25 °C) to 600 °C at a constant heating rate of 5 °C min
−1. The thermal decomposition temperature (
Tdec) was defined as the temperature at which 5% weight loss occurred, typically accompanied by a strong exothermic peak in the DTA curve. The TG/DTA results (
Table 1) indicated that all complexes had excellent thermal stability, with high
Tdec values. The TG/DTA thermograms of all the complexes are shown in
Figure S7. Complex
1 exhibited a sharp weight loss beginning at 283 °C, attributed to the decomplexation of the NHC ligand. For complex
2a, a two-step decomposition profile was observed: the first weight loss of ~45% between 296 and 400 °C corresponded well to the theoretical mass fraction of the NHC ligand (43%), and the second weight loss of ~26% between 400 and 600 °C matched the contribution of the acetylide ligand (22%). Complex
2b exhibited a similar two-step thermal degradation pattern.
These findings suggest that the initial weight loss for all complexes is associated with cleavage of the NHC ligand from the Au center, followed by decomposition of the acetylide moiety in complexes 2a and 2b. The high thermal stability is ascribed to the strong Au–C bond between the Au(I) center and the NHC ligand. The residual percentage of weight (wt%) after heating to 600 °C (experimental ash content) agreed well with the calculated theoretical ash content, indicating that only elemental Au remained at elevated temperatures.
Furthermore, the DTA thermograms exhibited several endothermic transitions preceding decomposition. These transitions are associated with phase changes and were analyzed in detail using DSC and POM, as discussed in the following section.
The phase-transition behavior was examined via DSC, supported by POM. During the heating cycle, the DSC thermogram of complex
1 exhibited a sharp endothermic peak at 80 °C, corresponding to a similar event observed in the DTA curve (
Figure S8). At this temperature, a distinct phase transition was also detected by POM (
Figure S11); the resulting phase exhibited no fluidity, even under mechanical stress. This behavior suggests a crystal-to-crystal phase transition, designated as Cry
1 → Cry
2. Upon further heating, complex
1 transitioned into an isotropic phase at 116 °C. On cooling, the isotropic phase reverted to a crystalline phase (Cry
x) at 97 °C. No intermediate mesophases were detected during either heating or cooling, indicating the absence of LC behavior. Although molecules with high aspect ratios and flexible substituents are often expected to form LC phases, complex
1 did not exhibit such behavior. This is attributed to its symmetric molecular design, which induces steric hindrance due to the adjacent placement of alkoxy chains on the benzimidazole ring, limiting conformational flexibility. These structural constraints likely suppress the formation of LC mesophases, despite the presence of long alkyl chains.
In contrast, complexes
2a and
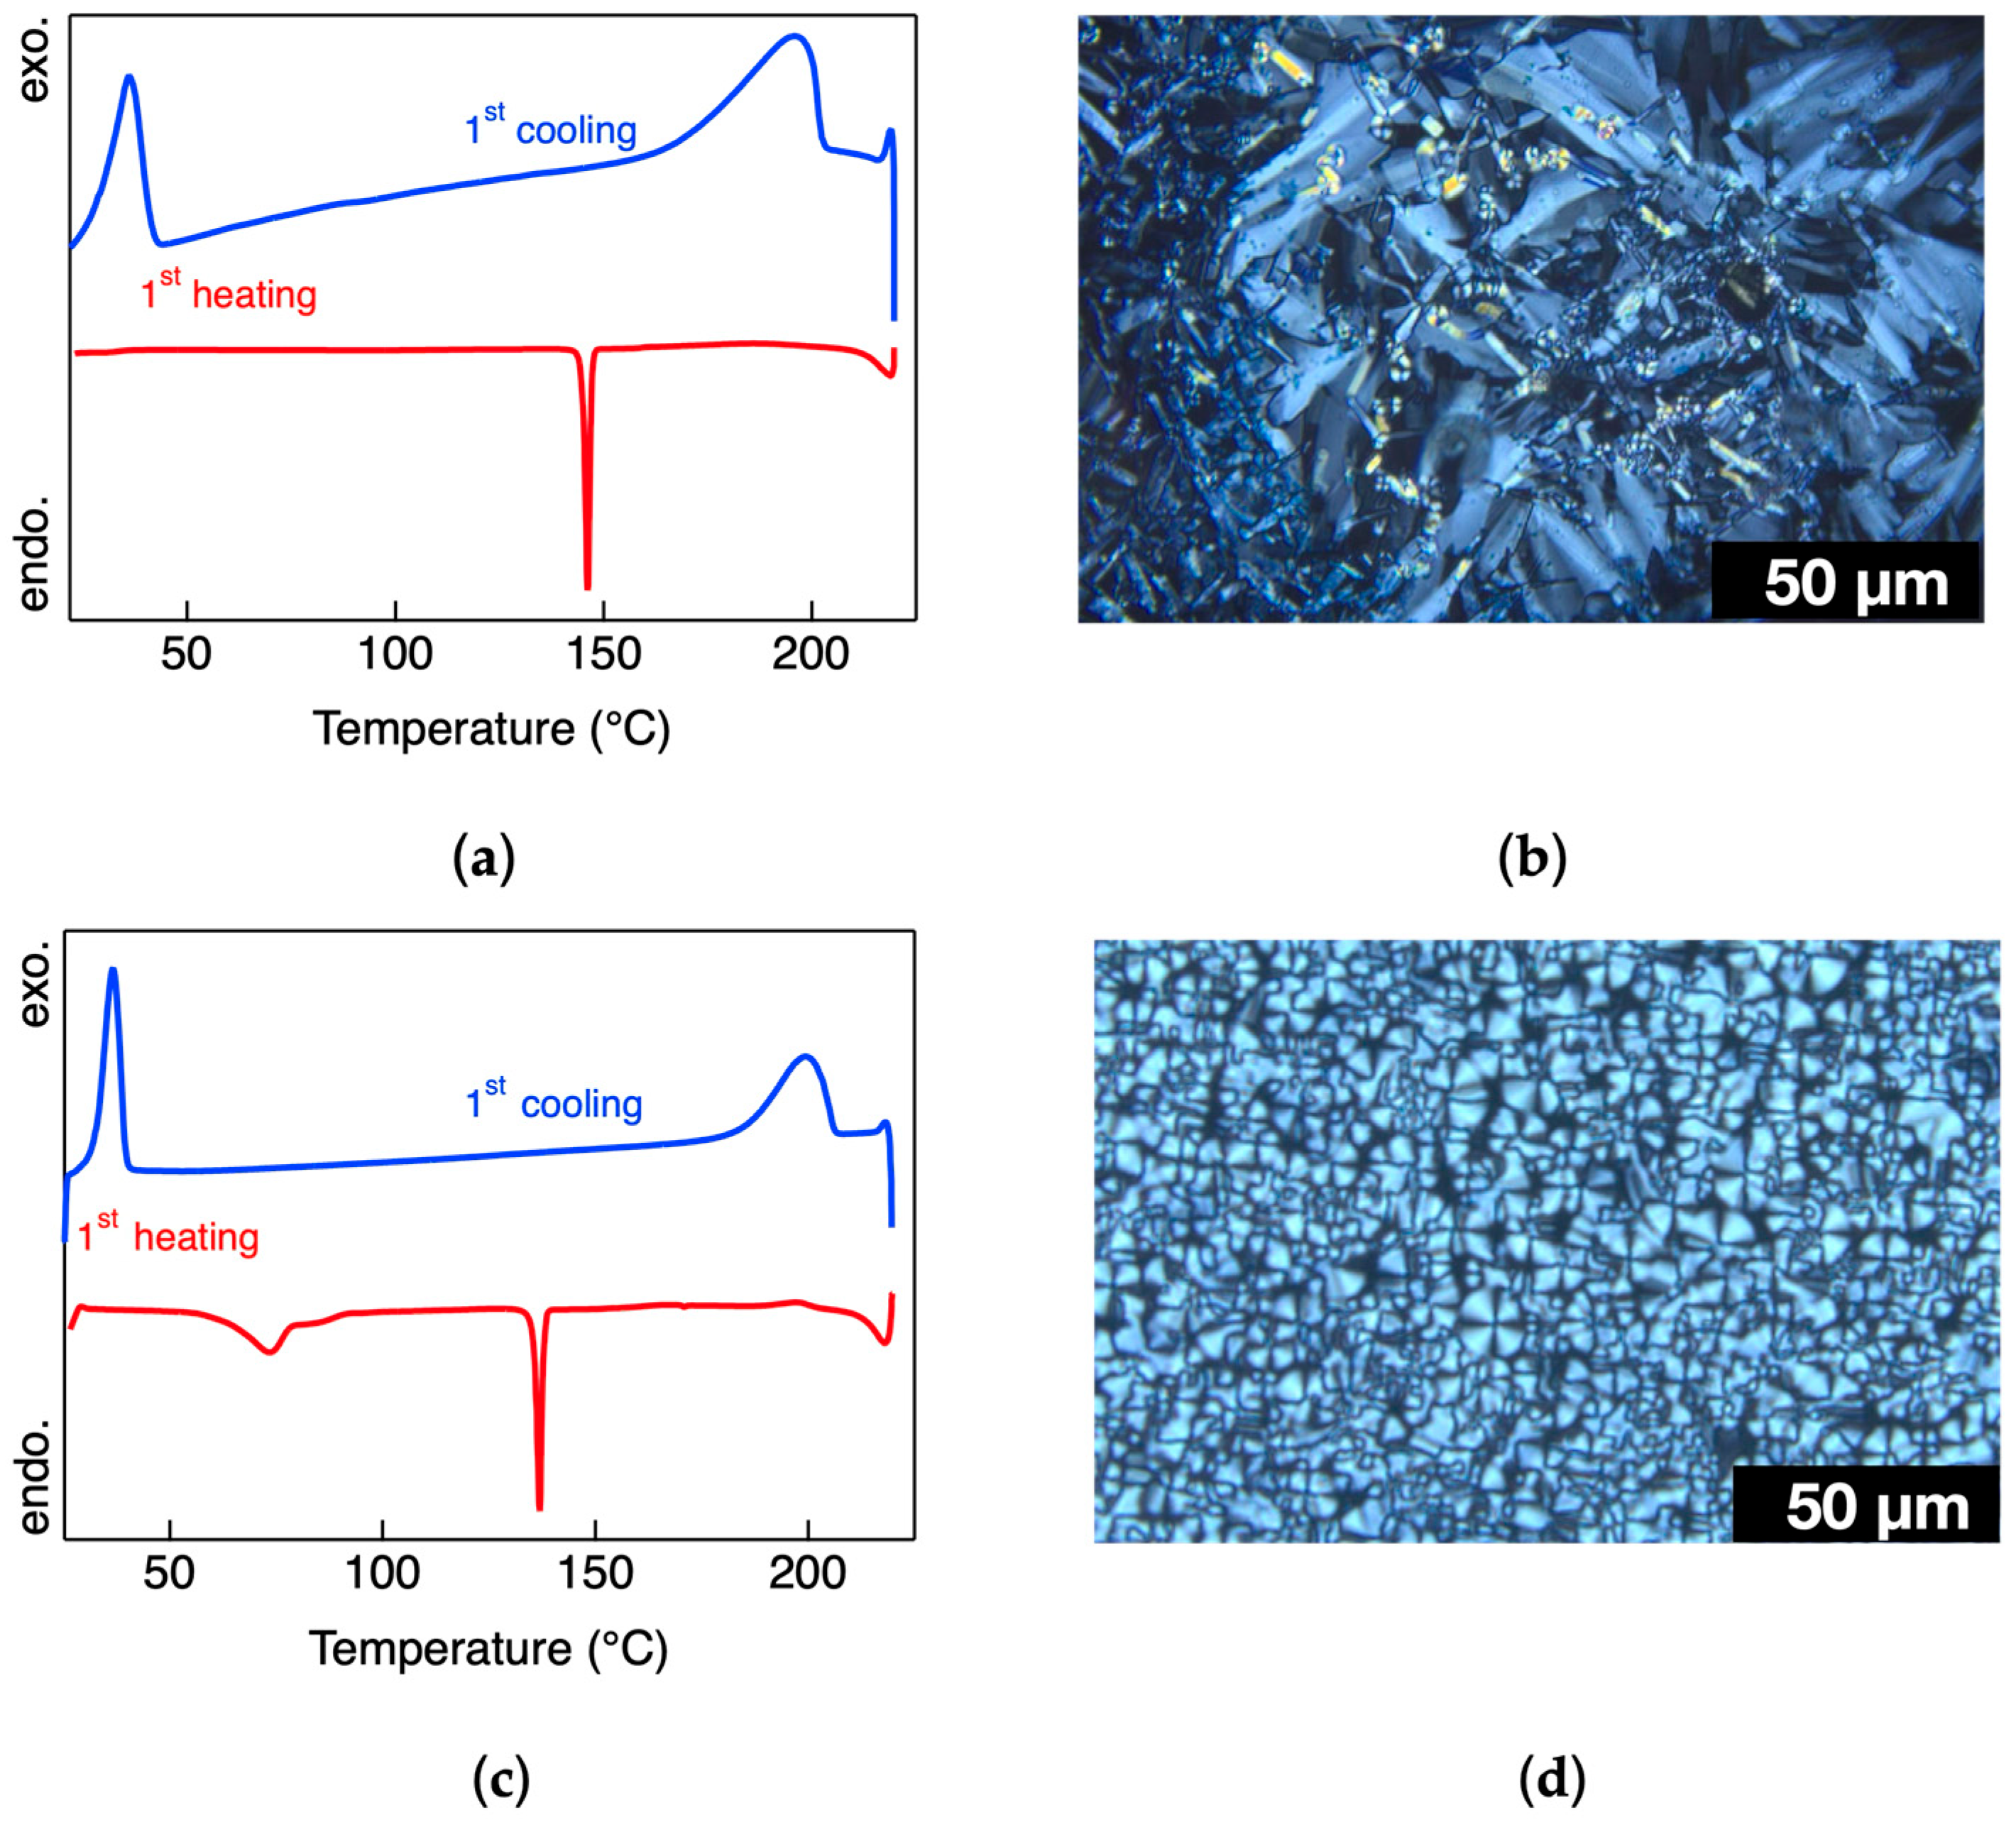
2b, bearing acetylide ligands, exhibited significantly enhanced anisotropy and disrupted molecular symmetry. Thus, both complexes displayed thermotropic LC behavior in both heating and cooling cycles. For complex
2a, a strong endothermic peak was observed at 146 °C in the heating process, marking the transition from a crystalline phase to a LC phase. Under POM, the LC phase exhibited characteristic fan-shaped textures and fluidity under shear stress (
Figure S12b). According to its optical features, this phase was identified as a Smectic A (SmA) mesophase [
25]. Upon continued heating, the SmA phase transformed into an isotropic liquid at 215 °C. During cooling, the isotropic phase reformed the SmA phase at 196 °C, corresponding to a broad exothermic peak in the DSC trace (
Figure 1a,b). This SmA phase remained thermodynamically stable over a wide temperature range. A broad exothermic transition at 36 °C was assigned to the SmA-to-crystalline (Cry
x) transition. Interestingly, the SmA phase observed during the first heating was not recovered in subsequent heating cycles, where the system directly transformed between crystalline and isotropic phases. However, the SmA phase reappeared reversibly in all cooling cycles, suggesting monotropic behavior.
Complex
2b exhibited similar phase behavior. The first heating cycle revealed a crystal-to-SmA transition at 136 °C (
Figure S13b), followed by isotropization at 216 °C. Upon cooling, the SmA phase re-emerged at 200 °C and persisted over a wide temperature range, with the SmA-to-Cry
x transition again occurring near 36 °C, as confirmed by both POM and DSC (
Figure 1c,d). These findings confirm that complexes
2a and
2b exhibit monotropic SmA phases in their cooling profiles.
The formation of the SmA phases in complexes
2a and
2b is attributed to their elongated, rod-like molecular architecture. Smectic liquid crystalline phases are typically observed in systems with high aspect ratios, where molecules can align into layered structures that exhibit both positional and orientational order. In the molecular design employed here, the rigid aromatic core—composed of a benzimidazole-based NHC and a phenylacetylide ligand linked via a central Au(I) atom—facilitates lamellar alignment, while the flexible alkoxy chains appended to both ligands provide the necessary mobility to support mesophase formation. This combination enables the emergence of a thermodynamically stable SmA phase. Our design rationale is supported by prior observations: Au(I) complexes lacking alkoxy chains on the NHC ligand fail to exhibit liquid crystallinity, emphasizing the critical role of symmetric placement of flexible chains on either side of the rigid core [
23]. The long, rod-like molecular shape and balanced flexibility enable the self-assembly of unit mesogens into well-defined lamellar arrangements, as reflected in the fan-shaped textures observed via POM.
The inability of the SmA phase to reappear during subsequent heating cycles is ascribed to significant differences in molecular packing between the initial crystal phase (Cry1) and the recrystallized phase (Cryx) formed after cooling from the isotropic melt. Smectic phases, due to their high degree of positional order, are especially sensitive to variations in intermolecular alignment. Cry1 crystals, grown slowly from mixed solvents, exhibit ordered packing conducive to SmA formation. In contrast, Cryx is formed through rapid cooling from the isotropic state, likely resulting in a kinetically trapped structure with lower order, which hinders the re-emergence of the SmA phase upon reheating. Conversely, SmA phases were reproducibly observed in the cooling processes from the isotropic melt. As thermal energy decreases, the molecular mobility enables the rod-like complexes to self-organize into lamellar arrangements stabilized by intermolecular interactions. This thermodynamically favored reassembly yields the characteristic SmA textures and underlines the reversibility of SmA formation exclusively in the cooling pathway.
The complete phase sequences, transition temperatures, and associated enthalpies are presented in
Table 2. Compared with previously reported systems [
23], the improved thermal stability of the SmA phases in complexes
2a and
2b is attributed to the incorporation of longer, flexible alkoxy chains on both NHC and acetylide ligands. These results collectively demonstrate that a high aspect ratio alone is insufficient to induce LC behavior; rather, molecular symmetry and flexibility are also essential factors. The combination of NHC and acetylide ligands in complexes
2a and
2b allows the synergistic realization of thermal stability, PL, and liquid crystallinity.
3.3. Photoluminescence Behavior of Complexes in Solution Phase
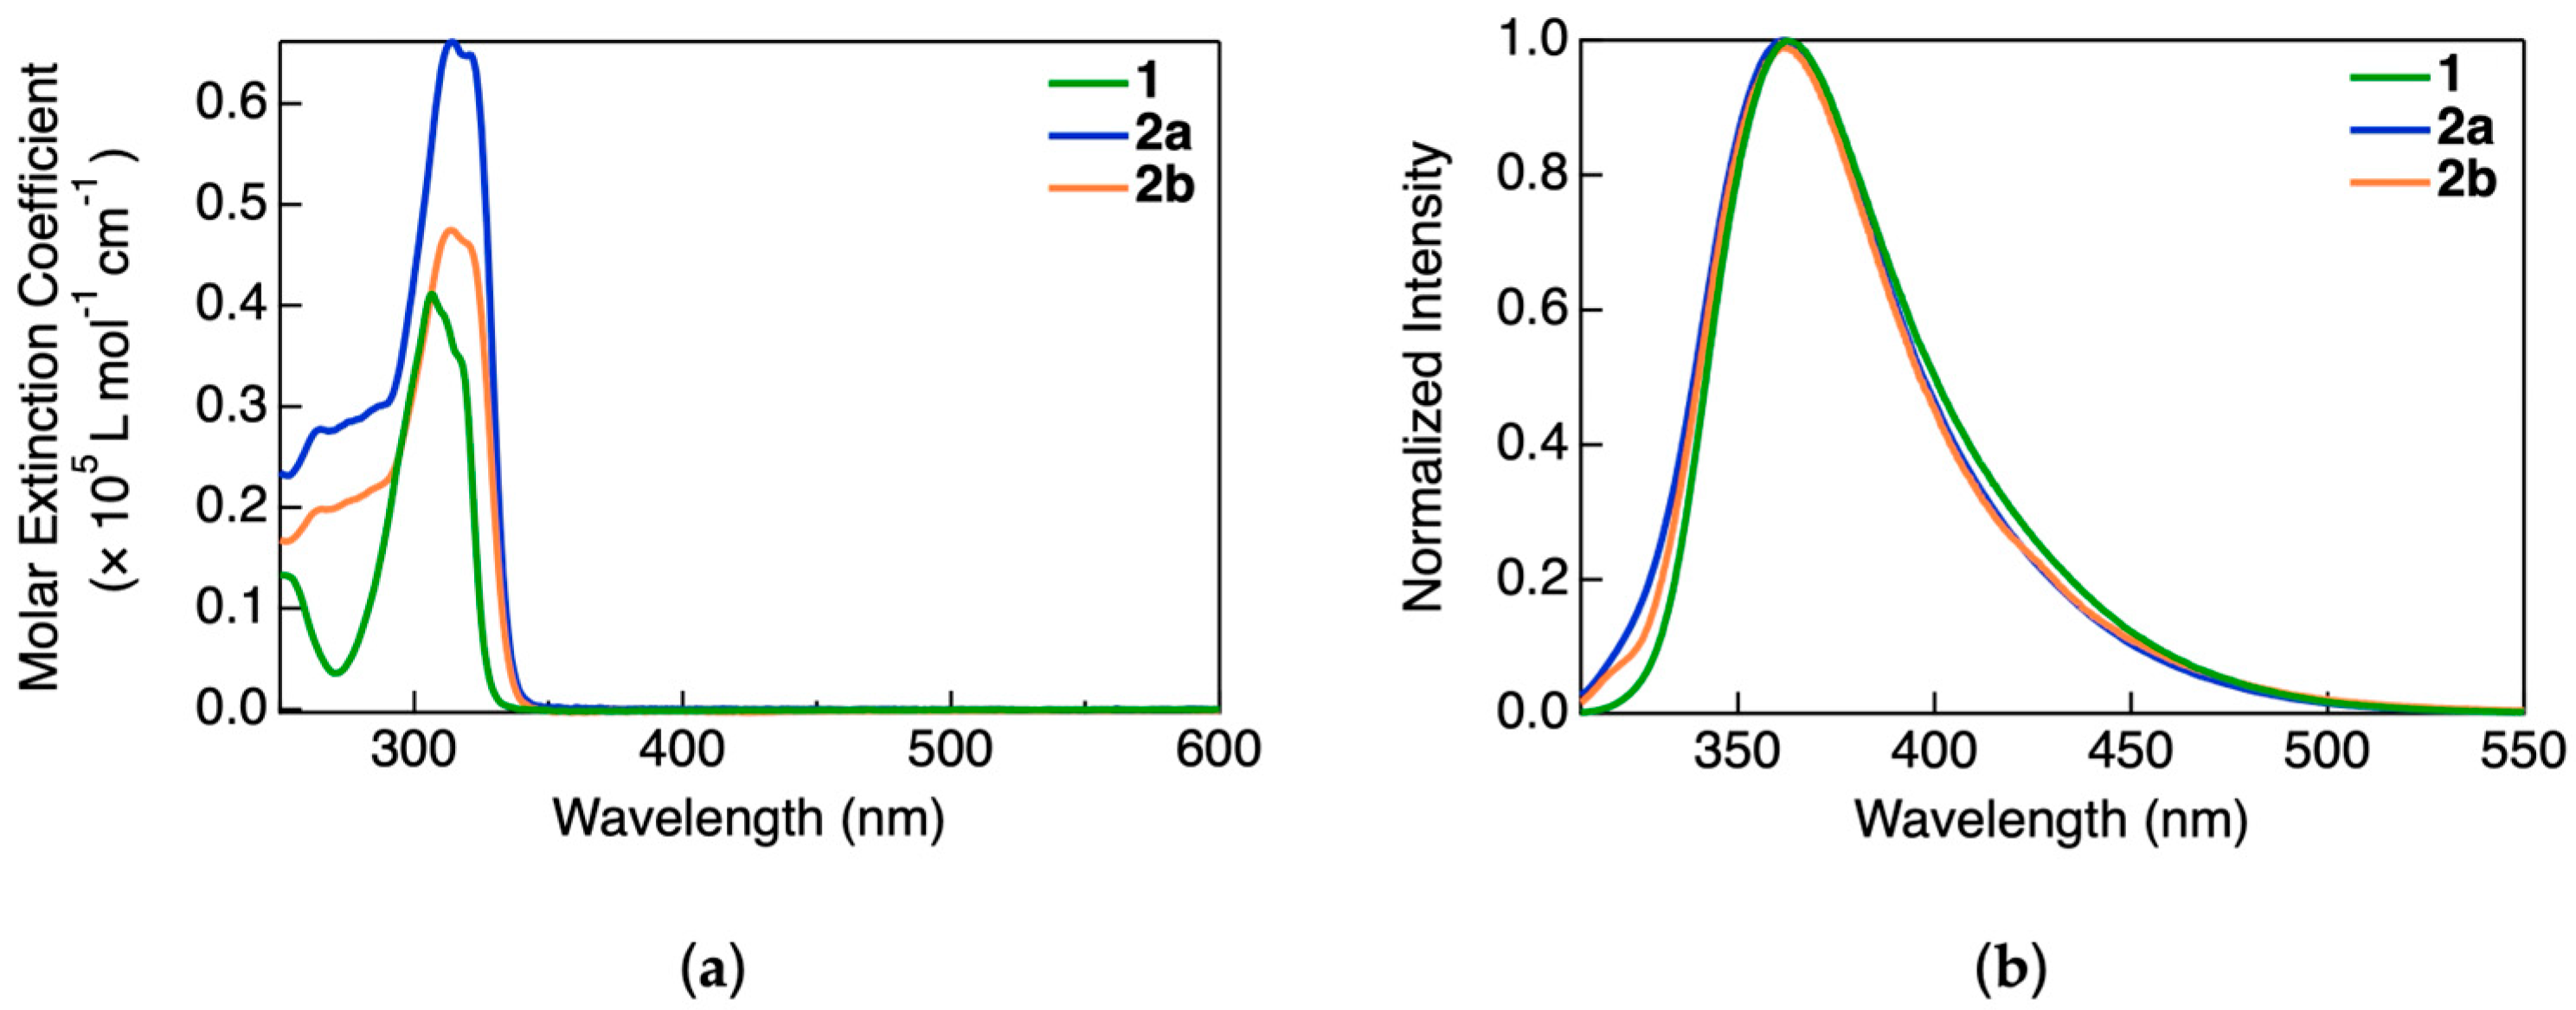
The UV–visible absorption spectra of the complexes were recorded in a dichloromethane solution, as shown in
Figure 2a. All three complexes exhibited absorption exclusively in the UV region, with maxima at 307 nm for 1, 316 nm for 2a, and 314 nm for 2b. The corresponding molar extinction coefficients were on the order of ~10
4 L mol
−1 cm
−1. Despite structural differences, the absorption bands were similar across the complexes and are therefore assigned to ligand-centered π–π* transitions arising from the NHC ligands, which are common to all three molecules. No absorption bands were observed in the visible region, suggesting the optical transparency of these compounds in that range. This property makes them promising candidates for incorporation into light-emitting devices that require minimal self-absorption.
The PL spectra of the complexes in dilute dichloromethane solution are shown in
Figure 2b. All compounds exhibited broad, structureless emission bands centered around 365 nm, with spectral envelopes spanning from 330 to 500 nm. The spectral similarity among the three complexes is attributed to monomeric, ligand-based emissions, as expected under dilute conditions where intermolecular interactions are negligible. These observations are consistent with previously reported photophysical behaviors of Au(I)–NHC complexes, where emission predominantly arises from singlet or triplet ligand-centered states in the absence of aggregation. The combined photoluminescence excitation, emission and the absorption spectra of all the complexes are shown in
Figure S14.
3.4. Photoluminescence Behavior of Complexes in Crystal
The PL behavior of the complexes was also investigated in the crystalline phase. All three complexes exhibited blue emission with broad spectra extending from 350 to 550 nm. The PL excitation and emission spectra are shown in
Figure 3.
Compared with their solution-phase emission, the solid-state emission bands were significantly redshifted and more intense, indicating the formation of lower-energy emissive states in the crystal lattice. Complex 1 exhibited relatively weak blue emissions, with a broad emission band centered at 448 nm. Additionally, a secondary emission peak at approximately 360 nm was observed, corresponding to the monomeric emission identified in the solution phase. Thus, the 360 nm band was assigned to monomer-based emission, and the redshifted 448 nm band was attributed to AIE in the solid state.
Upon introduction of acetylide ligands to complex
1, the resulting complexes
2a and
2b exhibited enhanced crystallinity and stronger luminescence. Their PL spectra displayed vibronically structured bands with primary peaks at 425 nm and shoulder features near 450 nm. These emission profiles are similar to those reported for previously studied rod-like Au(I)–acetylide complexes, suggesting that the emissive states in
2a and
2b are localized on the phenyl acetylide moieties [
10].
To further investigate the emission mechanism,
τ and
Φ were measured, and these results are summarized in
Table 3. Complex
1 exhibited a biexponential decay profile consisting of a fast component (67 ns) and a slower component in the microsecond range (~1 μs), consistent with dual contributions from monomeric and aggregated species. In contrast, complex
2a exhibited a single-exponential decay, while complex
2b displayed biexponential kinetics. All three complexes exhibited average lifetimes in the microsecond range, confirming that the observed emissions arose from triplet states, characteristic of RTP. Furthermore,
2a and
2b exhibited substantially higher PL quantum yields than
1, indicating that the phenyl acetylide ligands play a significant role in enhancing luminescence in the solid state. In contrast, for complex
1, the emission originated primarily from the NHC ligand.
3.5. Variable-Temperature PL Behavior of Complexes
The temperature-dependent PL of the complexes was investigated during both heating and cooling. Emission spectra were recorded at 10 °C intervals, starting from room temperature up to the melting point during heating, and in reverse during cooling.
In all cases, the emission intensity gradually decreased with increasing temperature. This behavior is attributed to enhanced nonradiative decay processes at elevated temperatures, which disrupt molecular aggregation and reduce RTP efficiency. For complex
1, the emission band centered at 448 nm diminished with temperature, whereas the shorter-wavelength band (~360 nm) remained largely unaffected (
Figure S15a). This supports the assignment of the 360-nm emission band to monomeric species, which are less sensitive to thermal motions.
Notably, the DSC thermogram of 1 exhibited a strong endothermic peak at 80 °C, corresponding to a crystal-to-crystal phase transition (Cry1 → Cry2) observed via POM. The PL spectrum of Cry2 differed from that of the original crystalline form, indicating phase-dependent emissive behavior. At ~120 °C, the isotropic phase was formed, and the 448 nm emission was completely quenched, leaving only the monomeric emission band. Upon cooling, the recrystallized sample (Cryx) did not fully recover the original PL intensity or spectral features, suggesting irreversible structural changes affecting the emissive properties.
The temperature-dependent PL of complexes
2a and
2b are shown in
Figure 4,
Figures S16 and S17. Both complexes exhibited reduced emission intensity upon heating, consistent with increased thermal quenching. For complex
2a, the crystal-to-Smectic A (SmA) transition occurred at 145 °C, as confirmed by DSC and POM. The LC phase exhibited a weaker and broadened PL spectrum compared with the crystalline state. A redshift of the primary emission band from 425 to 465 nm was observed in the isotropic phase, alongside a secondary band around 370 nm, which matches the solution-phase emission and is thus assigned to monomeric emission.
Upon cooling, the SmA phase reappeared and exhibited PL features similar to those in the isotropic state. As the temperature decreased further, a gradual reappearance of the 465 nm band was observed, indicating the SmA-to-crystal phase transition. At ~30 °C, a sharp increase in 465 nm emission was detected. However, the original emission spectrum and intensity were not fully restored, suggesting that the recrystallized form (Cryx) differs from the original crystal (Cry1) with regard to packing and aggregation, which play a critical role in solid-state luminescence.
Complex 2b exhibited analogous behavior. A phase transition to the SmA phase occurred at 136 °C during heating, and cooling resulted in partial restoration of the PL features, with spectral shifts and intensity changes following the same trends observed for 2a.
3.6. Variable-Temperature PXRD
Variable-temperature PXRD measurements were conducted to investigate the effects of molecular aggregation across various phases—particularly the crystalline and LC phases—on the photophysical properties. As a representative example, the PXRD patterns of complex
2b are presented in
Figure 5, corresponding to the original crystalline phase (Cry
1), the Smectic A (SmA) phase formed upon cooling, and the recrystallized phase (Cry
x).
The formation of the SmA phase was initially confirmed by DSC and POM at 136 °C during the first heating cycle. However, no diffraction peaks characteristic of a lamellar LC structure were observed at this temperature, likely owing to thermal motion and phase coexistence. Upon cooling of the molten sample, PXRD clearly revealed the formation of the SmA phase. At 180 °C, the PXRD pattern exhibited distinct reflections in the small-angle region, corresponding to d-spacings of 17.8 and 11.1 Å. In addition, a broad halo at 2θ = 15.8° was observed in the wide-angle region, indicative of lateral fluidity and short-range ordering typical of LC phases. The diffraction features and calculated d-spacings for the SmA phase of
2b are presented in
Table 4. The ratio of these d-spacings (~2:3) supports a lamellar molecular arrangement. For the complex
2a, the PXRD patterns and interlayer spacings are shown in
Figure S19 and
Table S1.
These findings are consistent with previous studies on rod-like Au(I) complexes, in which dimeric structures assembled into layered arrangements within the SmA phase [
11]. Although single-crystal X-ray analysis could not be performed for the present complexes, owing to their low crystallinity, related compounds with similar molecular frameworks have been shown to adopt antiparallel dimeric arrangements [
24]. It is thus speculated that
2a and
2b also form antiparallel dimers that function as the basic mesogenic unit in the SmA phase.
Further cooling to 36 °C induced a phase transition from SmA to Cryx, as confirmed by changes in the PXRD pattern. Notably, the diffraction pattern of Cryx differed significantly from that of the original Cry1 phase, providing additional evidence that the crystalline structure formed upon cooling from the isotropic melt is distinct from the original crystal.
These results highlight the thermodynamic stability and reversible phase behavior of the SmA phase in complexes 2a and 2b. The ability to maintain ordered mesophases over a wide temperature range makes these materials promising for application in display technologies and functional soft materials.
4. Conclusions
We synthesized and characterized a series of Au(I) complexes bearing NHC and phenyl acetylide ligands, designed to combine the thermal robustness of NHC ligands with the LC behavior introduced by alkynyl substituents. Complexes 2a and 2b exhibited thermodynamically stable Smectic A (SmA) mesophases, while complex 1 exhibited no LC behavior, underscoring the critical role of molecular symmetry and the presence of long alkoxy chains on both ligands.
The sterically hindered, symmetrically disubstituted NHC ligand in complex 1, despite its high aspect ratio, was insufficient to induce liquid crystallinity, indicating that molecular flexibility and packing anisotropy are also essential factors. In contrast, incorporation of acetylide ligands in 2a and 2b disrupted symmetry and enhanced anisotropy, resulting in LC-phase formation.
Additionally, complexes 2a and 2b exhibited significantly enhanced solid-state PL, with high quantum yields and microsecond-range lifetimes indicative of RTP. The correlations among the molecular packing, phase behavior, and photophysical properties suggest that rational ligand design can effectively modulate both mesophase stability and emissive characteristics.
Compared with our previous reports, the LC phases in 2a and 2b exhibit improved thermal stability and broader temperature ranges, offering a promising molecular design strategy for the development of phosphorescent Au(I) complexes applicable to functional soft materials and optoelectronic devices.


