Article

Improving the Interpretability of ANN-Based Predictions of Lattice Constants in Aliovalently Doped Perovskites Using Partial Dependence Plots

by
Abdullah Alharthi
1,
Abdulgafor Alfares
2,
Yusuf Abubakar Sha’aban
2,* and
Dahood Ademuyiwa Adegbite
3
1
Department of Electrical Engineering, King Khalid University, Abha 62521, Saudi Arabia
2
Department of Electrical Engineering, College of Engineering, University of Hafr Al Batin, Hafr Al Batin 39524, Saudi Arabia
3
Renewables Department, Saudi Arabian Oil Company, Gharb Al Dhahran 31311, Saudi Arabia
*
Author to whom correspondence should be addressed.
Crystals 2025, 15(6), 538; https://doi.org/10.3390/cryst15060538
Submission received: 18 April 2025 / Revised: 8 May 2025 / Accepted: 26 May 2025 / Published: 5 June 2025
(This article belongs to the Section Inorganic Crystalline Materials)

Abstract

:
The relationship between structure and properties is fundamental in materials science, particularly for aliovalently doped perovskites, where structural changes significantly influence material performance. Accurate prediction of key structural parameters is essential for tailoring these materials for advanced applications. In this study, we developed an Artificial Neural Network (ANN) model to predict lattice constants with high accuracy, achieving near-perfect R2 values and minimal prediction errors across training and testing datasets. To address the interpretability challenge commonly associated with black-box models, we integrated Partial Dependence Plots (PDPs), enabling a transparent analysis of how input features, including lattice parameters a, b, c, and the number of formula units per unit cell (Z), affect model predictions. Our findings show that parameters a, b, and c generally contribute to lattice expansion, while Z exhibits an inverse relationship due to its impact on packing density. The inclusion of PDPs offers novel insights into the underlying physical relationships and enhances the trustworthiness of machine learning (ML) predictions in the context of perovskite design. This approach demonstrates the utility of combining high-accuracy ML models with interpretability techniques to accelerate discovery in materials science.

1. Introduction

Perovskite materials have attracted significant attention in recent years due to their wide range of applications in modern technologies, such as photovoltaics [1], ferroelectric devices [2], and superconductors [3]. The unique properties of perovskites, including high efficiency in solar cells and excellent dielectric properties, make them indispensable in advancing sustainable energy solutions and electronic devices [4,5].
Recent advances in perovskite research have demonstrated that precise control over lattice parameters is critical for tailoring functional properties such as dielectric behavior, optical absorption, carrier transport, and structural stability. For instance, lattice constant tuning has been shown to significantly impact device performance in applications including high-frequency transducers [6], light-emitting and photodetector devices [7], and solar cells through facet engineering and interface optimization [8,9]. Moreover, structural manipulation via lattice distortion has enabled low-temperature synthesis of materials with giant permittivity [10], underscoring the importance of precise lattice control in advancing perovskite technologies.
The perovskite structure (ABO3) offers a highly flexible lattice framework capable of accommodating diverse chemical substitutions, making it ideal for tunable functional materials. In its cubic form, the A-site cation occupies the corners of the unit cell, the B-site cation is located at the body center, and O2− anions form octahedra around the B-site—refer to Figure 1. This structural versatility enables aliovalent doping, where ions of different valences replace host cations or anions, introducing charge imbalances typically compensated by the formation of vacancies, particularly oxygen vacancies, which induce local lattice distortions [11,12,13]. These distortions can significantly impact the material’s structural and functional properties, influencing ionic conductivity, electronic behavior, magnetism, and thermal stability [11,12,13,14]. Understanding how aliovalent doping affects lattice constants is therefore crucial for optimizing perovskites for specific applications, despite the complexities introduced by vacancy formation and structural disorder.
Their lattice constant is a fundamental aspect that dictates perovskites’ properties [15]. The lattice constant is a critical parameter influencing these materials’ electronic, optical, and mechanical properties [16]. Accurate prediction and understanding of lattice constants are thus essential for the design and optimization of perovskite-based devices [17]. This is particularly significant for aliovalently doped perovskites, where introducing dopants can create vacancies and alter the lattice structure, leading to enhanced or novel material properties [11].
Traditional first-principles methods such as density functional theory (DFT) are often computationally intensive when modeling aliovalent doping, particularly in systems with large structural variability, defect formation, or ionic size mismatch [18,19]. This presents a practical limitation for high-throughput screening and data-driven material design. To address this, we propose an interpretable machine learning approach that predicts subtle variations in the lattice constants of doped perovskites with minimal computational overhead. The goal is not only to achieve high prediction accuracy but also to provide insights into feature contributions using transparent, explainable tools, thereby supporting both rapid prototyping and scientific interpretation.
In the quest to predict material properties, machine learning (ML) has emerged as a powerful tool due to its ability to handle large datasets and uncover complex patterns that traditional methods might miss [20,21,22]. Various ML techniques, including neural networks, support vector machines, and decision trees, have been employed to predict properties like band gaps [23,24], formation energies [25], and the lattice constants of materials [19,26,27,28]. Recent studies have demonstrated the potential of ML in predicting the lattice constants of perovskites with high accuracy [19,26,27,28,29,30]. As reflected in several studies, ANNs and other similar ML techniques have been used to estimate the lattice constants of various materials [31,32]. Table 1 presents recent studies that employ machine learning (ML) methods for predicting the lattice constants in various materials.
Recent advancements in machine learning have significantly advanced the modeling, screening, and optimization of perovskite materials, particularly in predicting stability, band gaps, and optoelectronic properties [33,34,35,36,37]. These efforts demonstrate the growing importance of ML not only for achieving predictive accuracy but also for accelerating materials discovery and design. However, despite their noted success, most ML models, including Artificial Neural Networks (ANNs), are often criticized for their black-box nature. While they can provide highly accurate predictions, they typically offer limited insight into the relationships between input features and predicted outcomes. This lack of interpretability poses a significant barrier to adopting ML models in materials science, where understanding the mechanisms behind material behavior is as important as the predictions themselves [38,39]. The black-box nature of ANNs means that while they can accurately predict the lattice constants, they do not explain how different factors, such as ionic radii, doping levels, and vacancy formation, influence the lattice constant. This limitation hinders the ability to derive meaningful scientific insights from the models, making it challenging to trust and apply these predictions in experimental and industrial settings, particularly for complex systems such as aliovalently doped perovskites [31,32,40].
This study proposes a novel integration of Partial Dependence Plots (PDPs) with Artificial Neural Network (ANN) models to enhance the interpretability of predicting lattice constants in aliovalently doped perovskites. PDPs, a model-agnostic interpretability technique, enable the visualization of the marginal effects of specific input features, such as the lattice parameters along the a-axis (a), b-axis (b), and c-axis (c), as well as the number of ABX3 formula units per unit cell (Z) [41,42].
Our research involved developing an ANN model trained on a comprehensive dataset of experimentally measured lattice constants to predict the properties of various aliovalently doped perovskites. After training, we applied PDPs to analyze how changes in the a-axis, b-axis, c-axis, and the number of formula units per cell impact these predictions. This analysis not only deepened our understanding of the material properties but also identified potential biases or anomalies in the data, leading to the development of more accurate and dependable models.
The main contribution of our work lies in its fusion of high prediction accuracy with substantial interpretability. This integration facilitates a better understanding of complex model outputs and enhances transparency and trust in ANN models for material design and optimization. As machine learning technology advances, incorporating interpretability techniques such as PDPs is crucial for advancing research in materials science, fostering innovation, and enabling more informed decision-making in the field.
Table 1. Summary of machine learning studies on lattice constant prediction in various materials.
MaterialsInput FeaturesMachine Learning MethodsModel Performance (RMSE:)Interpretability of FeaturesGeneral CommentsYearsRef.
Cubic perovskites (ABX3)Ionic radii, electronegativity, density, and atomic numberSupport Vector Regression (SVR), Gaussian Process Regression (GPR), Artificial Neural Networks (ANN), and Ensemble Regression Trees (ERTs)0.0371NoGPR model achieved the highest precision, providing a scalable and efficient technique that could aid in screening for material discovery2025[19]
A2XY6 cubic crystals (A = K, Cs, Rb, TI; X = tetravalent cation; Y = F, Cl, Br, I)Ionic radii, electronegativitiesSupport Vector Regression (SVR)-NoThe SVR model showed lower total relative deviation compared to an existing linear model, demonstrating improved prediction accuracy and potential for material design.2020[43]
Cubic perovskite compoundsIonic radiiGaussian Process Regression (GPR)0.023NoExplored the relationship between ionic radii and lattice constants; GPR model noted for high accuracy and stability in predicting lattice constants.2020[44]
Double perovskite oxides (A22 + BB′O6)Ionic radii, electronegativities, oxidation statesGaussian Process Regression (GPR)0.024NoStatistical relationship elucidated among ionic radii, electronegativities, and oxidation states; model noted for high accuracy and stability in predicting lattice constants.2020[45]
Monoclinic double perovskites (A2B′B″O6)Effective ionic radiiGaussian Process Regression (GPR)0.0026NoRelationships between effective ionic radii and multiple lattice constants (a, b, c, β) studied; GPR model praised for its accuracy and cost-effectiveness in predictions.2021[29]
Cubic perovskites (ABX3)Ionic radii, number of valence electronsGaussian Process Regression (GPR)0.02104NoUtilized ionic radii and number of valence electrons to predict lattice constants across a diverse set of perovskites; noted for good performance in stability and accuracy.2021[46]
Pseudo-cubic/cubic perovskiteIonic radiiELM, SVR-PSO hybrid0.0206NoComparison of ELM and SVR-PSO models with Ubic and Sidey models; SVR-PSO showed superior accuracy and ELM noted for ease of implementation despite moderate performance.2020[47]
SpinelsIonic radii, electronegativitiesGaussian Process Regression (GPR)0.042NoThe investigation of 167 spinel samples showed more accurate predictions of lattice constants via GPR than previous linear models.2020[28]
Aliovalently doped perovskitesLattice parameters (a, b, c) and ZArtificial Neural Networks (ANN)0.00097Partial Dependence Plots (PDPs) used to visualize marginal effects of featuresHigh predictive accuracy and full experimental dataset; enhanced interpretability through PDPs2025[This work]

2. Materials and Methods

2.1. Machine Learning Model Development

This section details the comprehensive methodology employed to develop and implement a machine learning model, specifically an Artificial Neural Network (ANN), for predicting lattice constants in aliovalently doped perovskites. The development process encompasses several vital steps: data collection and description, data preparation and splitting, ANN model development, and implementation. Each step ensures the model’s accuracy, robustness, and interpretability.

2.1.1. Data Collection and Descriptions
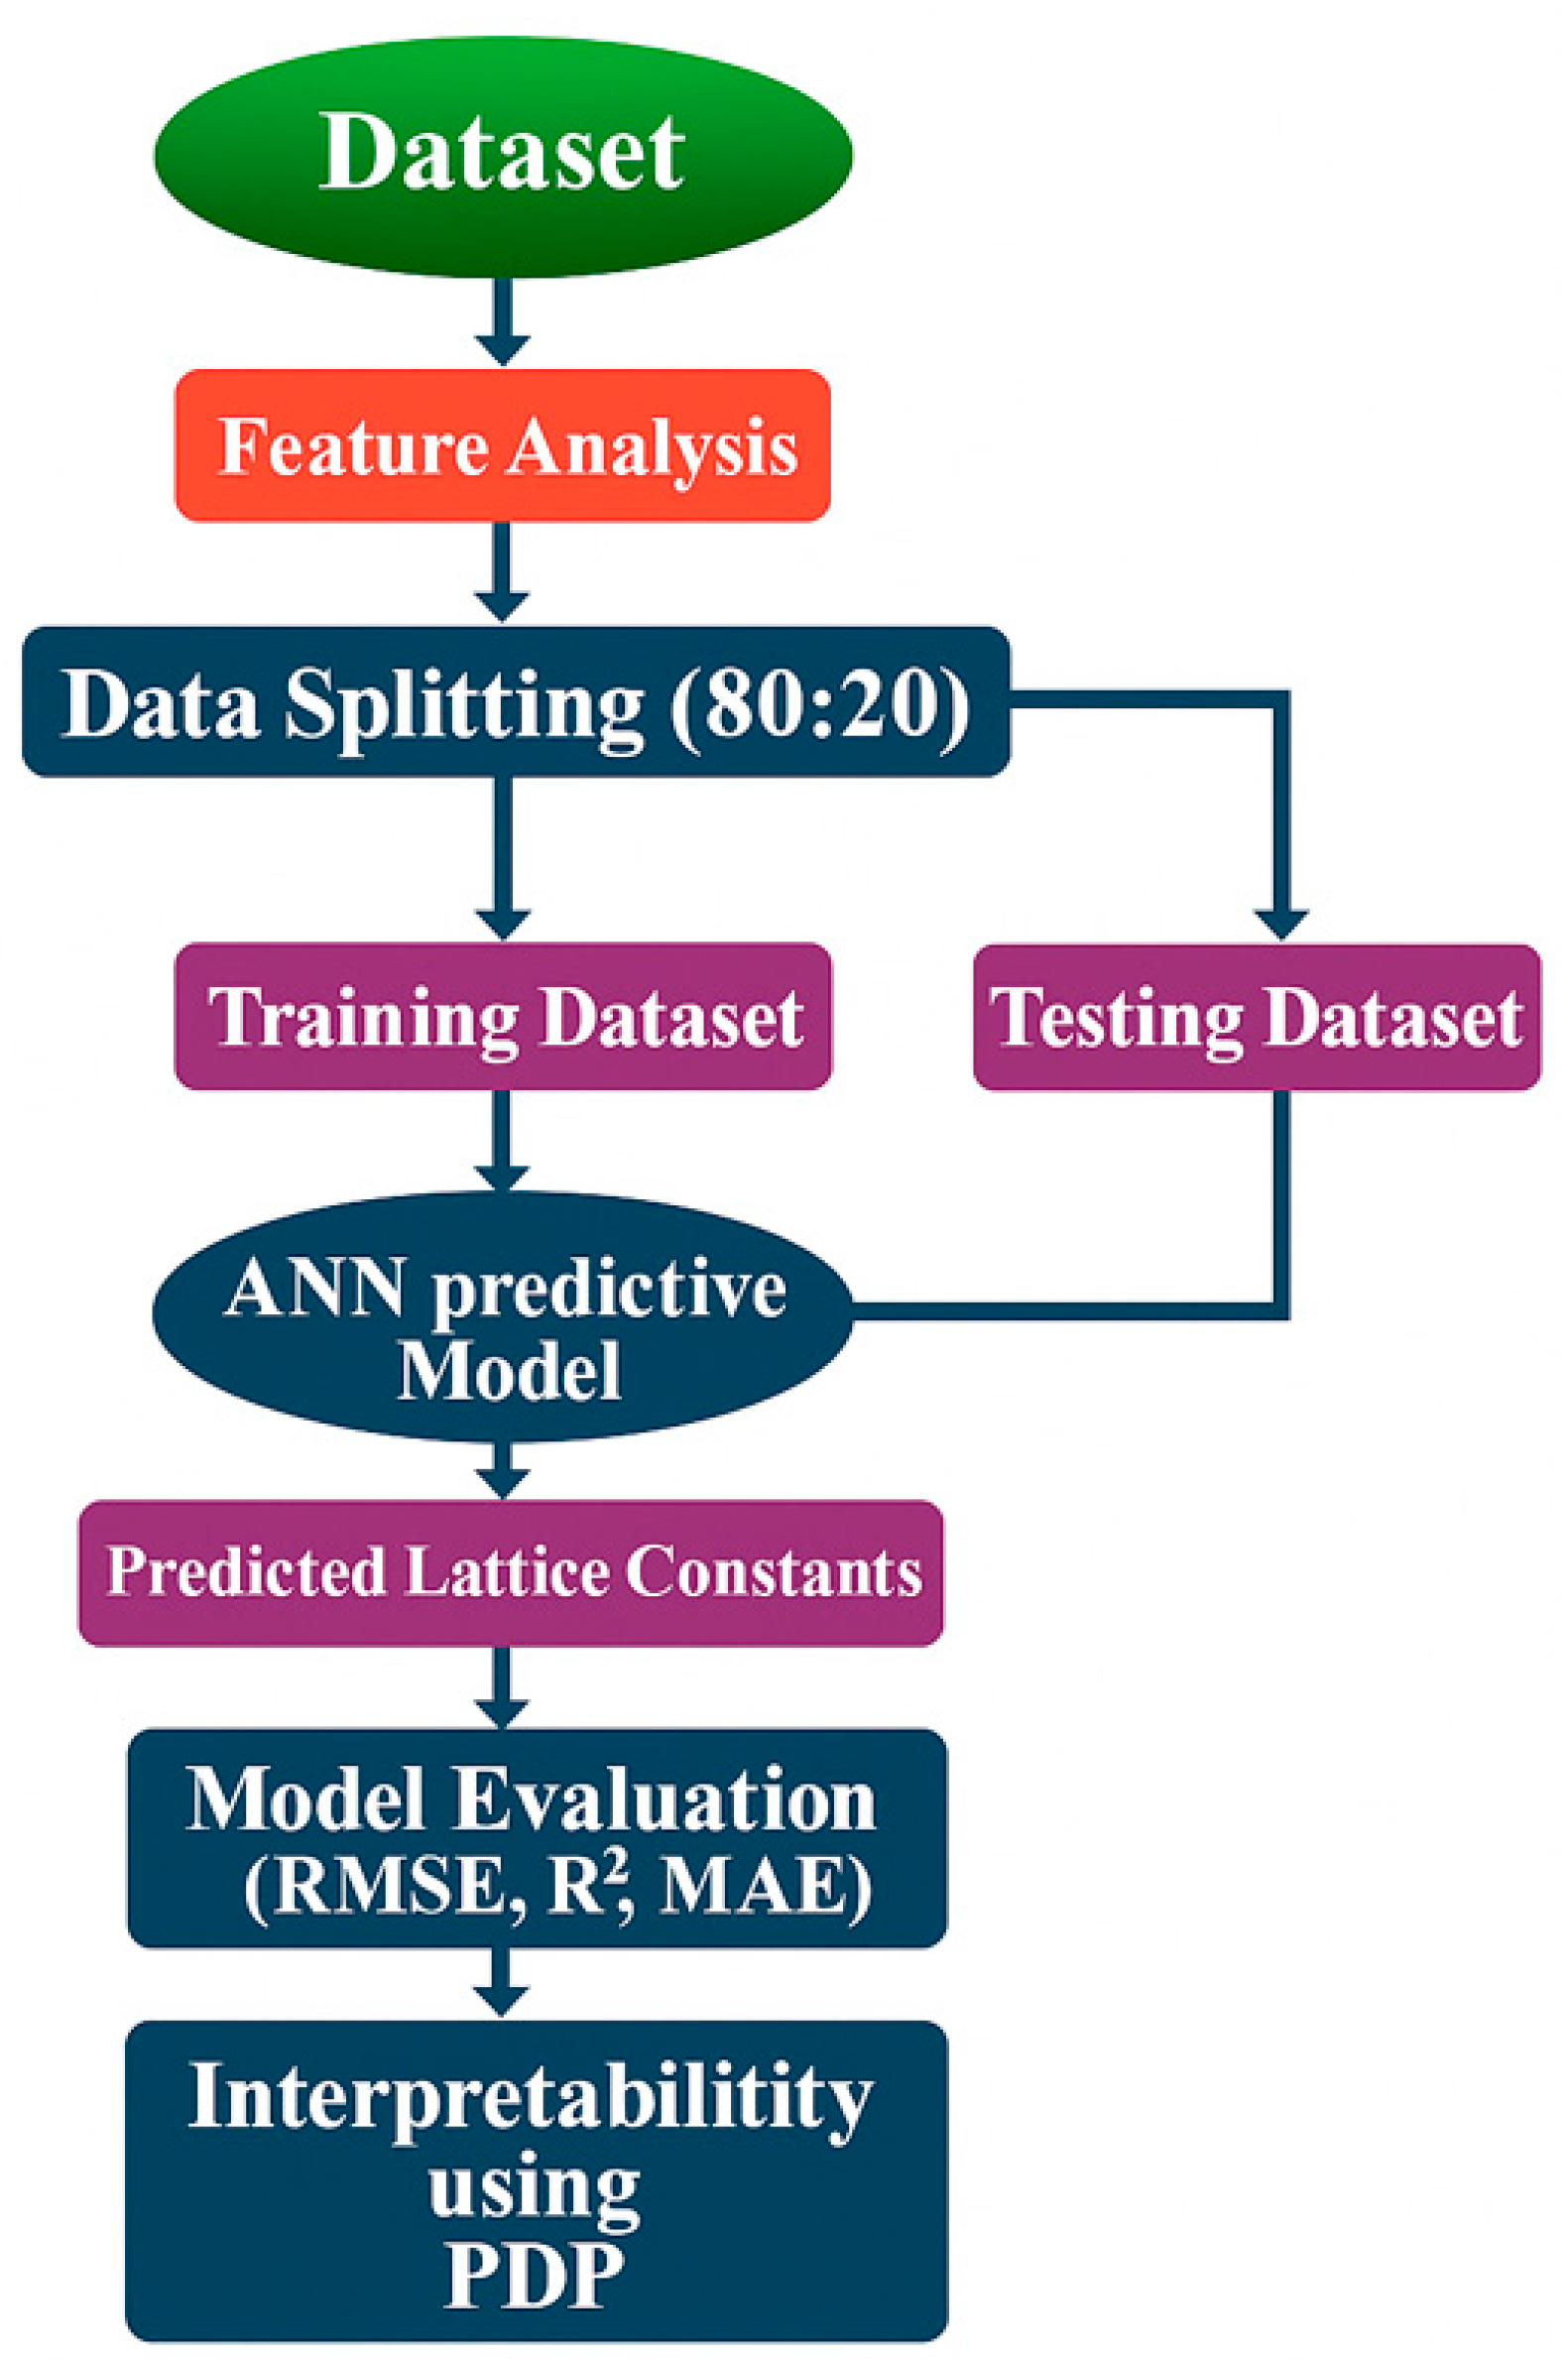
The dataset utilized for this study was taken from the previously published literature [31]. The materials covered in this dataset encompass a range of perovskite compositions, including CaTiO3 and its doped variants (e.g., Ca0.97La0.02TiO3, Ca0.94La0.04TiO3). The primary dopants used are La (Lanthanum), Nd (Neodymium), and Y (Yttrium). Ubic et al. synthesized and characterized these materials, providing a robust foundation for our modeling efforts [31]. The characterization of these materials involved the precise determination of lattice parameters a, b, and c using X-ray diffraction (XRD) techniques. Additionally, the number of ABX3 formula units per unit cell Z was determined based on crystallographic analysis.
The features used in this study include the lattice parameters a (Å), b (Å), and c (Å), as well as the number of ABX3 formula units per unit cell, Z. The experimental lattice constant is the target variable for model training and validation. The statistical characteristics of the dataset are summarized in Table 2, which presents the mean, standard deviation, minimum, and maximum values for each input feature, along with a qualitative interpretation of their influence on the predicted lattice constant based on Partial Dependence Plot (PDP) analysis. The dataset used in this study comprises 72 experimentally measured samples of aliovalently doped perovskites [31]. Each entry includes the lattice parameters (a, b, c) and the number of formula units per unit cell (Z), with the target variable being the corresponding lattice constant. All input features were standardized using MATLAB’s (MATLAB2024b) built-in preprocessing tools prior to training to ensure uniform feature scaling. The dataset was randomly split into training (80%) and testing (20%) subsets for model development and evaluation.
The chosen features are critical for accurately predicting the lattice constants in aliovalently doped perovskites. The lattice parameters a, b, and c directly describe the dimensions of the unit cell and are fundamental descriptors of the crystal structure. The number of ABX3 formula units per unit cell Z is a crucial parameter as it provides information about the unit cell’s content and density. The range and standard deviation of Z reflect a variety of structural configurations that influence the lattice constant. The experimental lattice constant LC provides the ground truth for model training and validation. The narrow range and low standard deviation of the lattice constant indicate high precision in the experimental measurements, essential for developing accurate predictive models. The model can capture the intricate relationships between the structural parameters and the lattice constant by incorporating these features, resulting in precise and reliable predictions.

2.1.2. Methodology

To ensure the robustness and generalizability of the model, the dataset was randomly divided into training and testing subsets in an 80:20 ratio. This random division helps prevent any sampling bias. It allows the model to generalize well to unseen data. The training subset, comprising 80% of the dataset, was used to train the ANN model, while the testing subset, comprising 20% of the dataset, was reserved for evaluating the model’s performance. Additionally, the dataset was standardized to ensure that all features were on a comparable scale, which is crucial for effective neural network training.

2.1.3. Artificial Neural Network (ANN)

The ANN model used in this study was designed to capture the complex relationships between the input features and the lattice constants [48,49]. The training process involves feeding the training data into the MATLAB regression learner and selecting the ANN model, where the model learns to adjust its weights and biases through backpropagation to minimize the error between the predicted and actual lattice constants [50]. The learning rate and the number of epochs is tuned to optimize the model’s performance. The hyperparameters of the ANN model are shown in Table 3.

2.1.4. Implementation

All computational work was conducted in a MATLAB 2024a environment. The entire training and validation process is represented in Figure 2. During the training phase, the ANN model was iteratively trained on the training subset, adjusting its parameters to minimize the prediction error. The model’s performance was monitored to achieve the best possible results. To further our understanding of how different structural parameters influence the predicted lattice constants, we utilized Partial Dependency Plots (PDPs). PDPs provide a graphical representation of the average effect of a specific feature on the model’s prediction, holding all other features at their average values. The PDPs are essential tools for interpreting complex machine learning models by showing the marginal effect of one of the features on the predicted outcome [51,52].
To investigate the influence of individual input variables on the predicted lattice constant, Partial Dependence Plots (PDPs) were generated for each feature— a ,   b ,   c , and Z—using MATLAB R2024a’s built-in interpretability tools. In this approach, one feature is varied across its range while the others are held constant, and the model’s predictions are averaged over all samples. This method reveals the first-order marginal effect of each feature on the output, enhancing interpretability by visualizing the direct impact of each variable on the predicted lattice constant. Although feature interactions are not captured, PDPs provide a clear representation of the dominant trends learned by the ANN model.

2.2. Model Validation

The final phase of our methodology focused on validating the ANN model’s performance to ensure its reliability and applicability in predicting lattice constants. We employed several statistical measures to assess the accuracy and robustness of the model. The metrics used include the following: Root Mean Squared Error (RMSE), Mean Absolute Error (MAE), R-squared (R2), and Mean Absolute Percentage Error (MAPE) [41,42,53,54].

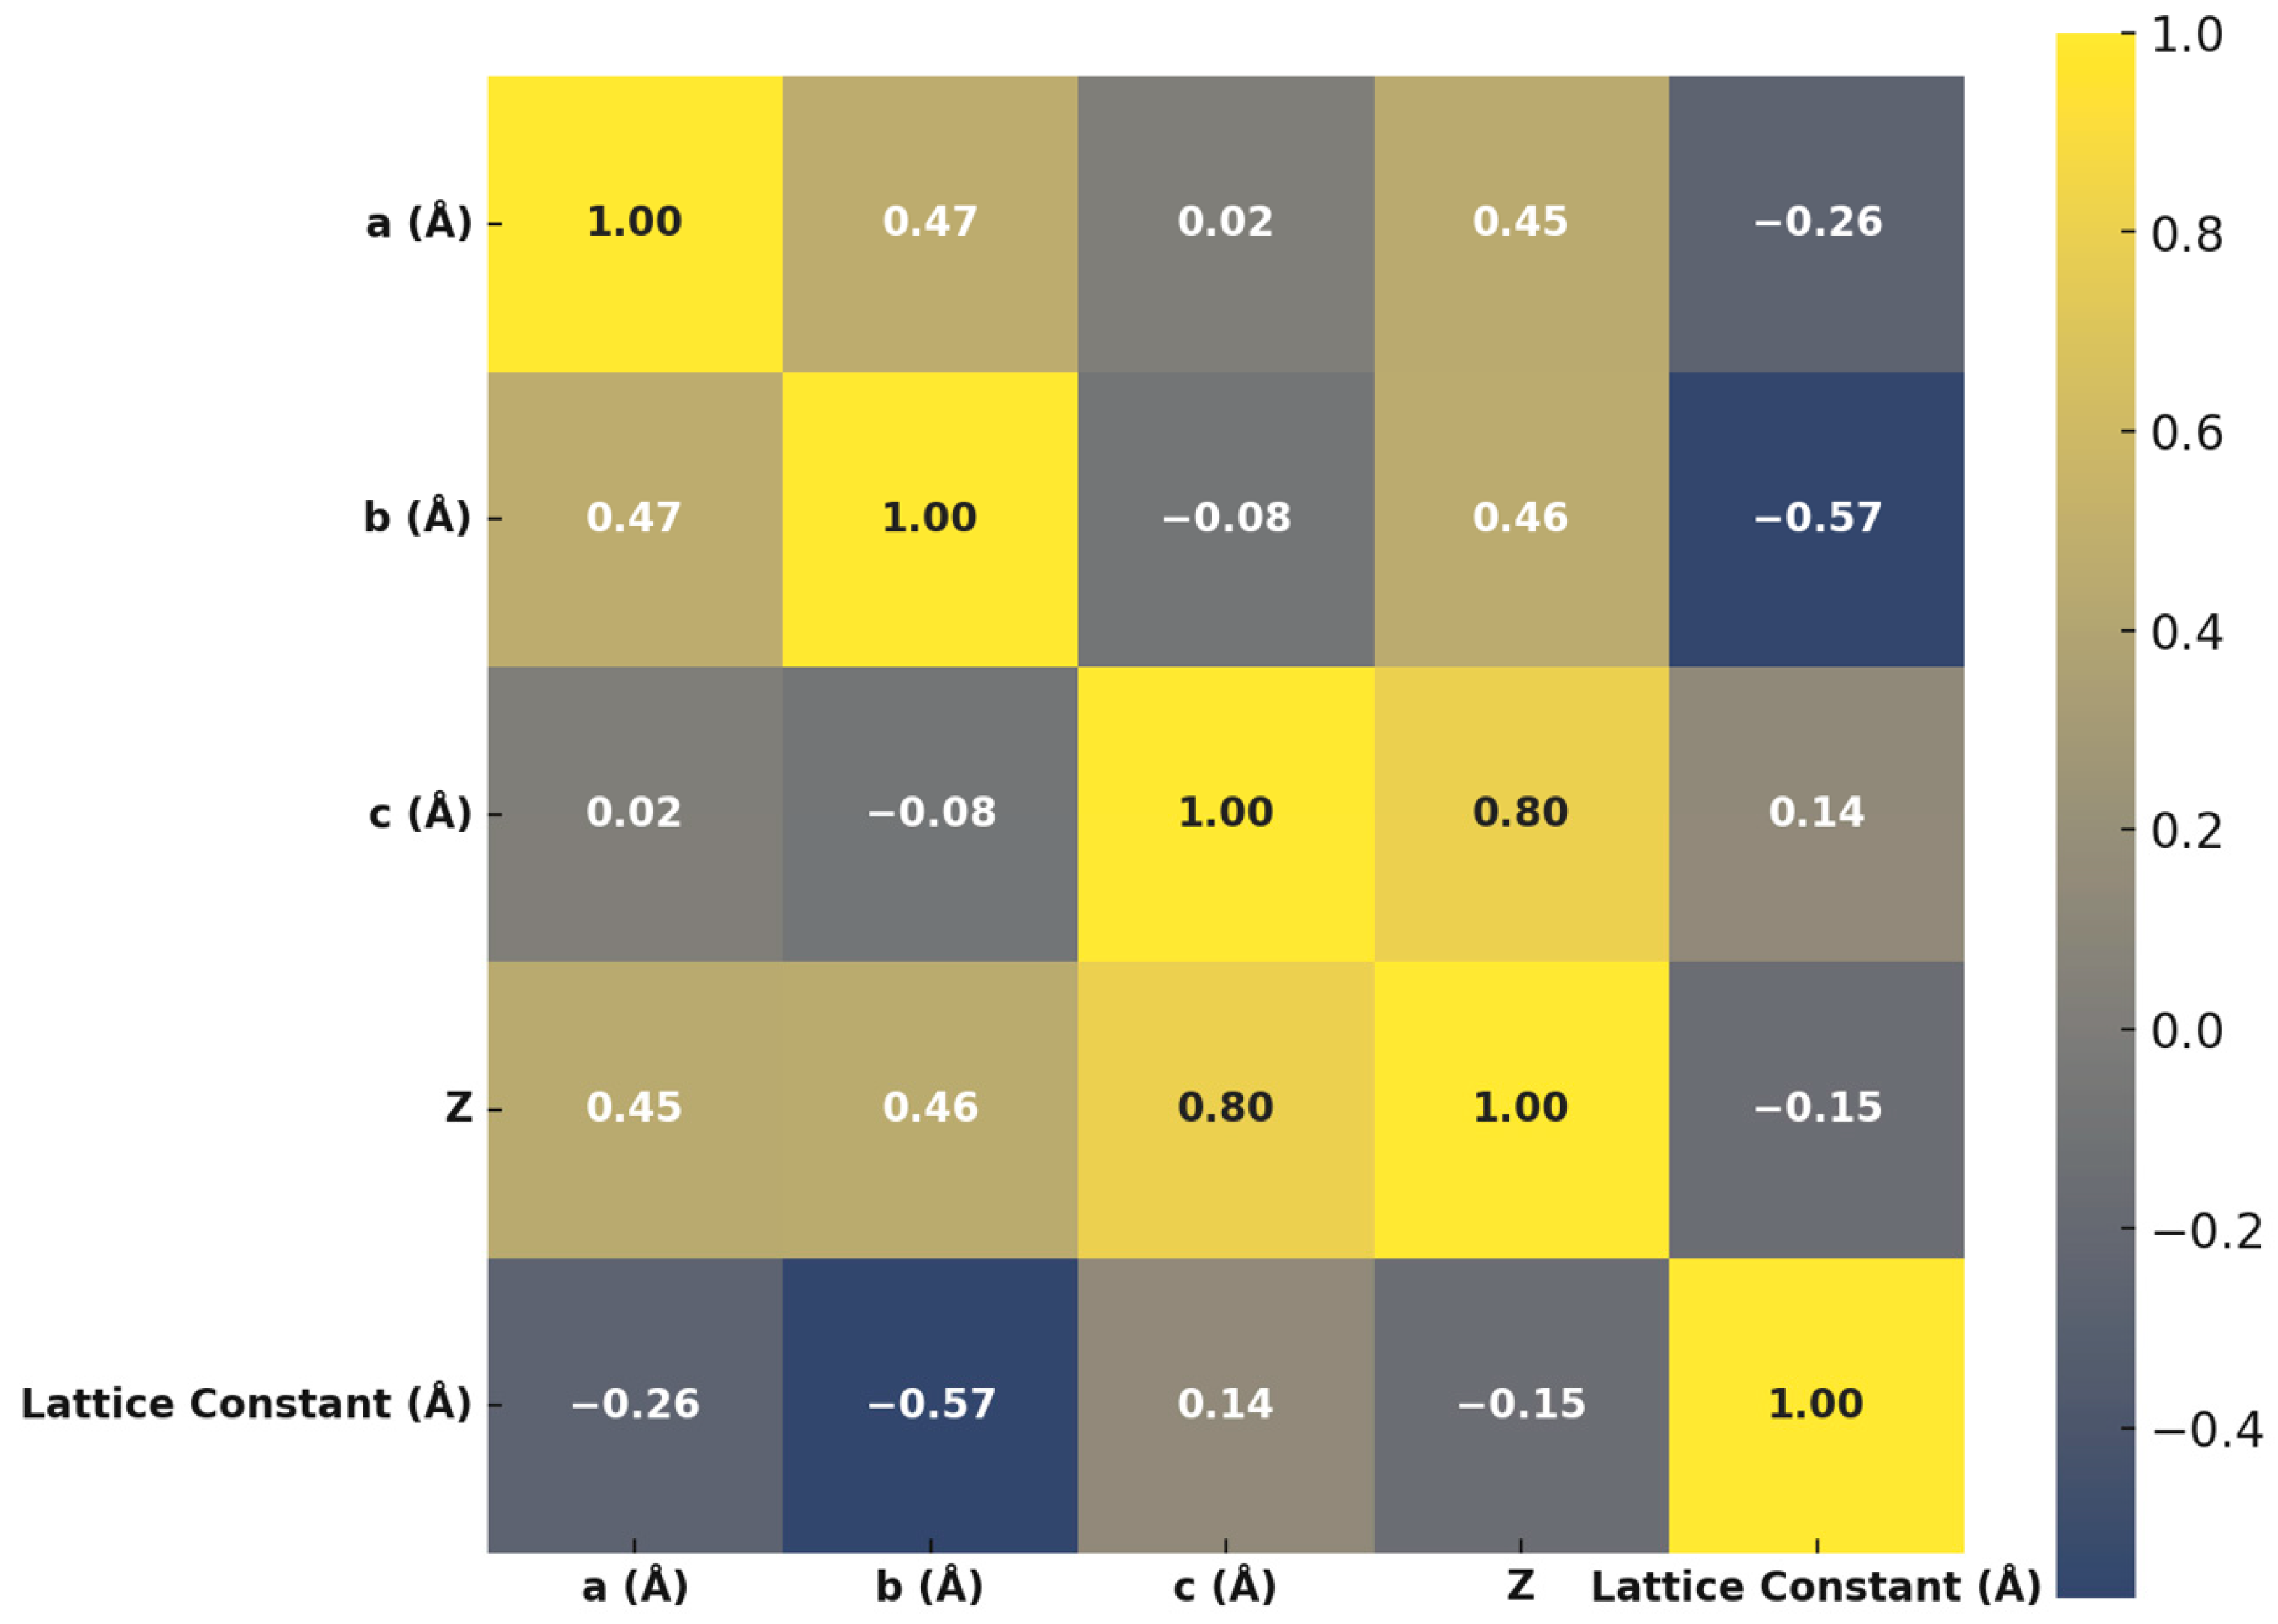
2.3. Data Exploration: Violin and Correlation Analysis

This section presents an in-depth analysis of the dataset used for predicting lattice constants in aliovalently doped perovskites. The analysis focuses on understanding feature distributions and inter-variable relationships using violin plots and correlation matrices, respectively.
Figure 3 displays violin plots for lattice parameters a, b, c (all in Å), and the number of formula units per unit cell (Z, unitless). These plots combine kernel density and box plot elements to show the spread and concentration of values. Parameters a and b show compact, symmetric distributions around the median, suggesting minimal variation across samples. In contrast, c exhibits a broader spread with distinct peaks, indicating higher structural variability among the compounds. The Z distribution is relatively uniform with slight clustering near the median. Among all features, c shows the greatest variability, which may influence the overall lattice architecture.
Figure 4 presents a correlation matrix showing pairwise relationships among a, b, c, Z, and the experimental lattice constant. Strong positive correlations exist between a, b, and c, indicating co-expansion of lattice dimensions. In contrast, a and b exhibit negative correlations with Z, suggesting denser unit cells may constrain those parameters. Interestingly, c is positively correlated with Z, implying elongation in that direction with increased formula units. These relationships highlight the intrinsic coupling between the lattice dimensions and packing density.

3. Results and Discussion

In this section, we present a comprehensive analysis of the performance of the Artificial Neural Network (ANN) model developed for predicting the lattice constants of aliovalently doped perovskites. This analysis includes statistical metrics, comparison plots, and residual evaluations, providing a detailed understanding of the model’s accuracy and reliability.

3.1. Performance Metrics and Model Evaluation

The performance of the ANN model was assessed using several key metrics, including Root Mean Squared Error (RMSE), Mean Squared Error (MSE), Mean Absolute Error (MAE), and R-squared (R2) values for both the training and testing datasets. These results are summarized in Table 4. The high R-squared values (1.00) for the training and testing datasets indicate that the model explains virtually all the variability in the predicted lattice constants. The low values of RMSE, MSE, and MAE further underscore the high accuracy and robustness of the ANN model.

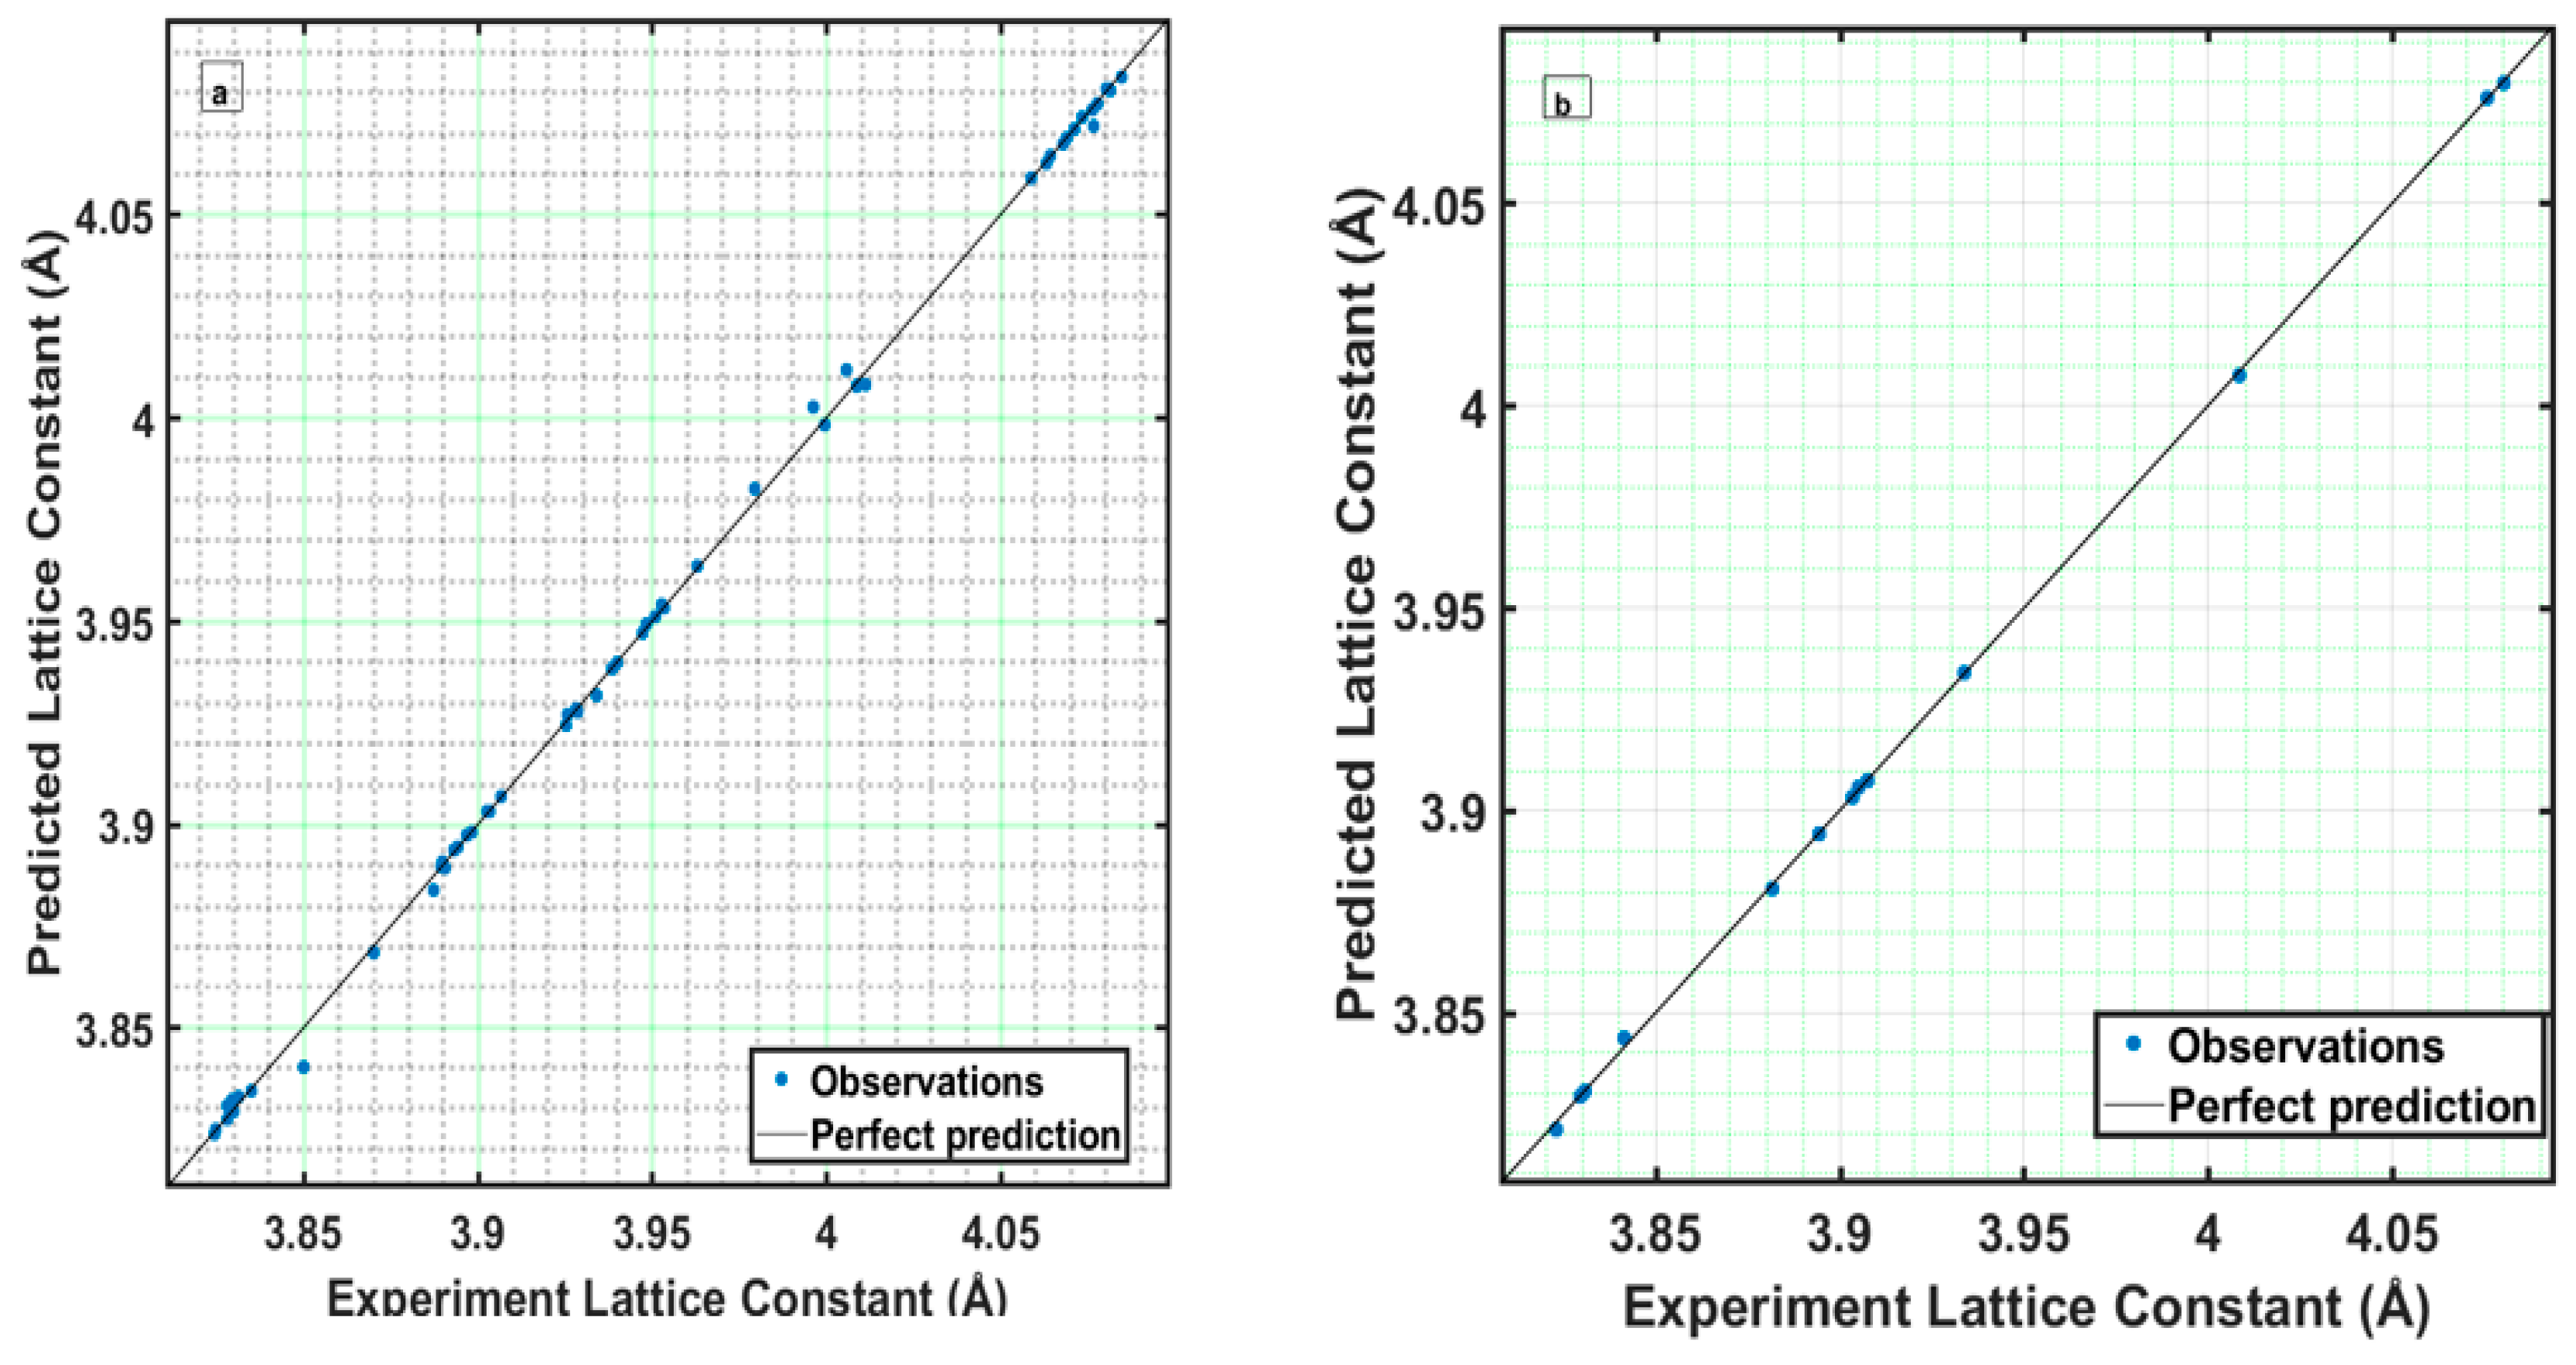
3.2. Predicted vs. Experimental Lattice Constants

Figure 5a,b compare the predicted and experimental lattice constants for the training and testing datasets. The diagonal line in each plot represents the line of perfect prediction, where the predicted values match the experimental values exactly. For the training data (Figure 5a), the data points are tightly clustered around the diagonal line, indicating high accuracy in the predictions. Similarly, the points for the testing data (Figure 5b) align closely with the diagonal line, reinforcing the model’s ability to generalize and maintain accuracy when predicting lattice constants for new, unseen data.

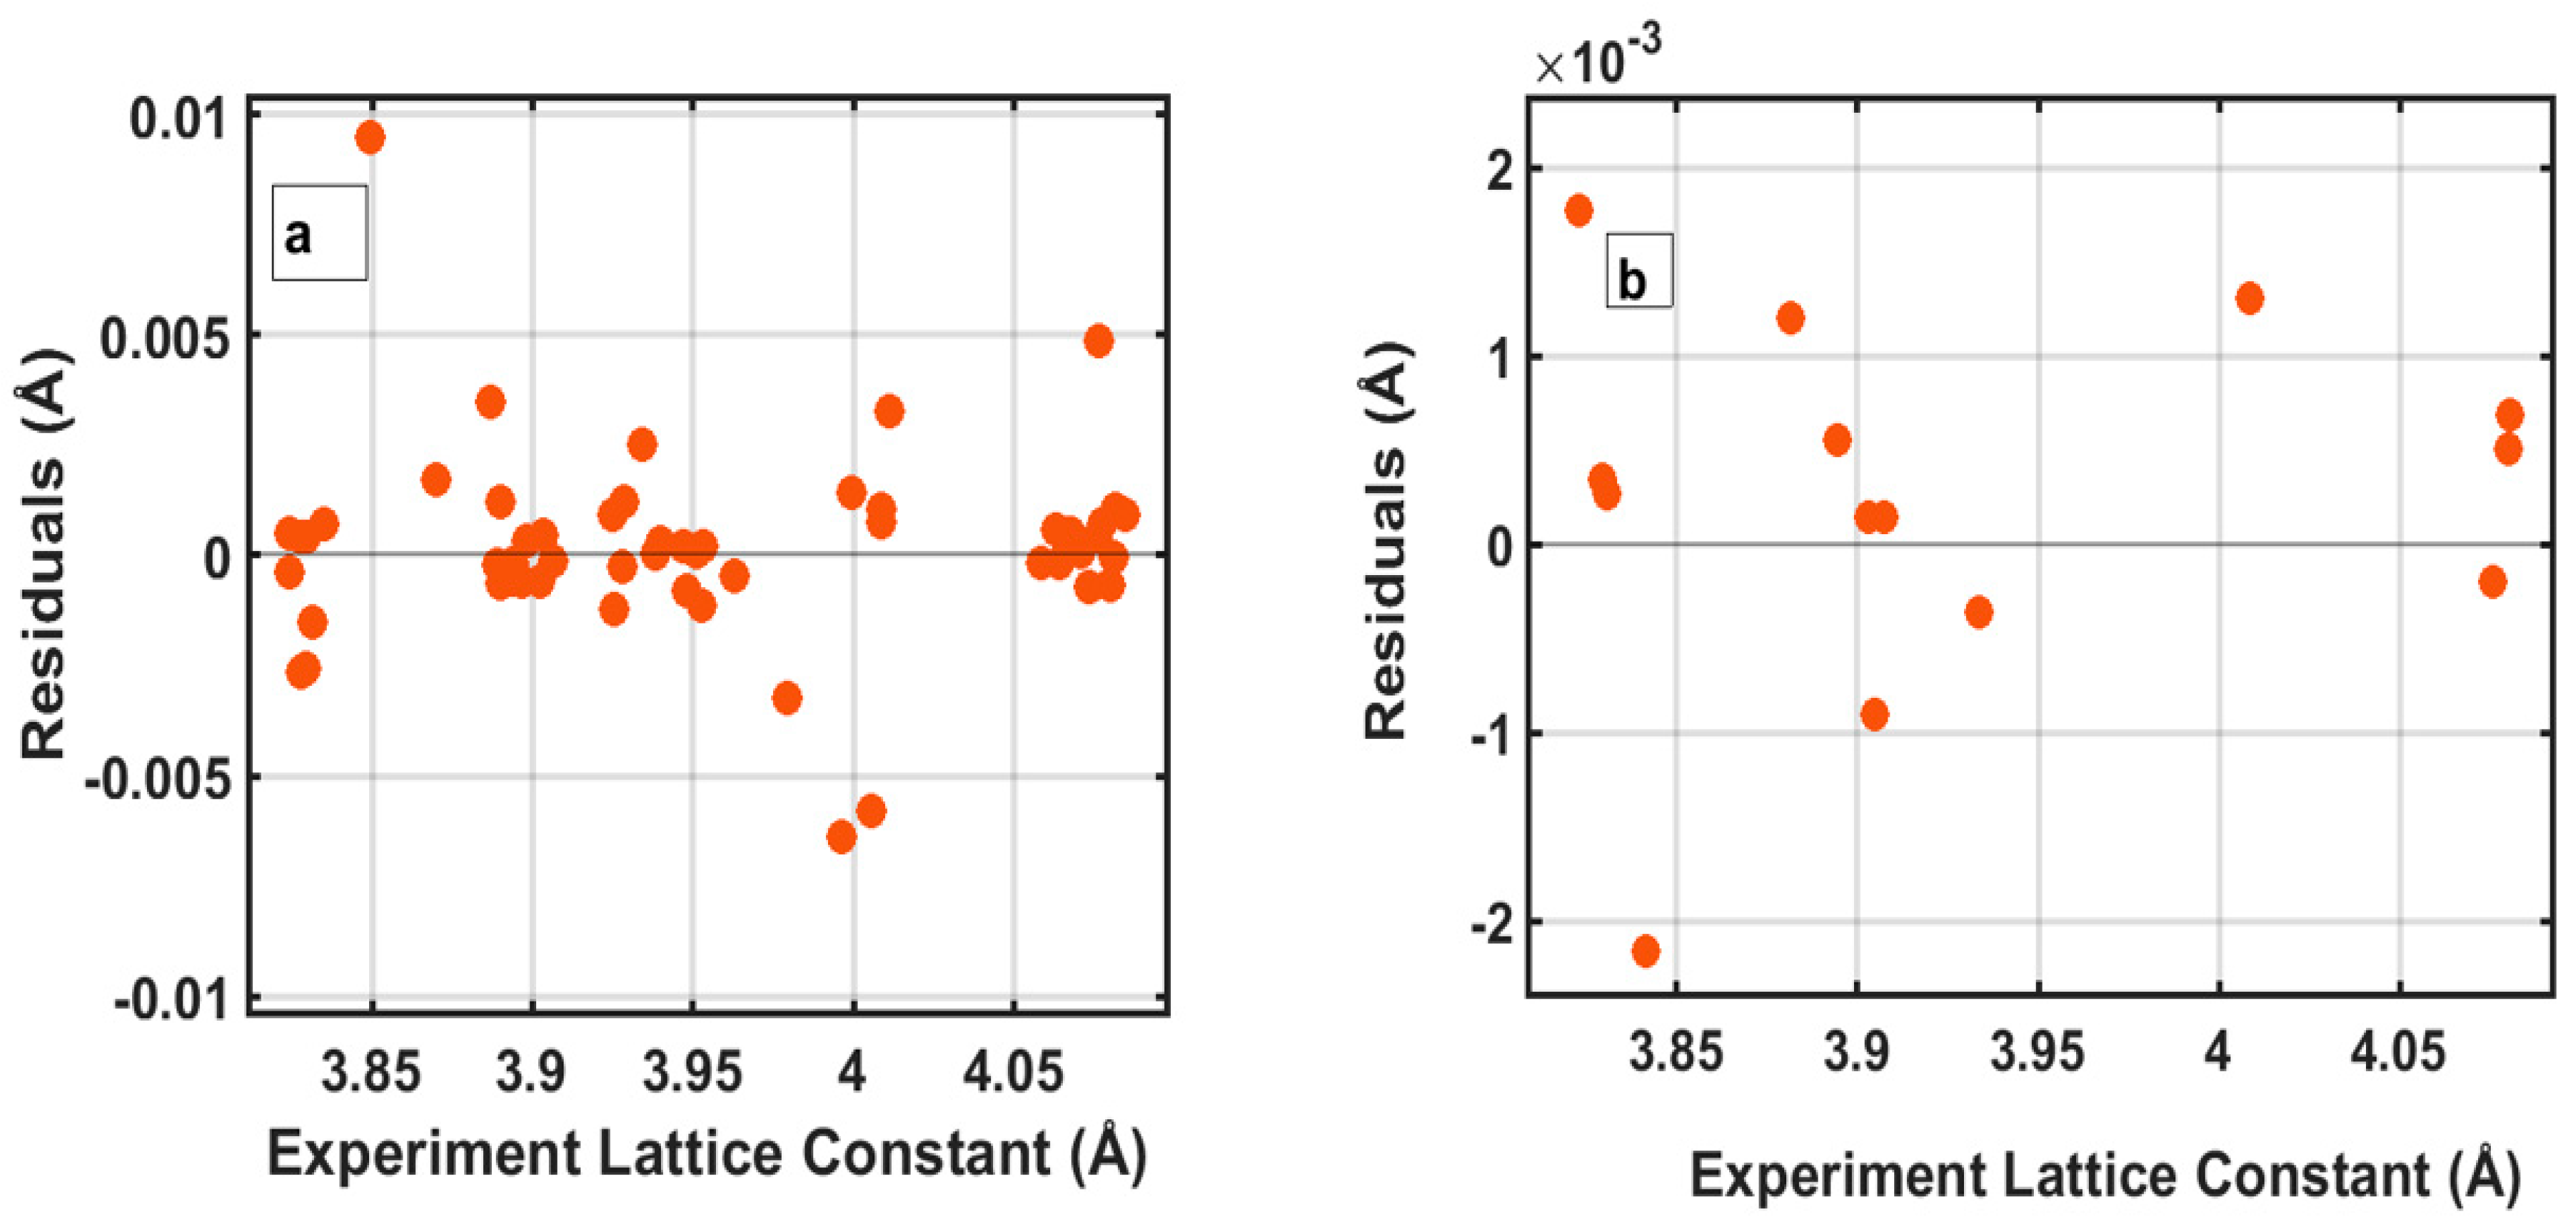
3.3. Residual Analysis

Residual plots for both the training and testing datasets are provided in Figure 6a,b, illustrating the differences between the experimental and predicted lattice constants. For the training data residuals (Figure 6a), the residuals are scattered around the zero line with no discernible pattern, suggesting that the model predictions are unbiased. The small magnitude of the residuals indicates minimal prediction errors, further confirming the model’s accuracy and precision. In the case of the testing data residuals (Figure 5b), the residuals are similarly centered around zero and display no systematic pattern, validating the model’s accuracy and reliability. The small residual values corroborate the low prediction error observed in the statistical metrics.
In sum, the ANN model exhibits exceptional performance in predicting the lattice constants of aliovalently doped perovskites, as demonstrated by the high R-squared values and low prediction errors in the training and testing datasets. The close alignment of the predicted values with the experimental data, along with unbiased residuals, confirms the model’s accuracy and robustness. These results highlight the potential of ANN models for accurately predicting the structural properties of complex materials such as covalently doped perovskites. Predicting high-precision lattice constants is crucial for designing and optimizing new materials with tailored properties. This study provides a solid foundation for the further exploration and application of machine learning techniques in materials science, paving the way for innovative advancements in the development of advanced functional materials.

3.4. Interpretability of ANN Predictions for Aliovalently Doped Perovskites

The Partial Dependence Plots (PDPs) for the features a, b, c, and Z provide critical insights into the interpretability of the Artificial Neural Network (ANN) model used for predicting the lattice constants of aliovalently doped perovskites. These PDPs illustrate how variations in each feature influence the predicted lattice constant, offering a clear understanding of the model’s behavior and the underlying physical relationships. Below, we offer perspective on how each of the features impacts the predicted lattice constant.

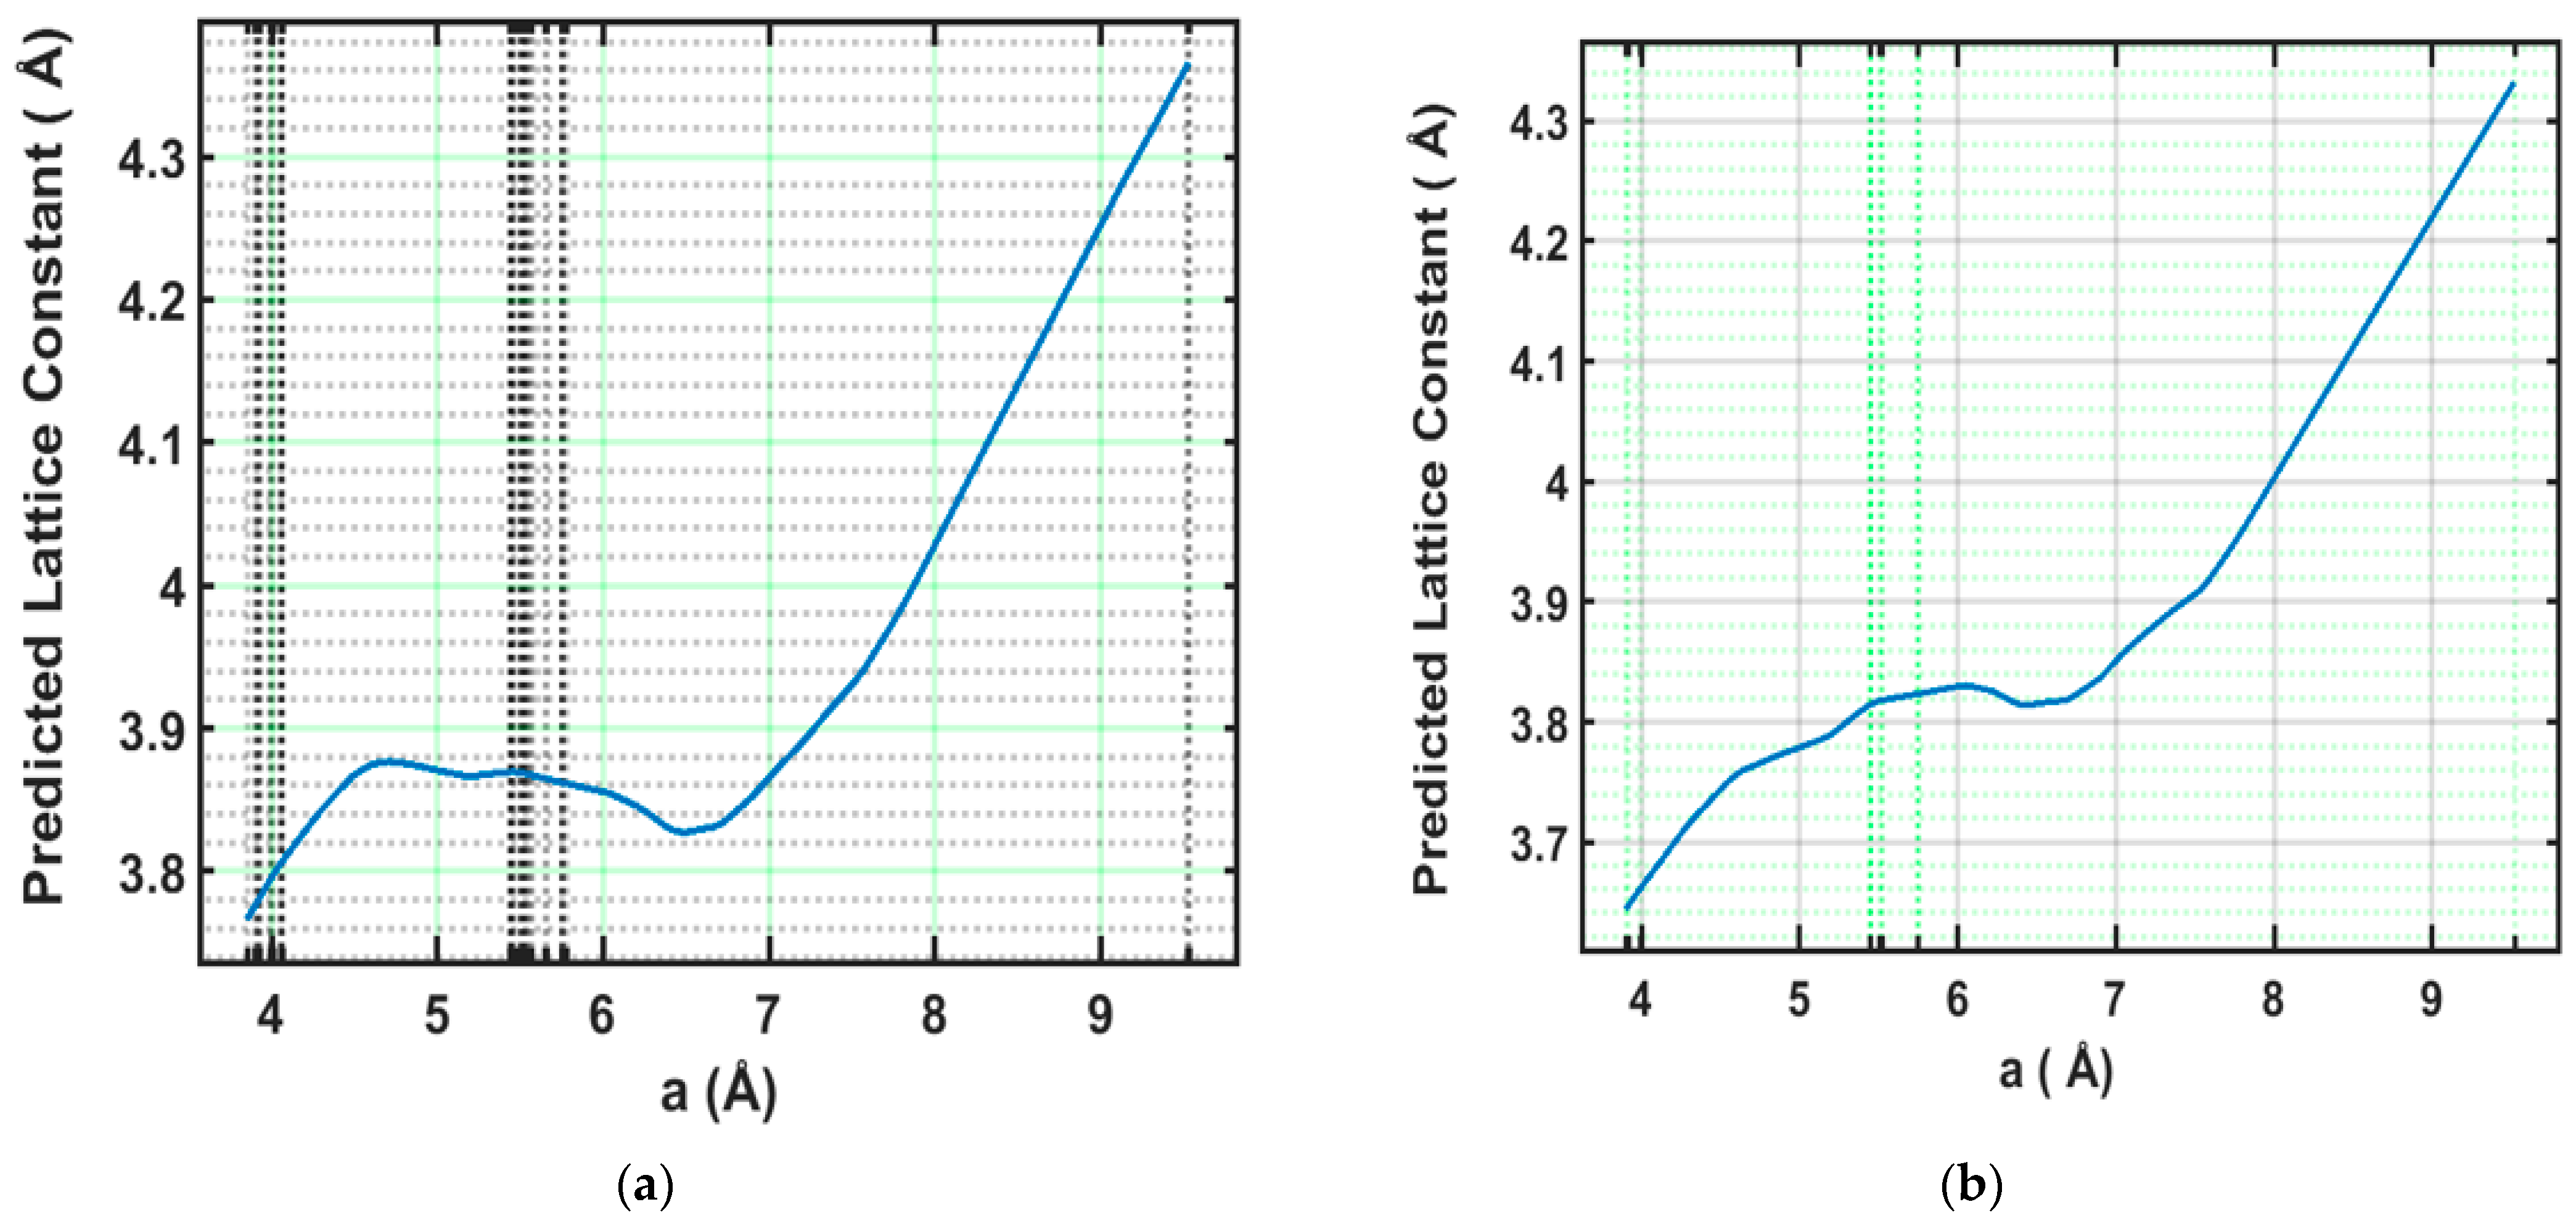
3.4.1. Analysis of Feature a (Å)

The PDP for feature a (Å), shown in Figure 7, shows a nonlinear relationship between a (Å) and the predicted lattice constant. In the training data, an initial increase in a (Å) from 4 Å to about 5.5 Å corresponds to a slight rise in the lattice constant, indicating that as the lattice parameter a (Å) expands, the overall unit cell volume increases. However, beyond 5.5 Å, the predicted lattice constant exhibits a complex pattern, with fluctuations between 6 and 7 Å, after which it sharply increases. This nonlinear behavior suggests intricate interactions within the lattice resulting from dopant incorporation and subsequent structural distortions. The testing data (shown in Figure 7b) mirror this trend, with a generally increasing lattice constant, but exhibit smoother transitions, indicative of the ANN’s ability to generalize while capturing the primary effects of feature a. To provide quantitative context, we evaluated the impact of a 10% increase in the mean value of a (from 5.23 Å to 5.75 Å), which resulted in an increase in the predicted lattice constant of approximately 0.01–0.02 Å, corresponding to a ~0.3% to 0.5% rise.
This modest change confirms the moderate influence of parameter a on the lattice constant prediction, reinforcing its role in governing structural variability through nonlinear effects. The observed nonlinear increase in the predicted lattice constant with respect to parameter a may stem from atomic-level effects such as A-site cation substitution strain, ionic radius mismatch, or resulting octahedral tilting in the perovskite framework. This suggests that compositional changes that expand a beyond ~5.5 Å could introduce disproportionate effects on structural metrics, indicating a design limit for stable tuning. Moreover, the sharp PDP slope in this region may also reflect underrepresentation of such cases in the dataset, suggesting possible sampling bias.

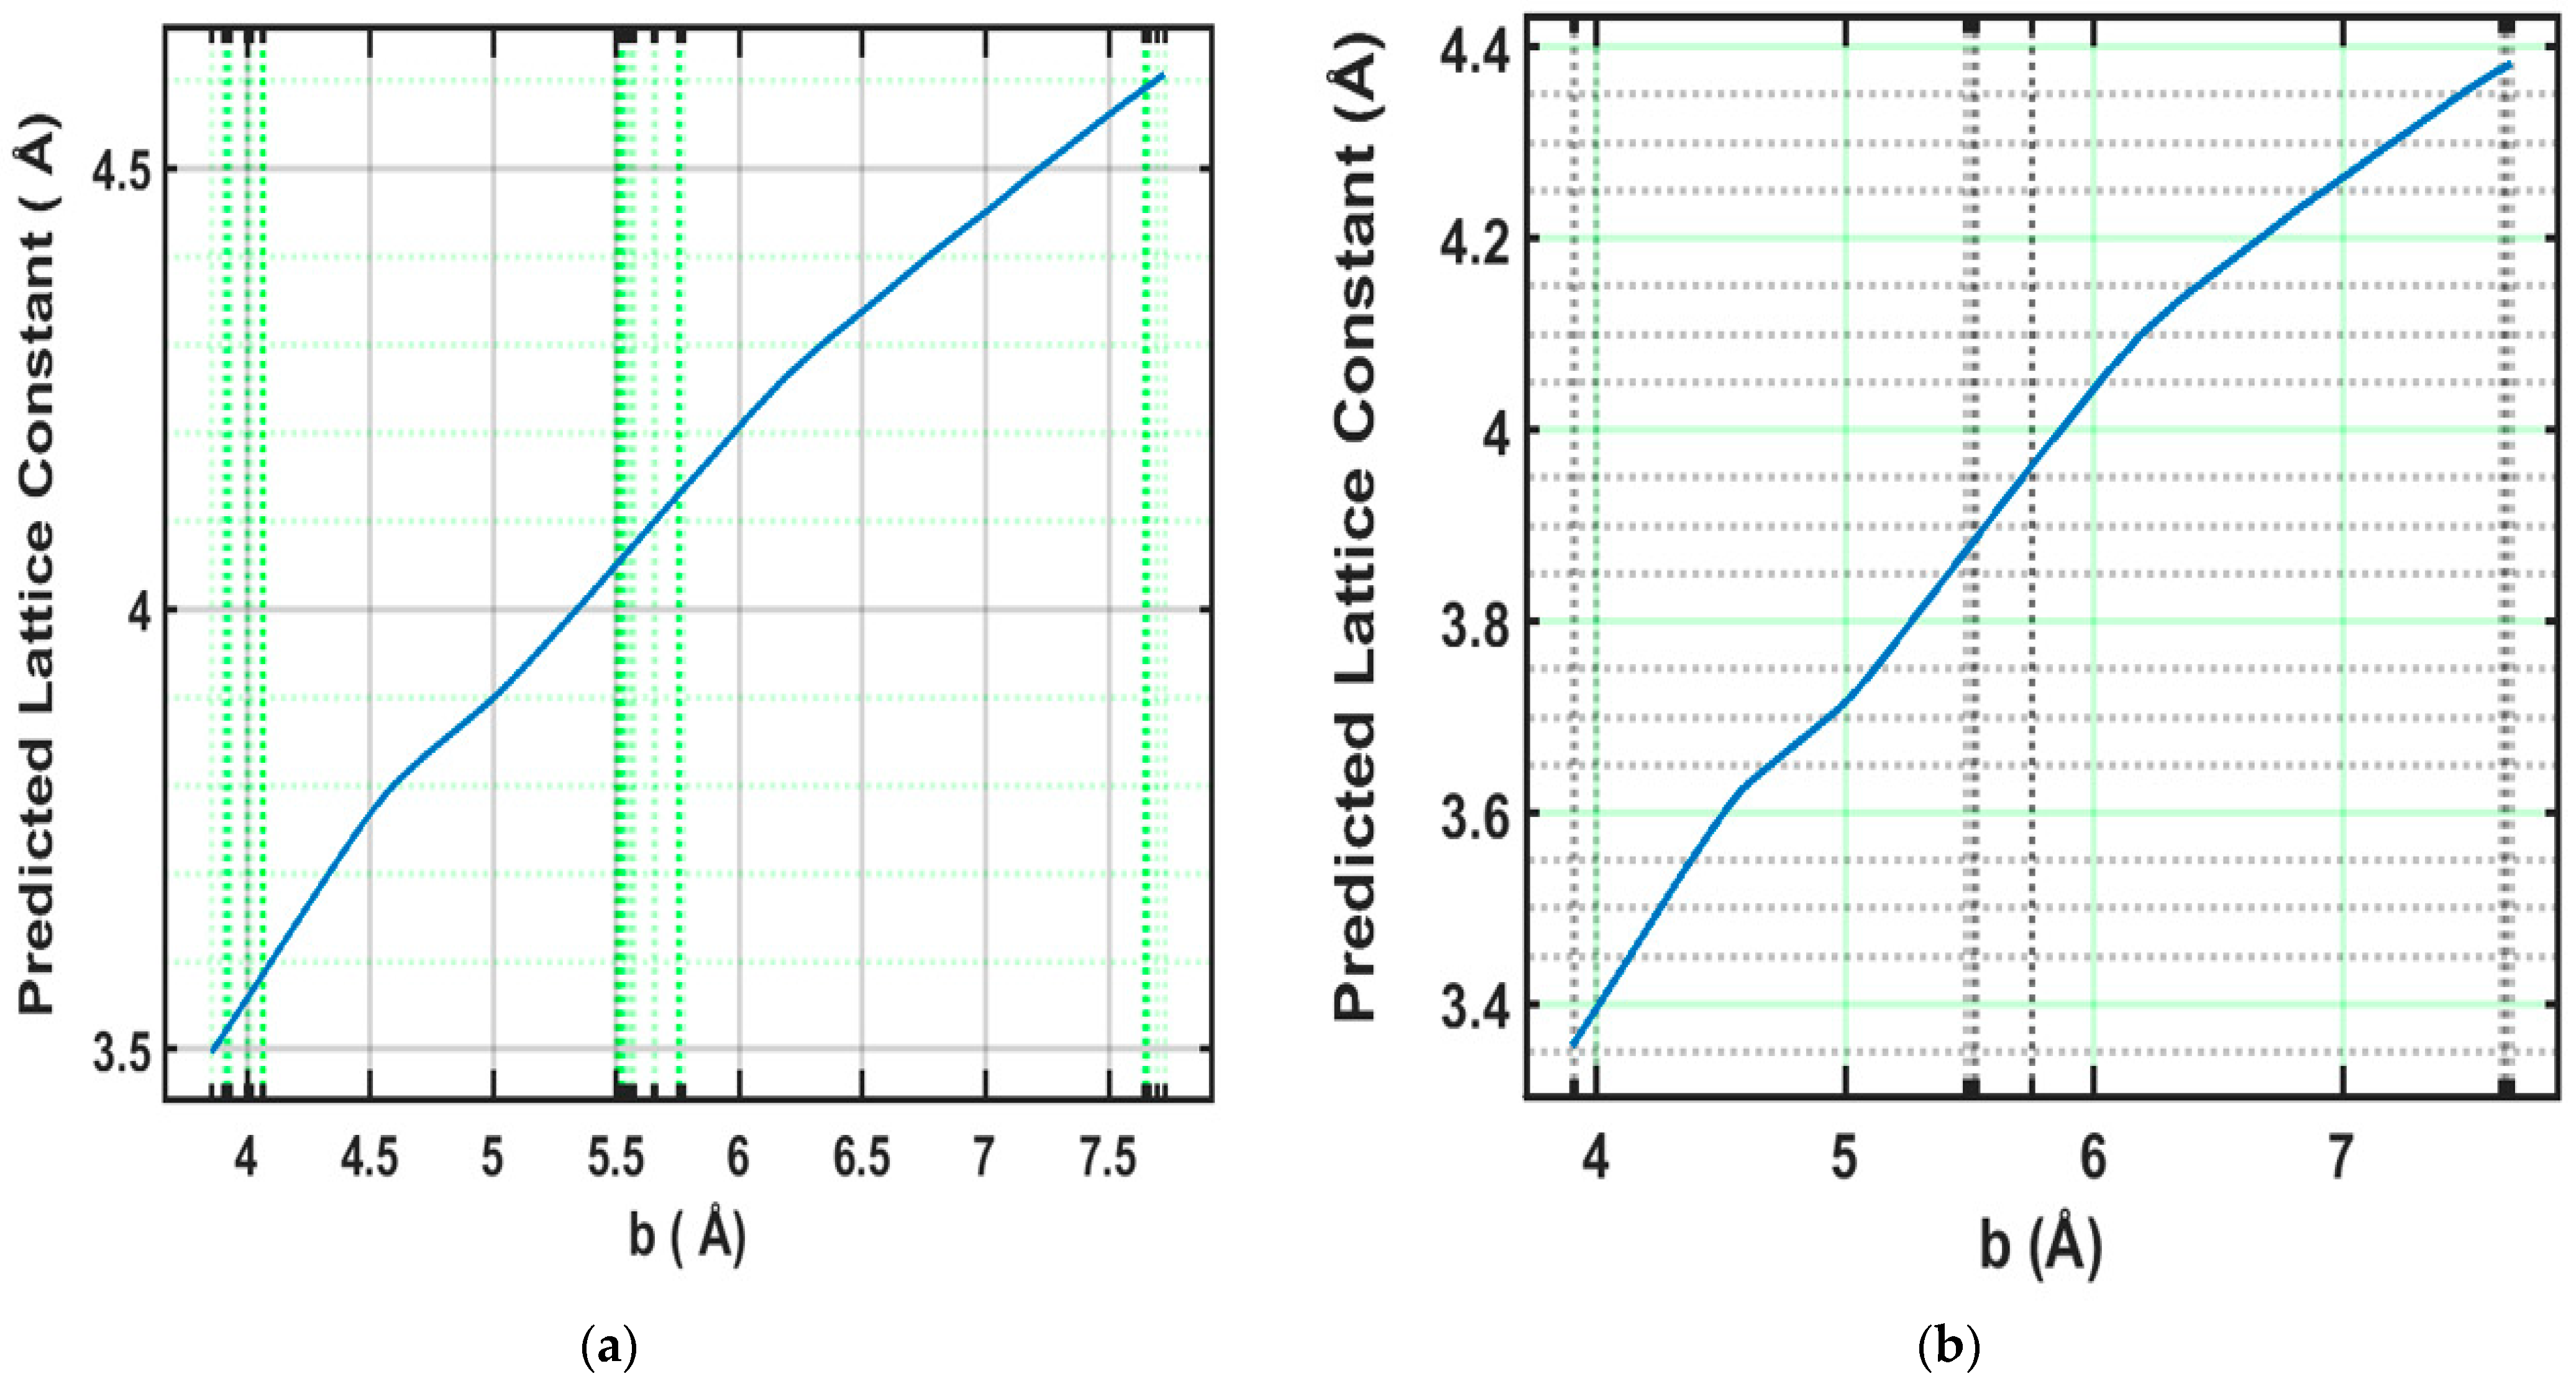
3.4.2. Analysis of Feature b (Å)

Although perovskite structures are often idealized as geometrically simple, aliovalent doping introduces anisotropic distortions that can selectively affect individual lattice directions. The b-axis, in particular, may undergo disproportionate changes due to local strain, ionic size mismatch, and vacancy formation—effects that are not always predictable through symmetry-based assumptions. Traditional geometry optimization approaches can capture these distortions but are computationally demanding for high-throughput screening. Our ANN-based approach offers a scalable alternative by learning from experimentally validated structures. The following PDP analysis reveals that changes in the b-axis have a consistent and quantifiable influence on the predicted lattice constant, supporting its inclusion in the model. For feature b, the PDP shown in Figure 8 indicates a clear linear relationship with the predicted lattice constant in the training data. As b increases from 4 Å to 7.5 Å, the lattice constant steadily rises, suggesting a direct correlation between b and the unit cell expansion. This linearity implies that variations in b lead to predictable changes in the lattice dimensions. The testing data shown in Figure 8b confirm this relationship, reinforcing the consistency and robustness of the ANN model in capturing the influence of b on the lattice constant. To quantify this effect, a 10% increase in the mean value of b (from 5.43 Å to approximately 5.98 Å) resulted in an increase of approximately 0.17 Å in the predicted lattice constant, corresponding to a ~4.3% rise.
This relatively strong sensitivity highlights the structural significance of parameter b and its considerable contribution to lattice expansion in aliovalently doped perovskites.

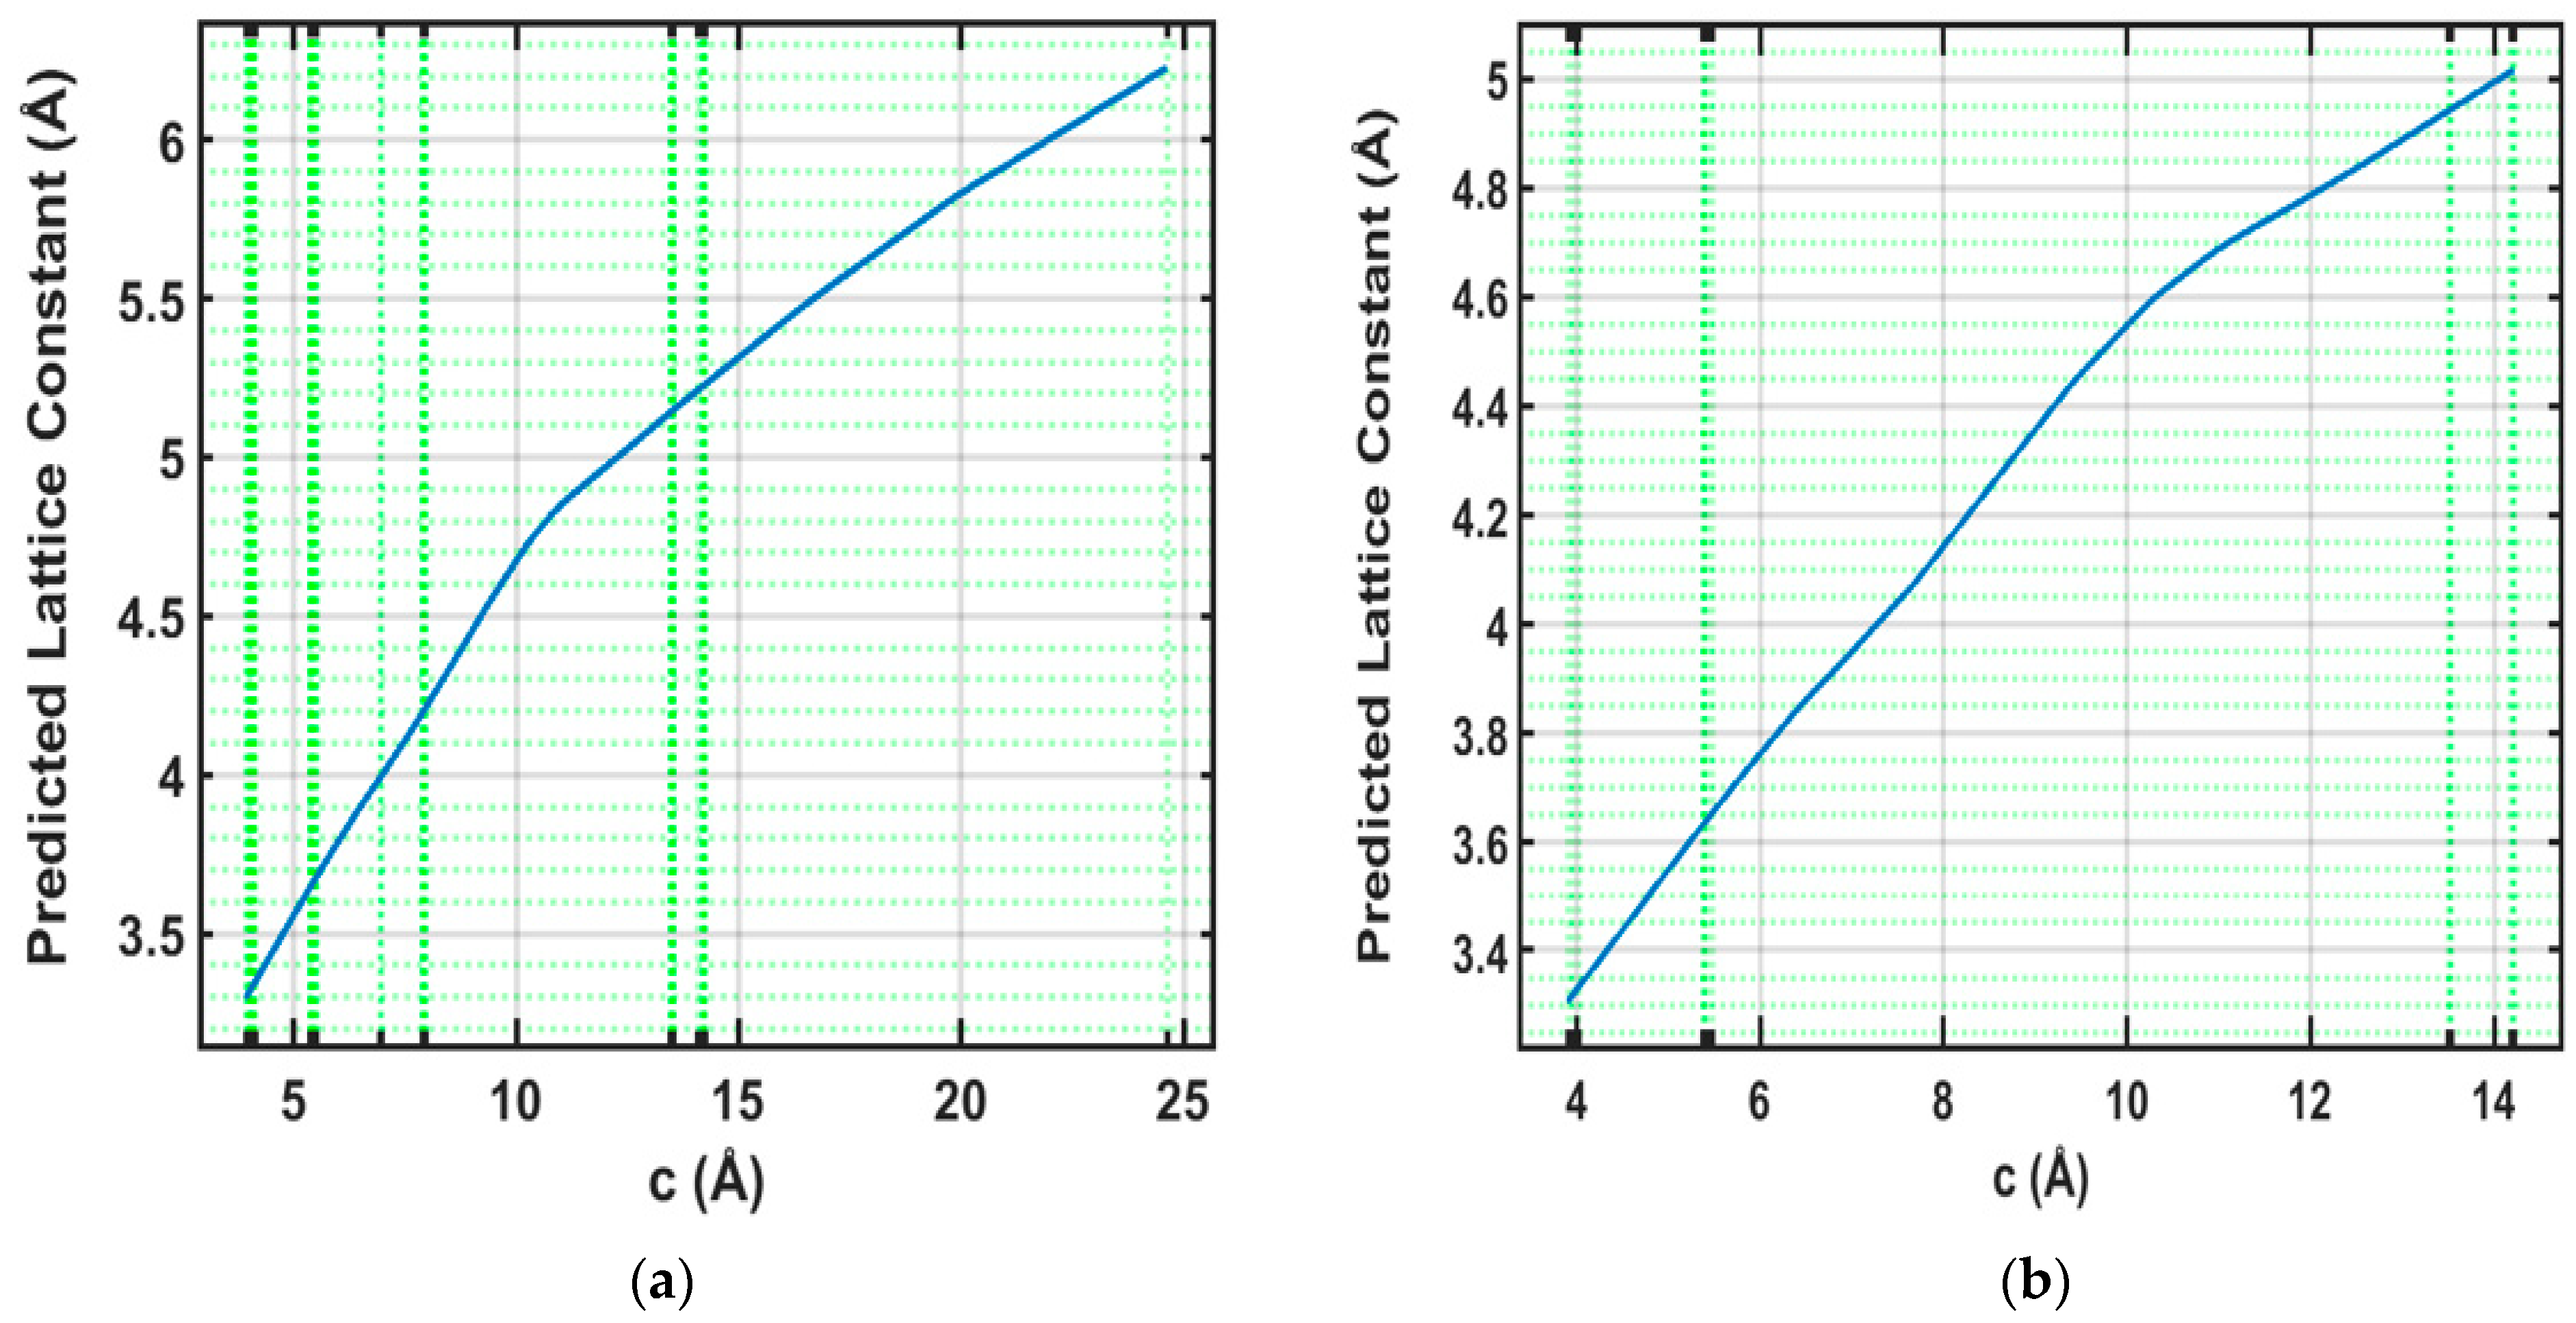
3.4.3. Analysis of Feature c (Å)

The PDP for feature c, shown in Figure 9, reveals a steady increase in the predicted lattice constant as c ranges from 4 Å to approximately 24 Å in the training data. This linear trend highlights a strong dependence of the lattice constant on the parameter c, indicating that c is a critical dimension for determining the overall lattice structure in aliovalently doped perovskites. The testing data (shown in Figure 9) also show a linear increase with a slightly lower slope, demonstrating the model’s ability to generalize well while capturing the primary trend. Quantitatively, a 10% increase in the mean value of c (from 8.79 Å to approximately 9.67 Å) resulted in an increase of about 0.25 Å in the predicted lattice constant, representing a ~5.9% change.
This substantial and nearly proportional response underscores the dominant influence of parameter c on the structural expansion of the doped perovskite lattice.

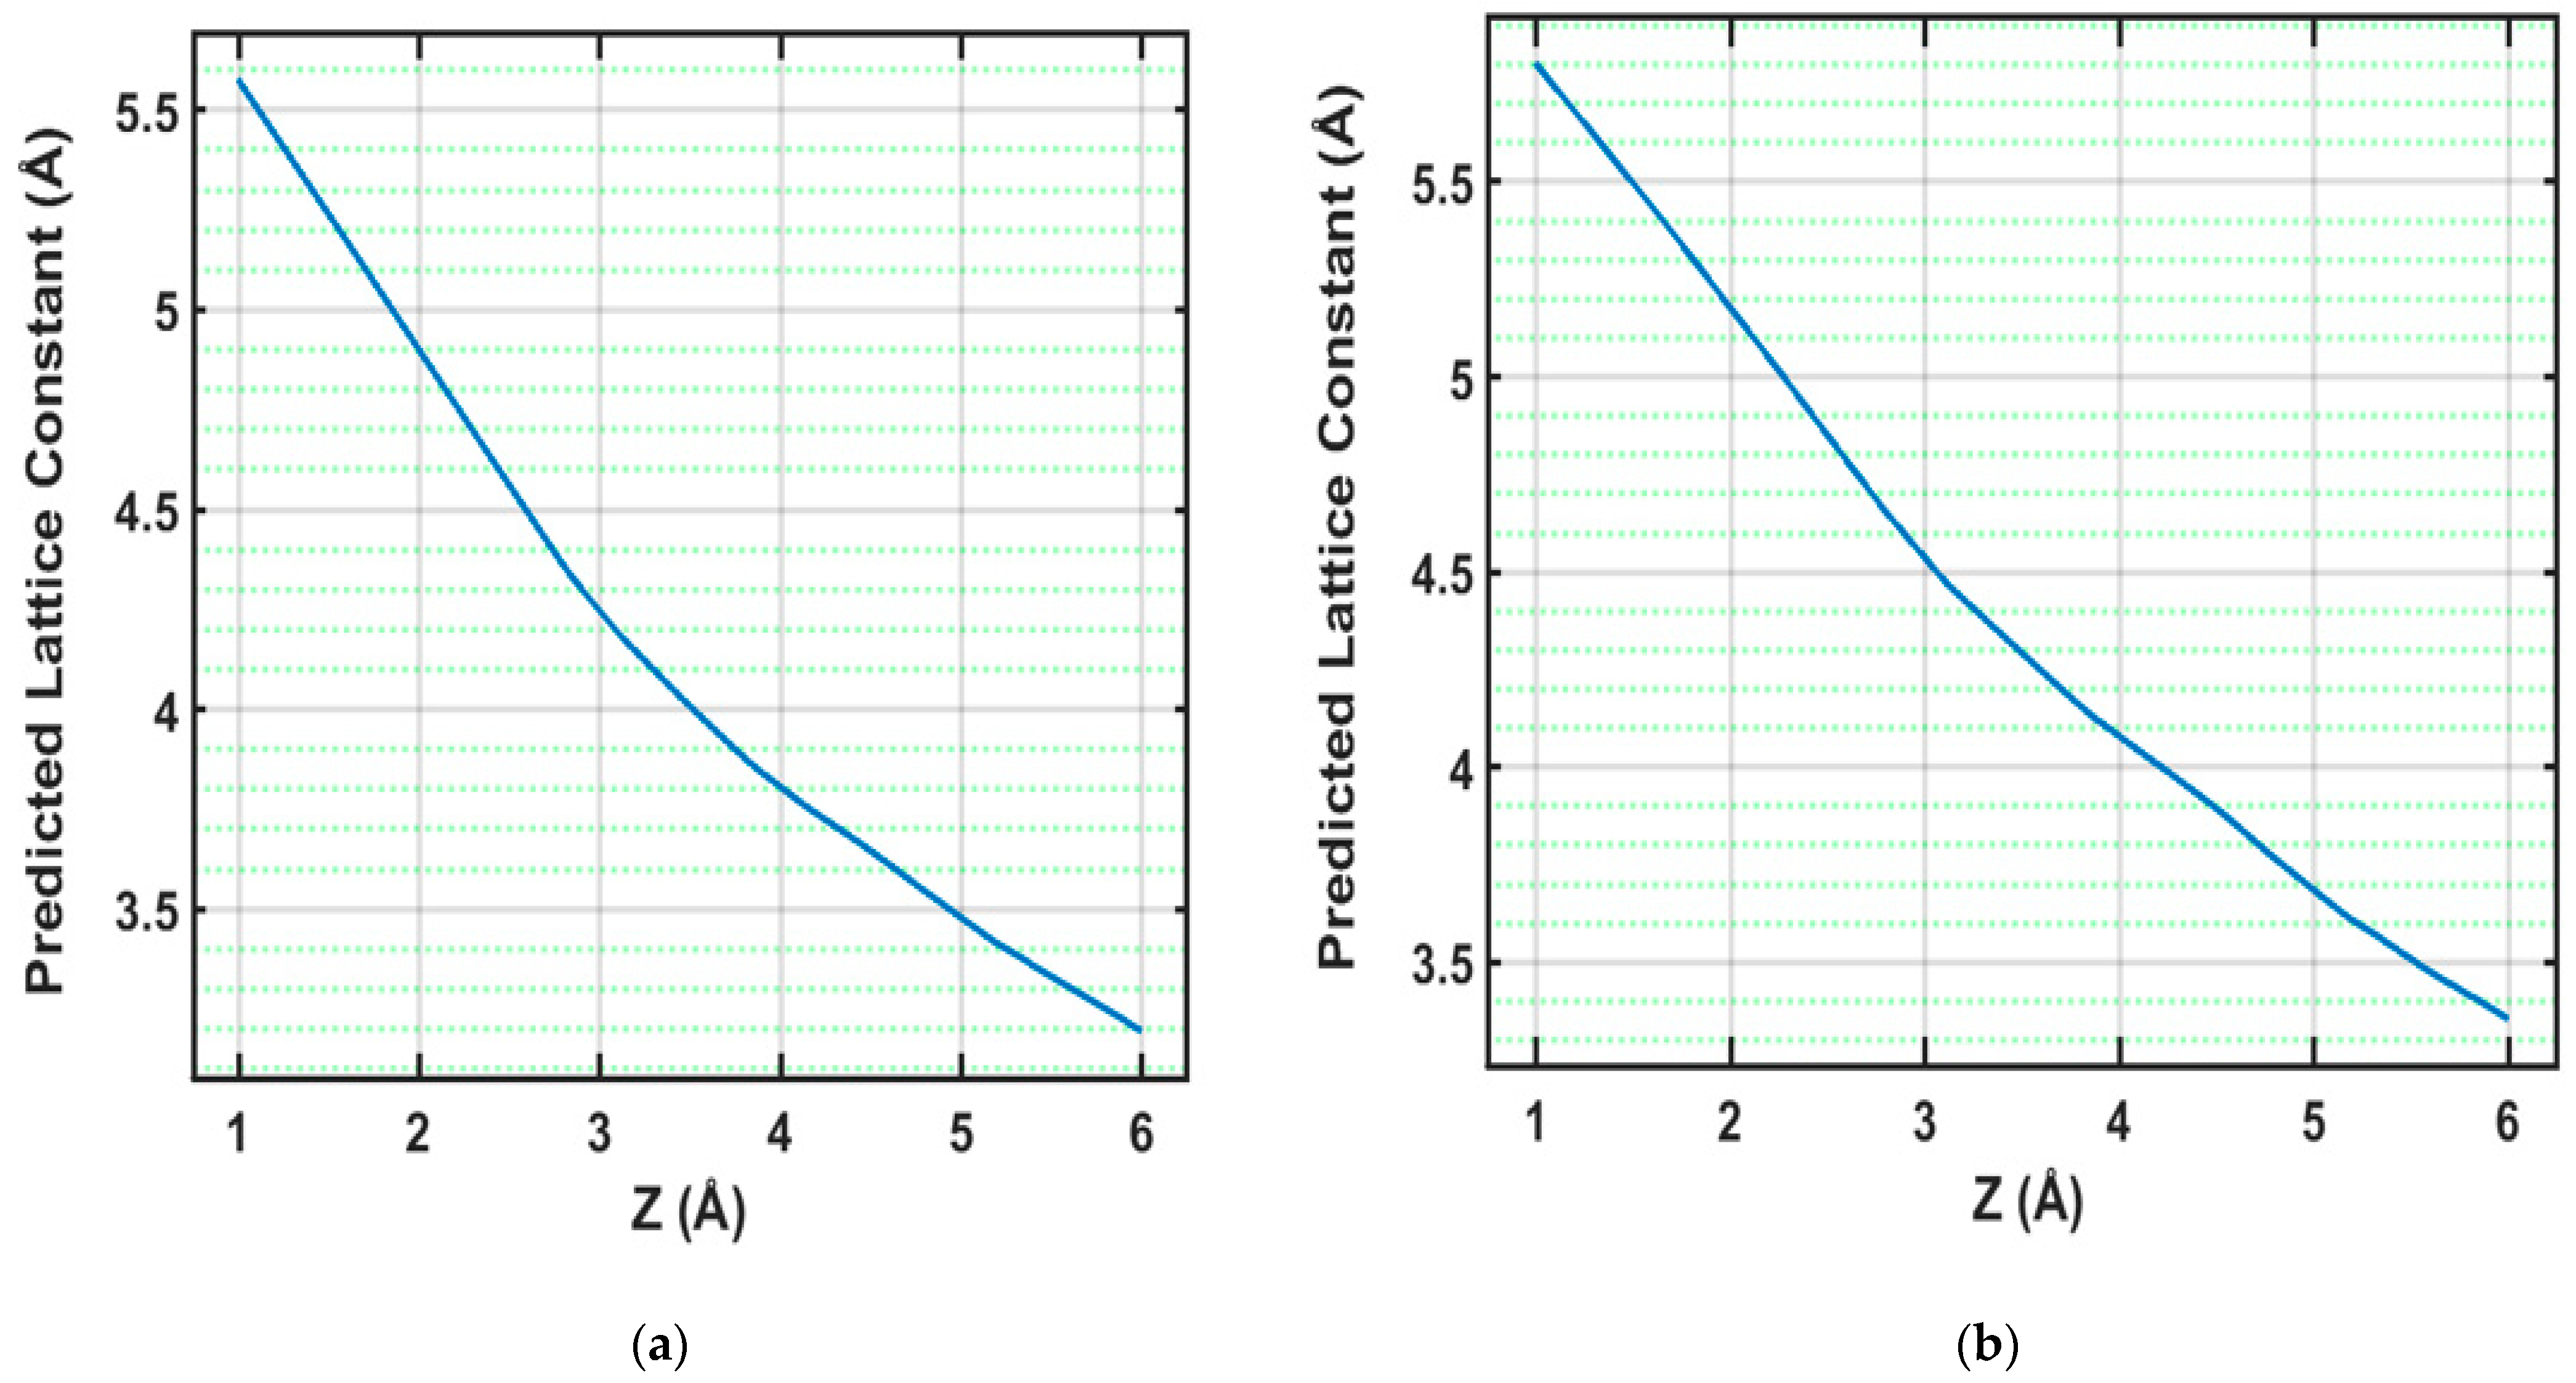
3.4.4. Analysis of Feature Z

The PDP for feature Z, as shown in Figure 10, exhibits a pronounced inverse relationship with the predicted lattice constant. As Z increases from 1 to 6, the lattice constant decreases significantly. This inverse trend is physically interpretable, as Z represents the number of ABX3 formula units per unit cell. A higher Z value implies a greater number of formula units within the same unit cell volume, resulting in denser packing and a reduced lattice constant. The testing data (shown in Figure 10b) confirm this negative correlation, underscoring the model’s understanding of how the density of formula units impacts the lattice structure. To quantify this effect, a 10% increase in the mean value of Z (from 3.79 to approximately 4.17) led to a decrease in the predicted lattice constant by approximately 0.15 Å, corresponding to a ~3.6% reduction.
This strong inverse sensitivity illustrates the critical role of the packing density in influencing the structural behavior of aliovalently doped perovskites and reinforces the physical plausibility of the model’s interpretive outputs.
The PDPs for the features a, b, c, and Z vividly illustrate the interpretability of the ANN model for predicting the lattice constants in aliovalently doped perovskites. The PDPs elucidate the complex interplay between doping, the lattice parameters, and the number of formula units per unit cell by depicting both linear and nonlinear relationships. The consistency between the training and testing data interpretations highlights the model’s robustness and generalization capabilities, making it a reliable tool for predicting and understanding the structural properties of doped perovskites.
Beyond qualitative trends, the PDP analysis provided quantitative insight into the feature-specific impacts on lattice constant predictions. For example, a 10% increase in parameter c led to a ~5.9% rise in the predicted lattice constant, while a similar increase in Z resulted in a ~3.6% decrease. Parameters b and a showed respective increases of ~4.3% and ~0.3–0.5% in the predicted output. These results not only confirm the physical plausibility of the model’s behavior but also identify which structural factors exert the most influence.
This enhanced interpretability through PDPs empowers researchers to understand the factors influencing lattice constants, facilitating the design and optimization of new perovskite materials with tailored properties. The insights gained from these PDPs are crucial for advancing materials science, as they bridge the gap between high prediction accuracy and scientific understanding, thus fostering greater confidence in applying ANN models in this domain.

3.4.5. Scientific Implications and Design Insights from PDP Analysis

Beyond enhancing model interpretability, the PDP analysis offers key insights into the structural behavior of aliovalently doped perovskites. The nonlinear trend observed for parameter a likely reflects local lattice distortions induced by dopant substitution, such as cation size mismatch, strain fields, and oxygen vacancy formation. These atomic-level effects may disrupt symmetry and lead to irregular expansion along the a-axis.
In contrast, the linear responses of b and c suggest these axes are more uniformly influenced by structural changes, making them more reliable targets for lattice tuning. The strong inverse relationship between Z and the lattice constant supports the known effect of the packing density on structural contraction and validates the model’s physical plausibility [31,55]. These results suggest practical design rules: parameters b and c offer predictable paths for engineering lattice constants, while changes in a require more cautious control due to nonlinear sensitivity. Additionally, the steep trend in Z highlights the need to monitor dataset balance, as overrepresentation of specific Z–dopant combinations could introduce predictive bias.

4. Conclusions

In this study, we developed an interpretable Artificial Neural Network (ANN) model for predicting the lattice constant of aliovalently doped perovskites based on structural features. By integrating Partial Dependence Plots (PDPs), we were able to visualize and quantify the marginal effects of input variables on model predictions. The PDP analysis revealed that lattice parameters a, b, and c exhibit varying degrees of influence, with a showing a particularly strong and nonlinear relationship with the predicted lattice constant. These insights enhance the model’s transparency and provide physical interpretability aligned with crystallographic behavior. Importantly, the interpretability gained through PDP analysis not only enhances confidence in the ANN model but also provides valuable guidance for materials design. These findings may assist in the rational engineering of doped perovskite systems by identifying compositional and structural ranges that most significantly impact lattice behavior. Moreover, the observed nonlinearities offer testable hypotheses for future experimental validation, particularly in compositional regimes where predictive sensitivity is high. As MATLAB’s PDP framework is internally built on SHAP and LIME principles, future studies could integrate both global and local explanations to improve per-sample interpretability and decision-making in perovskite design.

Author Contributions

Conceptualization, A.A. (Abdullah Alharthi) and Y.A.S.; methodology, A.A. (Abdullah Alharthi), A.A. (Abdulgafor Alfares) and Y.A.S.; software, A.A. (Abdullah Alharthi), D.A.A. and A.A. (Abdulgafor Alfares); validation, A.A. (Abdullah Alharthi), A.A. (Abdulgafor Alfares) and D.A.A.; formal analysis, D.A.A.; investigation, A.A. (Abdulgafor Alfares) and Y.A.S.; resources, A.A. (Abdullah Alharthi); data curation, A.A. (Abdulgafor Alfares); writing—original draft preparation, A.A. (Abdullah Alharthi) and Y.A.S.; writing—review and editing, A.A. (Abdulgafor Alfares), D.A.A. and Y.A.S.; visualization, A.A. (Abdulgafor Alfares); supervision, Y.A.S.; project administration, A.A. (Abdullah Alharthi) and Y.A.S.; funding acquisition, A.A. (Abdullah Alharthi) and A.A. (Abdulgafor Alfares). All authors have read and agreed to the published version of the manuscript.

Funding

This research was funded by the Deanship of Research and Graduate Studies at King Khalid University through the Large Research Project grant number RGP2/254/45, and Saudi Aramco.

Data Availability Statement

The dataset used in this study was obtained from the publication by Ubic et al., titled “Lattice-Constant Prediction and Effect of Vacancies in Aliovalently Doped Perovskites” (J. Alloys Compd. 2015, 644, 982–995. https://doi.org/10.1016/j.jallcom.2015.04.213). All data analyzed in this work are publicly available through the original publication.

Acknowledgments

The authors appreciate the continuous support of the University of Hafr Al Batin.

Conflicts of Interest

Author Dahood Ademuyiwa Adegbite was employed by the company Saudi Arabian Oil Company. The remaining authors declare that the research was conducted in the absence of any commercial or financial relationships that could be construed as a potential conflict of interest.

Abbreviations

The following abbreviations are used in this manuscript:
ANNArtificial Neural Network
ELMExtreme Learning Machine
GRPGaussian Process Regression
MAEMean Absolute Error
MAPEMean Absolute Percentage Error
MLMachine Learning
MSEMean Squared Error
PDPPartial Dependence Plots
PSOParticle Swarm Optimization
RMSERoot Mean Squared Error
SVRSupport Vector Regression
SVMSupport Vector Regression
XRDX-ray diffraction

References

  1. Galasso, F. Perovskite Type Compounds and High Tc Superconductors. JOM 1987, 39, 8–10. [Google Scholar] [CrossRef]
  2. Gao, W.; Zhu, Y.; Wang, Y.; Yuan, G.; Liu, J.-M. A Review of Flexible Perovskite Oxide Ferroelectric Films and Their Application. J. Mater. 2020, 6, 1–16. [Google Scholar] [CrossRef]
  3. Du, M.; Huang, H.; Zhang, Z.; Wang, M.; Song, H.; Duan, D.; Cui, T. High-Temperature Superconductivity in Perovskite Hydride Below 10 GPa. Adv. Sci. 2024, 11, 2408370. [Google Scholar] [CrossRef] [PubMed]
  4. Thakur, P.; Sharma, N.; Pathak, D.; Sharma, P.; Kishore, K.; Dhar, S.; Lal, M. State-of-Art Review on Smart Perovskites Materials: Properties and Applications. Emergent Mater. 2024, 7, 667–694. [Google Scholar] [CrossRef]
  5. Ouedraogo, N.A.N.; Odunmbaku, G.O.; Ouyang, Y.; Xiong, X.; Guo, B.; Chen, S.; Lu, S.; Sun, K. Eco-Friendly Processing of Perovskite Solar Cells in Ambient Air. Renew. Sustain. Energy Rev. 2024, 192, 114161. [Google Scholar] [CrossRef]
  6. Zhu, B.P.; Guo, W.K.; Shen, G.Z.; Zhou, Q.; Shung, K.K. Structure and Electrical Properties of (111)-Oriented Pb(Mg1/3Nb2/3)O3-PbZrO3-PbTiO3 Thin Film for Ultra-High-Frequency Transducer Applications. IEEE Trans. Ultrason. Ferroelectr. Freq. Control 2011, 58, 1962–1967. [Google Scholar] [CrossRef]
  7. Li, N.; Hu, X.; Tang, Y.; Lei, Y.; Suet Lau, Y.; Chen, Q.; Sui, X.; Zhu, F. Perovskite/Organic Tandem Device to Realize Light Detection and Emission Dual Function. Chem. Eng. J. 2024, 490, 151573. [Google Scholar] [CrossRef]
  8. Jia, S.; Li, Y.; Gao, C.; Liu, G.; Ren, Y.; He, C.; An, X.-T. Realization of P-Type MA-Based Perovskite Solar Cells Based on Exposure of the (002) Facet. Appl. Phys. Lett. 2025, 126, 023908. [Google Scholar] [CrossRef]
  9. Gao, C.; Jia, S.; Yin, X.; Li, Z.; Yang, G.; Chen, J.; Li, Z.; An, X. Enhancing Open-Circuit Voltage in FAPbI3 Perovskite Solar Cells via Self-Formation of Coherent Buried Interface FAPbIxCl3−x. Chem. Commun. 2025, 61, 2758–2761. [Google Scholar] [CrossRef]
  10. Zhu, B.; Wang, Z.; Zhang, Y.; Yu, Z.; Shi, J.; Xiong, R. Low Temperature Fabrication of the Giant Dielectric Material CaCu3Ti4O12 by Oxalate Coprecipitation Method. Mater. Chem. Phys. 2009, 113, 746–748. [Google Scholar] [CrossRef]
  11. Tolman, K.R.; Ubic, R.; Papac, M.; Seymour, K.C.; McCormack, S.J.; Kriven, W.M.; Kungl, H. Structural Effect of Aliovalent Doping in Lead Perovskites. J. Solid State Chem. 2015, 225, 359–367. [Google Scholar] [CrossRef]
  12. Mączka, M.; Sieradzki, A.; Bondzior, B.; Dereń, P.; Hanuza, J.; Hermanowicz, K. Effect of Aliovalent Doping on the Properties of Perovskite-like Multiferroic Formates. J. Mater. Chem. C 2015, 3, 9337–9345. [Google Scholar] [CrossRef]
  13. Ubic, R.; Tolman, K.; Chan, K.; Lundy, N.; Letourneau, S.; Kriven, W.M. Effective Size of Vacancies in Aliovalently Doped SrTiO3 Perovskites. J. Alloys Compd. 2013, 575, 239–245. [Google Scholar] [CrossRef]
  14. Li, Z.; Yu, J.; Hao, S.; Janolin, P.-E. Enhancing Properties of Lead-Free Ferroelectric BaTiO3 through Doping. J. Eur. Ceram. Soc. 2022, 42, 4693–4701. [Google Scholar] [CrossRef]
  15. Cao, J.; Jin, B.; Li, S.; Zheng, J.; Keremane, K.; Priya, S.; Hu, X.; Wu, C.; Wang, K. Structural Properties of Perovskite. In Perovskite Optoelectronic Devices; Springer: Berlin/Heidelberg, Germany, 2024; pp. 19–50. [Google Scholar]
  16. Smith, A.M.; Mohs, A.M.; Nie, S. Tuning the Optical and Electronic Properties of Colloidal Nanocrystals by Lattice Strain. Nat. Nanotechnol. 2009, 4, 56–63. [Google Scholar] [CrossRef]
  17. Tao, Q.; Xu, P.; Li, M.; Lu, W. Machine Learning for Perovskite Materials Design and Discovery. npj Comput. Mater. 2021, 7, 23. [Google Scholar] [CrossRef]
  18. Maier, R.A.; Garrity, K.F.; Ozarowski, A.; Donohue, M.P.; Cibin, G.; Levin, I. Effects of Octahedral Tilting on the Site of Substitution of Manganese in CaTiO3. Acta Mater. 2021, 207, 116688. [Google Scholar] [CrossRef]
  19. Alfares, A.; Sha’aban, Y.A.; Alhumoud, A. Machine Learning-Driven Predictions of Lattice Constants in ABX3 Perovskite Materials. Eng. Appl. Artif. Intell. 2025, 141, 109747. [Google Scholar] [CrossRef]
  20. Zhou, L.; Pan, S.; Wang, J.; Vasilakos, A.V. Machine Learning on Big Data: Opportunities and Challenges. Neurocomputing 2017, 237, 350–361. [Google Scholar] [CrossRef]
  21. Chibani, S.; Coudert, F.-X. Machine Learning Approaches for the Prediction of Materials Properties. APL Mater. 2020, 8, 080701. [Google Scholar] [CrossRef]
  22. Badrulhisham, F.; Pogatzki-Zahn, E.; Segelcke, D.; Spisak, T.; Vollert, J. Machine Learning and Artificial Intelligence in Neuroscience: A Primer for Researchers. Brain Behav. Immun. 2024, 115, 470–479. [Google Scholar] [CrossRef] [PubMed]
  23. Zhang, Y.; Xu, X. Machine Learning Band Gaps of Doped-TiO2 Photocatalysts from Structural and Morphological Parameters. ACS Omega 2020, 5, 15344–15352. [Google Scholar] [CrossRef]
  24. Talapatra, A.; Uberuaga, B.P.; Stanek, C.R.; Pilania, G. Band Gap Predictions of Double Perovskite Oxides Using Machine Learning. Commun. Mater. 2023, 4, 46. [Google Scholar] [CrossRef]
  25. Mao, Y.; Yang, H.; Sheng, Y.; Wang, J.; Ouyang, R.; Ye, C.; Yang, J.; Zhang, W. Prediction and Classification of Formation Energies of Binary Compounds by Machine Learning: An Approach without Crystal Structure Information. ACS Omega 2021, 6, 14533–14541. [Google Scholar] [CrossRef] [PubMed]
  26. Moreira, R.L.; Dias, A. Comment on “Prediction of Lattice Constant in Cubic Perovskites”. J. Phys. Chem. Solids 2007, 68, 1617–1622. [Google Scholar] [CrossRef]
  27. Zhang, Y.; Xu, X. Machine Learning Lattice Constants for Cubic Perovskite A2XY6 Compounds. J. Solid State Chem. 2020, 291, 121558. [Google Scholar] [CrossRef]
  28. Zhang, Y.; Xu, X. Machine Learning Lattice Constants for Spinel Compounds. Chem. Phys. Lett. 2020, 760, 137993. [Google Scholar] [CrossRef]
  29. Zhang, Y.; Xu, X. Machine Learning Lattice Parameters of Monoclinic Double Perovskites. Int. J. Quantum Chem. 2021, 121, e26480. [Google Scholar] [CrossRef]
  30. Majid, A.; Farooq Ahmad, M.; Choi, T.-S. Lattice Constant Prediction of A2BB’O6 Type Double Perovskites. In Computational Science and Its Applications, Proceedings of the 2009 International Conference on Computational Science and Its Applications, Yongin, Republic of Korea, 29 June–2 July 2009; Springer: Berlin/Heidelberg, Germany; pp. 82–92.
  31. Ubic, R.; Tolman, K.; Talley, K.; Joshi, B.; Schmidt, J.; Faulkner, E.; Owens, J.; Papac, M.; Garland, A.; Rumrill, C.; et al. Lattice-Constant Prediction and Effect of Vacancies in Aliovalently Doped Perovskites. J. Alloys Compd. 2015, 644, 982–995. [Google Scholar] [CrossRef]
  32. Mehmood, N.; Ahmad, R.; Gul, A.; Zaman, A.; Murtaza, G.; Ahmad, J.; Khattak, F.Y. Prediction of Lattice Constants for the Full-Heusler Alloys by Vector Regression Model and Artificial Neural Networks. Comput. Condens. Matter 2021, 29, e00605. [Google Scholar] [CrossRef]
  33. Abebe, M.G.; Abass, A.; Gomard, G.; Zschiedrich, L.; Lemmer, U.; Richards, B.S.; Rockstuhl, C.; Paetzold, U.W. Rigorous Wave-Optical Treatment of Photon Recycling in Thermodynamics of Photovoltaics: Perovskite Thin-Film Solar Cells. Phys. Rev. B 2018, 98, 075141. [Google Scholar] [CrossRef]
  34. Guo, R.; Khenkin, M.V.; Arnaoutakis, G.E.; Samoylova, N.A.; Barbé, J.; Lee, H.K.H.; Tsoi, W.C.; Katz, E.A. Initial Stages of Photodegradation of MAPbI3 Perovskite: Accelerated Aging with Concentrated Sunlight. Sol. RRL 2020, 4, 1900270. [Google Scholar] [CrossRef]
  35. Jäger, K.; Tillmann, P.; Katz, E.A.; Becker, C. Perovskite/Silicon Tandem Solar Cells: Effect of Luminescent Coupling and Bifaciality. Sol. RRL 2021, 5, 2000628. [Google Scholar] [CrossRef]
  36. Song, Y.; Wu, X.; Wang, K.; Zhang, Y. Discovering Optical Performance Enhancers in Perovskite Materials Through Machine Learning-Based Feature Analysis. Opt. Express 2025, 33, 776. [Google Scholar] [CrossRef]
  37. Unger, E.; Jacobsson, T.J. The Perovskite Database Project: A Perspective on Collective Data Sharing. ACS Energy Lett. 2022, 7, 1240–1245. [Google Scholar] [CrossRef]
  38. Hassija, V.; Chamola, V.; Mahapatra, A.; Singal, A.; Goel, D.; Huang, K.; Scardapane, S.; Spinelli, I.; Mahmud, M.; Hussain, A. Interpreting Black-Box Models: A Review on Explainable Artificial Intelligence. Cognit. Comput. 2024, 16, 45–74. [Google Scholar] [CrossRef]
  39. Schmidt, J.; Marques, M.R.G.; Botti, S.; Marques, M.A.L. Recent Advances and Applications of Machine Learning in Solid-State Materials Science. npj Comput. Mater. 2019, 5, 83. [Google Scholar] [CrossRef]
  40. Briones, J.; Guinto, M.C.; Pelicano, C.M. Accelerated Lattice Constant Prediction of Perovskite Materials (ABX3, A2BB′O6) Using Partial Least Squares and Principal Component Regression Methods. Mater. Lett. 2021, 298, 130040. [Google Scholar] [CrossRef]
  41. Sim, M.K. Explanation Using Model-Agnostic Methods. In Human-Centered Artificial Intelligence; Elsevier: Amsterdam, The Netherlands, 2022; pp. 17–31. [Google Scholar]
  42. Molnar, C.; König, G.; Bischl, B.; Casalicchio, G. Model-Agnostic Feature Importance and Effects with Dependent Features: A Conditional Subgroup Approach. Data Min. Knowl. Discov. 2024, 38, 2903–2941. [Google Scholar] [CrossRef]
  43. Alade, I.O.; Olumegbon, I.A.; Bagudu, A. Lattice Constant Prediction of A2XY6 Cubic Crystals (A = K, Cs, Rb, TI; X = Tetravalent Cation; Y = F, Cl, Br, I) Using Computational Intelligence Approach. J. Appl. Phys. 2020, 127, 015303. [Google Scholar] [CrossRef]
  44. Zhang, Y.; Xu, X. Machine Learning Lattice Constants for Cubic Perovskite Compounds. ChemistrySelect 2020, 5, 9999–10009. [Google Scholar] [CrossRef]
  45. Zhang, Y.; Xu, X. Machine Learning Lattice Constants for Cubic Perovskite A22+BB′O6 Compounds. CrystEngComm 2020, 22, 6385–6397. [Google Scholar] [CrossRef]
  46. Zhang, Y.; Xu, X. Modeling of Lattice Parameters of Cubic Perovskite Oxides and Halides. Heliyon 2021, 7, e07601. [Google Scholar] [CrossRef] [PubMed]
  47. Owolabi, T.O. Extreme Learning Machine and Swarm-Based Support Vector Regression Methods for Predicting Crystal Lattice Parameters of Pseudo-Cubic/Cubic Perovskites. J. Appl. Phys. 2020, 127, 245107. [Google Scholar] [CrossRef]
  48. Toghraie, D.; Sina, N.; Jolfaei, N.A.; Hajian, M.; Afrand, M. Designing an Artificial Neural Network (ANN) to Predict the Viscosity of Silver/Ethylene Glycol Nanofluid at Different Temperatures and Volume Fraction of Nanoparticles. Phys. A Stat. Mech. Appl. 2019, 534, 122142. [Google Scholar] [CrossRef]
  49. Heidari, E.; Sobati, M.A.; Movahedirad, S. Accurate Prediction of Nanofluid Viscosity Using a Multilayer Perceptron Artificial Neural Network (MLP-ANN). Chemom. Intell. Lab. Syst. 2016, 155, 73–85. [Google Scholar] [CrossRef]
  50. Toghraie, D.; Aghahadi, M.H.; Sina, N.; Soltani, F. Application of Artificial Neural Networks (ANNs) for Predicting the Viscosity of Tungsten Oxide (WO3)-MWCNTs/Engine Oil Hybrid Nanofluid. Int. J. Thermophys. 2020, 41, 163. [Google Scholar] [CrossRef]
  51. Loftus, J.R.; Bynum, L.E.J.; Hansen, S. Causal Dependence Plots. arXiv 2023. [Google Scholar] [CrossRef]
  52. Danesh, T.; Ouaret, R.; Floquet, P.; Danesh, T. Interpretability in Machine Learning Predictions: Case of Random Forest Regression Using Partial Dependence Plots. In Proceedings of the 18ème Congrès de la Société Française de Génie des Procédés, Toulouse, France, 7–10 November 2022. [Google Scholar]
  53. Hemmat Esfe, M.; Tatar, A.; Ahangar, M.R.H.; Rostamian, H. A Comparison of Performance of Several Artificial Intelligence Methods for Predicting the Dynamic Viscosity of TiO2/SAE50 Nano-Lubricant. Phys. E Low-Dimens. Syst. Nanostruct. 2018, 96, 85–93. [Google Scholar] [CrossRef]
  54. Jamei, M.; Ahmadianfar, I. A Rigorous Model for Prediction of Viscosity of Oil-Based Hybrid Nanofluids. Phys. A Stat. Mech. Appl. 2020, 556, 124827. [Google Scholar] [CrossRef]
  55. Kato, T.; Ichino, Y.; Mori, T.; Seike, Y. Effects of Potassium Doping on the Active Layer of Inverse-Structured Perovskite Solar Cells. IEICE Trans. Electron. 2023, E106.C, 220–227. [Google Scholar] [CrossRef]
Figure 1. Crystal structure of an ideal cubic ABO3 perovskite. The A-site cations (blue) are positioned at the cube corners, B-site cations (red) at the center, and oxygen anions (green) at the face centers forming BO6 octahedra. This serves as the parent structure for aliovalent doping, where substitutions at the A- or B-sites (e.g., La3+ for Sr2+) lead to charge-compensating oxygen vacancies and lattice distortions.
Crystals 15 00538 g001
Figure 2. Workflow for ANN-based lattice constant prediction. The dataset is analyzed and split into training and testing subsets. The training set is used to develop the ANN model, while the testing set is reserved exclusively for evaluating predictive performance. Partial Dependence Plots (PDPs) are used to interpret feature influence on predictions.
Crystals 15 00538 g002
Figure 3. Violin plots showing the distribution of input features: lattice parameters a, b, c (in Å), and the number of formula units per unit cell (Z, unitless). The width of each plot represents the density of data points, highlighting variability across features.
Crystals 15 00538 g003
Figure 4. Correlation matrix of lattice parameters and constants.
Crystals 15 00538 g004
Figure 5. Comparison of predicted and observed lattice constants for (a) training dataset (b) testing dataset.
Crystals 15 00538 g005
Figure 6. Residuals analysis of lattice constants for (a) training dataset (b) testing dataset.
Crystals 15 00538 g006
Figure 7. Variation in lattice parameter a with changes in lattice constant (a) training dataset (b) testing dataset.
Crystals 15 00538 g007
Figure 8. Variation in lattice parameter b with changes in lattice constant (a) training dataset (b) testing dataset.
Crystals 15 00538 g008
Figure 9. Variation in lattice parameter c with changes in lattice constant. (a) training dataset (b) testing dataset.
Crystals 15 00538 g009
Figure 10. Variation in lattice parameter Z with changes in lattice constant. (a) training dataset (b) testing dataset.
Crystals 15 00538 g010
Table 2. Summary statistics of input features and their qualitative influence on the predicted lattice constant, as inferred from Partial Dependence Plot (PDP) trends.
FeatureMeanStd DevMinMaxInfluence (PDP-Based)
a (Å)5.2261.2963.85659.5340High, nonlinear
b (Å)5.4331.3263.85657.7279Moderate, linear
c (Å)8.7905.6103.905024.6450High, linear
Z (unitless)3.7922.0141.00006.0000Inverse, nonlinear
Table 3. ANN architecture used for the lattice constant prediction.
HyperparameterValue
Number of fully connected layers1
First-layer neurons25
Activation functionReLU
Iteration limit1000
Loss function:Mean Squared Error (MSE)
Data preprocessingStandardized using MATLAB’s built-in normalization
Optimization algorithm:MATLAB’s default Levenberg–Marquardt optimization used within the regression learner app
Table 4. Model performance metrics.
MetricTraining ResultTesting Result
RMSE0.00213540.00097033
R-squared (R2)1.001.00
MSE 4.55081 × 10 6 9.41557 × 10 7
MAE0.00122630.00075149
Disclaimer/Publisher’s Note: The statements, opinions and data contained in all publications are solely those of the individual author(s) and contributor(s) and not of MDPI and/or the editor(s). MDPI and/or the editor(s) disclaim responsibility for any injury to people or property resulting from any ideas, methods, instructions or products referred to in the content.

