Article

The Influence of the Addition of Ca, Zn, and Zr on the Corrosion Properties of As-Homogenized Mg-3Sn Alloys

1
College of Mechanical Engineering, Shenyang University, Shenyang 110044, China
2
Liaoning Province Pollution Environmental Remediation Professional Technology Innovation Center, College of Environment, Shenyang University, Shenyang 110044, China
3
Shenyang Key Laboratory of Collaborative Technology Innovation for Industrial Pollution Reduction and Carbon Reduction, College of Environment, Shenyang University, Shenyang 110044, China
*
Authors to whom correspondence should be addressed.
Crystals 2025, 15(6), 537; https://doi.org/10.3390/cryst15060537
Submission received: 8 March 2025 / Revised: 8 May 2025 / Accepted: 23 May 2025 / Published: 3 June 2025
(This article belongs to the Section Crystalline Metals and Alloys)

Abstract

The influences of the addition of Ca, Zn, and Zr on the corrosion behavior and mechanism of as-homogenized Mg-3Sn (T3) alloys in a 3.5% NaCl solution were systematically investigated via hydrogen evolution, mass loss, and electrochemical tests. The results indicated that the addition of Ca resulted in a decrease in the corrosion resistance of the T3 alloy. However, the subsequent addition of Zn and Zr could enhance the corrosion resistance of the Mg-3Sn-1Ca (TX31) alloy. The primary cause for the decline in the corrosion resistance of the TX31 alloy was that Ca altered the type of the second phase and the corrosion mechanism of the T3 alloy. This was attributed to the fact that the addition of Ca in the T3 alloy induced the precipitation of the CaMgSn phase and inhibited the precipitation of the Mg2Sn phase. Simultaneously, both the average grain size and the area fraction of the second phase increased, which provided more initiation sites for pitting and accelerated the corrosion of the alloy. The addition of Zr in the TX31 alloy could remarkably refine grains, inhibit anodic corrosion, and improve corrosion resistance. Nevertheless, the corrosion resistance of the Mg-3Sn-1Ca-1Zr (TXK311) alloy was still inferior to that of the T3 alloy. In this study, the Mg-3Sn-1Ca-1Zn (TXZ311) alloy exhibited the best corrosion resistance, with a hydrogen-evolution corrosion rate of 2.82 mm·year−1. This was because the addition of Zn refined the grains of the TX31 alloy and facilitated the formation of a relatively stable passivation film, which effectively prevented the intrusion of Cl, thereby enhancing the corrosion resistance of the alloy.

1. Introduction

Magnesium (Mg) alloys, distinguished by their ultralight characteristics and exceptional strength-to-weight ratio, are increasingly pivotal in aerospace, automotive, and biomedical sectors [1,2,3]. Despite these merits, their practical utility is constrained by rapid corrosion degradation, limited wear resistance, and challenges in forming complex geometries [4,5]. Addressing these limitations to engineer Mg alloys that synergize mechanical robustness, corrosion durability, and thermal stability remains a critical technological imperative.
Mg-Sn alloys have emerged as promising candidates for elevated-temperature applications due to the precipitation of thermally stable Mg2Sn intermetallic phases during processing [6,7]. The incorporation of Sn enhances both ductility and tensile strength while modulating corrosion behavior through cathodic hydrogen suppression [8,9,10]. However, an excessive Sn content (>3 wt.%) induces coarse Mg2Sn formation, which acts as cathodic micro-galvanic sites, exacerbating localized pitting corrosion [11,12]. This duality necessitates precise compositional optimization.
Calcium (Ca) alloying offers a strategic pathway to refine microstructures and inhibit Mg2Sn precipitation. At Sn/Ca mass ratios of 3–3.5/1, Ca facilitates CaMgSn-phase formation, improving thermal stability [13,14,15]. Paradoxically, excessive Ca (>1 wt.%) coarsens grain structures and amplifies the secondary-phase volume fraction, thereby accelerating corrosion initiation [16,17,18]. Liu et al. [19] demonstrated a non-monotonic relationship between Ca content and corrosion resistance in Mg-Bi-Al alloys, underscoring the importance of balanced Ca incorporation.
Zinc (Zn) and zirconium (Zr) are pivotal modifiers for tailoring Mg alloy performance. Zn, sharing Mg’s hexagonal close-packed structure, enhances corrosion resistance through stable passivation films, though excessive Zn (>2 wt.%) triggers micro-galvanic coupling, reversing this trend [20,21,22,23]. For instance, Ercetin et al. [24] further elucidated Zn’s role in stabilizing corrosion product films, while Yang et al. [25] highlighted Zn’s influence on passivation kinetics in Mg-Sn-Zr systems. Han et al. [26] investigated the influence of (1–4) wt.% Zn content on the corrosion rate of Mg-5Sn alloys. The results showed that 1 wt.% Zn content increases the stability of the product film, and the Mg-5Sn-1Zn alloy exhibits the lowest corrosion rate. Alloying exerts an influence on the solidification mode and crystal growth morphology of alloys, thereby resulting in compositional segregation or alterations in grains [27,28]. Zr has been reported to significantly refine grains, transforming coarse α-Mg dendrites into fine spherical grains [29]. Chang et al. [30] investigated the effects of heat treatment and the Zr element on the corrosion behavior of a Mg-3Nd-0.2Zn-0.4Zr (wt.%) alloy. The results showed that the addition of Zr had a favorable effect on the corrosion resistance of the alloys. Huang et al. [31] investigated the microstructure and corrosion properties of Mg-3Zn-1Y-xZr (x = 0, 0.2, 0.4, 0.6) alloys. The results showed that the Mg-3Zn-1Y-0.6Zr alloy has the lowest corrosion rate. They concluded that Zr can significantly refine the grains, optimize the microstructure, and enhance the corrosion resistance of the alloy.
Despite these advances, the synergistic interplay of Ca with Zn/Zr in Mg-3Sn alloys remains underexplored. This study systematically investigates how Ca, Zn, and Zr additions govern microstructure evolution, phase constitution, and corrosion dynamics in as-homogenized Mg-3Sn alloys. By elucidating the roles of grain refinement, secondary-phase optimization, and surface passivation mechanisms, this work aims to establish design principles for corrosion-resistant Mg-Sn alloys tailored for industrial deployment.

2. Experimental Section

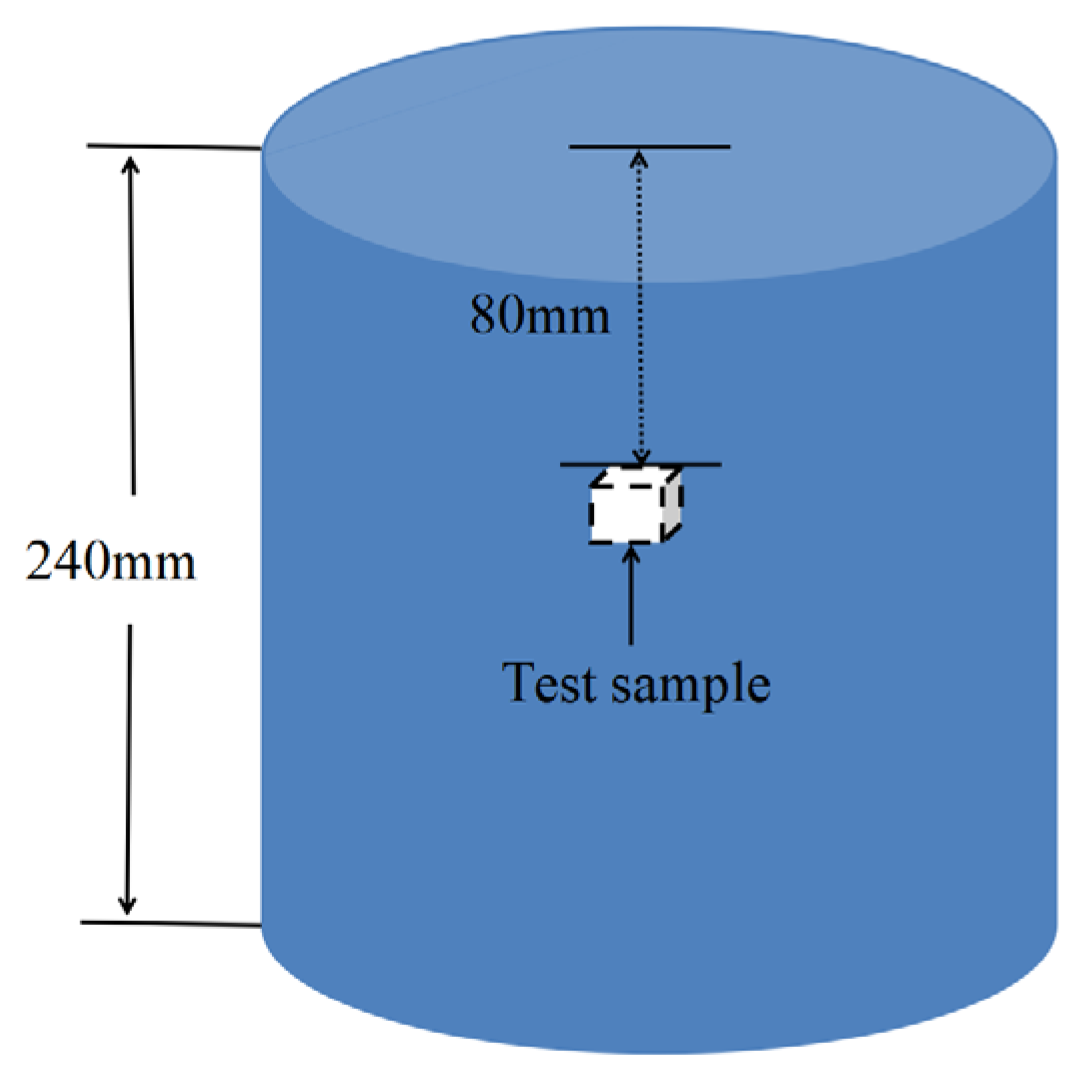
2.1. Material Preparation

The experimental alloys Mg-3Sn, Mg-3Sn-1Ca, Mg-3Sn-1Ca-1Zn and Mg-3Sn-1Ca-1Zr were made from industrial pure Mg, pure Sn, pure Zn, Mg–25% Ca, and Mg–30% Zr master alloys. They were smelted at 730 °C in a well-type resistance furnace (RJ2 series, Hankou Electric Furnace Company, Wuhan, China), with a CO2:SF6 (100:1) gas mixture protecting the melt surface. After the addition of alloying elements, the melt was stirred and held at 710 °C for 25 min, and then poured into a steel mold with a diameter of 65 mm and height of 240 mm for natural cooling. The ingots were homogenized at 400 °C for 24 h in a 1400 °C manual-door box furnace and water-quenched. After that, the actual chemical composition of the experimental alloys was measured by an inductively coupled plasma atomic emission spectrometer (ICP, Plasma 2000, Sinovac Testing Technology Co., Ltd., Beijing, China), which are shown in Table 1.

2.2. Microstructure Analysis

The metallographic and SEM samples were sanded (400–5000 grit), polished (0.5 μm diamond paste), and etched (3 g picric acid, 3 mL acetic acid, 50 mL ethanol, 5 mL deionized water, 5–10 s), with the sampling position shown in Figure 1. The grain size and the secondary-phase volume fraction were evaluated with Image-Pro Plus software 6.0. Microstructures were analyzed by stereomicroscope and SEM-EDS (Hitachi S-4800, Tokyo, Japan). Phase identification was conducted with a Shimadzu-7000 X-ray diffractometer (Cu target, 40 kV, 30 mA, 20–90° scan, Kyoto, Japan).

2.3. Corrosion Performance Test

The corrosion behavior of the as-homogenized alloys was investigated using the hydrogen evolution immersion method, mass loss method, and polarization method. Before the immersion test, the alloy samples were prepared using wire-cutting equipment. Three groups of 10 mm × 10 mm × 10 mm samples were cut, and their surfaces were ground with 400–3000-grit sandpaper. Subsequently, each sample was immersed in a 3.5 wt.% NaCl solution for 24 h. During the hydrogen evolution measurement, hydrogen was collected using an alkaline burette and the volume was recorded every 2 h. After 24 h immersion, the corrosion products were removed by ultrasonic treatment in a mixture containing 100 g CrO3, 5 g AgNO3, and 500 mL of deionized water. Then, the mass loss of the samples was measured.
Equation (1) was used to calculate the corrosion rate in mass loss, given in [7].
P W = 8.76 × 10 4 × Δ g A × t × ρ
where PW—the mass-loss corrosion rate, mm × year−1; ∆g—the alloy mass loss before and after corrosion, g; A—the soaked sample’s total surface area, cm2; t—the soaking time, h; and ρ—the mass loss measured based on sample density, g × cm−3.
The hydrogen-evolution corrosion rate was calculated according to Equation (2), given in [7].
P H = 8.76 × 10 4 × Δ V × M A × t × ρ
where PH—the hydrogen-evolution corrosion rate, mm × year−1; M—the relationship between the hydrogen production rate and alloy mass loss rate, with a value of 0.001083, g × mL−1; and ∆V—the total amount of hydrogen evolution during corrosion, mL.
The electrochemical corrosion rate was calculated by Equation (3), given in [20], as follows:
P i = 22.85 × i c o r r
where Pi—the electrochemical corrosion rate, mm × year−1; and icorr—the corrosion current density, mA × cm−2.
For the electrochemical test, the alloy samples were prepared as follows: The exposed surface with an area of 1 cm² was polished successively with 400–3000-grit sandpaper, and the remaining surfaces were encapsulated in epoxy resin. All electrochemical tests were carried out in a 3.5 wt.% NaCl solution. The polarization curves and impedance spectra were measured using an electrochemical workstation (CHI660E, Shanghai Chenhua Instrument Co., Ltd., Shanghai, China). A conventional three-electrode cell was employed, which consisted of a working electrode (the sample), a reference electrode (a saturated calomel electrode), and a counter electrode (a platinum electrode).
After specimens were immersed in solution for 3600 s to reach a relatively stable open-circuit potential (OCP), the polarization test began. Polarization curves were acquired at a sweep rate of 1 mV/s, with potential from −2.2 V to −1.1 V. Ecorr and Icorr were derived from the Tafel plot. For EIS, the scan frequency was 100 kHz to 0.01 Hz with 10 mV perturbation. To ensure repeatability, immersion and electrochemical polarization tests were repeated three times for each alloy sample.

3. Results

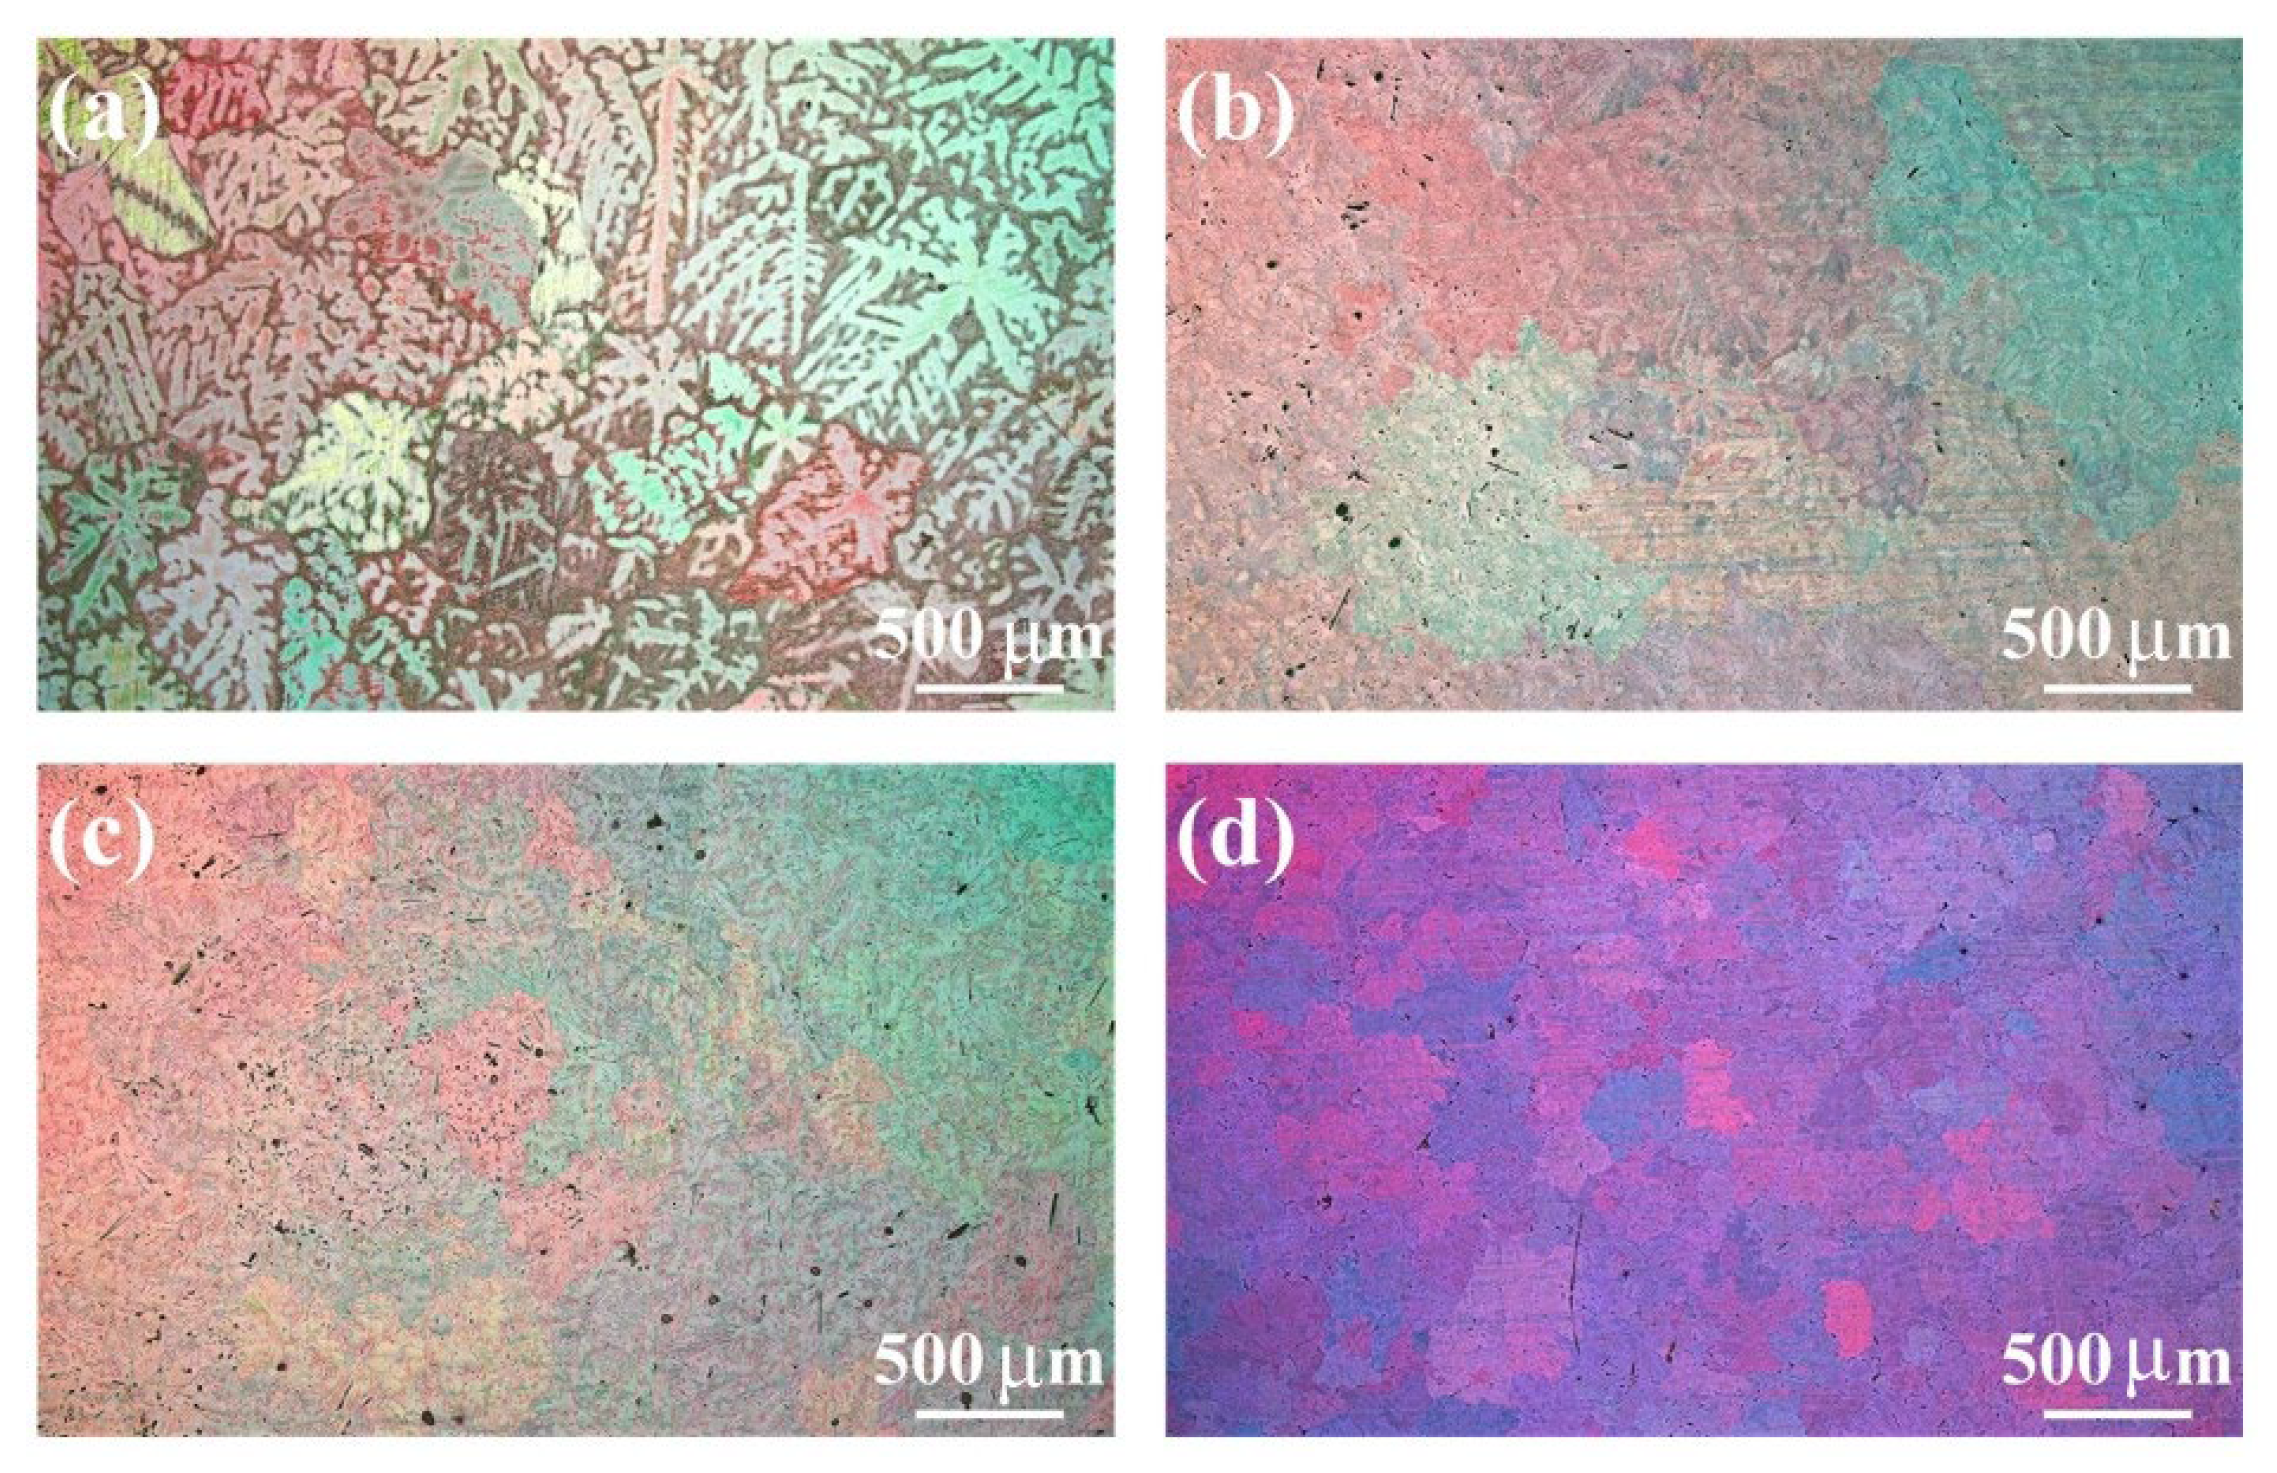
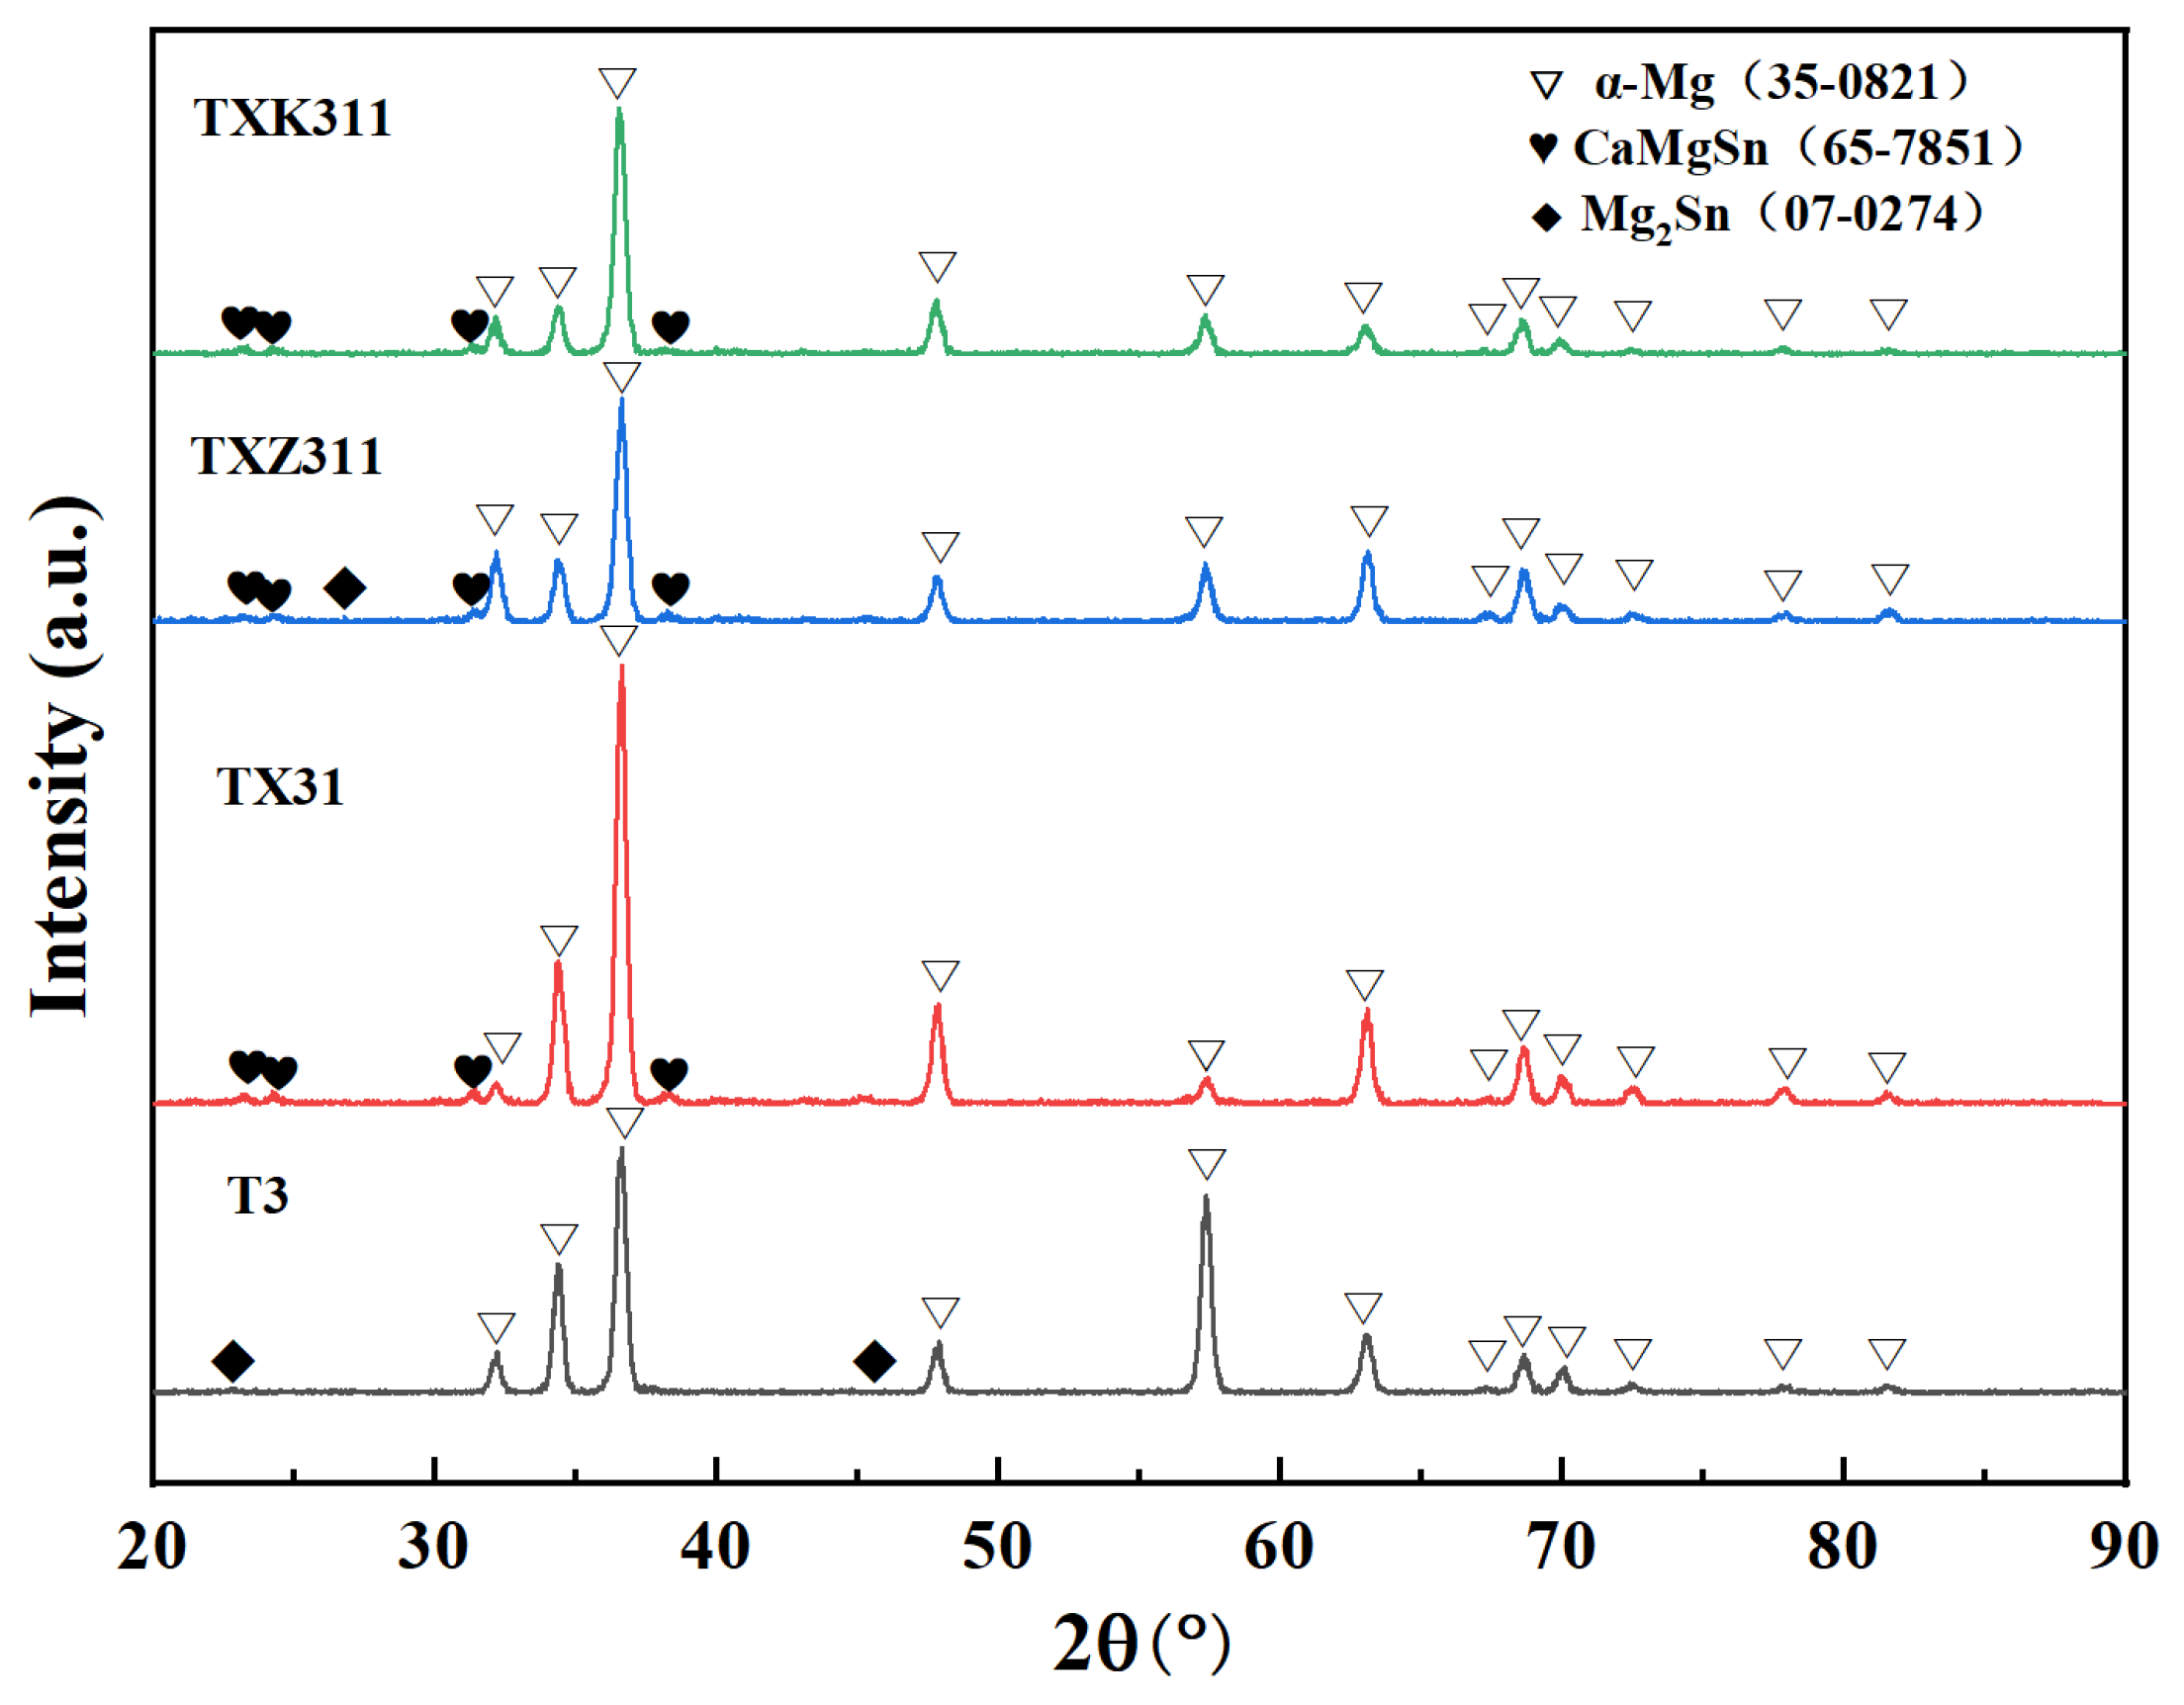
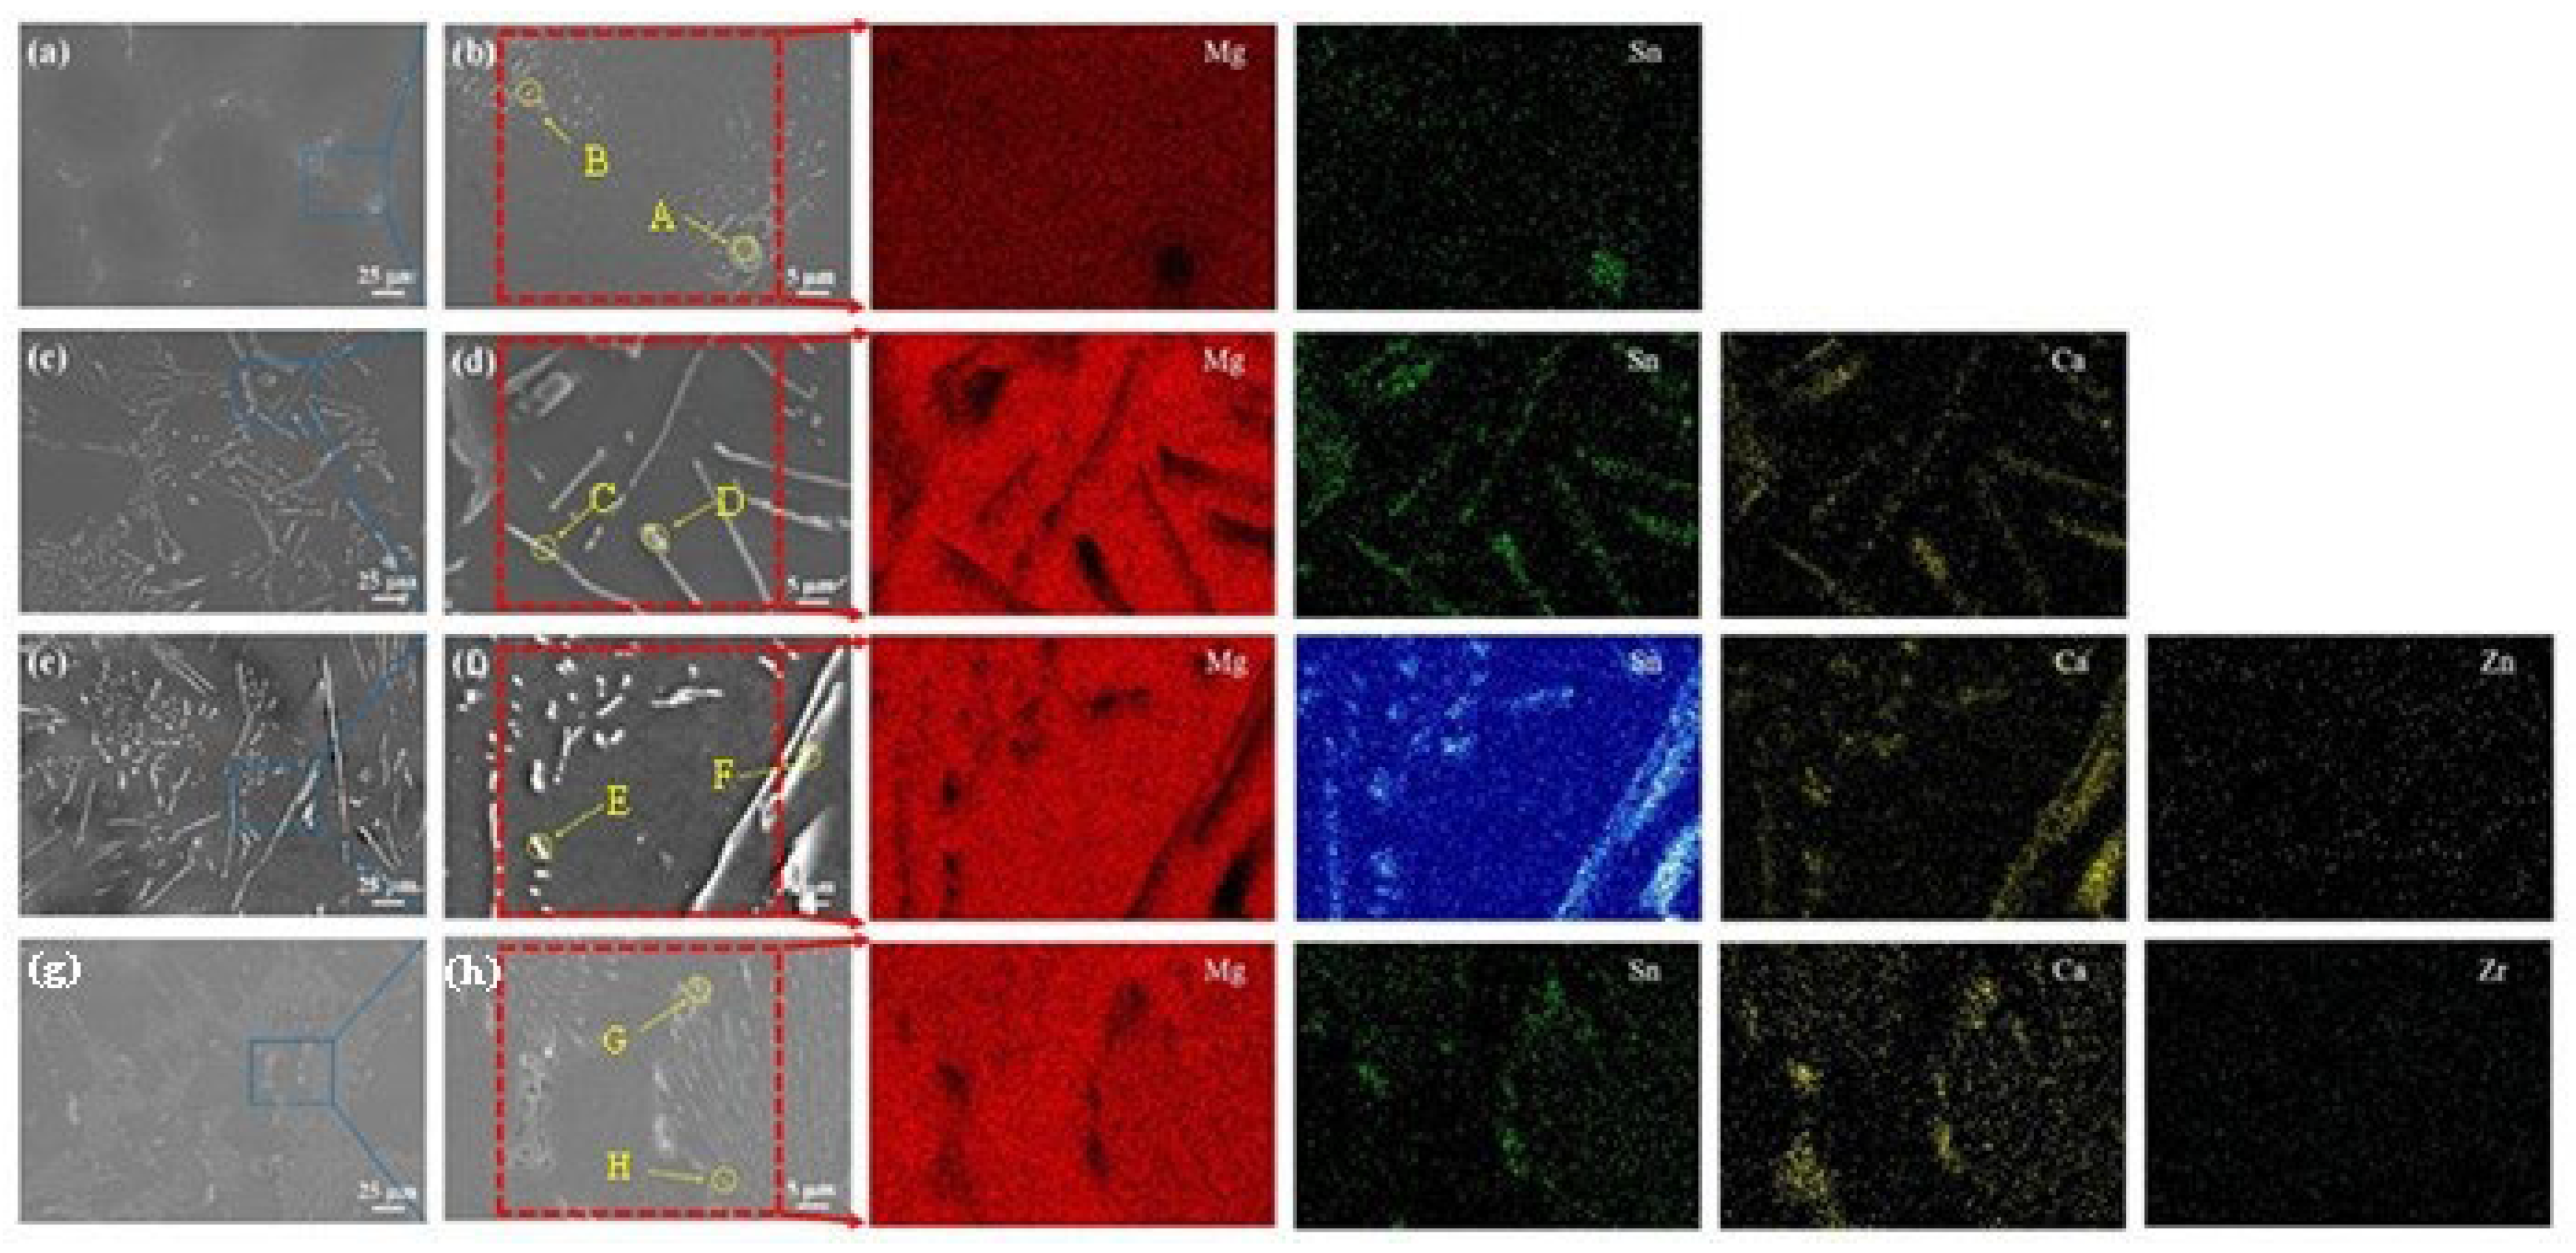
3.1. Microstructure Characterization
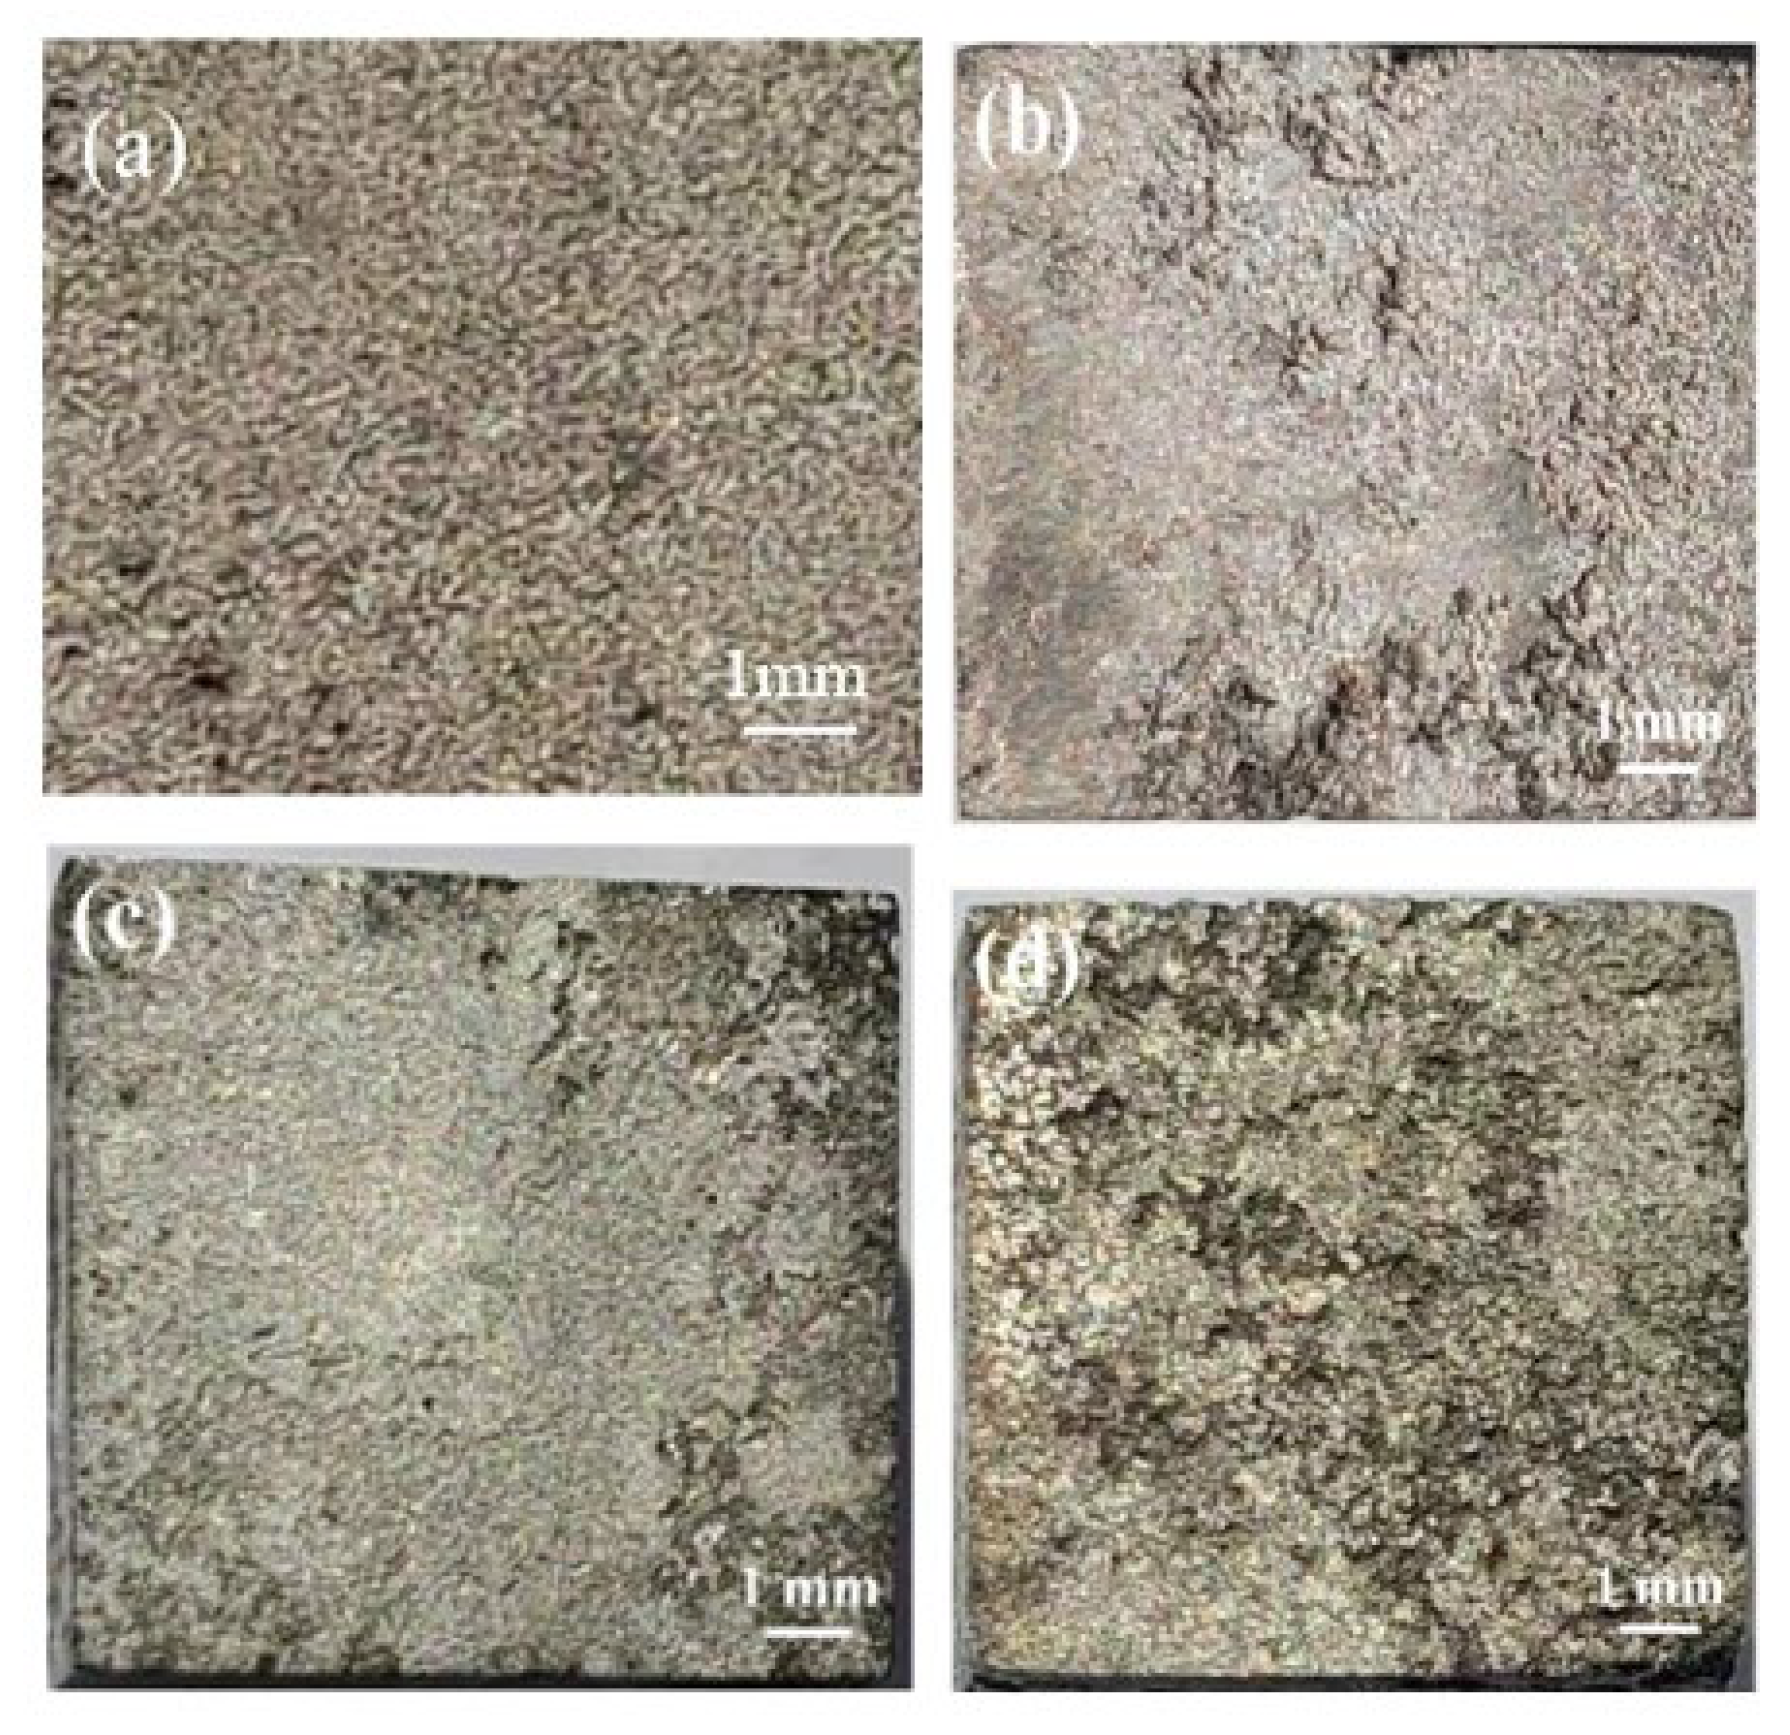
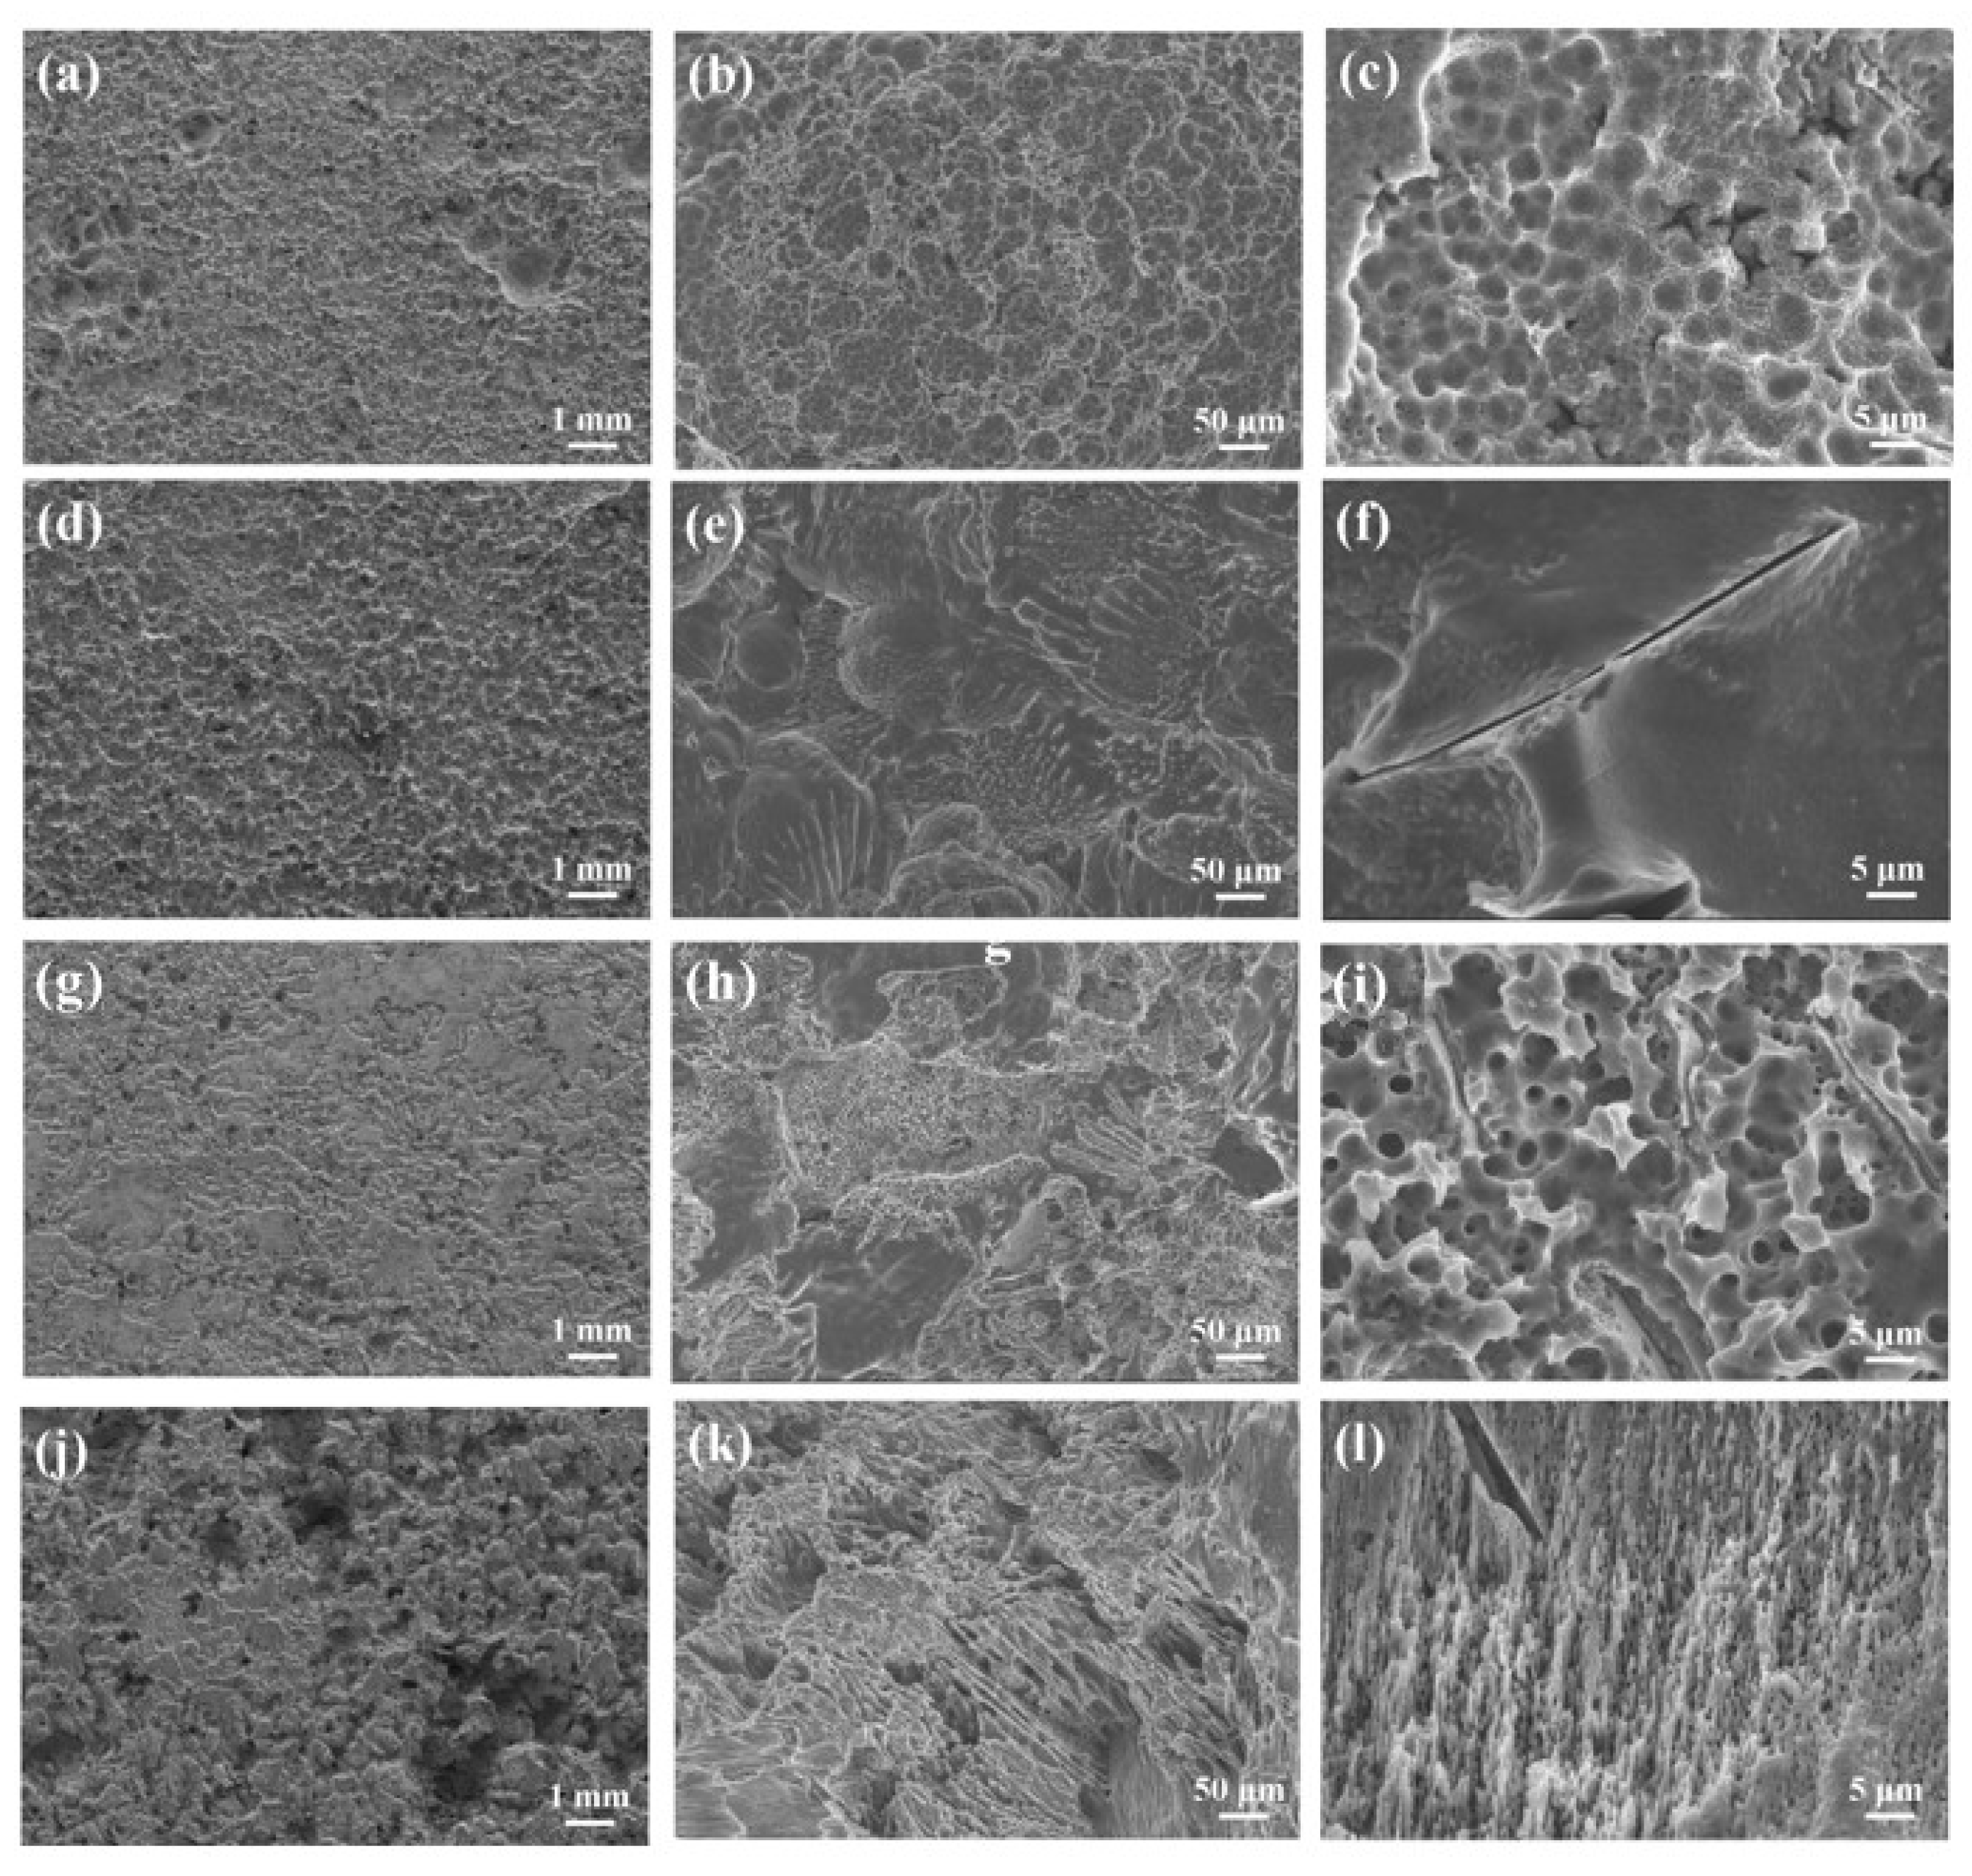
Figure 2 presents the microstructures of four as-homogenized alloys. The average grain sizes of these alloys were measured using Image-Pro Plus software 6.0. Among them, The TXK311 alloy had the smallest grain size, at 260.4 ± 3.4 μm, while the TX31 alloy had the largest, at 698.7 ± 7.2 μm. The average grain diameters of the T3 and TXZ311 alloys were 406.5 ± 6.6 μm and 364.8 ± 5.1 μm, respectively. As shown in Figure 2, the T3 alloy features typical dendritic crystals, with the second phase distributed in a continuous or discontinuous network at the grain boundaries. Adding the Ca element caused the alloy’s microstructure to change from coarse dendritic crystals to equiaxed crystals. The grain size increased, and a new second phase precipitated at the grain boundaries, mainly in massive and needle-like morphologies. When Zn and Zr elements were added to the TX31 alloy, the alloy grains were refined, and the grain shape resembled equiaxed crystals.
The XRD patterns of as-homogenized T3, TX31, TXZ311, and TXK311 alloys are shown in Figure 3. The XRD pattern of the T3 alloy sample contains α-Mg and Mg2Sn phases. After the addition of 1 wt.% Ca, the diffraction peaks of a-Mg and CaMgSn phases can be observed in the alloy’s XRD pattern. The composition of this phase is in line with the findings of Reference [15]. At a Sn/Ca mass ratio of approximately 3, nearly all of the Ca combines with Sn to form CaMgSn particles, while the remaining Sn dissolves in the Mg matrix. With the addition of Zn and Zr elements, the Sn/Ca mass ratio of the TXZ311 and TXK311 alloys is about 3.1. In these alloys, the peak intensity of Mg2Sn disappears, and the diffraction peaks belonging to the CaMgSn phase emerge, with no other new peaks detected. In the TXZ311 and TXK311 alloys, no diffraction peaks containing Zn and Zr elements were found. This could be because the added Zn and Zr elements dissolved in the Mg matrix and did not form a new phase with Mg and Sn elements. It may also be attributed to the low content of Zn and Zr, which was below the detection limit.
Figure 4 shows the SEM micrographs of the as-homogenized alloys and the corresponding surface scanning results. The size and area fraction of the second phase were measured using Image-Pro Plus software, and the results are shown in Table 2.
As depicted in Figure 4a,b, in the T3 alloy, the spherical and elongated granular second phases not only exist at grain boundaries but also exist in many spherical second phases inside the grains, all of which are Mg2Sn phases. The area fraction of the second phase was 2.4 ± 0.6%. In the TX31 and TXZ311 alloys, the white second phases were semi continuously distributed as long needle-like and dot-like structures in the α-Mg matrix (as shown in Figure 4c–f), with area fractions of 7.4 ± 1.5% and 7.9 ± 2.1%, respectively. In the TXK311 alloy, the second phase was dispersed in the Mg matrix in the form of fine needles and particles, and its area fraction was 13 ± 2.2%. In combining the EDS results (Table 3) and XRD analysis (Figure 3), it can be deduced that the spherical and bright-white granular phases in the T3 alloy were the Mg2Sn phase, the semicontinuous long-needle-like and point phases in the TX31 and TXZ311 alloys were the CaMgSn phase, and the fine-needle and granular phases in the TXK311 alloy were also the CaMgSn phase. Thus, it is inferred that in the T3 alloy, Sn partially dissolves in the Mg matrix and partially precipitates as the Mg2Sn phase at the grain boundaries. In contrast, in the TX31, TXZ311, and TXK311 alloys, Sn and Ca preferentially precipitate as the CaMgSn phase in the Mg matrix. Additionally, the addition of 1% Zn and 1% Zr refines the second phase of the alloys, and the addition of Zr results in a dispersed distribution of the second phase.

3.2. Immersion Test

Figure 5 displays the amount of hydrogen evolution and the hydrogen-evolution corrosion rate of the four as-homogenized alloys when corroded in a 3.5% NaCl solution for 24 h. For the T3 and TXK311 alloys, the amount of hydrogen released increased approximately linearly with corrosion time. This indicates that the amount of hydrogen released was nearly equal every 2 h, suggesting that no protective film formed on the surfaces of these alloys or that the oxide film formed did not offer a protective function during the corrosion process. For the TX31 alloy, the amount of hydrogen released increased slightly after 2 h, then the release rate slowed down, and it increased linearly again after 12 h. The hydrogen-evolution rate of the TXZ311 alloy exhibited a similar decreasing trend as the immersion time increased, which might be attributed to the protective effect of the oxide film formed on its surface. Moreover, the corrosion rate of the studied alloys increased with the addition of Ca elements as the corrosion time extended. However, with the further addition of Zn and Zr elements, the corrosion rate decreased to varying degrees. As presented in Figure 5b, the TX31 alloy had the highest hydrogen-evolution rate of 6.14 mm·year−1, indicating the worst corrosion resistance, while the TXZ311 alloy had the lowest hydrogen-evolution rate of 2.82 mm·year−1, demonstrating the best corrosion resistance.
Figure 6 shows the macroscopic morphology of the corroded surfaces of the alloys after 24 h of immersion. From the macroscopic structure, it is evident that localized corrosion and diffusion occurred during the immersion process. In the T3 alloy matrix, there were mainly small and shallow corrosion pits. In the TX31, TXZ311, and TXK311 alloys, both large and deep corrosion pits as well as small and shallow corrosion pits were present. The surface corrosion of the T3 alloy was more uniform and less severe. Conversely, the surface corrosion of the TX31 alloy with the added Ca element was more serious. There was a series of isolated corrosion pits, and these corrosion pits were deeper. The surface corrosion of the TXZ311 alloy was less severe than that of the TX31 alloy, and its metallic luster was more prominent. A series of corrosion pits with significant depth differences was distributed on its surface, and there were more uncorroded areas. The TXK311 alloy had a metallic luster on its surface and also had some uncorroded areas.
Figure 7 shows the SEM microstructure of the corroded surface of the alloy. In the T3 alloy, the α-Mg matrix was severely corroded, with a few pits on the surface. The surface corrosion of the TX31 alloy was the most severe among the alloys, with the alloy matrix being severely corroded. The surface was covered with distinct corrosion pits, leading to pitting and cracking. After the addition of the Zn element, the surface corrosion of the TX31 alloy was notably reduced. There were some corrosion pits on the alloy surface, and in the severely corroded areas, there were a large number of gaps and holes, presenting as porous flakes. Compared to T3, TX31, and TXZ311 alloys, the TXK311 alloy had a relatively small amount of minor corrosion on its surface. However, the pits were deeper, and in the severely corroded areas, there were a large number of interstitials and holes in the form of flakes.

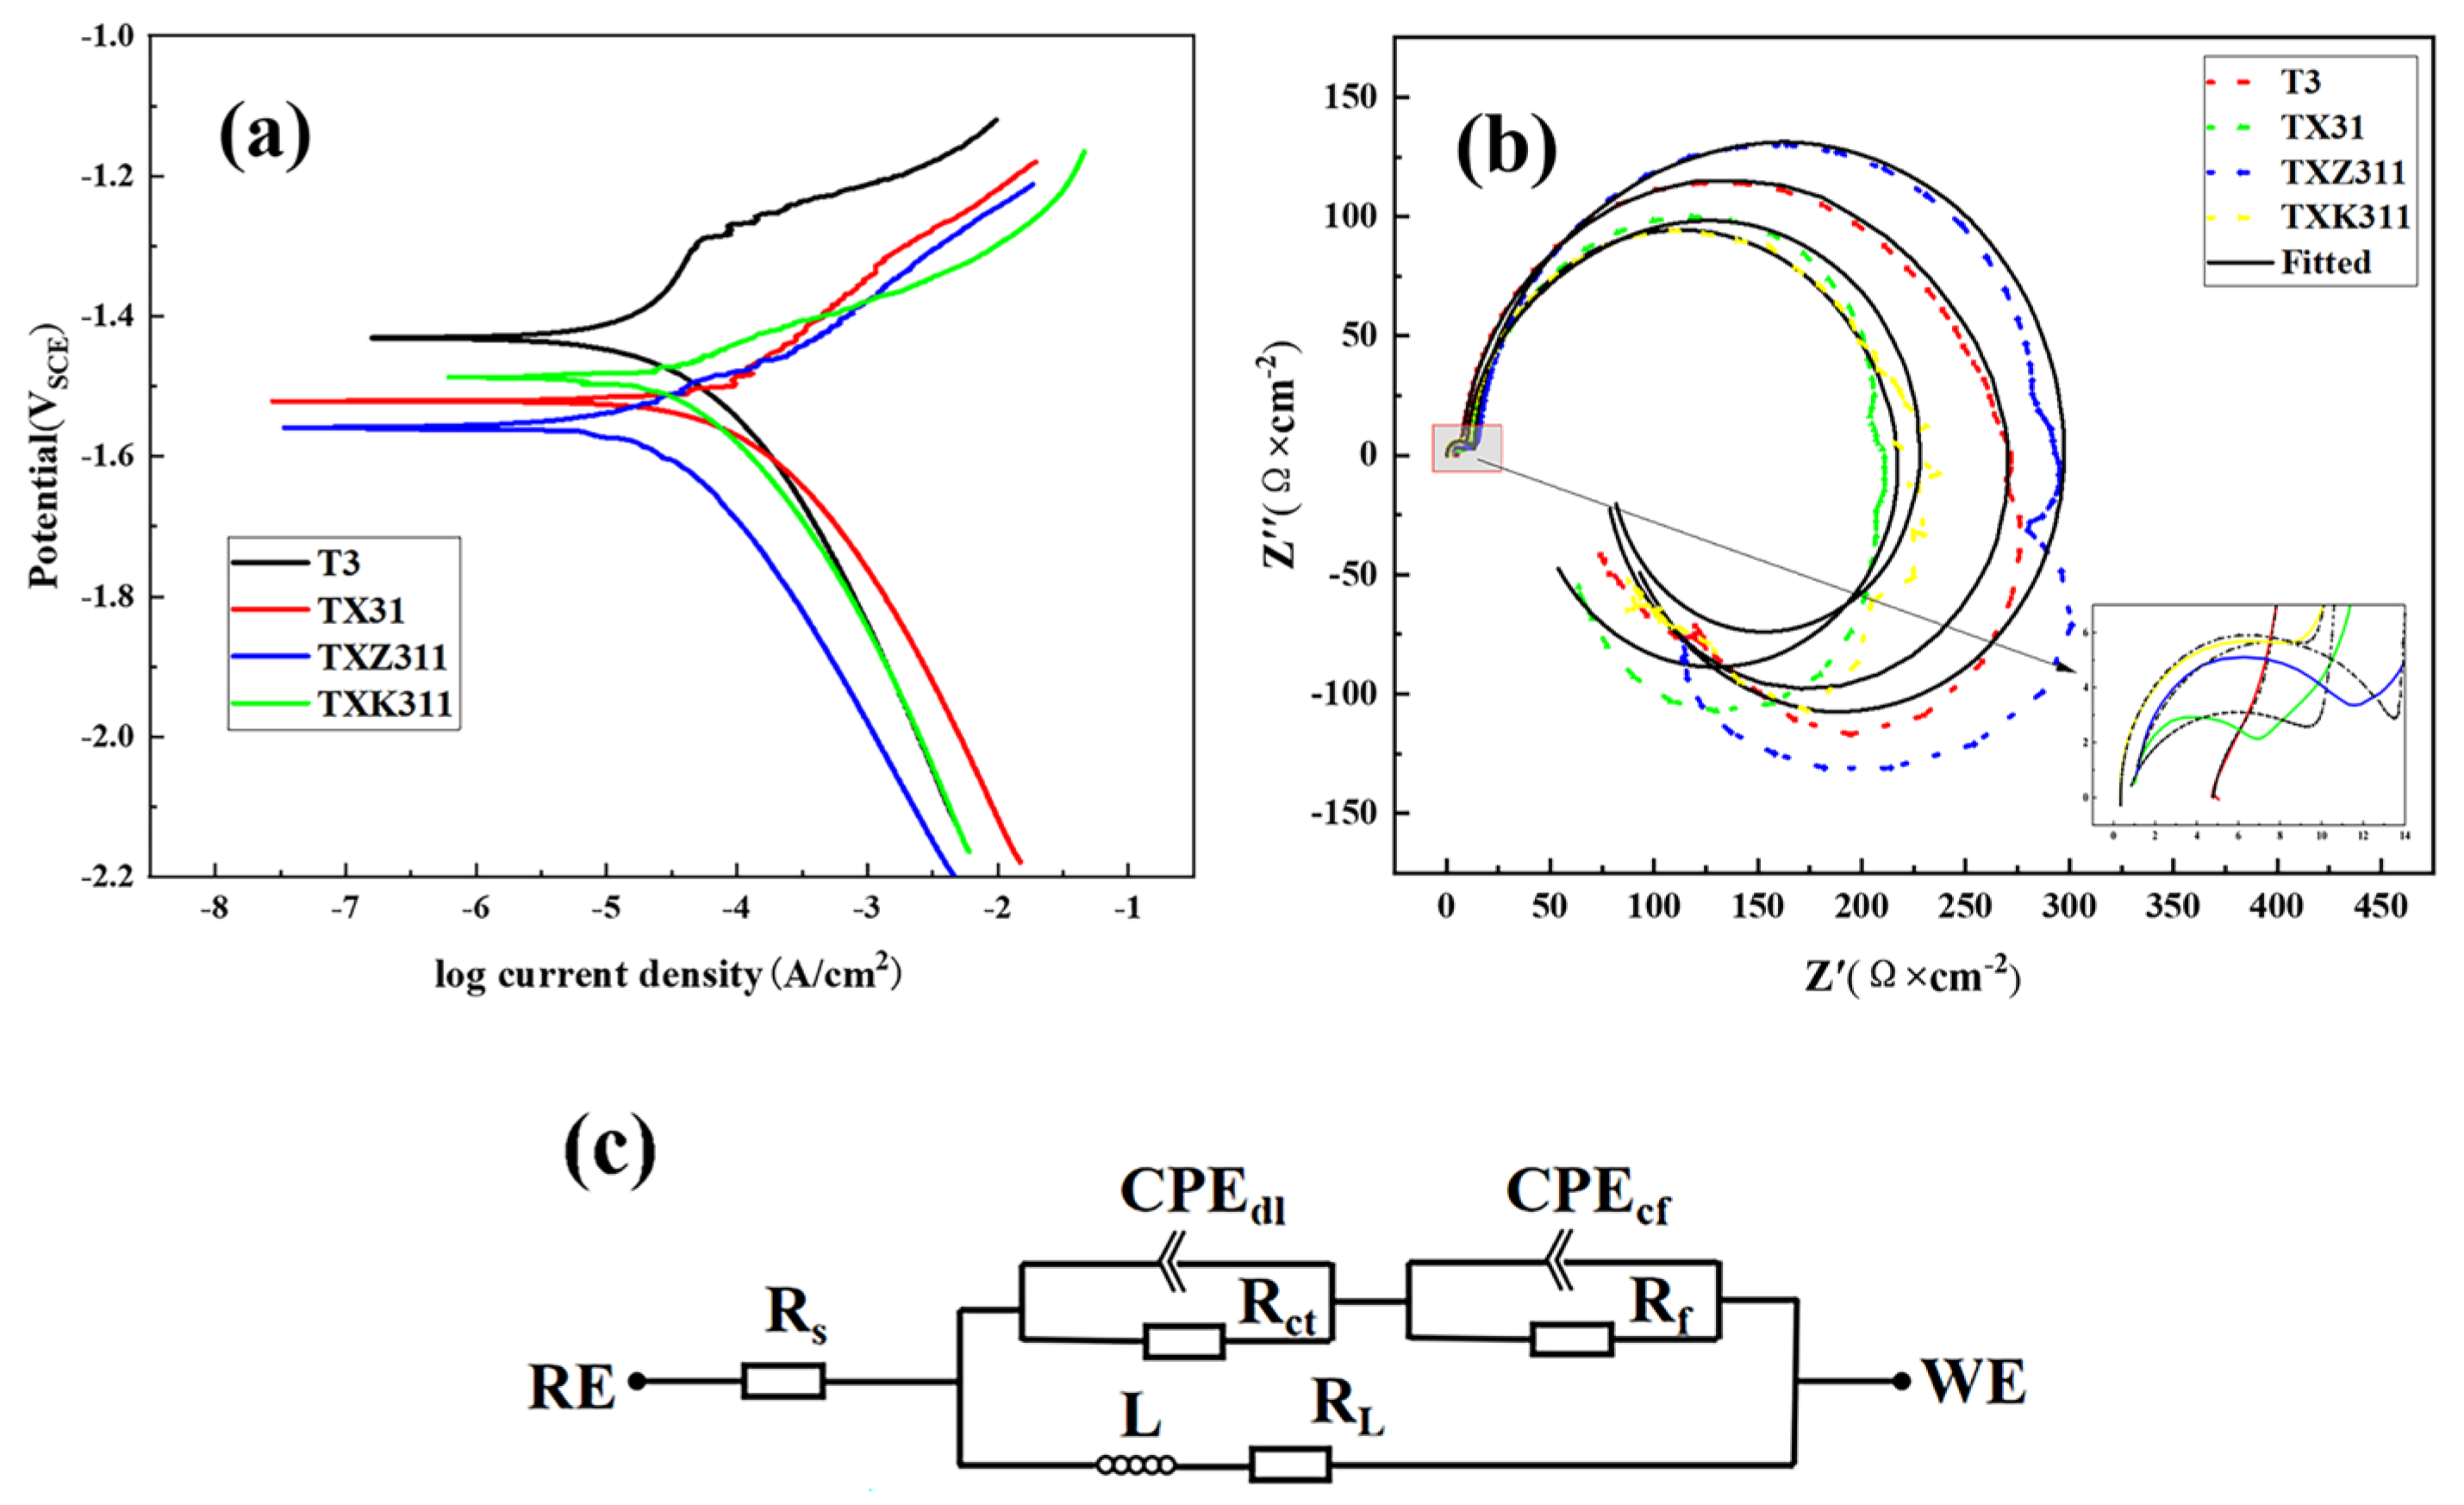
3.3. Electrochemical Behavior
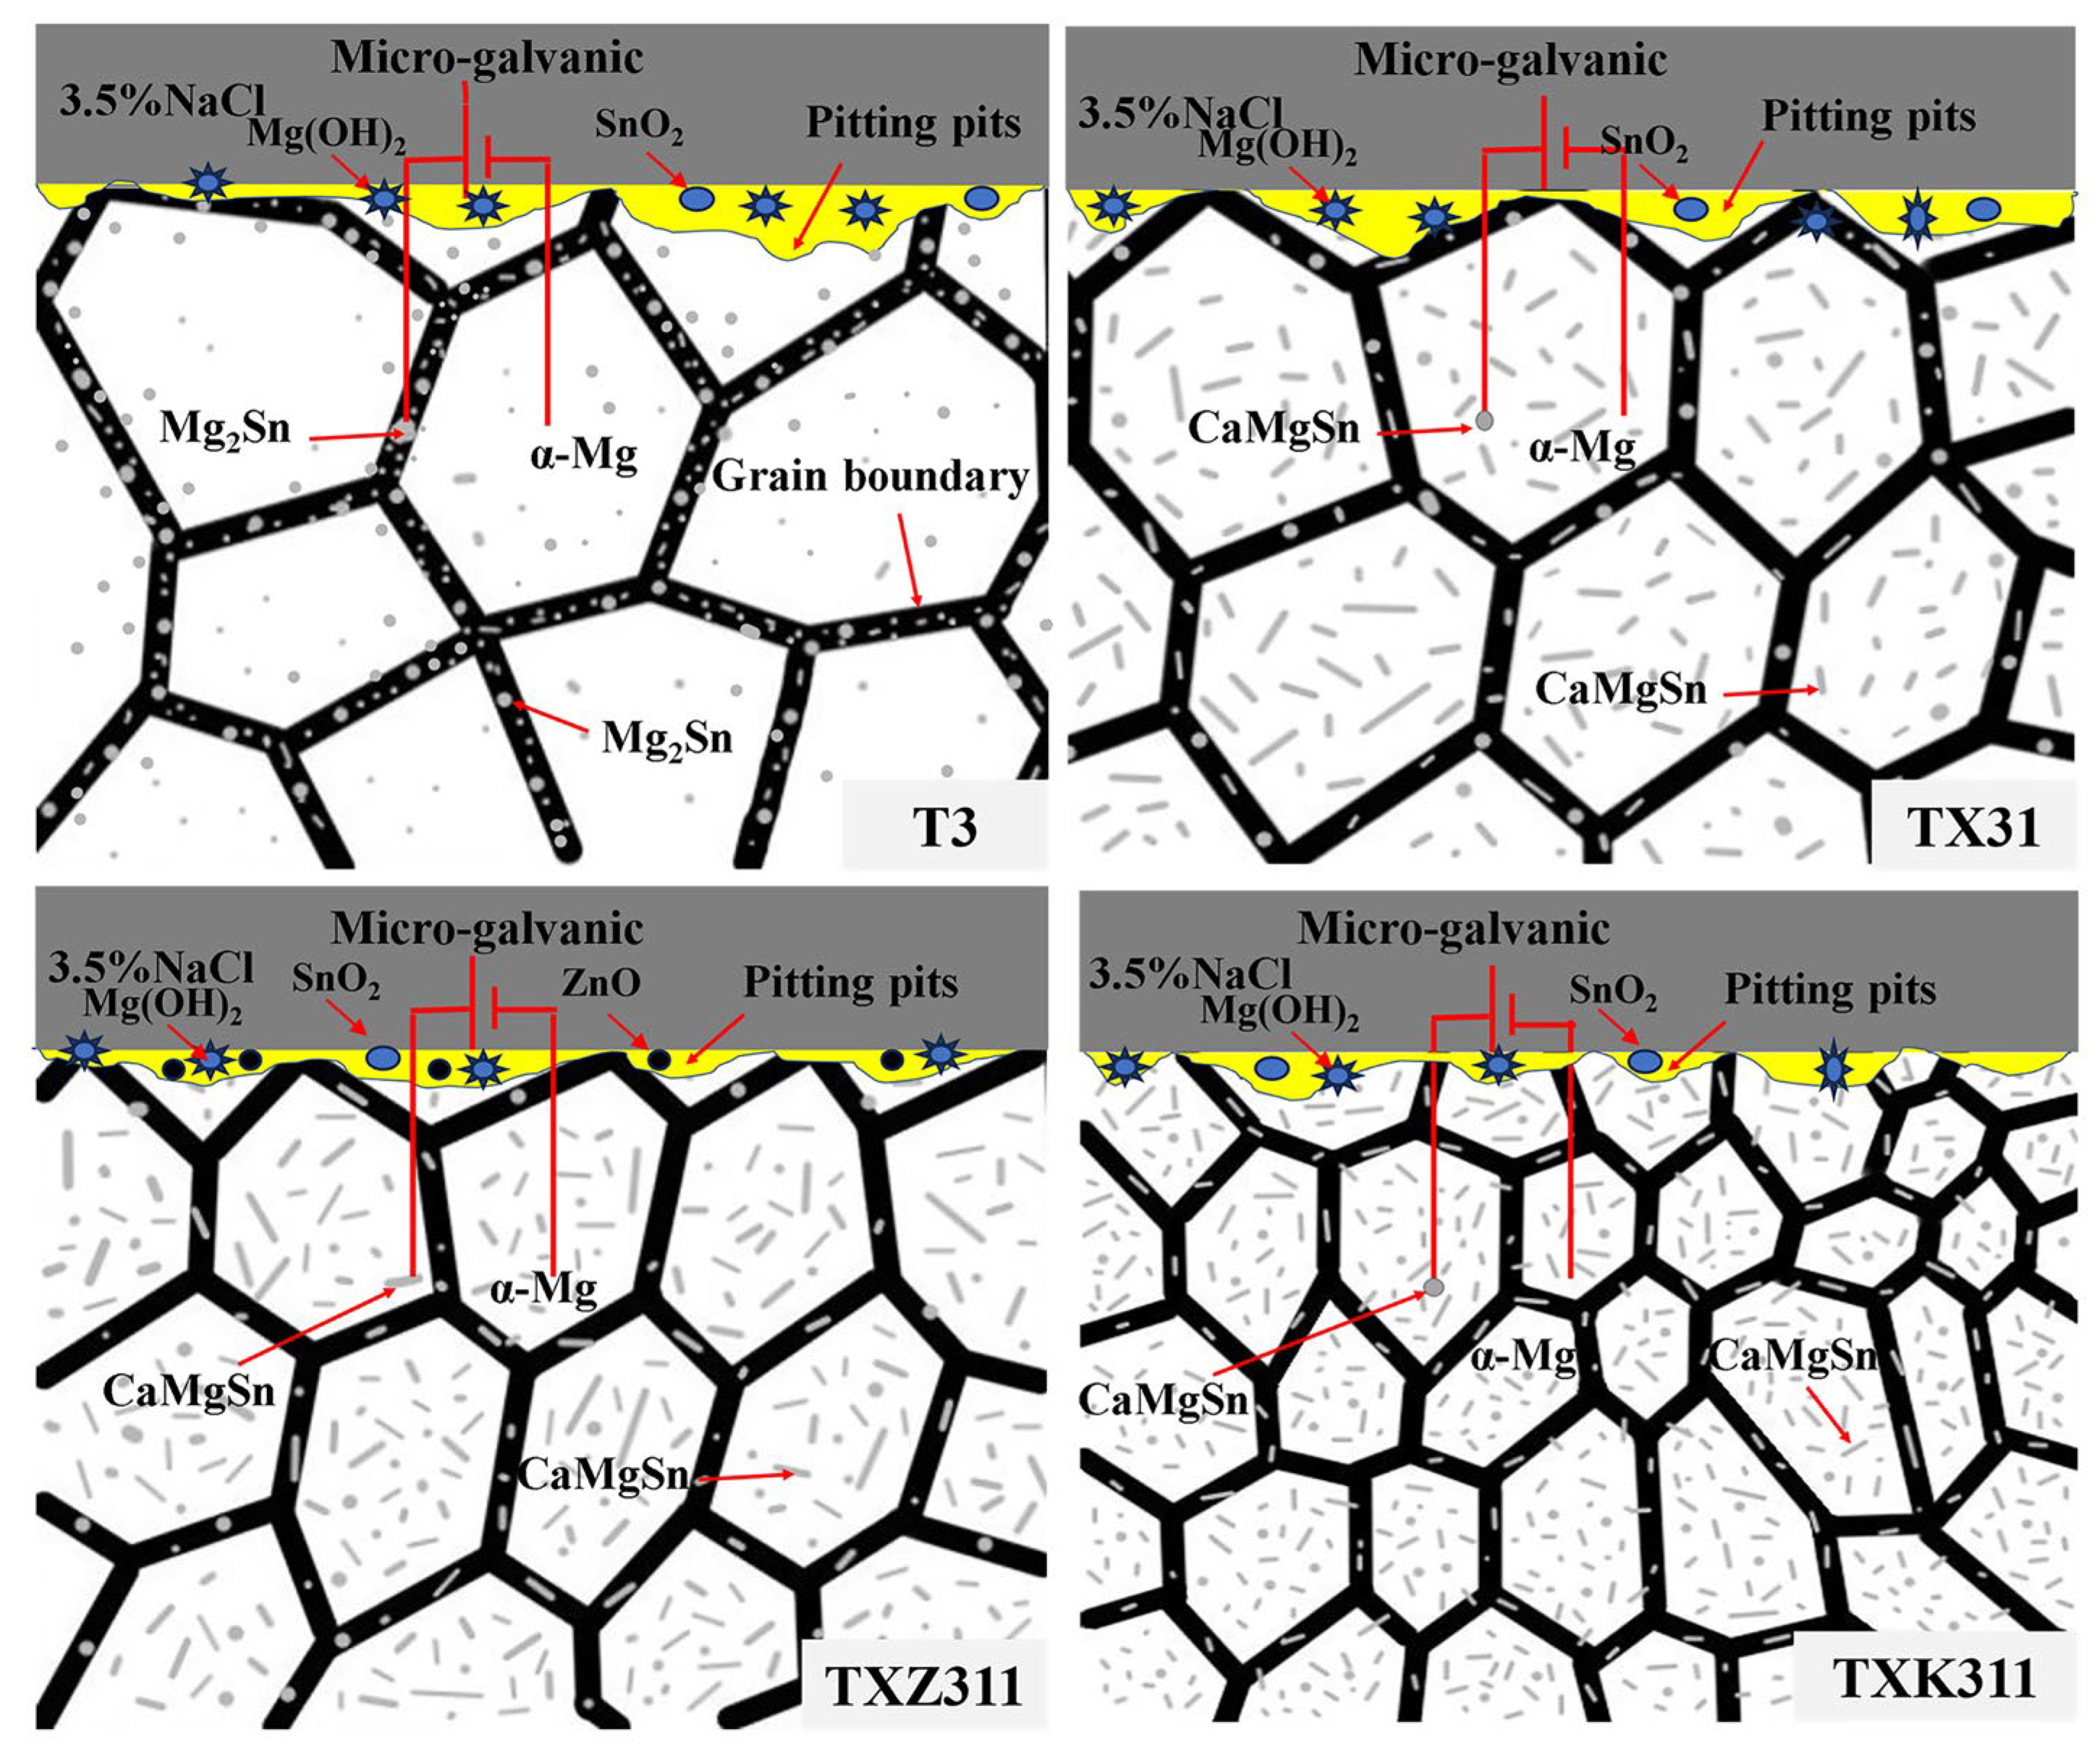
Figure 8 shows the polarization curves and Nyquist diagrams of the as-homogenized T3, TX31, TXZ311, and TXK311 alloys. In general, the cathodic polarization curve represents the hydrogen-evolution reaction, and the anode branch represents the dissolution reaction of the Mg matrix. From the anodic part of the polarization curves in Figure 8a, it can be observed that the passivation of the T3 alloy was more pronounced. In contrast, there was no obvious passivation stage in the alloy with Ca addition. This indicates that the microstructure after Ca addition has little impact on the mechanism of forming anodic branches and that the oxide film on the surface of these alloys provides incomplete protection.
The equivalent circuit diagrams of the T3, TX31, TXZ311, and TXK311 alloys are shown in Figure 8c. The fitting results of the equivalent circuit are shown in Table 4, where Rs represents the solution resistance, Rt represents the charge-transfer resistance, CPEt represents the electric double-layer capacitance, Rf represents the surface film resistance, and CPEf represents the surface film capacitance. The corrosion current density (icoor) of the four alloys was determined from the cathodic polarization curve by the Tafel extrapolation method as shown in Table 4, yielding values of 5.78 × 10⁻⁵ A·cm2, 6.69 × 10⁻⁵ A·cm2, 3.81 × 10⁻⁵ A·cm2, and 4.67 × 10⁻⁵ A·cm2, respectively. It can be determined that the corrosion current density of the four alloys from small to large was TXZ311 < T3 < TXK311 < TX31, indicating that the TXZ311 alloy has the best corrosion resistance.
As can be seen from the Nyquist plot in Figure 8b, the four alloys exhibit a small capacitive reactance arc in the high-frequency region, a large capacitive reactance arc in the mid-frequency region, and a low-frequency inductive reactance arc. In numerous studies, the capacitive reactance arc in the high-frequency region corresponds to the oxide film layer formation of the alloy corrosion products, which is caused by the film layer resistance of the corrosion products. The capacitive reactance arc in the mid-frequency region corresponds to the corrosion process of the metal–solution interface reaction, reflecting the interface electric double-layer capacitance and charge-transfer resistance of the metal corrosion process. The inductive reactance arc indicates that local pitting corrosion occurs on the surface of the sample, resulting in anodic dissolution. From the local magnification of Figure 8b, it can be seen that the capacitive reactance arc of the TXZ311 alloy is larger. This indicates that the TXZ311 alloy has high corrosion product film resistance during metal corrosion and that the alloy has better corrosion resistance. Studies have shown that the larger the radius of the capacitive reactance arc, the greater the polarization resistance and the better the corrosion resistance. Based on the capacitive arc radius in Figure 8b, the corrosion resistance of the alloys, from high to low, is TXZ311 > T3 > TXK311 > TX31, which is consistent with the results of the hydrogen evolution test. Additionally, according to the value of the surface film resistance Rf in Table 4, it can be seen that the corrosion product layer formed by the TXZ311 alloy has the greatest protective effect on the alloy.

4. Discussion

The type and content of alloying elements in Mg alloys and the changes in microstructure caused by varying them can greatly affect the corrosion rate of Mg alloys. Studies have shown that the corrosion resistance of Mg alloys is the result of the grain size, second phase, microstructure uniformity, and defect density [31]. The mass-loss corrosion rate (PW), hydrogen-evolution corrosion rate (PH), and electrochemical corrosion rate (Pi) results of the four alloys are listed in Table 5. From the results, it can be concluded that the corrosion rates of the four alloys for both static and dynamic corrosion are, from slow to fast, TXZ311 < T3 < TXK311 < TX31. Table 6 lists the electrochemical corrosion potentials and corrosion current densities of the present experimental alloys and the previously studied magnesium alloys. It can be found that the corrosion resistance of the homogeneous alloys studied in this experiment is basically comparable to that of the extruded alloys in the literature [32].
Furthermore, in conjunction with the electrochemical data in Table 4, it can be found that the corrosion potential and corrosion current density of the T3 alloy change significantly with the addition of Ca. Adding 1% Ca increases the corrosion potential and corrosion current density of the alloy, indicating an increase in the alloy’s corrosion rate. The further addition of Zn and Zr elements, respectively, reduced the corrosion current density and improved the corrosion resistance of the alloy. In addition, as indicated by the difference in arc radius, the addition of alloying elements did not change the corrosion mechanism of Mg alloys, but changed the corrosion rate by changing the polarization resistance of the Mg alloys [33].
The corrosion mechanism of as-homogenized T3, TXZ311, and TXK311 alloys is shown in Figure 9. The dark gray color represents the 3.5% NaCl solution, the white color represents the matrix α-Mg, the black color represents grain boundaries, the gray color represents the second phase distributed at grain boundaries, the black dots represent ZnO, the far blue point represents SnO2, and the sun-shape pattern represents Mg(OH)2. The corrosion of the four Mg alloys in a sodium chloride solution is a complex process of galvanic coupling corrosion and chemical corrosion together. The specific mechanism is as follows:
The second phase distributed at grain boundaries and in the grains will form a corrosion couple with the α-Mg matrix, with α-Mg as the anode and the second phase as the cathode. When corrosion starts, due to the role of micro-coupling corrosion, the Mg matrix around the second phase as the anode is preferentially corroded and dissolved:
Mg ⟶ Mg²⁺ + 2e
The released electrons are transferred to the cathode through the metal interface, triggering the cathodic hydrogen precipitation reaction:
2H2O + 2e ⟶ H2 ↑ + 2OH
This process leads to the rapid consumption of the magnesium alloy as the anode, accompanied by violent hydrogen evolution and the formation of an oxide film of Mg(OH)2 and SnO. In addition, an oxide film of ZnO is formed on the surface of the TXZ311 alloy [34]. While galvanic corrosion occurs, the Mg alloy itself undergoes chemical corrosion in the NaCl solution. Cl, as an aggressive ion, attacks the loose Mg(OH)2 oxide film on the surface of the Mg alloy, exposing the fresh metal surface and triggering localized pitting corrosion:
Mg(OH)2 + 2Cl ⟶ MgCl2 + 2OH
Meanwhile, from the macroscopic corrosion patterns of the alloys in Figure 6 and the SEM images of the corrosion products removed after corrosion in Figure 7, it can be concluded that the microstructural corrosion of all the alloys showed electrochemical corrosion and pitting. Recent research has also shown that Mg alloys undergo both electrochemical galvanic corrosion and chemical corrosion in a Cl solution [35]. When the second phase and the matrix α-Mg are in contact with the medium simultaneously, a potential difference is generated between them, forming a primary cell, which leads to galvanic corrosion within the magnesium alloy. Wang et al. [36] also found that the potential of the second phase in Mg alloys is usually higher than that of the Mg matrix, which causes electrochemical corrosion leading to the anodic dissolution of the α-Mg matrix around the second phase.
In addition, it can be seen from Figure 6a and Figure 7a–c that the regions near the grain boundaries of T3 alloys are preferentially corroded. This is due to the fact that the Mg2Sn phase is mainly distributed continuously at the grain boundaries. When the Mg2Sn phase and the α-Mg matrix are in contact with the corrosive medium at the same time, the α-Mg matrix around Mg2Sn is preferentially corroded due to the formation of a galvanic coupling cell by the large potential difference between the two (see Figure 7a–c). Wang et al. [36] also reported that the Mg2Sn phase serves as a corrosion initiation point during the corrosion of Mg-Sn alloys, and they also found that the addition of a Sn alloy alloys changes in the surface film’s properties, resulting in the corrosion of the Mg-Sn alloy.
Unlike the T3 alloy, the second phase of the TX31 alloy is mainly a fine-needle and granular CaMgSn phase, and the area fraction of the second phase is increased, which increases the initiation point of pitting and accelerates the corrosion of the alloy. Compared to the TX31 alloy, the addition of Zn and Zr elements leaves the second phase of the alloy unchanged, and the area fraction of the second phase increases, but the corrosion resistance of both alloys increases. This is due to the fact that the addition of both Zn and Zr elements significantly refines the grain size of the TX31 alloy. The grain refinement of the alloys promotes a more homogeneous tissue distribution and enhances the stability of the surface film. Recent studies have also shown that the main reason for the improved corrosion resistance of magnesium alloys after grain refinement is the inhibition of cathodic H2 precipitation, which suppresses corrosion during anodic processes. The reason for the higher corrosion resistance of TXZ311 alloys than TXK311 and T3 alloys is that the solid solution of Zn (with an atomic radius similar to that of Mg) reduces the electrochemical activity of the substrate, shifts the self-corrosion potential (Ecorr) positively by about 0.1 V, and slows down the anodic dissolution rate. Furthermore, during the corrosion of TXZ311 alloys, the addition of Zn elements promotes the generation of a denser Mg(OH)2-ZnO composite film, which leads to a substantial increase in the charge-transfer resistance (Rct) and significantly inhibits the penetration of Cl. This dense passive film effectively prevents the penetration of corrosive media and hinders the intrusion of Cl, thus reducing the corrosion rate. The addition of Zr did not significantly change the composition or compactness of the oxide film, which could not provide additional protection. The solubility of Zr in the magnesium matrix is low, and it is easy to form fine Zr particles or a Zr-rich phase. These second phases may form a micro-galvanic couple (cathode–anode reaction) with the magnesium matrix, which will accelerate local corrosion.

5. Conclusions

The effects of the 1% Ca additions, 1% Ca and 1% Zn composite additions, and 1% Ca and 1% Zr composite additions on the microstructure and corrosion properties of Mg-3Sn-based alloys were investigated.
  • In the as-homogenized Mg-3Sn alloy, the addition of Ca inhibits the precipitation of Mg2Sn and the formation of the intermetallic compound CaMgSn. The Zn and Zr elements can refine the grain size and the average size of the CaMgSn phase in TXZ311 alloys and increase the area fraction of the second phase.
  • The corrosion of the T3 alloy is mainly electrochemical galvanic corrosion. The addition of Ca changes the type of the second phase (from Mg2Sn to CaMgSn) but does not alter the fundamental corrosion mechanism. The Zn and Zr elements change the corrosion rate of the Mg alloys by altering the polarization resistance of the alloys, while the corrosion mechanism does not change.
  • The hydrogen evolution test, electrochemical test, and corrosion morphology show that the as-homogenized TXZ311 alloy has the best corrosion resistance. The addition of the Zn element can refine the alloy, improve the corrosion resistance of the alloy, and form a dense passivation film on the surface during the corrosion process of the alloy, reducing the corrosion rate.

Author Contributions

Conceptualization, Z.J. and X.N.; methodology, Y.Y.; software, Z.M., S.D. and Q.C.; formal analysis, X.N.; investigation, Y.Y.; resources, Z.M.; writing—original draft preparation, Y.Y.; visualization, S.D.; supervision, S.D.; project administration, Z.J.; funding acquisition, X.N. All authors have read and agreed to the published version of the manuscript.

Funding

The authors acknowledge the Key project of Education of the Education Department of Liaoning Province [LJKZ1171], the National College Students’ Entrepreneurship Project [202311035033], the financial support from the Liaoning Province Natural Science Foundation Project of China [2023-MS-321], and the Liaoning Province International Cooperation Project (Project Number: 2023030491-JH2/107).

Data Availability Statement

The original contributions presented in this study are included in the article material. Further inquiries can be directed to the corresponding authors.

Conflicts of Interest

We declare that we have no conflicts of interest.

References

  1. Song, J.; She, J.; Chen, D.; Pan, F. Latest research advances on magnesium and magnesium alloys worldwide. J. Magnes. Alloys 2020, 8, 1–41. [Google Scholar] [CrossRef]
  2. Cole, G.S. Summary of “Magnesium vision 2020: A North American automotive strategic vision for magnesium”. In Essential Readings in Magnesium Technology; Springer: Cham, Switzerland, 2016; pp. 35–40. [Google Scholar]
  3. Ramalingam, V.V.; Ramasamy, P.; Kovukkal, M.D.; Myilsamy, G. Research and development in magnesium alloys for industrial and biomedical applications: A review. Met. Mater. Int. 2020, 26, 409–430. [Google Scholar] [CrossRef]
  4. Kubásek, J.; Minárik, P.; Hosová, K.; Šašek, S.; Knapek, M.; Veselý, J.; Stráská, J.; Dvorský, D.; Čavojský, M.; Vojtěch, D. Novel magnesium alloy containing Y, Gd and Ca with enhanced ignition temperature and mechanical properties for aviation applications. J. Alloys Compd. 2021, 877, 160089. [Google Scholar] [CrossRef]
  5. Khoubrou, I.; Nami, B.; Miresmaeili, S.M.; Yazdani, M. Evolution of Microstructure, Texture and Mechanical Properties of ECAP-Processed ZK60 Magnesium Alloy. Met. Mater. Int. 2024, 31, 227–236. [Google Scholar] [CrossRef]
  6. Zhuo, X.; Shao, C.; Zhang, P.; Zhichao, H.; Huan, L. Effect of Hot Rolling on the Microstructure and Mechanical Performance of a Mg-5Sn Alloy. Materials 2022, 15, 5973. [Google Scholar] [CrossRef]
  7. Jia, Z.; Yu, B.; Fu, L. Effect of Zn and Cu Addition on Mechanical Properties of As-Extruded Mg-3Sn-1Ca Alloy. Materials 2022, 15, 4438. [Google Scholar] [CrossRef]
  8. Zeng, Y.; Shi, O.L.; Jiang, B.; Quan, G.F.; Pan, S. Improved formability with theoretical critical shear strength transforming in Mg alloys with Sn addition. J. Alloys Compd. 2018, 764, 555–564. [Google Scholar] [CrossRef]
  9. Zengin, H.; Turen, Y.; Ahlatci, H.; Yavuz, S.; Abdullah, C. Influence of Sn addition on microstructure and corrosion resistance of AS21 magnesium alloy. Trans. Nonferr. Met. Soc. China 2019, 29, 1413–1423. [Google Scholar] [CrossRef]
  10. Zeng, R.; Zhang, J.; Huang, W.; Dietzel, W.; Kainer, K.U.; Blawert, C.; Wei, K. Review of studies on corrosion of magnesium alloys. Trans. Nonferr. Met. Soc. China 2006, 16, s763–s771. [Google Scholar] [CrossRef]
  11. Ha, H.Y.; Kang, J.Y.; Kim, S.G.; Kim, B.; Park, S.S.; Yim, C.D.; You, B.S. Influences of metallurgical factors on the corrosion behaviour of extruded binary Mg-Sn alloys. Corros. Sci. 2014, 82, 369–379. [Google Scholar] [CrossRef]
  12. Liu, X.; Shan, D.; Song, Y.; Chen, R.; Han, E. Influences of the quantity of Mg2Sn phase on the corrosion behavior of Mg-7Sn magnesium alloy. Electrochim. Acta 2011, 56, 2582–2590. [Google Scholar] [CrossRef]
  13. Zeng, R.; Cui, L.; Ke, W. Biomedical magnesium alloys: Composition, microstructure and corrosion. Acta Met. Sin. 2018, 54, 1215–1235. [Google Scholar]
  14. Kamde, M.A.; Mahton, Y.; Singh, Y.; Sahoo, S.K.; Ganguly, S.; Prakash, N.S.; Roy, M.; Mishra, V.; Sarkar, S.; Saha, P. Correlation of Microstructure and Corrosion Behavior of squeeze-cast Mg-4.0-4.0Zn-0.5Zr-0.2Ca (wt%) Alloys Constituting W and LPSO Secondary Phases. Met. Mater. Int. 2024, 30, 3379–3401. [Google Scholar] [CrossRef]
  15. Kozlov, A.; Ohno, M.; Leil, T.A. Phase equilibria, thermodynamics and solidification microstructures of Mg-Sn-Ca alloys, Part 2: Prediction of phase formation in Mg-rich Mg-Sn-Ca cast alloys. Intermetallics 2008, 16, 316–321. [Google Scholar] [CrossRef]
  16. Suresh, K.; Rao, K.P.; Prasad, Y.; Hort, N.; Kainer, K.U. Microstructure and mechanical properties of as-cast Mg-Sn-Ca alloys and effect of alloying elements. Trans. Nonferr. Met. Soc. China 2013, 23, 3604–3610. [Google Scholar] [CrossRef]
  17. Wang, C.; Liu, Z.; Xiao, S.; Chen, Y. Effects of Sn, Ca additions on thermal conductivity of Mg matrix alloys. Mater. Sci. Technol. 2016, 32, 581–587. [Google Scholar] [CrossRef]
  18. Erdmann, N.; Angrisani, N.; Reifenrath, J.; Lucas, A.; Thorey, F.; Bormann, D.; Meyer-Lindenberg, A. Biomechanical testing and degradation analysis of MgCa0.8 alloy screws: A comparative in vivo study in rabbits. Acta Biomater. 2011, 7, 1421–1428. [Google Scholar] [CrossRef]
  19. Yang, J.; Peng, J.; Nyberg, E.A.; Pan, F. Effect of Ca addition on the corrosion behavior of Mg-Al-Mn alloy. Appl. Surf. Sci. 2016, 369, 92–100. [Google Scholar] [CrossRef]
  20. Du, W.; Liu, K.; Ma, K.; Zhao, H.W.; Li, S.B. Effects of trace Ca/Sn addition on corrosion behaviors of biodegradable Mg-4Zn-0.2 Mn alloy. J. Magnes. Alloys 2018, 6, 1–14. [Google Scholar] [CrossRef]
  21. Zhang, C.; Wu, L.; Huang, G.; Liu, K.; Jiang, B.; Wang, G.G.; Xia, D.; Atrens, A.; Pan, F. Influence of microalloying with Ca and Ce on the corrosion behavior of extruded Mg-3Al-1Zn. J. Electrochem. Soc. 2019, 166, C445. [Google Scholar] [CrossRef]
  22. Liu, Q.; Cheng, W.; Zhang, H.; Xu, C.; Zhang, J. The role of Ca on the microstructure and corrosion behavior of Mg-8Sn-1Al-1Zn-Ca alloys. J. Alloys Compd. 2014, 590, 162–167. [Google Scholar] [CrossRef]
  23. Gong, C.; He, X.; Yan, X. Corrosion behavior of Mg-Ca-Zn alloys with high Zn content. J. Phys. Chem. Solids 2021, 152, 109952. [Google Scholar] [CrossRef]
  24. Ercetin, A.; Özgün, Ö.; Aslantas, K.; Aykutoğlu, G. The microstructure, degradation behavior and cytotoxicity effect of Mg-Sn-Zn alloys in vitro tests. SN Appl. Sci. 2020, 2, 173. [Google Scholar] [CrossRef]
  25. Yang, J.; Yim, C.D.; You, B.S. Effects of solute Zn on corrosion film of Mg-Sn-Zn alloy formed in NaCl solution. J. Electrochem. Soc. 2016, 163, C839. [Google Scholar] [CrossRef]
  26. Han, H.Y.; Kang, J.Y.; Yim, C.D.; Lee, Y.L. Role of hydrogen evolution rate in determining the corrosion rate of extruded Mg-5Sn-(1-4 wt%) Zn alloys. Corros. Sci. 2014, 89, 275–285. [Google Scholar]
  27. Wang, Y.; Jia, S.; Wei, M.; Liming, P.; Yujuan, W.; Xintian, L. Research progress on solidification structure of alloys by synchrotron X-ray radiography: A review. J. Magnes. Alloys 2020, 8, 396–413. [Google Scholar] [CrossRef]
  28. Ren, J.; Guo, E.; Wang, X.; Kang, H.; Chen, Z.; Wang, T. Influence of Alloyed Ga on the Microstructure and Corrosion Properties of As-Cast Mg-5Sn Alloys. Materials 2019, 12, 3686. [Google Scholar] [CrossRef]
  29. Liu, Y. Research progress in effect of alloying on electrochemical corrosion rates of Mg alloys. Rare Met. Mater. Eng. 2021, 50, 361–372. [Google Scholar]
  30. Chang, J.W.; Fu, P.H.; Guo, X.W.; Suhong, Z.; Chunquan, C.; Wenjiang, D. The effects of heat treatment and zirconium on the corrosion behaviour of Mg-3Nd-0.2 Zn-0.4 Zr (wt.%) alloy. Corros. Sci. 2007, 49, 2612–2627. [Google Scholar] [CrossRef]
  31. Hu, T.; Xiao, W.; Wang, F.; Li, Y.; Lyu, S.; Zheng, R.; Ma, C. Improving Tensile Properties of Mg-Sn-Zn Magnesium Alloy Sheets Using Pretension and Ageing Treatment. J. Alloys Compd. 2018, 735, 1494–1504. [Google Scholar] [CrossRef]
  32. Zhao, C.; Pan, F.; Pan, H. Microstructure, mechanical and bio-corrosion properties of as-extruded Mg-Sn-Ca alloys. Trans. Nonferr. Met. Soc. China 2016, 26, 1574–1582. [Google Scholar] [CrossRef]
  33. Zhang, T.; Zou, J.; Huang, Z. Effect of rolling temperature on corrosion resistance of AZ61 magnesium alloy. Nonferr. Met. Sci. Eng. 2023, 14, 473–480. [Google Scholar]
  34. Zheng, J.; Bing, Y.; Li, F.; Qizhi, L. The effect of Zn on the corrosion resistance of extruded Mg-3Sn-1Ca alloy. Surf. Technol. 2023, 52, 233–242. [Google Scholar]
  35. Deng, B.; Li, Q.; Wu, Y.; Chao, L.; Wei, L.; Zhicheng, N.; Anmin, L. The influence of the second phase on the corrosion behavior of Mg Zn Zr alloy. Mater. Prot. 2021, 54, 48–53. [Google Scholar]
  36. Wang, C.; Guo, S.; Zeng, L. Effects of second phases on microstructure, microhardness, and corrosion behavior of Mg-3Sn—(1Ca) alloys. Materials 2019, 12, 2515. [Google Scholar] [CrossRef]
Figure 1. Metallographic sampling location.
Crystals 15 00537 g001
Figure 2. Microstructure of the as-homogenized alloys: (a) T3, (b) TX31, (c) TXZ311, and (d) TXK311.
Crystals 15 00537 g002
Figure 3. XRD patterns of as-homogenized T3, TX31, TXZ311, and TXK311 alloys.
Crystals 15 00537 g003
Figure 4. SEM micrographs of the as-homogenized alloys and corresponding EDS elemental mapping results: (a,b) T3, (c,d) TX31, (e,f) TXZ311, and (g,h) TXK311.
Crystals 15 00537 g004
Figure 5. (a) Hydrogen evolution amount; (b) hydrogen−evolution corrosion rate.
Crystals 15 00537 g005
Figure 6. Macro-morphology of corroded surface of alloy after 24 h immersion. (a) T3, (b) TX31, (c) TXZ311, and (d) TXK311.
Crystals 15 00537 g006
Figure 7. SEM images of as-homogenized alloys after 24 h of corrosion to remove surface corrosion products. (ac) T3, (df) TX31, (gi) TXZ311, and (jl) TXK311.
Crystals 15 00537 g007
Figure 8. (a) Polarization curves, (b) electrochemical impedance spectroscopy (EIS), and (c) equivalent circuits of four as−homogenized alloys.
Crystals 15 00537 g008
Figure 9. Schematic diagram of corrosion mechanism. (Modified).
Crystals 15 00537 g009
Table 1. Actual chemical composition of as-homogenized alloy.
Alloy Measured Composition (wt.%)
MgSnCaZnZr
Mg-3Sn(T3)Bal.2.97000
Mg-3Sn-1Ca(TX31)Bal.3.141.0200
Mg-3Sn-1Ca-1Zn(TXZ311)Bal.3.141.021.090
Mg-3Sn-1Ca-1Zr(TXK311)Bal.3.081.0300.6
Table 2. The area fraction and size distribution of the second phase.
AlloyGrain Size (μm)Second-Phase Size Distribution (μm)Area Fraction of Second Phase (%)
Mg2SnCaMgSn
T3406.5 ± 6.61.5~11.5-2.4 ± 0.6
TX31698.7 ± 7.2-1.6~31.27.4 ± 1.5
TXZ311364.8 ± 5.1-1.4~35.17.9 ± 2.1
TXK311260.4 ± 3.4-0.8~22.713.1 ± 2.2
Table 3. EDS results for as-homogenized T3, TX31, TXZ311, and TXK311 alloys.
PointChemical Composition (at.%)Phase Types
MgSnCaZnZr
A79.5420.46000Mg2Sn
B75.7424.26000Mg2Sn
C66.5017.8914.5800CaMgSn
D57.1919.8222.9800CaMgSn
E87.077.034.651.260CaMgSn
F83.518.347.200.940CaMgSn
G75.5512.9911.2600.19CaMgSn
H72.9015.3511.3300.04CaMgSn
Table 4. Polarization curves and impedance fitting results of as-homogenized alloys.
AlloyEcorr/VIcorr/A·cm−2RsCPEtRctCPEfRfRlL
Ω·cm2Y1n1Ω·cm2Y2n2Ω·cm2Ω·cm2H·cm−2
T3−1.435.78 × 10−51.374.7 × 10−40.717.948.9 × 10−50.93126.648.84337.7
TX31−1.526.69 × 10−50.762.8 × 10−60.858.018.3 × 10−50.90212.136.191117
TXZ311−1.563.81 × 10−50.944.88 × 10−70.9211.893.9 × 10−50.92291.293.651322
TXK311−1.494.67 × 10−50.392.72 × 10−60.908.737.1 × 10−50.9222168.44354.6
Table 5. Average corrosion rate of as-homogenized T3, TX31, TXZ311, and TXK311 alloys.
AlloyT3TX31TXZ311TXK311
Corrosion rate (PW/mm·y−1)5.347.553.946.42
Corrosion rate (PH/mm·y−1)3.946.142.824.96
Corrosion rate (Pi/mm·y−1)1.311.520.871.07
Table 6. Corrosion potential and corrosion current density compared to other alloys.
AlloyEcorr/VIcorr/A·cm−2StatusReference
T3−1.435.78 × 10−5as-homogenizedThis work
TX31−1.526.69 × 10−5as-homogenizedThis work
TXZ311−1.563.81 × 10−5as-homogenizedThis work
TXK311−1.494.67 × 10−5as-homogenizedThis work
Mg-2Al-0.2Si-0.5Sn−1.586.73 × 10−5cast[9]
Mg-7Sn−1.582.88 × 10−5cast[12]
Mg-5Al-0.4Mn-1Ca−1.584.65 × 10−5cast[19]
Mg-1Sn-0.5Ca−1.475.95 × 10−6as-extruded[32]
Mg-2Sn-0.5Ca−1.456.73 × 10−6as-extruded[32]
Disclaimer/Publisher’s Note: The statements, opinions and data contained in all publications are solely those of the individual author(s) and contributor(s) and not of MDPI and/or the editor(s). MDPI and/or the editor(s) disclaim responsibility for any injury to people or property resulting from any ideas, methods, instructions or products referred to in the content.

