Article

The Missing Structures of Pasteur’s Aspartates

Structural Biochemistry, Faculty of Science, Utrecht University, Universiteitsweg 99, 3584 CG Utrecht, The Netherlands
*
Author to whom correspondence should be addressed.
Crystals 2025, 15(6), 521; https://doi.org/10.3390/cryst15060521
Submission received: 9 May 2025 / Revised: 23 May 2025 / Accepted: 25 May 2025 / Published: 29 May 2025
(This article belongs to the Section Organic Crystalline Materials)

Abstract

:
In his crystallographic research on chiral separation, Louis Pasteur reported the crystals of the sodium salts of enantiopure and racemic aspartic acid. Their atomic structure remained unknown to this day. In the present article, the two crystal structures are reported. The X-ray diffraction of both crystals was severely affected by twinning. Their crystal packing is very similar and can be described as a three-dimensional coordination network. A decomposition of the structures into layers helps to explain the twinning as stacking faults. In the enantiopure crystal, the layers are parallel to ( 0 , 1 , 0 ) and in the racemic crystal parallel to ( 0 , 0 , 1 ) . The sum formula of the two crystal structures is identical, representing the monohydrate of the monosodium aspartate.

1. Introduction

Perhaps unknown to the general public but well known to the experts in the field is the fact that Louis Pasteur (1822–1895) started his scientific career as a crystallographer [1,2]. His most prominent finding in this field was the spontaneous resolution of the racemate of tartaric acid in 1848. This magnificent experiment inspires crystallographers and structural scientists to this day [3].
For the chiral resolution, Pasteur used the sodium ammonium double salt of tartaric acid (Scheme 1). The presence of non-superimposable hemihedral faces allowed him to distinguish two kinds of crystal forms under the microscope. Bringing these two kinds of crystals into solution gave a rotation of polarized light to the left for one solution and to the right for the other solution. Pasteur thus concluded that there is a relationship between the crystal form and the rotation direction of polarized light. Going even further, he related the rotation direction to the internal structure of the crystal. For this, he used concepts of René-Just Haüy, who had proposed that crystals are composed of smaller units which he called molécules intégrantes [4]. Pasteur’s correlation between optical rotation and molecular chirality is a major achievement in the history of science [5], especially if we consider that at the time no clear picture of the terms “atoms” and “molecules” was established.
After the great success with the tartrates, Pasteur extended his studies to other natural products such as malic acid and aspartic acid. For aspartic acid, he found an active and an inactive form. He erroneously believed here that the inactive form is not a racemate. While the molecules in the active form would be twisted like a stairway, the molecules in the inactive form would be untwisted. The stairway of the inactive form would then consist of the same stairs but straight instead of spiral [6]. A main argument for Pasteur’s rejection of the racemate was the absence of spontaneous resolution. With modern knowledge that is mainly based on X-ray crystal structure determinations, we are now aware that racemates do exist. In fact, racemic crystal structures are very common, while spontaneous resolution is a rare event [7,8]. The racemic form of aspartic acid is known in the Cambridge Structural Database [9] under the refcode family beginning with DLASPA.
In analogy to the salts of tartaric acid, Pasteur also synthesized the sodium salts of the active and inactive form of aspartic acid (Scheme 2). A drawing of the external shapes of the crystals is shown in Figure 1. According to Pasteur, the chemical composition of the two forms is identical and the reactions are the same, but the crystal forms are incompatible [10]. Pasteur does not report the exact chemical composition and formula. He found that both sodium salts are very soluble in water. The inactive sodium salt is slightly less soluble than the active form. The crystals of the active form are always striated (“Les faces des pans étant toujours striées et donnant lieu à des doubles images, je n’ai pas confiance dans les mesures que j’ai prises des angles du prisme” [10]) and the crystals of the inactive form are often characterized by re-entrant angles. From these descriptions by Pasteur, Flack concluded the presence of severe twinning in the latter system [1].
In 1890, G. Grattarola in Florence performed a detailed analysis of the crystal morphology of sodium aspartate. A summary of his studies can be found in Zeitschrift für Kristallographie (1892) [11]. As sum formula, he gives the monohydrate of the disodium salt of aspartic acid. The racemic compound is monosymmetric (i.e., monoclinic) and frequently twinned. The enantiopure crystals somewhat resemble the racemic variant but the enantiopure crystals were not suitable for exact measurements. Grattarola’s description of the racemic crystal is referenced in Groth’s Chemische Krystallographie [12].
Since the time of Pasteur, a number of alkaline and alkaline earth complexes of aspartic acid have been synthesized and their crystal structures determined, especially by the group of Schmidbaur and co-workers [13]. A full overview is given by Fleck and Petrosyan [14]. Interestingly, the sodium salts of the enantiopure and the racemic aspartic acid are missing in this list. We can only speculate about the reasons for these omissions. Perhaps it is due to the difficulty of crystallization, which has been described by Schmidbaur for the other salts. It can also be the consequence of twinning and the difficulties in the crystal structure determination. The twinning can be concluded from Pasteur’s descriptions.
With the software improvements for twin handling [15,16] and the progress in X-ray diffraction equipment in mind, we set out to determine the X-ray crystal structures of the sodium salts of enantiopure aspartic acid (compound 1) and racemic aspartic acid (compound 2). This way, we intend to fill a gap which was left in the series of Pasteur’s crystals.
From a chemical point of view, sodium ions play an important role in many research fields. As examples, sodium is central in silicate chemistry and many modern materials. It is abundant in the fluids of living organisms, and sodium salts are frequently used in the pharmaceutical and food industries. Still, chemists are unable to predict the sodium coordination number and coordination geometry ab initio [17,18]. In many cases, the experimental X-ray crystal structure is taken as a starting point for further experiments and modeling [19]. For this reason, we will discuss the sodium environments in some detail.

2. Materials and Methods

2.1. Synthesis and Crystallization

For the synthesis of 1, 1.335 g (10.0 mmol) L-aspartic acid (Sigma-Aldrich, St. Louis, MO, USA) was suspended in 20 mL water. Under medium stirring, the suspension was titrated with 1 M NaOH solution until pH 7.19 was reached. After 10 days of standing at room temperature, a very viscous fluid was obtained but no crystals. Therefore the sample was heated to 60 °C until a crystal skin formed. Two drops of water were added and after 1 day of standing at room temperature, severely intergrown crystals were obtained (see Figure S1 in the Supplementary Materials).
For the synthesis of 2, 1.331 g (10.0 mmol) DL-aspartic acid (Sigma-Aldrich) was suspended in 20 mL water. Under medium stirring, the suspension was titrated with 1 M NaOH solution until pH 7.20 was reached. After standing for 3 days at room temperature, this sample also gave a highly viscous fluid. Part of the fluid was stored at 5 °C for 2 weeks resulting in severely intergrown crystals (see Figure S2 in the Supplementary Materials).

2.2. X-Ray Crystal Structure Determinations

Using ϕ - and ω -scans, X-ray intensities of 1 and 2 were measured on a Bruker Kappa ApexII diffractometer with sealed tube and Triumph monochromator. A rotation increment of 0.3° for each frame was used. For compound 1, 529 frames were measured with a detector distance of 41 mm and 7190 frames with a distance of 60 mm. For compound 2, 6111 frames were measured with a detector distance of 60 mm. The Dirax software, version 1.17 [20] was used for indexing the reflections and for finding the twin laws. (The reader may be confused by the similarity of the unit cell parameters of 1 with those of orthorhombic L-glutamine. No glutamine was used during the synthesis). The intensity integration was performed with Eval15 [21]. Profile prediction in 1 involved an isotropic mosaicity of 1.0° and an anisotropic mosaicity [22] of 1.0° about h k l = ( 1 , 0 , 0 ) . Profile prediction in 2 involved an isotropic mosaicity of 1.0°. Absorption correction, scaling, outlier rejection, and merging were performed with TWINABS [16]. The structures were solved with SHELXT [23] and refined with SHELXL-2019 [24] against F 2 of all reflections. All hydrogen atoms were located in difference Fourier maps. C–H hydrogen atoms were refined with a riding model. In 1, N–H hydrogen atoms were refined with the AFIX 137 constraint and O–H hydrogen atoms with distance and angle restraints (DFIX). In 2, N–H and O–H hydrogen atoms were refined freely with isotropic displacement parameters. Geometry calculations and checking for higher symmetry were performed with the PLATON software, version 111124 [25]. Further experimental details are given in Table 1.

2.3. Twinning in Compound 1

Monoclinic crystals crystallizing as pseudo-orthorhombic twins are often characterized by a β -angle close to 90° and completely overlapping reflections of both twin lattices. In such a case, the twin law is a twofold rotation about the a-axis or the c-axis and can be arbitrarily chosen between these two possibilities. In the case of compound 1, β is 90.734(3)° and the reflections are visibly split. An example of a significantly split reflection is shown in Figure 2. Still, the majority of reflections are fully or partially overlapping. Therefore, the intensity determination is difficult, but reliable results were obtained with the Eval15 software, version 1.2 [21] using profile prediction. From the non-overlapping reflections, the twin law could unambiguously be determined as twofold rotation about the a-axis. The correct assignment of the twin law can be seen in the two-dimensional reconstruction of the h 0 plane (Figure 3). The final unit cell parameters were obtained from post-refinement of 4582 non-overlapping reflections of the first twin component, resulting in a β -angle of 90.734(3)°. The input file for TWINABS [16] consisted of the non-overlapping reflections of the first twin component plus the overlapping reflections of the two components. After merging, the reflection file contains 3228 overlapping and 626 non-overlapping reflections (including systematic absences). The final structure refinement in SHELXL resulted in a twin fraction B A S F = 0.4934 ( 14 ) .

2.4. Twinning in Compound 2

For compound 2, the β -angle deviates strongly from 90°. This makes indexing easier than in 1. A two-dimensional reconstruction of the h 0 plane for 2 is shown in Figure S9 in the Supplementary Materials. After integration with Eval15 [21], the reflection file for TWINABS [16] contains the non-overlapping reflections of both components plus the overlapping reflection. The merged file for the structure refinement contained 1393 non-overlapping reflections of the first twin component and 704 overlapping reflections (including systematic absences). The twin fraction refined to B A S F = 0.5175 ( 12 ) .

2.5. Absolute Structure of Compound 1

The absolute structure of 1 was determined in two different ways. The Parsons z parameter [26] was directly obtained by a post-refinement analysis in SHELXL [24] based on a reflection file with twinned data. It resulted in a value z = 0.01 ( 7 ) ; see Table 1. For the determination of the Hooft y parameter [27], the reflection file was de-twinned with SHELXL based on the final atomic model (instruction LIST 8) and then underwent a single-crystal refinement. Based on the single-crystal result files, the PLATON software [25] determined a value y = 0.01 ( 6 ) . Parsons z and Hooft y are thus very consistent and confirm the absolute structure, which was already known from the enantiopure L-aspartic acid used in the synthesis.

3. Results and Discussion

The two compounds 1 and 2 both have the sum formula [C4H6NO4]Na(H2O). The asymmetric units of their crystal structures are given in Figure 4 with two formula units for 1 and in Figure 5 with one formula unit for 2. This finding is a proof that Pasteur’s claim is correct, which stated that the active and the inactive forms have identical compositions; see Section 1. In the aspartic acid moiety, both carboxylic acid groups are deprotonated and the amino group is protonated, leading to a total charge of 1 . Overall, this results in a three-dimensional coordination network involving the sodium cations, the aspartate mono-anions, and the coordinated hydrate water molecules. The coordination networks in 1 and 2 are further supported by three-dimensional networks of N–H⋯O and O–H⋯O hydrogen bonds (Tables S3 and S6 in the Supplementary Materials). The shortest Na⋯Na distances are 4.4182(11) Å in 1 and 4.1355(9) Å in 2.
The X-ray density of 1.7489(3) g / cm 3 in 1 is slightly higher than the 1.7172(1) g / cm 3 in 2 (Table 1). Both values are higher than the 1.582 and 1.609 g / cm 3 for the corresponding enantiopure lithium and potassium salts from the literature [28]. The densest packing in 1 can also be seen in the Kitajgorodskij packing index [29] of 85.0%, compared to 83.2% (compound 2), 76.7% (Li salt), and 82.9% (K salt).

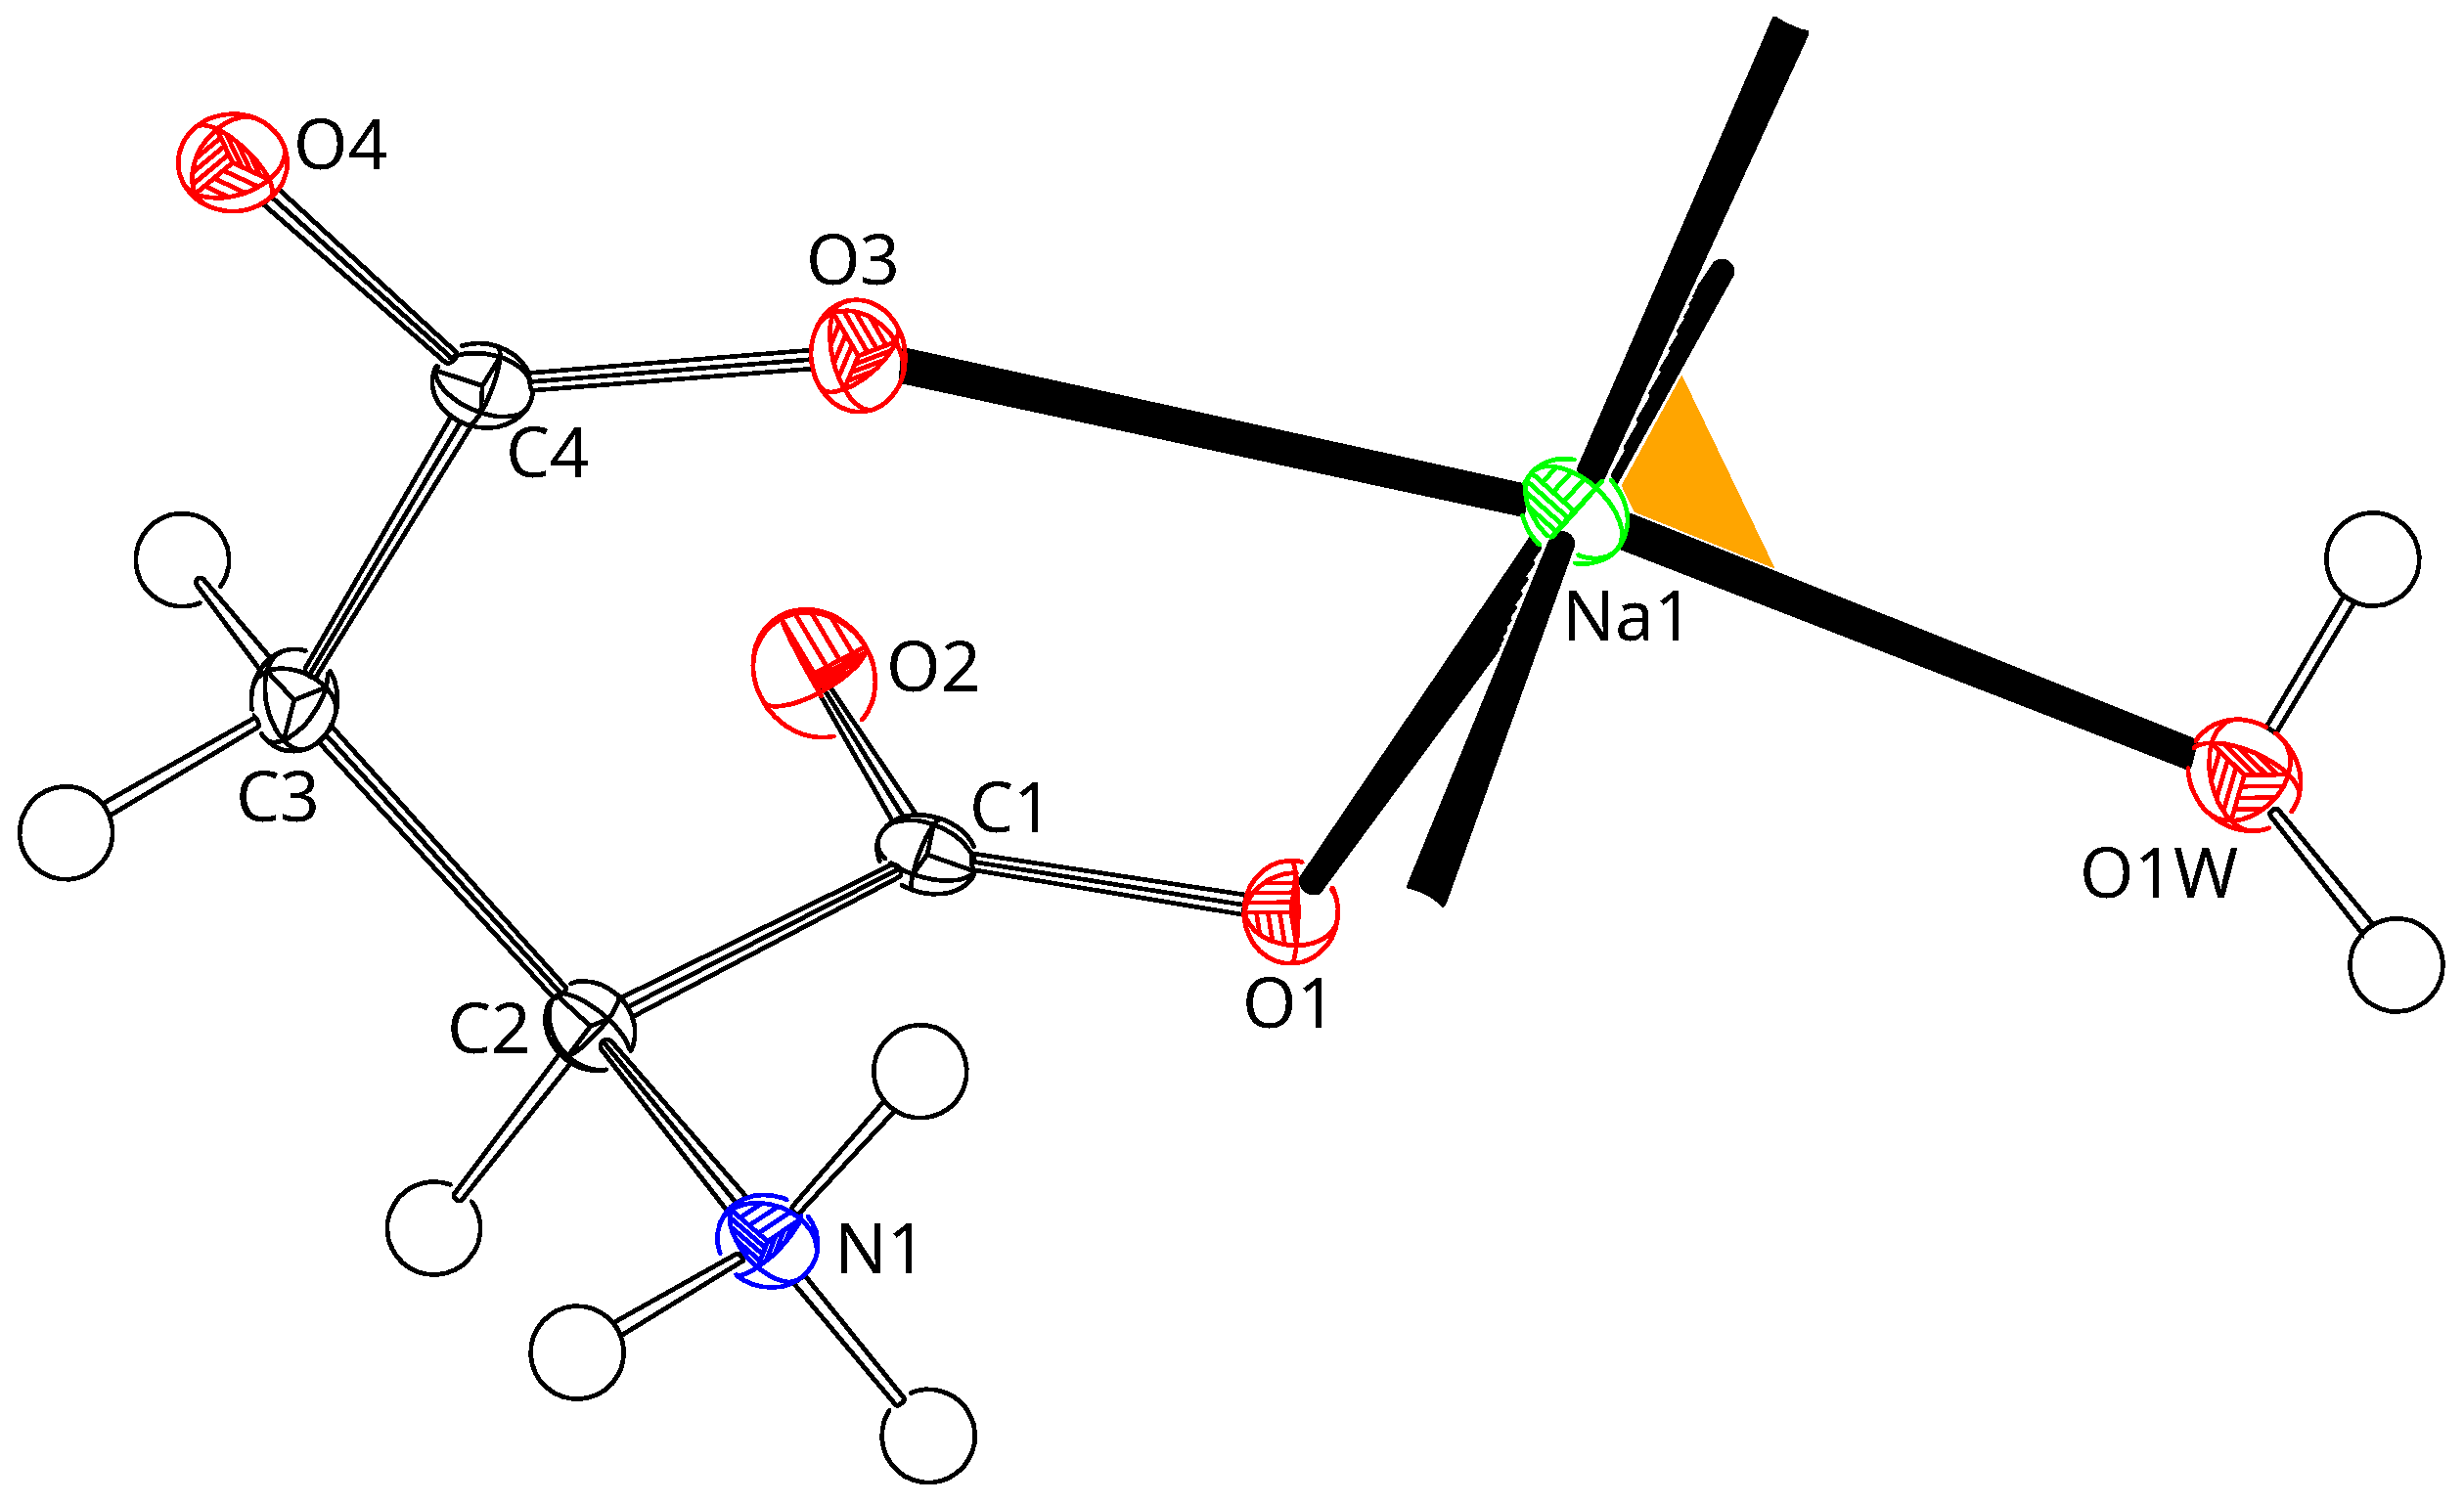
3.1. Sodium Coordination

In compounds 1 and 2, the sodium atoms are hexacoordinated by oxygen atoms (Tables S2 and S5 in the Supplementary Materials). Four oxygens are from carboxylate groups and two from coordinated water molecules. This results in a distorted octahedral geometry with the water molecules in the cis position. Because the water molecules are bridging two sodium centers (Tables S1 and S4 in the Supplementary Materials), the connected octahedra share two vertices in 1 and one edge in 2. Overall, this leads to double strands of octahedra in the direction of the a-axis (see Figures S3 and S4 in the Supplementary Materials).
In transition metal complexes, the reason for octahedral distortion is often found in electronic properties such as the Jahn–Teller effect. Also, geometric strain can lead to distortion as, for example, with strained chelating ligands. Additionally, in the solid state there can be packing effects leading to distorted geometries. For the sodium cation with a s 2 s 2 p 6 configuration, electronic effects can be excluded, and the ion can be considered as a point charge. In the literature, several approaches are described for the quantification of the octahedral distortion. Here, we apply the quadratic elongation λ o c t [30], the angular variance σ θ ( o c t ) 2 [30], and the continuous symmetry measure CSM [31]. These results are summarized in Table 2.
In the measure of quadratic elongation, the six Na–O distances are compared with the distances of an ideal octahedron with identical polyhedral volume. A value λ o c t = 1.0 would correspond to a perfect octahedron with O h symmetry. In 1 and 2, we find λ o c t between 1.044 and 1.053. The distances between Na and the carboxylate oxygen atoms have a rather narrow range of 2.3198(17)–2.4390(8) Å. Interestingly, the distances of the Na to the water oxygen atoms are much more flexible with values between 2.4681(9) and 2.7220(19) Å. The Na–O distance of 2.7220(19) Å certainly indicates a weak coordination but is not without precedents in the literature.
The angular variance considers the difference of coordination angles with the 90° angles of the ideal octahedron. In 1 and 2, the cis angles vary significantly between 67.19(3) and 105.96(6)°. Consequently, the angular variance is quite large. Surprisingly, it is not the chelating aspartate ligand (Figure 4 and Figure 5) that leads to the largest distortion, but the largest deviation involves the coordinated hydrate water molecules. This can again be interpreted as the weak and flexible coordination mode for the water.
The CSM analyzes the distance between the vectors of the current polyhedron with the vectors of a given ideal polyhedron. For the three structures of the current study (Table 2), the closest ideal polyhedron is the octahedron. Nevertheless, the CSM values of 2.381–2.620 are high compared to the octahedral transition metal complexes in [31]. This indicates a large distortion.
Each of the four carboxylate oxygen atoms has exactly one bond to a sodium center. The distribution of C–O–Na angles is bimodal with 116.73(12)–122.21(12)° for O1 and O4, and 145.75(14)–159.93(7)° for O2 and O3. It can be noted that O1 and O4 are acceptors of stronger hydrogen bonds than O2 and O3. The C–C–O–Na torsion is in gauche conformation for O1 and O4, in trans conformation for O2, and in cis conformation for O3 (Scheme 3).

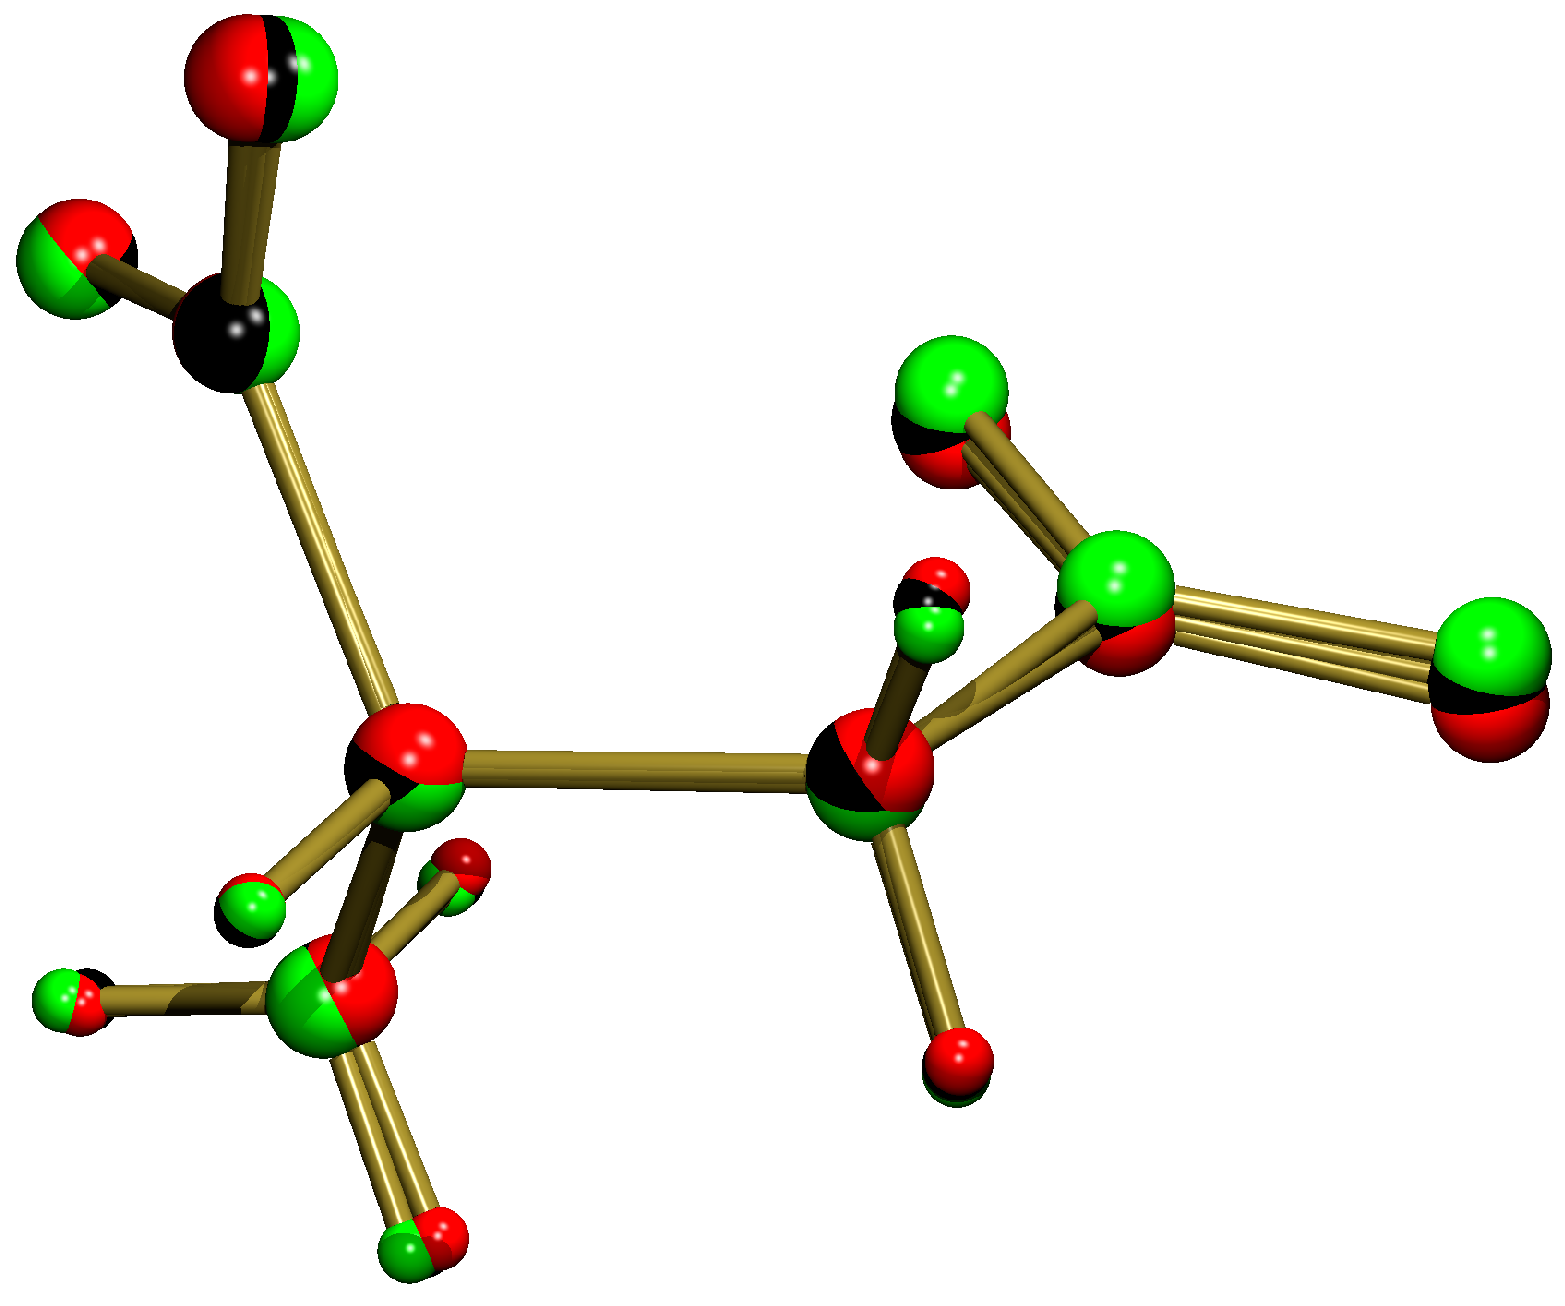
3.2. Amino Acid Conformations

The conformations of the aspartate anions in 1 and 2 are very similar (Table 3 and Figure 6). This is the consequence of a similar coordination mode to the sodium cation (see Section 3.1) and the similar packing (see below). The conformations are different from the Li- and K-compounds from the literature [28], which have a different coordination mode to the metals and a very different packing. A constant of the independent aspartate molecules here and also in the Cambridge Structural Database [9], is the χ 1 torsion, which is in gauche conformation in nearly all crystal structures.

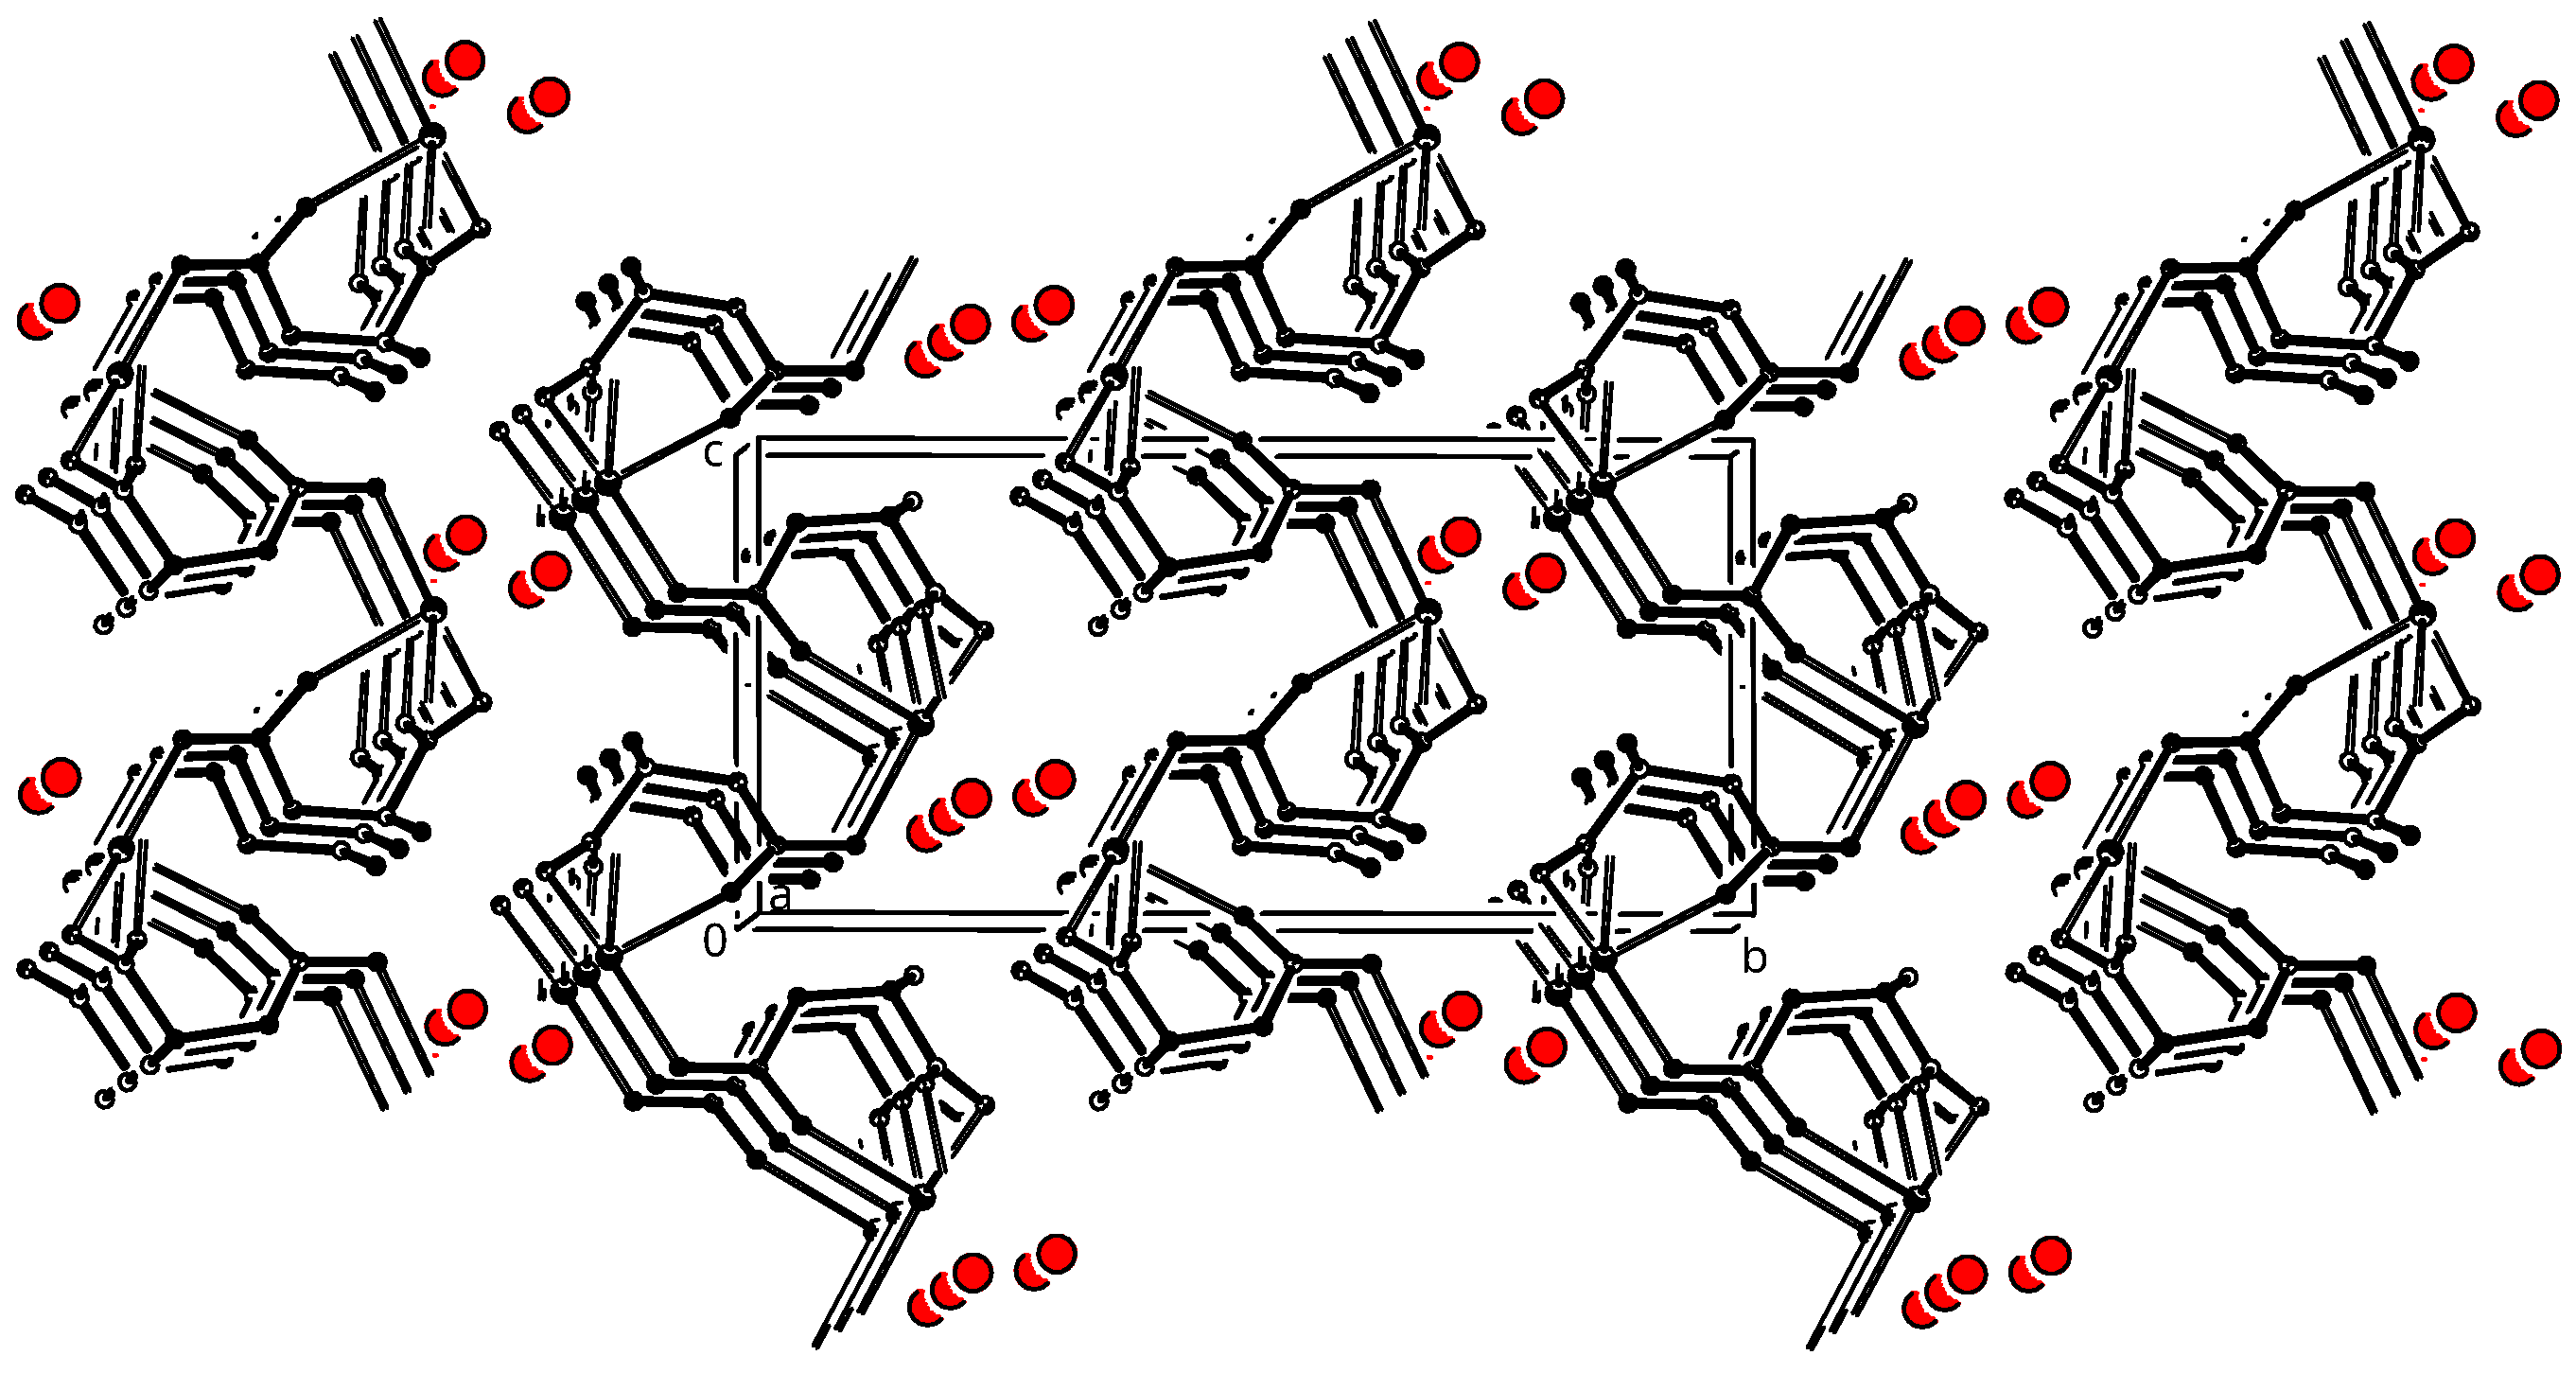
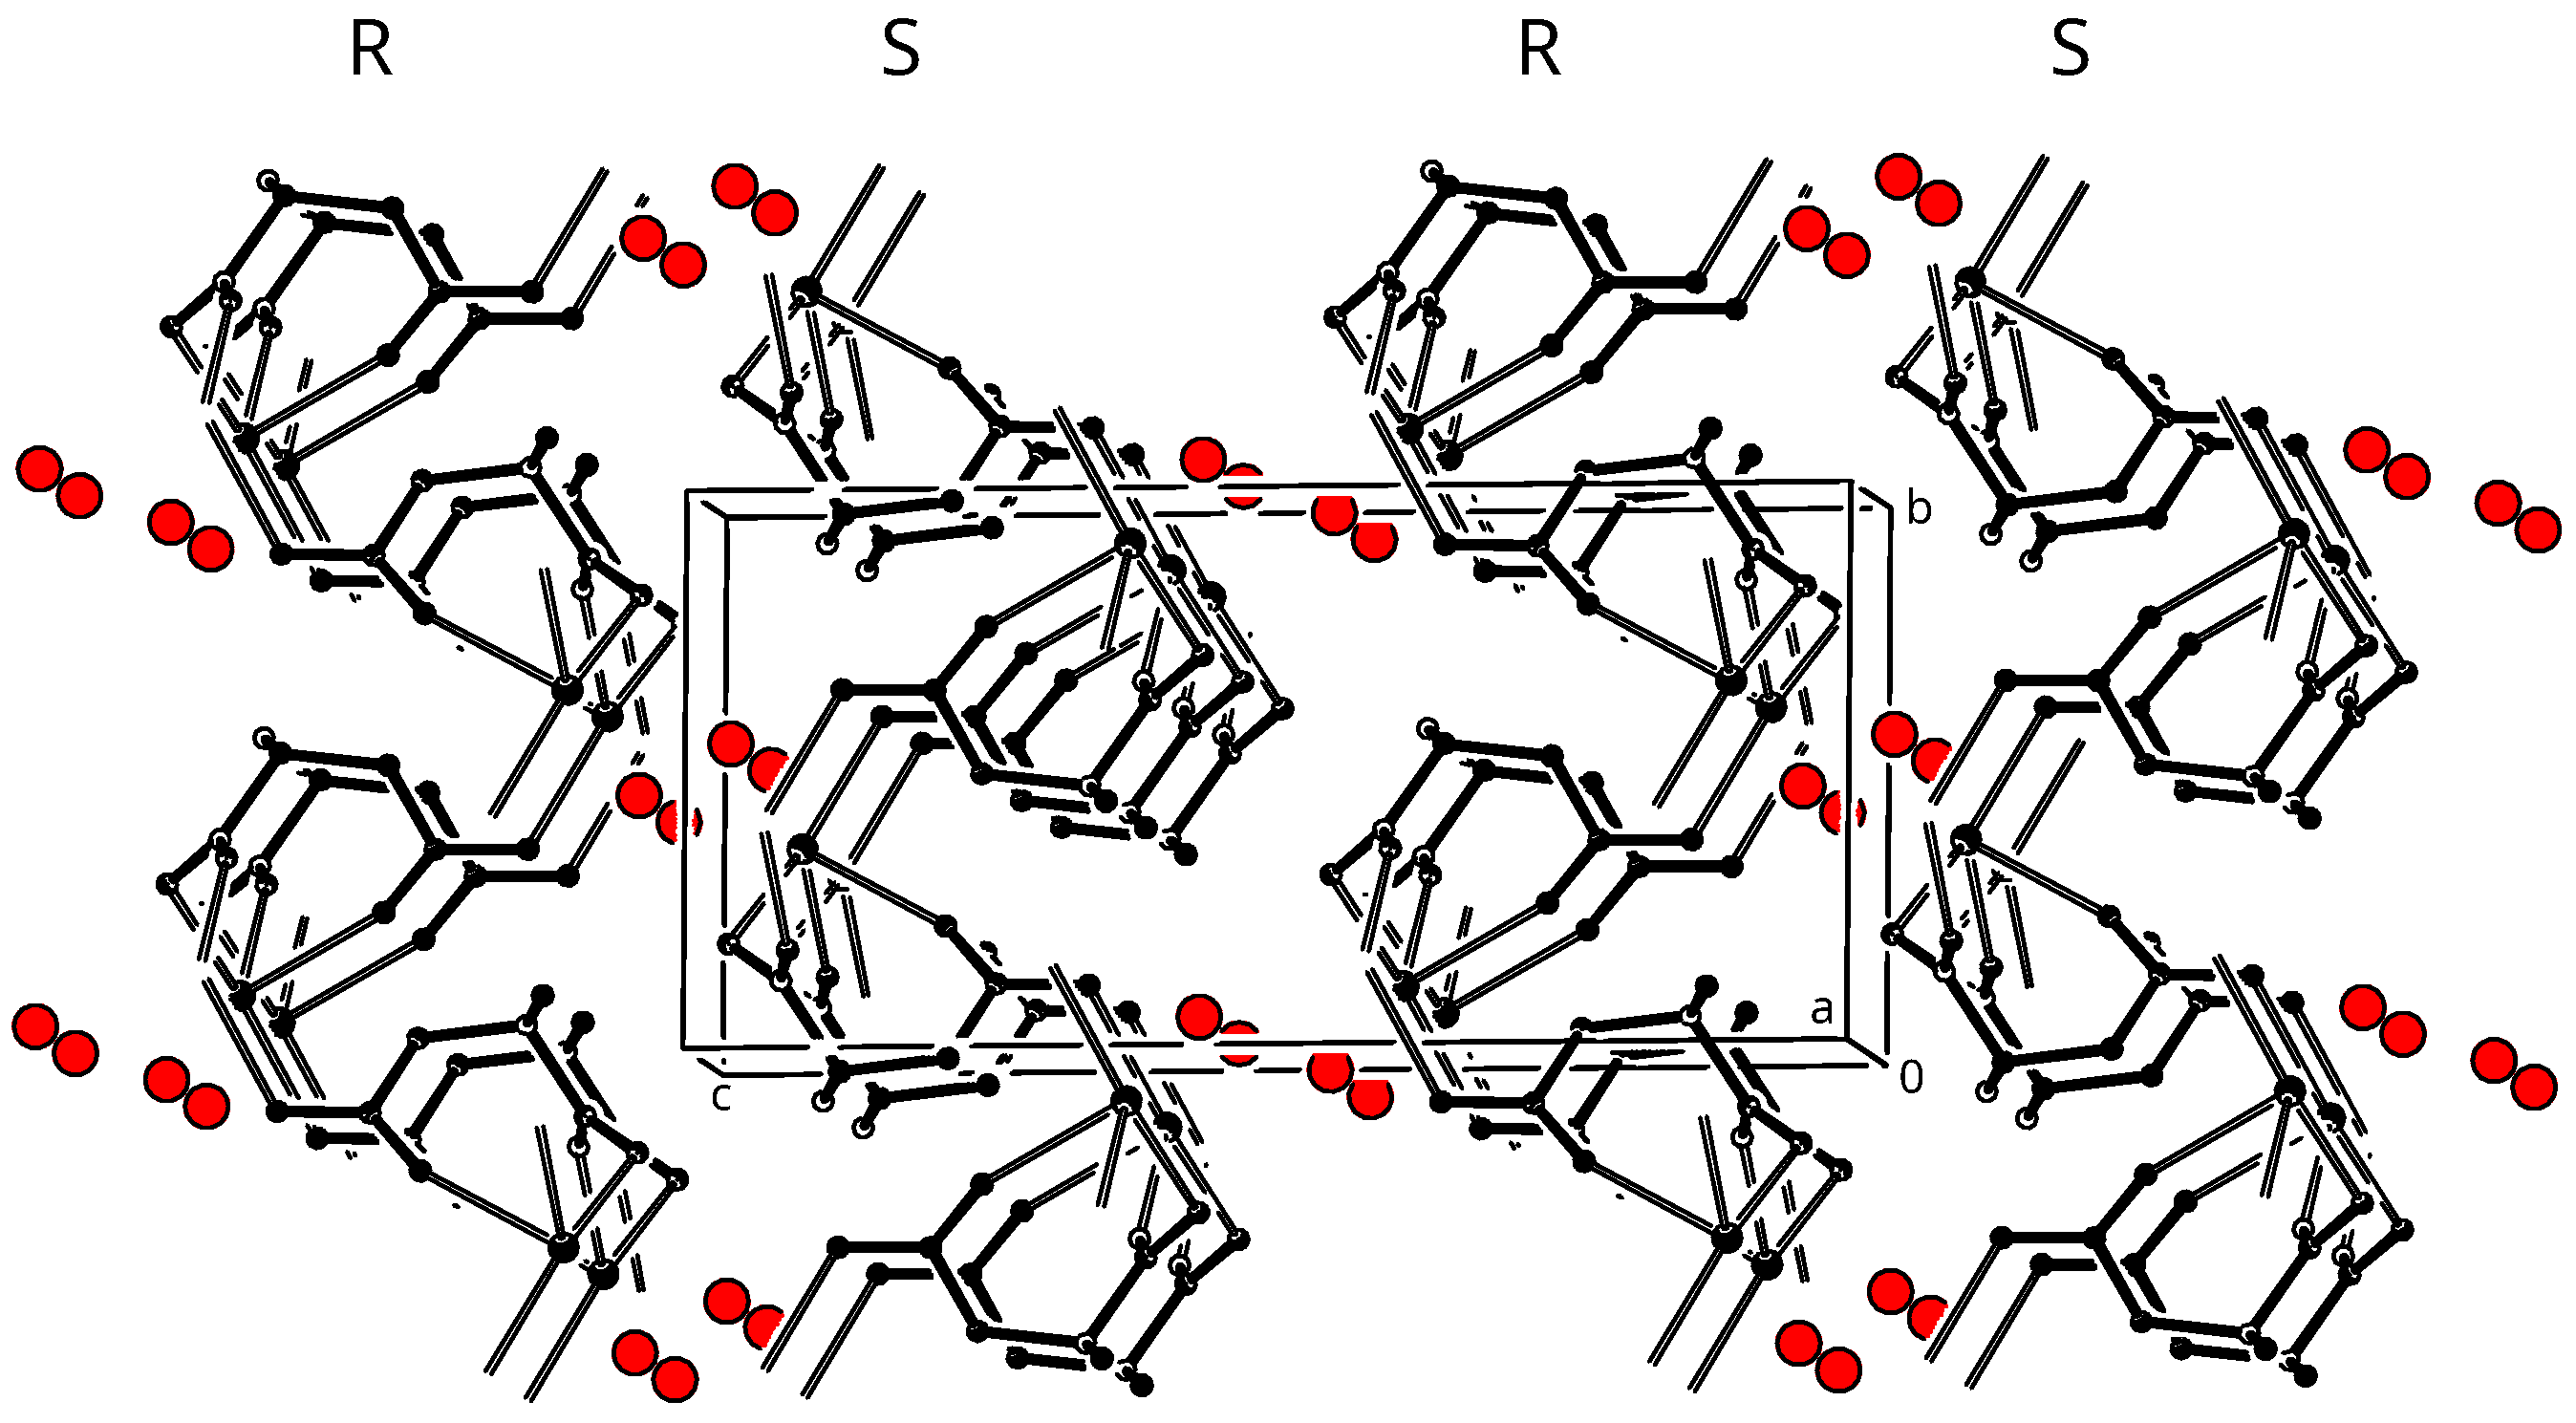
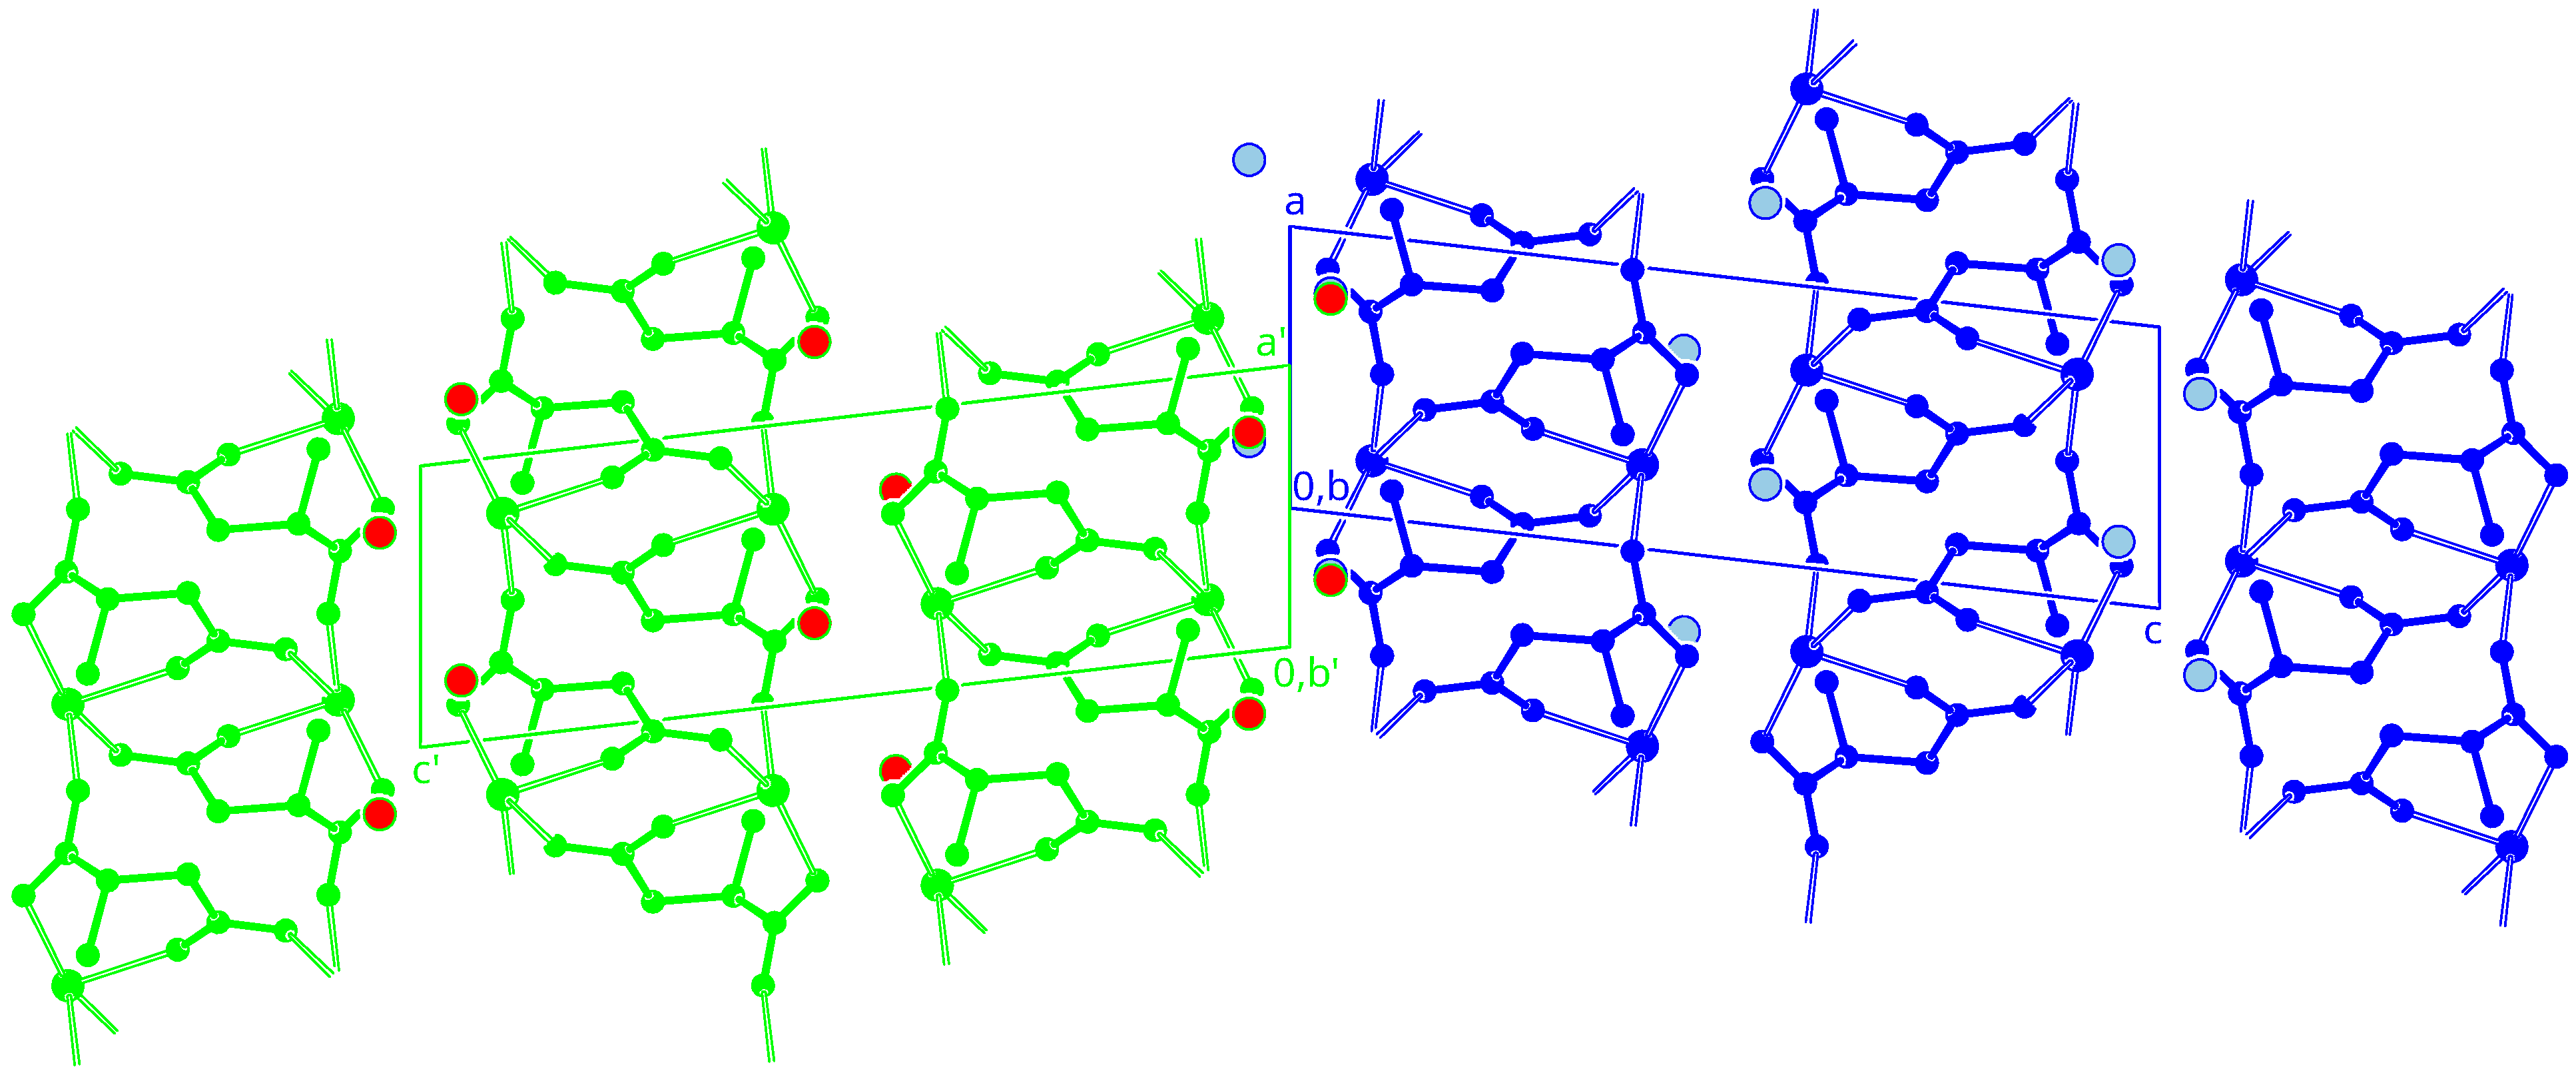
3.3. Crystal Packing

The crystal structures of 1 and 2 can be interpreted as layer structures where sheets of strongly bound sodium aspartate are stacked on top of each other, separated by quite weakly coordinated hydrate water. In 1, the layers are in the a , c -plane and the stacking is in the direction of the b-axis (Figure 7). The layer thickness is 1 2 × d 010 = d 020 = 8.086 Å. In 2, layers are in the a , b -plane and the stacking is in the direction of the c-axis (Figure 8). The layer thickness is 1 2 × d 001 = d 002 = 8.186 Å. Each sodium aspartate layer is homochiral. In 1, this is because of the enantiopurity of the whole crystal. In 2, only first kind symmetry operations are within a layer and second kind operations are only between the layers. (In 2, first kind operations are 2 1 screws, and second kind operations are inversions and glide reflections). Overall, crystal structure 2 is obviously racemic.

3.4. Twinning Model for Enantiopure Compound 1

For 1, we propose a pseudo-orthorhombic twin cell with the same volume as the true unit cell. The twin index is consequently 1, and the twinning is pseudo-merohedral. The twin law was unambiguously determined from the split reflection profiles as a twofold rotation about u v w = [ 1 , 0 , 0 ] ; see Section 2.3. In the monoclinic crystal system, the twin axis u v w = [ 1 , 0 , 0 ] is equivalent to the vector h k l = ( 0 , 0 , 1 ) .
In the case of 1, the determination of the twin law from the intensities is ambiguous. The TwinRotMat method in PLATON [25] selects a twofold rotation about vector h k l = ( 1 , 0 , 0 ) as the twin operation (Figure S5 in the Supplementary Materials). In fact, with TwinRotMat, we were unable to create a twinned HKLF5 reflection file of acceptable quality from the LIST 4 output of our current reflection data. In the program, overlaps are determined from the θ values only, while for 1 the full knowledge of the diffraction geometry is essential.
A rough single-crystal intensity integration with an orthorhombic orientation matrix and the box-integration method of Eval14 [32] resulted in a reflection file with a low merging R value of R i n t = 3.10 % for the Laue group m m m . (Despite the low value of the orthorhombic R i n t , only a single 2 1 screw axis can be detected in the systematic absences). Structure refinement with these data and the twin vector h k l = ( 0 , 0 , 1 ) leads to a refined R 1 = 3.18 % . Changing the twin vector to h k l = ( 1 , 0 , 0 ) gives an identical R 1 value. The two twin laws can thus not be distinguished based on the intensities. Obviously, the proper treatment of the twinning during intensity integration leads to an improved R 1 value (Section 2.3 and Table 1).
The twin law is always a point group operation. In 1, it is a twofold rotation. This law is fully sufficient for a proper intensity integration and a successful structure refinement. The twin law is not adequate for an atomic description of the twin boundary; see, for example, [33,34]. Information about the twin boundary is not contained in the X-ray diffraction experiment, which always involves the whole crystal specimen or a large part of it. We therefore try to draw indirect conclusions from the layer structure of the crystal packing. Beforehand, it can be said that the experimentally determined twin axis u v w = [ 1 , 0 , 0 ] is lying in the layer in the a , c -plane, which builds up the crystal packing of 1 (Section 3.3).
Crystal 1 contains two molecules in the asymmetric unit ( Z = 2 ). The two aspartate anions are related by a local 2 1 screw axis approximately in the c- or c * -direction (Figure S6 in the Supplementary Materials). Figure S7 in the Supplementary Materials shows a single Na-aspartate layer viewed from the top, including the approximate 2 1 screw axes. The top of the layer is consequently similar to the bottom of this layer. The single layer is transformed into the adjacent layer by the true crystallographic 2 1 axis perpendicular to the layer. In other words, the crystallographic 2 1 axis is along the b direction, as shown in Figure 7. In this Figure, we also detect an approximate 2 1 axis along a, located between and oriented parallel to the layers. In total, there are one exact and two approximate 2 1 axes in perpendicular directions. The local 2 1 axes can be the driving force for the twinning and one of them becomes the twin axis. This leads to stacking faults in the arrangement of the layers, as is common in many twin structures.
The combination of three 2 1 axes in perpendicular directions is a description of space group P 2 1 2 1 2 1 . This can not only be seen in the plots of the crystal packing but can also be detected by the ADDSYM routine of the PLATON software [25]. For this analysis, it is necessary to increase the tolerances for non-fitting atoms. We can conclude that the twinned P 2 1 structure of 1 is derived from P 2 1 2 1 2 1 by significant distortion. The 2 1 symmetry of the twin boundary will consequently prevent short, unfavorable atomic contacts. The twin boundary will be energetically similar to the layer boundaries in the single-crystal stacking.
Twinned crystals with stacking faults can show significant diffuse scattering; see, for example, [35,36]. This depends on the size of the individual twin domains. Diffuse scattering in 1 is negligible and we conclude that the twin domain size is larger than the coherence length of the X-rays in the current diffraction experiment.

3.5. Twinning Model for Racemic Compound 2

As twin lattice for compound 2, we propose a unit cell where the c-axis is increased by a factor of four. In this twin lattice, the Lepage algorithm [37] in the PLATON software [25] detects that the original a-axis is a potential twofold axis in a pseudo-orthorhombic C-centered lattice with a twin obliquity [38] of ω = 0.335 °. Overall, the current situation fulfills Mallard’s criterion [39], which states that the twin index should be smaller than six (here it is four) and the twin obliquity should be smaller than 6° (here it is 0.335°).
For the intensity integration, a rotation operation was selected as the twin law. This is necessary in order to maintain right-handed orientation matrices for the two twin components. In the centrosymmetric crystal of 2, the true twin law can equally be a mirror operation. For the structure refinement, rotation and mirror cannot be distinguished. Based on the indexing of the observed reflections, there are consequently four equivalent twin operations possible in the monoclinic crystal system of 2: twofold rotation about u v w = [ 1 , 0 , 0 ] , twofold rotation about vector h k l = ( 0 , 0 , 1 ) , reflection perpendicular to u v w = [ 1 , 0 , 0 ] , or reflection at plane h k l = ( 0 , 0 , 1 ) . Because of the centrosymmetry, anomalous dispersion cannot be used for the distinction.
Single sodium aspartate layers in 2 (S configuration) are very similar and nearly superimposable with the single layers in 1 (Figures S7 and S8 in the Supplementary Materials). Lying inside the single layer of 2 there is an exact 2 1 screw axis in the b direction, while the single layer of 1 contains only an approximate 2 1 axis. A single layer in 2 is transformed into the adjacent layer by exact inversion centers between the layers. Equivalently, this transformation is achieved by the n-glide mirror plane perpendicular to b. For an atomic explanation of the twin boundary we can choose between a 2 1 screw axis along a and a reflection at plane ( 0 , 0 , 1 ) . Both choices potentially need to be combined with translations. For the preparation of Figure 9, a mirror operation was used. This would keep the alternation of S and R layers in the stacking. For stacking faults in a reflection twin of an organic material, see, for example, [40]. In compound 2, the 2 1 operation along a is equally favorable (not displayed).
Similar to 1, the crystals of 2 show no significant diffuse scattering (see Figure S9 in the Supplementary Materials).

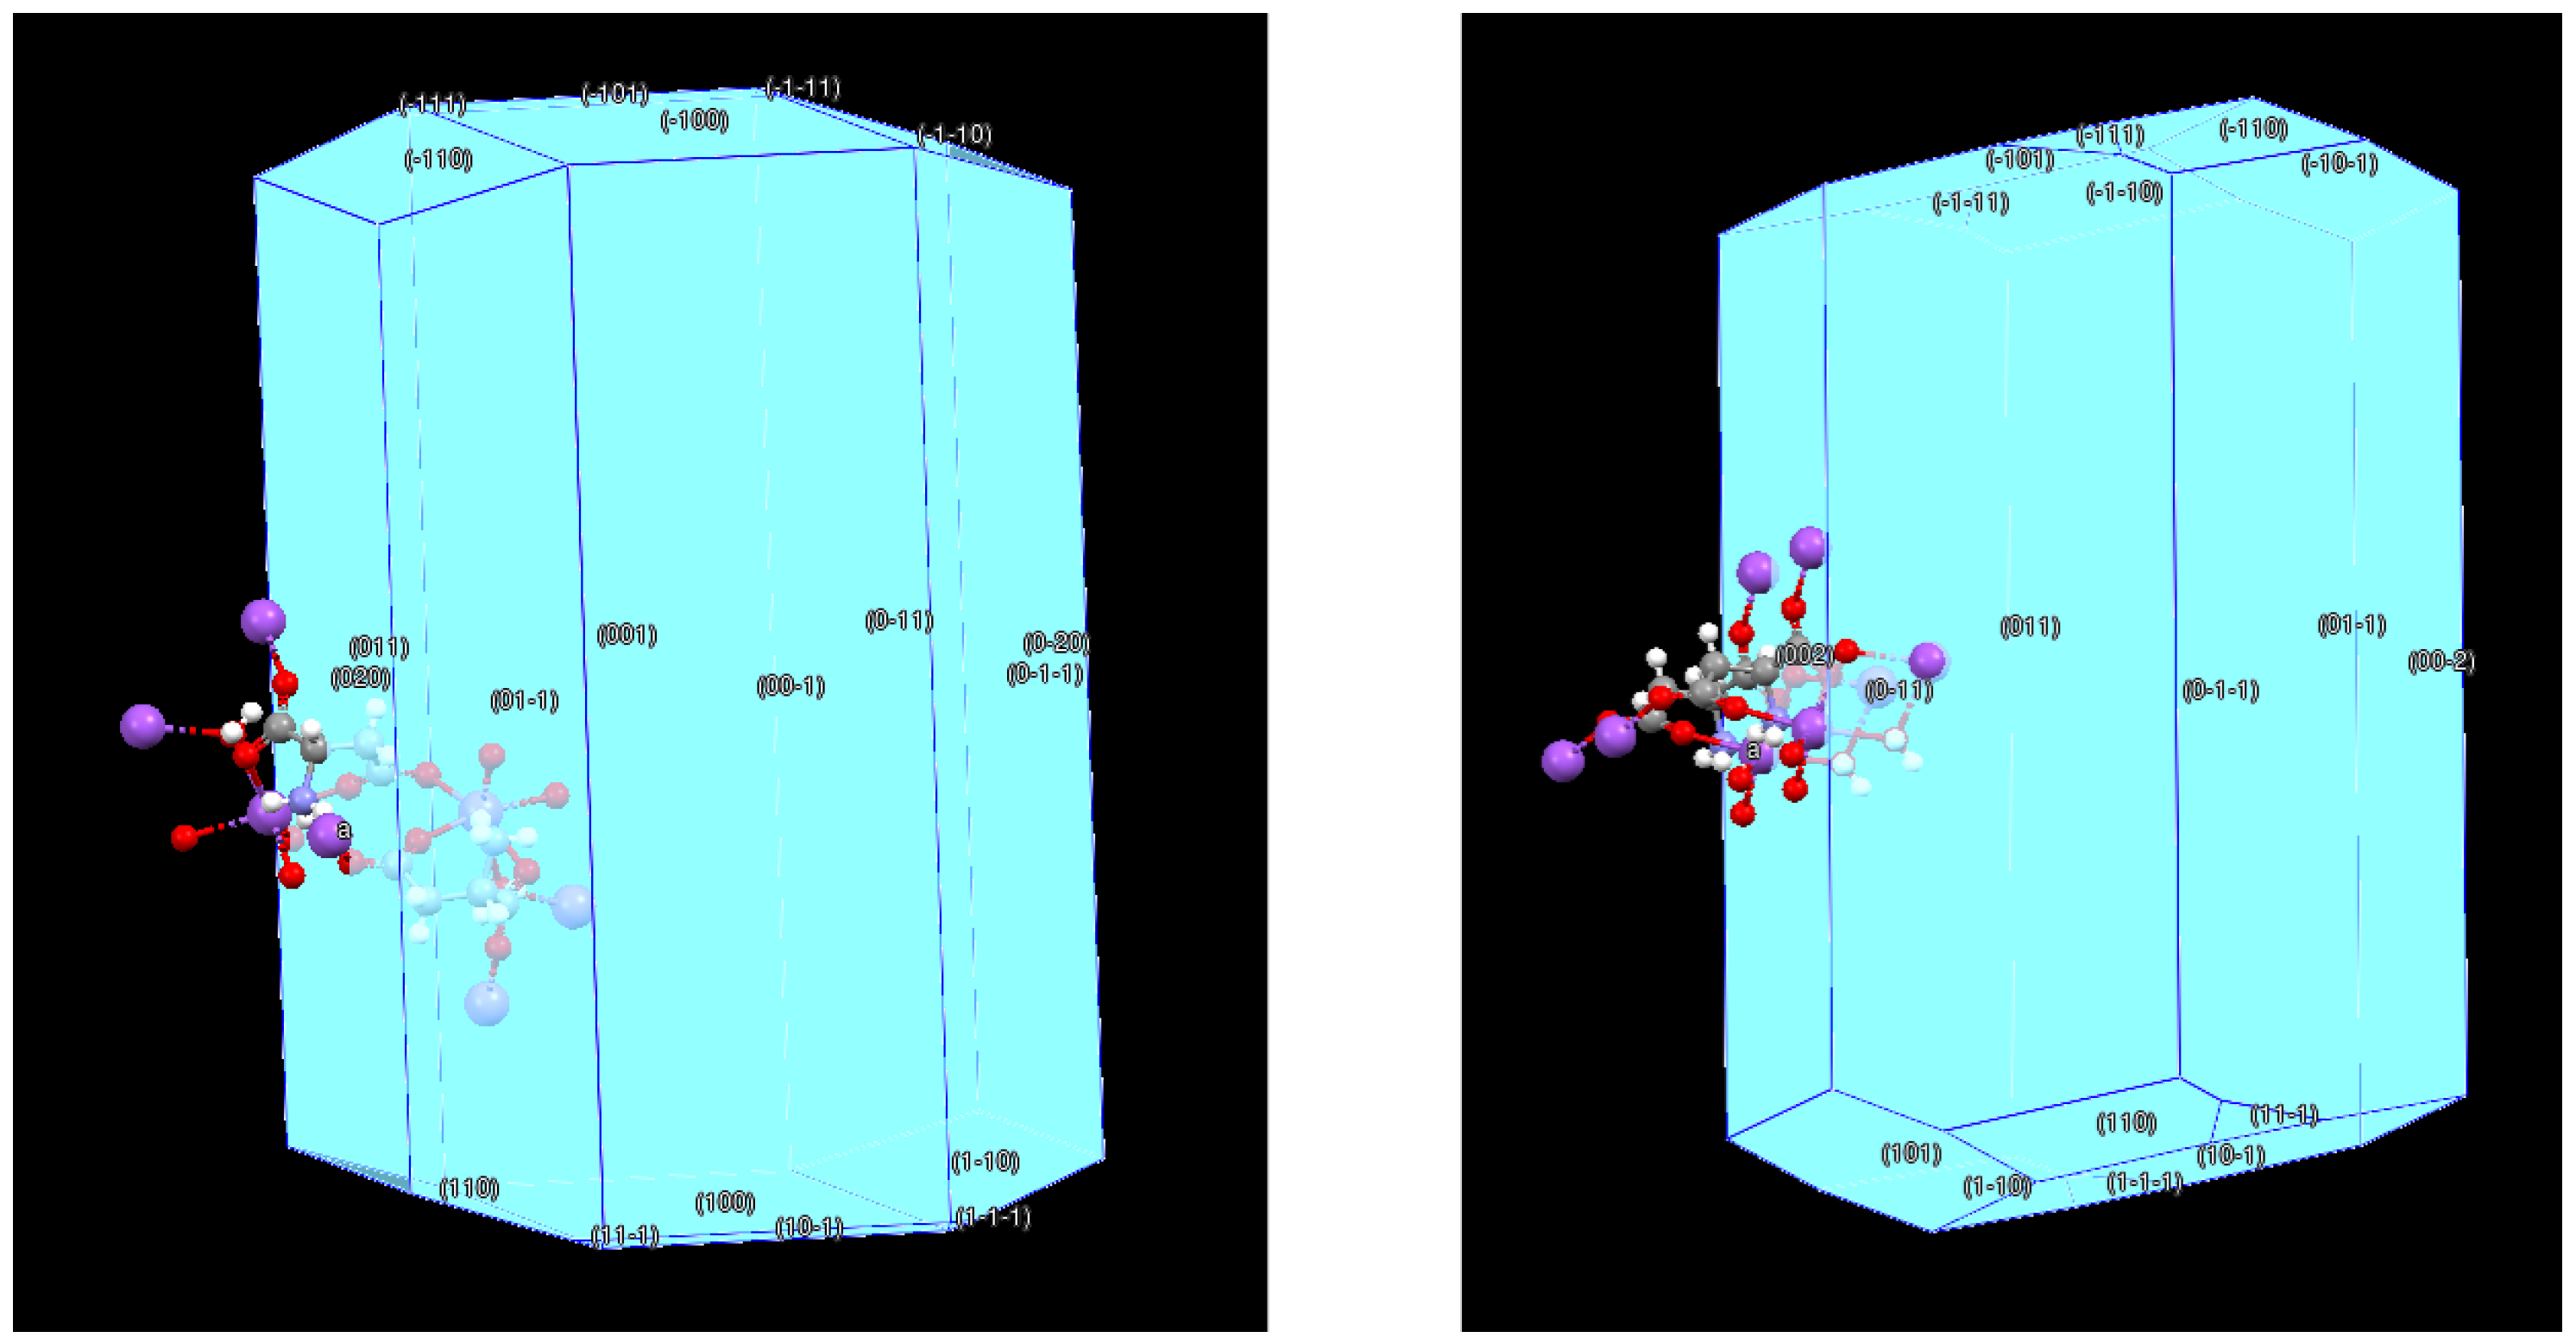
3.6. BFDH Morphology

In the previous sections the three-dimensional coordination structures and the three-dimensional hydrogen-bond structures were decomposed into layers in order to explain the crystal packing and the twinning. This was based on the weaker and more flexible bonding of the bridging water molecules and resulted in ( 0 , 1 , 0 ) layers for 1 and ( 0 , 0 , 1 ) layers for 2.
In the literature, it has been proposed that prominent faces in predicted or measured crystal morphology can be used as explanation for twin boundaries in growth twins [41,42]. Because the crystal size and quality of 1 and 2 did not allow an accurate measurement of the morphology, we resorted to morphology prediction. We used the Bravais–Friedel–Donnay–Harker model (BFDH model) [43] as implemented in the CSD-particle menu of the Mercury software [44]. The BFDH model is based on the idea that net planes with a high reticular density (i.e., number of lattice points per unit surface) will have a high morphological importance. This simple approach makes the BFDH model universally applicable and independent of the materials chemistry. Only the unit cell parameters and the space group symmetry are required as input. A disadvantage is that energy contributions are not considered and the BFDH model is often inadequate. We nevertheless chose the BFDH model because proper energy calculations for three-dimensional coordination compounds are very challenging. For instance, in Mercury only the BFDH model is available for 1 and 2 and the other methods of morphology prediction are not implemented for them.
Drawings of the BFDH morphologies are given in Figure 10, and the numerical output is presented in Tables S7 and S8 in the Supplementary Materials. Faces { 0 , 2 , 0 } in 1 and faces { 0 , 0 , 2 } in 2 have the highest importance. (By definition, Miller indices of net planes should be relative prime. In BFDH morphology, the presence of screw axes and/or glide planes makes exceptions to this rule [45]). This is confirmed in the diffraction pattern. In 1, reflection h k l = ( 0 , 1 , 0 ) is systematically absent, while h k l = ( 0 , 2 , 0 ) is the reflection with the lowest resolution. In 2, h k l = ( 0 , 0 , 1 ) is systematically absent and h k l = ( 0 , 0 , 2 ) is the lowest resolution reflection.
The importance of { 0 , 2 , 0 } in 1 and { 0 , 0 , 2 } in 2 thus confirm the structure-based decomposition into layers, which was discussed in the previous sections.

3.7. Non-Standard Unit Cell Parameters

With the matrix ( 1 , 0 , 1 ¯ / 0 , 1 ¯ , 0 / 1 ¯ , 0 , 0 ) , the unit cell parameters of racemic compound 2 (see Table 1) can be transformed into a non-standard setting with a = 17.8810 , b = 7.7195 , c = 5.2977 Å and β = 113.705 °. In this new setting, the ratio of the axes is 2.3163:1:0.6862. This is similar to the ratio of 2.2369:1:0.6768 and the angle β = 113 56 1 4 ( 113.938 ) reported by Grattarola and Groth [11,12]. It is therefore likely that we successfully reproduced their crystal structure. In contrast to their sum formula COONa·CH2·CHNH2·COONa + H2O, we find the monohydrate of the monosodium aspartate.
In the non-standard setting, the space group is P 2 1 / a . The twin law is a twofold rotation about the vector u v w = [ 0 , 0 , 1 ] or the vector h k l = ( 1 , 0 , 0 ) (or a reflection on the perpendicular mirror planes). The planes of the sodium aspartate layer structure (see Figure 8) transform to the b , c -plane in the non-standard setting. This again confirms the identity of 2 with Grattarola’s twin description, which is based on the { 1 , 0 , 0 } planes [11,12].

4. Conclusions

One hundred seventy-two years after the first description of the crystals of enantiopure and racemic sodium aspartate by Louis Pasteur, we can finally present the atomic structure from X-ray crystal structure determinations. The diffraction experiments were hampered by the twinning of both crystal forms. The results confirm Pasteur’s postulate that the enantiopure and racemic crystals have the same sum formulas. Even more, both forms have a very similar crystal packing which is composed of slabs of two-dimensional sodium aspartate stacked on top of each other and connected by coordinated hydrate water molecules and by hydrogen bonds. Both crystals are the monohydrate of the monosodium salt of aspartic acid. In the enantiopure crystals of 1, there are approximate 2 1 axes along c lying in the layer; in racemic 2, the 2 1 axes lying in the layer are exact and along b. Consequently, the length of the c-axis in 1 corresponds to that of the b-axis in 2 (Table 1). The twinning of the two crystal forms 1 and 2 is most likely caused by stacking faults. Looking at the crystal packing shows that the twin boundaries are similar to the single-crystal boundaries. The net planes of the twin boundaries could also be shown to be important in the morphology of the BFDH models. Experimentally, the X-ray intensity evaluation in 1 was challenging because the monoclinic β -angle is close to 90°, resulting in split reflections that are very close together.

Supplementary Materials

The following supporting information can be downloaded at: https://www.mdpi.com/article/10.3390/cryst15060521/s1, Figure S1: Crystallization result of compound 1; Figure S2: Crystallization result of compound 2; Figure S3: Arrangement of sodium coordination octahedra in enantiopure 1; Figure S4: Arrangement of sodium coordination octahedra in racemic 2; Figure S5: Twin analysis of 1 with TwinRotMat; Figure S6: Two independent aspartate anions in 1; Figure S7: Independent aspartate anions in a single layer of 1; Figure S8: Independent aspartate anions in a single layer of 2; Figure S9: Simulated precession photo for 2; Table S1: Environment of water molecules in 1; Table S2: Environment of sodium atoms in 1; Table S3: Hydrogen bond geometries in 1; Table S4: Environment of water molecules in 2; Table S5: Environment of sodium atoms in 2; Table S6: Hydrogen bond geometries in 2; Table S7: BFDH morphology for 1; Table S8: BFDH morphology for 2. References in the Supplementary Materials: [21,25,44,46].

Author Contributions

Conceptualization, M.L.; formal analysis, all authors; data curation, all authors; writing—original draft preparation, M.L.; writing—review and editing, all authors. All authors have read and agreed to the published version of the manuscript.

Funding

The X-ray diffractometer was financed by The Netherlands Organization for Scientific Research (NWO).

Institutional Review Board Statement

Not applicable.

Informed Consent Statement

Not applicable.

Data Availability Statement

The raw diffraction frames have been converted to imgCIF format [47] and uploaded to Zenodo (https://doi.org/10.5281/zenodo.15432049 (accessed on 24 May 2025), https://doi.org/10.5281/zenodo.15349705 (accessed on 24 May 2025)). CCDC 2449022 (crystal structure 1) and 2449023 (2) contain the supplementary crystallographic data for this paper. These data can be obtained free of charge from the Cambridge Crystallographic Data Centre via www.ccdc.cam.ac.uk/data_request/cif (accessed on 24 May 2025).

Acknowledgments

Loes Kroon-Batenburg is acknowledged for her help with the conversion of raw diffraction images to imgCIF format.

Conflicts of Interest

The authors declare no conflicts of interest.

References

  1. Flack, H.D. Louis Pasteur’s discovery of molecular chirality and spontaneous resolution in 1848, together with a complete review of his crystallographic and chemical work. Acta Crystallogr. Sect. A 2009, 65, 371–389. [Google Scholar] [CrossRef] [PubMed]
  2. Gal, J. Pasteur and the art of chirality. Nat. Chem. 2017, 9, 604–605. [Google Scholar] [CrossRef] [PubMed]
  3. Rietveld, I.B.; Painsecq, F.; Jandl, C.; Stam, D.; Coquerel, G. In the Footsteps of Pasteur: Finding Conglomerates by Using State-of-the-Art Electron Diffraction. Cryst. Growth Des. 2024, 24, 5893–5897. [Google Scholar] [CrossRef]
  4. Bernal, J.D. Science and Industry in the Nineteenth Century; Routledge & Kegan Paul: London, UK, 1953. [Google Scholar]
  5. Gal, J. Louis Pasteur, Chemical Linguist: Founding the Language of Stereochemistry. Helv. Chim. Acta 2019, 102, e1900098. [Google Scholar] [CrossRef]
  6. Jacques, J. The Molecule and Its Double; McGraw-Hill: New York, NY, USA, 1993. [Google Scholar]
  7. Jacques, J.; Collet, A.; Wilen, S.H. Enantiomers, Racemates, and Resolutions; Krieger Pub. Co.: Malabar, FL, USA, 1994. [Google Scholar]
  8. Rekis, T. Crystallization of chiral molecular compounds: What can be learned from the Cambridge Structural Database? Acta Crystallogr. Sect. B 2020, 76, 307–315. [Google Scholar] [CrossRef]
  9. Groom, C.R.; Bruno, I.J.; Lightfoot, M.P.; Ward, S.C. The Cambridge Structural Database. Acta Crystallogr. Sect. B 2016, 72, 171–179. [Google Scholar] [CrossRef]
  10. Pasteur Vallery-Radot, R. Oeuvres de Pasteur. Tome Premier: Dissymétrie Moléculaire; Masson et cie: Paris, France, 1922; pp. 169–171. [Google Scholar]
  11. Grattarola, G. Asparaginsäure Natronsalze. Z. Krist.—Cryst. Mater. 1892, 20, 620. [Google Scholar] [CrossRef]
  12. Groth, P. Chemische Krystallographie, Dritter Teil; Verlag von Wilhelm Engelmann: Leipzig, Germany, 1910; p. 277. [Google Scholar]
  13. Schmidbaur, H.; Classen, H.G.; Helbig, J. Aspartic and Glutamic Acid as Ligands to Alkali and Alkaline-Earth Metals: Structural Chemistry as Related to Magnesium Therapy. Angew. Chem. Int. Ed. Engl. 1990, 29, 1090–1103. [Google Scholar] [CrossRef]
  14. Fleck, M.; Petrosyan, A.M. Salts of Amino Acids: Crystallization, Structure and Properties; Springer: Cham, Switzerland, 2014. [Google Scholar] [CrossRef]
  15. Herbst-Irmer, R.; Sheldrick, G.M. Refinement of Twinned Structures with SHELXL97. Acta Crystallogr. Sect. B 1998, 54, 443–449. [Google Scholar] [CrossRef]
  16. Sevvana, M.; Ruf, M.; Usón, I.; Sheldrick, G.M.; Herbst-Irmer, R. Non-merohedral twinning: From minerals to proteins. Acta Crystallogr. Sect. D 2019, 75, 1040–1050. [Google Scholar] [CrossRef]
  17. Dudev, M.; Wang, J.; Dudev, T.; Lim, C. Factors Governing the Metal Coordination Number in Metal Complexes from Cambridge Structural Database Analyses. J. Phys. Chem. B 2006, 110, 1889–1895. [Google Scholar] [CrossRef] [PubMed]
  18. Bock, C.W.; Markham, G.D.; Katz, A.K.; Glusker, J.P. The Arrangement of First- and Second-shell Water Molecules Around Metal Ions: Effects of Charge and Size. Theor. Chem. Accounts 2006, 115, 100–112. [Google Scholar] [CrossRef]
  19. Ruggiero, M.T.; Sibik, J.; Erba, A.; Zeitler, J.A.; Korter, T.M. Quantification of cation–anion interactions in crystalline monopotassium and monosodium glutamate salts. Phys. Chem. Chem. Phys. 2017, 19, 28647–28652. [Google Scholar] [CrossRef]
  20. Duisenberg, A.J.M. Indexing in single-crystal diffractometry with an obstinate list of reflections. J. Appl. Crystallogr. 1992, 25, 92–96. [Google Scholar] [CrossRef]
  21. Schreurs, A.M.M.; Xian, X.; Kroon-Batenburg, L.M.J. EVAL15: A diffraction data integration method based on ab initio predicted profiles. J. Appl. Crystallogr. 2010, 43, 70–82. [Google Scholar] [CrossRef]
  22. Duisenberg, A.J.M. Diffractometry and reflection profiles of anisotropic mosaic and split crystals. Acta Crystallogr. Sect. A 1983, 39, 211–216. [Google Scholar] [CrossRef]
  23. Sheldrick, G.M. SHELXT—Integrated space-group and crystal-structure determination. Acta Crystallogr. Sect. A 2015, 71, 3–8. [Google Scholar] [CrossRef]
  24. Sheldrick, G.M. Crystal structure refinement with SHELXL. Acta Crystallogr. Sect. C 2015, 71, 3–8. [Google Scholar] [CrossRef]
  25. Spek, A.L. Structure validation in chemical crystallography. Acta Crystallogr. Sect. D 2009, 65, 148–155. [Google Scholar] [CrossRef]
  26. Parsons, S.; Flack, H.D.; Wagner, T. Use of intensity quotients and differences in absolute structure refinement. Acta Crystallogr. Sect. B 2013, 69, 249–259. [Google Scholar] [CrossRef]
  27. Hooft, R.W.W.; Straver, L.H.; Spek, A.L. Determination of absolute structure using Bayesian statistics on Bijvoet differences. J. Appl. Crystallogr. 2008, 41, 96–103. [Google Scholar] [CrossRef]
  28. Schmidbaur, H.; Bach, I.; Wilkinson, D.L.; Müller, G. Metal ion binding by amino acids. Preparation and crystal structures of lithium hydrogen L-aspartate hydrate and potassium hydrogen L-aspartate dihydrate. Chem. Berichte 1989, 122, 1427–1431. [Google Scholar] [CrossRef]
  29. Kitaĭgorodskiĭ, A.I. Molecular Crystals and Molecules; Academic Press: New York, NY, USA, 1973. [Google Scholar]
  30. Robinson, K.; Gibbs, G.V.; Ribbe, P.H. Quadratic Elongation: A Quantitative Measure of Distortion in Coordination Polyhedra. Science 1971, 172, 567–570. [Google Scholar] [CrossRef]
  31. Alvarez, S.; Avnir, D.; Llunell, M.; Pinsky, M. Continuous symmetry maps and shape classification. The case of six-coordinated metal compounds. New J. Chem. 2002, 26, 996–1009. [Google Scholar] [CrossRef]
  32. Duisenberg, A.J.M.; Kroon-Batenburg, L.M.J.; Schreurs, A.M.M. An intensity evaluation method: EVAL-14. J. Appl. Crystallogr. 2003, 36, 220–229. [Google Scholar] [CrossRef]
  33. Stöger, B.; Pokorny, B.; Lumpi, D.; Zobetz, E.; Fröhlich, J. The twinning of two closely related phenylisoxazoles interpreted according to order-disorder theory. Z. Krist.—Cryst. Mater. 2013, 228, 106–112. [Google Scholar] [CrossRef]
  34. Marzouki, M.A.; Souvignier, B.; Nespolo, M. Twinning of aragonite—The crystallographic orbit and sectional layer group approach. Acta Crystallogr. Sect. A 2015, 71, 195–202. [Google Scholar] [CrossRef]
  35. Herbstein, F.H. Twinned crystals. III. γ-o-Nitroaniline. Acta Crystallogr. 1965, 19, 590–595. [Google Scholar] [CrossRef]
  36. Lutz, M.; Kroon-Batenburg, L.M.J. Order-Disorder in Diaquobis(salicylato)copper(II) Revisited. Croat. Chem. Acta 2018, 91, 289–298. [Google Scholar] [CrossRef]
  37. Le Page, Y. The derivation of the axes of the conventional unit cell from the dimensions of the Buerger-reduced cell. J. Appl. Crystallogr. 1982, 15, 255–259. [Google Scholar] [CrossRef]
  38. Le Page, Y. Mallard’s law recast as a Diophantine system: Fast and complete enumeration of possible twin laws by [reticular] [pseudo] merohedry. J. Appl. Crystallogr. 2002, 35, 175–181. [Google Scholar] [CrossRef]
  39. Nespolo, M.; Ferraris, G. Hybrid twinning—A cooperative type of oriented crystal association. Z. Krist.—Cryst. Mater. 2005, 220, 317–323. [Google Scholar] [CrossRef]
  40. Lutz, M.; Klein, T.J.S.d.; Huijben, J. 5-Iodouracil: Structure of a reflection twin. Acta Crystallogr. Sect. C 2015, 71, 912–915. [Google Scholar] [CrossRef] [PubMed]
  41. Hartman, P. On the Morphology of Growth Twins. Z. Krist.—Cryst. Mater. 1956, 107, 225–237. [Google Scholar] [CrossRef]
  42. Kitamura, M.; Hosoya, S.; Sunagawa, I. Re-investigation of the re-entrant corner effect in twinned crystals. J. Cryst. Growth 1979, 47, 93–99. [Google Scholar] [CrossRef]
  43. Winn, D.; Doherty, M.F. Modeling crystal shapes of organic materials grown from solution. AIChE J. 2000, 46, 1348–1367. [Google Scholar] [CrossRef]
  44. Macrae, C.F.; Edgington, P.R.; McCabe, P.; Pidcock, E.; Shields, G.P.; Taylor, R.; Towler, M.; van de Streek, J. Mercury: Visualization and analysis of crystal structures. J. Appl. Crystallogr. 2006, 39, 453–457. [Google Scholar] [CrossRef]
  45. Donnay, J.D.H.; Harker, D. A new law of crystal morphology extending the Law of Bravais. Am. Mineral. 1937, 22, 446–467. [Google Scholar]
  46. Blatov, V.A.; Shevchenko, A.P.; Proserpio, D.M. Applied Topological Analysis of Crystal Structures with the Program Package ToposPro. Cryst. Growth Des. 2014, 14, 3576–3586. [Google Scholar] [CrossRef]
  47. Hammersley, A.P.; Bernstein, H.J.; Westbrook, J.D. International Tables for Crystallography, Volume G; Springer: Dordrecht, The Netherlands, 2005; pp. 444–458. [Google Scholar]
Scheme 1. L-(+)-tartaric acid (left) and L-aspartic acid (right) used in the research of Louis Pastuer. The drawings are made on the basis of modern knowledge. L-aspartic acid is shown in the zwitterionic form.
Crystals 15 00521 sch001
Scheme 2. Monosodium aspartate monohydrate.
Crystals 15 00521 sch002
Figure 1. External shape of the crystals of sodium aspartate. The active form is on the left (prismatic needles with rhombic base), and the facets h are the hemihedral facets. The middle and the right show the inactive form (oblique prism with modified rectangular base). This figure is re-drawn after Pasteur [10].
Crystals 15 00521 g001
Figure 2. Example of a split reflection in compound 1. The reflection in the image center is h k l = ( 6 , 2 , 3 ) of the first twin component. The reflection in the corner is h k l = ( 6 , 2 , 3 ) of the second twin component. Left: observed reflection profile. Right: modeled profile by the Eval15 software [21].
Crystals 15 00521 g002
Figure 3. Two-dimensional reconstruction of the h 0 plane of compound 1, prepared with the img2hkl program of the Eval15 suite [21]. Left: full image up to a resolution of 0.82 Å. Middle: zoom image taken from the yellow square in the left image. Right: zoom image with predictions, with white circles for the first and blue circles for the second lattice.
Crystals 15 00521 g003
Figure 4. Asymmetric unit of enantiopure 1 in the crystal. Displacement ellipsoids are drawn at the 50% probability level. Hydrogen atoms are drawn as spheres with arbitrary radii. The O–Na–O cis angles between the water molecules are marked in orange. The stoichiometry for monosodium aspartate monohydrate can be derived from the asymmetric unit.
Crystals 15 00521 g004
Figure 5. Asymmetric unit of racemic 2 in the crystal. Displacement ellipsoids are drawn at the 50% probability level. Hydrogen atoms are drawn as spheres with arbitrary radii. The O–Na–O cis angle between the water molecules is marked in orange. The stoichiometry for monosodium aspartate monohydrate can be derived from the asymmetric unit.
Crystals 15 00521 g005
Scheme 3. Coordination modes of sodium to carboxylate groups.
Crystals 15 00521 sch003
Figure 6. Overlay of the two independent aspartate ligands in 1 (black and red) and the S-enantiomer in racemic 2 (green).
Crystals 15 00521 g006
Figure 7. In the crystal structure of 1, we find strongly bound sodium aspartate layers (black) separated by hydrate water layer molecules (red). Hydrogen atoms and Na–water bonds are omitted for clarity.
Crystals 15 00521 g007
Figure 8. Layer structure of 2. Strongly coordinated sodium aspartate layers (black) with water molecules (red) are located at the interface between these layers. Hydrogen atoms and Na–water bonds are omitted for clarity. The R and S symbols indicate the amino acid configurations in the homochiral layers.
Crystals 15 00521 g008
Figure 9. Artistic impression of the twin boundary in 2. The second component (green/red) is a reflection of the first component (blue) at the plane h k l = ( 0 , 0 , 1 ) . No short contacts and clashes are detected. The difference between a single-crystal boundary and a twin boundary is small.
Crystals 15 00521 g009
Figure 10. Predicted BFDH morphologies for 1 (left) and 2 (right). The calculations were performed with the Mercury software, version 2025.1.0 [44].
Crystals 15 00521 g010
Table 1. Experimental details of the crystal structures.
1 (Enantiopure)2 (Racemic)
sum formulaC4H8NNaO5C4H8NNaO5
formula weight173.10173.10
crystal systemmonoclinicmonoclinic
space group P 2 1 (no. 4) P 2 1 / n (no. 14)
a [Å]5.27592(17)5.2977(2)
b [Å]16.174(2)7.7195(3)
c [Å]7.7051(8)16.4812(8)
β [°]90.734(3)96.588(2)
V [Å3]657.43(11)669.56(5)
Z44
D x [ g / cm 3 ]1.7491.717
μ [ mm 1 ]0.210.21
T [K]150(2)150(2)
crystal size [mm] 0.47 × 0.22 × 0.18 0.62 × 0.33 × 0.16
λ [Å]0.710730.71073
( sin θ / λ ) m a x −1]0.710.71
meas. refl.25,44231,302
unique refl.38321997
obs. refl. [ I > 2 σ ( I ) ]37811939
R i n t 0.0300.029
no. parameters214121
no. restraints70
a, b 0.0349, 0.06470.0422, 0.1553
R1/wR2 (obs. refl.)0.0219/0.05610.0261/0.0712
R1/wR2 (all refl.)0.0222/0.05620.0267/0.0715
S1.1141.083
Parsons z [26] (SHELXL)0.01(7) [1802 pairs]
Δ ρ m i n / m a x [e/Å3]−0.17/0.29−0.28/0.36
 a and b are parameters of the SHELXL weighting scheme w = 1 / [ σ 2 ( F o 2 ) + ( a × P ) 2 + b × P ] with P = ( F o 2 + 2 F c 2 ) / 3 .
Table 2. Octahedral distortion at the sodium atoms. The last column shows PLATON calculations [25] of the approximate symmetry of the NaO6 polyhedron with rms deviation in brackets.
StructureAtom Name λ oct [30] σ θ ( oct ) 2 [30]CSM [31]Symmetry
1Na11.044136.09 deg 2 2.381 D 3 d (0.32 Å)
Na21.049144.10 deg 2 2.387 C i (0.26 Å)
2Na11.053159.26 deg 2 2.620 C 2 h (0.32 Å)
Table 3. Torsion angles [°] of the aspartate ligands in 1 and 2 in the current study and of the Li and K compounds from the literature. For the meaning of the atom labels, see Figure 4 and Figure 5. Compound 2 has only one independent molecule and the label extension x is not used.
1 (mol. 1, x = 1)1 (mol. 2, x = 2)2 *Li [28]K [28]
ψ 1 O1x–C1x–C2x–N1x−0.1(2)−0.5(2)−0.53(12)−28.5(2)−32.7(3)
ψ 2 O2x–C1x–C2x–N1x177.49(16)176.17(16)178.78(8)153.12(15)150.84(17)
χ 1 N1x–C2x–C3x–C4x62.8(2)56.2(2)57.97(10)−70.7(2)−62.6(2)
χ 2 , 1 C2x–C3x–C4x–O3x13.7(2)16.8(3)15.48(13)3.0(2)−1.2(3)
χ 2 , 2 C2x–C3x–C4x–O4x−167.39(16)−163.77(16)−165.32(8)−175.23(18)178.82(18)
* Racemic crystal. Values are taken from the molecule in S-configuration.
Disclaimer/Publisher’s Note: The statements, opinions and data contained in all publications are solely those of the individual author(s) and contributor(s) and not of MDPI and/or the editor(s). MDPI and/or the editor(s) disclaim responsibility for any injury to people or property resulting from any ideas, methods, instructions or products referred to in the content.

