Article

Tailoring the Luminescence Properties of Strontium Aluminate Phosphors for Unique Smartphone Detectable Optical Tags

1
Institute of Solid State Physics, University of Latvia, Ķengaraga Iela 8, Latgales Priekšpilsēta, LV-1063 Rīga, Latvia
2
Centre de Recherche en Photonique, Université du Québec en Outaouais, 101 Rue St-Jean Bosco, Gatineau, QC J8Y 3G5, Canada
3
Central Laboratory for Applied Physics, BAS, 61 Blvd Sanct Peterburg, 4000 Plovdiv, Bulgaria
4
Centre de Développement des Technologies Avancées CDTA, Baba Hassen, Algiers 16303, Algeria
*
Author to whom correspondence should be addressed.
Crystals 2025, 15(5), 474; https://doi.org/10.3390/cryst15050474
Submission received: 14 April 2025 / Revised: 6 May 2025 / Accepted: 6 May 2025 / Published: 17 May 2025
(This article belongs to the Section Polycrystalline Ceramics)

Abstract

In this work, a precursor-driven tailoring of strontium aluminate phosphors doped with Eu2+ and Dy3+ to generate unique, batch-specific luminescent signatures suitable for smartphone-detectable anti-counterfeiting tags was developed. A microwave-assisted hydrothermal synthesis approach was employed to explore the impact of a wide range of alkaline hydroxide and carbonate precursors on the structure of strontium aluminate. The resulting materials exhibited distinct differences in crystalline phase composition, morphology, and trap depth distribution. A smartphone-based detection system was developed, enabling rapid identification of spectral fingerprints. This study demonstrates a viable strategy for embedding unique luminescent identifiers, offering a scalable solution for robust, low-cost anti-counterfeiting applications in both the spectral and the time domain.

1. Introduction

Luminescent phosphors, particularly Eu2+- and Dy3+-activated strontium aluminate, have long been recognized for their persistent afterglow and versatile applications ranging from safety signage and emergency displays to advanced imaging systems [1,2,3]. The ability of luminescent phosphors to absorb energy from both ultraviolet and visible light and to store and gradually release it over extended periods has spurred significant research into optimizing their synthesis, morphology, and luminescent characteristics. Traditionally synthesized via high-temperature solid-state methods, these methods often suffer from issues such as broad particle size distributions and high energy consumption [3,4,5,6,7,8,9,10]. In contrast, microwave-assisted hydrothermal synthesis offers a rapid, energy-efficient alternative that promotes uniform nucleation, fine control over particle size, and phase composition through careful manipulation of synthesis parameters [11].
Building on our previous work, the current study explores a novel concept of tailoring the luminescence properties of strontium aluminate phosphors via precursor selection to create distinct and nearly non-replicable optical fingerprints. By varying the chemical precursors, subtle yet reproducible differences in crystalline phase formation and particle morphology are introduced that directly influence the persistent luminescence behavior. These differences are not only of fundamental scientific interest but also hold significant promise for anti-counterfeiting applications. In this context, each batch of material—by virtue of its unique precursor-dependent luminescence signature—can serve as a secure tag that is extremely difficult to replicate [6,12,13]. For this and similar applications, the time response should be relatively short—of the order of seconds, and the possible individual characteristics of interest must be in the spectrum, the color, and the rise/decay time response [14].
To employ these tailored optical materials into a practical security feature, a low-cost portable detection system using a smartphone equipped with a diffraction grating has been designed. This setup enables rapid, in-field spectral analysis, where even minor variations in the luminescence profile can be discerned, thereby verifying authenticity with high confidence. The integration of such an accessible, low-cost detection device and our synthesis method paves the way for simple, affordable, and innovative anti-counterfeiting solutions, merging advanced materials science with everyday technology.
In this work, the structural and luminescent properties of Eu2+, Dy3+ co-doped strontium aluminate phosphors are tailored by choice of precursors to create unique emission profiles. By precisely controlling the synthesis parameters via a microwave-assisted hydrothermal method, fine-tuned luminescent behavior optimized for this application is achieved. The resulting materials demonstrate strong potential as secure, persistent optical tags detectable by a modified smartphone platform. This targeted design strategy not only introduces a novel functionality to strontium aluminate phosphors but also addresses the increasing demand for robust and accessible anti-counterfeiting technologies across diverse sectors.

2. Materials and Synthesis

2.1. Materials and Methods

The SrAl2O4 phosphors, activated with 1 at.% Eu2+, 2at.% Dy3+, and 15 at.% B3+, were synthesized with a microwave-assisted hydrothermal method. Boron was used as a flux, and it has been confirmed that boron incorporation in strontium aluminate materials contributes to the creation of trapping centers, leading to prolonged afterglow times [15]. The following precursors were chosen: strontium nitrate (Sr(NO3)2, >99.6% purity, Sigma-Aldrich, Steinheim, Germany), aluminum nitrate nonahydrate (Al(NO3)3∙9H2O, >99.6% purity, VWR Prolabo Chemicals, Lutterworth, UK), boric acid (H3BO3, >96% purity, Sigma-Aldrich), europium oxide (Eu2O3, >99.99% purity, Alfa Aesar, Heysham, UK), dysprosium oxide (Dy2O3, >99.99% purity, Alfa Aesar), nitric acid (HNO3, 65% ACS reagent, Sigma-Aldrich), deionized water, and ethanol (96%) were used for solution preparation and washing. Different chemical precursors were used to control the reaction environment, as follows: hydroxides KOH(≥84.0% purity, Sigma-Aldrich), LiOH (≥99.0% purity, Sigma-Aldrich), NaOH (≥98% purity, K ≤ 0.02%, Sigma-Aldrich), carbonates K2CO3 (ACS reagent, ≥99.0% purity, Sigma-Aldrich), Na2CO3 (ACS reagent, ≥99.0% purity, Sigma-Aldrich), (NH4)2CO3 (≥30.0% NH3 basis, ACS reagent, ≥99.0% purity, Sigma-Aldrich), HMTA (Hexamethylenetetramine, ≥99.0% purity, Sigma-Aldrich).

2.2. Synthesis Procedure

Eu2O3 and Dy2O3 powders were dissolved in nitric acid to form a 0.08 M solution. The ratio of rare earth oxide to nitric acid was kept at 1:20. Separately, a 0.36 M solution of boric acid was prepared for B3+ doping. Two separate solutions were prepared:
  • Cation solution: A mixture of strontium nitrate and aluminum nitrate (metal ion 0.2 M concentrate), along with Eu2+, Dy3+, and B3+ dopants in ratios of 1%, 2%, and 15%.
  • Anion solution: Each precursor (KOH, LiOH, NaOH, HMTA, K2CO3, Na2CO3, or (NH4)2CO3) was dissolved in 20 mL of DI water, maintaining a Sr2+ to OH ratio of 1:2 or Sr2+ to CO32− ratio of 1:1.
Both solutions were combined and placed in PTFE containers inside a grinder (Milestone synthWAVE) microwave reactor (frequency of 2.45 GHz with variable power from 0% to 100% (1.5 kW)). The reaction conditions were as follows: temperature 240 °C, duration 1 h 30 min, pressure 40 bar (N2 atmosphere), 30 min, heating time to 240 °C, constant stirring speed.
After cooling, the samples were washed several times with water and ethanol and dried at 80 °C for 72 h. The samples were subjected to pre-calcination—800 °C for 2 h in oxygen atmosphere (to remove organics) and final calcination—1200 °C for 2 h in a reducing atmosphere (95% Ar/5% H2).

3. Characterization Techniques and Results

3.1. X-Ray Diffraction (XRD)

X-ray diffraction (XRD) was performed with Rigaku MiniFlex 600 that uses a Cu target (Kα radiation 40 kV, 15 mA) for phase identification. The Rietveld analysis was performed with FullProf Analysis software, version 5.20 (supporting information in Appendix B), using crystallografic information files from Materials Project homepage (mp-3393, mp-3094, mp-5512). The morphology and elemental composition of dried powders were studied using the Tescan Lyra (Brno-Kohoutovice, Czech Republic) scanning electron microscope (SEM) in secondary electron (SE) and backscattered electron (BSE) mode at an accelerating voltage of 30.0 kV. For energy dispersive spectroscopy (EDS) analysis, Oxford X-Max 50 detector was used at an accelerating voltage of 30.0 kV at x magnification.
XRD patterns were measured using a Bragg–Brentano type diffractometer, Rigaku MiniFlex 600 (Rigaku Corp., Tokyo, Japan), equipped with a 600 W Cu anode X-ray tube operated at 40 kV and 15 mA. Qualitative phase composition was determined by comparing XRD data with ICCD database.
Figure 1 displays the XRD patterns of the same samples after thermal treatment at 1200 °C. During microwave heating, Sr and Al precursors form various compounds with low solubility in water, such as oxides, hydroxides, carbonates and oxyhydroxides, depending on the used precursors [7]. To obtain SrAl2O4, the resulting powders have to be annealed at higher temperatures, therefore, the ratio of Sr, Al, O, and dopants is dependent on the composition obtained before the annealing. The results show that, in all cases, monoclinic strontium aluminate (SrAl2O4) was formed. However, most samples also showed the presence of additional cubic strontium aluminate (Sr3Al2O6) and hexagonal strontium aluminate (Sr4Al14O25) phases. Based on the XRD data, it appears that the formation of monoclinic SrAl2O4 is favored in systems where strong bases—LiOH, KOH, and NaOH—are used for precipitation of metals (Figure 2).
In contrast, samples synthesized using carbonate precursors such as Na2CO3 and K2CO3, or HMTA, primarily formed cubic strontium aluminate (Sr3Al2O6) after calcination. Interestingly, the sample prepared with ammonium carbonate ((NH4)2CO3) contained nearly equal proportions of both SrAl2O4 and Sr3Al2O6 phases. The observed effect may be associated with the formation of metal carbonate intermediates during microwave heating, as both carbonates and HMTA produce CO32− ions by dissolving carbonate salts or by heating decomposition of HMTA.

3.2. Morphology (SEM—Scanning Electron Microscope)

The morphology of the final thermally treated samples was examined, and the SEM images are presented in Figure 3. After final calcination distinct differences in particle structure were observed depending on the precursor used during synthesis.
Samples prepared with hydroxide-based precursors exhibited irregular, plate-like particle shapes. These flattened structures were consistently observed across all hydroxide-containing samples, indicating that the precursor type strongly influenced the final particle morphology. The sample synthesized using LiOH also forms dense structures, as LiOH is often used as a flux for different ceramic materials [15,16].
In contrast, samples synthesized with carbonate-based precursors and HMTA (Figure 4) displayed more compact, quasi-spherical, and dense structures. SEM images revealed that these particles had a smoother surface and less-defined boundaries, giving them a ceramic-like appearance. This morphological change is attributed to the nature of the precursors, which affect particle growth dynamics during the microwave-assisted synthesis and subsequent high-temperature treatment. The presence of carbon residues in these samples may favor densification of these particles, forming ceramic-like structures.
Additionally, the presence of boron likely contributed to the formation of larger structures. During thermal treatment, boron acts as a flux—promoting material diffusion and enhancing both dopant diffusion into structure and sintering between particles. Here, we see that although boron was present in the synthesis, its effectiveness as a flux or structure modifier can depend heavily on other factors, such as precursor chemistry. As a result, the final materials show signs of softened particle boundaries and grain coalescence.

3.3. Energy Dispersive Spectroscopy (EDS)

For the acquisition of the EDS spectra, BSE mode is useful for identifying potentially inhomogeneous distribution of elements with different atomic numbers, as the brightest regions in the images could be rich in rare-earth elements, while the darkest regions are associated with areas where the concentrations of dopants are the lowest [17]. The elemental composition of all samples was compared by calculated Eu:Dy and Sr:Al weight ratios, as shown in Table 1. The reported standard deviations were calculated based on three repeated EDS measurements for each sample. The highest Sr:Al weight ratio was observed for samples S_HMTA (4.1) and S_Na2CO3 (3.2) that had the highest amount of Sr3AlO6 and Sr4Al14O25 phases (87.85% and 3.22% for S_HMTA and 90.09% and 0% for S_Na2CO3). Moreover, the lowest Sr:Al weight ratio was observed for sample S_KOH (1.2), which had the highest amount of SrAl2O4 (86.68%). By comparing these data with integrated PL relative intensities, samples S_LiOH, S_KOH, S_(NH4)2CO3, and S_NaOH with lowest Sr:Al weight ratio (1.4; 1.2; 1.6, and 2, respectively) exhibit the highest integrated PL intensity. We observed that the highest PL intensity can be achieved by reducing the Sr:Al weight ratio. By examining the Eu:Dy weight ratio, samples S_LiOH, S_K2CO3, and S_HMTA have a slightly higher Eu:Dy weight ratio (1.8; 1.7; 1.3, respectively), meaning that for these samples, Eu has been incorporated in a slightly higher ratio than in other cases. The main drawback of the EDS technique is that Eu and Dy quantification is limited due to low concentrations of both elements; therefore, it can be concluded that dopants were quite homogeneously incorporated in all samples. Due to the low concentration of dopants and the intrinsic limitations of EDS, the elemental ratios presented should be considered semi-quantitative; nevertheless, they provide useful comparative trends across the sample series. However, samples synthesized using carbonate precursors and HMTA contain little carbon residue even after annealing at high temperatures, as carbon peaks at 2.83 keV (corresponding to C Kα line) were observed in EDS spectra.

3.4. X-Ray Photoelectron Spectroscopy XPS

X-ray photoelectron spectroscopy (XPS) was performed on the samples, acquiring both wide-range survey spectra to determine overall elemental composition and high-resolution narrow scans of individual elements. The survey spectra analysis revealed different atomic percentages of Sr, Al, and O, confirming the presence of multiple phases in the sample. In Figure 5 is the comparison of the bulk phase composition determined by Rietveld refinement with the surface composition measured by XPS for a series of samples. For the Rietveld data, the phase percentages of Sr3Al2O6, SrAl2O4, and Sr4Al14O25 were used along with their stoichiometric ratios to calculate the overall atomic percentages of Sr, Al, and O. Calculated values were then directly compared to the corresponding XPS survey results. The results demonstrate that, although there are differences in the absolute values due to the surface sensitivity of XPS versus the bulk nature of the Rietveld analysis, the overall trends in the elemental ratios are consistent across the samples.
From the narrow scans, the most interesting case was the high-resolution O 1s narrow scan (Figure 6). It revealed that the O1s spectra in these samples can be de-convoluted into multiple components. In most cases, the primary component—at an effective maximum near 530.6–530.9 eV with FWHM values around 1.7–2.0 eV—is attributed to lattice oxygen in the strontium aluminate matrix, which is consistent with literature values for oxide materials [18,19,20]. Samples like S_NaOH and S_NH4CO3—which have a high fraction of SrAl2O4 according to the phase analysis—consistently show a prominent component at approximately 532.4–532.5 eV. In contrast, samples dominated by Sr3Al2O6, such as those prepared with K2CO3 and Na2CO3, exhibit a main peak near 530.6–530.9 eV. Additionally, a lower binding energy component, typically in the 529–530 eV range, is observed in several samples (NaOH, LiOH, and KOH) and may be linked to a minor phase or a defect-related oxygen species. These differences in effective peak positions and their relative areas suggest that each oxygen environment—in lattice oxygen of SrAl2O4 versus Sr3Al2O6 and the minor contribution from Sr4Al14O25—is reflected in a slight shift of the O 1s binding energy.
High-resolution Eu3d spectra were acquired for all samples (Figure 7), despite the low concentration of europium dopants, which renders quantitative analysis challenging. The relative positions of the maxima remain the same throughout all of the samples; however. the spectra are noisy. Therefore, it is impossible to say if there is any difference in the binding energies. Narrow scans reveal the presence of both Eu2+ and Eu3+ components across the sample series [21]. This observation suggests that, even under reducing synthesis conditions aimed at promoting the Eu2+ state, a small fraction of europium remains in the trivalent form, possibly due to incomplete reduction or surface oxidation effects.

3.5. TSL Analysis

Thermally stimulated luminescence (TSL) analysis was performed in the temperature range from 10 to 320 K to determine the trapping center depths of the samples (Figure 8). It is well established in the literature that the primary TSL peak for strontium aluminate-based luminophores typically occurs near room temperature, which we confirmed in our measurements. Additionally, several lower-temperature [22,23] peaks were also detected. To estimate the energies of the trapping centers corresponding to clearly distinguishable peaks, we employed the Arrhenius plot method [24,25]. This involved plotting the natural logarithm of luminescence intensity (ln(I)) against inverse temperature (1/T). For regions exhibiting clear peaks, linear segments in the Arrhenius plots were identifiable, enabling the calculation of trap activation energies directly from the slope. Specifically, the slope corresponds to the ratio E/k, where E represents the activation energy and k denotes Boltzmann’s constant. The calculated trapping center energies are summarized in Table 2. Each analyzed sample showed at least one dominant peak near room temperature, along with either additional lower-temperature peaks or a gradual increase in intensity without distinct exponential edges. In instances where the intensity increased gradually, the absence of clearly defined linear regions in the Arrhenius plots hindered accurate determination of trap depths. Such gradual intensity increases suggest the presence of overlapping or closely spaced shallow trapping centers or even a continuum of shallow energy states. This complexity aligns with previous literature, indicating that strontium aluminate luminophores commonly exhibit a distribution of closely spaced trapping center energies [2,10,26].
The trapping center depth, or trap depth, in SrAl2O4:Eu2+,Dy3+ and other persistent luminescence materials is a crucial parameter influencing their persistent luminescence properties. Trap depth refers to the energy required to release trapped charge carriers, typically electrons, which then recombine to produce prolonged afterglow. Studies by other researchers have reported varying trap depths for SrAl2O4:Eu2+,Dy3+ phosphors. For instance, one study determined an activation energy of approximately 0.47 eV, indicating that the material follows second-order kinetics in its luminescence process [27]. Another study found a trap depth of 0.37 eV for SrAl2O4:Eu2+,Dy3+ phosphors [28]. Thermoluminescence (TL) studies on Eu,Dy co-doped Sr4Al14O25 have identified at least two distinct trapping centers, with the depth 0.6–0.7 eV and about 0.5–0.6 eV for the effective traps [29,30]. Fewer explicit trap energy values are reported in the literature for this Sr3Al2O6 phase, but it is generally inferred that the trap levels fall in a similar range (~0.5–0.7 eV). The trapping center depth is closely related to the afterglow duration [29,30]. The optimal trap depth for a very long afterglow is considered to be around 0.6 eV; however, for the application of luminescent, smartphone-readable tags, the trapping centers should be more shallow.

4. Smartphone Measurements

4.1. Smartphone-Based Contactless Sensing

The basic motive behind this research is to create optically distinguishable phosphors featuring unique properties to be used as markers for security and anti-counterfeiting applications or sensors with contactless smartphone-based interrogation of time, spectral and intensity changes [31,32,33,34,35,36]. The 2D image sensor of smartphones allows the recognition and analysis of images and patterns such as QR codes [37,38]. This approach allows multi-level encoding for enhancing security. The simplest level consists in the spatial encoding like the 1D or 2D bar-code patterns detectable under white light illumination. The addition of colors from luminescent materials upon UV excitation [37,38] adds another level of security. These can be both narrow-band fluorescent [3,39] or broader band phosphorescent [31] materials. The parallel measurement of the fluorescence time response and the time decay constant [40], for example, adds another strictly individual level of encoding. Unfortunately, the time response of fluorescent materials is shorter than a millisecond, needs more complicated detection units, and cannot be used in the case of far more affordable smartphone interrogation. Phosphorescent time responses, on the contrary, can be fine-tuned to be of the order of seconds, which makes them perfectly suited for smartphone detection since most mobile phones can record at 30 FPS and 60 FPS rates, which means a measurement each 33.3 ms or 16.7 ms. Thus, the individual characteristics of the time response can accurately be recovered, which in turn makes them practically meaningful. In the general case, combinations of different materials can be used to achieve higher levels of security [41]. In view of the above considerations, our attention is focused on the capabilities a smartphone offers to correctly identify the spectral and time responses of the synthesized samples as well as to what a degree their individual characteristics as detectable by a smartphone are distinguishable from one another.

4.2. Spectral Measurements

4.2.1. Measurement Equipment

We next perform measurements on the spectral and time-dependent responses of the synthesized and above-characterized samples. The spectral measurements were carried out using a standard fiber spectrometer (QE 65000, Ocean Optics, USA) and a smartphone (Xiaomi, 11T Pro, China and Samsung, Galaxy A51, Republic of Korea). The sources used for the spectral distribution measurement were a laser-driven white light (Energetiq, Japan) source in combination with an Ocean Optics monochromator, which allow scanning of the excitation wavelength from 220 nm up to 900 nm at 1 nm increments. The intensity of the light exciting the phosphor samples was varied using an Ocean Optics optical fiber attenuator. Large core (200 μm to 800 μm) quartz-polymer optical fibers were used to excite the samples, which were placed in an array of 0.8 mm holes spaced at 2 mm in a metal sheet. They were illuminated from one side, and the luminescence was measured on the other side of the sample. Also, a 1 × 2 optical fiber splitter was used for reference measurements.
For the time–response measurements, we used 380 nm LED in combination with a glass rod serving as a cylindrical lens, which allowed us to simultaneously excite all the samples with the same source and intensity.
The absolute power measurements were carried out with an optical fiber power meter Hewlett Packard, USA (HP 8152A,), which allows calibrated measurements in the 450 nm to 1020 nm range (optical head 81520A) and a Thorlabs, NJ, USA, optical power/energy meter (PM100D) with a pyroelectric probe (S401C) featuring a flat sensitivity in the 190 nm to 20 μm spectral range.

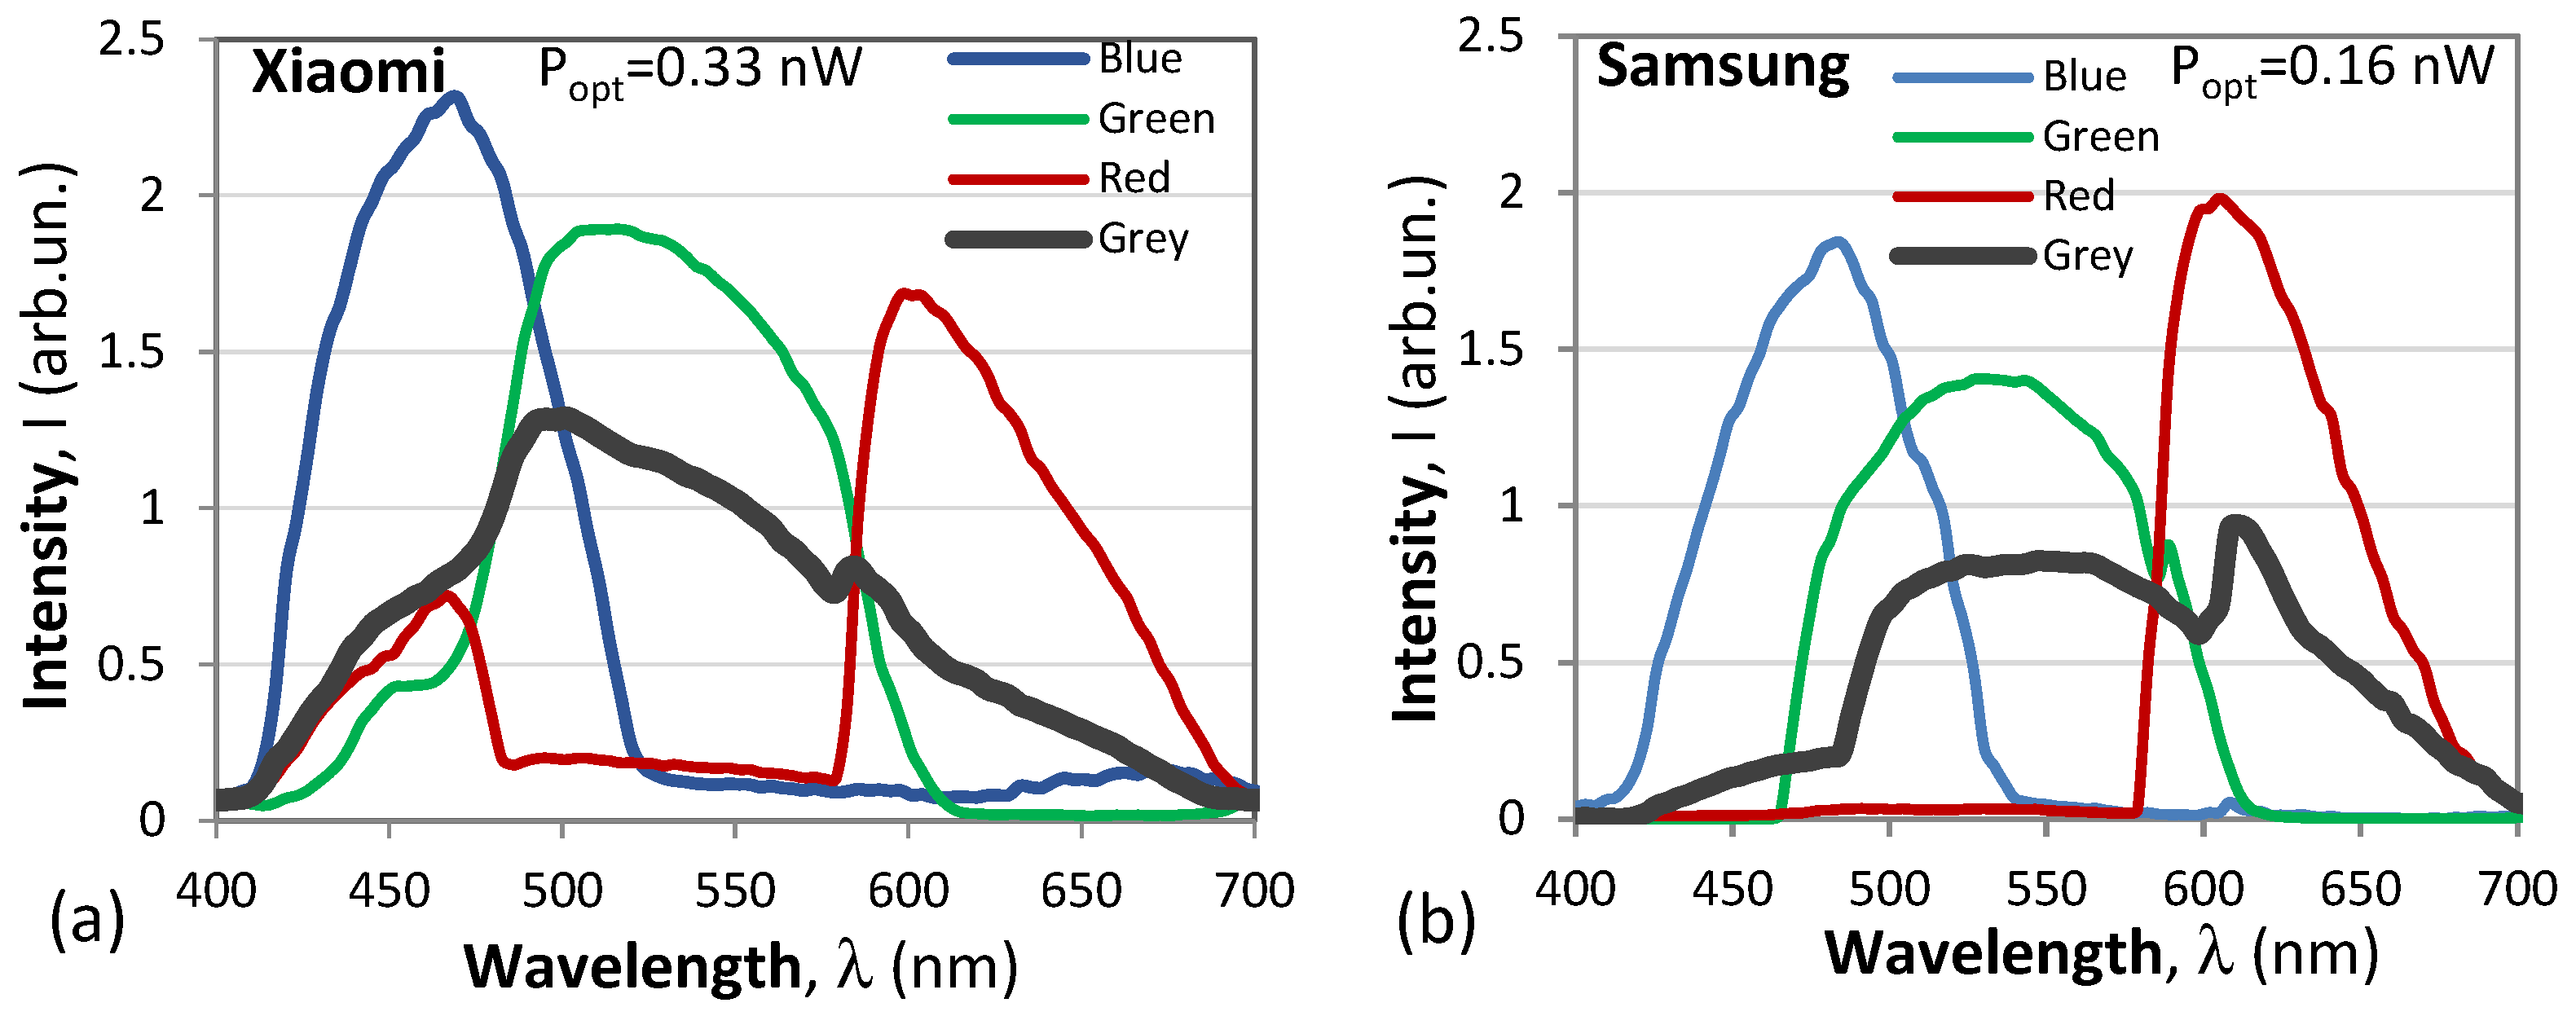
4.2.2. Smartphone Characterization

We first performed measurements to characterize the smartphone as a spectral measurement instrument using the following procedure. The monochromator was scanned from 390 nm to 710 nm, and the light was launched into the fiber attenuator followed by the 1 × 2 splitter. The intensity of the light coming out from one of the output fibers was recorded by the smartphone while from the other was connected to the optical power meter. As the wavelength varied in time, the video image was analyzed and the recorded intensity in the R, G, and B pixels as well as for the signal in grey were separately measured. This procedure was repeated for different levels of the signals set up with the attenuator and controlled at 500 nm with the power meter. Figure 9 shows the recovered signals from the blue, green, and red pixels as well as the intensity after the images were converted to grey.
As is seen, these resultant spectra in grey are rather uneven and show peaks at wavelengths of maximum transmission for some of the color pixels as is the case with the red pixels in the Samsung phone, or at the wavelengths of the intersection of the transmission curves of B with G and G with R as is the case for the Xiaomi smartphone. The measured RGB pixel spectral distributions shown above depend on the power level of the signal being measured. Figure 10 shows how the resultant transmission spectrum changes as the power level of the light was varied with the attenuator. The power levels in nW are shown in the legends. Clearly seen is that the overall transmission spectra of both smartphones change considerably above certain power levels and tend to reach some saturation.
In Figure 11a, we present the total power as measured by the smartphones in counts over the 400 nm to 700 nm spectral range versus the optical power as measured by the power meter at the reference 500 nm wavelength. This figure shows that although the filter responses may be different, both cameras exhibit a marked nonlinearity, which over the measurement range can be approximated sufficiently well with a logarithmic curve.
Since the responses shown in Figure 9 and Figure 10 were measured without corrections for the spectral power distribution of the source, the spectral distribution at the monochromator output was measured using the pyroelectric probe of the power meter in the 220 nm to 720 nm range over 5 nm intervals, and the normalized power is presented in Figure 12b in blue dots. In red dots, we present the normalized intensity at each of the wavelengths as calculated from the response of the Ocean Optics spectrometer used. The distribution as measured by the pyroelectric probe represents the true spectral distribution at the monochromator output that is contained also in the RGB responses and all further spectral measurements. We clearly note the peak at 470 nm in the blue, which is very close to the maxima of the blue pixel spectral responses of both smartphones.

4.2.3. Smartphone Spectral Measurements

We first illuminated the linear array with the samples with a 400 nm LED whose light is focused along a line using a glass rod and observe simultaneously the individual phosphorescence and the corresponding spectra. Since the spectra of the samples are in the blue-green range, we prefer the Xiaomi 11T Pro smartphone whose transmission spectrum exhibits weaker irregularity. In Figure 12a, we show the images of the seven samples and their spectra as obtained with the smartphone. As seen, the colors of the phosphorescent samples (#1 to #7) are different and correspondingly so are their spectra, shown to the right. Figure 12b presents the spectral distributions derived from the spectra in Figure 12a. As the excitation and the simultaneous measurement conditions are identical, we can correctly compare the spectra. As seen, sample #3 exhibits the strongest phosphorescence followed by #7, while #4 exhibits the weakest. Sample #1 exhibits medium intensity, while the rest ranked as follows: #2, #5, and #6. Both visibly and by distribution, the samples are different.
To obtain a more detailed picture about the individual phosphorescent spectra, we measure the 3D excitation–emission spectra using both a fiber optic spectrometer and a smartphone. For the spectrometer, the wavelength varied between 220 nm and 500 nm with a 5 nm increment, while for the smartphone measurements, the increment was 10 nm. In Figure 13, each row of three spectra refers to one sample. The fiber spectrometer 3D spectra are the first in each row. Two versions of smartphone spectra are shown. Those in the middle are at a lower signal level, while those to the right are at a higher level of the signal. Comparing the 3D spectra measured by the fiber spectrometer, we see that samples #1 (HTMA), #5 (K2CO3), and #6 (Na2CO3) are very similar to one another, as are #2 and #7. On the other hand, the strongest (#3) and weakest (#4) phosphorescent samples exhibit distinctly different 3D spectra.
Table 3 summarizes the maximum efficiency excitation (λ′) and emission (λ) wavelengths, corresponding to the maximum point on the 3D plots. Transition from blue to red correspond to an increase of the intensity.
The 3D excitation/emission spectra evidently depend on the level of the signal (or alternatively on the integration (exposure) time and on the non-uniformity of the smartphone spectral transmission (see Figure 11). A stronger signal causes saturation and seriously deforms the spectral response of the smartphone spectrometer in way that broadens the 3D topographic image. The irregularity of the transmission spectrum causes the appearance of false maxima, especially if saturation effects are added. A comparison between the maxima of the transmission spectra in the 580–600 nm range from Figure 11 and the maxima in that range from the 3D images from Figure 14 obtained with a smartphone reveals the presence of the false maxima.
Thus, at low level phosphorescence (shorter exposure duration), the 3D spectra are closer to those measured with a standard spectrometer. However, the position of the emission maxima is not affected by the signal level, which means that if a correction for the transmission irregularities of the smartphone camera is used, the shape of the spectrum of a particular sample at a given excitation can be correctly identified. In all cases, saturation effects lead to an apparent broadening of the excitation (Δλ’) and emission (Δλ) bandwidths.

4.3. Time-Dependent Responses

4.3.1. Smartphone Measurements of the Time Responses

We are next interested in the degree to which the time responses of the samples under study differ from one another. All time responses were taken using the Xiaomi 11TPro smartphone at a 33FPS rate (Δt = 33.3 ms). The intensity of the excitation and the phosphorescence was kept sufficiently low to avoid non-linearity and saturation of the smartphone response (see Figure 12b). As we are using power law approximations for the rise and decay time responses of the luminescence intensity, we present them and the physical meaning of the parameters that describe it in Appendix A.

4.3.2. Experimental Results

Figure 15a–g presents the normalized rise/decay time responses with ON/OFF excitation at 380 nm LED excitation modulated with rectangular pulses of period T = 2 s and duty factors η = 10%, 30%, 50%, 70%, and 90%.
In Figure 14a–g, the double red arrow indicates the phosphorescence level ΔuOFF for η = 50%, i.e., the relative share of phosphorescence of the sample, while the dashed arrow indicates the rise of this relative share as the duration of the excitation increases with the duty cycle.
A comparison between the responses permits the following observations to be made:
(1)
The relative share of phosphorescence ΔuOFF of the samples are clearly different and, in all cases, rise with the duty cycle, i.e., with the excitation duration τ.
(2)
A fast rise response implies a fast drop in the luminescence, i.e., a lower ΔuOFF.
(3)
The sample #4 (NaOH) with the weakest luminescence also has the lowest share of phosphorescence (≈11%). Sample #3 (KOH) with the strongest luminescence has the second low share of phosphorescence (≈22%). The rest of the samples exhibit a phosphorescence share between 40% and 52%.
As the curves shown do not reveal the type of dependence, we present a double Log plot of the 1-uON(t) and the uOFF(t) vs. time for η = 10% and 50% presented in Figure 16a–g.
The comparison of the plots reveals several important observations:
(1)
The Log[1-uON(t)] and Log[uOFF(t)] lines get closer as the duty cycle increases, which is due to the greater probability of populating the traps.
(2)
Most of the samples exhibit a change of the linear drop in the double Log plot, meaning that the rate of decay changes, and as the slope increases, this means that some critical time interval Δtc = 0.2 s–0.3 s (indicated in Figure 16) after switching OFF the excitation the phosphorescence decay speeds up. This critical duration is the same for both ON and OFF responses. The change implies that after this critical moment, the probability of electrons getting released increases.
(3)
For sample #3 (KOH) with the strongest luminescence and the lowest phosphorescence share, this change of decay rate is the weakest.
(4)
Sample #4 (NaOH) exhibits a specific time decay response. Initially, it drops very fast to a low level (Figure 16d) then slowly recovers to a phosphorescence level ≤3% followed by a slow decay after one second. This behavior was observed for all duty cycles and is indicative of some internal conversion dynamics.
Figure 16 below summarizes the dependence of the rise and decay power law parameters A0, a0 and A, α on the duty cycle for t ≤ Δtc, which were revealed after power law fitting was performed for the dependences shown in Figure 15 and repeated for all duty cycles.
The general observations that can be formulated are as follows:
(1)
As the duty cycle, and hence the excitation duration, increases, the A and α increase, which means that the relative share of phosphorescence immediately prior to switching off the excitation increases. However, after switching off, the decay rate increases with the duty cycle.
(2)
For the rise response, the opposite is true because of the periodic excitation. The longer the duration τ (duty cycle increases), the smaller the relative share of phosphorescence to saturation level, i.e., the less traps remain to be populated.
In Table 4 below, we summarize the most important characteristics of the samples as described by the relative share of phosphorescence ΔuOFF prior to switching excitation off for a 50% duty cycle at room temperature and the decay power law parameters A, α.
Excluding sample #4 with the weakest luminescence and phosphorescence share, the rest of the samples can be classified as follows:
(1)
The product of the luminescence intensity L (in counts) and the relative share of phosphorescence ΔuOFF yield the phosphorescence intensity P immediately after switching off the excitation source
P = u O F F L
(2)
The phosphorescent intensity of the samples is shown on the last line so we can rank them as follows:
#5 (4890), #6 (4060), #2 (3570), #7 (3400) #3 (2350), #1 (1970), and #4 (155)
(3)
Looking at their decay rate as expressed by α, we can arrange them in the following from slowest to fastest order
#3 (−0.094), #7 (−0.173), #5 (−0.185), #6 (−0.192), #4 (−0.218), #2 (−0.268), #1 (−0.334)
(4)
The three samples that appear among the first four in the above two arrangements are: #5 (K2CO3), #6 (Na2CO3), #7 (NH4)2CO3). With Reference to Table 2, we find that these samples have comparable trapping center depths.

4.4. Temperature Dependent Responses

We finally perform an estimation of the sensitivity to temperature changes of the samples under study. The samples were cooled/heated using a thermoelectric cooler from 0 to 100 °C. In Figure 17, we show a selection of the time responses at three temperatures: 0 °C, 25 °C, and 50 °C for a period modulation of T = 2 s, η = 0.5 and excitation at 380 nm.
The curves shown in the figures confirm the following characteristics already outlined in Section 4.2.1:
(1)
The overall intensity of luminescence decreases with temperature (see Equation (A1)). For the normalized responses, the decrease is ΔuT over a temperature interval ΔT from which the temperature sensitivities are calculated and presented in Table 5.
(2)
As temperature increases both the rise and decay responses slow down i.e., α0 and α diminish.
(3)
The relative share of phosphorescence ΔuOFF tends to increase
If temperature is measured as the decrease of intensity with temperature I (T), the ranking of the samples for temperature sensing applications would be as follows:
#1 (1.08%/K), #2 (0.98%/K), #3 (0.98%/K) and #4 (0.86%/K)
These most temperature-sensitive samples are from the first group from Table 2 and are characterized by lower trapping center depths and are suited for contactless sensing applications [31,36].
A comparison of the temperature-dependent time-responses clearly indicate that samples, which at room temperature appear quite similar like #1 and #2 or #5 and #6, have a more distinct behavior at other temperatures.

5. Discussion

A clear outcome of this study is the strong relationship between precursor choice, the distribution of trapping center depths, and the time-resolved luminescence behavior of the phosphors. The TSL data reveal that different precursor chemistries produce distinct trap depth profiles, which in turn govern the rise/decay kinetics of the luminescence and the fraction of emission due to long-lived phosphorescence. Specifically, hydroxide-based precursors (LiOH, KOH, NaOH) tended to yield predominantly shallow traps (on the order of ~0.05–0.11 eV), whereas carbonate-based precursors (K2CO3, Na2CO3, (NH4)2CO3) introduced deeper traps (~0.15–0.19 eV). For example, the KOH-derived sample (#3) exhibited a single shallow trap around 0.055 eV. The HMTA-derived sample (#1) interestingly displayed a very broad trap depth distribution. This precursor-driven trap disparity is likely rooted in the different phase compositions and defect chemistries each route produces. As noted, the strong bases favor the monoclinic SrAl2O4 phase—which may host primarily shallower trap sites—whereas carbonates stabilize a different phase or induce defects that create deeper energetic traps. The group of samples prepared with hydroxides showed lower trap energies and were more thermally sensitive (their luminescence output changed more with temperature), consistent with shallower traps that empty more readily. These trap depth differences have a direct impact on the luminescence kinetics, manifested in the rise/decay profiles and the share of phosphorescent (delayed) emission. In general, shallower traps release charge carriers easily at room temperature, leading to faster decay of afterglow, whereas deeper traps retain carriers longer, prolonging the phosphorescence. Our time-resolved measurements corroborate this well-known trend: samples with deeper trap distributions exhibited slower decays and a larger fraction of their emission as afterglow. The carbonate-precursor phosphors showed notably extended phosphorescence. For instance, the K2CO3-derived sample (#5) produced a longer-lasting afterglow (i.e., a slow decay tail), in contrast to the KOH-derived sample (#3), which faded much more rapidly. Quantitatively, the KOH sample’s emission was dominated by prompt fluorescence with only ~22% of the intensity contributed by long-lived phosphorescence. In comparison, the majority of other samples—including the carbonate-based ones—exhibited a phosphorescence share on the order of 40–52%, indicating that nearly half of their emitted light was coming from delayed release of trapped carriers. The Na2CO3 and (NH4)2CO3 samples (both with ~0.15 eV traps) illustrate this point well: they demonstrated very similar decay behavior and phosphorescent fractions, reflecting their nearly identical trap depths. Conversely, the LiOH sample (#2) and the shallow-trapped NaOH sample (#4) showed more rapid decay components and lower afterglow, as expected for materials dominated by shallow traps. We observed a general trade-off between rise speed and afterglow—materials that built up emission quickly under excitation also lost their emission quickly once excitation ceased. This is evidenced by sample #3 (KOH), which had the fastest rise and highest initial brightness but then dropped off the fastest (yielding a low afterglow share), whereas samples with slower, trap-limited rise (due to carrier capture into deeper traps) maintained a higher post-excitation luminescence. This behavior is consistent with trap-mediated dynamics: when traps are shallow or few, most excited carriers recombine immediately (bright fast fluorescence, little storage), but when ample deeper traps are present, a significant portion of carriers detour into long-lived trap states, reducing immediate emission but sustaining a slower release over time. Notably, the NaOH-derived sample (#4) was something of an outlier—despite containing a moderately deep trap (~0.16 eV), it displayed the weakest overall luminescence and an unusually low phosphorescent share (~11%). It also exhibited a clearly different TSL behavior compared to the others, revealing no luminescence up to 200 K. Its decay curve dropped almost to zero immediately after excitation, then showed a slight delayed recovery (a very dim 3% residual phosphorescence) before decaying slowly. This anomalous behavior suggests inefficient trap filling or competitive non-radiative losses in that particular sample, underlining that trap depth is not the sole factor—trap population and trap-release dynamics (which can be affected by defect type or dopant distribution) also play a role. Nonetheless, excluding such anomalies, a clear trend emerges: samples with similar trap energies tend to exhibit similar time–response parameters. For example, both carbonate-derived samples #6 and #7 (trap ~0.15 eV) not only have comparable afterglow durations, but also similar phosphorescence fractions and decay exponents in their time profiles. Likewise, the two samples incorporating ~0.17–0.18 eV traps (the HMTA sample #1 and K2CO3 sample #5) each show a pronounced long-lived emission component attributable to those deeper traps. In essence, the trap depth distribution—as tailored by the synthesis route—serves as a fingerprint that governs how quickly the luminescence rises to equilibrium under excitation and how it decays afterward. On a materials level, these findings provide a deeper explanation of how the synthesis route impacts functional luminescent performance, which is crucial for optical tagging applications. Different precursor chemistries lead to different phase assemblages and microstructures, which establish different sets of trap sites (defects, dopant environments) within the crystal.
Thus, we conclude that the ability to tune trap depth via precursor selection allows fine control over afterglow duration and intensity. For example, a tag material made with a K2CO3 precursor will have a characteristically slower dimming curve (deeper traps) than one made with KOH, providing an extra dimension (time profile) to differentiate tag signatures even if their emission spectra are similar. We effectively demonstrate that by varying synthesis precursors we can engineer the trap landscape and thereby modulate the time-dependent luminescent signature of the phosphor. This is highly beneficial for anti-counterfeiting optical tags, as it means each batch’s unique precursor recipe can endow a distinctive combination of immediate fluorescence and delayed phosphorescence. Such multi-component luminescence behavior can be captured and identified using a smartphone, adding robustness against counterfeit replication.
The feasibility of employing smartphone spectroscopy for detecting spectral, time-, and temperature-dependent fingerprints was studied, and the results demonstrate promising potential for real-world anti-counterfeiting applications, although future studies should address precision and possible environmental interferences. Important issues and effects related to spectral distortions and non-linearity of response of different smartphone models were investigated and show the need for corrections to be used in order to recover the original characteristics of the sample. The spectral, time-, and temperature-dependent characteristics of the different samples were found to be strictly individual and recognizable within seconds, within which color differences and time responses are recognizable directly without a dispersive element. The addition of the simplest and lowest cost possible transmission grating offers additional capabilities of higher-level spectral analysis. Also, we demonstrate that because the smartphone camera is a 2D detector, simultaneous time and spectral analysis of a large number of tags is fully realizable.

Author Contributions

Conceptualization, T.E. and V.V.; methodology, K.K. and K.N.; software, E.E.; validation, V.V. and T.E.; formal analysis, S.F. and M.D.; investigation, E.E. and S.F.; resources, T.E. and V.V.; data curation, K.K., S.F., and K.N.; writing—original draft preparation, T.E. and V.V.; writing—review and editing, E.E., M.D., and K.N.; visualization T.E. and V.V.; supervision, T.E. and V.V. All authors have read and agreed to the published version of the manuscript.

Funding

Financial support provided by Fundamental and applied Research project Nr.LZP-2023/1–0521 “Light Activated 4D Printed Materials for Vascular Tissue Engineering” and realized at the Institute of Solid State Physics, University of Latvia is greatly acknowledged. M. D. and V.V. thank the support from MikroTik patron, a donation (No. 40012) administrated by the University of Latvia Foundation. The Institute of Solid-State Physics, University of Latvia as the Center of Excellence has received funding from the European Union’s Horizon 2020 Framework Program H2020-WIDESPREAD-01–2016–2017-TeamingPhase2 under grant agreement No. 739508, project CAMART2. The support of NSERC Canada through a Development Discovery Grants 2025 is also acknowledged.

Data Availability Statement

Data are available upon request.

Conflicts of Interest

The authors declare no conflicts of interest.

Appendix A. Power Law Approximation for the Time Responses

Appendix A.1. The Power Law Approximations

In the general case, the time responses of phosphorescent materials depend on the temperature, the excitation intensity of the sample [29], the duration of the excitation, the period if periodic, the excitation wavelength, and on the emission wavelength [32].
Figure 15 illustrates how the ON/OFF rise/decay time responses of phosphorescent strontium aluminates change with increase of temperature (T′ > T). The dependence of the luminescence intensity on the temperature I(T) and that of the ON/OFF rise/decay time responses on temperature and the duty cycle R(t,η,T) and D(t,η,T) are given below [14,31,32,35,36] as:
I ( T ) = I ( 0 ) 1 + A e x p E k T             A = Γ 0 Γ ν
R t , η , T = R η , T 1 A 0 η , T t α 0 η , T
D t , η , T = R η , T A η , T t α η , T
The normalized ON (rise) and OFF (decay) can be defined as [31,32]:
R t , η , T R η , T = u O N t , η , T = 1 A 0 η , T t α 0 η , T
D t , η , T R η , T = u O F F t , η , T = A η , T t α η , T
Thus, taking in a double log presentation the normalised rise (1-ON) and decay (OFF) responses are casted as:
l o g 1 u O N ( t ) = l o g A 0 α 0 l o g t
l o g u O F F ( t ) = l o g A α l o g t
Figure A1. Normalized ON/OFF time responses: (a) R(t) and D(t) responses and their temperature dependence. Red lines stand for fast changes, blue lines for measurable slower changes; (b) the double log plot of typical 1-uON (red line) and uOFF (blue line) vs. time responses.
Crystals 15 00474 g0a1
To understand the time responses and the physical meaning beyond the parameters of the power law approximations used, we first note that the observed luminescence contains a fast fluorescence component lasting typically much less than a millisecond, which cannot be detected with a standard or with a smartphone spectrometer and is followed by a slower phosphorescent tail that lasts from tens of milliseconds to hours. Equations (A1)–(A4) above describe the phosphorescence response after some initial moment t0, which is typically larger than a millisecond. If taken by a spectrometer a measurement of the time response of the spectrum can be performed at best each 170 ms, while with a phone each 33.3 ms at a 30 FPS rate or each 16.7 ms at 60 FPS rate. So, practically the phosphorescent part of the luminescence is measured using both methods.
The samples under study have been excited by rectangular pulses of duration τ and a period T. The duty cycle η is then
η = τ T

Appendix A.2. Physical Meaning of the Power Law Parameters

The physical meaning of the A0, α0 and A, α power law parameters are as follows [32,35].
A. 
The rise phase. Prior to the rise phase when the excitation is ON, no luminescence exists as the Eu ions are not excited. As the excitation is ON, the first luminescence to be observed within durations less than a millisecond is the fluorescence, which is caused by transitions form the excited Eu2+* to the ground state. With some probability, excited electrons absorb additional thermal energy kT and pass to the conduction zone where they are captured by traps of random location and energy depth. After some time delay, trapped electrons are released by thermal fluctuations and after encountering an ionized Eu center relax to ground level releasing a photon. The delayed emission constitutes the phosphorescence share. At the first moment t0 that luminescence of the sample is measured, the level uON,0 = uON(t0) is mostly due to fluorescence. As fluorescence is a much faster process, at a constant excitation rate (rectangular pulses), its share remains constant. Therefore, we can consider that the remaining 1-uON,0 is actually the relative share of phosphorescence. This level is indicated in Figure 15 and determined from Equation (A3a) as:
u O N = 1 u O N t 0 = A 0 . t 0 α 0
Thus, the higher A0, the higher the relative share of phosphorescence at the initial moment of measurement t0. A larger power parameter α0 means that the phosphorescence share will increase faster (Figure 10a) and the rise to saturation level R = R(t >> t0) = R(t → ∞). In Figure 10b, a larger A0 and a lower α0 will appear as the upper red 1-ON line representing A0 and α0. Lower A0 and higher α0 values will be represented as the red 1-ON line with parameters A0 and α0.
B. 
The decay phase. At the end of the ON phase, a certain proportion of the traps in the material have captured electrons from the conduction band that are still not released. Since no excitation is present, we have only a process of electron release and a delayed emission—i.e., phosphorescence. Immediately after the switching OFF of the source, the fast drop to the level D0 = D(t0) is caused by fluorescence, which means that the quantity 1-uOFFN,0 can be used as a measure of the relative share of fluorescence, and correspondingly the relative share of phosphorescence ΔuOFF is:
u O F F = u O F F t 0 = A t 0 α
Thus, the higher A, the higher the initial level of phosphorescence from which it decays to zero, and the higher α, the faster the decay. In Figure 10b, in blue lines a higher A′ and a lower α′ are described by the upper line meaning a higher level of phosphorescence with a slower decay, while a lower A″ and a higher α″ are presented by a line that describes a lower phosphorescence that decays faster.

Appendix B. Rietveld Refinement Results

This table summarizes the results of Rietveld refinement for the synthesized Eu,Dy co-doped strontium aluminate samples prepared with different precursors. The relative weight fractions of the identified phases (Sr4Al14O25, SrAl2O4, and Sr3Al2O6) are presented for each sample. Bragg R-factors were not included in the final table, as the semi-quantitative purpose of the refinement focuses primarily on phase identification and estimation rather than detailed profile fitting accuracy, especially in the context of multiphase, low-symmetry systems with overlapping peaks. All samples show consistent lattice parameters for Sr4Al14O25, suggesting structural stability across the synthesis conditions.
Table A1. The summary of Rietveld analysis on the samples.
SamplePhaseSpace GroupCrystal
System
a (Å)b (Å)c (Å)Weight Fraction (%)
KOHSr4Al14O25Pmma (No. 51)Orthorhombic4.88238.480624.76970.48
KOHSrAl2O4P21 (No. 4)Monoclinic5.16218.81568.453512.85
KOHSr3Al2O6Pa-3 (No. 205)Cubic15.999915.999915.999986.68
NH4CO3Sr4Al14O25Pmma (No. 51)Orthorhombic4.88238.480624.76978.87
NH4CO3SrAl2O4P21 (No. 4)Monoclinic5.16218.81568.453552.08
NH4CO3Sr3Al2O6Pa-3 (No. 205)Cubic15.999915.999915.999939.05
LiOHSr4Al14O25Pmma (No. 51)Orthorhombic4.88238.480624.76973.7
LiOHSrAl2O4P21 (No. 4)Monoclinic5.16218.81568.453560.08
LiOHSr3Al2O6Pa-3 (No. 205)Cubic15.999915.999915.999936.22
Na2CO3Sr4Al14O25Pmma (No. 51)Orthorhombic4.88238.480624.76970.0
Na2CO3SrAl2O4P21 (No. 4)Monoclinic5.16218.81568.45359.91
Na2CO3Sr3Al2O6Pa-3 (No. 205)Cubic15.999915.999915.999990.09
NaOHSr4Al14O25Pmma (No. 51)Orthorhombic4.88238.480624.769717.32
NaOHSrAl2O4P21 (No. 4)Monoclinic5.16218.81568.453518.4
NaOHSr3Al2O6Pa-3 (No. 205)Cubic15.999915.999915.999964.27

References

  1. Liepina, V.; Millers, D.; Smits, K. Tunneling luminescence in long lasting afterglow of SrAl2O4:Eu,Dy. J. Lumin. 2017, 185, 151–154. [Google Scholar] [CrossRef]
  2. Vitola, V.; Millers, D.; Bite, I.; Smits, K.; Spustaka, A. Recent progress in understanding the persistent luminescence in SrAl2O4:Eu,Dy. Mater. Sci. Technol. 2019, 35, 1661–1677. [Google Scholar] [CrossRef]
  3. Prasanth, D.; Sunitha, D.V.; Kumar, P.R.; Darshan, G.P. Design strategies, luminescence mechanisms, and solid-state lighting applications of lanthanide-doped phosphorescent materials. ChemPhysMater 2025, 4, 108–123. [Google Scholar] [CrossRef]
  4. Sharma, V.; Nigam, S.; Sudarsan, V.; Vatsa, R.K. High temperature stabilization of Y2Sn2O7: Eu luminescent nanoparticles—A facile synthesis. J. Lumin. 2016, 179, 248–253. [Google Scholar] [CrossRef]
  5. Laganovska, K.; Vitola, V.; Einbergs, E.; Bite, I.; Zolotarjovs, A.; Leimane, M.; Tunens, G.; Smits, K. Impact of Europium and Niobium Doping on Hafnium Oxide (HfO2): Comparative Analysis of Sol–Gel and Combustion Synthesis Methods. Ceramics 2024, 7, 15-28. [Google Scholar] [CrossRef]
  6. Gao, P.; Wang, J.; Wu, J.; Xu, Q.; Yang, L.; Liu, Q.; Qi, Y.; Li, Z. Preparation of SrAl2O4: Eu2+, Dy3+ Powder by Combustion Method and Application in Anticounterfeiting. Coatings 2023, 13, 808. [Google Scholar] [CrossRef]
  7. Xue, Z.; Deng, S.; Liu, Y.; Lei, B.; Xiao, Y.; Zheng, M. Synthesis and luminescence properties of SrAl2O4:Eu2+,Dy3+ hollow microspheres via a solvothermal co-precipitation method. J. Rare Earths 2013, 31, 241–246. [Google Scholar] [CrossRef]
  8. Doke, G.; Antuzevics, A.; Krieke, G.; Kalnina, A.; Sarakovskis, A. Novel broadband near-infrared emitting long afterglow phosphor MgGeO3: Cr3+. J. Alloys Compd. 2022, 918, 165768. [Google Scholar] [CrossRef]
  9. Doke, G.; Krieke, G.; Antuzevics, A.; Sarakovskis, A.; Berzina, B. Optical properties of red-emitting long afterglow phosphor Mg2Si1−xGexO4: Mn2+/Mn4+. Opt. Mater. 2023, 137, 113500. [Google Scholar] [CrossRef]
  10. Mushtaq, U.; Ayoub, I.; Kumar, V.; Sharma, V.; Swart, H.C.; Chamanehpour, E.; Rubahn, H.-G.; Mishra, Y.K. Persistent luminescent nanophosphors for applications in cancer theranostics, biomedical, imaging and security. Mater. Today Bio 2023, 23, 100860. [Google Scholar] [CrossRef]
  11. Bite, I.; Laganovska, K.; Vanags, E.; Vitola, V. Synthesis and characterization of translucent hafnia ceramics. Materialia 2023, 32, 101887. [Google Scholar] [CrossRef]
  12. Eftimov, T.; Kostova, I.; Arapova, A.; Patronov, G. Rise and decay time responses of Sr aluminate phosphorescent materials. J. Lumin. 2021, 235, 117985. [Google Scholar] [CrossRef]
  13. Wang, Z.; Liu, Q.; Wang, J.; Qi, Y.; Li, Z.; Li, J.; Zhang, Z.; Wang, X.; Li, C.; Wang, R. Study on the Luminescence Performance and Anti-Counterfeiting Application of Eu2+, Nd3+ Co-Doped SrAl2O4 Phosphor. Nanomaterials 2024, 14, 1265. [Google Scholar] [CrossRef]
  14. Zhang, J.; Wang, Z.; Huo, X.; Meng, X.; Wang, Y.; Suo, H.; Li, P. Anti-Counterfeiting Application of Persistent Luminescence Materials and Its Research Progress. Laser Photon. Rev. 2024, 18, 2300751. [Google Scholar] [CrossRef]
  15. Hayashi, F.; Ogawa, K.; Moriya, Y.; Sudare, T.; Teshima, K. Growth of β-Li2 TiO3 Nanocrystals from LiCl and LiOH Fluxes. Cryst. Growth Des. 2019, 19, 1377–1383. [Google Scholar] [CrossRef]
  16. Kimijima, T.; Zettsu, N.; Onodera, H.; Yubuta, K.; Oishi, S.; Teshima, K. Low-temperature growth of idiomorphic cubic-phase Li7La3 Zr2O12 crystals using LiOH flux. CrystEngComm 2015, 17, 3487–3492. [Google Scholar] [CrossRef]
  17. Jones, R.; Burgess, S.; Pinard, P. Enhanced Compositional Mapping on the SEM Through Combined EDS-WDS Mapping in AztecWave. Microsc. Microanal. 2022, 28, 546–547. [Google Scholar] [CrossRef]
  18. Vitola, V.; Bite, I.; Millers, D.; Zolotarjovs, A.; Laganovska, K.; Smits, K.; Spustaka, A. The boron effect on low temperature luminescence of SrAl2O4:Eu,Dy. Ceram. Int. 2020, 46, 26377–26381. [Google Scholar] [CrossRef]
  19. Kim, D.; Kim, S.-C.; Bae, J.-S.; Kim, S.; Kim, S.-J.; Park, J.-C. Eu 2+-Activated Alkaline-Earth Halophosphates, M5(PO4)3X:Eu2+ (M = Ca, Sr, Ba; X = F, Cl, Br) for NUV-LEDs: Site-Selective Crystal Field Effect. Inorg. Chem. 2016, 55, 8359–8370. [Google Scholar] [CrossRef]
  20. Laganovska, K.; Bite, I.; Zolotarjovs, A.; Smits, K. Niobium enhanced europium ion luminescence in hafnia nanocrystals. J. Lumin. 2018, 203, 358–363. [Google Scholar] [CrossRef]
  21. Vercaemst, R.; Poelman, D.; Fiermans, L.; Van Meirhaeghe, R.L.; Laflère, W.H.; Cardon, F. A detailed XPS study of the rare earth compounds EuS and EuF3. J. Electron Spectrosc. Relat. Phenom. 1995, 74, 45–56. [Google Scholar] [CrossRef]
  22. Aitasalo, T.; Hölsä, J.; Jungner, H.; Krupa, J.-C.; Lastusaari, M.; Legendziewicz, J.; Niittykoski, J. Effect of temperature on the luminescence processes of SrAl2O4:Eu2+. Radiat. Meas. 2004, 38, 727–730. [Google Scholar] [CrossRef]
  23. Bite, I.; Krieke, G.; Zolotarjovs, A.; Laganovska, K.; Liepina, V.; Smits, K.; Auzins, K.; Grigorjeva, L.; Millers, D.; Skuja, L. Novel method of phosphorescent strontium aluminate coating preparation on aluminium. Mater. Des. 2018, 160, 794–802. [Google Scholar] [CrossRef]
  24. Wang, X.; Seto, T.; Zhao, Z.; Li, Y.; Wu, Q.; Lia, H.; Wang, Y. Preparation of Sr1−xCaxLiAl3N4:Eu2+ Solid Solutions and Their Photoluminescence Properties. J. Am. Ceram. Soc. 2016, 99, 3273–3279. [Google Scholar]
  25. Wolde, S.; Chauhan, D.; Somvanshi, D.; Unil Perera, A.G.; Li, L.H.; Chen, L.; Khanna, S.P.; Linfield, E.H. Accuracy of activation energy from Arrhenius plots and temperature-dependent internal photoemission spectroscopy. Infrared Phys. Technol. 2019, 102, 103026. [Google Scholar] [CrossRef]
  26. Yang, L.; Liu, Q.; Zheng, H.; Zhou, S.; Zhang, W. The decay model of Eu2+ and Eu2+, Dy3+ substituted SrAl2O4 prepared by high temperature solid phase method. J. Phys. Chem. Solids 2019, 124, 151–156. [Google Scholar] [CrossRef]
  27. Tang, X.; Ehler, E.; Brost, E.; Mathew, D. Evaluation of SrAl2O4:Eu, Dy phosphor for potential applications in thermoluminescent dosimetry. J. Appl. Clin. Med. 2021, 22, 191–197. [Google Scholar] [CrossRef] [PubMed]
  28. Chang, C.; Yuan, Z.; Mao, D. Eu2+ activated long persistent strontium aluminate nano scaled phosphor prepared by precipitation method. J. Alloys Compd. 2006, 415, 220–222. [Google Scholar] [CrossRef]
  29. Romero, M.; Castaing, V.; Lozano, G.; Miguez, H. Trap Depth Distribution Determines Afterglow Kinetics: A Local Model Applied to ZnGa2O4:Cr3+. J. Phys. Chem. Lett. 2024, 15, 9129–9135. [Google Scholar] [CrossRef]
  30. Zhang, X.; Liu, Y.; Hu, P.; Zhang, Y.; Zi, Y.; Zhang, Y.; Yang, Z.; Jiang, J. Hydrolytic-Resistance Long-Persistent Luminescence SrAl2O4:Eu2+,Dy3+ Ceramics for Optical Information Storage. Adv. Funct. Mater. 2025, 35, 2414872. [Google Scholar] [CrossRef]
  31. Eftimov, T.A.; Kostova, I.; Peltekov, A.; Hristova, K.; Brabant, D.; Fouzar, S.; Nikolov, K. A Study of Strontium Aluminates for All Optical Contactless Sensing Applications Using Smartphone Interrogation. Opt. Laser Technol. 2024, 176, 110965. [Google Scholar] [CrossRef]
  32. Fouzar, S.; Kostova, I.; Eftimov, T.; Benmounah, A.; Ouchabane, M.; Lakhssassi, A. Excitation and spectral dependence of the rise and decay time responses of Eu2+ and Dy3+ doped strontium aluminates. J. Mater. Sci Mater. Electron. 2022, 33, 20962–20980. [Google Scholar] [CrossRef]
  33. Wang, L.; Shang, Z.; Shi, M.; Cao, P.; Yang, B.; Zou, J. Preparing and testing the reliability of long after glow SrAl2O4:Eu2+, Dy3+ phosphor flexible films for temperature sensing. RSC Adv. 2020, 10, 11418. [Google Scholar] [CrossRef] [PubMed]
  34. Wang, L.; Wang, W.; Shang, Z.; Cao, P.; Shi, M.; Yang, B.; Zou, J. Optical and reliability properties studies of Sr4Al14O25:Eu2+ film for high-CRI white LEDs. J. Mater. Sci. Mater. Electron. 2020, 31, 13561–13569. [Google Scholar] [CrossRef]
  35. Fouzar, S.; Eftimov, T.; Kostova, I.; Benmounah, A.; Lakhssassi, A. Effects of temperature on the time responses of strontium aluminates. Opt. Mater. 2021, 122, 111619. [Google Scholar] [CrossRef]
  36. Eftimov, T.; Kostova, I.; Fouzar, S.; Brabant, D.; Nikolov, K.; Vladev, V. Smartphone-Readable Optical-Fiber Quasi-Distributed Phosphorescent Temperature Sensor. Photonics 2024, 11, 694. [Google Scholar] [CrossRef]
  37. Ramalho, J.F.C.B.; António, L.C.F.; Correia, S.F.H.; Fu, L.S.; Pinho, A.S.; Brites, C.D.S.; Carlos, L.D.; André, P.S.; Ferreira, R.A.S. Luminescent QR codes for smart labelling and sensing. Opt. Laser Technol. 2018, 101, 304–311. [Google Scholar] [CrossRef]
  38. Ramalho, J.F.C.B.; Correia, S.F.H.; Fu, L.; Dias, L.M.S.; Adão, P.; Mateus, P.; Ferreira, R.A.S.; André, P.S. Super modules-based active QR codes for smart trackability and IoT: A responsive-banknotes case study. NPJ Flex. Electron. 2020, 4, 11. [Google Scholar] [CrossRef]
  39. Hristova, K.; Kostova, I.P.; Eftimov, T.A.; Patronov, G.; Tsoneva, S. Synthesis and Characterization of Smartphone-Readable Luminescent Lanthanum Borates Doped and Co-Doped with Eu and Dy. Photonics 2025, 12, 171. [Google Scholar] [CrossRef]
  40. Yakunin, S.; Chaaban, J.; Benin, B.M.; Cherniukh, I.; Bernasconi, C.; Landuyt, A.; Shynkarenko, Y.; Bolat, S.; Hofer, C.; Romanyuk, Y.E.; et al. Radiative lifetime-encoded unicolour security tags using perovskite nanocrystals. Nat. Commun. 2021, 12, 981. [Google Scholar] [CrossRef]
  41. Zaw, M.M.; Cao, P.; Ong, R.G.K.; Neo, D.C.J.; Lay, C.L. 3D Security Labels: Photostable Multimaterial Multilayered QR Codes via Two-Photon Lithography. ACS Appl. Opt. Mater. 2024, 2, 276–283. [Google Scholar] [CrossRef]
Figure 1. XRD data for the samples, symbol color corresponding to the indicated phases (SrAl2O4, Sr4Al14O25, Sr3Al2O6).
Crystals 15 00474 g001
Figure 2. Sample phase composition as obtained from Rietveld analysis.
Crystals 15 00474 g002
Figure 3. SEM images (SE mode) of samples synthesized using hydroxide precursors (LiOH, KOH, NaOH) after annealing.
Crystals 15 00474 g003
Figure 4. SEM images (SE mode) of samples synthesized using carbonate precursors (K2CO3, (NH4)2CO3, Na2CO3) and HMTA after annealing.
Crystals 15 00474 g004
Figure 5. Comparison of atomic percentages with Rietveld and XPS analysis.
Crystals 15 00474 g005
Figure 6. The narrow XPS scans of O1s region for all samples.
Crystals 15 00474 g006
Figure 7. The narrow XPS scans of Eu3d region for NH4CO3 sample.
Crystals 15 00474 g007
Figure 8. TSL analysis of the samples.
Crystals 15 00474 g008
Figure 9. RGB filter responses of the smartphones: (a) Xiaomi 11T Pro; (b) Samsung Galaxy A51.
Crystals 15 00474 g009
Figure 10. Overall spectral responses of the smartphones vs. optical power increase: (a) Xiaomi 11T Pro; (b) Samsung Galaxy A51.
Crystals 15 00474 g010
Figure 11. (a) Normalized power spectral distribution of the white light source as measured by a pyroelectric probe and the fiber spectrometer; (b) responses of the Xiaomi 11T Pro and Samsung Galaxy A51 vs. absolute optical power at 500 nm.
Crystals 15 00474 g011
Figure 12. (a) Photograph of the phosphorescent samples and the observed spectra taken simultaneously with a smartphone spectrometer with 400 nm excitation. (b) Spectral distributions with a smartphone spectrometer with 400 nm excitation.
Crystals 15 00474 g012
Figure 13. Topographic view of the 3D excitation emission luminescence spectra as measured by the fiber spectrometer (FS)—left images and by a smartphone spectrometer (SS)—middle and right: (a) #1; (b) #2; (c) #3; (d) #4; (e) #5; (f) #6; (g) #7.
Crystals 15 00474 g013aCrystals 15 00474 g013b
Figure 14. Rise/decay time responses for five different duty cycles for 380 nm LED excitation. The double arrow indicates the ΔuOFF(t0) level: (a) #1, (b) #2, (c) #3, (d) #4, (e) #5, (f) #6, (g) #7 and (h) comparison of all the responses for a duty cycle of η = 50%.
Crystals 15 00474 g014
Figure 15. Double log plots of 1-uON(t) and uOFF(t) for η = 10% and η = 50% at room temperature and 380 nm LED excitation: (a) #1, (b) #2, (c) #3, (d) #4, (e) #5, (f) #6, (g) #7.
Crystals 15 00474 g015
Figure 16. Dependence of the power law parameters A0, a0 and A, α on the duty cycle for t ≤ Δtc: (a) #1, (b) #2, (c) #3, (d) #4, (e) #5, (f) #6, (g) #7.
Crystals 15 00474 g016
Figure 17. Time-dependent temperature responses of samples #1 through #7.
Crystals 15 00474 g017
Table 1. Average element ratio for samples after thermal treatment.
SampleEu:Dy Weight RatioSDSr:Al Weight RatioSD
#1 HTMA1.31.04.11.0
#2 LiOH1.81.31.40.2
#3 KOH0.460.021.20.6
#4 NaOH0.70.32.00.8
#5 K2CO31.70.62.71.4
#6 Na2CO30.70.23.21.3
#7 (NH4)2CO30.40.31.60.4
Table 2. Comparison table of trapping center depths.
Sample IDTraping Center Depths (eV)
#1—HMTA0.050.17
#2—LiOH0.103
#3—KOH0.055
#4—NaOH0.1610.112
#5—K2CO30.1170.186
#6—Na2CO30.148
#7—(NH4)2CO30.150
Table 3. Comparison table of the maximum efficiency excitation (λ′) and emission wavelengths (λ).
Excitation Wavelength, λ′
Emission Wavelength, λ
#1
HTMA
#2
LiOH
#3
KOH
#4
NaOH
#5
K2CO3
#6
Na2CO3
#7
(NH4)2CO3
λ′Max (nm)362.5362.5367.5367.5365358367.5
λMax (nm)523524492520523523521.5
Table 4. Power law decay parameters A, α, luminous intensity L, relative share of phosphorescence ΔuOFF and phosphorescence intensity P of the samples under study.
#1
HTMA
#2
LiOH
#3
KOH
#4
NaOH
#5
K2CO3
#6
Na2CO3
#7
(NH4)2CO3
A0.14340.17480.16910.04950.19030.28160.2244
α−0.334−0.268−0.094−0.218−0.185−0.192−0.173
Luminescence
Intensity, L
≈4800≈8500≈10,700≈1400≈9600≈7800≈8500
ΔuOFF41%42%22%11%51%52%40%
Phosphorescence, P≈1970≈3570≈2350≈155≈4890≈4060≈3400
Table 5. Comparison table of the temperature sensitivity of the sample.
#1
HTMA
#2
LiOH
#3
KOH
#4
NaOH
#5
K2CO3
#6
Na2CO3
#7
(NH4)2CO3
ΔuT54%49%49%43%29%35%25%
ΔuTT1.08%/K0.98%/K0.98%/K0.86%/K0.58%/K0.74%/K0.5%/K
Disclaimer/Publisher’s Note: The statements, opinions and data contained in all publications are solely those of the individual author(s) and contributor(s) and not of MDPI and/or the editor(s). MDPI and/or the editor(s) disclaim responsibility for any injury to people or property resulting from any ideas, methods, instructions or products referred to in the content.

