Article

Microstructure Evolution and the Influence on Residual Stress in Metal Additive Manufacturing with Analytics †

by
Wei Huang
1,*,
Hamid Garmestani
2 and
Steven Y. Liang
1,*
1
George W. Woodruff School of Mechanical Engineering, Georgia Institute of Technology, 801 Ferst Drive, Atlanta, GA 30332, USA
2
School of Materials Science and Engineering, Georgia Institute of Technology, 771 Ferst Drive NW, Atlanta, GA 30332, USA
*
Authors to whom correspondence should be addressed.
This manuscript is an extended version of the conference paper: Huang, W.; Garmestani, H.; Liang, S.Y. Microstructure Evolution and the Influence on Material Properties of Residual Stress in Additive Manufacturing with Analytics for a Green Future. In Proceedings of the TMS 2025 154th Annual Meeting & Exhibition Supplemental Proceedings, TMS 2025. The Minerals, Metals & Materials Series; Springer: Cham, Switzerland, 2025. https://doi.org/10.1007/978-3-031-80748-0_21.
Crystals 2025, 15(5), 435; https://doi.org/10.3390/cryst15050435
Submission received: 28 March 2025 / Revised: 26 April 2025 / Accepted: 28 April 2025 / Published: 2 May 2025

Abstract

:
Additive Manufacturing (AM) has become a revolutionary technology in manufacturing, attracting considerable attention in industrial applications recently. It allows for intricate fabrication, reduces material waste, offers design flexibility, and has economic implications. Nonetheless, the residual stresses generated during the AM process and their effects on microstructural evolution and material properties continue to pose significant challenges hindering its advancement. This paper investigates the evolution of microstructures, focusing on texture and grain size as influenced by processing parameters. It examines how these factors affect the performance of multi-phase materials, specifically in terms of elastic modulus, Poisson’s ratio, and yield strength, leading to variations in residual stress through analytical simulation. The authors developed a thermal model that considers heat transfer boundaries and the geometry of the molten pool. They simulated grain size by considering the heating and cooling processes, including thermal stress, the Johnson-Mehl-Avrami-Kolmogorov (JMAK) model, and grain refinement. The texture was simulated using the Columnar-to-Equiaxed Transition (CET) model, thermal dynamics, and Bunge calculations. The self-consistency model determines the properties based on the established texture distribution. Finally, both microstructure-affected and non-affected residual stresses were modeled and compared. Two gaps between microstructure-affected residual stress and non-affected analytical models appear at the depths of 0.02 mm and 0.078 mm. The results indicate that controlling process parameters and optimizing microstructures can effectively reduce residual stresses, significantly enhancing the overall performance of AM components. Hence, this work provides a more accurate analytical residual stress model and lays the foundation for better control of residual stress in the AM industry.

1. Introduction

This is an extended version of the conference paper by W. Huang et al. [1]. Advanced manufacturing focuses on intelligence, networking, and digitalization within the global decarbonization and sustainable production agreement. AM is now widely accepted as a new paradigm to support the design and production of high-performance components for aerospace, medical, energy, and automotive applications [2]. Leading AM methods include fused deposition modeling, powder bed fusion, inkjet printing and contour crafting, stereolithography, direct energy deposition, laminated object manufacturing for metals [3,4,5] and alloys [6], polymers [7] and composites [8], ceramics [9], and concrete [10]. Even with AM’s advantages, limitations such as anisotropic microstructure and mechanical properties, a restricted choice of materials, defects, and high cost are weighty [11].
Residual stress is the internal stress within a material without external forces, often resulting from non-uniform plastic deformation, phase transformations, or thermal gradients. It is a crucial topic in materials science and engineering, especially in manufacturing processes like welding, casting, and AM. Excessive residual stresses can cause part distortion, cracking, or premature failure, jeopardizing component reliability and service life. Therefore, understanding and managing residual stresses is vital for optimizing manufacturing processes and improving material performance. In recent years, the rise of AM has led to unprecedented attention on the study of residual stresses. AM constructs intricate components layer by layer, and the inherent intense thermal gradients and rapid cooling rates of this process result in residual stresses, which significantly affect material performance. Jamison L. et al. [12] and M. Megahed et al. [13] provided an overview of residual stresses in metal AM.
Various methods have been developed to tackle the challenges. Experimental measurement techniques such as X-ray diffraction, neutron diffraction, and ultrasonic methods have significantly improved. These techniques provide powerful tools for the precise quantification of residual stresses. Additionally, numerical simulation methods, including finite element analysis (FEA), are essential for predicting residual stress distributions and optimizing process parameters. The integration of data-driven approaches and machine learning techniques has recently created new opportunities for analytical modeling and predicting residual stresses, further enhancing the field.
There are two main types of experimental procedures used to measure residual stress in components: destructive methods and nondestructive methods. Nondestructive methods for analyzing materials include X-ray diffraction (XRD) [14], neutron diffraction, ultrasonics [15], and electrical resistivity [16]. Additionally, techniques such as magnetic behavior analysis [17] and piezo-spectroscopy [18] are considered nondestructive, though they are specific to certain materials and geometries. On the other hand, destructive methods consist of techniques such as hole drilling, sectioning, crack compliance, digital image correlation [19], and electronic speckle pattern interferometry. These methods create a free surface in part and relate the resulting deformation to residual stress [20,21].
In addition to experimental investigations, researchers frequently rely on numerical modeling to predict the buildup of residual stress during the AM process [22,23]. While experimental measurements of stress within the part are essential for understanding this phenomenon, measuring the entire part experimentally can be both challenging and costly. Many researchers utilize the finite element method (FEM) for their simulations; however, simulating the entire process in a reasonable timeframe is often not feasible. As a result, several simplifications must be made in the modeling process. Furthermore, using inverse analysis to optimize the process parameters for desired part performance is typically not achievable with FEM within a practical time frame.
Analytical models validated through physical experiments offer a valuable way to understand, control, and optimize process parameters through in-situ analysis. This approach is time-efficient, conserves computational resources, and lowers facility costs compared to other methods. Additionally, it aligns with the Industrial 4.0 movement. Currently, the analytical modeling in AM field mainly focuses on the processing-microstructure-property relationship. Some fundamental models have been established, such as the single-phase texture [24], multi-phase texture [25], grain size [26], and defects [27]. As residual stress is a critical research topic, the impact of microstructure evolution on the analytical modeling of residual stress in additive manufacturing still requires further investigation.
The first step of this study involved creating a thermal profile based on a moving point heat source, considering the boundary conditions during laser powder bed fusion (LPBF). Using the thermal distribution, we simulated microstructure characteristics, such as texture and grain size. The elastic modulus and Poisson’s ratio were calculated using a self-consistency model derived from the computed texture. The yield strength was determined using the Hall-Petch equation, which incorporates the modeled grain size. Finally, we compared the modified and non-modified residual stresses under various processing parameters by calculating residual stress based on the modeled material properties.
The Johnson-Cook flow stress model [28] predicts the yield surface by adjusting the yield strength parameter using the Hall-Petch equation, which considers grain size. It also considers the effects of cyclic heating, cooling, and yielding, which contribute to residual stress buildup due to the metal’s incremental plasticity and kinematic hardening behavior. This involves the principle of volume invariance in plastic deformation and the conditions of equilibrium and compatibility. Several modifications have been proposed for the Johnson-Cook model to address temperature-dependent flow softening and the influence of grain growth on yield strength. These modifications utilize the Hall-Petch equation [29,30], with parameters obtained from the literature [31]. In this study, results from the consideration of microstructure evolution during the process proved that this change does affect the modeling of residual stress via varying material properties. At some point in the parts modeled, it could be significant. This phenomenon, in turn, supports the necessity of the microstructure-affected analytical model.

2. Methodology

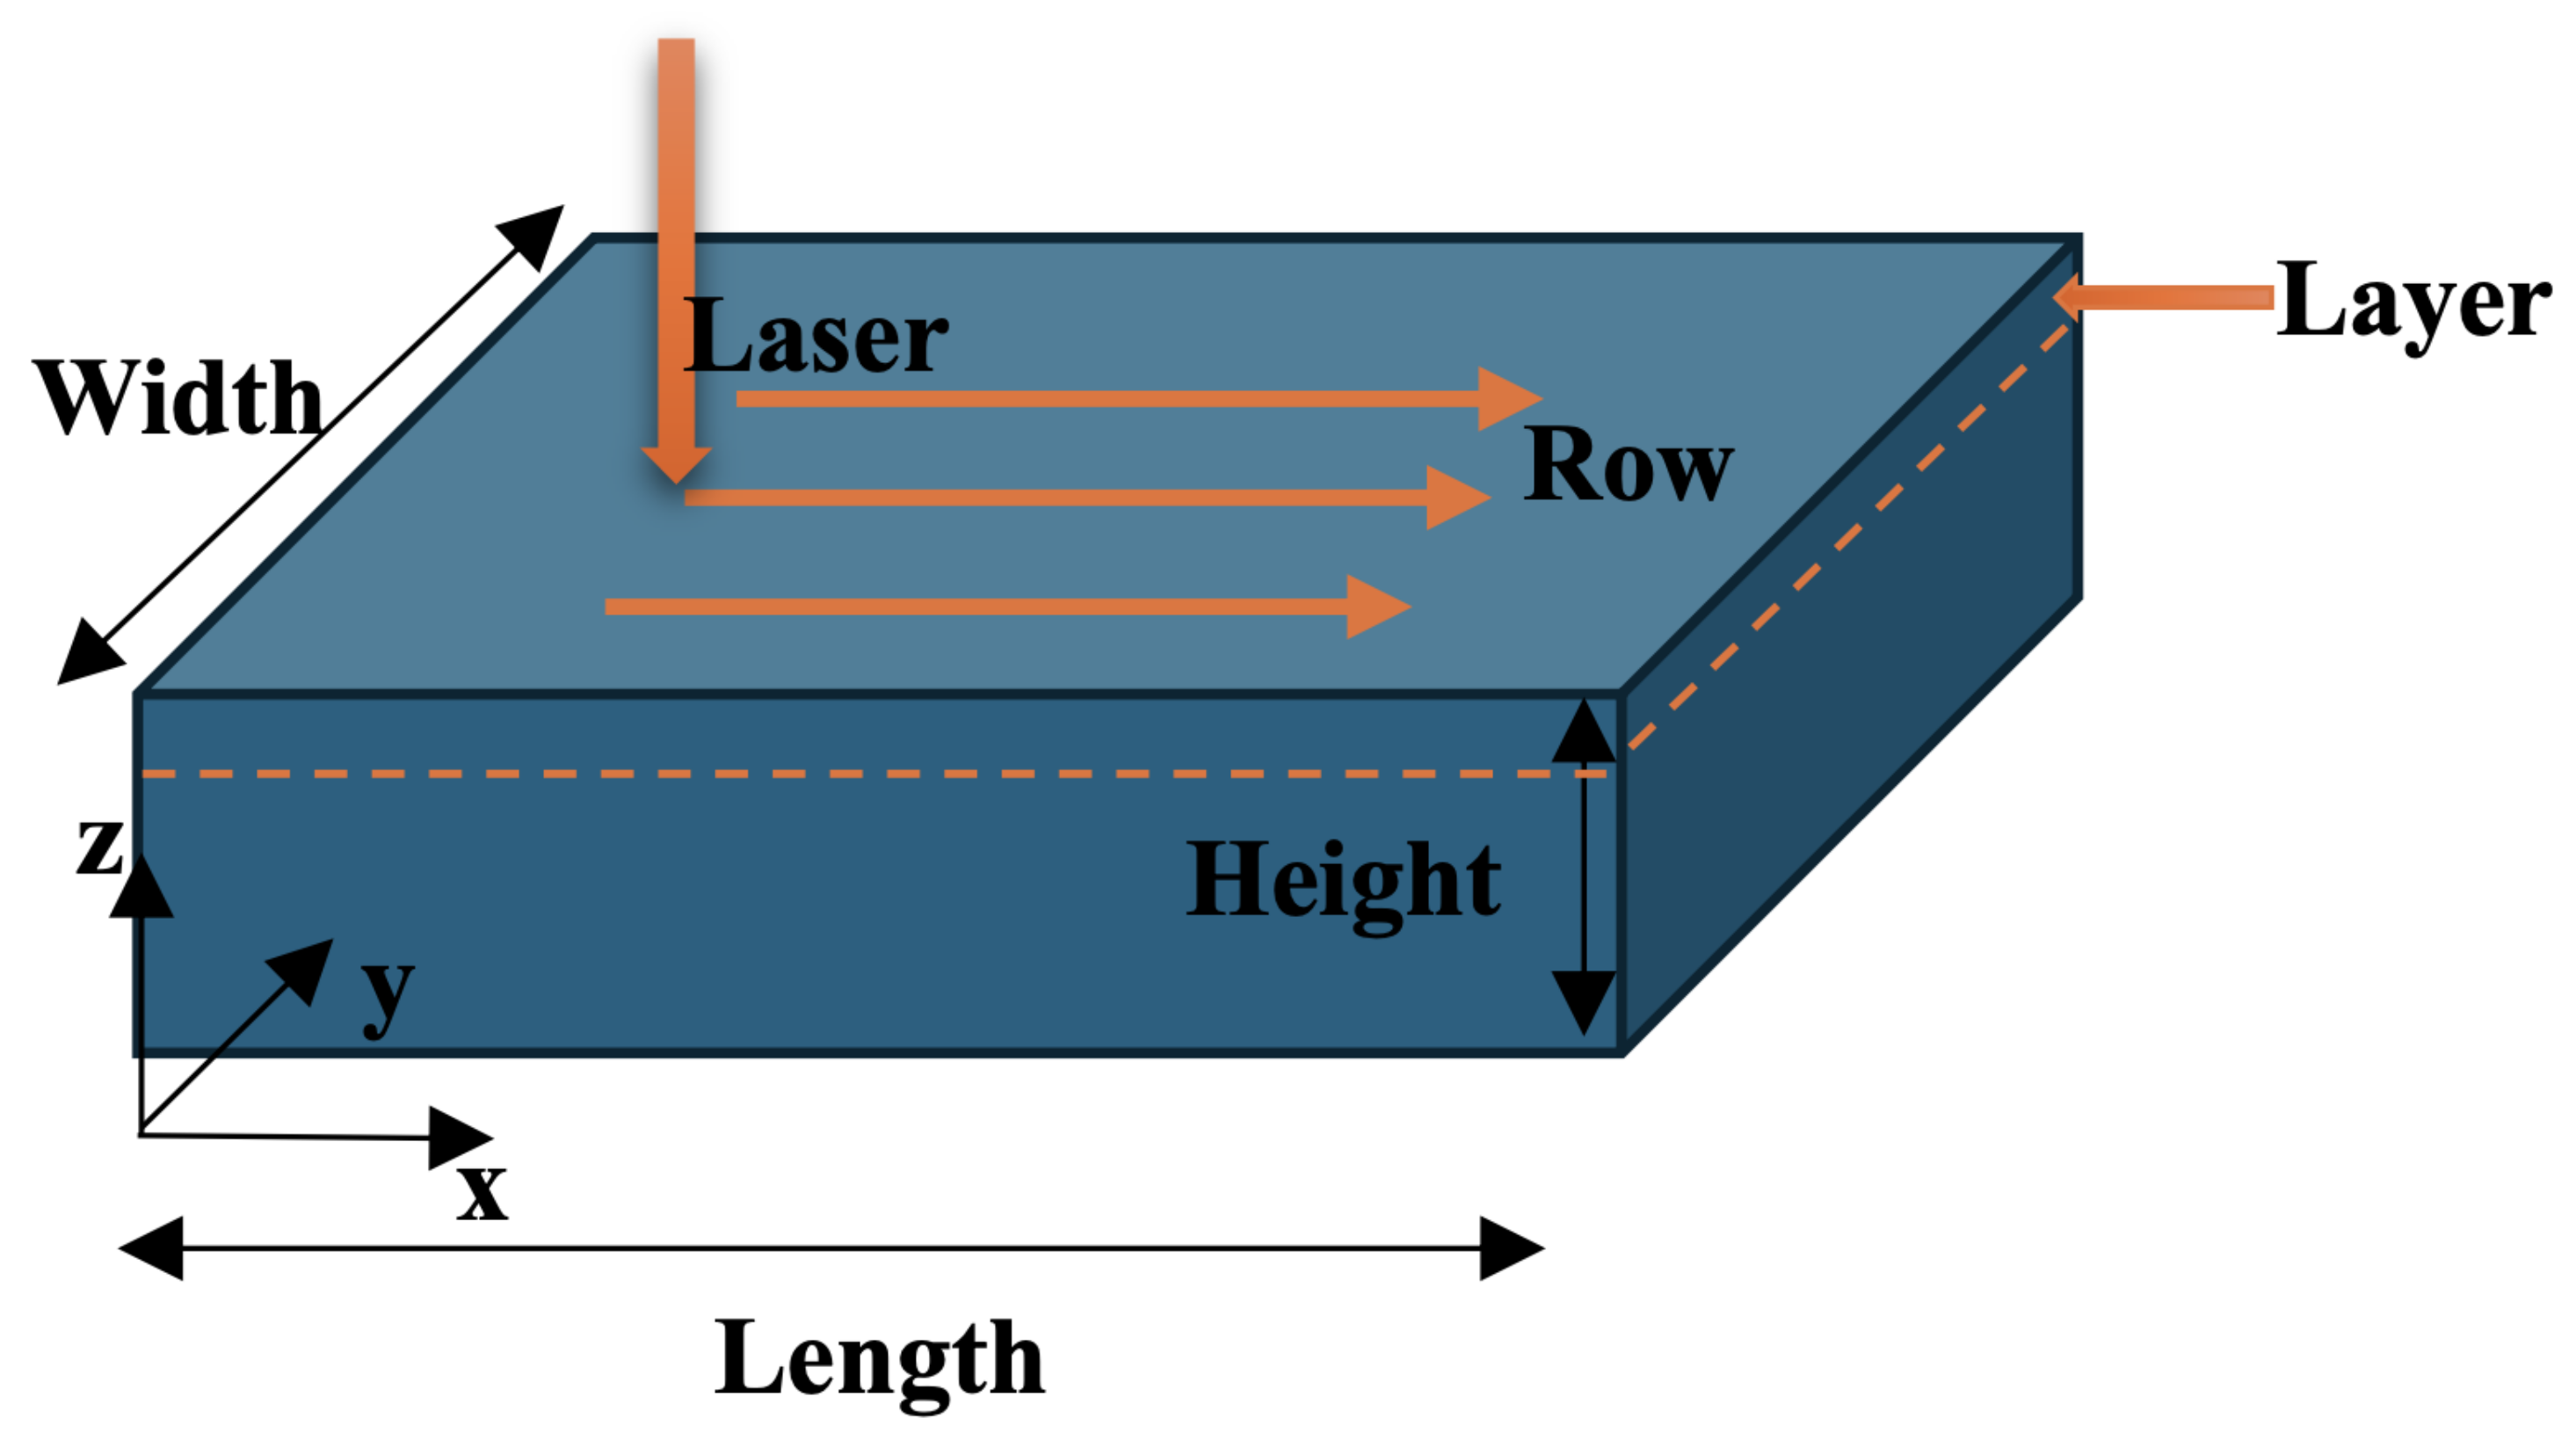
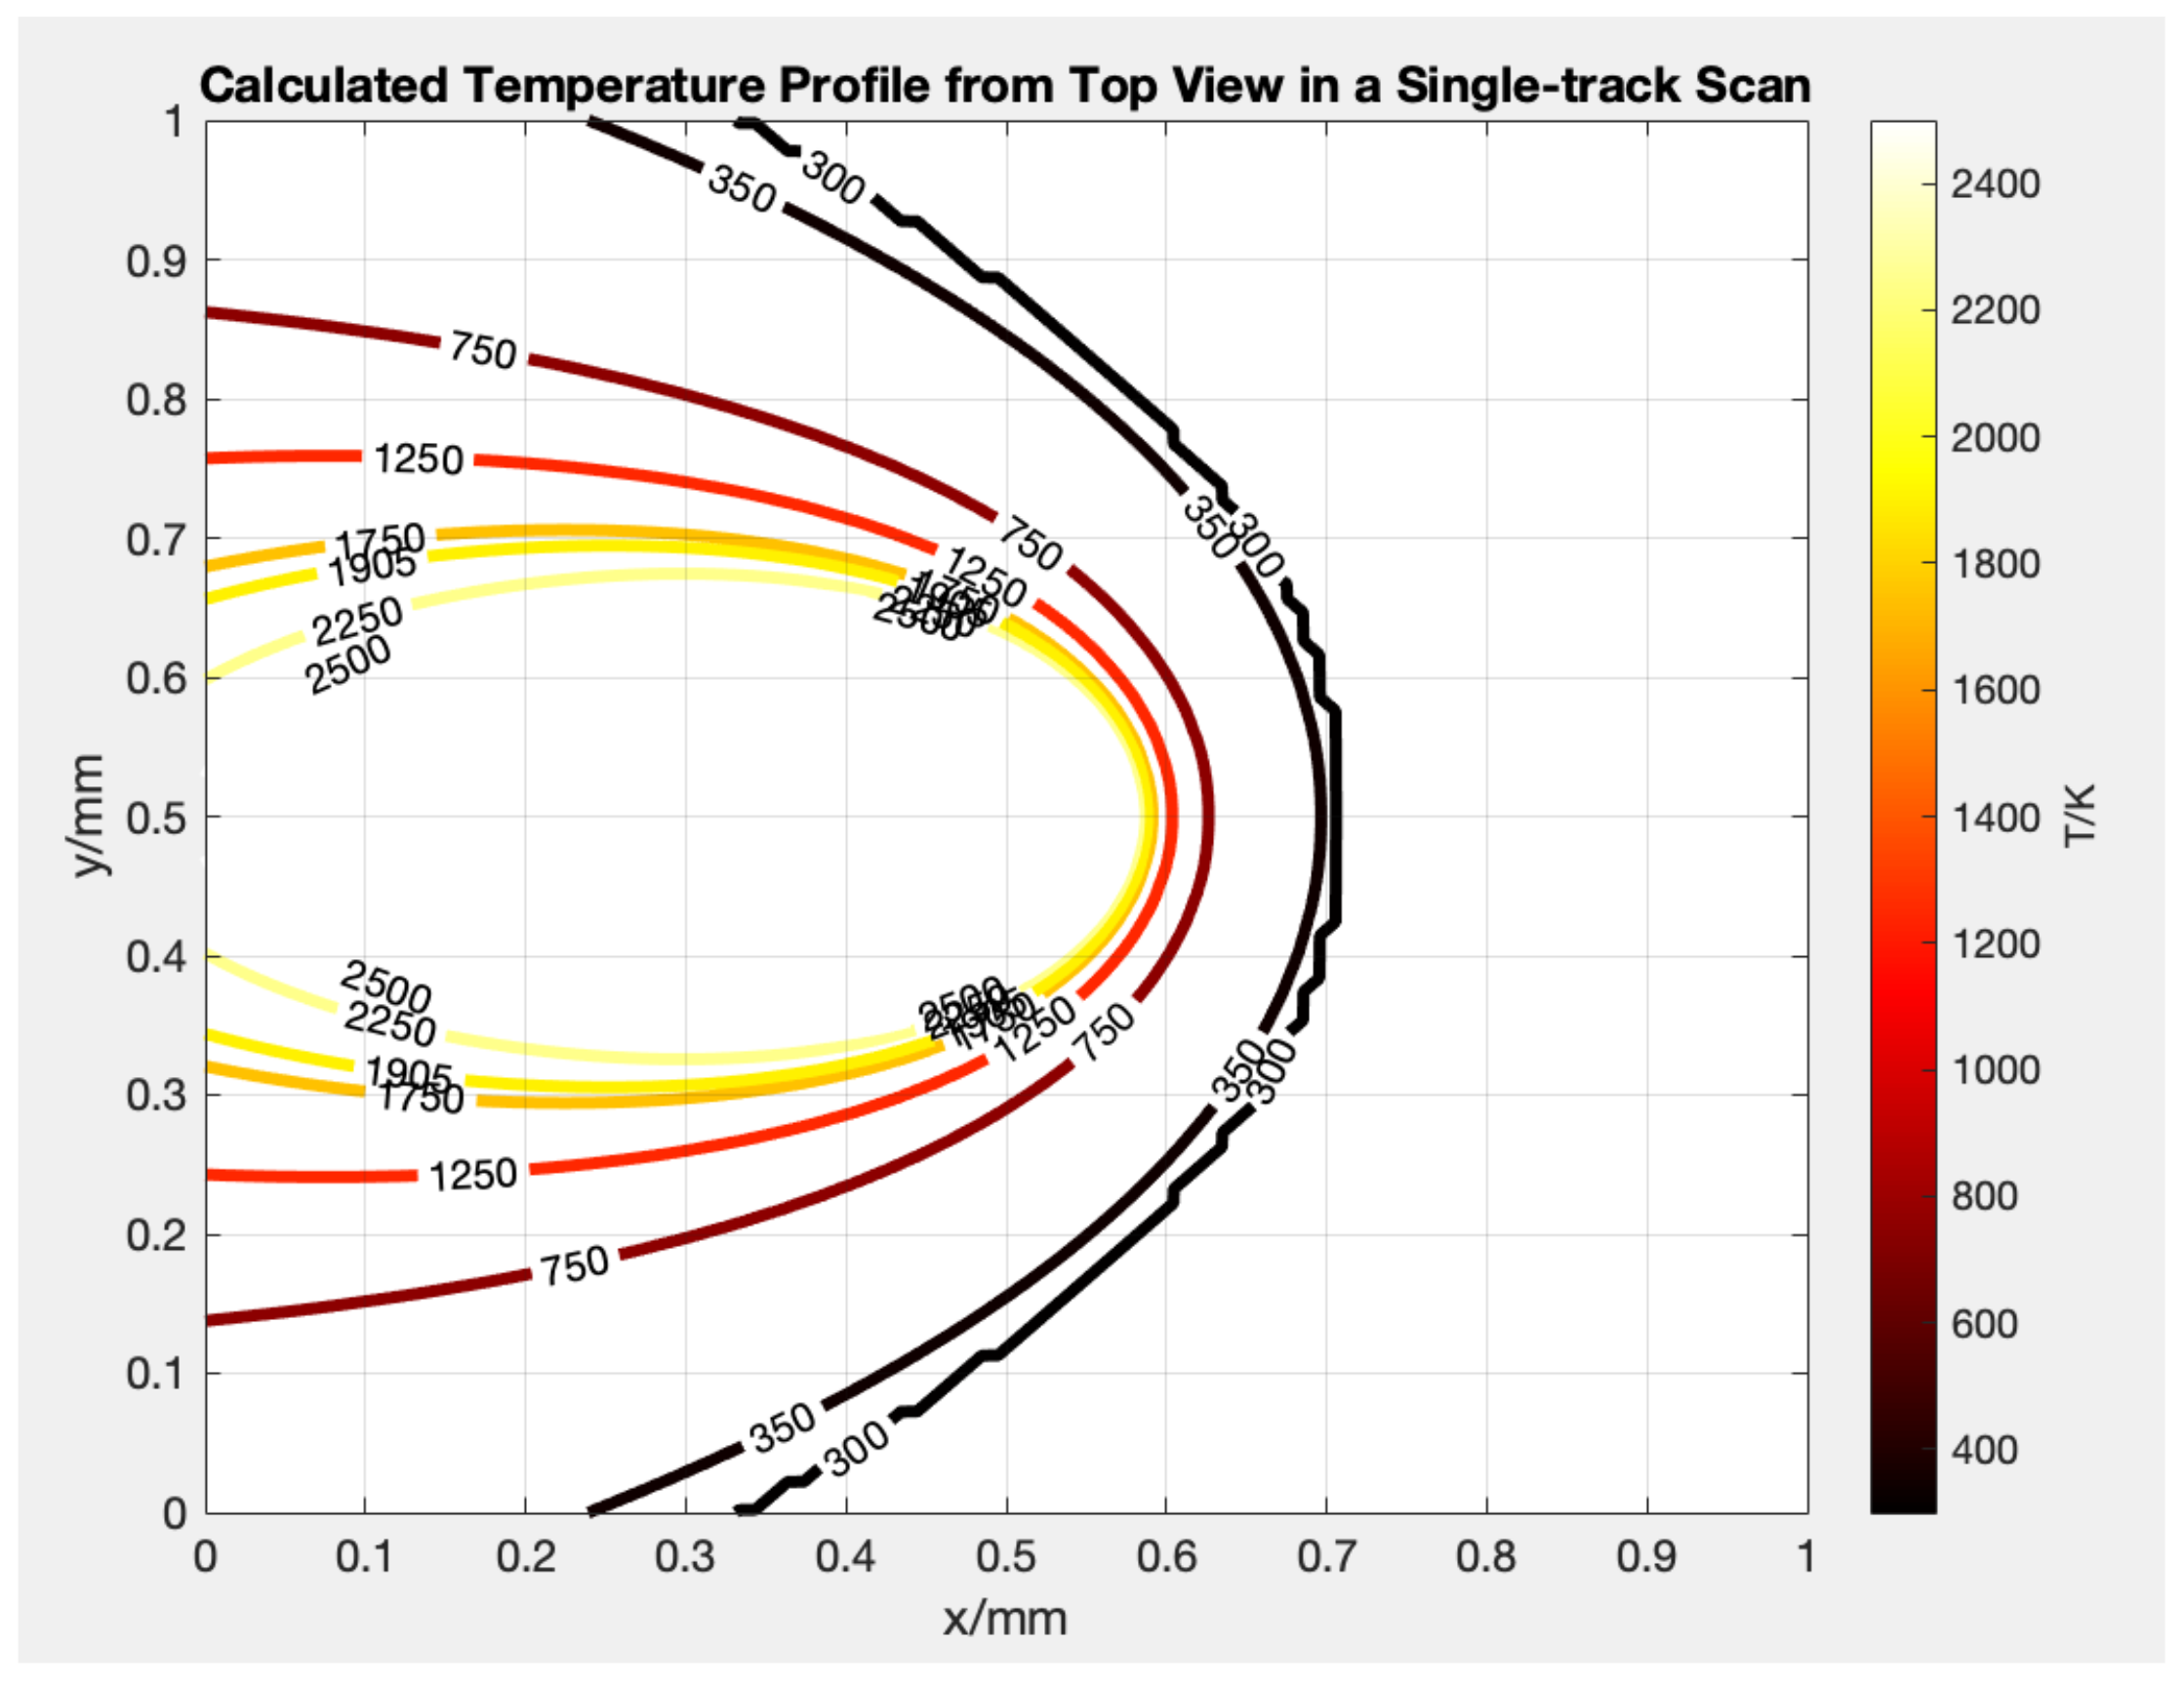
2.1. Thermal Profile

The multi-phase texture analytical model, developed by W. Huang et al. [25], should be used to establish the thermal profile. This model accounts for heat losses due to conduction, convection, and radiation within a three-dimensional heat transfer boundary condition.
T ( x , y , z ) = 1 4 π k R ( P η exp V ( R + x ) 2 κ A h ( T T 0 ) + ε σ ( T 4 T 0 4 ) + k p ( T T 0 ) R ) + T 0
κ = K / ρ c
R 2 = ( x x 0 ) 2 + ( y y 0 ) 2 + ( z z 0 ) 2
In this context, the following parameters are defined:
-
V: laser scanning velocity
-
P: laser power
-
K: thermal conductivity
-
c: heat capacity
-
η : laser absorption coefficient
-
κ : thermal diffusivity
-
ρ : density
-
R: distance between the heat source and the analysis location
-
k p : thermal conductivity of the powder
-
h: heat convection coefficient
-
ε : emissivity
-
σ : Stefan-Boltzmann constant
Additionally, T represents the simulated thermal profile, and A denotes the area of each heat sink on the surface of the melt pool.

2.2. Texture

W. Huang et al. [24] proposed new quantitative models considering heat input and heat loss with a more accurate molten pool and temperature distribution for microstructure evolution simulation of single-phase texture, addressing the flaws mentioned in the introduction that no previous research solves. Additionally, the model established in the study is analytical-based, which is much faster.
In the study, each grain in the material is represented by three Euler angles that define its crystallographic orientation. These angles specify the three rotations needed to transform the laboratory reference frame into the crystallographic lattice frame. The Bunge Convention was chosen to illustrate the Euler angles among various conventions.
The thermal gradient within the molten pool was figured by G = | T | . The solidification rate, R S , can be resolved by
R S = V cos θ
where V represents the scanning speed and θ is the angle between the scanning and growth directions.
CET was expressed by G n R S ratio and a specific value ∅ according to the calibrated solidification map [32] in the G R S space for Ti-6Al-4V. The study used a polycrystalline powder substrate with multiple random orientations instead of a single crystal base, better reflecting industrial conditions. When the solidification area grows columnar grains, they will grow epitaxially from the seed crystal. The direction in which the final dendrite of a specific location point grows can be determined by maximizing the cosine value of the angle between two vectors. This angle is represented by the equation cos ϕ = m · G G , where m is the specific crystallographic orientation vector of the seed crystal that gives the maximum value of cos ϕ . G is the thermal gradient vector at the location.
When the solidification area grows equiaxed grains, the texture orientations will develop based on the random substrate texture at that location. As the laser moves along a track, the liquid solidifies behind the melt pool, with the solidification process occurring from bottom to top. Once the first layer is scanned, the second layer will be built on top of it, and the first layer will act as the new seed crystals for the grain growth of the second layer. This layer-by-layer process will continue. The transition coefficients between columnar and equiaxed growth are discussed in the literature [33].

2.3. Grain Size

Grain size can be analytically modeled along with the thermal stress obtained and the dynamic growth of the grain recrystallization during heating and grain refinement during cooling, as demonstrated in previous work [26]. The dynamic recrystallization and the resulting grain size are predicted by the JMAK model [34,35,36,37]. This model uses a statistical methodology. J. Cahn developed the theory after that, taking into account continual cooling [38]. In AM, grain refining is more noticeable due to quick cooling. Through experimental verifications and quantitative relations, Umemoto et al. [39] calculated its impact on certain alloys. We can analytically describe grain size in AM using the computed thermal stress, dynamic recrystallization grain growth during heating, and grain refinement during cooling.

2.4. Microstructure-Affected Materials Properties

Anisotropy has been a significant problem for additively manufactured parts when modeling their material properties. The self-consistent crystal plasticity model effectively determines the effective elastic modulus of a two-phase composite, yielding more precise intermediate results compared to traditional upper and lower-bound models. When expressed in matrix form, the generalized Hooke’s law relates strains to stresses, establishing a connection between strain ε and stress σ for linear elastic materials.
σ 1 = σ x x σ 2 = σ y y σ 3 = σ z z σ 4 = σ y z σ 5 = σ x z σ 6 = σ x y = C 11 C 12 C 13 C 14 C 15 C 16 C 21 C 22 C 23 C 24 C 25 C 26 C 31 C 32 C 33 C 34 C 35 C 36 C 41 C 42 C 43 C 44 C 45 C 46 C 51 C 52 C 53 C 54 C 55 C 56 C 61 C 62 C 63 C 64 C 65 C 66 ε 1 = ε x x ε 2 = ε y y ε 3 = ε z z ε 4 = ε y z ε 5 = ε x z ε 6 = ε x y
where the stiffness constants, denoted by the 36 C i j s, form the stiffness matrix.
The elastic constants for the beta-Ti-6Al-4V [40] and alpha-Ti-6Al-4V [41,42] unit cells are given by the following equations, respectively, in terms of stiffness (C).
C α Ti = 154 82 61 0 0 0 82 154 61 0 0 0 61 61 173 0 0 0 0 0 0 45 0 0 0 0 0 0 45 0 0 0 0 0 0 45 GPa
C β Ti = 87.8 112 112 0 0 0 112 87.8 112 0 0 0 112 112 87.8 0 0 0 0 0 0 39.8 0 0 0 0 0 0 39.8 0 0 0 0 0 0 39.8 GPa
The following equations calculate the elastic modulus and Poisson’s ratio along the three directions.
E i i = 1 S i i eff
ν i j = ε j ε i
The notation E i i represents the elastic modulus in the x, y, and z directions. The term S i i eff refers to the effective elastic modulus in each respective direction. Additionally, Poisson’s ratio, denoted as ν i j , describes the relationship between the applied strain and the transverse strain that occurs during uniaxial tension.
Regarding the properties affected by grain size, the primary equation that describes the relationship between grain size and yield strength is the Hall-Petch equation, as it requires the fewest parameters.
The Hall-Petch equation is expressed as follows:
σ y = σ 0 + k 1 d
In this equation, σ y denotes the yield strength, while σ 0 and k are constants influenced by the material’s chemistry and microstructure.

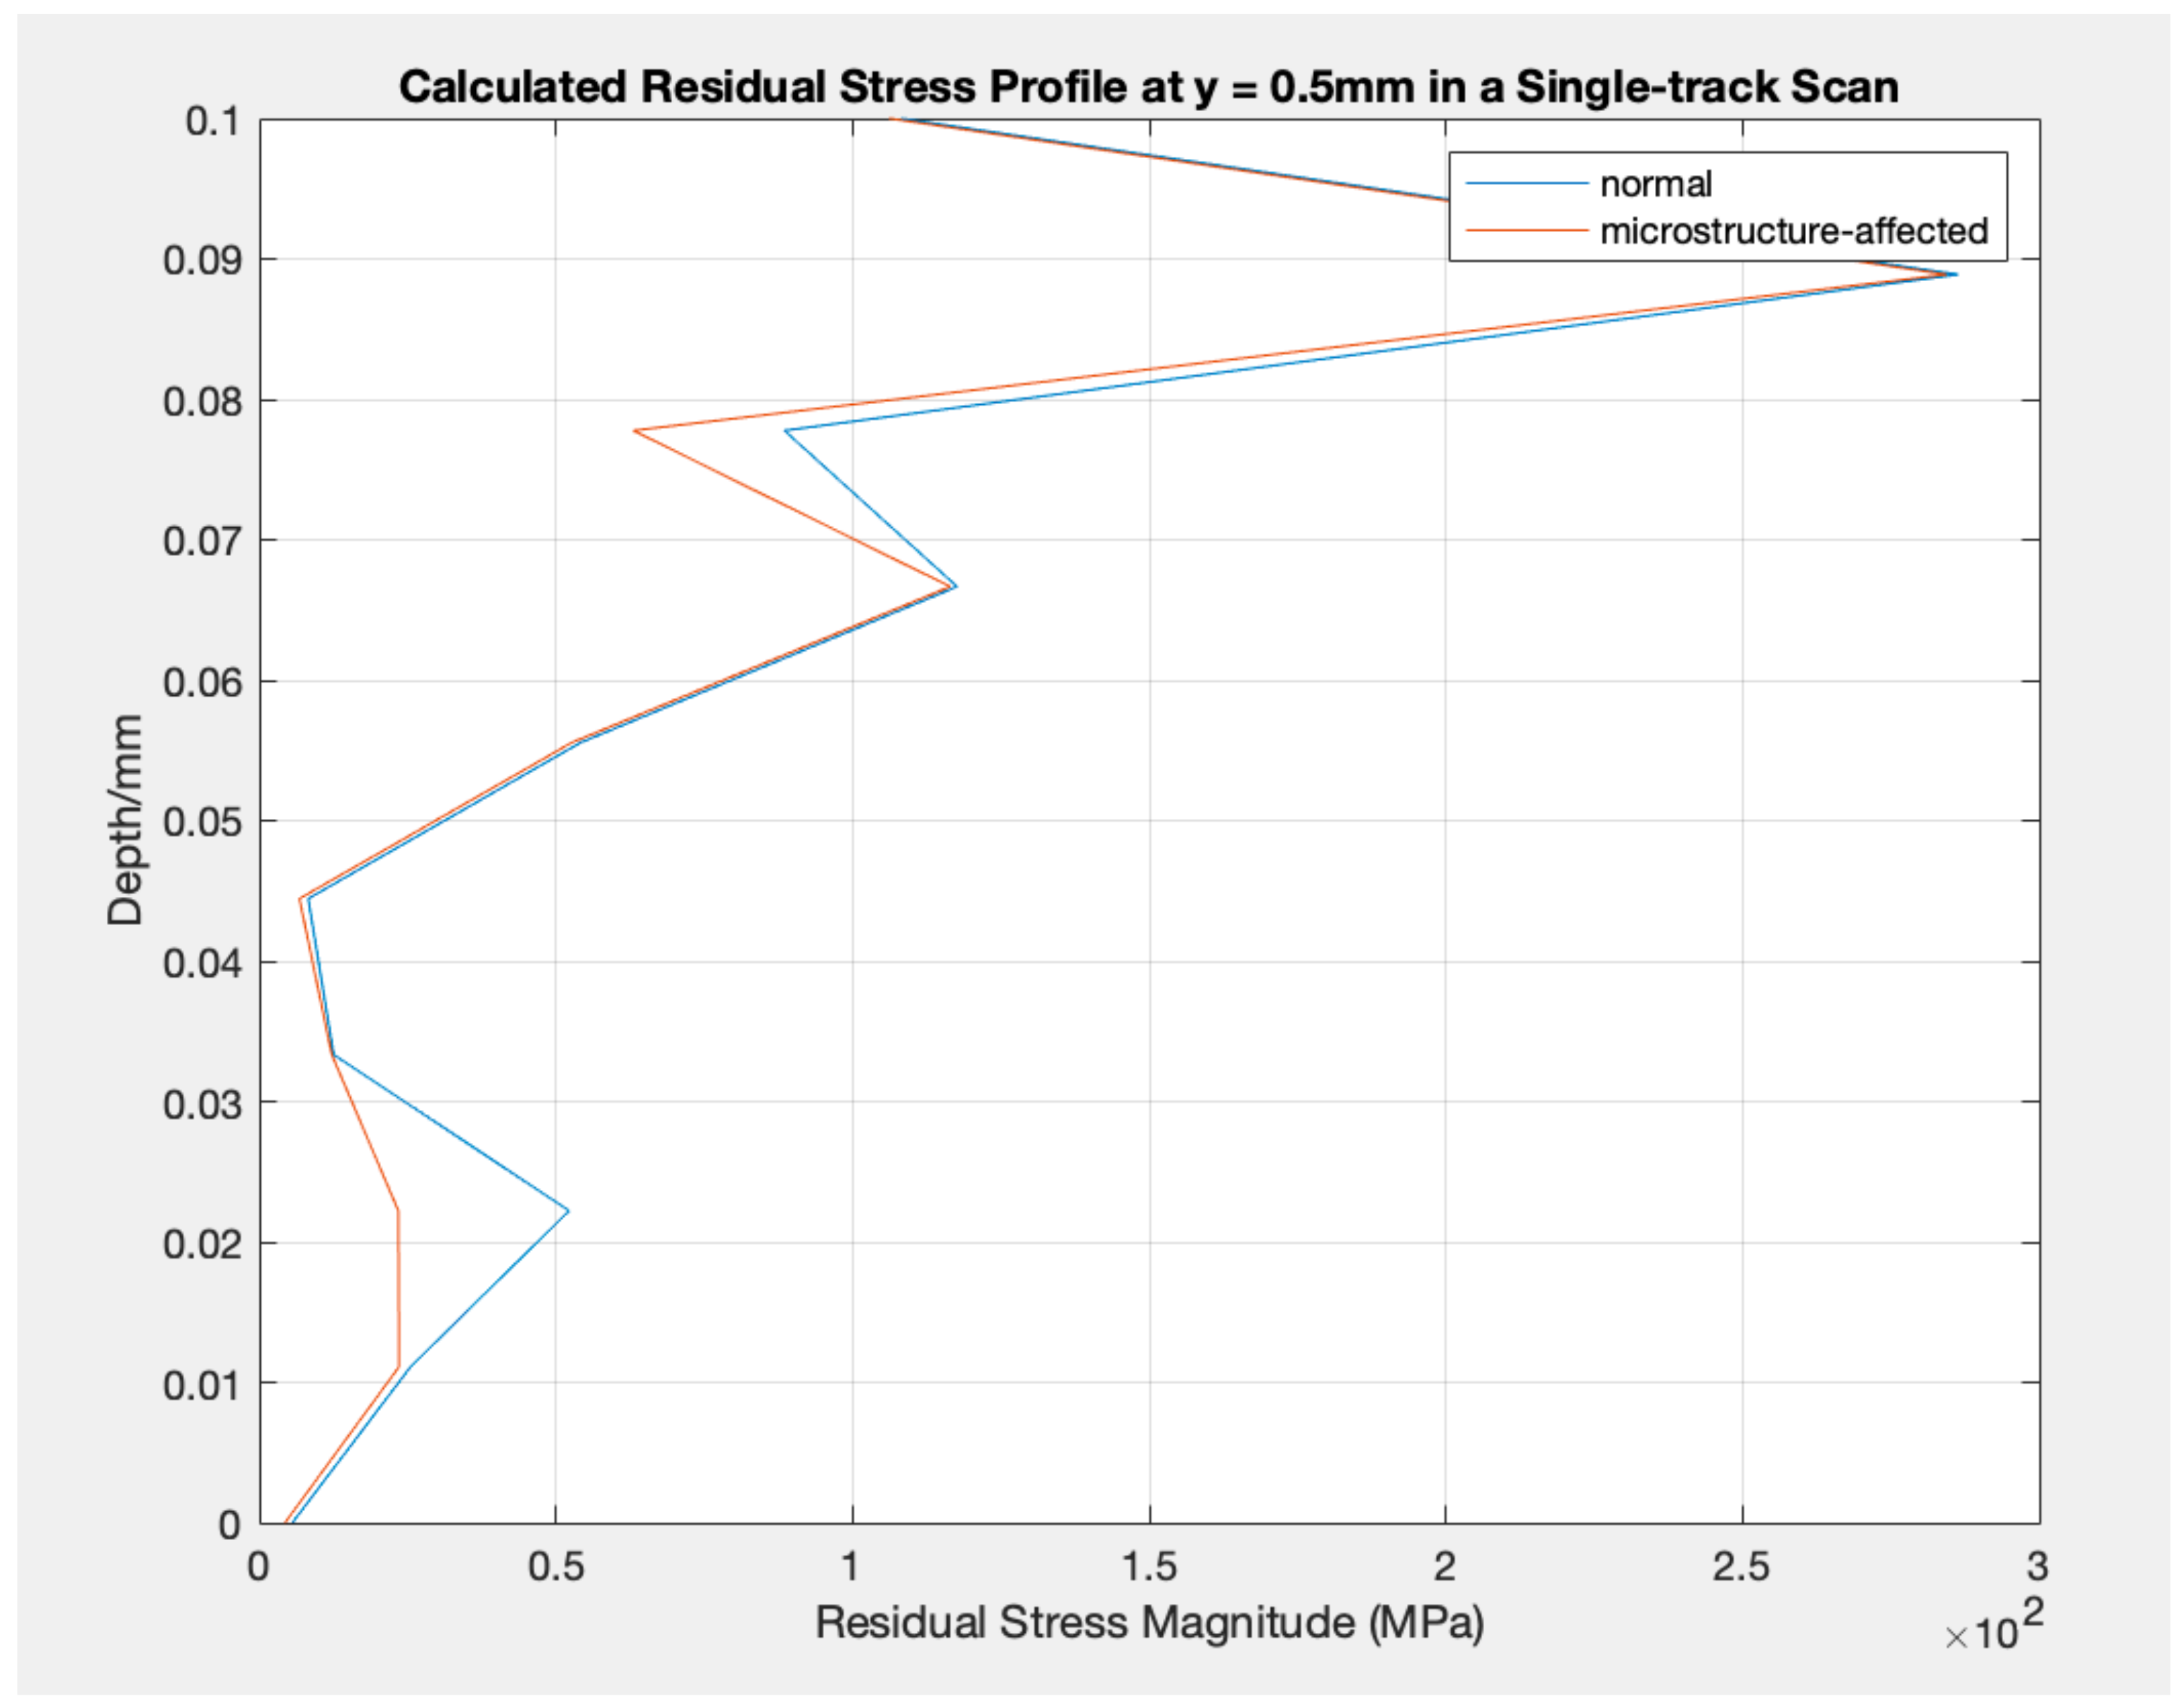
2.5. Residual Stress

The fundamental residual stress analytical model derived from the thermal profile was established and could be referred to in the past work [43], though without much exploration of the influence of properties on its variation and more investigation. Due to the process of LPBF, high strain and strain rates are generated in the alloy parts manufactured, so the Johnson-Cook flow stress model is used to address the yield strength threshold. Cases of elastic and elastic-plastic regions are all regarded in the algorithms. Previously, the properties were empirical temperature-dependent; however, in this work, they are updated with the new materials properties models to make them more accurate for further investigation.

3. Results and Discussion

The first step is to establish the thermal profile, which serves as the foundation for the process. The input of the model, which includes the material properties of Ti-6Al-4V, the processing parameters, and the geometry of the part, is detailed and presented in Table 1. The prior work has validated the thermal model [24], texture model [25], and grain size model [26]. The thermal history was validated against the experimental results of the molten pool size under the assumption of steady-state.
Then, the processing settings are modified to align with the values used in the earlier study by Cho et al. [44]. The laser power is set at 375 W, the layer thickness is 60 µm, the hatch spacing is 120 µm, and the scan speed is 1020 mm/s. The experimental setup includes five IDs that represent different layers and rows, as detailed in Table 2 and Figure 1.
For a better understanding of how the microstructure evolution affects the residual stress developed, the representative figures of thermal profile, grain size distribution, and texture are presented in Figure 2, Figure 3 and Figure 4.
The elastic modulus and Poisson’s ratio have been calculated and are presented in Table 3 and Table 4 and Figure 5. As shown in Table 3 and Table 4 and Figure 5, the values of elastic modulus and Poisson’s ratio indeed vary during processing, so in this sense, it is necessary to update the values for residual stress analytical models.
The residual stresses impacted by microstructure are compared and displayed in Figure 6, Figure 7, Figure 8, Figure 9 and Figure 10 by updating the yield strength, elastic modulus, and Poisson’s ratio for every processing setting.
Residual stress varies significantly across different scenarios due to changes in microstructure-affected properties, especially compared to typical models that do not account for microstructural changes. This indicates that the evolving microstructure during the AM process influences material properties such as elastic modulus and yield strength. These changes in material properties will also affect the modeling of residual stress and other performance characteristics.
In detail, the residual stress values on the top surface of the parts do not change (stay at about 500 MPa) due to various scanning strategies in terms of the number of layers and rows and whether they are affected by varying properties. However, as the depth increases, the residual stress values alter slightly differently, while the tendencies do not change. On the other hand, two relatively apparent peaks appear in each experimental setting between the microstructure-affected residual stress and the commonly analytically modeled residual stress. One appears at a depth of about 0.02 mm and the other at about 0.078 mm. The difference between the two modeled values varies as well. For other depth regions, the values modeled between the two analytical models do not differ much.

4. Conclusions

This work uses an analytical model to investigate the evolution of microstructure and the influence of residual stress on material properties in AM. We have developed analytical thermal models and models for grain size, texture, microstructure-affected properties, and residual stress. Additionally, we compared residual stress models in cases where microstructure was affected and where it was not, analyzing the differences across various scanning strategies based on the number of layers and rows.
It has been observed that the values of residual stress on the top surface, as modeled for different scanning strategies, do not change significantly whether the microstructure is affected. However, there are minor modifications in residual stress when considering changes in depth, regardless of the presence of microstructure, as well as different layer and row settings.
When comparing the two analytical models, it was found that variations in material properties during the process significantly impact the modeled residual stress. Two significant peaks appear in the values from the two analytical models: one occurs at a depth of approximately 0.02 mm, while the other is around 0.078 mm. This suggests that the accuracy of the residual stress modeling can be significantly improved by taking into account fluctuations in material properties during the process. Hence, this work establishes a more advanced and more accurate analytical residual stress prediction model for the AM process in industry. In the future, this analytical model could also serve as an approach to inversely predict processing parameters for the ideal residual stress status in industry, with huge economic and time savings compared to experimental approach, FEM-based methods, or previous analytical residual stress models.

Author Contributions

Conceptualization, W.H. and S.Y.L.; methodology, W.H.; software, W.H.; validation, W.H.; formal analysis, W.H.; investigation, W.H.; resources, W.H.; data curation, W.H.; writing—original draft preparation, W.H.; writing—review and editing, W.H.; H.G.; S.Y.L.; visualization, W.H.; supervision, S.Y.L.; project administration, S.Y.L.; funding acquisition, H.G.; S.Y.L. All authors have read and agreed to the published version of the manuscript.

Funding

This research received no external funding.

Data Availability Statement

The raw data supporting the conclusions of this article will be made available by the authors on request.

Acknowledgments

This work was supported by the Boeing Company.

Conflicts of Interest

The authors declare that they have no known competing financial interests or personal relationships that could have appeared to influence the work reported in this paper.

Abbreviations

AMAdditive Manufacturing
LPBFLaser powder bed fusion
CETColumnar-to-equiaxed transition of crystallographic orientation
FEMFinite element method
AIArtificial intelligence
BCCBody-centered cubic
HCPHexagonal close packed
PLaser power
TTemperature
η Laser absorption coefficient
x, y, zCoordinates
VLaser scanning velocity
RDistance from the heat source to the point of analysis
KThermal conductivity
x 0 , y 0 , z 0 Coordinates of the heat source
κ Thermal diffusivity
T 0 Room temperature
cHeat capacity
ρ Density
Q c o n d Heat of conduction
Q c o n v Heat of convection
Q r a d Heat of radiation
AArea of each heat sink on the melt pool surface
k p Powder thermal conductivity
Δ TTemperature change
hHeat convection coefficient
ε Radiation emissivity
σ Stefan-Boltzmann constant
GThermal gradient vector
R S Solidification rate
nExponent
Certain value in Hunt’s model
mSpecific crystallographic orientation vector of the seed crystal that gives the maximum value of cos ϕ
PXPolycrystal base
N s e e d Number of possible seed crystals
T m Melting temperature
k t Bulk thermal conductivity
nn, kkColumnar/equiaxed transition coefficient
X, Y, ZCoordinate axis
JMAKJohnson-Mehl-Avrami-Kolmogorov
α Thermal expansion coefficient
σ x x therm , σ z z therm Thermal stress in the xx and zz directions
GGreen’s function
ν Poisson’s Ratio
EElastic modulus
ϵ Strain
X d r e x Volume fraction of dynamically recrystallized material
ϵ p Peak strain
d 0 Initial grain size
Q act Activation energy
C 8 , m 8 , n 8 , h 8 , a 8 , C 1 , m 1 , h 1 , a 1 , R , C cooling Materials constants
qCooling rate
nNewly formed grain number
INucleation rate per unit volume
C i j Stiffness constants
S i j Complicance constants

References

  1. Huang, W.; Garmestani, H.; Liang, S.Y. Microstructure Evolution and the Influence on Material Properties of Residual Stress in Additive Manufacturing with Analytics for a Green Future. In Proceedings of the TMS 2025 154th Annual Meeting & Exhibition Supplemental Proceedings, Las Vegas, NV, USA, 23–27 March 2025; TMS 2025; The Minerals, Metals & Materials Series. Springer: Berlin/Heidelberg, Germany, 2025; pp. 244–253. [Google Scholar]
  2. DebRoy, T.; Wei, H.; Zuback, J.; Mukherjee, T.; Elmer, J.; Milewski, J.; Beese, A.M.; Wilson-Heid, A.d.; De, A.; Zhang, W. Additive manufacturing of metallic components–process, structure and properties. Prog. Mater. Sci. 2018, 92, 112–224. [Google Scholar] [CrossRef]
  3. Frazier, W.E. Metal additive manufacturing: A review. J. Mater. Eng. Perform. 2014, 23, 1917–1928. [Google Scholar] [CrossRef]
  4. Herzog, D.; Seyda, V.; Wycisk, E.M.; Emmelmann, C. Additive manufacturing of metals. Acta Mater. 2016, 117, 371–392. [Google Scholar] [CrossRef]
  5. Blakey-Milner, B.; Gradl, P.; Snedden, G.; Brooks, M.; Pitot, J.; Lopez, E.; Leary, M.; Berto, F.; Du Plessis, A. Metal additive manufacturing in aerospace: A review. Mater. Des. 2021, 209, 110008. [Google Scholar] [CrossRef]
  6. Aboulkhair, N.T.; Simonelli, M.; Parry, L.; Ashcroft, I.; Tuck, C.; Hague, R. 3D printing of Aluminium alloys: Additive Manufacturing of Aluminium alloys using selective laser melting. Prog. Mater. Sci. 2019, 106, 100578. [Google Scholar] [CrossRef]
  7. Ligon, S.C.; Liska, R.; Stampfl, J.; Gurr, M.; Mülhaupt, R. Polymers for 3D Printing and Customized Additive Manufacturing. Chem. Rev. 2017, 117, 10212–10290. [Google Scholar] [CrossRef]
  8. Wang, X.; Jiang, M.; Zhou, Z.; Gou, J.; Hui, D. 3D printing of polymer matrix composites: A review and prospective. Compos. Part B-Eng. 2017, 110, 442–458. [Google Scholar] [CrossRef]
  9. Chen, Z.; Li, Z.; Li, J.; Liu, C.; Lao, C.; Fu, Y.; Liu, C.; Yang, L.; Wang, P.; Yi, H. 3D printing of ceramics: A review. J. Eur. Ceram. Soc. 2019, 39, 661–687. [Google Scholar] [CrossRef]
  10. Bourell, D.; Kruth, J.P.; Leu, M.; Levy, G.; Rosen, D.; Beese, A.M.; Clare, A. Materials for additive manufacturing. CIRP Ann. 2017, 66, 659–681. [Google Scholar] [CrossRef]
  11. Ngo, T.D.; Kashani, A.R.; Imbalzano, G.; Nguyen, K.T.; Hui, D. Additive manufacturing (3D printing): A review of materials, methods, applications and challenges. Compos. Part Eng. 2018, 143, 172–196. [Google Scholar] [CrossRef]
  12. Bartlett, J.L.; Li, X. An overview of residual stresses in metal powder bed fusion. Addit. Manuf. 2019, 27, 131–149. [Google Scholar] [CrossRef]
  13. Megahed, M.; Mindt, H.W.; N’Dri, N.A.; Duan, H.; Desmaison, O. Metal additive-manufacturing process and residual stress modeling. Integr. Mater. Manuf. Innov. 2016, 5, 61–93. [Google Scholar] [CrossRef]
  14. Staub, A.; Spierings, A.B.; Wegener, K. Correlation of meltpool characteristics and residual stresses at high laser intensity for metal lpbf process. Adv. Mater. Process. Technol. 2018, 5, 153–161. [Google Scholar] [CrossRef]
  15. Noronha, P.J.; Wert, J.J. An Ultrasonic Technique for the Measurement of Residual Stress. J. Test. Eval. 1975, 3, 147–152. [Google Scholar] [CrossRef]
  16. Chung, D.D.L. Thermal analysis of carbon fiber polymer-matrix composites by electrical resistance measurement. Thermochim. Acta 2000, 364, 121–132. [Google Scholar] [CrossRef]
  17. Krause, T.W.; Clapham, L.; Pattantyus, A.; Atherton, D.L. Investigation of the stress-dependent magnetic easy axis in steel using magnetic Barkhausen noise. J. Appl. Phys. 1996, 79, 4242–4252. [Google Scholar] [CrossRef]
  18. Ager, J.W.; Drory, M.D. Quantitative measurement of residual biaxial stress by Raman spectroscopy in diamond grown on a Ti alloy by chemical vapor deposition. Phys. Rev. B Condens. Matter 1993, 48 4, 2601–2607. [Google Scholar] [CrossRef]
  19. Wu, A.S.; Brown, D.W.; Kumar, M.; Gallegos, G.F.; King, W.E. An Experimental Investigation into Additive Manufacturing-Induced Residual Stresses in 316L Stainless Steel. Metall. Mater. Trans. A 2014, 45, 6260–6270. [Google Scholar] [CrossRef]
  20. Wang, Z.; Denlinger, E.R.; Michaleris, P.; Stoica, A.D.; Ma, D.; Beese, A.M. Residual stress mapping in Inconel 625 fabricated through additive manufacturing: Method for neutron diffraction measurements to validate thermomechanical model predictions. Mater. Des. 2017, 113, 169–177. [Google Scholar] [CrossRef]
  21. Prime, M.B. Cross-sectional mapping of residual stresses by measuring the surface contour after a cut. J. Eng. Mater. Technol.-Trans. Asme 2001, 123, 162–168. [Google Scholar] [CrossRef]
  22. Mokhtarishirazabad, M.; McMillan, M.; Vijayanand, V.D.; Simpson, C.; Agius, D.; Truman, C.E.; Knowles, D.A.; Mostafavi, M. Predicting residual stress in a 316L electron beam weld joint incorporating plastic properties derived from a crystal plasticity finite element model. Int. J. Press. Vessel. Pip. 2022, 201, 104868. [Google Scholar] [CrossRef]
  23. Kapoor, K.; Yoo, Y.S.J.; Book, T.A.; Kacher, J.; Sangid, M.D. Incorporating grain-level residual stresses and validating a crystal plasticity model of a two-phase Ti-6Al-4 V alloy produced via additive manufacturing. J. Mech. Phys. Solids 2018, 121, 447–462. [Google Scholar] [CrossRef]
  24. Huang, W.; Wang, W.; Ning, J.; Garmestani, H.; Liang, S.Y. Analytical Model of Quantitative Texture Prediction Considering Heat Transfer Based on Single-Phase Material in Laser Powder Bed Fusion. J. Manuf. Mater. Process. 2024, 8, 70. [Google Scholar] [CrossRef]
  25. Huang, W.; Garmestani, H.; Liang, S.Y. Analytical prediction of texture of multi-phase materials in laser powder bed fusion. J. Manuf. Mater. Process. 2024, 8, 234. [Google Scholar]
  26. Ji, X.; Mirkoohi, E.; Ning, J.; Liang, S.Y. Analytical modeling of post-printing grain size in metal additive manufacturing. Opt. Lasers Eng. 2020, 124, 105805. [Google Scholar] [CrossRef]
  27. Wang, W.; Ning, J.; Liang, S.Y. Prediction of lack-of-fusion porosity in laser powder-bed fusion considering boundary conditions and sensitivity to laser power absorption. Int. J. Adv. Manuf. Technol. 2021, 112, 61–70. [Google Scholar] [CrossRef]
  28. Johnson, G.R. A Constitutive Model and Data for Metals Subjected to Large Strains, high strain rates and high temperatures. In Proceedings of the 7th International Symposium on Ballistics, The Hague, Netherlands, 19–21 April 1983. [Google Scholar]
  29. Lee, H.J.; Ni, H.; Wu, D.T.; Ramirez, A.G. Grain size estimations from the direct measurement of nucleation and growth. Appl. Phys. Lett. 2005, 87, 124102. [Google Scholar] [CrossRef]
  30. Özel, T.; Llanos, I.; Soriano, J.; Arrazola, P.J. 3D finite element modelling of chip formation process for machining inconel 718: Comparison of fe software predictions. Mach. Sci. Technol. 2011, 15, 21–46. [Google Scholar] [CrossRef]
  31. Kobayashi, T.; Simons, J.; Brown, C.; Shockey, D. Plastic flow behavior of Inconel 718 under dynamic shear loads. Int. J. Impact Eng. 2008, 35, 389–396. [Google Scholar] [CrossRef]
  32. Kobryn, P.A.; Semiatin, S.L. Microstructure and texture evolution during solidification processing of Ti–6Al–4V. J. Mater. Process. Technol. 2003, 135, 330–339. [Google Scholar] [CrossRef]
  33. Welsch, G.; Boyer, R.; Collings, E. Materials Properties Handbook: Titanium Alloys; ASM International: Almere, The Netherlands, 1993. [Google Scholar]
  34. Avrami, M. Kinetics of phase change. I General theory. J. Chem. Phys. 1939, 7, 1103–1112. [Google Scholar] [CrossRef]
  35. Avrami, M. Kinetics of phase change. II transformation-time relations for random distribution of nuclei. J. Chem. Phys. 1940, 8, 212–224. [Google Scholar] [CrossRef]
  36. Avrami, M. Granulation, phase change, and microstructure kinetics of phase change. III. J. Chem. Phys. 1941, 9, 177–184. [Google Scholar] [CrossRef]
  37. Faleiros, A.; Rabelo, T.N.; Thim, G.P.; Oliveira, M.A.S. Kinetics of phase change. Mater. Res.-Ibero-Am. J. Mater. 2000, 3, 51–60. [Google Scholar] [CrossRef]
  38. Cahn, J.W. Transformation kinetics during continuous cooling. Acta Metall. 1956, 4, 572–575. [Google Scholar] [CrossRef]
  39. Umemoto, M.; Hai Guo, Z.; Tamura, I. Effect of cooling rate on grain size of ferrite in a carbon steel. Mater. Sci. Technol. 1987, 3, 249–255. [Google Scholar] [CrossRef]
  40. Ikehata, H.; Nagasako, N.; Furuta, T.; Fukumoto, A.; Miwa, K.; Saito, T. First-principles calculations for development of low elastic modulus Ti alloys. Phys. Rev. B 2004, 70, 174113. [Google Scholar] [CrossRef]
  41. Howard, C.J.; Kisi, E.H. Measurement of single-crystal elastic constants by neutron diffraction from polycrystals. J. Appl. Crystallogr. 1999, 32, 624–633. [Google Scholar] [CrossRef]
  42. Heldmann, A.; Hoelzel, M.; Hofmann, M.; Gan, W.; Schmahl, W.W.; Griesshaber, E.; Hansen, T.W.; Schell, N.; Petry, W. Diffraction-based determination of single-crystal elastic constants of polycrystalline titanium alloys. J. Appl. Crystallogr. 2019, 52, 1144–1156. [Google Scholar] [CrossRef]
  43. Mirkoohi, E.; Tran, H.C.; Lo, Y.L.; Chang, Y.C.; Lin, H.; Liang, S.Y. Analytical mechanics modeling of residual stress in laser powder bed considering flow hardening and softening. Int. J. Adv. Manuf. Technol. 2020, 107, 4159–4172. [Google Scholar] [CrossRef]
  44. Cho, J.Y.; Xu, W.; Brandt, M.; Qian, M. Selective laser melting-fabricated Ti-6Al-4V alloy: Microstructural inhomogeneity, consequent variations in elastic modulus and implications. Opt. Laser Technol. 2019, 111, 664–670. [Google Scholar] [CrossRef]
Figure 1. Schematic of the Samples Listed in Table 2.
Crystals 15 00435 g001
Figure 2. Representative Thermal Profile.
Crystals 15 00435 g002
Figure 3. Representative Grain Size Distribution on Top Surface.
Crystals 15 00435 g003
Figure 4. Representative (100) Pole Figure of Texture.
Crystals 15 00435 g004
Figure 5. Calculated Elastic Modulus and Poisson’s Ratio values. Blue bars represent the values of effective elastic modulus, and orange lines represent effective Poisson’s ratios.
Crystals 15 00435 g005
Figure 6. Calculated Residual Stress Profile at y = 0.5 mm in a Single-track Scan: normal vs. microstructure-affected. (ID: 1).
Crystals 15 00435 g006
Figure 7. Calculated Residual Stress Profile at y = 0.5 mm in a Single-track Scan: normal vs. microstructure-affected. (ID: 2).
Crystals 15 00435 g007
Figure 8. Calculated Residual Stress Profile at y = 0.5 mm in a Single-track Scan: normal vs. microstructure-affected. (ID: 3).
Crystals 15 00435 g008
Figure 9. Calculated Residual Stress Profile at y = 0.5 mm in a Single-track Scan: normal vs. microstructure-affected. (ID: 4).
Crystals 15 00435 g009
Figure 10. Calculated Residual Stress Profile at y = 0.5 mm in a Single-track Scan: normal vs. microstructure-affected. (ID: 5).
Crystals 15 00435 g010
Table 1. Materials Properties and Values of Ti-6Al-4V [25] and Part Geometry Settings.
Model InputsValueUnit
Surrounding Temperature ( T 0 )20 ° C
Melting Temperature ( T m )1655 ° C
Density ( ρ )4428kg/m3
Modulus of Elasticity (E)60.78GPa
Poisson’s Ratio ( ν )0.341
Bulk Thermal Conductivity ( k t )5–35W/(mK)
Powder Thermal Conductivity ( k p )0.21W/(mK)
Heat Capacity (C)500–800J/(KgK)
Heat Convection Coefficient (h)24W/(m2K)
Radiation Emissivity ( ε )0.91
Stefan-Boltzmann Constant ( σ )5.67 × 10 8 W/(m2K)
Columnar/Equiaxed Transition Coefficient (nn)3.21
Columnar/Equiaxed Transition Coefficient (kk) 10 25 1
Laser Absorption Value0.8181
Part Length (L)4mm
Part Width (W)1mm
Part Height (H)0.5mm
Number of Heat Sinks (S)91
Layer Thickness50 μ m
Hatching Space50 μ m
Hall-Petch Material Constant (k)230 μ m0.5 MPa
Hall-Petch Material Constant ( σ 0 )737MPa
Table 2. Number of Layers and Rows in Each Experimental Settings.
IDLayersRows
111
222
333
444
555
Table 3. Simulated Results of Elastic Modulus.
E 11 (GPa) E 22 (GPa) E 33 (GPa) E eff (GPa)
1106.580114.330108.660109.857
2106.380106.700119.300110.793
3105.020106.050129.340113.470
4104.880104.890141.160116.977
5104.870106.210130.030113.703
Table 4. Simulated Results of Poisson’s Ratio.
ν 12 ν 21 ν 13 ν 31 ν 23 ν 32
10.4640.4970.1950.1990.2090.199
20.4630.4640.1950.2180.1950.218
30.4570.4610.1920.2370.1940.237
40.4560.4560.1920.2580.1920.258
50.4560.4620.1920.2380.1940.238
Disclaimer/Publisher’s Note: The statements, opinions and data contained in all publications are solely those of the individual author(s) and contributor(s) and not of MDPI and/or the editor(s). MDPI and/or the editor(s) disclaim responsibility for any injury to people or property resulting from any ideas, methods, instructions or products referred to in the content.

