1. Introduction
Dye-sensitized solar cells (DSSCs) are a low-cost and eco-friendly photovoltaic technology that mimic natural photosynthesis to convert sunlight into electricity [
1]. The most important component of a DSSC is the photoanode, which plays a crucial role in light absorption and electron generation [
2]. The photoanode must achieve some minimum requirements for an efficient conversion of solar energy into electricity. The most important parameter of the photoanode is that they must be designed from materials with high optical transparency, high dye adsorption capacity due to high specific surface area, excellent electronic conductivity in order to minimize recombination losses, long-term chemical and electrochemical stability, good compatibility with the sensitizing dye, and conduction band position allowing easy electron transfer [
3,
4,
5].
The most commonly used materials are metal oxide-based semiconductors, with titanium dioxide (TiO
2) being the most widely used due to its wide band gap, ~3.2 eV; high chemical stability; and excellent dye adsorption capacity [
1,
6,
7]. Other frequently used materials include tin dioxide (SnO
2) because it has higher electron mobility than TiO
2, but lower dye adsorption capacity and a higher tendency to electron recombination [
8,
9,
10,
11]; zinc oxide (ZnO) also has similar electrochemical properties to TiO
2, but has different morphological structures (nanotubes, nanowires, nanoparticles) for improved electron collection [
12,
13,
14]. Niobium oxide (Nb
2O
5) offers high stability and good electronic properties but is less widely used due to high cost [
15,
16], while silicon dioxide (SiO
2) nanoparticles are applied as a support material or composite layers to improve structural stability and photoanode performance [
17,
18,
19].
Over time, studies reveal that oxide-based materials used individually in the design of photoanodes have certain limitations, as they cannot fulfill at the same time all the essential requirements needed for light absorption applications, particularly in solar cells. As a result, researchers have focused on the development of composite or doped materials that combine the advantages of different oxides to overcome these limitations and enhance the overall efficiency and durability of solar cells. Thus, composite TiO
2-SnO
2 materials combine the excellent adsorption capacity of the TiO
2 dye with the high electronic mobility of SnO
2, reducing charge recombination and improving electronic transport [
20,
21]. TiO
2-ZnO blends capitalize on the superior electronic mobility of ZnO while maintaining TiO
2 stability [
22,
23], while TiO
2-Nb
2O
5 composites improve charge separation and extend electron lifetime [
24,
25]. TiO
2-SiO
2 composites improve dye loading and light scattering [
24,
26], while TiO
2-Fe
2O
3 [
27] and TiO
2-WO
3 composites extend light absorption in the visible range, increasing photocurrent [
28]. These hybrid materials demonstrate that the combination of multiple oxides can lead to superior photoanodic properties, optimizing the efficiency, stability, and light-trapping capabilities in DSSCs.
Recent research has shown that the integration of copper oxide (CuO) with titanium dioxide (TiO
2) in composite photoanode can enhance the performance of photoanode. For example, one study demonstrated that the synthesis of a TiO
2/CuO nanocomposite using Impatiens tinctoria leaf extract resulted in superior photocatalytic efficiency due to the formation of an n-p junction within the photoanode, which enhanced charge transport and reduced electron recombination. In this CuO-doped TiO
2-based photoanode, CuO has a concentration between 0 and 50% wt and has been found to modify the optical and structural properties of the photoanode, influencing the efficiency of solar cells [
29]. Similarly, SrO-coated TiO
2 nanotubes demonstrated improved electron transport and reduced recombination, leading to higher conversion efficiencies in flexible DSSCs [
30]. Regarding SiO
2 nanoparticles, recent studies have explored the use of CuO/SiO
2 composites in DSSC photoanode, with research showing that sol–gel synthesized CuO/SiO
2 nanocomposites improve optical absorption and material stability, making them promising candidates for DSSC applications [
31].
TiO2 in its anatase form is considered one of the most suitable materials for dye-sensitized solar cells (DSSCs), but its relatively wide band gap (~3.2 eV) and high electron-hole recombination rate limit its ability to efficiently harvest solar energy. To overcome these drawbacks, various approaches such as metal and non-metal doping have been explored to shift its optical response into the visible region and enhance charge carrier separation.
In this context, the present study investigates the influence of CuO and SrO additions on TiO2 and SiO2 composites, offering insights into the structural, morphological, and optical modifications induced by these components. The addition of CuO and SrO beside TiO2 and SiO2 nanoparticles is motivated by their ability to introduce intermediate energy levels within the forbidden band gap, effectively acting as electron traps that reduce the recombination rate and increase the solar conversion efficiency. CuO, with its intermediate band gap and strong absorption in the visible region due to d–d electronic transitions of Cu2+ ions, significantly enhances light trapping. At the same time, SrO exhibits high response in the ultraviolet region, further extending the spectral absorption range. By generating additional energy states and narrowing the effective band gap, these oxides synergistically could improve the overall light-absorbing capacity and optoelectronic performance of the system. Although significantly low concentrations of CuO and SrO (1 and 2 wt%) were used, improvements in light absorption properties were observed. Concentrations of 1% and 2% CuO and SrO were chosen as minimum additive levels that can induce possible surface modifications without significantly affecting the phase composition. These low concentrations are commonly used to evaluate the sensitivity of the host matrix to compositional changes and to explore potential improvements in physicochemical and optical properties with minimal material input.
The preparation methods are greatly simplified, being physical mixing methods in environmentally friendly media, without toxic solvents and at room temperature, which significantly reduces the processing costs of these materials. This study focuses on the fundamental investigation of the optical properties of the synthesized Ti composites, aiming to evaluate their potential for solar energy applications. While the results indicate that these materials meet the essential criteria for use in dye-sensitized solar cells (DSSCs) and exhibit enhanced optical properties, this work does not extend to practical device fabrication or performance testing. Future research will be dedicated to integrating these materials into functional solar cell architectures to assess their real-world efficiency
3. Results and Discussion
The XRD patterns of the pure materials used in this study are presented in
Figure 1A. The XRD pattern of SiO
2 nanoparticles shows only a broad band centered around 22°, which is the characteristic peak for amorphous SiO
2. The XRD patterns of TiO
2 nanoparticles present distinctive peaks around 25.35, 37.64, 48.05, 54.9, and 62.62°, similar to those reported for tetragonal anatase crystal structure [
32]. The presence of additional weak peaks, assigned to the rutile tetragonal crystalline phase, centered at 27.40, 36.04, and 53.80° marked with # in the XRD patterns, were also identified in XRD patterns of TiO
2 nanoparticles (the ration between the two phases is 1:9). The XRD pattern of CuO shows the typical pattern of monoclinic CuO structure without other impurities peaks. Four distinctive peaks, marked with * in the XRD patterns, around 30.10, 34.76, 49.95, and 59.48° were identified by XRD analysis as a SrO cubic structure. Also, the XRD pattern of SrO exhibited several peaks characteristics of the reactivity of SrO with air humidity. The small and broad peaks assigned to Sr (OH)
2 reveal the hygroscopic nature of SrO.
Figure 1B shows the XRD patterns of binary TiO
2–CuO composite phases at two different CuO concentrations. As it can be seen, in diffractogram, the highest intense peaks ascribed with CuO crystalline phase, located at 35.35, 38.63, 48.76, and 61.59° are well defined, indicating the coexistence of both TiO
2 and CuO phases. The CuO crystalline phase is much more prominent with increasing CuO content. The presence of CuO crystalline phase was also noticed in the binary SiO
2–CuO composite samples, as seen in
Figure 1C. For the TiO
2–SrO composite, the XRD pattern, displayed in
Figure 1D, revealed minor modifications. Only a small peak, corresponding to SrO, was observed. The diffractogram for the SiO
2–SrO composite shows only the SiO
2 amorphous structure. The second phase, related to SrO, was not detected. The reason for this is the small concentration of SrO corroborated with its hydroscopic nature (meaning that part of SrO is in Sr (OH)
2 form, leading to an even smaller concentration of SrO). As a result, the SrO phase concentration may be below the XRD detection limit.
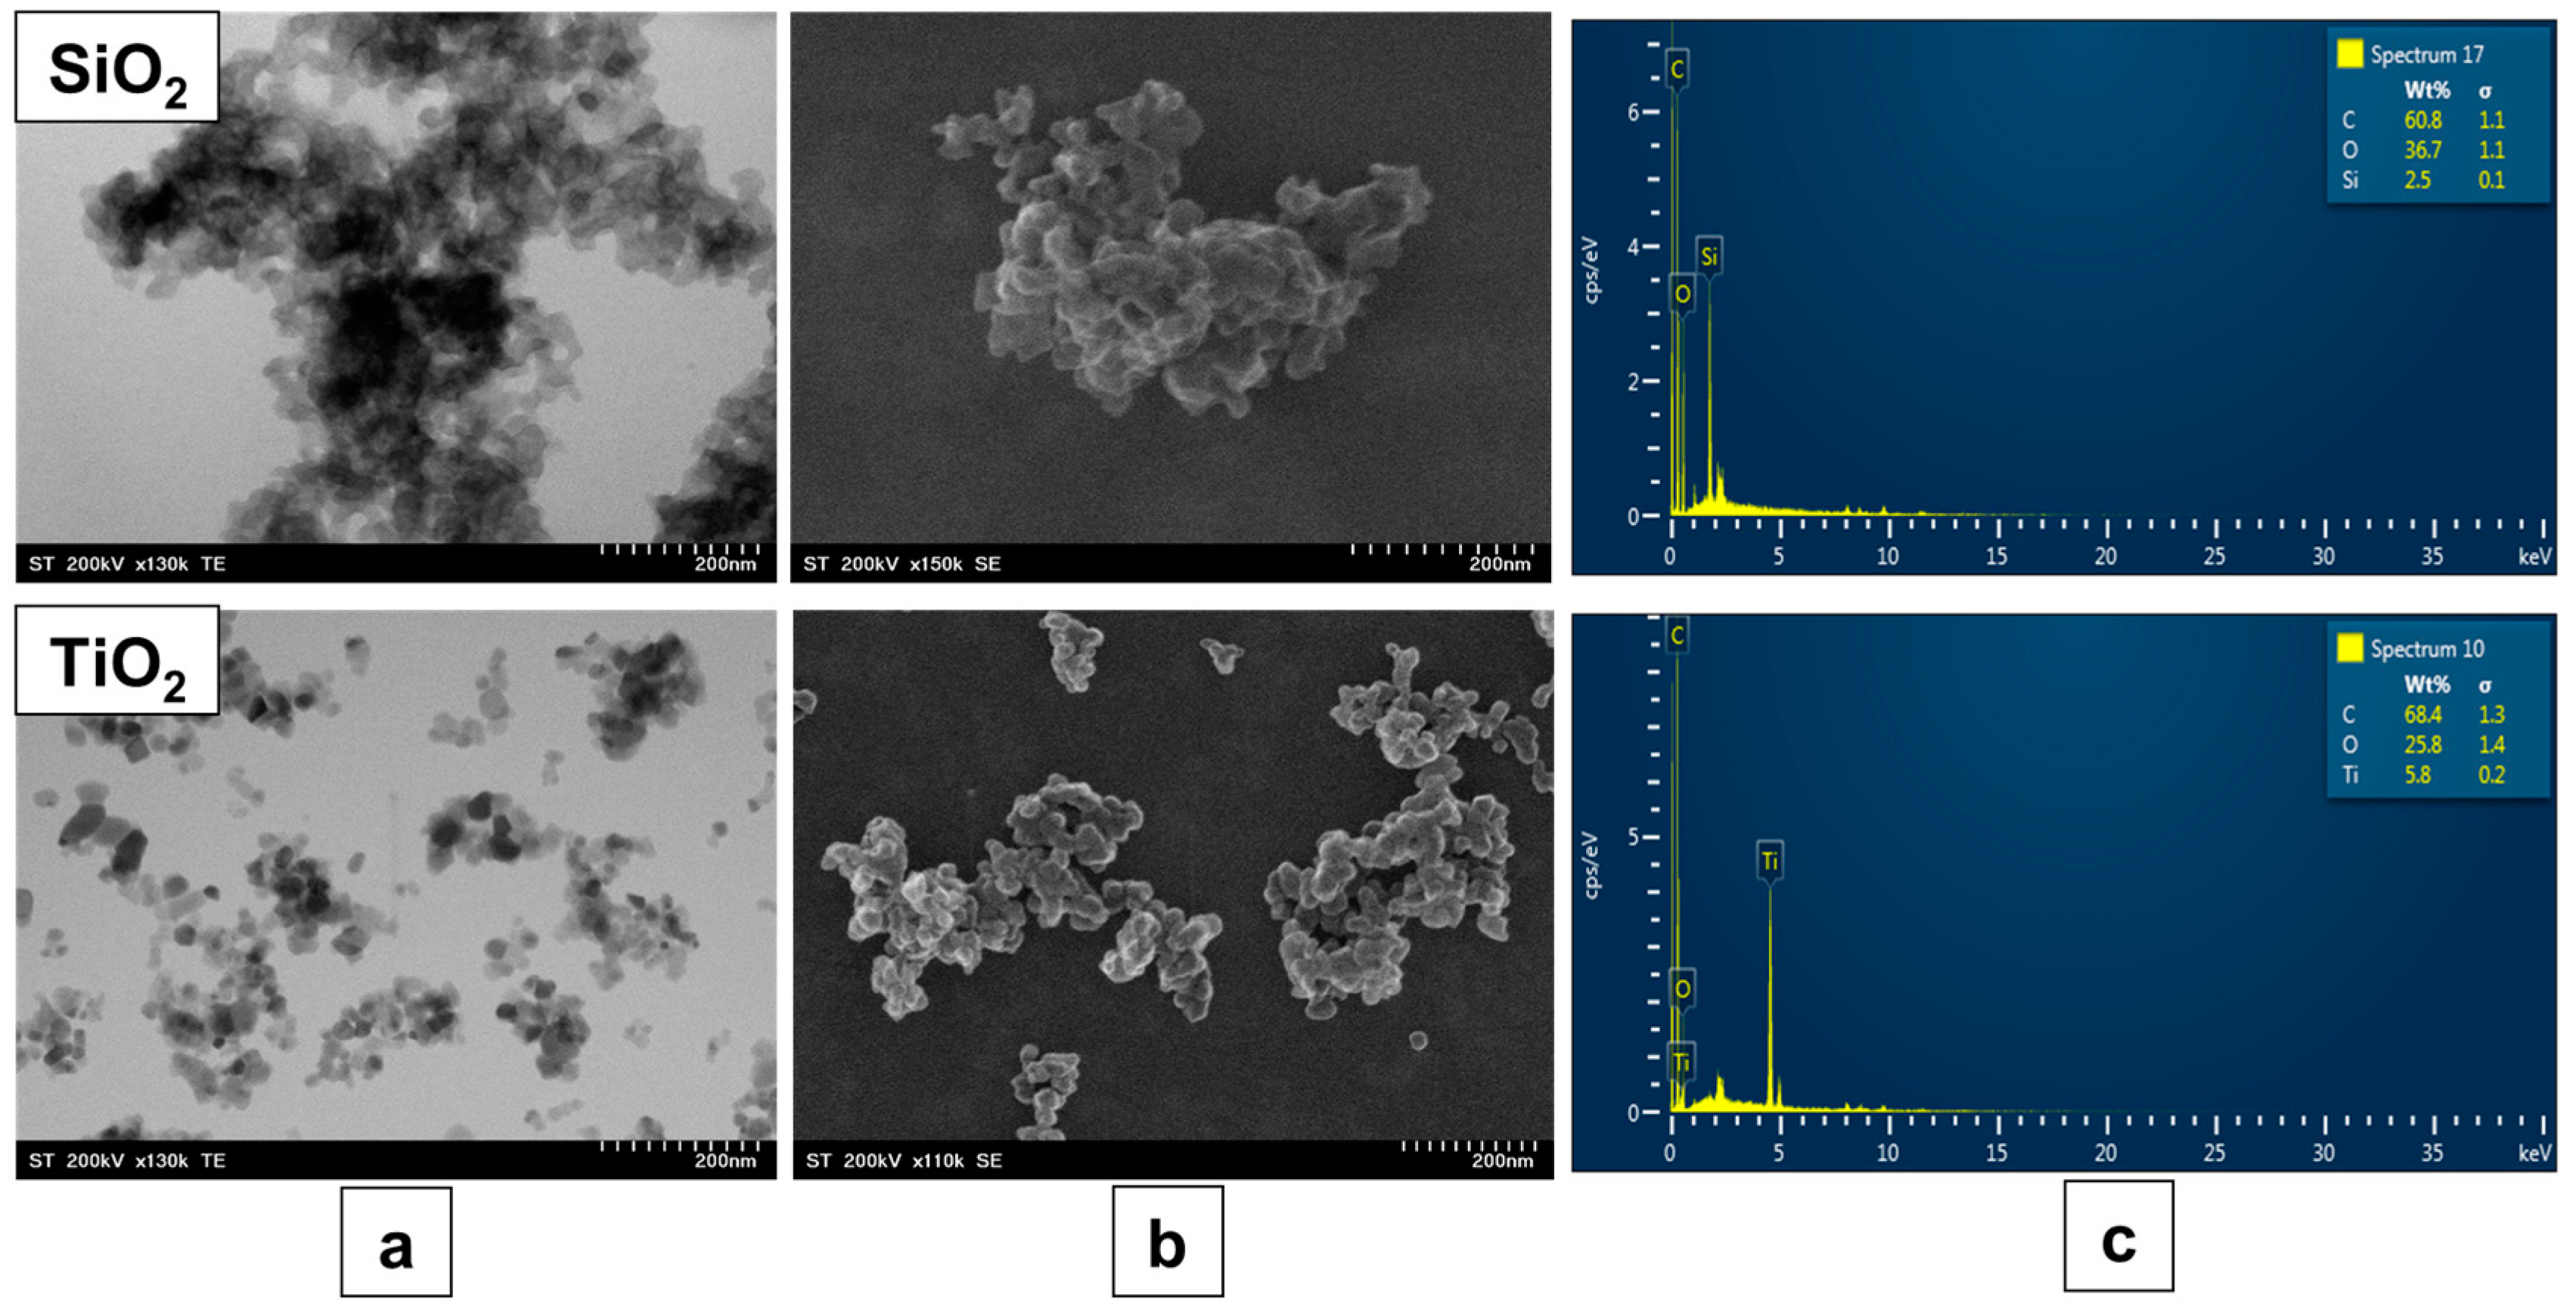
Figure 2 shows the morphology of the base oxide materials, SiO
2 and TiO
2, by TEM and SEM images, as well as their composition analysis obtained by EDX spectroscopy. The TEM images offer a comprehensive view of the morphology and size distribution of SiO
2 and TiO
2 nanoparticles. The SiO
2 nanoparticles exhibit a spherical shape with a relatively uniform size of approximately 20 nm. Their smooth surfaces and uniform dispersion indicate a low degree of aggregation. TiO
2 nanoparticles exhibit a more irregular morphology, with a polyhedral shape of approximately 30 nm. The particle sizes are relatively uniform, although a slight agglomeration is observed, which is typical for metal oxide nanoparticles due to their high surface energy. The SEM images provide complementary information about the surface texture and general particle distribution. The SiO
2 samples show a relatively smooth and porous surface morphology while the TiO
2 samples, on the other hand, exhibit a rougher surface texture, with the formation of small, aggregated clusters due to particle–particle interactions. From a morphological point of view, both investigated surfaces are considered suitable for use as base materials in light adsorption applications.
Thereafter, all binary oxide composite samples were morphologically characterized using SEM microscopy to highlight the sample homogeneity, while the presence of the second oxide phase (CuO or SrO) was identified through EDX spectroscopy.
Figure 3 and
Figure 4 present the microscopy images of the SiO
2–CuO and SiO
2–SrO composites samples, as well as the TiO
2–CuO and TiO
2–SrO composite samples, respectively. In both cases, images are shown at two different concentrations of the secondary oxides, offering a detailed view of their surface morphology. Additionally, the figures include the composition spectra obtained from the samples, which offer insights into their elemental distribution and confirm the presence of specific phases within the composite materials.
In both SiO2- and TiO2-based composites, the addition of the second oxide phase (CuO or SrO) is not visible in the microscopic images. This is mainly due to the small amounts involved (1 and 2 wt%) and the substantial difference in nanoparticle size between CuO or SrO and the base oxide materials. In particular, no major aggregates of CuO or SrO are observed on the surface of the primary oxides, highlighting the good homogeneity of the binary composite materials. The EDX analysis reveals different concentrations of the second oxide used (CuO and SrO) at the two initial concentrations of 1 and 2 wt%. The obtained data should be interpreted considering the surface contamination with carbon, which is likely due to the washing of the samples with solvent and their processing in air.
Relatively high concentrations of carbon were detected in the EDX spectra, but these values were not excluded from the analysis in order to preserve the accuracy and integrity of the measurements. However, it should be noted that the presence of carbon results from surface contamination with residual solvents, exposure to ambient air, and adsorption of atmospheric CO2 during sample preparation, drying, and storage. In addition, it is known that the porous structures of TiO2 and SiO2 can retain carbon-containing species, which cannot be completely removed by conventional washing and drying steps. However, this residual carbon in no way affects the optical properties of the final composite materials.
TEM measurements, along with elemental mapping for each composite sample, were performed and are presented in the
Supplementary Materials (Figures S1–S8). These results confirm the absence of major CuO or SrO aggregation and support the good homogeneity of the binary composite materials.
Additionally, to further highlight the structure of the binary oxide composites, FTIR spectroscopy was employed.
Figure 5 shows the spectra of pure SiO
2 nanoparticles (A) and pure TiO
2 nanoparticles (B).
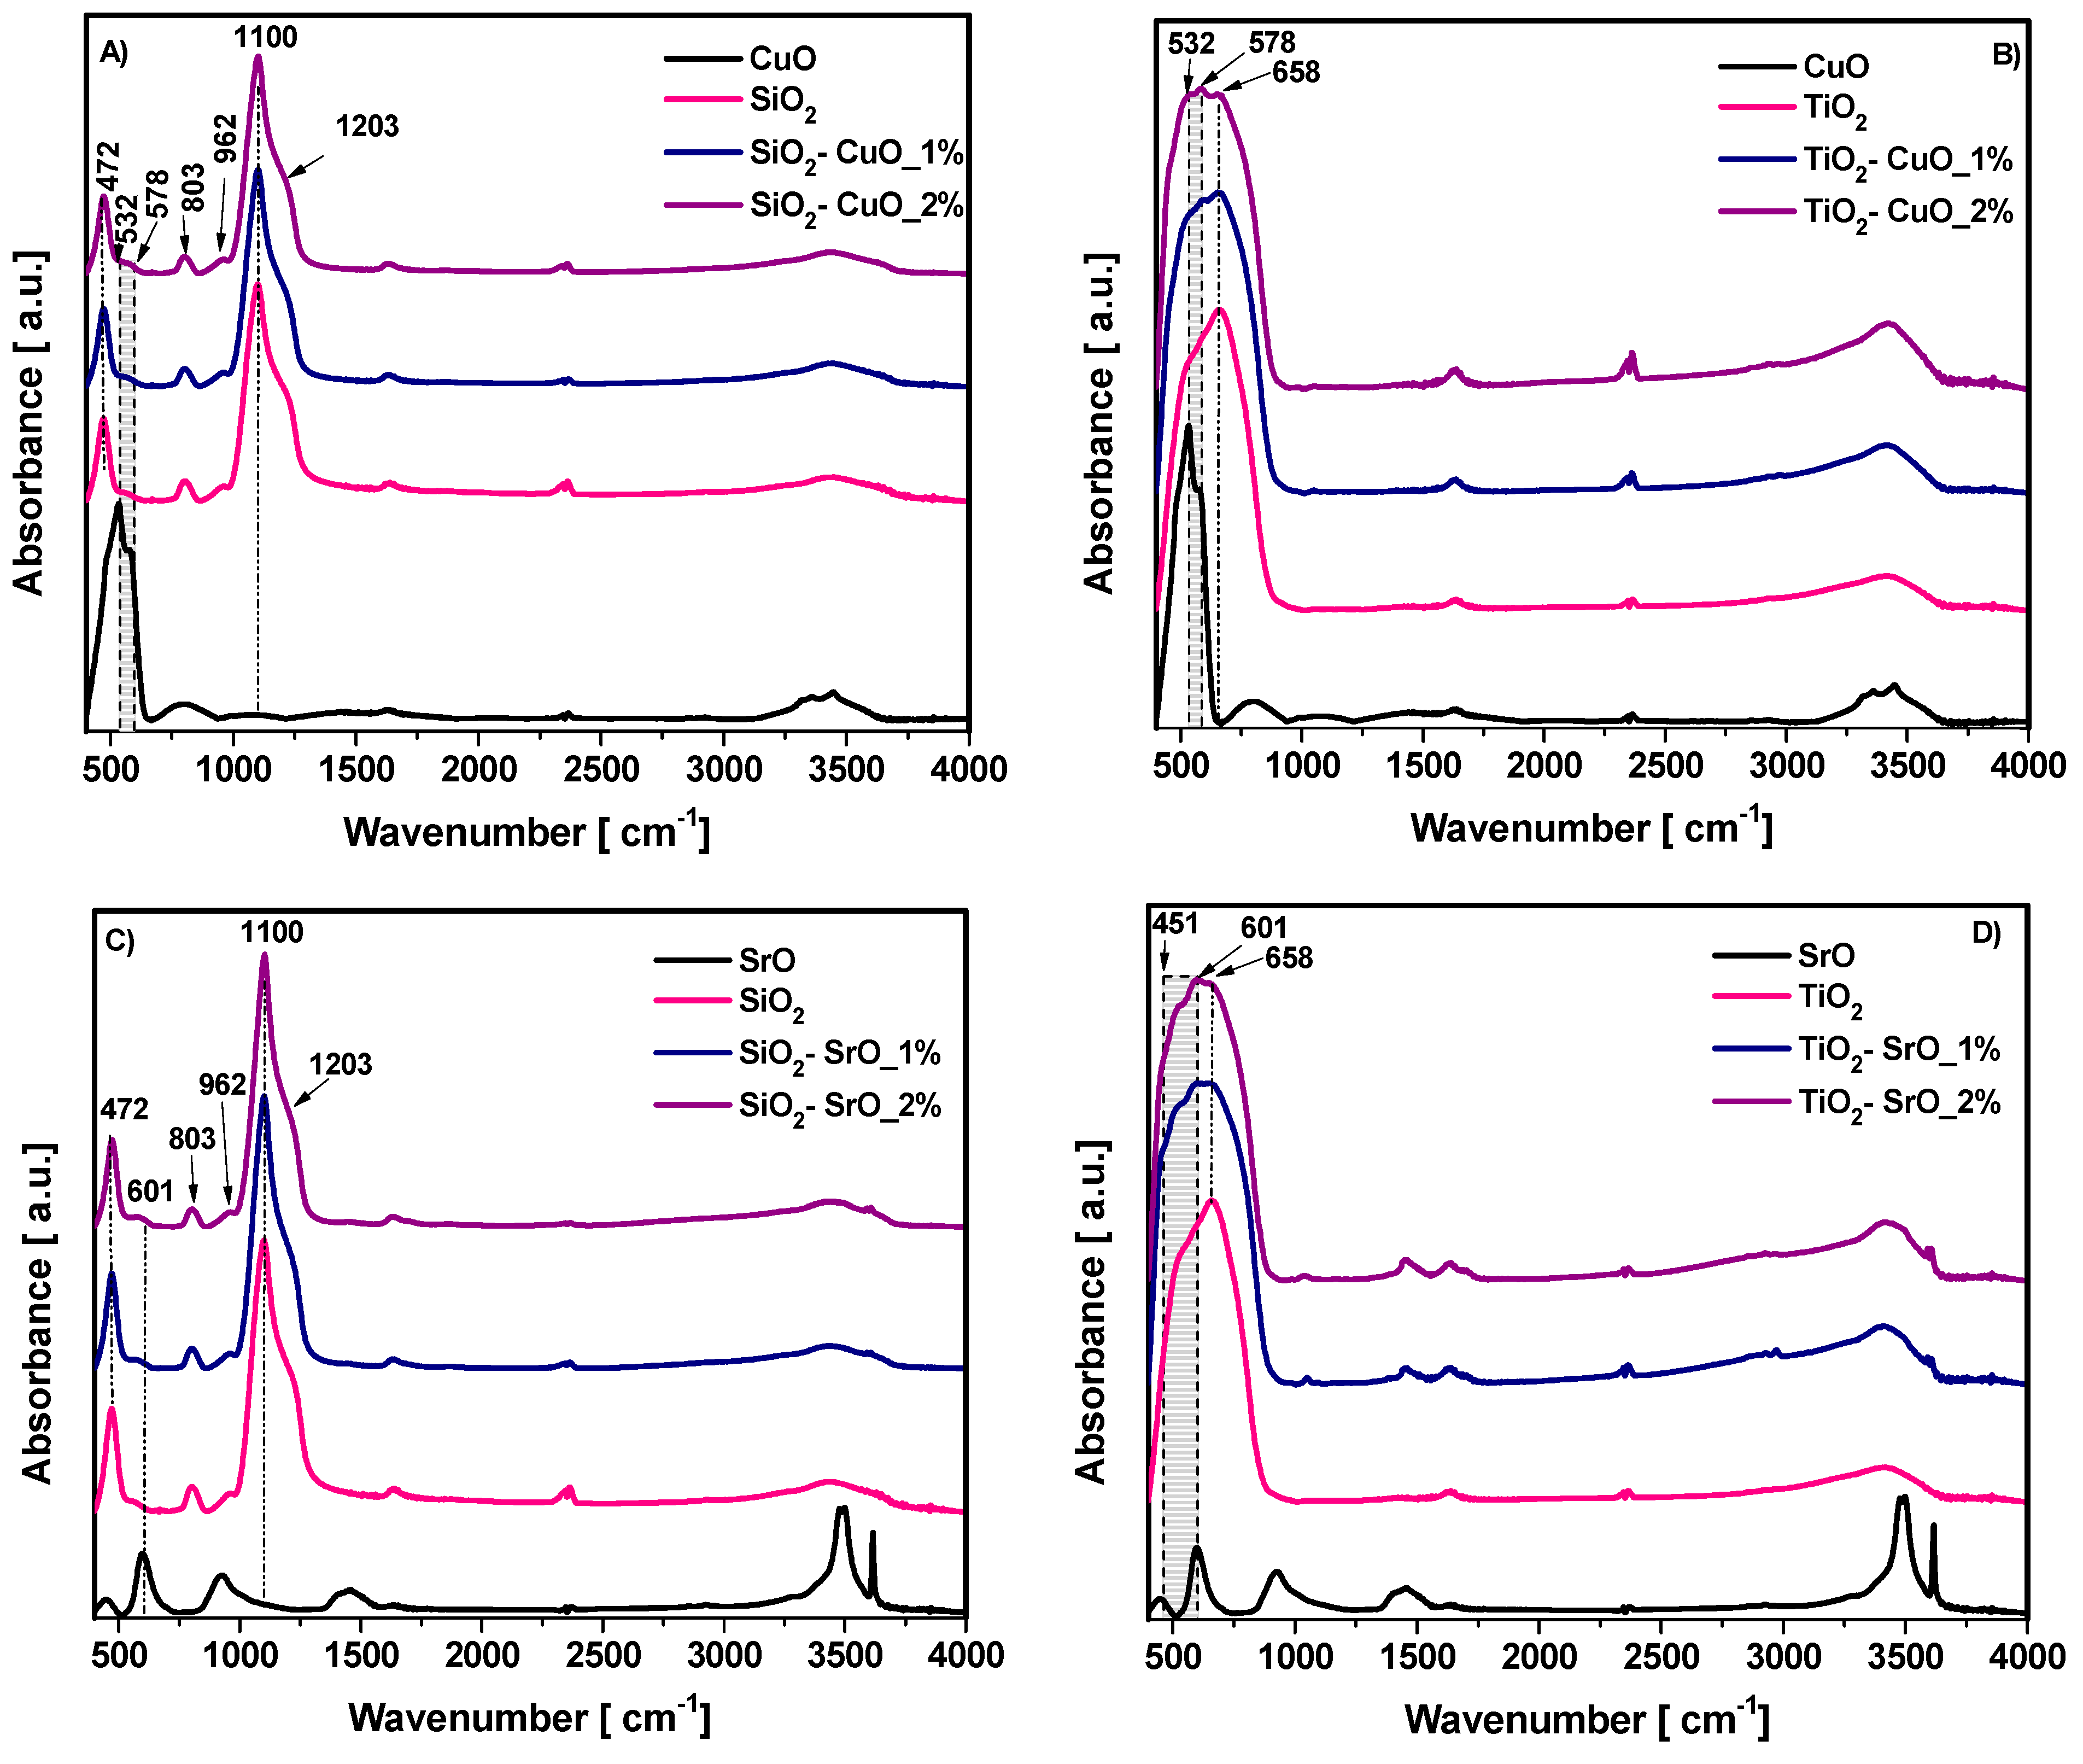
Figure 5A shows the most important characteristic peaks of pure SiO
2 nanoparticles, including the intense Si–O–Si asymmetric stretching vibration around 1100 cm
−1; the symmetric stretching at ~800 cm
−1; the bending mode near 470 cm
−1, indicating the presence of silica; but also a smaller peak which appears as a shoulder around 960 cm
−1, indicating the partial presence of silanol (-SiOH) groups, often associated with surface hydroxylation. The broad peak in the 3300–3500 cm
−1 region, is attributed to O–H stretching from adsorbed water or surface hydroxyl groups; and the small peak around 1600 cm
−1, corresponding to H–O–H bending vibrations associated with physically adsorbed moisture. The band appearing around 2360 cm
−1, attributed to the O = C = O stretching vibration, suggesting the possible adsorption of CO
2 molecules on the surface of the SiO
2 nanoparticles.
Figure 5B shows the characteristic bands of TiO
2 pure nanoparticles, with the most important peaks observed around ~650 cm
−1, attributed to the Ti–O–Ti stretching vibrations, specific to anatase phase. In addition to the characteristic peaks of TiO
2, similar to SiO
2 nanoparticles, bands attributed to water and CO
2 are also observed, indicating the presence of adsorbed moisture and possible CO
2 adsorption on the nanoparticle surface.
The
Figure 6A, presented the FTIR spectra of pure SiO
2 nanoparticles, CuO nanoparticles and binary SiO
2-CuO composite at two different CuO concentrations. In the FTIR spectrum of CuO nanoparticles, in the 470–580 cm
−1 wavenumber region, the relevant peaks associated with the vibrational band of Cu–O bonds appear. In the composite SiO
2-CuO samples, for both CuO concentrations, the following changes are observed: in the wavenumber region of 520–610 cm
−1, a slight increase in peak intensity is observed with the increase in CuO concentration and the SiO
2-specific peak at 472 cm
−1 exhibits a slight shift to lower wavenumbers, suggesting potential interactions between CuO and the SiO
2 matrix; the SiO
2-specific peak at 1204 cm
−1 exhibits a slight shift under the influence of CuO, suggesting minor structural modifications. These structural changes are also reflected in the slight decrease in intensity of the 803 cm
−1 peak, which is characteristic of SiO
2.
Similarly to the SiO
2–CuO composites,
Figure 6B compares the spectra of pure TiO
2 nanoparticles and CuO nanoparticles with the spectra of the binary TiO
2-CuO composite phases at two different CuO concentrations. In this case, in the wavenumber region specific to CuO, 470–580 cm
−1, a slight increase in the intensity of the three characteristic CuO peaks is observed as the CuO concentration increases.
Figure 6C presents a comparative analysis of the absorption spectra of pure SiO
2 nanoparticles and SrO nanoparticles with the spectra recorded for the binary SiO
2-SrO composite mixtures at two different SrO concentrations. In the FTIR spectrum of pure SrO nanoparticles, the following characteristic peaks can be observed around 451 cm
−1 and 601 cm
−1 attributed to different vibrational modes of SrO. In the SiO
2-SrO composite samples, regardless of SrO concentration, the following modifications are observed: in the wavenumber range of 520–625 cm
−1, an increase in the SrO-specific peak is observed as the SrO concentration in the composite increases. Similarly to the SiO
2-CuO composites, the SiO
2-specific peak at approximately 457 cm
−1 and 1200 cm
−1 peak shifts towards lower wavenumbers; meanwhile, the 803 cm
−1 peak decreases in intensity as the SrO concentration increases. This behavior can be attributed to the increase in the effective dipole moment in the presence of SrO. A higher SrO concentration leads to stronger collective dipole changes, which enhance the absorption intensity in the SrO-specific spectral region while causing certain SiO
2 peaks to weaken or slightly shift.
Figure 6D compares the spectra of pure TiO
2 nanoparticles and SrO nanoparticles with the spectra of the binary TiO
2-SrO composite phases at two different SrO concentrations. In this case, at 451 si 601 cm
−1 wavenumbers, the SrO peak intensity increases with rising SrO concentration in the composite, accompanied by a slight shift in the TiO
2-specific peak towards lower wavenumbers. This behavior suggests the coexistence of both oxide phases in the composite material and indicates a physical interaction between SrO and TiO
2, likely due to structural modifications and changes in local bonding environments.
3.1. Optical Properties
The optical characteristics, such as the transmittance, absorption, absorption coefficient, band gap energy, Urbach energy, refractive index, and the color properties of pure TiO2 and SiO2 nanoparticles with two different concentrations of CuO (1, 2 wt%) and SrO (1, 2 wt%), have been explored using UV-Vis spectroscopy in the spectral range 200–850 nm.
3.2. Transmittance Spectra
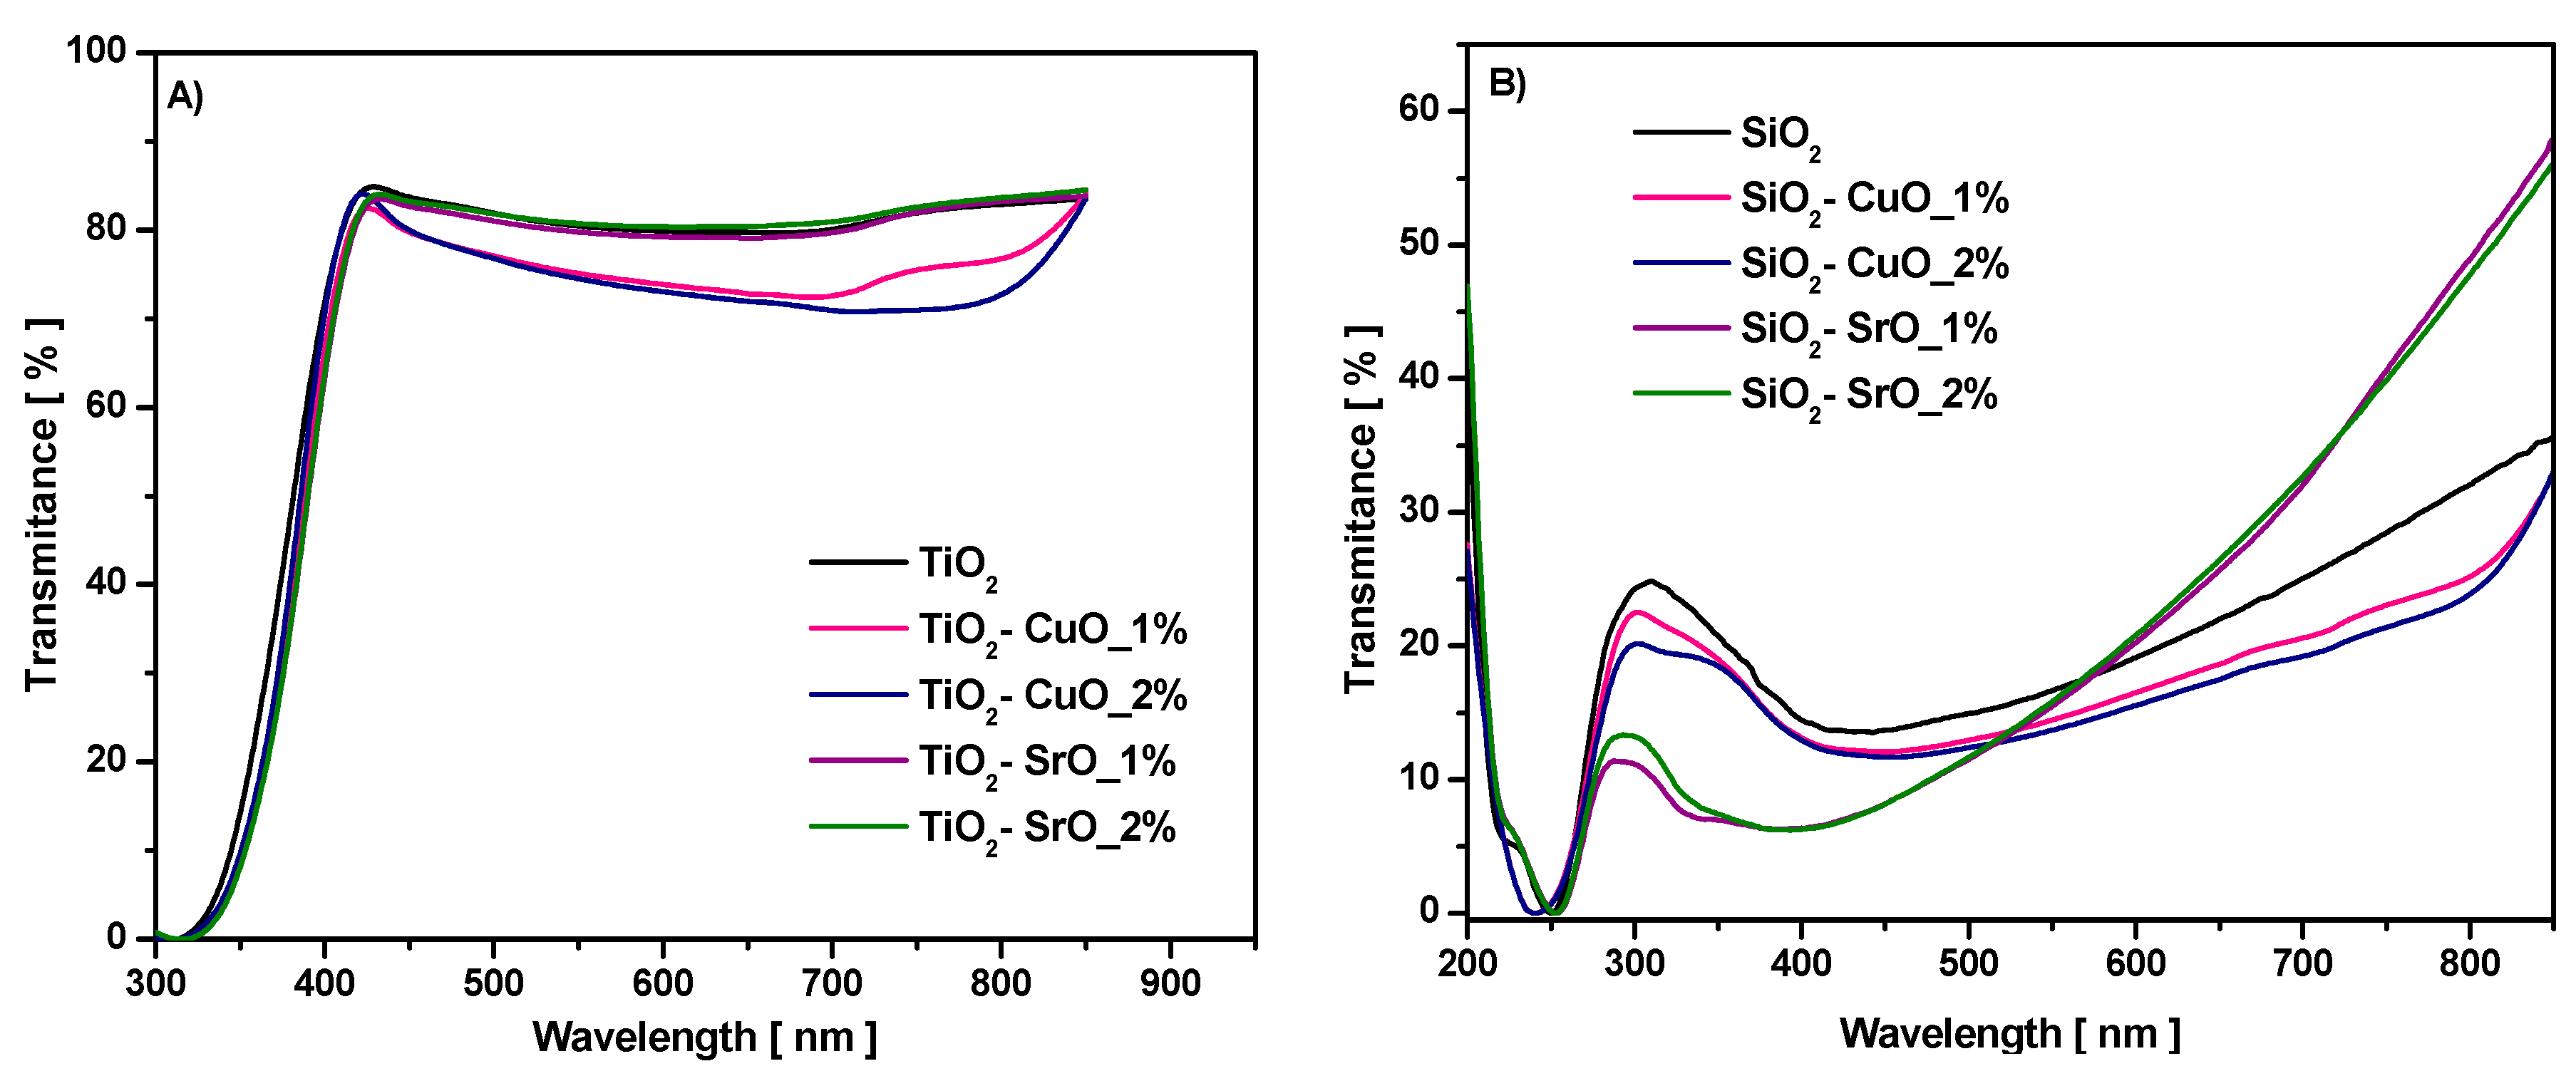
Transmittance spectra as a function of wavelength for studied samples are illustrated in
Figure 7. In the visible region, TiO
2-CuO composites have up to 82% transmittance, which is excellent for solar cell applications [
33]. The value of maximum transmittance for the TiO
2-CuO composite was Tmax = 82% for 1% CuO and 84% for 2% CuO. For the TiO
2-SrO composite, the transmittance values increase with the concentration, from Tmax = 83.5 to 84%. For the SiO
2 sample (
Figure 7B), the T% reached 25% in ultraviolet light at λ = 309 nm. In the visible region, the T% increases with increasing of the incident photon wavelength and reached Tmax = 35% in NIR region at λ = 850 nm. For the SiO
2-CuO composite, transmittance spectra slowly decrease. It is also observed that incorporation of SrO improved the transmittance spectrum of pure SiO
2 in the 575–850 nm region; the transmittance increases from 35% up to 57% at the λ = 850 nm.
3.3. UV-Vis Absorption Spectra
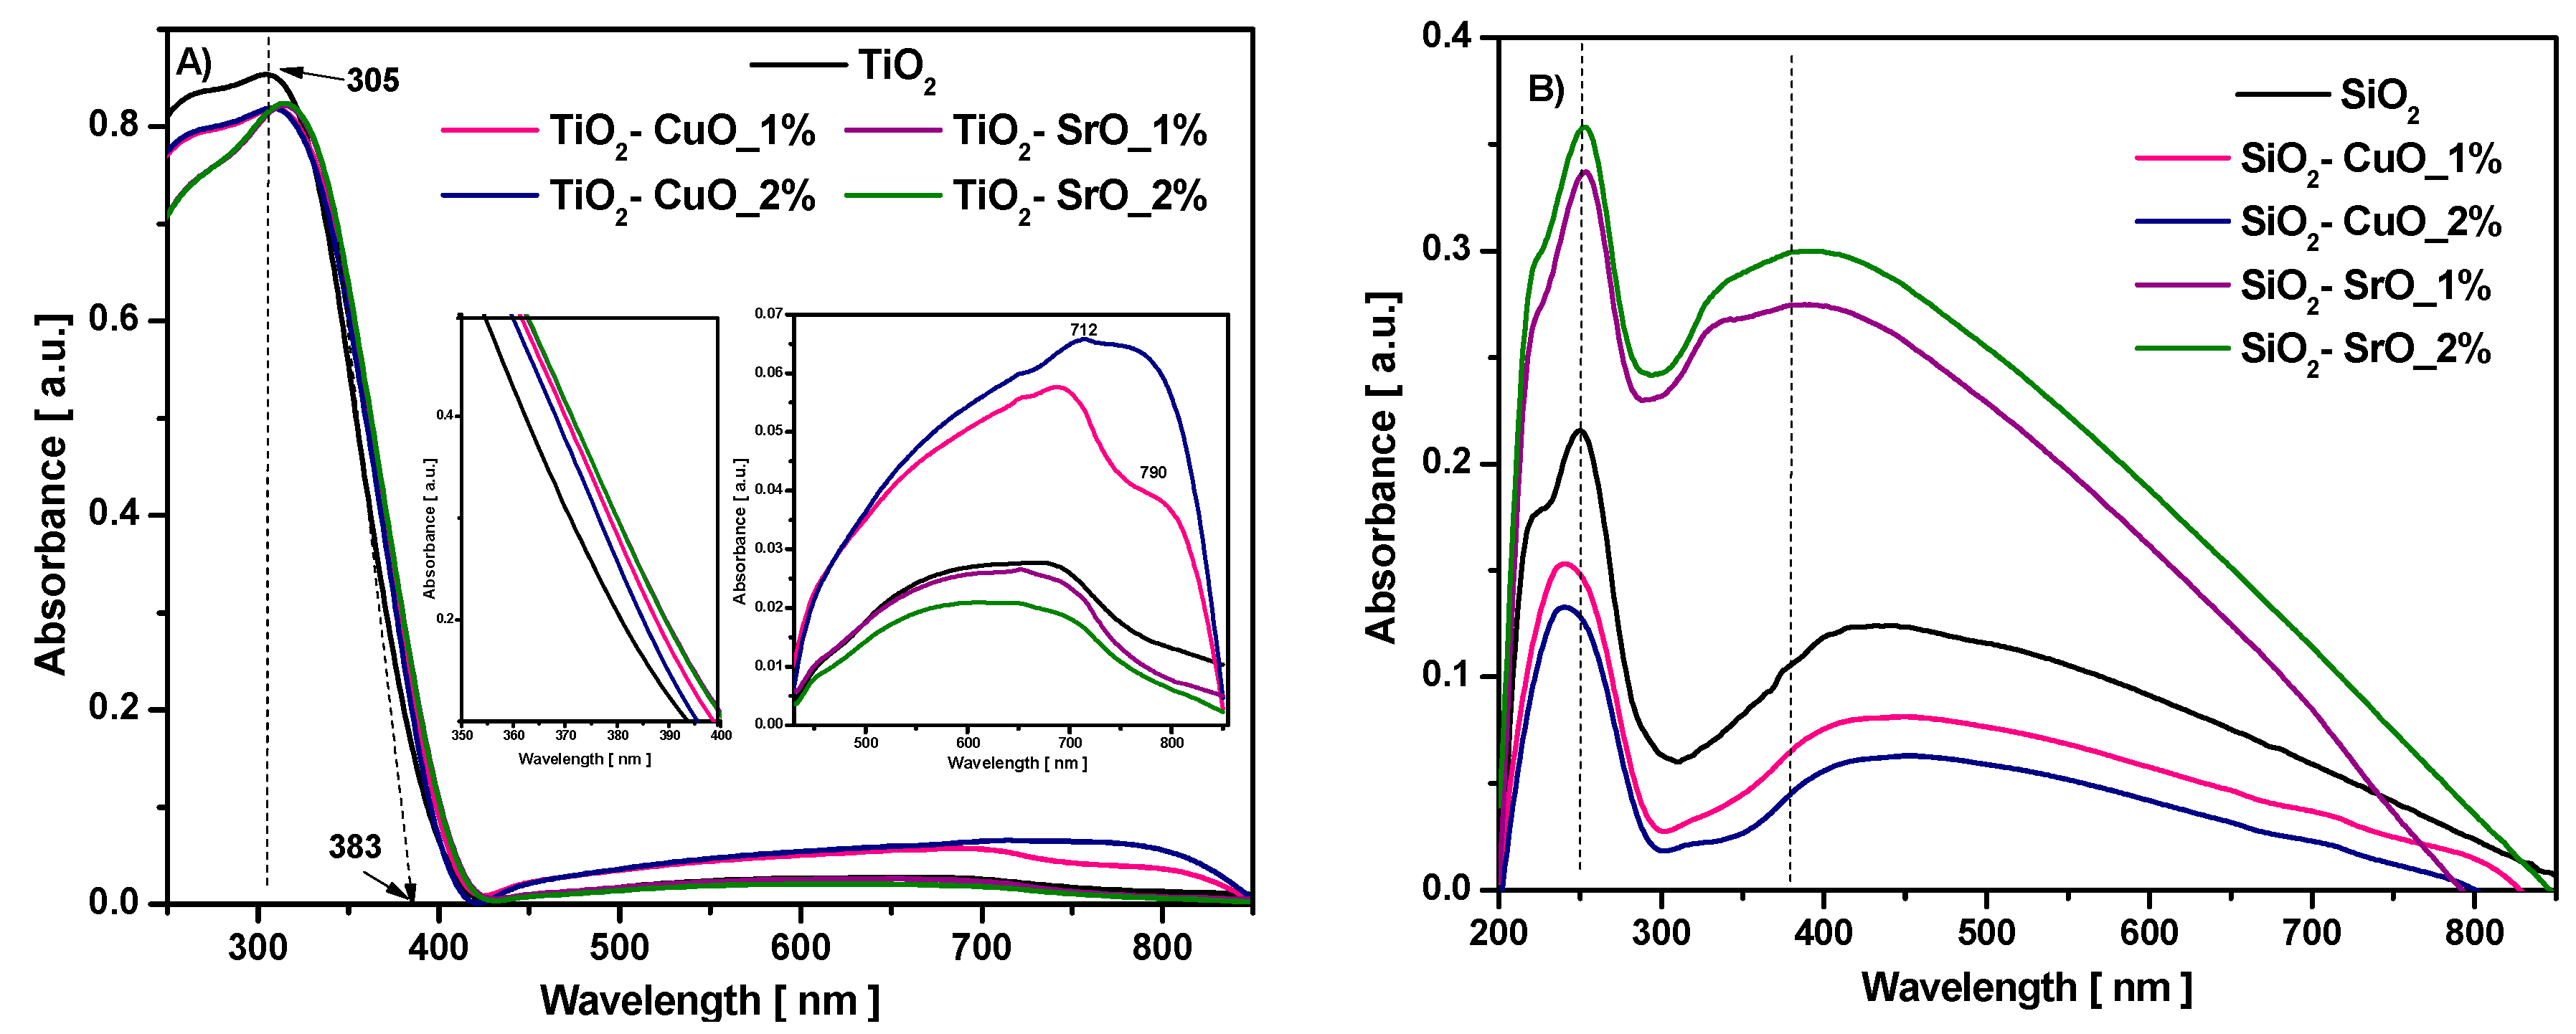
UV-Vis absorption spectra for the investigated samples are illustrated in
Figure 8. As may be observed, the minimum transmittance of the samples corresponds to the maximum absorption wavelength, according to Beer Lambert law.
The optical absorption spectra of pure TiO
2 (
Figure 8A) exhibited a strong absorption band in UV region, located at 305 nm, corresponding to the charge transfer region of O (2p)−Ti (3d) and broader absorption in the Vis region extended up to 800 nm, with a shoulder at 683 nm, typical of structural defects such as Ti
3+ and/or to oxygen vacancies (V
0) which form defect complexes and color centers states [
34,
35].
For the TiO
2-CuO composites, the absorption maximum band shifted towards higher wavelengths, from 305 nm to 309 and 308 nm for 1% CuO and 2% CuO, respectively, and to 314 and 315 nm for TiO
2-SrO composites. For TiO
2-CuO composites, the absorption spectra may be an overlap of the band structures of TiO
2 and CuO. The overlaps of the maximum absorption of TiO
2 with the d–d electronic transition of the Cu
2+ ion,
2B
1g →
2E
g, which occurred between 400 and 800 nm [
36], explained the variations in the positions of the maximum absorption of Cu-doped TiO
2. It is also seen that the absorption edges of studied samples show a non-linear red shift in the visible light region, depending on the composition and doping level.
As may be observed in the inset of the figure, the intensity of the broadened absorption band from the Vis region slowly increase only for TiO
2-CuO composites and shifts towards higher wavelength, from 683 nm to 689 nm and 714 nm, respectively, with the increase CuO content. In addition, the appearance of an absorption shoulder in the NIR region, located around 790 nm, suggests the presence of Cu
2+ in the prepared samples. The broad band centered about 790 nm is attributed to the
2B
1g-
2B
2g transition of Cu
2+ ions in octahedral coordination with a strong tetragonal distortion [
37] and is due to the formation of five-fold coordinated CuO
5 centers [
38]. By increasing the CuO concentration, the absorption shoulder became more evident.
The absorption spectra of pure SiO
2 (
Figure 8B) presented a maximum absorption in the UV region, located at 251 nm, and a broad absorption between 309 and 850 nm, with a maximum at 429 nm, related to different defects of SiO
2 nanoparticles [
36]. For SiO
2-CuO composites, the band located at 251 nm shifted to a lower wavelength and for SiO
2-SrO composites, this band shifted slowly to higher wavelength and increased the absorption of SiO
2.
From our results, it can be inferred that addition of CuO was the most effective for visible light response of TiO
2 and SrO for SiO
2. Recent studies have demonstrated that the red shift in the absorption edge in nanomaterials can be attributed to several factors, including impurity-induced defects, surface and interface effects, lattice strain, oxygen vacancies, and crystallite size reduction [
39,
40]. The incorporation of dopants into the TiO
2 lattice modifies its electronic structure by introducing intermediate energy states, thereby influencing optical absorption properties [
41]. In particular, Sassi et al. [
42] reported that in Cu-doped TiO
2 films, red shifting results from decreased particle size and enhanced surface effects, whereas blue shifts are associated with quantum size effects. Additionally, increased CuO content has been linked to reduced crystallinity and enhanced structural disorder, which may further contribute to absorption edge shifts—similar to findings reported for CdO thin films [
43]. The reduction in crystallite size typically induces lattice strain and defects, which not only affect structural integrity but also play a crucial role in tuning the band structure and optical transitions of anatase TiO
2 [
44].
3.3.1. Band Gap Energy (Eg)
The absorption edge is directly connected with band gap energy (E
g) of material. The band gap determines the minimum amount of energy required for electron excitation from valance band (VB) to conduction band (CB). Energy difference between the top of VB and the bottom of CB corresponds to band gap Eg value. For TiO
2, the bottom of the CB is dominated by the empty Ti 3d electron and the top of the VB is occupied by O2p electron states [
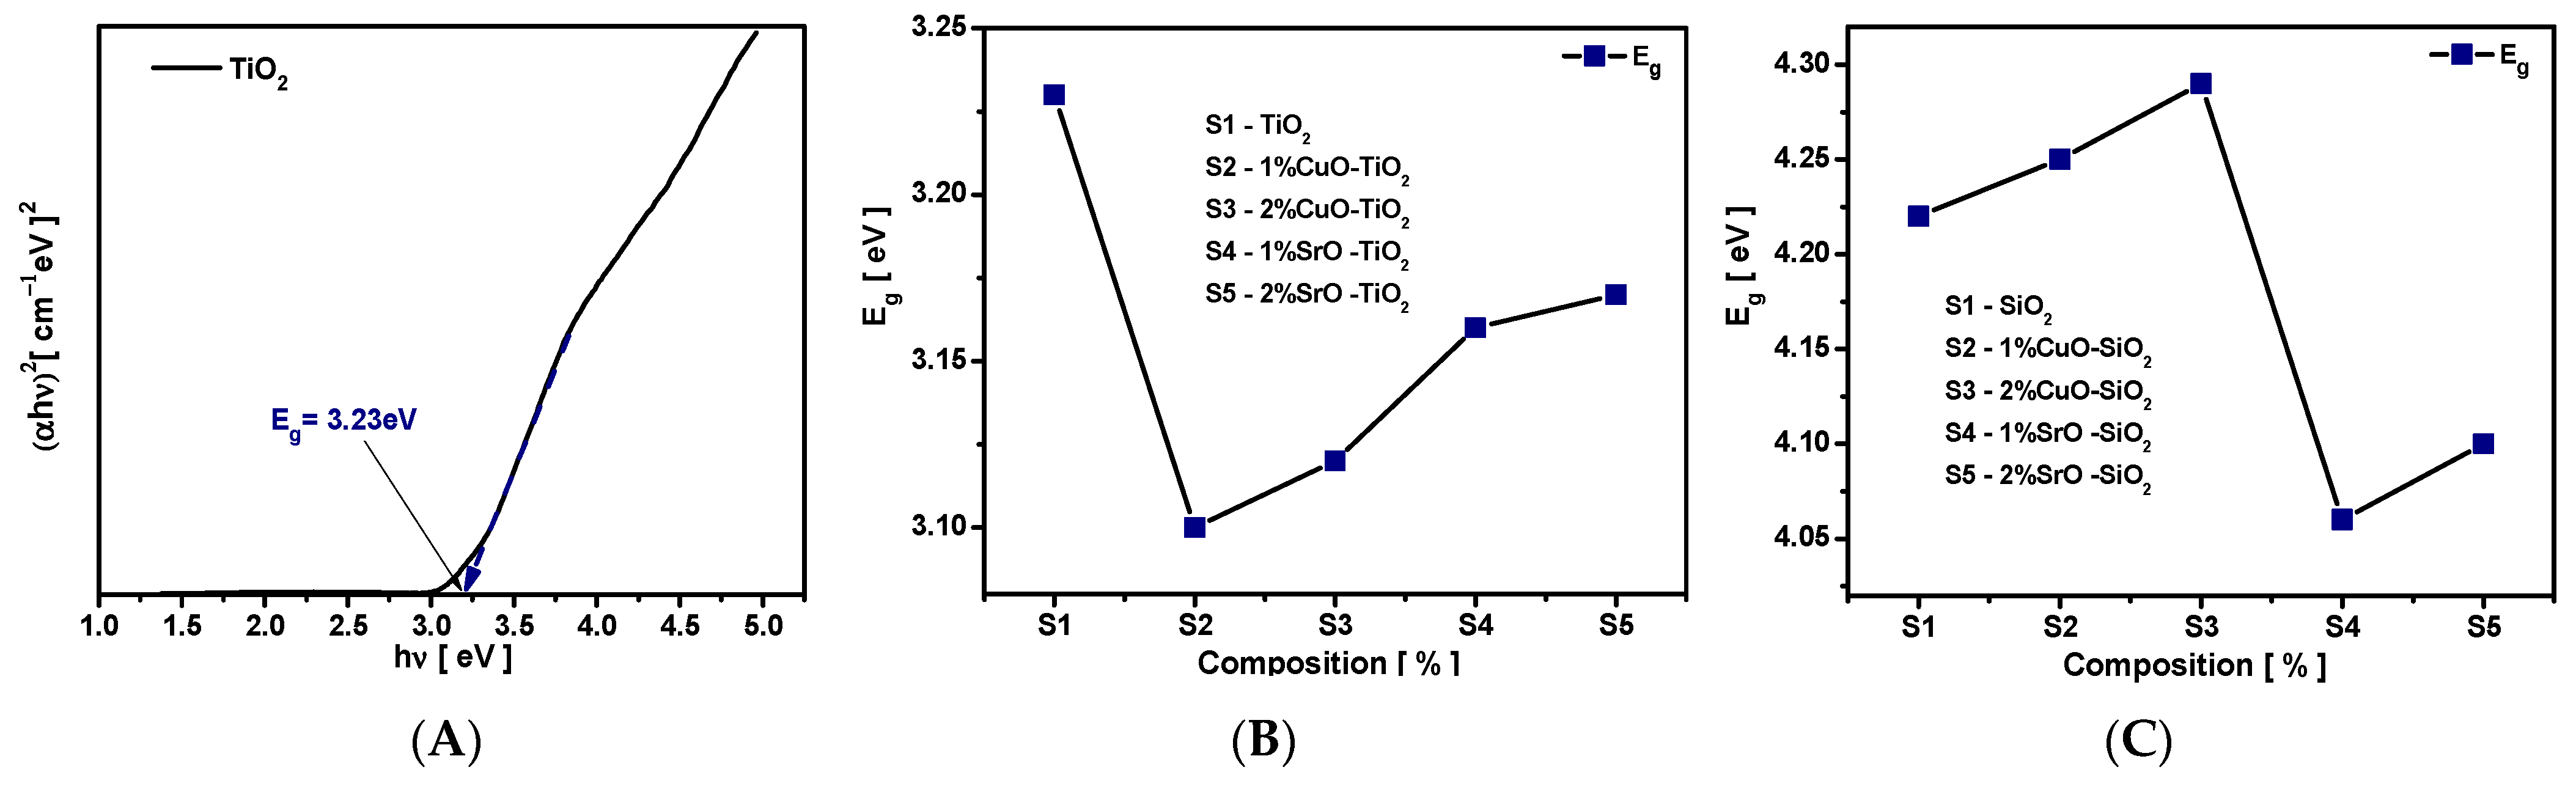
45]. The value of energy band gap (Eg) may be obtained by plotting (αhν)
n as a function of photon energy hν, where α is the absorption coefficient, ν is the frequency of light, h is Plank’s constant, and the exponent n depends on the type of transition: ½ for direct allowed and 2 for indirect allowed transition, respectively. For the investigated samples, the best fitting is observed for indirect transition, which means electrons must pass through an intermediate state to reach conduction band and transfer momentum to a crystal lattice. The values of band gap energy for the investigated samples were estimated from the intersection of the tangent line of plots (αhν)
2 to the energy axis, and extrapolating (αhν)
2 = 0, as may observed in
Figure 9 for TiO
2 sample.
The optical absorption coefficient α(ν) was determined through the equation [
41]
where A is the absorbance and d is the path length of the sample.
The energy axis was determined by converting the wavelength spectrum to energy from the following relation [
41]:
where E, c, and λ are the energy, speed of light, and wavelength of light.
The compositional dependence of (αhν)
2 for studied samples is illustrated in
Figure 9. It is shown that the E
g strongly depends on the variation in the chemical compositions. The E
g value obtained for the pure TiO
2 was 3.23 eV. For TiO
2-CuO composites, E
g decreases from 3.23 to 3.1 eV for 1% CuO and 3.12 eV for the 2% CuO sample. For TiO
2-SrO composites, the optical band gap diminishes from 3.23 to 3.16 eV for 1% SrO and 3.17 eVfor 2%SrO concentration. As may be observed in
Figure 9C the optical band gap values of the SiO
2 samples increased from 4.22 to 4.29 eV with increases in the concentration of CuO and decreased non-linearly from 4.22 eV to 4.06 for SiO
2-SrO composites.
As predicted from crystal field theory, Cu-doping TiO
2 promotes, due to hybridization between Cu 3d and O 2p orbitals, the formation of broad impurity bands states above the valence band of TiO
2 [
46]. Consequently, Cu content increases the Fermi level of TiO
2, creating an impurity conduction band inside the valence band of TiO
2. These two effects combined lead to red-shifting of the absorption edge, decrease the band gap of TiO
2 and improve substantially the absorption intensity in the visible light. Choudhury et al. [
47] notes also that Cu
2+ d states and oxygen defects create band states, thereby favoring electronic transition to these levels and resulting in lowering of band gap of TiO
2. Cho et al. [
48] find a similar trend for a Cu-doped TiO
2 photocatalyst prepared by the sol–gel technique followed by calcination.
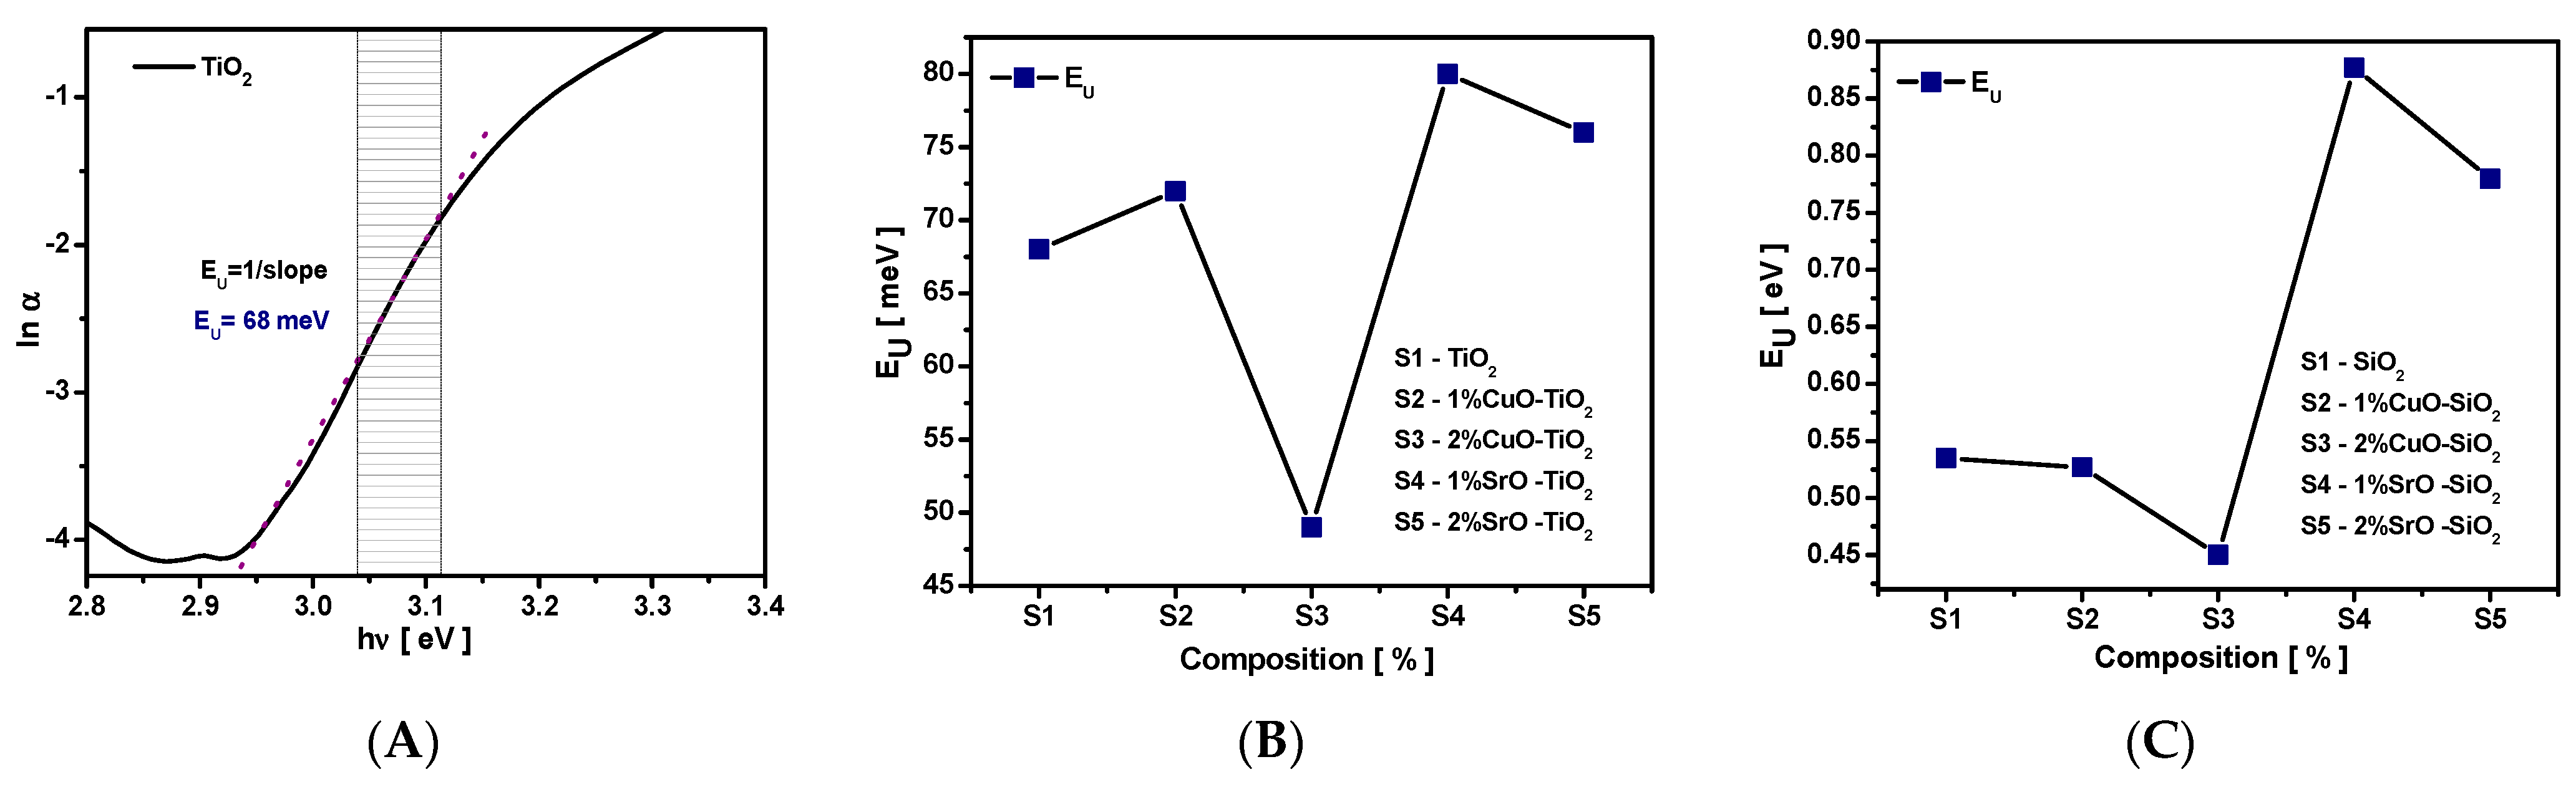
3.3.2. Urbach Energy (EU)
The lowering of the band gap is attributed to the presence of localized defect states in the band gap and is correlated with the material quality. These localized defect states, associated with the Urbach tail, or Urbach energy (E
U) produce an exponential absorption tail in the lower photon energy range of the absorption spectra. The E
U of 45 meV corresponds to the perfect crystal [
49]. Plotting the ln(α) as a function of hν (eV), the Urbach energy was determined from the slopes of the linear regions of the curves and by taking the reciprocals, as is illustrated in
Figure 10A. The compositional dependence of E
U for study samples is illustrated in
Figure 10C.
It was noticed that EU varies non-linearly with composition and is inversely related with band gap energy. The slight increase in the Urbach energy value, EU, from 68 meV for pure TiO2 to 71, 80, and 76 meV, respectively, was observed for 1%CuO and 1 and 2%SrO. For 2%CuO, a significant decay of the Urbach tail to 47meV was seen. The EU values of the SiO2 samples decreased from 0.535 to 0.451eV for SiO2-CuO composites and increased at 0.877 eV for 1% SiO2-SrO composites and decreased to 0.788eV for 2% SiO2-SrO composites. The higher values of Urbach energy found in SiO2-SrO composites suggest that these samples have more defects (impurity) and this consequently led to an increase in the concentration of localized states.
According to the Urbach rule, band tail states, typically induced by impurities or structural disorder, contribute to band gap narrowing and act as trap states for photo-generated carriers [
50,
51]. The observed decrease in E
U for 2% TiO
2–CuO and both SiO
2–CuO composites indicates a partial suppression of these states, correlating with the optical band gap widening. Additionally, SrO incorporation into SiO
2 nanoparticles leads to a red shift in the absorption edge and enhanced visible-light absorption.
3.3.3. Refractive Indices (n)
The refractive indices (n) of the studied samples are evaluated from the optical band gap values using the following relation:
The variation in refractive indices, n, with composition, is shown in
Figure 11. The estimated n value of the pure TiO
2 sample is 2.33 and 2.13 for pure SiO
2. As is observed in
Figure 11, n increases non-linearly from 2.33 to 2.71 for TiO
2 composites, and decreases from 2.13 to 2.12 and 2.11 with increasing CuO content in the SiO
2 sample. For SiO
2-SrO composites, n values increase from 2.13 to 2.16 for 1% SrO, and to 2.15 for higher SrO levels. Refractive index variations arise from scattering losses caused by the changes in material composition and densification.
Analysis of the results for the studied samples indicated that when the absorption edge red-shifted, the optical band gap decreased and the Urbach energy and refractive index increased, and when wavelength blue shifted, a reversible trend was observed. This variation may be related to physical crystal defects induced by dopants, and also to the particles size distribution within the samples. An increase in the particles size weakens quantum size effects, leading to red-shifting of the absorption edge and consequently decreasing the band gap energy and increasing refractive index. The increased refractive index observed in the TiO
2–CuO, TiO
2–SrO, and SiO
2–SrO composites is associated with their reduced band gap relative to pure TiO
2 and SiO
2, consistent with the red shift in the absorption edge into the visible region [
52]. A higher refractive index implies slower light propagation through the material, which is beneficial for enhancing light–matter interaction in solar cell applications. In contrast, the lower refractive index observed for SiO
2–CuO composites, compared to pure SiO
2, may be attributed to their wider effective band gap.
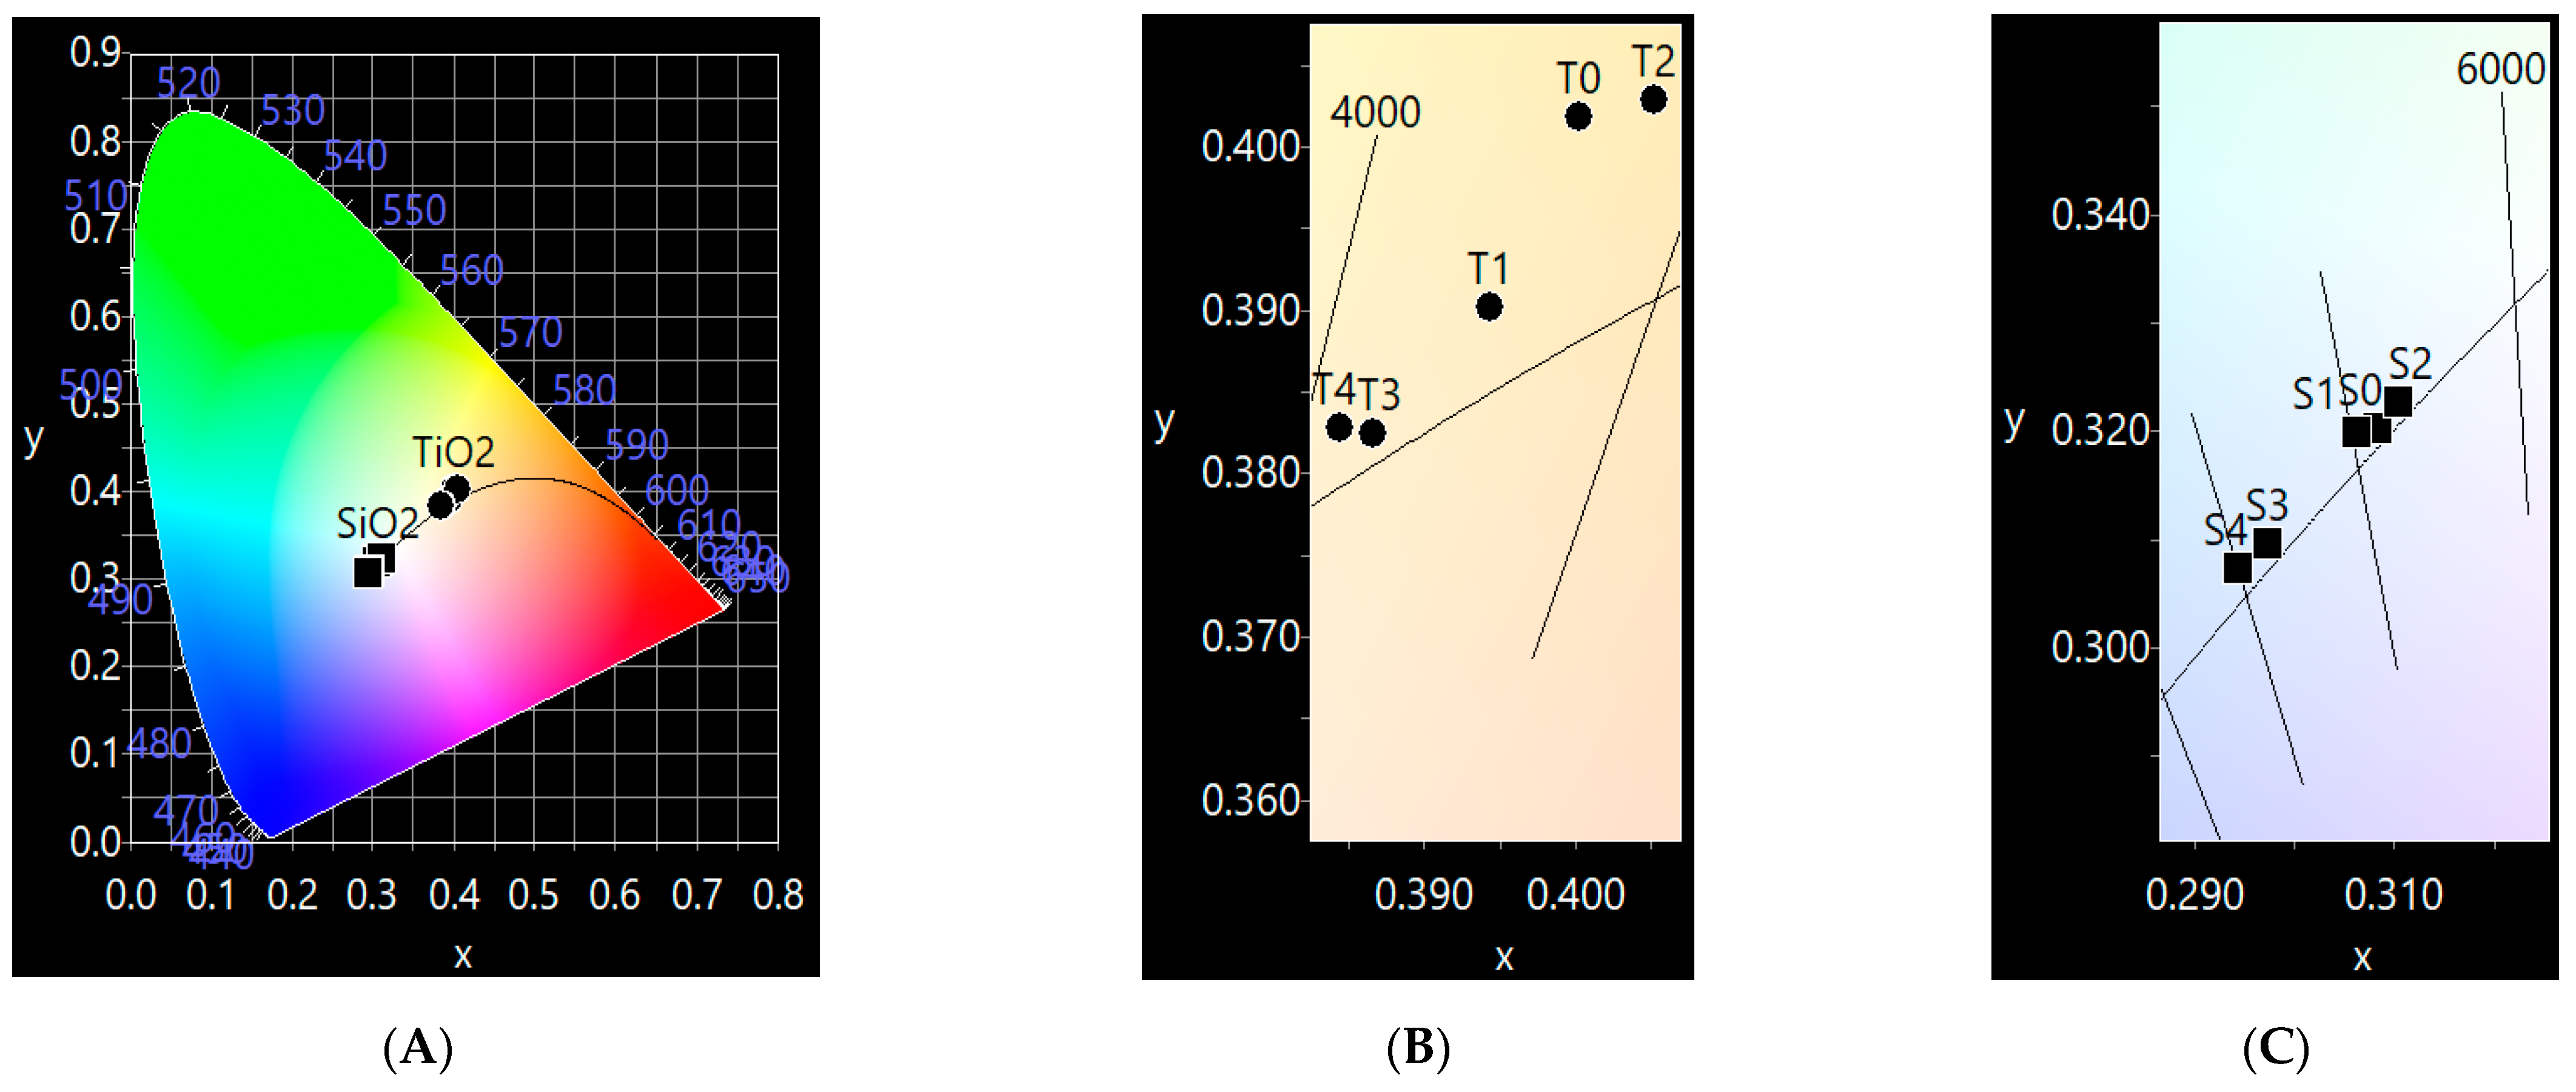
3.3.4. Color Coordinates (x,y)
The color coordinate (x,y) values were used to represent and define the range of colors achievable investigated samples using Commission International de L`Eclairage (CIE) chromaticity diagram. The color coordinates (x, y) were calculated based on the data obtained from UV-Vis spectra using CIE 1931 software (v. 7.0.).
Figure 12 shows the CIE 1931 chromaticity diagram of the prepared samples. It is observed that the estimated color coordinates for all TiO
2 samples were located in the yellow region of the visible spectrum, and for SiO
2 samples, the color coordinates are near to the standard white light (x = 0.333, y = 0.333). For pure TiO
2 samples, the color coordinates are x = 0.400 and y = 0.402 and the corresponding color coordinates for the SiO
2 sample are around x = 0.308 and y = 0.320. The slow variation in the color coordinates (x,y) of the TiO
2/SiO
2 composites may be attributed to the generation of defects that act as color centers which absorb the visible spectrum.


 and
and 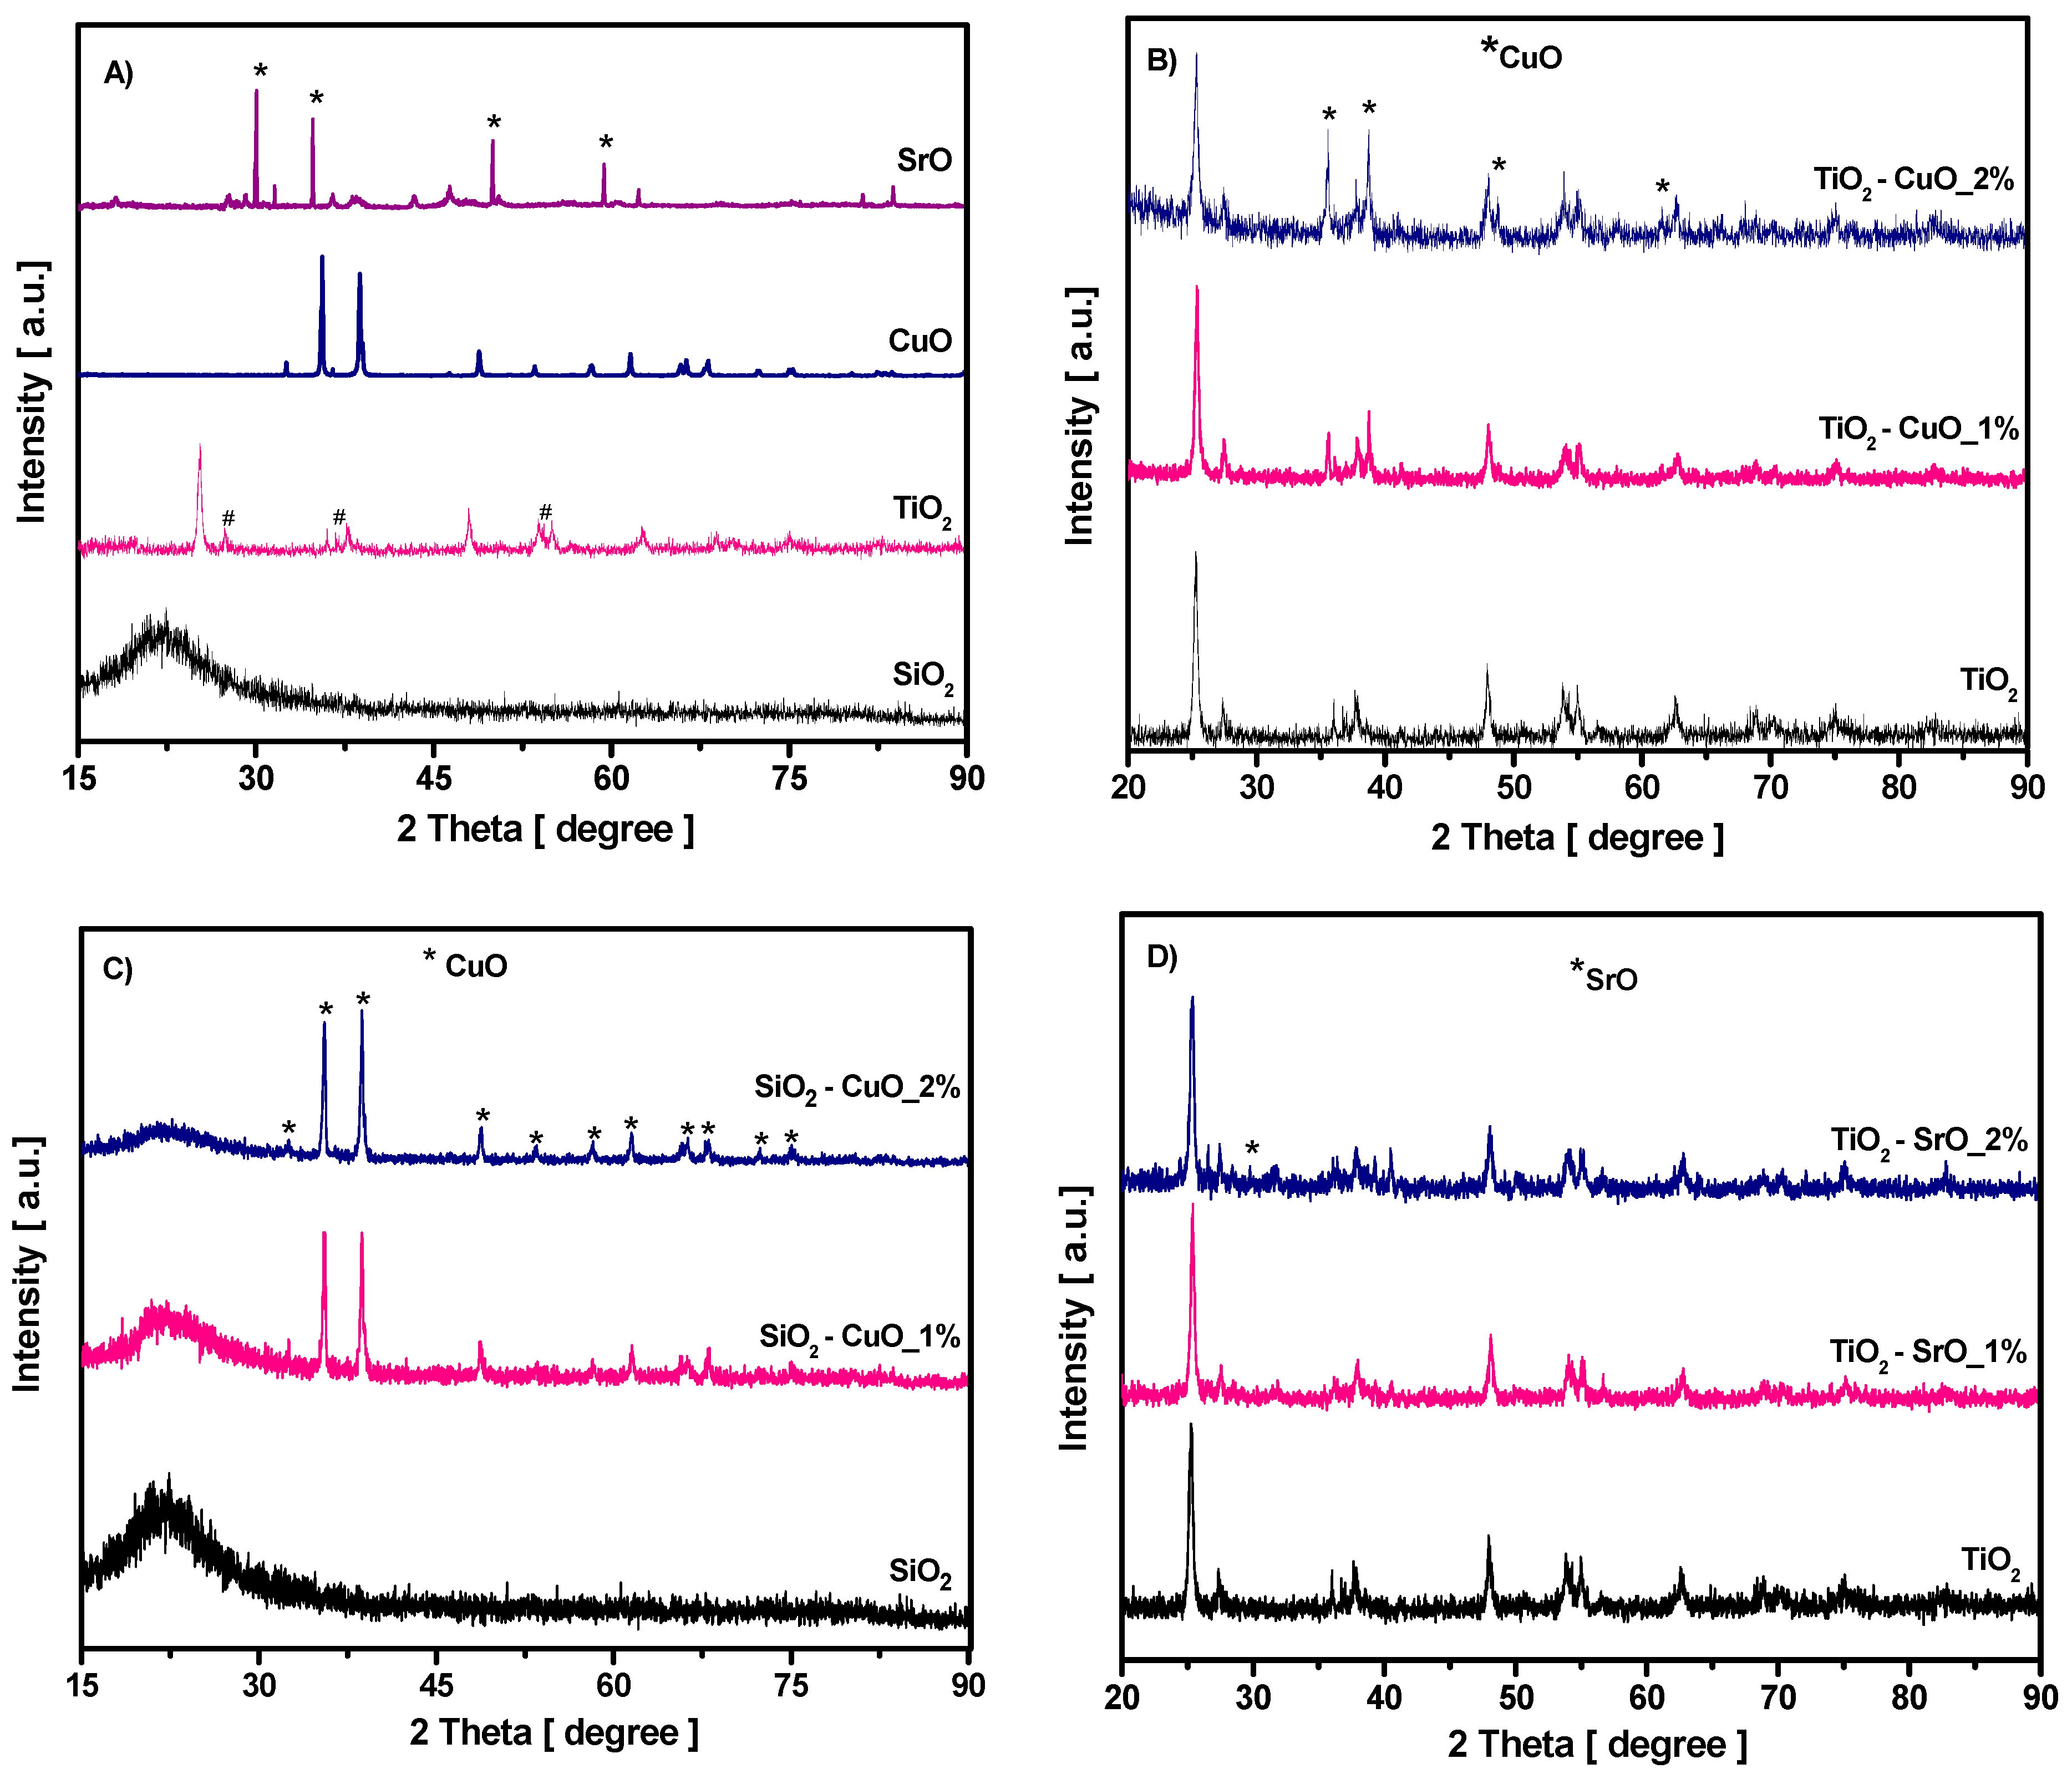


