Article

Seven New Irbesartan Salts: Significantly Improved Dissolution, Excellent Hygrothermal Stability, and Characteristic Supramolecular Synthons

1
National Engineering Research Center of Industrial Crystallization Technology, School of Chemical Engineering and Technology, Tianjin University, Tianjin 300072, China
2
Collaborative Innovation Center of Chemical Science and Engineering, Tianjin 300072, China
3
Asymchem Life Science (Tianjin) Co., Ltd., Tianjin 300072, China
*
Author to whom correspondence should be addressed.
Crystals 2025, 15(4), 342; https://doi.org/10.3390/cryst15040342
Submission received: 9 March 2025 / Revised: 30 March 2025 / Accepted: 1 April 2025 / Published: 4 April 2025
(This article belongs to the Section Crystal Engineering)

Abstract

:
Irbesartan (IRB) is a commonly used BCS Class II antihypertensive drug requiring dissolving capacity enhancement to address oral bioavailability limitations. In this work, seven new IRB salts were successfully synthesized, including one carboxylate (IRB-MAL) and six sulfonate salts (IRB-TOSA, IRB-BSA, IRB-4-CBSA, IRB-2, 5-CBSA, IRB-MSA, and IRB-CPSA). Their vitro dissolution, intrinsic dissolution rates (IDRs), thermal/hygroscopic stability (via thermal analysis, dynamic vapor sorption, and accelerated stability tests), and phase transition process (monitored by in situ Raman spectroscopy) were evaluated. The results revealed that IRB-TOSA, IRB-MAL, IRB-BSA, IRB-4-CBSA, and IRB-MSA salts exhibited IDRs of 0.3194–0.7383 mg/(cm2·min), all significantly higher than IRB, with dissolution concentrations increased by 14.9–113.6%. IRB-TOSA and IRB-4-CBSA salts demonstrated excellent hydrothermal stability. Single crystal structure analysis confirmed proton transfer from coformers’ sulfonic/carboxylic acids (deprotonation site, H-out) to IRB’s diazaheterocycles (protonation site, H-in) in IRB salts. Six sulfonate salts exhibited NH-in–H···OH-out and Nnon-H-in–H···OH-out hydrogen bonds, with the former absent in IRB-MAL. Furthermore, supramolecular synthon studies revealed distinct hydrogen-bonding patterns (e.g., bifurcated bonds in 2,5-CBSA and CPSA salts) that correlate with moisture resistance. Quantitative analysis of IRB salts suggested hydrogen bond strengths may influence their melting points (decomposition temperatures). This study demonstrates that IRB salts hold promise for advanced pharmaceutical applications.

Graphical Abstract

1. Introduction

Enhancing the dissolution of poorly soluble active pharmaceutical ingredients (APIs) remains a significant challenge in the pharmaceutical industry [1]. To address this issue, various solid-state forms have been explored, including polymorphs, amorphous forms, hydrates, salts, and cocrystals [2,3,4,5]. Among these, salts generally exhibit higher aqueous solubility than cocrystals, as APIs in salt form exist as dissociated ions in solution [6,7,8,9]. Moreover, salts offer greater pharmaceutical stability and are easy to synthesize and crystallize. Salt engineering effectively overcomes the physicochemical issues of APIs while also expanding the therapeutic value, such as improving dissolution [10], enhancing stability [11], optimizing tableting performance [12], and controlling toxic side effects [13]. Notably, more than 50% of the drugs on the market today are sold as salts [14].
The concept of supramolecular synthons, introduced by Desiraju [15], refers to structural units formed through imagined or known synthetic operations involving intermolecular interactions, which play a crucial role in the development of new salts. In the supramolecular synthons of API salts, usually the protonation (H-in) and deprotonation (H-out) sites directly form DH-in–H···AH-out hydrogen bonds (HBs). Typical examples include the N1 (H-in site) on pipemidic acid bonding with gentisic acid’s carboxyl group (H-out site) in their salt [16] and sunitinib’s diethylamino N4 (H-in site) connecting with 2,6-dihydroxybenzoic acid’s deprotonated carboxyl (H-out site) in their salt [17]. Beyond direct bonding, alternative interactions may occur, including instances where the H-in site engages with a non-deprotonated (non-H-out) site or the H-out site interacts with a non-protonated (non-H-in) site. This is exemplified by trimethoprim-1,5-naphthalene disulfonate [18], where the sulfonic acid group (H-out site) forms DH-in–H···AH-out and Dnon-H-in–H···AH-out HBs with neutral nitrogen and nitrogen cation, respectively, and in probenecid-4-aminopyridine salt [19] as well. However, cases without direct hydrogen bonding between H-in and H-out sites in the synthon are rare, such as in pipemidic acid–saccharin salt hydrate [16].
Irbesartan (IRB, CAS No. 138402-11-6) is a first-line antihypertensive drug [20] that demonstrates therapeutic efficacy in other conditions, including Parkinson’s disease and diabetic nephropathy. IRB is predominantly formulated as tablets and capsules. There are two proton tautomers of the IRB molecule, the 1-H tautomer and the 2-H tautomer, which differ in the protonation positions of the tetrazole ring, as shown in Figure 1. In solution, a tautomeric equilibrium exists between the 1-H tautomer and the 2-H tautomer [21]. The two proton tautomers crystallize as distinct forms A (CCDC No. 199411) [22] and B (CCDC No. 130127) [23], respectively. Form A is a trigonal crystal system (space group P 3 - ) with the proton at N1 of the tetrazole ring. In contrast, form B is a triclinic crystal system (space group P 1 - ) with the proton at N2 of the tetrazole ring. In the solid state, the two tautomers are stable and not interconverted. It is called desmotropy isomerism behavior and is not the true polymorphism [21]. Crystallization in an ethanol–water mixed solvent when the volume fraction of water is >10% gives form B, and vice versa, form A [24]. The melting points of forms A and B are 182.35 °C and 185.66 °C [21], respectively.
IRB (BCS Class II drug) exhibits poor aqueous solubility of 5.9 × 10⁻² mg/mL at 25 °C [25]. In a pH 6.8 buffer at 37 °C, form A exhibited both higher solubility (0.55 vs. 0.18 mg/mL) and intrinsic dissolution rate (0.0025 vs. 0.0010 mg/(min·cm2)) than form B in its powder and compacted forms, respectively [26]. Enhancing IRB’s dissolution and IDR remains challenging, though strategies like nanosizing, inclusion complexes, solid dispersions, salts, and cocrystals [26,27,28,29,30] have been explored, with salts or cocrystals being the more common approaches. Five salts of IRB have been reported, namely, 2,6-dihydroxybenzoate, hydrochloride, bromate, dihydrated 2,3-dibromosuccinate, and piperazine salt [26,29,30]. Nuclear magnetic resonance (NMR) spectroscopy analysis revealed that proton transfer occurs from the acid coformers to IRB’s diazepine ring, forming the IRB cation with the tetrazole ring proton at N1 (consistent with form A). In the IRB–piperazine salt, the N1 proton of IRB form A transfers to the N atom of piperazine to form the anion. Three cocrystals of IRB (with succinic acid, benzoic acid, and vanillin) have been reported [31,32]. Compared to pure IRB, the maximum dissolution in hydrochloric acid of the table benzoic acid cocrystal and the succinic acid cocrystal is nearly 8-fold and 4-fold higher, respectively (the dissolution or IDR values calculated herein are based on IRB).
Among the reported IRB salts and cocrystals, 2,6-dihydroxybenzoic acid, 2,3-dibromosuccinic acid, and succinic acid are not classified as GRAS (Generally Recognized As Safe) coformers. IRB–succinic/benzoic acid cocrystals melted at ~140 °C, exhibiting reduced thermal stability, while DSC analysis showed broader, lower endothermic peaks, suggesting diminished crystallinity. In contrast, the IRB–vanillin cocrystal exhibited almost no crystallinity. Moreover, none of the three cocrystals have been structurally characterized, obscuring their absolute molecule configurations for medicinal applications. Hygroscopic IRB hydrochloride and bromate cause stability issues, while the needle-like morphology of the IRB–piperazine salt complicates washing, filtration, drying, and formulation. Currently, needle-shaped form A is the medicinal form. As mentioned above, both form A and its reported salts/cocrystals still face significant challenges. Therefore, there is a critical need to identify a pharmacologically safe coformer capable of generating a highly soluble IRB salt with an enhanced IDR, improved crystallinity, superior hygrothermal stability, and process-friendly crystal morphology.
In this work, a full interaction map (FIM) was used to identify 45 potential coformers capable of forming salts with IRB, followed by experimental screening. Seven new IRB salts (six sulfonates, one carboxylate) were synthesized by the suspension and solution crystallization method, and their crystal structures were resolved by single-crystal X-ray diffraction (SCXRD). The coformers are p-toluenesulfonic acid (TOSA), maleic acid (MAL), benzenesulfonic acid (BSA), 4-chlorobenzenesulfonic acid (4-CBSA), 2,5-dichlorobenzenesulfonic acid (2,5-CBSA), methanesulfonic acid (MSA), and camphorsulfonic acid (CPSA) (the chemical structural formulae are shown in Figure 2). The supramolecular synthons of the seven new IRB salts were further analyzed. To evaluate the thermal properties, hygrothermal stability, and dissolution properties, the new IRB salts underwent thermal analyses, accelerated stability testing, and dissolution and IDR measurements in pH 6.8 buffer at 37 °C. Additionally, for the two IRB salts that exhibited hovering and spring-parachute dissolution profiles, their phase transformations in pH 6.8 buffer at 37 °C were monitored via in situ Raman spectroscopy. Finally, the weak interactions in the crystal structure of the IRB salts were analytically visualized and quantified using Hirshfeld surfaces (HSs), molecular electrostatic potential surfaces (MEPSs), an independent gradient model based on Hirshfeld partition (IGMH), and atoms in molecules (AIM), and their effects on thermal properties were revealed.

2. Experimental Section
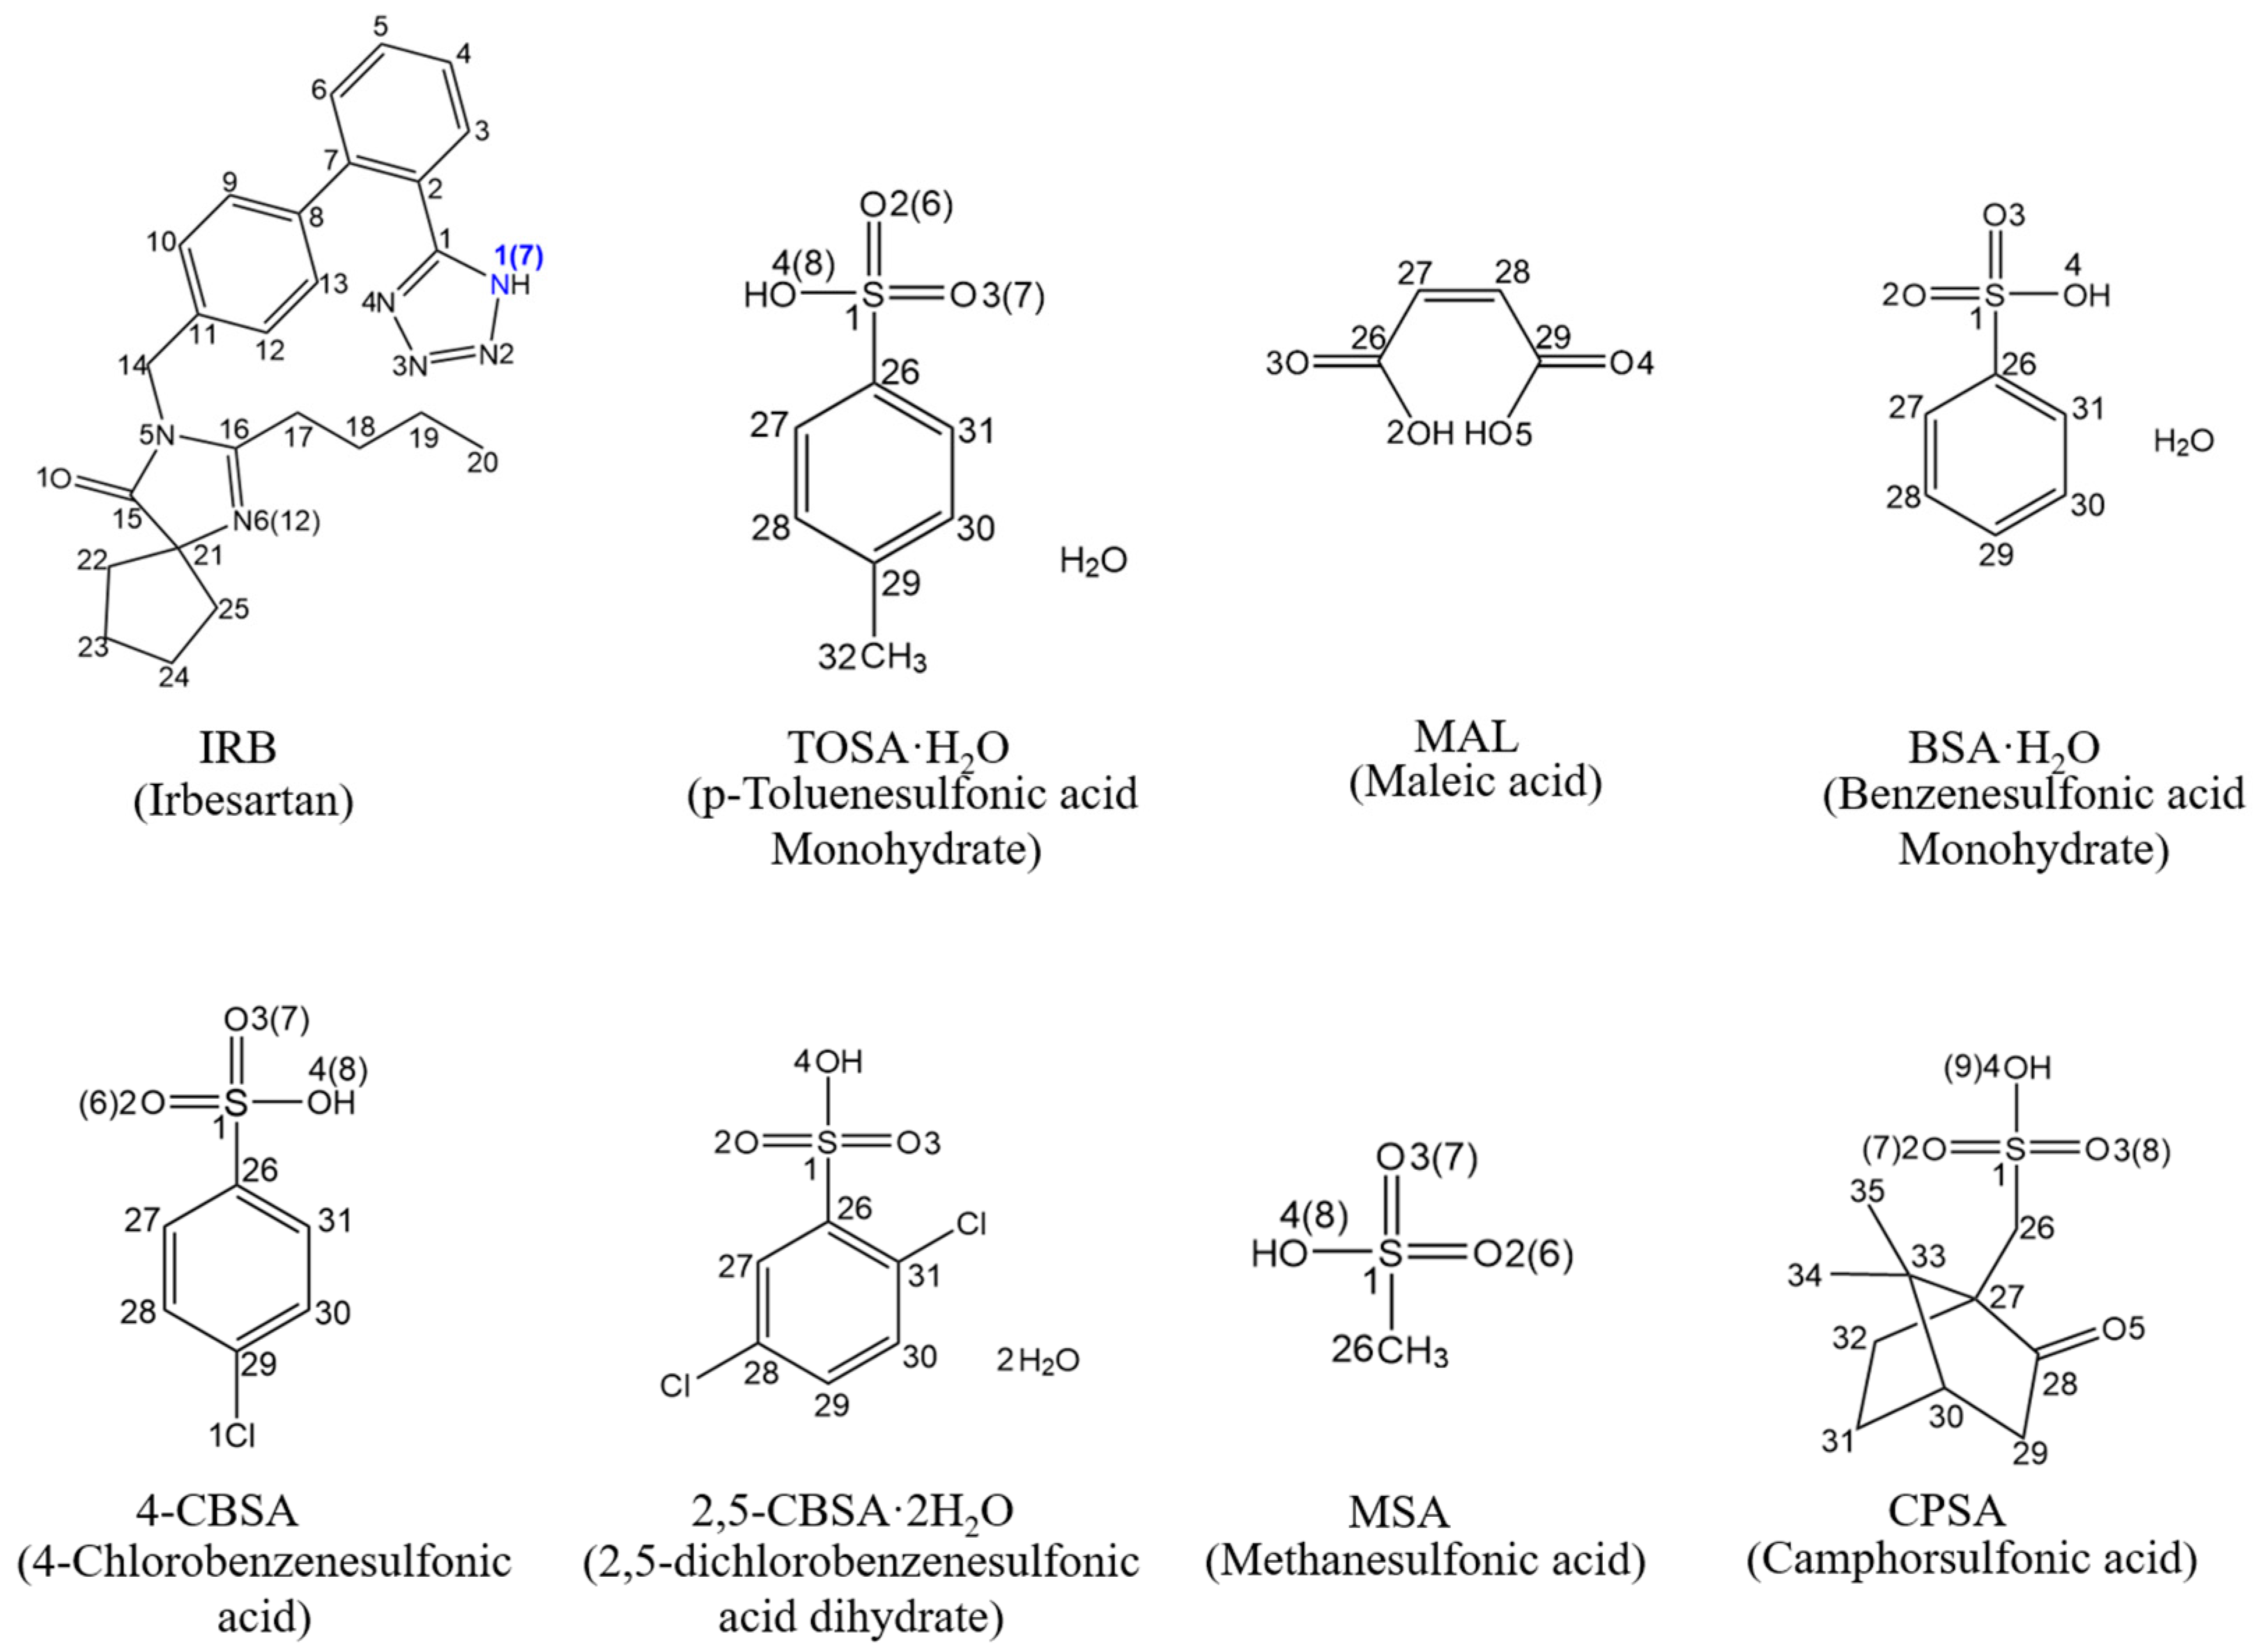
2.1. Materials

Irbesartan (IRB) form A (CAS No. 138402-11-6, purity > 99%) was purchased from Shanghai D&B Biotechnology Co. (Shanghai, China). The specific manufacturer information and purity of the coformers are listed in Table S1. The solvents used in the experiments were provided by Tianjin Jiangtian Chemical Co., (Tianjin, China). All chemicals were used directly without further purification.

2.2. Screening Methods

The suspension crystallization method was used to screen IRB salts. In each experiment, the powders of IRB and the coformers were mixed at a molar ratio of 1:1, and the excess powder mixture was stirred with 3 mL of ethanol or acetonitrile in a screw-top vial for 12 h. The sample was then filtered using a vacuum pump (SHB IIIS, Zhengzhou Great Wall Scientific Industrial and Trade Co., Ltd., Zhengzhou, China) connected to a Büchner funnel and dried in a drying oven (DZF6020, Taisite Instrument Co., Ltd., Tianjin, China) at atmospheric pressure and 50 °C. The resulting powder was used for further characterization.

2.3. Preparation of IRB Salts

2.3.1. Preparation of Single Crystals

The IRB-TOSA salt, IRB-4-CBSA salt, and IRB-MSA salt were prepared by adding 0.25 mmol of IRB powder and 0.25 mmol of coformer powder into 3 mL of anhydrous ethanol with stirring at 25 °C to prepare a clear solution. The solution was cooled to 15 °C at a rate of 0.05 °C/min using a constant speed program-controlled thermostat (XOYS-2006N, Nanjing Xianou Instrument Manufacturing Co., Ltd., Nanjing, China), and crystals fulfilling the quality requirements for single crystal resolution could be obtained after 3 days of constant temperature at 15 °C.
The IRB-BSA salt, IRB-MAL salt, and IRB-CPSA salt were prepared as above, but the solvent used was changed to anhydrous acetonitrile.
The IRB-2,5-CBSA salt was prepared by adding 0.25 mmol of IRB powder and coformer 2,5-CBSA powder into 6 mL of anhydrous acetonitrile at 25 °C with stirring, and the mixture was allowed to stand for 0.5 h. The supernatant was collected and filtered; then, the resulting filtrate was slowly evaporated at 25 °C. After a few hours, crystals suitable for single crystal resolution were obtained.

2.3.2. Preparation of Powders

Powder samples were prepared by milling of the single crystals. The above steps were repeated, and the obtained single crystals were ground to obtain powder and dried in an atmospheric pressure drying oven at 50 °C (DZF6020, China). It was used for subsequent characterization and experiments.

2.4. Accelerated Stability Study

To evaluate the hygrothermal stability of the prepared IRB salts, an accelerated stability study was conducted for 14 weeks in a constant temperature and humidity chamber (HWS-70B, Faithfull Instruments Co., Ltd., Tianjin, China). The chamber was maintained at 40 °C and 75% relative humidity (RH) [16,19,33]. Samples were taken every 2 weeks for PXRD analysis.

2.5. Dissolution Study

The crystalline powders of the IRB salts were first sieved to eliminate size effects by selecting samples with particle sizes between 109 and 150 μm (100 to 150 mesh). The sieved 300 mg powder was then compacted at 6 MPa for 3 min to obtain a disk with a diameter of 13 mm. The outer surface of the disk was covered with paraffin to expose only a free flat surface for dissolution determination. The paddle of an electric mixer was set to rotate at a speed of 100 rpm, and the temperature was 37.0 ± 0.1 °C. The discs were added to 100 mL, pH 6.8 phosphate buffer solution in a 100 mL jacketed glass vessel and stirred. Then, 2 mL was removed at each time point of 2, 5, 10, 15, 20, 25, 30, 40, 60, 90, 120, 180, 240, 300, 420, 540, 720, 900, 1080 and 1440 min, and an equal volume of buffer was added [16]. The suspension was filtered through an aqueous filtration membrane (0.22 μm) to obtain a clear solution, which was then diluted to the appropriate concentration using a mobile phase, and the IRB concentration was determined by HPLC (alliance waters e2695, Waters Corporation, Milford, CT, USA). After the dissolution test experiments, the residual solids were collected for PXRD for crystallographic analysis, and all experiments were repeated three times.
The pH 6.8 phosphate buffer used in the experiments was prepared according to the Chinese Pharmacopoeia (2020 Edition, Volume IV) [34], i.e., 250 mL of 0.2 mol/L potassium dihydrogen phosphate solution and 118 mL of 0.2 mol/L sodium hydroxide solution were mixed and then completed to 1000 mL with water. The chromatographic column used was C18 (250 × 4.6 mm, 5 μm) at 37.0 °C with a UV detection wavelength of 245 nm. The mobile phase was acetonitrile–0.1% aqueous phosphoric acid (40:60 v/v) at a flow rate of 1.0 mL/min with a 10 μL injection volume. The working curve obtained by measuring a known concentration of IRB solution was y = 273.7x + 62.23, R2 = 0.9999.
The intrinsic dissolution rates (IDR, mg/(cm2·min)) of the IRB salts were calculated based on dissolution curves according to the Noyes–Whitney [35] Equation (1):
IDR   = V d c d t 1 A disk
where V represents the volume of the dissolution medium (mL), c is the concentration of IRB dissolved in the dissolution medium (mg/mL), Adisk is the surface area of the solid sample (cm2), and t represents the time (min). The dc/dt treatment is the slope of the initial linear segment of the c-t curve.

2.6. In Situ Raman Spectrometer Monitoring of the Phase Transformation Process

Utilizing a time-gated in situ Raman spectrometer (PicoRaman M3, Timegate, Finland), we monitored the phase transformation process of the IRB-TOSA salt and the IRB-2,5-CBSA salt. This advanced time-gated Raman spectroscopy technique effectively mitigates interference from fluorescence and high-temperature blackbody radiation, significantly enhancing the signal-to-noise ratio and improving the accuracy and reliability of quantitative analysis [36]. For the experiment, 100 mL of a pH 6.8 buffer solution and 1 g of the IRB-TOSA or IRB-2,5-CBSA powder were dissolved in a crystallizer at 25 °C. The solid-phase crystal form was monitored over a 30 min suspension period using a Raman spectrometer (PicoRaman M3, Timegate Corporation, Oulu, Finland). The wavenumber range for testing spanned from 2000 cm−1–300 cm−1, with a spectral resolution of 5 cm−1, and each spectrum was collected at 30 s intervals. Section 2.5 showed that the IRB-TOSA salt and the IRB-2,5-CBSA salt transformed to form B after the experiments. To compare with IRB form B, the Raman spectra of IRB form B were determined prior to process monitoring. An appropriate amount of IRB form B powder was taken and placed in the sample cell, and the surface of the sample was flattened in order to produce a uniform scattering of the laser beam. IRB form B was prepared by the method reported in the literature [37]. Excess IRB form A powder was added to 3 mL of acetonitrile and stirred at 25 °C for 72 h. The sample was then filtered using a vacuum pump (SHB IIIS, China) connected to a Büchner funnel and dried in a drying oven (DZF6020, China) at atmospheric pressure and 50 °C. The resulting samples were subjected to PXRD analysis and optical microscopy observations, and the results are shown in Figure S1 and Section 3.4.5.

2.7. Characterization

2.7.1. Powder X-Ray Diffraction (PXRD)

PXRD tests were carried out on a powder X-ray diffractometer (D/Max 2500, Rigaku, Tokyo, Japan). The sample was placed on a tray, pressed to ensure uniformity, and analyzed under the following conditions: Cu Kα (λ = 1.5406 Å) as the X-ray source, with an operating voltage of 40 kV and tube current of 100 mA. The scanning range was set to 2–35°, and the scanning speed was maintained at 10°/min.

2.7.2. Single-Crystal X-Ray Diffraction (SCXRD)

SCXRD was performed on a single-crystal diffractometer (MM007 Saturn944+, Rigaku, Japan) by means of X-ray at a wavelength of 0.71073 Å (Mo-Kα). The diffraction data were integrated and corrected for absorption using the SAINT 8.38A program. The crystal structure was solved by direct methods with SHELXT 2018/2 [38] and refined by full-matrix least-squares techniques using SHELXL 2018/3 [39]. Non-hydrogen atoms were refined anisotropically. Hydrogen atoms were placed at geometrically idealized positions using a riding model and included in the refinement with fixed isotropic displacement parameters.

2.7.3. Differential Scanning Calorimetry (DSC) and Thermogravimetric Analysis (TGA)

DSC analysis of the samples was carried out on a differential scanning calorimeter (Toledo DSC 1/500, Mettler Toledo, Greifensee, Switzerland) by weighing 5–10 mg of the samples into a standard aluminum crucible, punching a small hole in it, and using 50 mL/min of N2 and a temperature increase rate of 10 °C/min. The temperature range was set as 25–250 °C.
The samples were analyzed using a thermogravimetric analyzer (TGA/DSC1 STARe, Mettler Toledo, Greifensee, Switzerland) system. A total of 5–10 mg of each sample was weighed into a ceramic crucible and tested using 20 mL/min of N2 and a temperature increase rate of 10 °C/min. The temperature range of the test was set to 25–300 °C.

2.7.4. Nuclear Magnetic Resonance (NMR) Spectroscopy

Solution nuclear magnetic resonance 1H spectroscopy (1H NMR): Solution 1H NMR analysis was performed using 10 mg of each sample and 0.5 mL of CD3OD. Spectra were collected on a solution NMR spectrometer (Bruker-Anavce NEO 400 MHz, Billerica, Germany) with tetramethylsilane (δ 0 ppm) as an internal standard for the chemical shifts of the samples.
Solid-state nuclear magnetic resonance 13C spectroscopy (13C NMR): 13C NMR spectra were recorded using a solid-state NMR spectrometer (JEOL JNM-ECZLG 600 MHz, Tokyo, Japan) in CP/MAS mode with a rotational frequency of 10 kHz. The chemical shifts were externally referenced to tetramethylsilane.

2.7.5. Crystal Morphology Analysis

The crystal morphology was detected using an optical microscope (OLYMPUS CKX53, Tokyo, Japan).

2.7.6. Dynamic Vapor Sorption (DVS) Analysis

The hygroscopicity of the samples was tested using a DVS instrument (BSD Instrument Technology Co., Ltd., Beijing, China). The adsorption–desorption test was initiated by first pretreating ≥200 mg of powder samples with outgassing at 65 °C for 180 min. The test temperature was 25 °C, the carrier gas was N2, the total gas flow rate was 400 mL/min, the adsorption equilibrium condition was dm/dt ≤ 0.1 mg over 60 min, the upper limit of the equilibrium duration was set to 180 min, and the collection pressure points were RH = 5%, 10%, 20%, 30%, 40%, 50%, 60%, 70%, 80%, 90%, and 95%.

2.8. Computational Details

2.8.1. Full Interaction Map (FIM) Analysis

The crystal structure of IRB form A was taken from the CCDC crystal database (No. 1999411). The FIM analysis was performed using Mercury 4.2.0 software (Cambridge Crystallographic Data Centre, Cambridge, UK) [40] as a structure visualization tool.

2.8.2. Supramolecular Synthon Analysis

Material Studio 6.0 (Accelrys Software Inc., San Diego, CA, USA) and Mercury 4.2.0 software were used to display the double bonds and HBs in the IRB salts.

2.8.3. Conformation Similarity Analysis

The .cif files of the single crystals were exported to .pdb files using Mercury software with PyMol 2.3.0 software [41] to visually compare the conformations of IRB and IRB molecules in their salt structures.

2.8.4. Hirshfeld Surface (HS) Analysis

Hirshfeld surface analysis was performed with CrystalExplorer 17.5 [42] software to visualize and quantify the interactions present in the crystal structure.

2.8.5. Molecular Electrostatic Potential Surface (MEPS) Analysis

The electrostatic potentials [43] were calculated for IRB and coformers using Multiwfn 3.8 [44] software by selecting an isosurface with an electron density of 0.001 a.u. The results were visualized using the VMD 1.9.4 program [45]. All hydrogen atom geometries were optimized using the b3lyp/3-21G basis set of Gaussian 09.

2.8.6. Atoms in Molecules (AIM) and Independent Gradient Model Based on Hirshfeld Partition (IGMH) Analysis

All AIM and IGMH calculations [46,47] were performed using the Gaussian 09 package under the b3lyp/3-21G basis set. The Multiwfn 3.8 and VMD 1.9.4 programs were used for visualization. The independent gradient model based on Hirshfeld partition (IGMH) [48] is a new visualization method for labeling inter- and intra-fragment interactions in crystal structure fragments. AIM analysis (first proposed by Bader) [49] is used to obtain topological paths at critical points and connections and to determine the properties of HB interactions [50]. Koch [51] et al. proposed criteria about the strength of HB: ∇2ρ < 0 and H < 0 for strong HB and covalent bonds; ∇2ρ > 0 and H < 0 for intermediate HB and partially covalent bonds; and ∇2ρ > 0 and H > 0 for weak HB and electrostatic interactions. The following Equation (2) [46] is commonly used to calculate the HB energy:
EH = −332.34ρ(BCP) − 1.0661
where the HB energy EH is in kcal/mol and ρ(BCP) is in a.u.

3. Results and Discussion

3.1. FIM Analysis

The full interaction map (FIM) identifies potential HB binding sites in the molecular structure of IRB. As shown in Figure 3, regions with deep outlines (red/blue) indicate a higher propensity for synthon formation, while transparent regions have a lower likelihood [52]. Hydrogen bond acceptor (HBA) regions are shown in red, and hydrogen bond donor (HBD) regions are shown in blue. The analysis reveals that IRB contains multiple HBD and HBA sites, including the imine group of the tetrazole ring, the carboxyl group of the diazole ring, and the tertiary amine group. Therefore, IRB tends to form new salts with coformers containing hydroxyl, carboxyl, and sulfonic acid groups. Accordingly, 45 coformers with potential applications were selected for screening by the suspension method in this study. These coformers include pharmaceutical intermediates with sulfonic acid, carboxylic acid, hydroxyl, and amino groups, as well as some nutrients.

3.2. Screening Results

In this study, suspension crystallization was used to screen the coformers, with the results summarized in Table S2. The PXRD analysis confirmed the formation of new solid phases between IRB and seven coformers (TOSA, MAL, BSA, 4-CBSA, 2,5-CBSA, MSA, and CPSA), as shown in Figure S2. Taking IRB-TOSA as an example, as can be seen in Figure S2a, the PXRD diagrams of IRB-TOSA showed new characteristic peaks at 7.84°, 9.53°, 15.67°, 18.24°, and 20.62° that are different from those of IRB and coformer TOSA·H2O. The appearance of new characteristic peaks indicates that the synthesized products of IRB with the seven coformers are new solid forms rather than physical mixtures (MSA lacks PXRD data due to its liquid state at room temperature).
According to the ΔpKa rule [53], salt formation occurs when ΔpKa > 3, while cocrystals form when ΔpKa < 0. For 0 ≤ ΔpKa ≤ 3, both salts and cocrystals are possible. As shown in Table 1, the ΔpKa values of IRB with TOSA, BSA, 4-CBSA, 2,5-CBSA, and MSA are all greater than 3, indicating a strong tendency for salt formation. However, for IRB-MAL and IRB-CPSA, further analyses, such as single-crystal structure analysis, are needed to determine whether they are salts or cocrystals.

3.3. Crystal Structure Analysis

3.3.1. SCXRD Analysis

High-quality single crystals of seven IRB new phases (IRB-TOSA, IRB-MAL, IRB-BSA, IRB-4-CBSA, IRB-2,5-CBSA, IRB-MSA, and IRB-CPSA) were successfully cultivated, and their single-crystal structures were resolved, confirming that all new phases are salts. The crystallographic parameters of the seven IRB salts are listed in Table 2, and the specific HB geometries collected are summarized in Table S3–S9. Comparing the PXRD patterns obtained from the single-crystal structure simulations with those of the seven new products of the screening experiments (Figure S3), it is observed that the characteristic peak positions are consistent. This indicates that the screening experiment product has the same structure as the single crystal, and it has a high crystal purity.
Before the crystal structure analysis, it should be noted that the atom numbering in the crystal structure is labeled in Figure 2. Since all seven IRB salts synthesized in this study are nonhydrated, the water molecules in the coformers are not numbered in Figure 2. For the four salts (IRB-TOSA, IRB-4-CBSA, IRB-MSA, IRB-CPSA) containing two IRB salt molecules in an asymmetric unit, the atom numbers of the second salt molecule are deferred, with the numbers of the atoms that act as HBD and HBA sites written in parentheses.
The IRB-TOSA salt belongs to the triclinic crystal system, P 1 - space group. The proton on the IRB tetrazole ring in the IRB-TOSA salt is at the N1 position, which is the same as that in the 1-H tautomer. The proton position on the IRB tetrazole ring is the same in all seven salts. In the IRB-TOSA crystal structure, the proton of O4(O8) on the sulfonic acid group of TOSA in the asymmetric unit transfers to N6(N12) in the diazepine ring of IRB. As shown in Figure 4a (structures with less occupied positional disorder were removed for clarity), the tetrazole ring of IRB and the sulfonic acid group of TOSA form two HBs: N1(IRB)–H1···O2(TOSA) (dD···A = 2.714 Å, θD–H···A = 167.00°, dH···A < r(A) + 2.000, where r(A) is the atomic radius of the HBA) and N7(IRB)–H7···O6(TOSA) (2.657 Å, 162.03°). As shown in Figure 4b, the adjacent asymmetric units (green markers in Figure 4b) in IRB-TOSA form a 1D chain structure along the b-axis through the weak interaction of C52(IRB)–H52C···π(IRB) (dC52···π = 3.616 Å, θC52–H52C···π = 132.15°, dH···π < 3.0) (Cg in the figure refers to the centroid of the benzene ring involved in bonding), and then the chain structure expands into a 2D planar surface through the N6(IRB)–H6···O3(TOSA) (2.739 Å, 162.95°) or N12(IRB)–H12···O8(TOSA) (2.657 Å, 154.47°) charge-assisted HB along the c-axis direction (Figure 4c). The neighboring planes are stacked into a 3D structure by C37(IRB)–H37···O1(IRB) along the a-axis (Figure 4d, H atoms are not shown for clarity).
The IRB-MAL salt belongs to the orthorhombic crystal system, P212121 space group. As shown in Figure 5a, the O2 proton on the carboxyl group of MAL transfers to N6 in the diazepine ring of IRB, and the O5–H5···O3 (2.422 Å, 175.73°) intramolecular HB also appears in MAL. In the asymmetric unit, IRB and MAL form the N1(IRB)–H1···O2(MAL) (2.672 Å, 175.77°) HB interaction (Figure 5a), adjacent asymmetric units are connected by the N6(IRB)–H6···O4(MAL) (2.656 Å, 153.93°) charge-assisted HB along the a-axis to form a sawtooth chain-like structure (Figure 5b, shaded in purple), and the two long, sawtooth-shaped chains are connected by C14(IRB)–H14B···N4(IRB) (3.335 Å, 130.28°) along the c-axis to develop into a 2D plane (Figure 5c) and further stacked in a parallel manner through van der Waals weak interactions to finally form the entire 3D structure (Figure 5d).
The IRB-BSA salt belongs to the monoclinic crystal system, P21/n space group. As shown in Figure 6a (structures with less occupied positional disorder are removed for clarity), the proton of O4 on the BSA sulfonic acid group of the asymmetric unit (the pink markers in Figure 6a) transfers to N6 in the diazepine ring of IRB and forms a N6(IRB)–H6···O2(BSA) (2.708 Å, 171.68°) HB interaction. Two neighboring asymmetric units form the ring structure U1 through two N1(IRB)–H1···O4(BSA) (2.673 Å, 162.63°), and the other two asymmetric units form the ring structure U2 in the same way (Figure 6a). As shown in Figure 6b, the neighboring U1, U2 form a 1D ribbon structure through C14(IRB)–H14B···N4(IRB) (3.304 Å, 124.31°); then, the ribbon structure is formed through C25(IRB)–H25B···O1(IRB) (3.343 Å, 128.27°) along the a-axis direction to expand into a 2D plane (Figure 6c) and further stacked in a parallel manner through van der Waals weak interactions to finally form the entire 3D structure (Figure 6d).
The IRB-4-CBSA salt belongs to the monoclinic crystal system, P21/c space group. As shown in Figure 7a (for clarity, the structures with a positional disorder of lower occupancy are removed), the proton of O4(O8) on the sulfonic acid group of 4-CBSA transfers to N6(N12) in the diazepine ring of IRB and forms N6(IRB)–H6···O2(4-CBSA) (2.737 Å, 155.83°) and N12(IRB)–H12···O8(4-CBSA) (2.627 Å, 163.51°) charge-assisted HB interactions. In the crystal structure, the two IRB-4-CBSA molecules form a ring structure through N1(IRB)–H1···O6(4-CBSA) (2.679 Å, 155.97°) and N7(IRB)–H7···O3(4-CBSA) (2.680 Å, 163.84°) HB interactions (Figure 7a). Adjacent ring structures form a Z-shaped chain structure via C14(IRB)–H14A···N4(IRB) (3.236 Å, 121.49°), C48(IRB)–H48B···N10(IRB) (3.429 Å, 131.19°), and C45(IRB)–H45A···Cl2(4-CBSA) (3.753 Å, 143.88°) along the a-axis (green shading in Figure 7b), and then the chain structure expands to develop into a 2D planar surface via C14(IRB)–H14A···N4(IRB) (3.236 Å, 121.49°) and C48(IRB)–H48B···N10(IRB) (3.429 Å, 131.19°) toward the b-axis (Figure 7c), with a 3D stacking structure along the c-axis between adjacent planes via C28(4-CBSA)–H28···O5(IRB) (3.223 Å, 125.28°) and C53(IRB)–H53B···O5(IRB) (3.478 Å, 152.62°) interactions (Figure 7d; H atoms are not shown for clarity).
The IRB-2,5-CBSA salt belongs to the monoclinic crystal system, P21/n space group. As shown in Figure 8a, the proton of O4 on the sulfonic acid group of 2,5-CBSA transfers to N6 in the diazepine ring of IRB. In the asymmetric unit, the tetrazole ring of IRB forms N1(IRB)–H1···O2(2,5-CBSA) (3.147 Å, 123.20°) and N1(IRB)–H1···O3(2,5-CBSA) (2.727 Å, 166.85°) divergent HBs with the sulfonic acid group of 2,5-CBSA (Figure 8a). Adjacent asymmetric units are connected by a N6(IRB)–H6···O2(2,5-CBSA) (2.750 Å, 164.75°) HB to form a z-shaped chain structure along the b-axis (light red shading in Figure 8b), which then extends via C14(IRB)–H14A···N4(IRB) (3.279 Å, 126.01°) toward the a-axis to develop into a 2D planar surface (Figure 8c), and adjacent planar surfaces (light green shading in Figure 8d; H atoms are not shown for clarity) form a 3D stacking structure along the c-axis via C30(2,5-CBSA)–H30···O1(IRB) (3.232 Å, 125.42°).
The IRB-MSA salt belongs to the monoclinic crystal system, P21/c space group. As shown in Figure 9a, the proton of O4 (O8) on the 4-MSA sulfonic acid group transfers to N6 (N12) in the diazepine ring of IRB to form charge-assisted HBs N6(IRB)–H6···O7(MSA) (2.669 Å, 155.00°) and N12(IRB)–H12···O4(MSA) (2.637 Å, 158.90°). In the asymmetric unit, two IRB-MSA molecules form a ring structure through N1(IRB)–H1···O2(MSA) (2.671 Å, 167.03°) and N7(IRB)–H7···O6(MSA) (2.664 Å, 169.40°) HBs (Figure 9a). Adjacent asymmetric units (blue shaded in Figure 9b) are connected by C10(IRB)–H10···O7(MSA) (3.314 Å, 122.17°) and C39(IRB)–H39···O4(MSA) (3.259Å, 118.44°) to form a chain structure along the a-axis direction; then, the chain structure is extended to form a 2D plane via C39(IRB)–H39···O4(MSA) toward the b-axis (Figure 9c), and a 3D stacking structure is formed between adjacent planes via C20(IRB)–H20C···O1(IRB) (3.440 Å, 172.59°) along the c-axis (Figure 9d; H atoms are not shown for clarity).
The IRB-CPSA salt belongs to the monoclinic crystal system, P21 space group. As shown in Figure 10a, the proton transfer of O4 (O9) on the sulfonic acid group of the CPSA molecule to N6 (N12) in the diazepine ring of the IRB molecule forms the charge-assisted HBs N6(IRB)–H6···O4(CPSA) (2.641 Å, 166.34°) and N12(IRB)–H12···O7(CPSA) (2.723 Å, 167.82°) (the structures with positional disorder of lower occupancy are removed). In the IRB-CPSA crystal structure, two IRB-CPSA molecules are connected by the bifurcated HBs N1(IRB)–H1···O8(CPSA) (2.855 Å, 158.95°) and N1(IRB)–H1···O9(CPSA) (3.073 Å, 129.33°) to form an asymmetric unit (Figure 10a). Adjacent asymmetric units are connected by bifurcated HBs N7(IRB)–H7···O2(CPSA) (2.893 Å, 140.70°) and N7(IRB)–H7···O3(CPSA) (3.214 Å, 154.50°) to form a Z-shaped chain structure along the c-axis direction (Figure 10b); then, the chain structure expands into 2D planes via C9(IRB)–H9···O10(CPSA) (3.211 Å, 126.97°) and C34(CPSA)–H34···O6(IRB) (3.396 Å, 144.12°) toward the a-axis (Figure 10c), and adjacent planes form a 3D stacking structure along the b-axis via C17(IRB)–H17A···N2(IRB) (3.607 Å, 166.58°) and C57(IRB)–H57A···O1(IRB) (3.542 Å, 163.58°) (Figure 10d; H atoms are not shown for clarity).

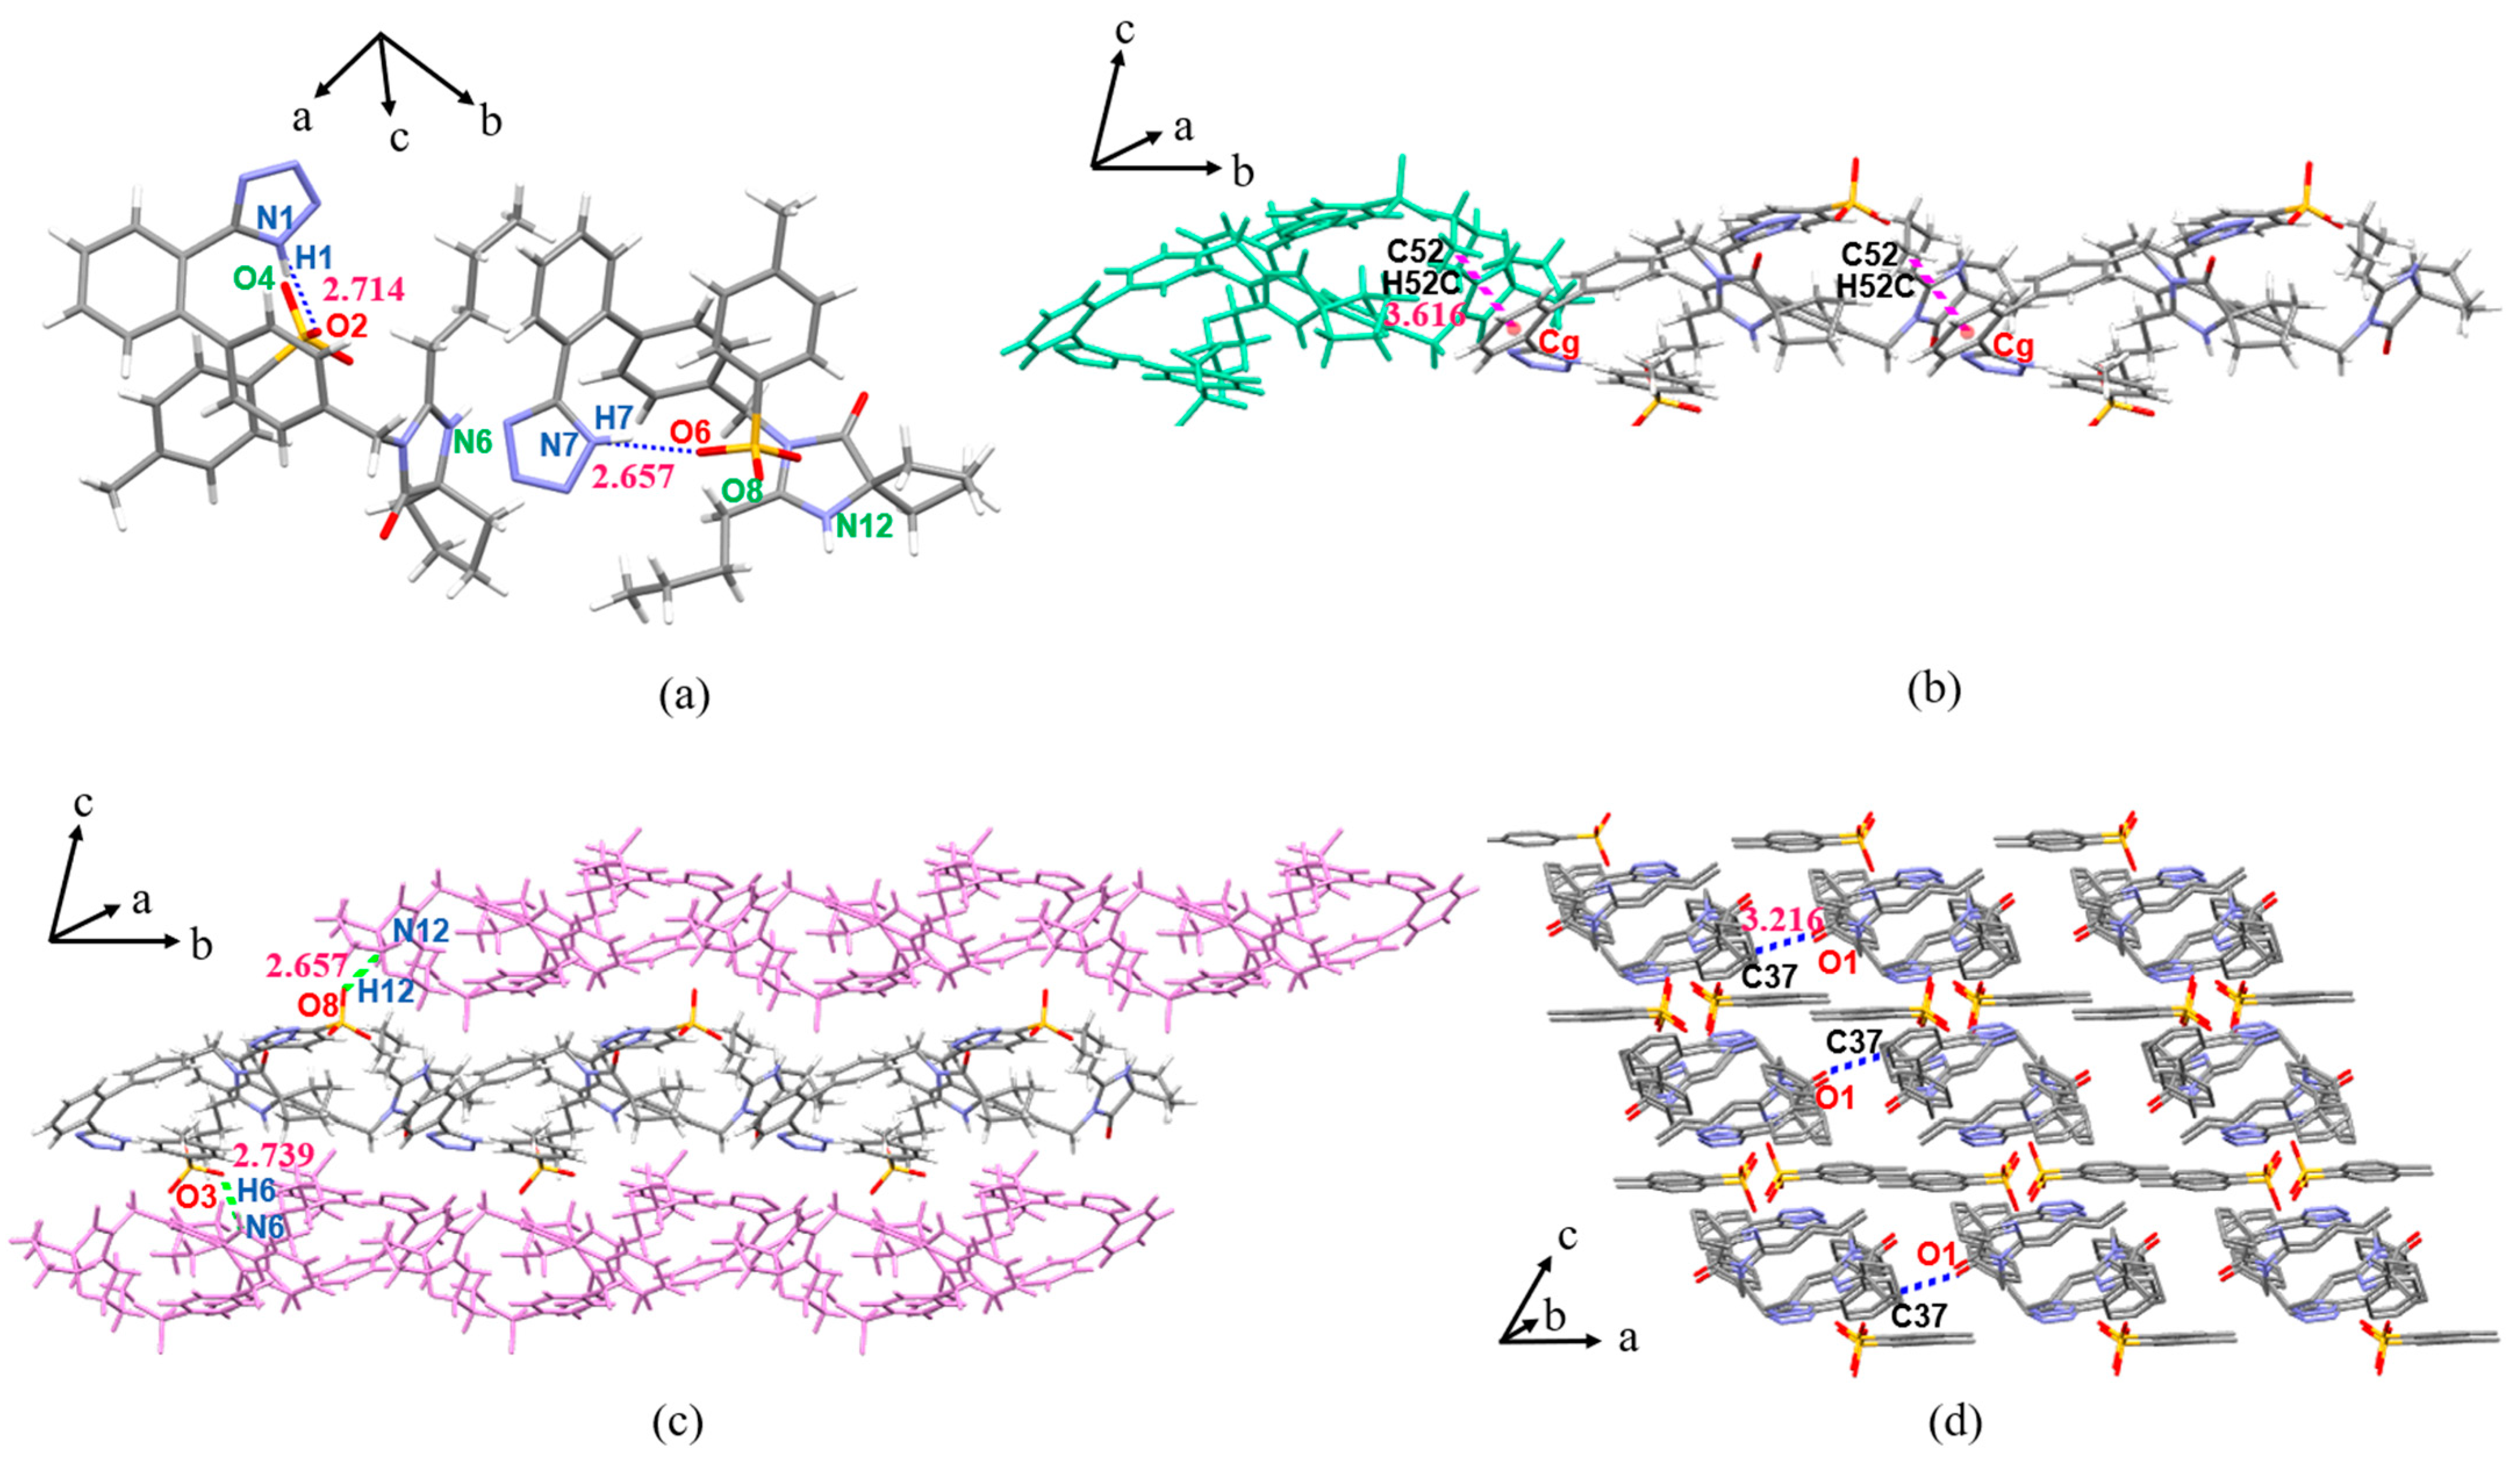
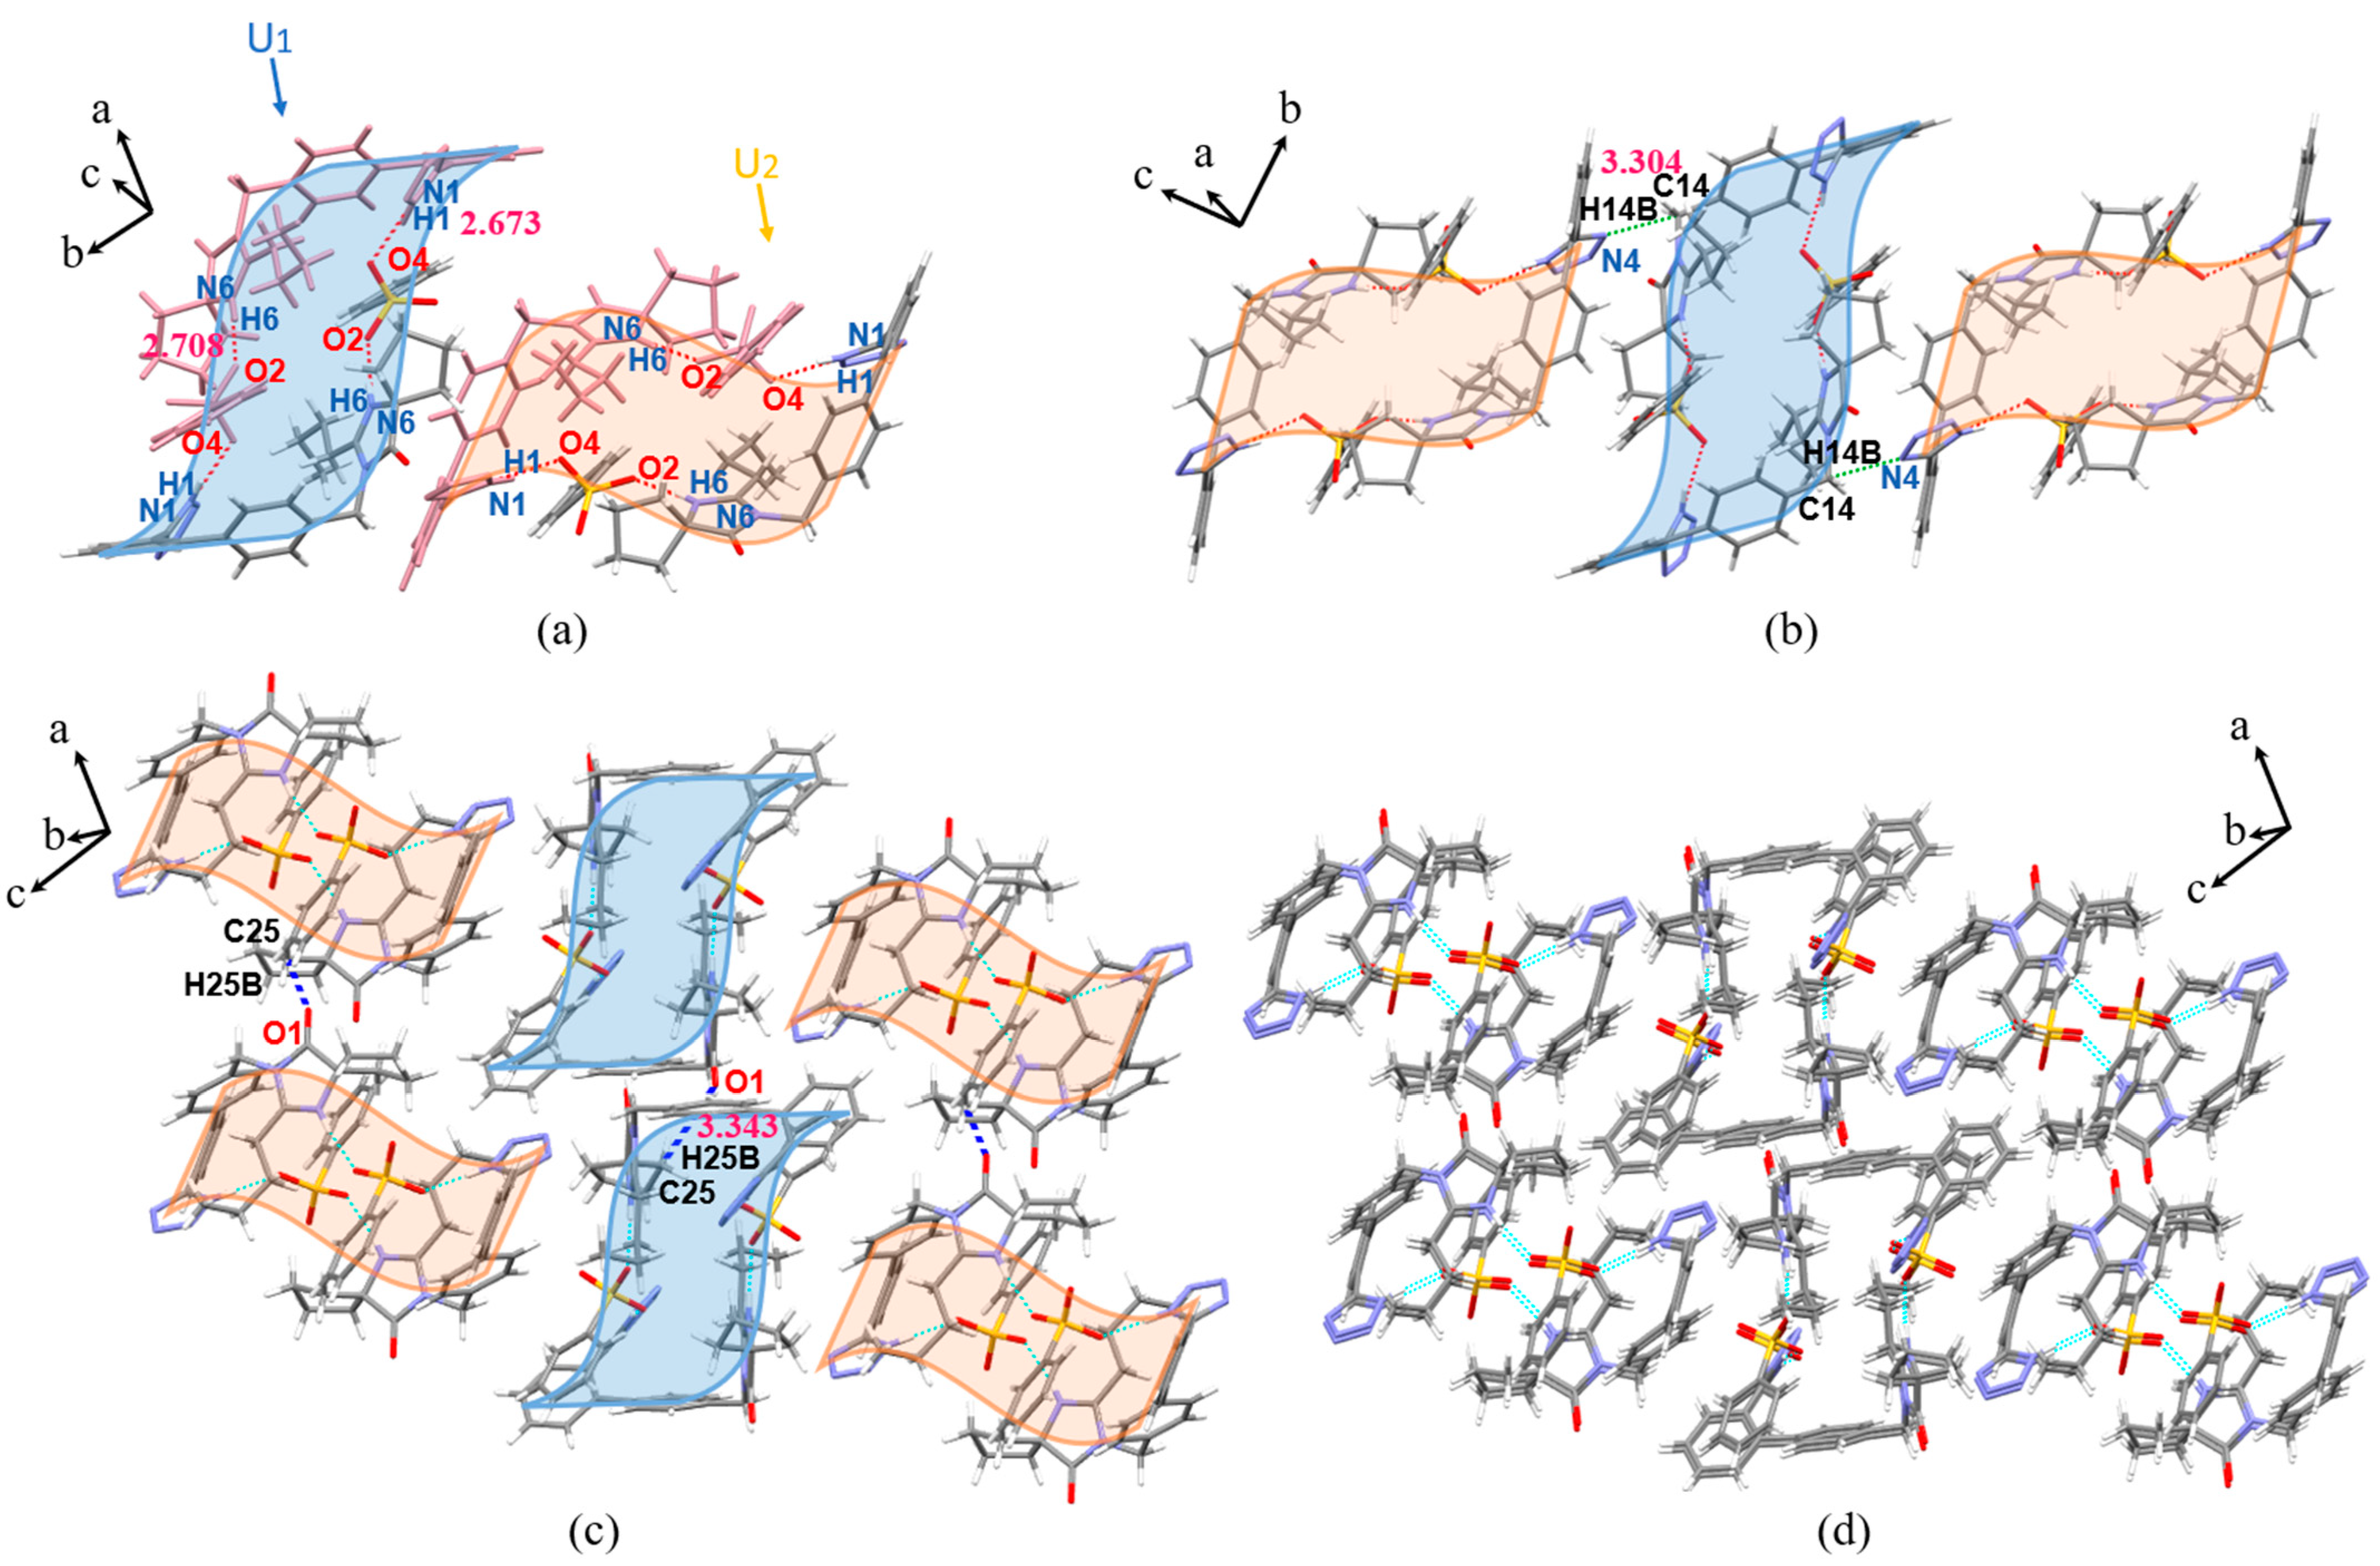
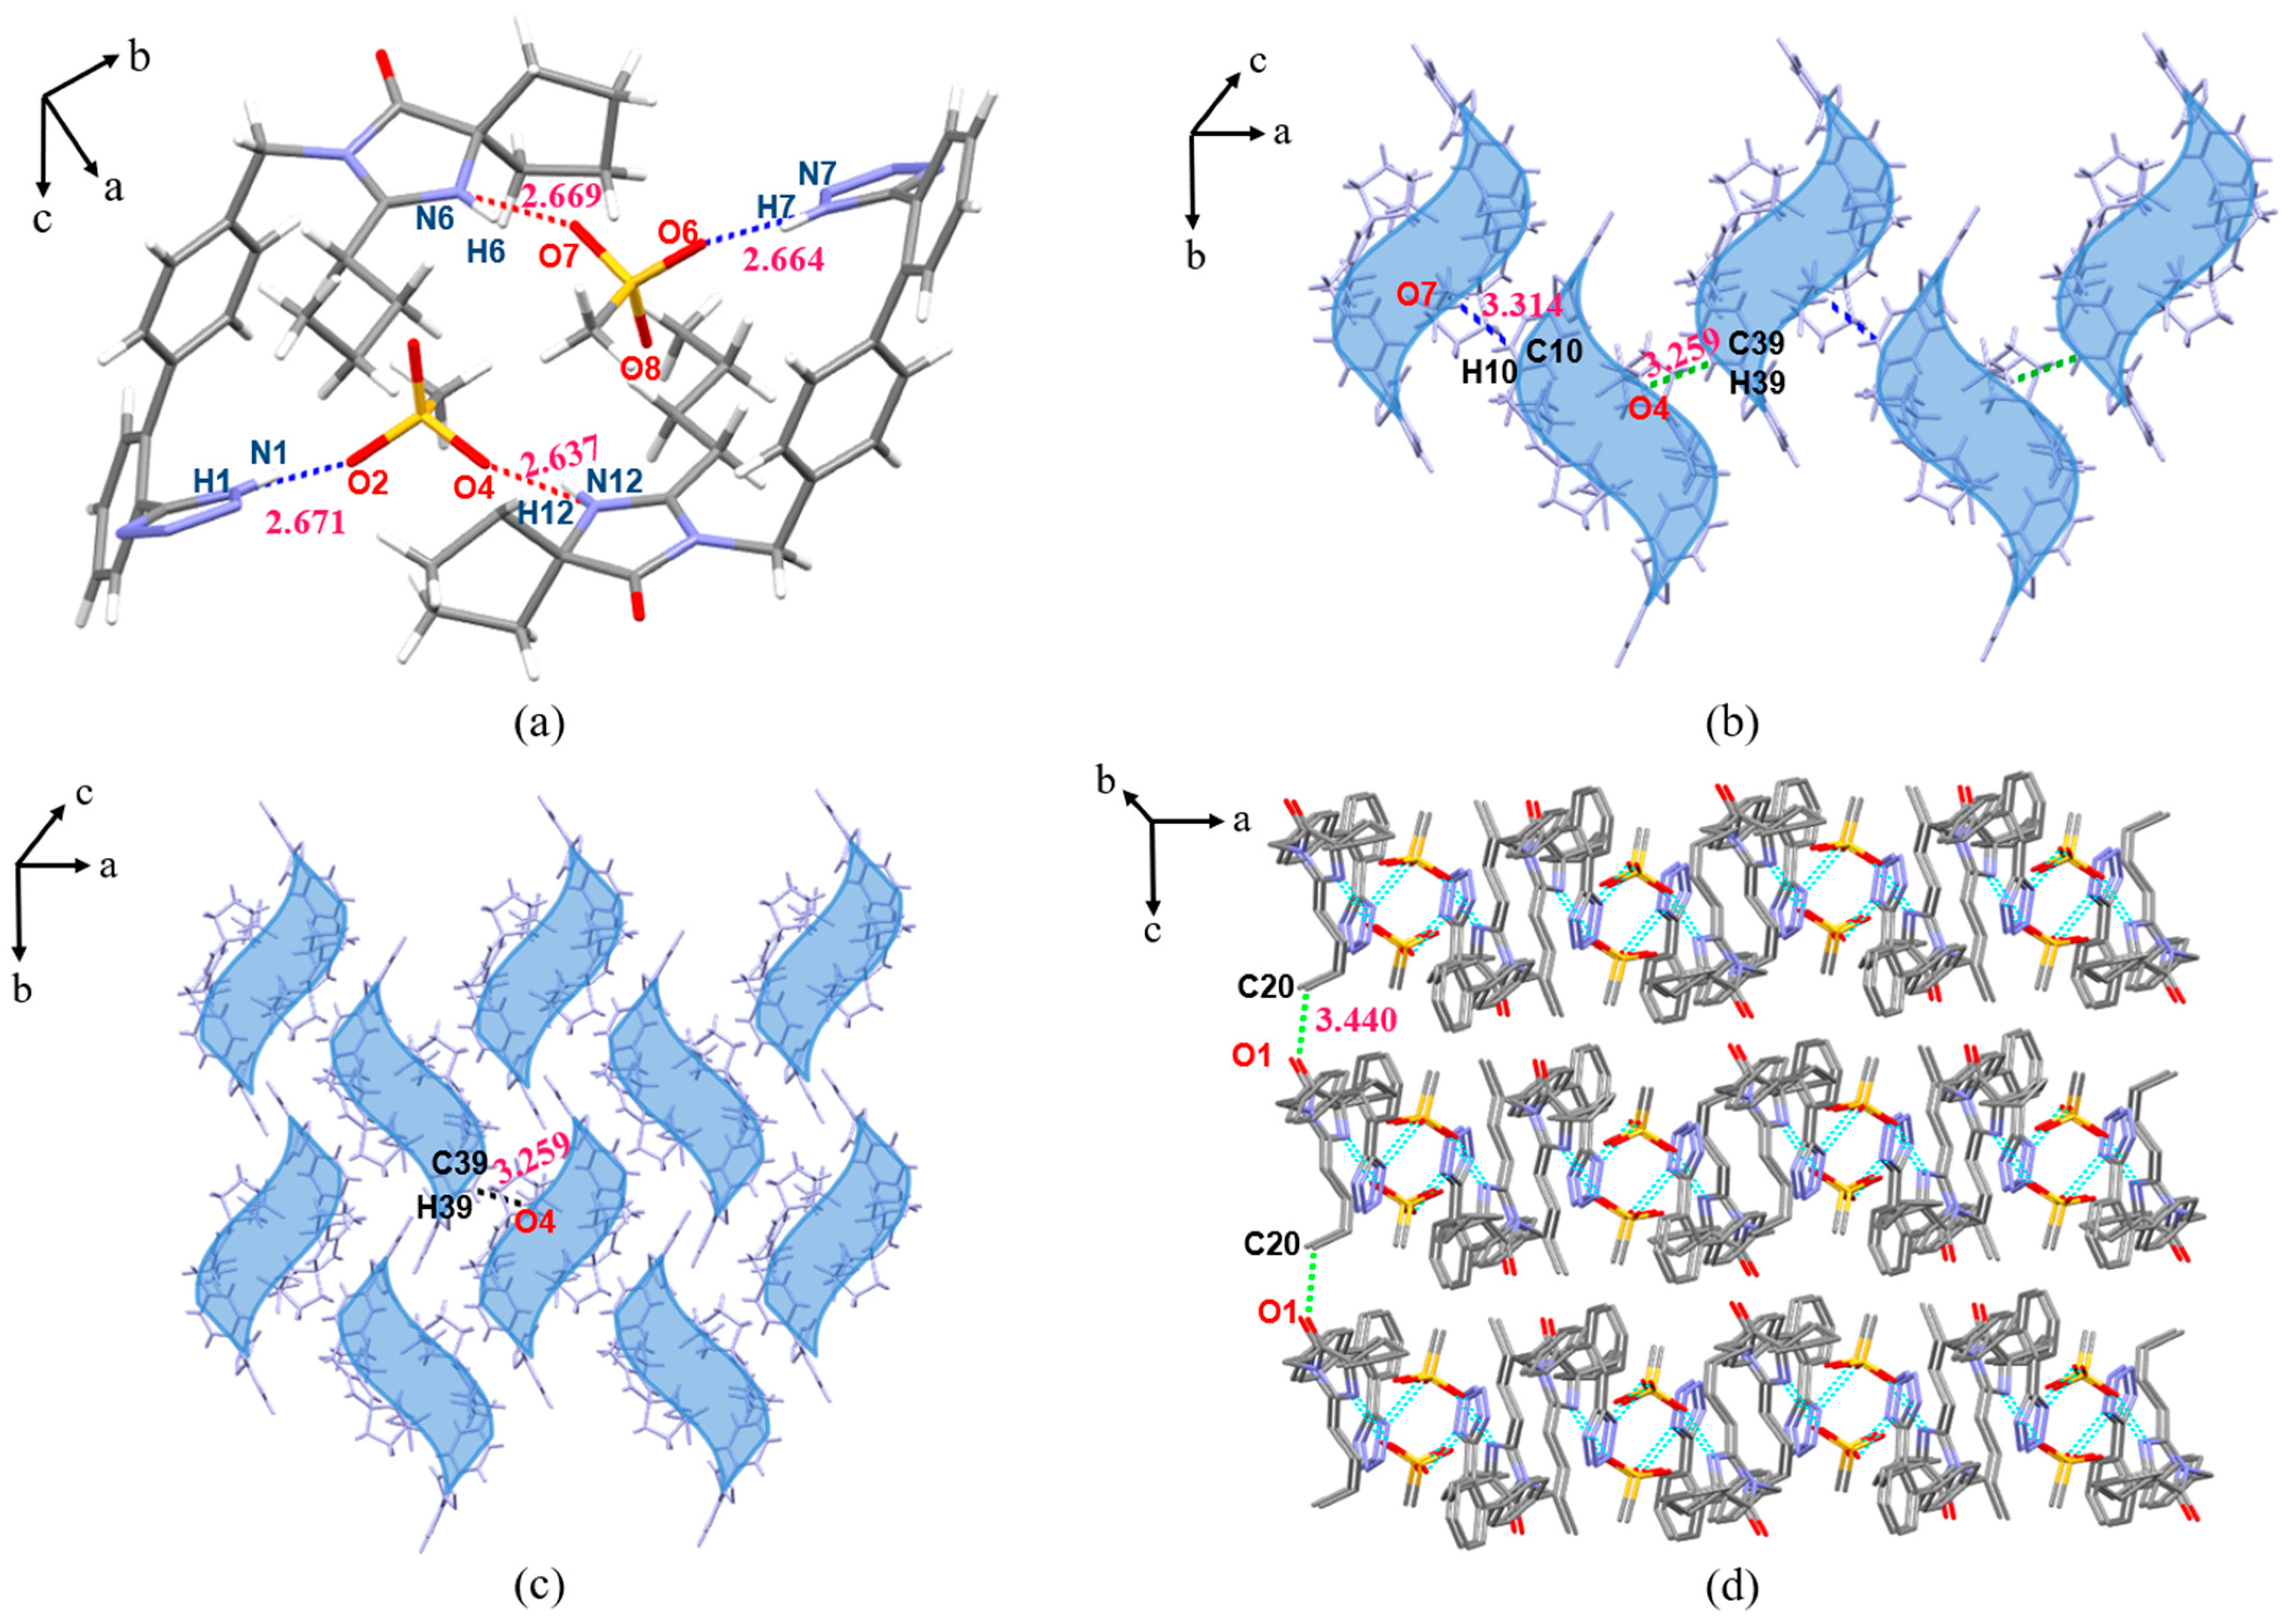
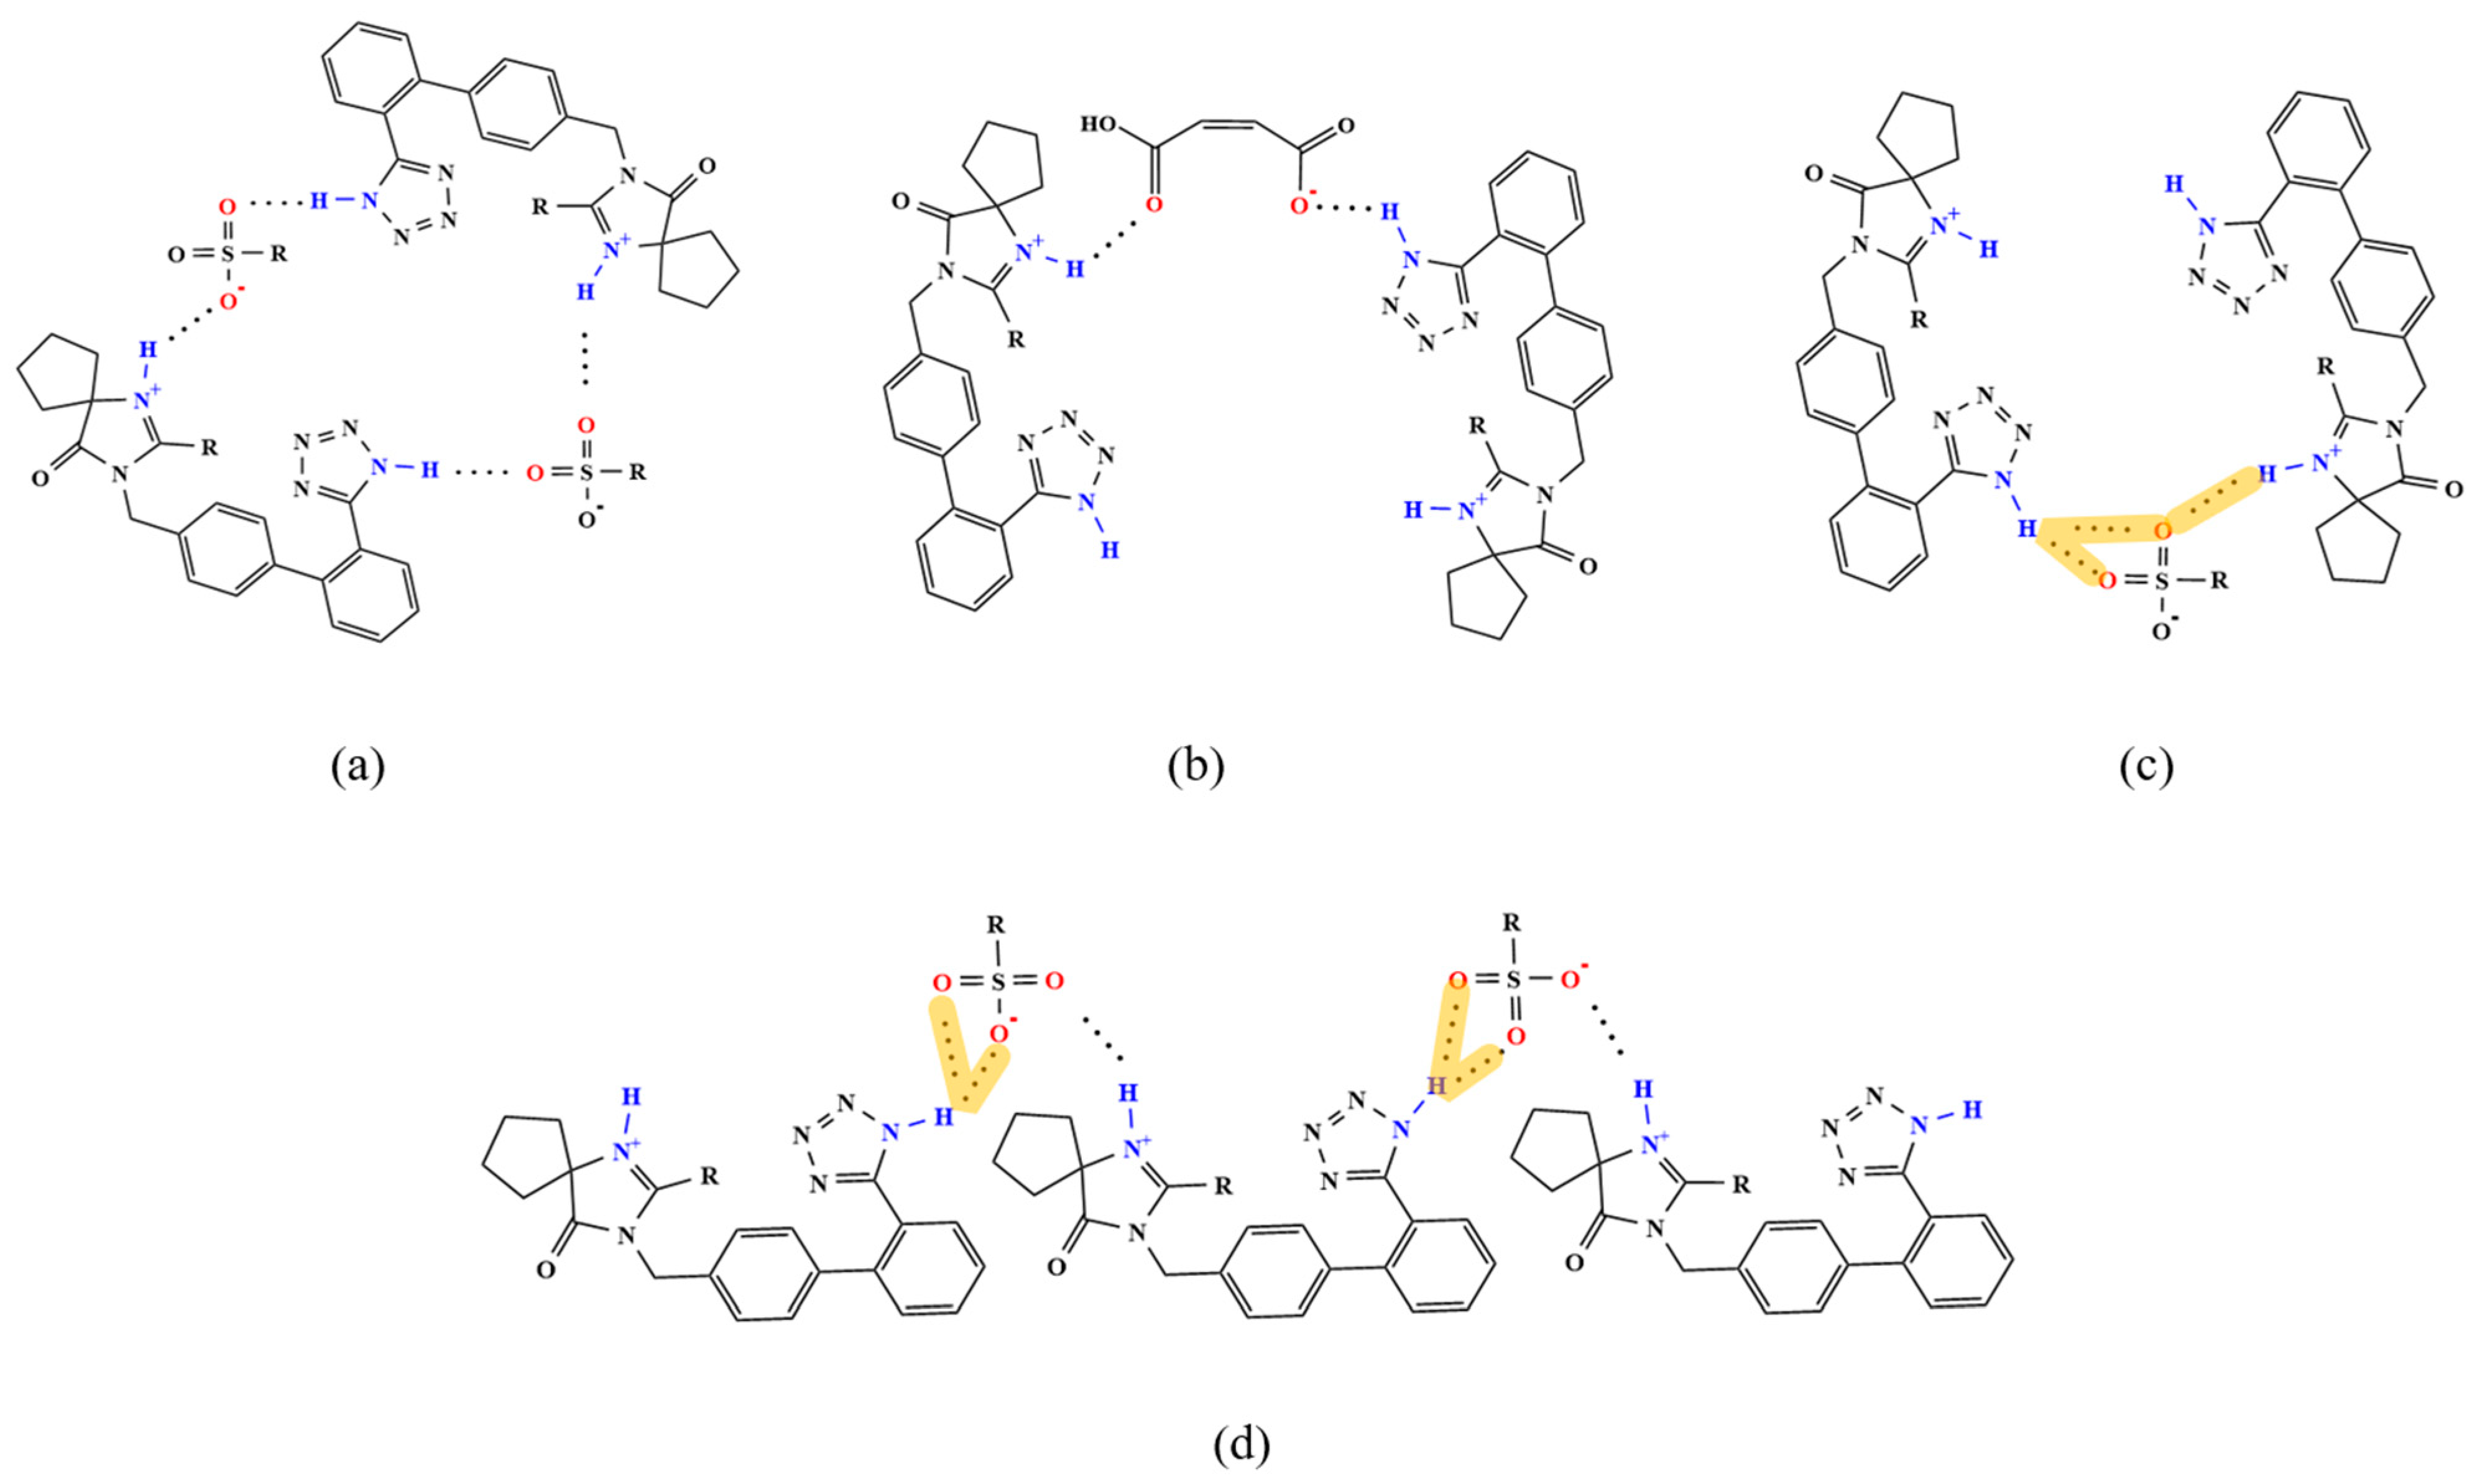
3.3.2. Analysis of Supramolecular Synthons

In the supramolecular synthons of the seven IRB salts, the imine group N1(N7)–H on the IRB tetrazole ring and N6(N12)–H on the diazepine ring act as HBDs, with the latter being the protonation site (H-in). The sulfonic acid group (three oxygens) or carboxyl group (two oxygens) of the coformers act as the HBAs, with the hydroxyl group being the deprotonation site (H-out), as shown in Figure 11 and Table S10. Typically, the deprotonation site forms a NH-in–H···OH-out charge-assisted HB with the protonation site. Such HBs are contained in the supramolecular synthons of the IRB-TOSA salt, IRB-BSA salt, IRB-4-CBSA salt, IRB-2,5-CBSA salt, IRB-MSA salt, and IRB-CPSA salt (marked in blue in Table S10). However, in the supramolecular synthons of the IRB-MAL salt, the deprotonation site (H-out) of MAL and the protonation site (H-in) of IRB do not directly form HBs. Instead, they form NH-in–H···Onon-H-out and Nnon-H-in–H···OH-out HBs with a neutral HBD (non-H-in) of IRB and a neutral HBA (non-H-out) of MAL, respectively. Moreover, Nnon-H-in–H···OH-out HBs exist in all the supramolecular synthons.
As shown in Figure 11, the supramolecular synthons of the IRB-TOSA salt, IRB-BSA salt, IRB-4-CBSA salt, and IRB-MSA salt take on a cyclic structure (Figure 11a). The supramolecular synthons of the IRB-MAL salt, IRB-2,5-CBSA salt, and IRB-CPSA salt are chain-like. Among them, the supramolecular synthons in the IRB-MAL salt and the IRB-2,5-CBSA salt (Figure 11b,c) have the simplest trimer structure, and those in the IRB-CPSA salt show a pentameric structure (Figure 11d). It is observed that rare bifurcated HBs are presented in the IRB-2,5-CBSA salt and the IRB-CPSA salt (shown by orange shading in Figure 11c,d). In the IRB-CPSA salt (Figure 11d), dual-HBA bifurcated HBs are present. In the IRB-2,5-CBSA salt (Figure 11c), both dual-HBA and dual-HBD bifurcated HBs are present, and, in particular, the sulfonic acid of 2,5-CBSA is involved in the two types of bifurcated HBs at the same time.
From the supramolecular synthons of the six IRB sulfonates, it can be seen that the sulfonic acid group of the coformers can form either two single HBs with the IRB tetrazolium ring N1–H and the diazepine ring N6–H via two oxygens, respectively, or a dual-HBA bifurcated HB with the IRB tetrazolium ring N1–H via two oxygens, and also a dual-HBD bifurcated HB with the IRB tetrazolium ring and the diazepine ring via one oxygen, as shown in Table 3. Notably, in the supramolecular synthon of the IRB-CPSA salt, three oxygens from the same sulfonic acid group form HBs simultaneously (Figure 11d).

3.3.3. NMR Analysis

Proton transfer in seven IRB salts was corroborated by solid-state and solution-state NMR spectroscopy. Among the seven salts synthesized, the IRB-TOSA, IRB-BSA, IRB-4-CBSA, IRB-MSA, and IRB-CPSA salts do not undergo phase transformation in methanol (PXRD profiles are shown in Figure S4), and all of them directly localize the hydrogen atom positions by solution hydrogen spectroscopy. The single-crystal structures in Section 3.3.1 show that, of the seven salts, the protonation site of IRB is the N6 atom involved in the double bond in the diazepine ring. The chemical shift changes in H-17, H-18, H-22, and H-25 near the diazepine N6 are analyzed below. The 1H NMR data of IRB and five IRB salts (IRB-TOSA, IRB-BSA, IRB-4-CBSA, IRB-MSA, and IRB-CPSA) measured in deuterated methanol are listed in Table 4 (the carbon atom numbering of IRB is given in Figure 2). The chemical shifts of the protons near N6 on the diazepine rings of these five salts all show a clear shift to lower fields compared to IRB. For example, the chemical shift of H-17 of these five salts increased from 2.4 ppm to about 2.9 ppm, showing a triple peak. The chemical shifts of H-22 and H-25 of IRB-TOSA increased by almost 0.2 ppm, the chemical shift of H-18 increased by 0.1 ppm, and H-18 of IRB-BSA shows multiple peaks with an increase in the chemical shift of almost 0.1 ppm. This indicates that proton transfer occurred in all five IRB salts [30].
Since IRB-MAL undergoes phase transformation in deuterated methanol and IRB-2,5-CBSA has very low solubility in deuterated reagents, both salts demonstrated proton transfer with the aid of solid-state carbon spectroscopy. The 13C NMR spectra of IRB, the IRB-MAL salt, and the IRB-2,5-CBSA salt are shown in Figure 12. C-15 and C-16 in the diazepine ring where N6 is located show the most obvious signal change. The chemical shifts of C-15 and C-16 are 183.07 and 166.49 ppm, respectively, for IRB, 179.78 and 176.21 ppm, respectively, for the IRB-2,5-CBSA salt, and 178.39 and 169.91 ppm, respectively, for the IRB-MAL salt. The change in chemical shifts of carbon signifies the protonation of N6 in the diazepine ring [30]. In addition, both the IRB-MAL and IRB-2,5-CBSA salts show C-1 signals at ~156 ppm, similar to IRB form A, which further confirms that the protons on their tetrazole rings are located at the N1 position.

3.3.4. ΔDC–O/S–O Analysis

In a carboxylate anion, the C–O bond lengths are typically similar, whereas, in a neutral carboxyl group, the C–O bond lengths differ significantly. Thus, proton transfer can be assessed by comparing the bond length difference (ΔDC–O) between the C–O bonds. Proton transfer occurs when the ΔDC–O is small; otherwise, it does not [54]. Similarly, for sulfonic acid coformers, proton transfer can be assessed by calculating the bond length difference (ΔDS–O) between the S–O bonds in the sulfonic acid group. As shown in Table 5, for the IRB-TOSA salt, the three S–O bond lengths are very close; the maximum ΔDS–O of 0.012 Å suggests that proton transfer between IRB and the coformer TOSA does indeed occur. After deprotonation, the three oxygens of the sulfonate group form equivalent resonance structures. The same occurs for the other five IRB sulfonates. As for the IRB-MAL salt, the ΔDC–O,COO of 0.031 Å means almost no bond length difference between the C–O bonds, so proton transfer also occurred between IRB and the coformer MAL.
In addition, the ΔDC–O,COOH(IRB-MAL) between the two C–O bonds of the neutral carboxyl group of MAL in the IRB-MAL salt was also calculated, with a value of 0.040 Å, as shown in Table 6. Compared to the ΔDC–O,COOH(IRB-MAL) of the two C–O bonds of the neutral carboxyl groups in the MAL molecule (which are 0.092 Å and 0.080 Å, respectively), the ΔDC–O,COOH(IRB-MAL) is significantly smaller than the ΔDC–O,COOH(MAL) but close to the ΔDC–O,COO(IRB-MAL). After the deprotonation of MAL, its carboxylate anion COO (H-out) produces an electron-donating inductive effect and a field effect on the other neutral carboxyl group (non-H-out). As a result, the electron cloud density of the neutral carboxyl group increases, and its HBA capacity is enhanced. This probably leads to a rotation of the MAL molecule, such that its COO (H-out) misses contact with the protonation site (H-in) and instead forms a Nnon-H-in–H···OH-out charge-assisted HB with the neutral HBD on IRB, the tetrazolium cycloimide group, N1(N7)–H (non-H-in). The electrically neutral carboxyl group (non-H-out) of MAL forms a NH-in–H···Onon-H-out charge-assisted HB with the IRB protonation site, N6(N12)–H (H-in) of the diazepine ring.

3.3.5. Analysis of Conformation Similarity

There are multiple rotatable single bonds in the molecular structure of IRB, and conformation flexibility may contribute to the construction of salt forms. The molecular conformation stacking of IRB in the seven salts and form A (CCDC No. 199411) [22] is shown in Figure 13. As seen in Figure 13a, the easily rotatable parts of IRB are the cyclopentane group, the 1H-tetrazol-5-yl group on the benzene ring, and the butyl group on the diazepine ring, and the conformation differences are manifested by different values of the corresponding torsion angles τ1, τ2, and τ3 (black, red, and blue markings in Figure 13a), respectively (Table S11). The change in the IRB molecular conformation in the IRB salts was measured by Δτi, where Δτi = min (|τi,IRBτi,salt|, 360° − |τi,IRBτi,salt|) (see Table S11 for details). Among the three torsion angles affecting the conformation of the IRB molecule, τ1 is less variable with respect to the IRB molecule, with values of τ1 around 120° for both IRB and the IRB salts. In contrast, τ2 exhibits significant changes (Δτ2 > 150°) in some of the IRB salts, as shown by the 1H-tetrazol-5-yl groups of IRB-TOSA-a, IRB-TOSA-b, IRB-4-CBSA-b, IRB-2,5-CBSA, IRB-MSA-b, and IRB-CPSA-b being oriented to the opposite side relative to IRB. The largest change is observed in IRB-CPSA-b, with a Δτ2 of nearly 170° (identified in yellow in Figure 13c). The butyl groups of all the salts have a large orientation with respect to IRB, with Δτ3 > 90°. These results suggest that the salt formation of IRB affects the conformation of IRB to a certain extent, and the effect on the conformation varies depending on the structural differences among coformers.

3.4. Crystal Characterization and Property Analysis

3.4.1. Thermal Analysis

The endothermic peaks in the DSC curves and the absence of weight loss in the corresponding temperature ranges in the TGA plots (shown in Figure S5) indicate that the seven salts prepared by the single-crystal milling method are anhydrates and non-solvates, in agreement with the results of the single-crystal resolution. As shown in Figure S5, the melting temperatures Tm (or decomposition temperatures Td) of the IRB-TOSA salt, IRB-MAL salt, IRB-BSA salt, IRB-4-CBSA salt, IRB-2,5-CBSA salt, IRB-MSA salt, and IRB-CPSA salt are 206 °C (Tm), 137 °C (Tm), 231 °C (Td), 179 °C (Tm), 247 °C (Td), 188 °C (Td), and 249 °C (Td), respectively, which are different from IRB and the coformers (183 °C (Tm), 103 °C (Td), 146 °C (Td), 52 °C (Tm), 102 °C (Td), 88 °C (Td), and 202 °C (Td)). These results further confirm the formation of a new solid phase (DSC and TGA curves were not conducted due to MSA’s liquid state at room temperature). Among them, the IRB-TOSA salt, IRB-BSA salt, IRB-2,5-CBSA salt, IRB-MSA salt, and IRB-CPSA salt have higher melting points than those of IRB and the coformers, and they possess better thermal stability. The three oxygen atoms on the sulfonic acid group of the coformer in the IRB-CPSA salt form HBs with IRB simultaneously (Figure 11d), and this compact structure may be one of the reasons for the highest decomposition temperature of the IRB-CPSA salt. In addition, the sharp endothermic peaks of all IRB salts indicate a high degree of crystallinity.

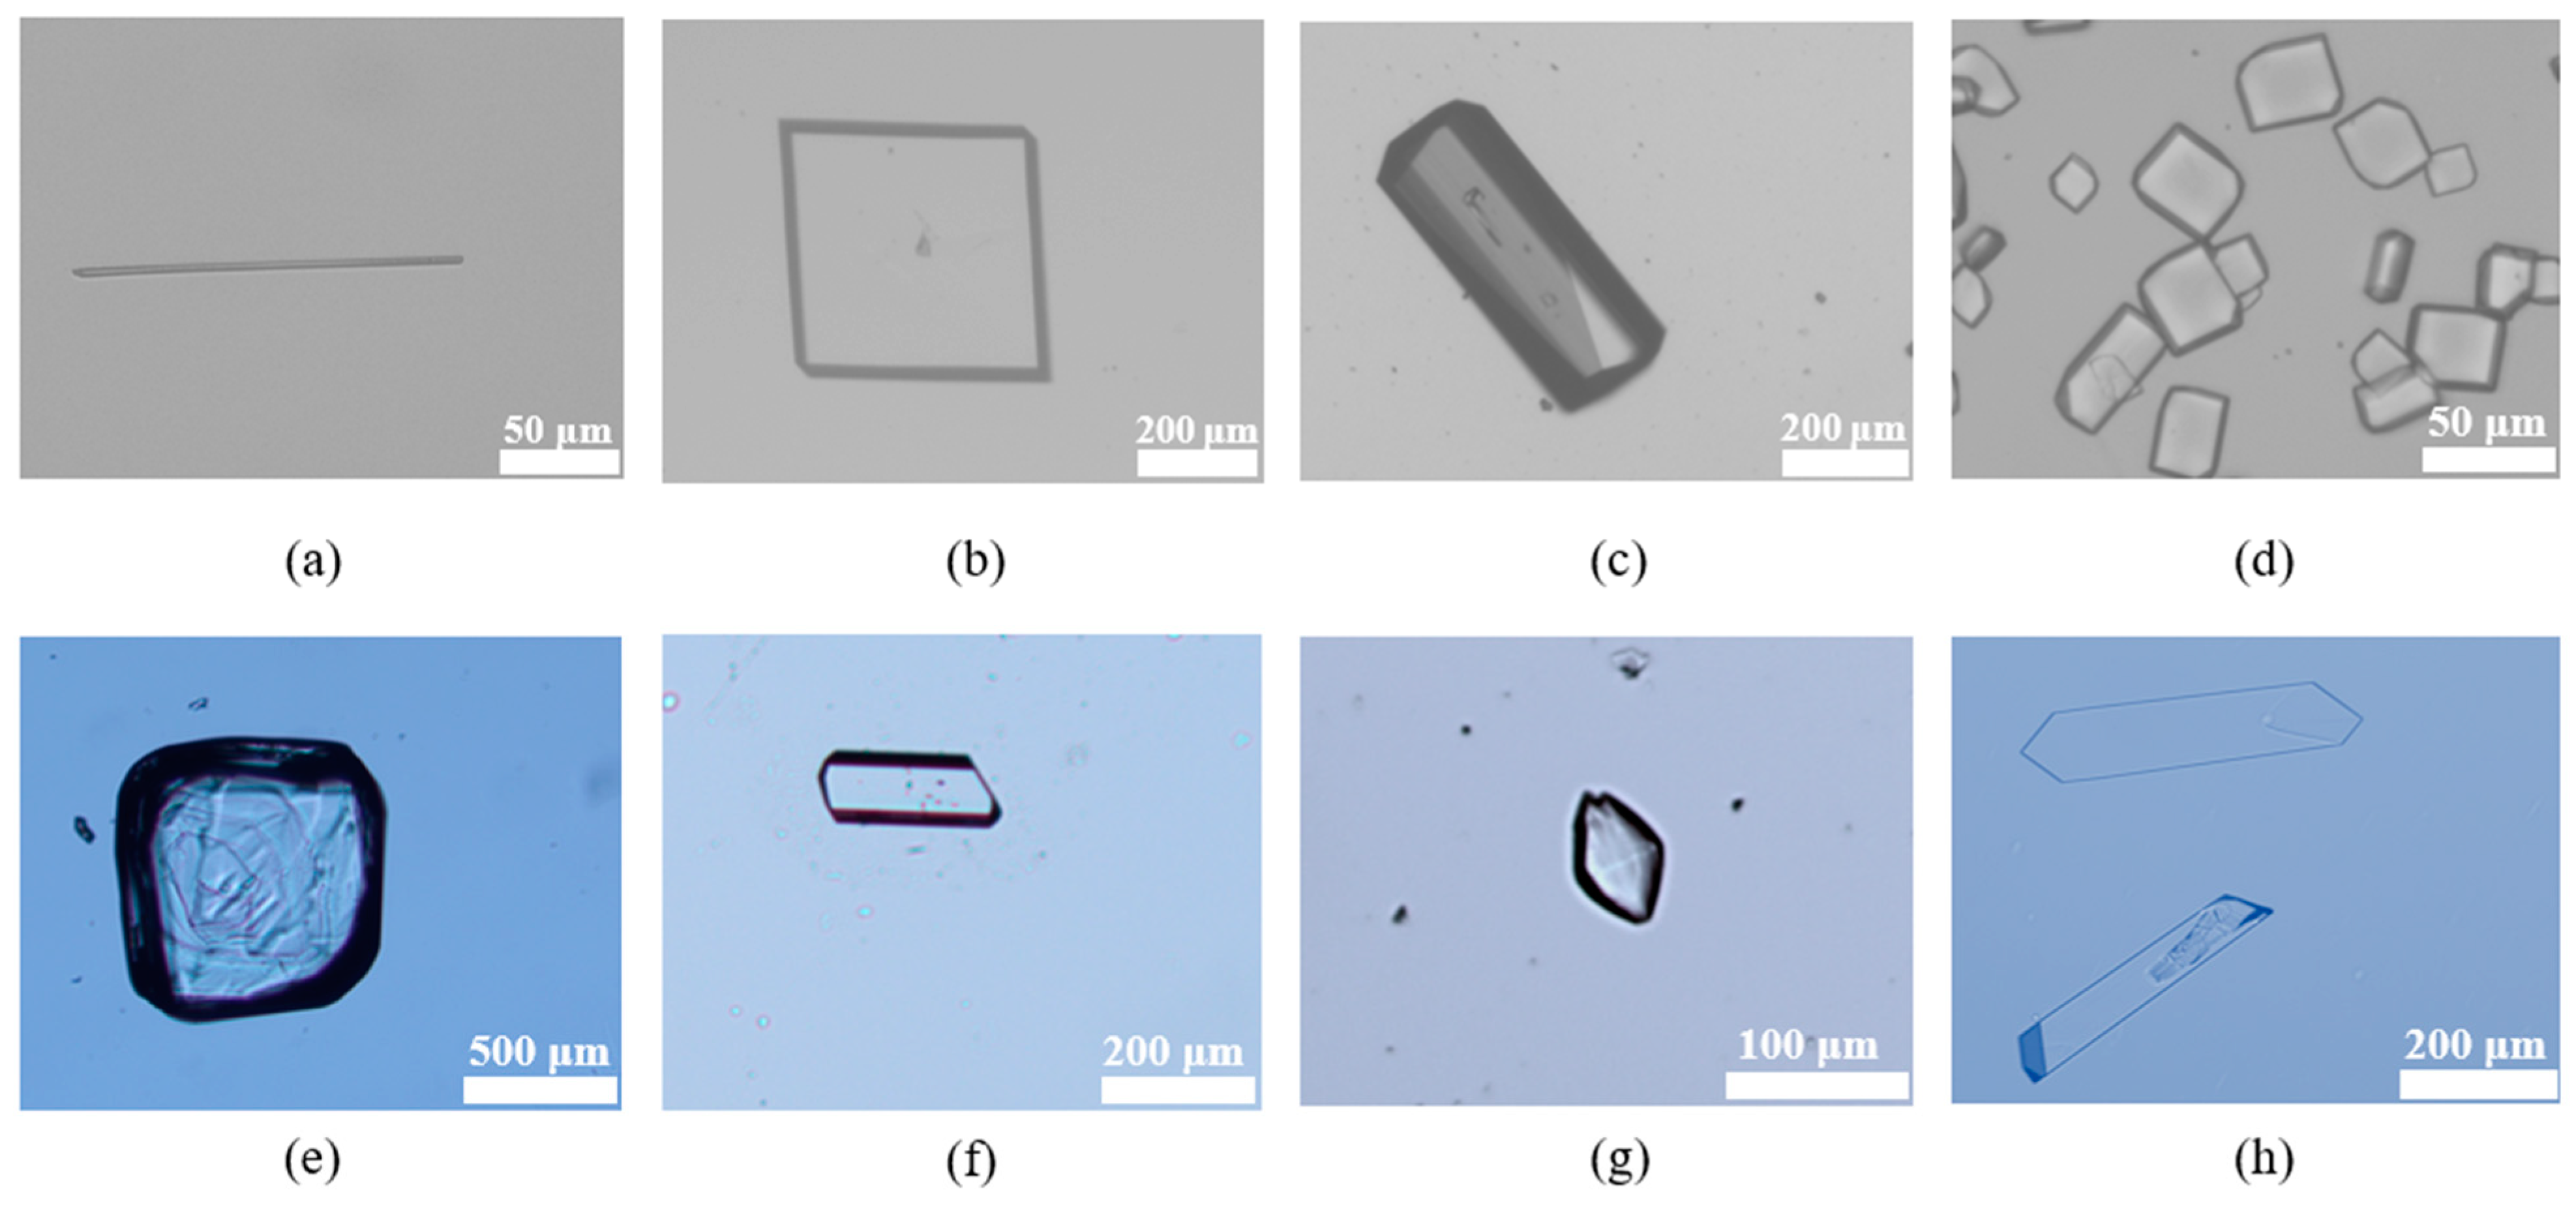
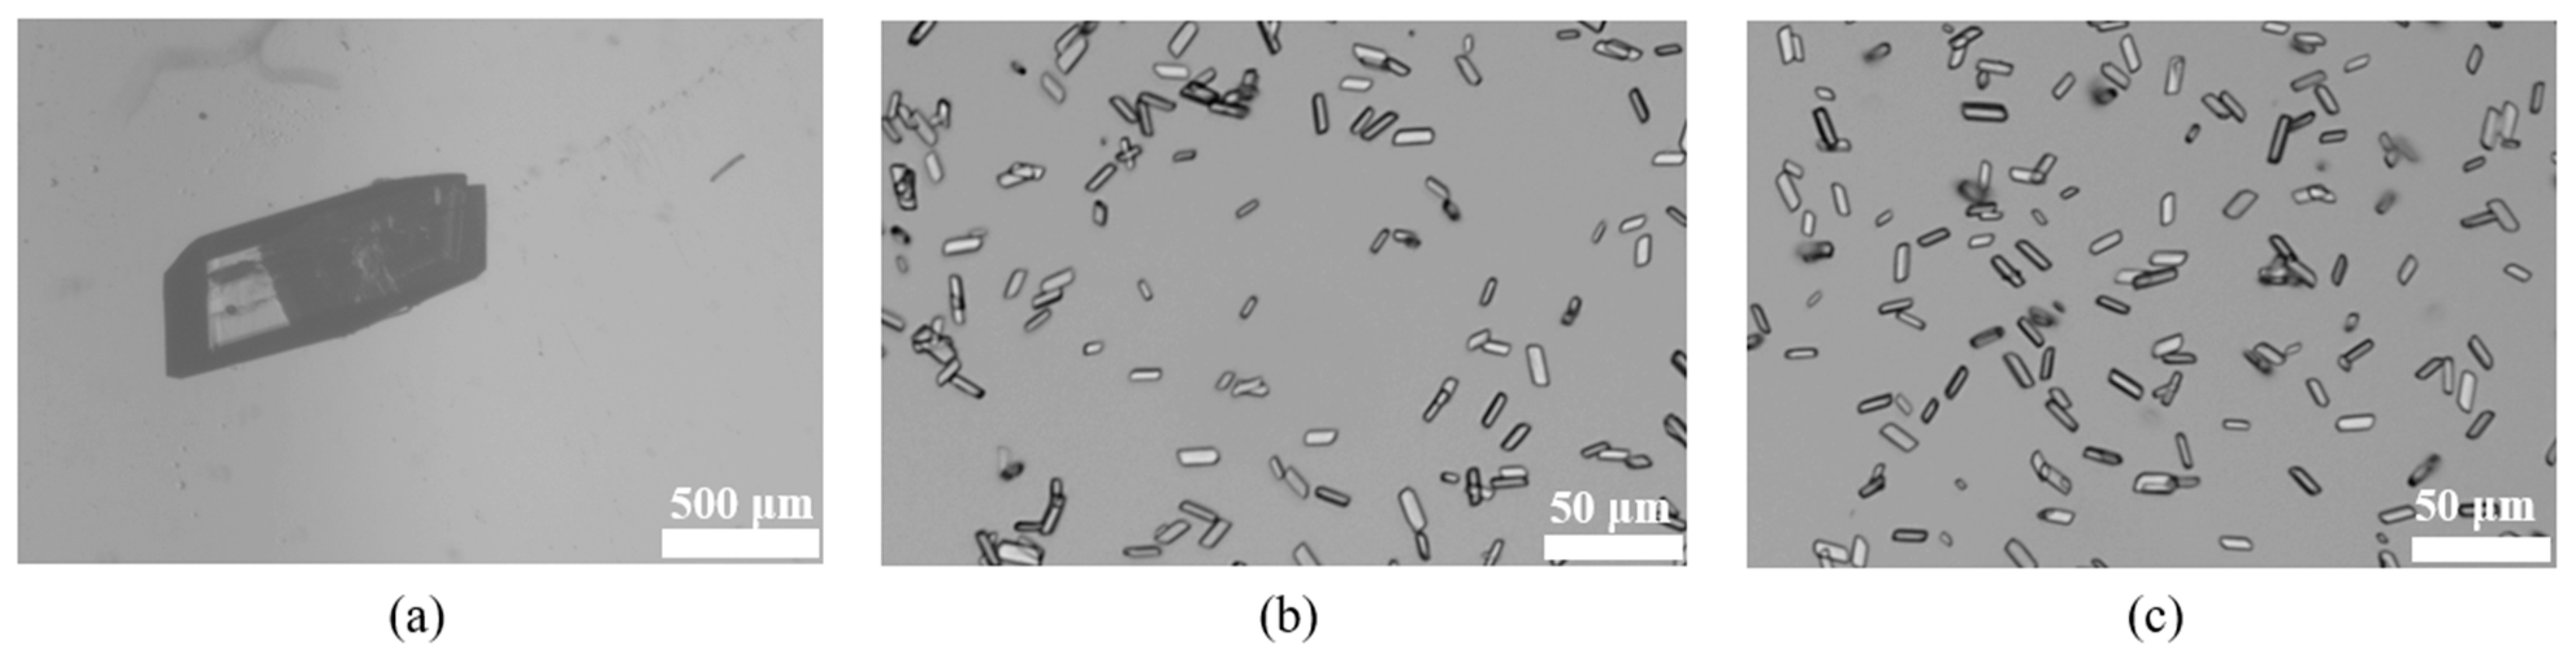
3.4.2. Crystal Morphology Analysis

The morphologies of the seven new IRB salts are flakes, blocks, or short rods, as shown in Figure 14. The particle sizes of the IRB-BSA salt, IRB-2,5-CBSA salt, and IRB-MSA salt are 50–200 μm, while the other IRB salts have a particle size of around 500 μm. The good crystal morphologies of the IRB salts are more favorable for filtration, washing, drying, and downstream processing, storage, and transportation than the long needle-like shape of pharmaceutical IRB crystal form A (Figure 14a, obtained by slowly evaporating solvent in an anhydrous methanol solution at room temperature and PXRD, as shown in Figure S1).

3.4.3. Hygroscopicity and Moisture–Thermal Stability Analysis

Water absorption during manufacturing and storage affects the appearance, properties, and stability of APIs. Since TOSA, 4-CBSA, and 2,5-CBSA (coformers) are all highly hygroscopic, the adsorption–desorption isotherms of the three salts that they formed with IRB at 25 °C and RH = 5–95% were determined via DVS analysis to assess the hygroscopicity of the salts, and the results are shown in Figure S6 and Table 7. The mass of the IRB-TOSA salt, IRB-4-CBSA salt, and IRB-2,5-CBSA salt increased by 0.16%, 0.32%, and 0.10%, respectively, when the relative humidity was increased from 0% to 95%. At RH = 40%, their mass gains (0.04%, 0.11%, and 0.04%) were below 0.2%. According to the Chinese Pharmacopoeia’s determination [34] of hygroscopic weight gain, the three salts are almost non-hygroscopic, with IRB-2,5-CBSA being the least hygroscopic. Furthermore, the desorption curves of the three salts are close to the adsorption curves (Figure S6a–c), indicating that the adsorption and desorption processes are reversible. For the three coformers, when the RH was steadily increased to 95%, TOSA (Figure S6d) and 4-CBSA (Figure S6e) exhibited a mass increase of 182.42% and 172.51%, respectively, suggesting that they are highly susceptible to hygroscopicity. In contrast, 2,5-CBSA (Figure S6f) is not only highly hygroscopic but also has an irreversible adsorption–desorption process with nearly 50% moisture still present in the sample mass when the relative humidity was lowered to 5%; hence, 2,5-CBSA is extremely hygroscopic. From the above results, it is clear that the introduction of the coformers did not bring strong hygroscopicity to the IRB salts, and the three salts have excellent moisture resistance, which is very favorable for the late packaging and storage of the drug. Compared to the sulfonic acid coformers, the significantly decreased hygroscopicity of the IRB sulfonates can also be explained by the crystal structure. For example, the coformer TOSA has multiple HB binding sites on the sulfonic acid group, which could act as an HBA or HBD to form an O–H···O HB with H2O. When TOSA forms a salt with IRB, all three oxygen atoms on the sulfonic acid group form an HB with IRB and form a complex cyclic supramolecular synthon, which results in a reduction in the number of potential HB sites for binding to H2O, significantly reducing the hygroscopicity of the salt.
The stability of the IRB salts was assessed under accelerated storage conditions (40 °C, 75% RH) over 14 weeks. As shown in Figure S7, the PXRD patterns of the IRB-TOSA salt, IRB-MAL salt, IRB-BSA salt, IRB-4-CBSA salt, IRB-2,5-CBSA salt, and IRB-CPSA salt remained unchanged after 14 weeks of storage, indicating that they possess excellent hygrothermal stability, which is essential for further applications. However, the IRB-MSA salt exhibited degradation by the 4th week.

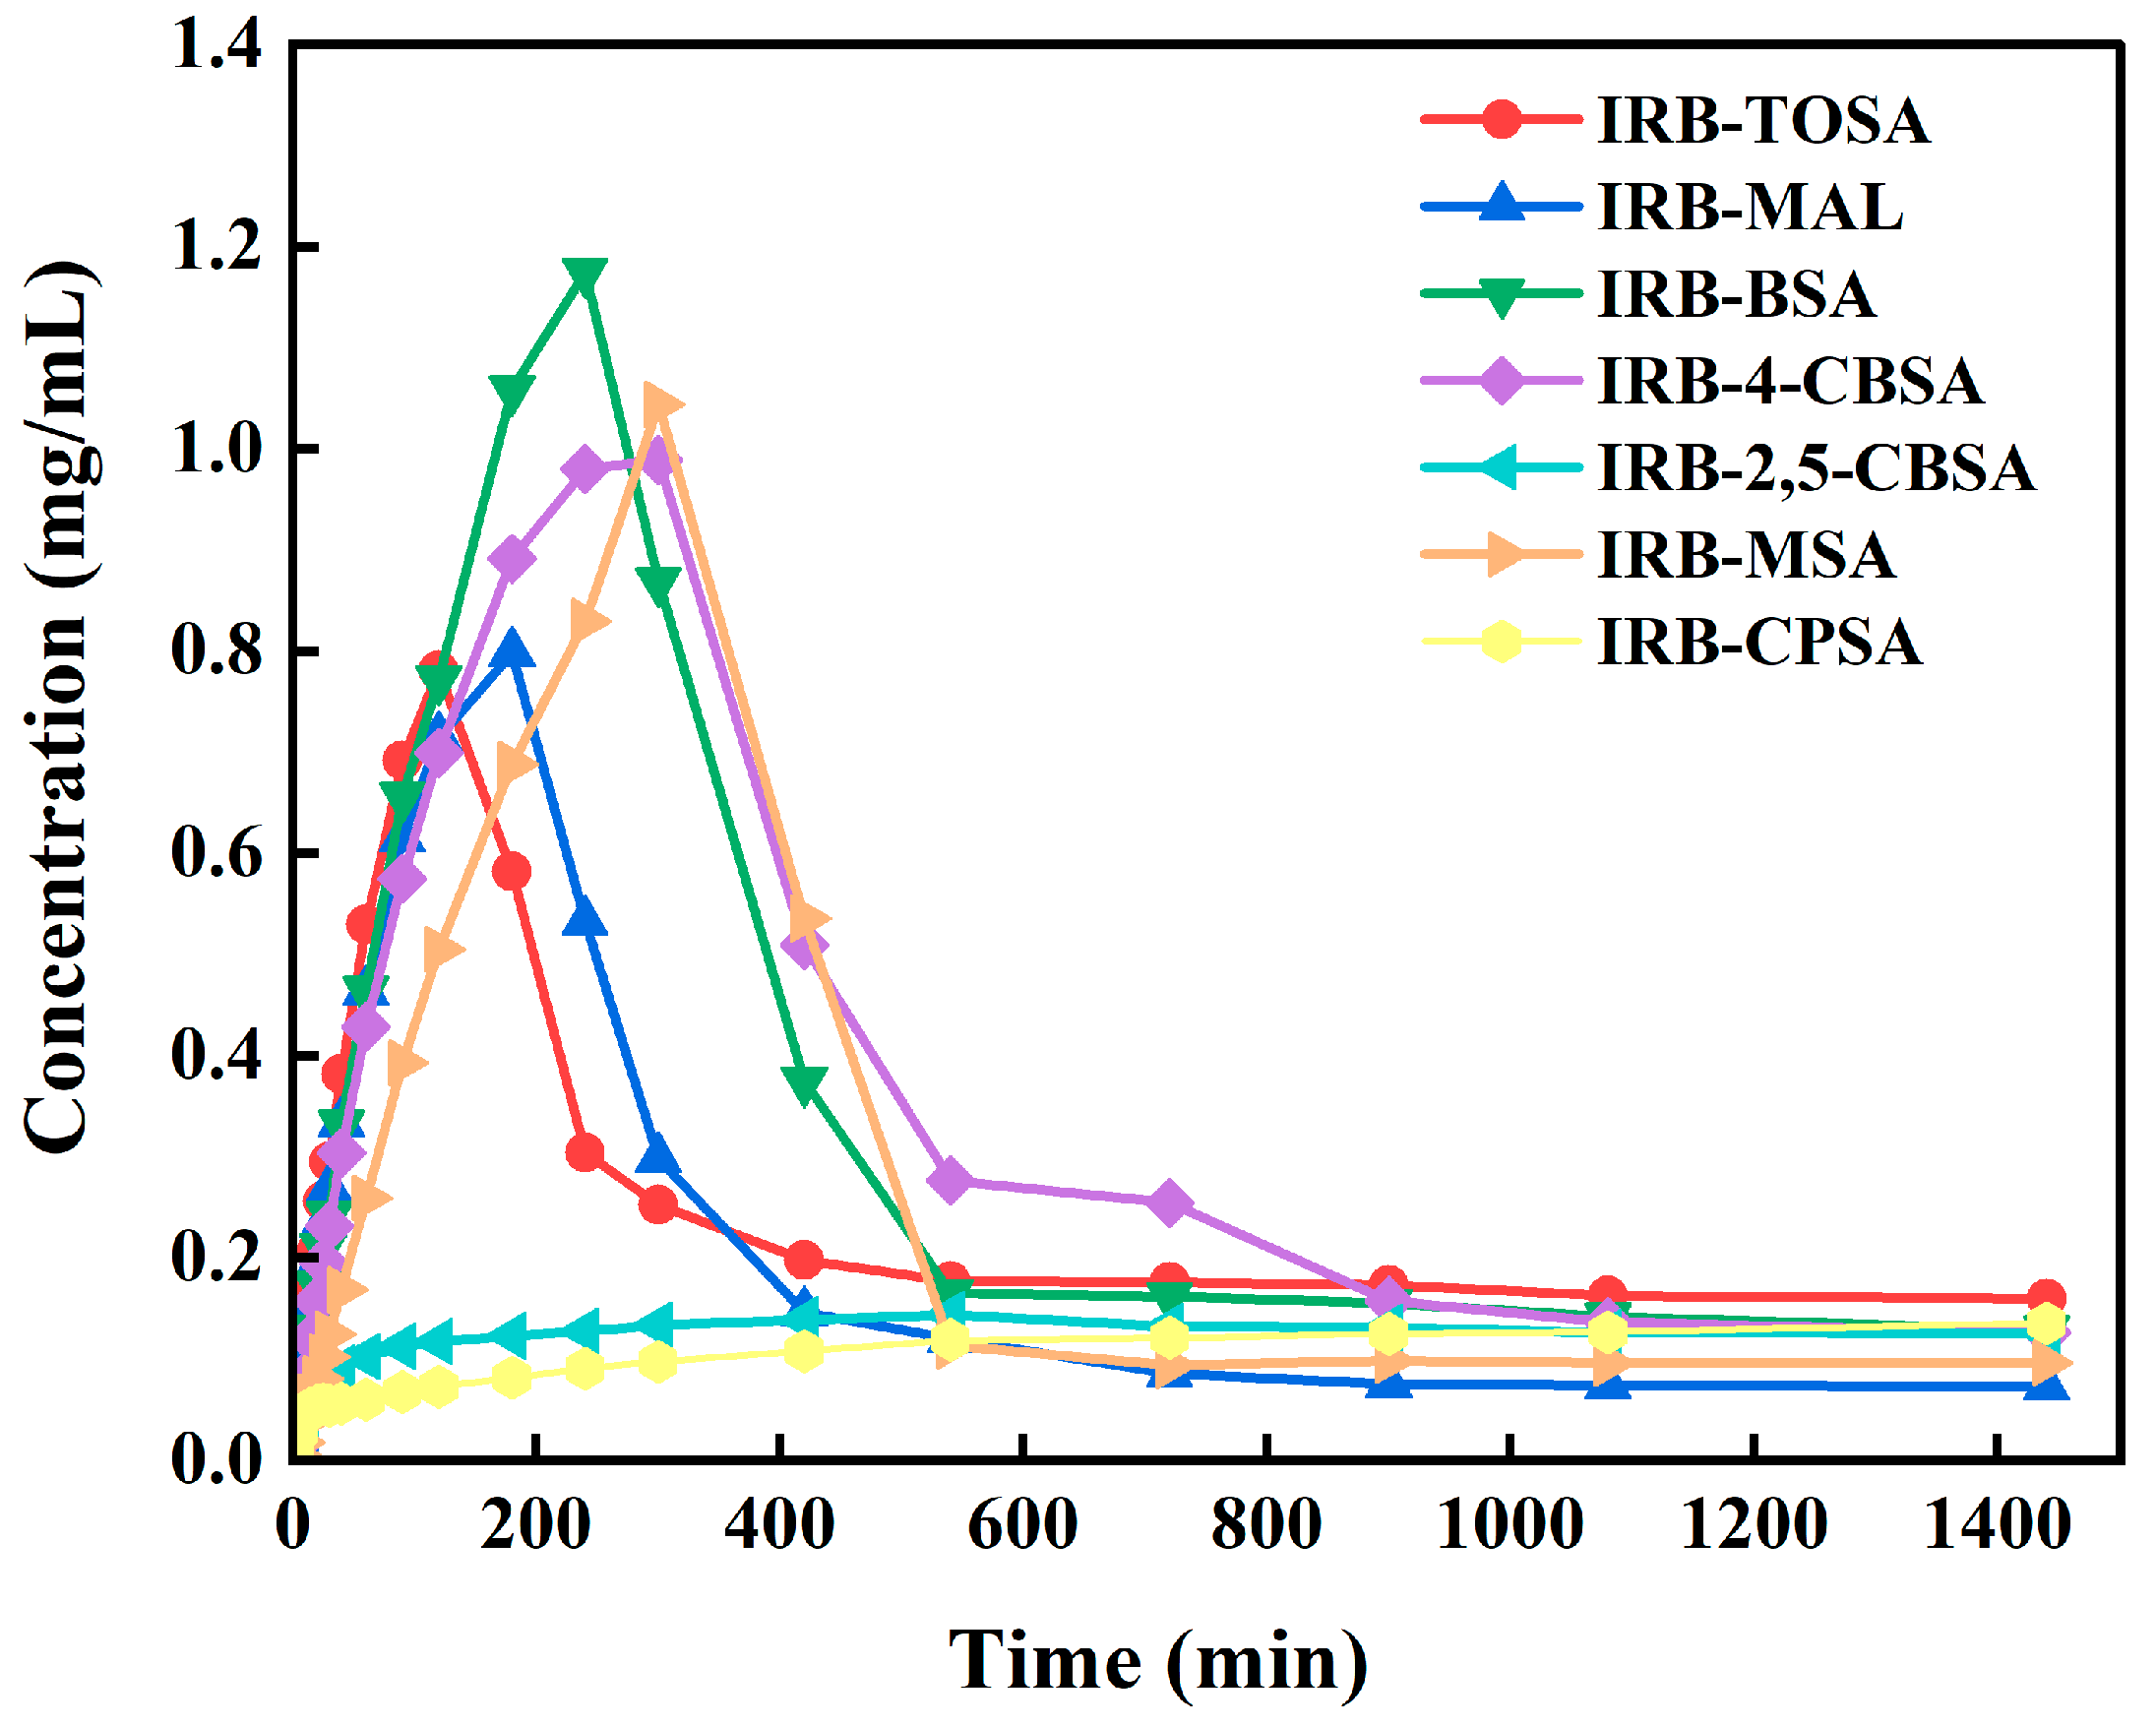
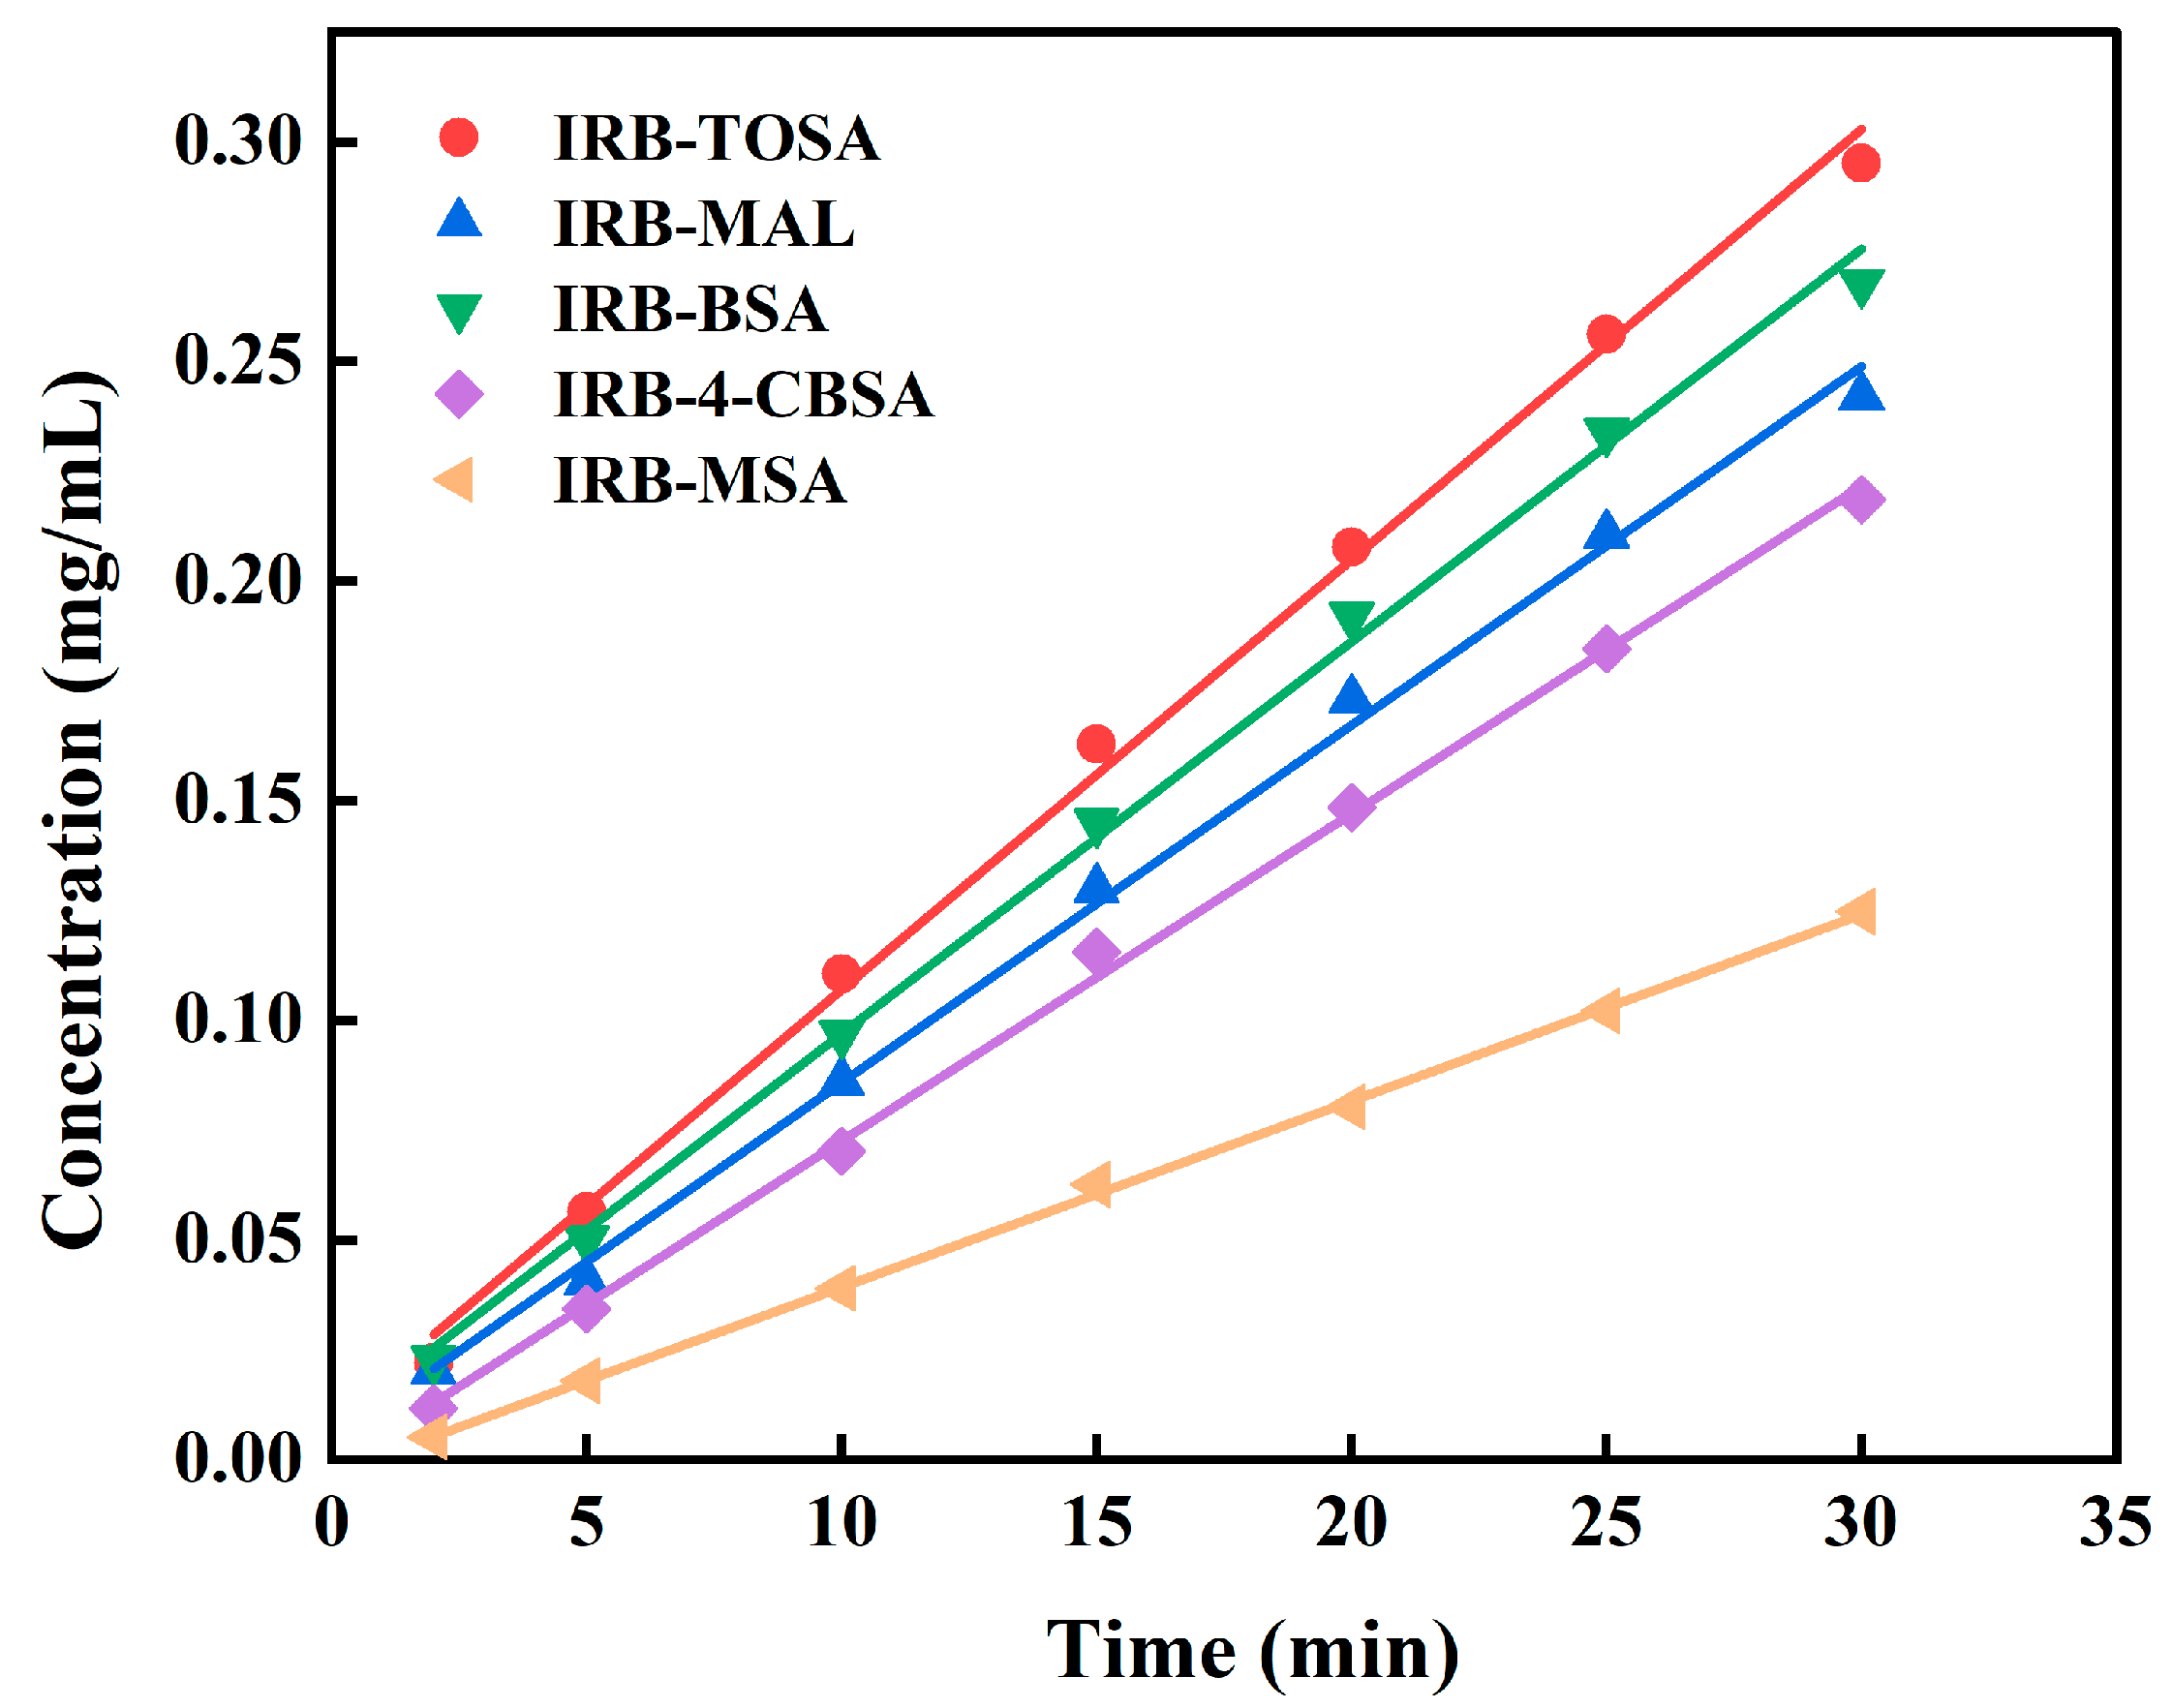
3.4.4. Dissolution and IDR Analysis

Dissolution and the intrinsic dissolution rate (IDR) have a great impact on the bioavailability of drugs. In this paper, the dissolution curves of the IRB salts in pH 6.8 buffer were determined, as shown in Figure 15. The pH of the solution before and after 24 h of the experiment is shown in Table S13. The pH remained essentially constant, indicating that pH is not responsible for the change in the IRB dissolution properties by IRB salts. The portion of the IRB salt dissolution curves shows a linear increase in dissolution for the first 30 min (Figure 16). The IDR values calculated based on the dissolution curves are listed in Table S13, and the IDR values of the IRB-TOSA salt, IRB-MAL salt, IRB-BSA salt, IRB-4-CBSA salt, and IRB-MSA salt are 0.7383, 0.6140, 0.6728, 0.5613, and 0.3194 mg/(cm2·min), respectively, which are all significantly higher than the IDR value of IRB form A (0.0025 mg/(cm2·min)) [26], with the highest IDR value for the IRB-TOSA salt. As a fat-soluble drug, IRB generally requires about 1 h of gastrointestinal digestion before absorption into the bloodstream [55]. As can be seen in Figure 15, IRB concentrations in the IRB salts reached high values at this time and maintained them for at least 300 min, probably due to molecular interactions between IRB and the coformers, which help sustain IRB supersaturation in solution [56]. It can also be seen in Figure 15 that the dissolution of the IRB-2,5-CBSA salt and the IRB-CPSA salt grew slowly compared to the other five salts, similar to IRB crystal form A. Additionally, during the first 30 min of dissolution, the dissolution gradually slowed rather than remaining constant (e.g., Figure S8); therefore, the IDR values of these two salts are not calculated in this paper. As shown in Figure 15, the peak Cmax of the curve is the maximum dissolution, and the Cmax values of the IRB-TOSA salt, IRB-MAL salt, IRB-BSA salt, IRB-4-CBSA salt, and IRB-MSA salt are 0.781, 0.798, 1.175, 0.632, and 1.044 mg/mL, in that order. These values are 42.0%, 45.1%, 113.6%, 14.9%, and 89.8% higher than that of IRB (which reaches a maximum concentration of 0.55 mg/mL at 60 min [26]) measured under identical experimental conditions, respectively. These results indicate that the enhanced dissolution and faster release rates of these five IRB salts could facilitate more rapid drug action, making them promising candidates for improved pharmaceutical formulations.

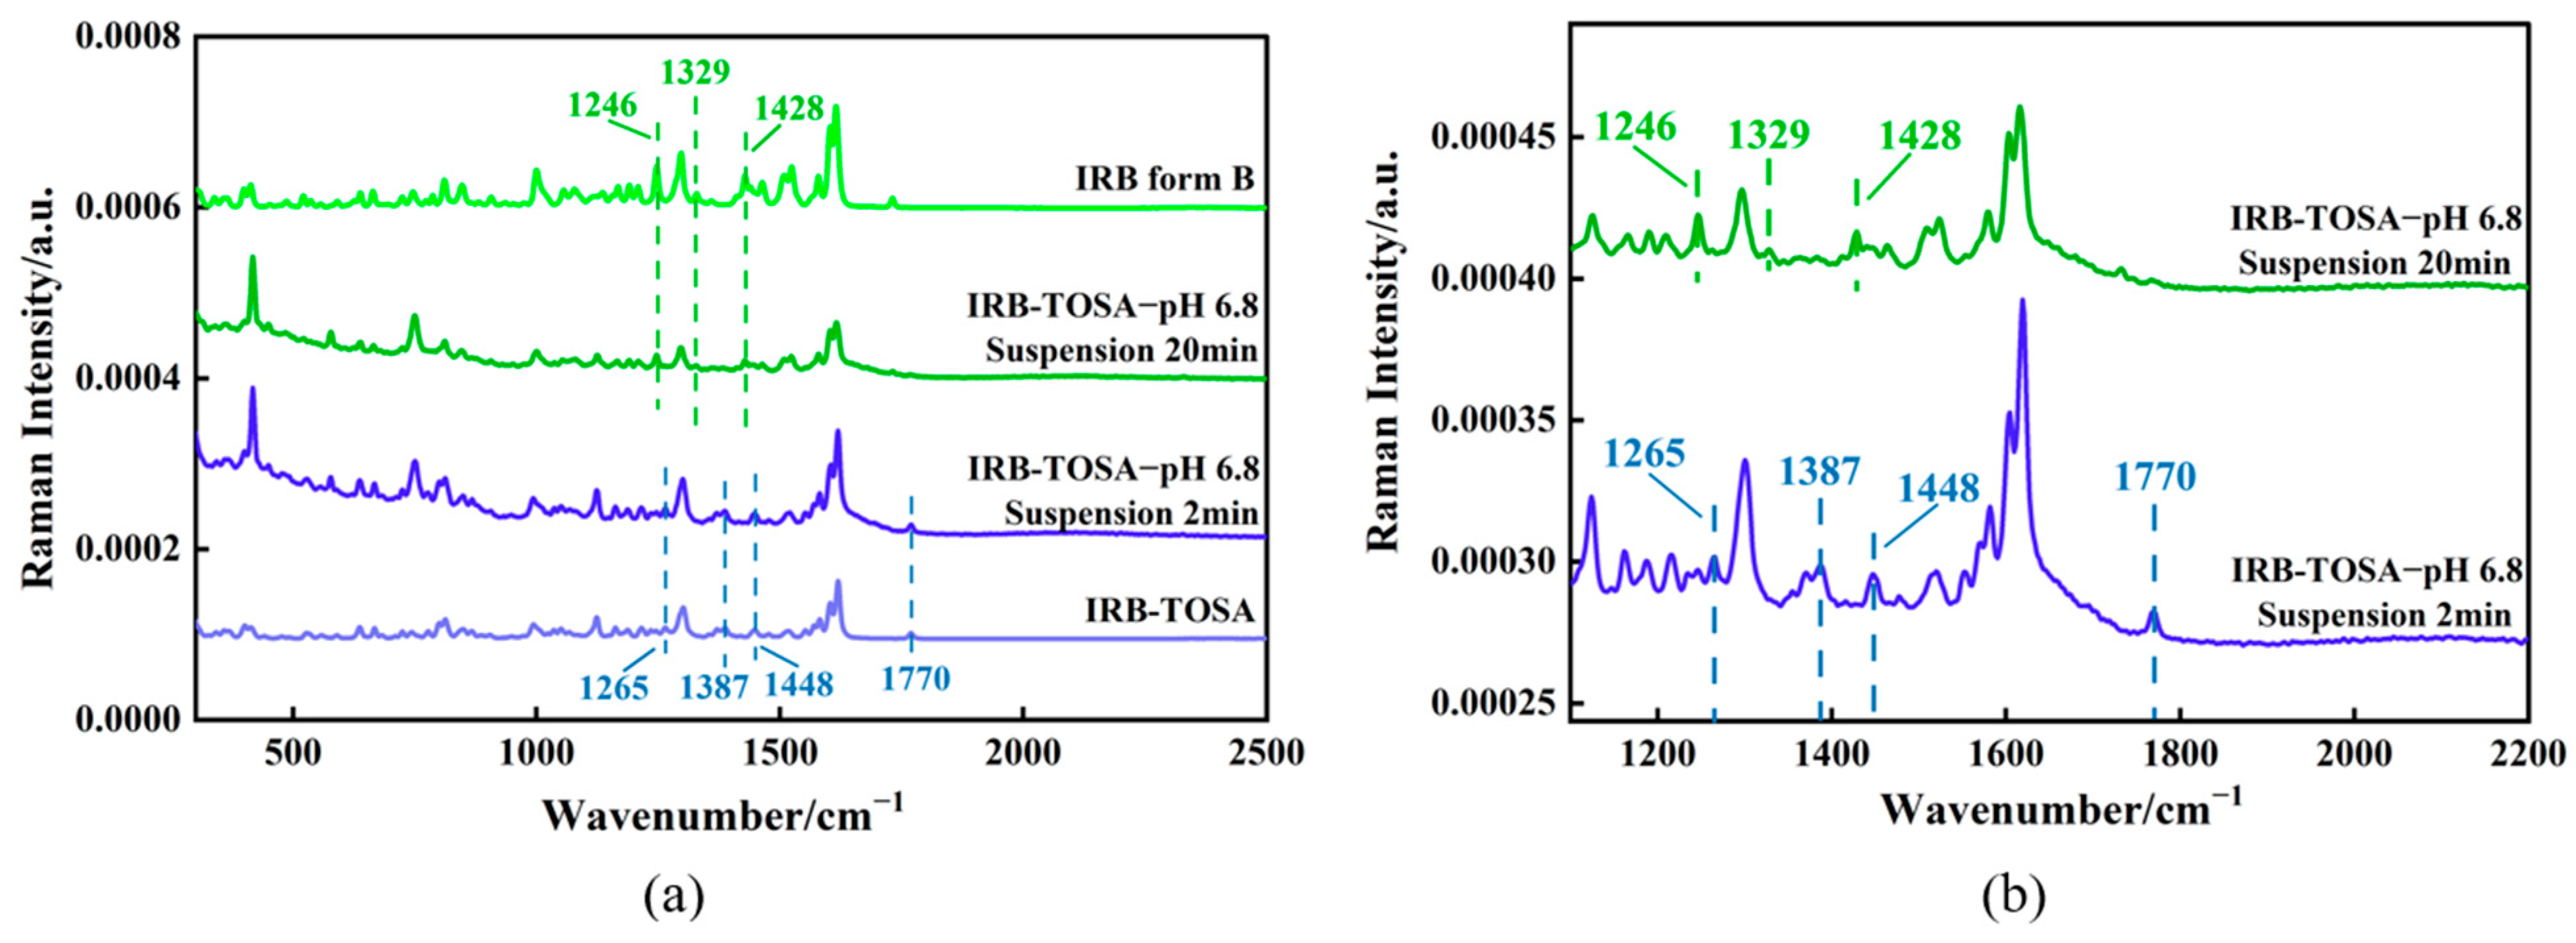
3.4.5. Analysis of the Phase Transformation Process

The type of dissolution curve reflects the release behavior and phase behavior of a drug. Dissolution curves are usually typed as hover and spring–parachute. A spring–parachute dissolution curve implies that the dissolution process of the cocrystal or salt is accompanied by phase transformation [57]. The hover-type dissolution curve may arise from either the dissolution behavior of the cocrystal/salt as a stable crystal form [58] or the simultaneous dissolution of the cocrystal/salt and precipitation of the API [59]. After the dissolution curve determination experiments, the PXRD of the residual solid phase was determined, and the results are shown in Figure S9. In the figure, it can be seen that all seven IRB salts transform to IRB form B after 24 h. According to the characteristics of dissolution with time (e.g., Figure 15), the seven IRB salts can be classified into two categories: spring–parachute type [60] and slow-rising hovering type. The IRB-TOSA salt and the 2,5-CBSA salt were selected from the two categories, and their suspension phase transformation process in pH 6.8 phosphate buffer at 37 °C was monitored by in situ Raman spectroscopy.
The Raman spectral variations in the suspension phase transformation process of the IRB-TOSA salt are shown in Figure 17. The Raman spectrum of the IRB-TOSA salt has characteristic peaks at 1265 cm−1, 1387 cm−1, 1448 cm−1, and 1770 cm−1. The Raman spectrum of IRB form B has characteristic peaks at 1246 cm−1, 1329 cm−1, and 1428 cm−1. In the first 2 min of the suspension experiment, the characteristic peaks of the Raman spectra were in the same positions as those of IRB-TOSA, indicating that there was no obvious change in the suspended IRB-TOSA salt in the solution at that time. After 20 min of suspension, the original scattering peaks at 1265 cm−1, 1387 cm−1, 1448 cm−1, and 1770 cm−1 disappeared, and the characteristic peaks at 1246 cm−1, 1329 cm−1, and 1428 cm−1 corresponding to IRB form B appeared, indicating that the IRB-TOSA salt underwent phase transformation and transformed into IRB form B. Microscopic observation was carried out, as shown in Figure 18. IRB form A is needle-like (Figure 14a), and form B is short rod-like (Figure 18a), which are clearly different in morphology. The crystal morphology in the suspension was short rods (Figure 18b), which further indicated that at that time, the IRB-TOSA salt had transformed into IRB form B. As shown in Figure 19, the Raman spectra of the pure solid phase of IRB-2,5-CBSA have characteristic peaks at 1263 cm−1, 1448 cm−1, and 1779 cm−1. Within 2 min of suspension, the positions of the characteristic peaks in the Raman spectra are the same as those of the IRB-2,5-CBSA salt, indicating that phase transformation had not yet occurred for the suspended IRB-2,5-CBSA in solution at that time. Similar to the phase transformation process of IRB-TOSA, after suspension for 20 min, the original characteristic peaks at 1263 cm−1, 1448 cm−1, and 1779 cm−1 disappeared, and the characteristic peaks corresponding to IRB form B appeared at 1246 cm−1, 1329 cm−1, and 1428 cm−1. The crystal morphology was short rods (Figure 18c), which indicated that IRB-2,5-CBSA transformed to IRB form B.
The incongruent dissolution of the IRB salts in the buffer solutions is likely mediated by the solvent environment [61]. In addition, IRB precipitated as form B, not form A, probably due to the greater polarity of the phosphate buffer, which is more favorable for the crystallization of form B [62]. In general, the dipole moments of both proton tautomers increased with increasing solvent dipole moment [37]. The intermolecular HB of tetrazolium–imidazole in the 2-H isomer (form B) increased its polarity, whereas there is no such HB in the 1-H isomer (form A), which is less polar than the 2-H isomer [37]. It is possible that the more polar phosphate buffer favors the presence of IRB in the form of the 2-H tautomer, thus allowing more growth units available in solution for form B growth; therefore, IRB precipitated as form B.

3.5. Computational Analysis

3.5.1. HS Analysis

The Hirshfeld surfaces of the IRB salts are presented in Figure S10. In all IRB salts, the IRB cations act as HBDs via the N atoms on the tetrazole ring and the diazepine ring, which interact with the O atoms on the carboxylic or sulfonic acid groups in the coformers. A prominent red region (strong interaction [50]) exists in all the N atoms of the diazepine ring, corresponding to the formation of N–H···Ocoformers by proton transfer in the salt. The relative percentage contribution of intermolecular interactions is shown in Table 8, with H···H interactions occupying the highest ratio (42.4–56.3%). In addition, the sum of the proportions of N···H and O···H interactions reaches 25.3–31.7%, indicating that the NIRB–H···Ocoformers HB plays an important role in the construction of supramolecular synthesizers. The C···H interactions account for 10.6–15.0% of the total proportion, which corresponds to the presence of the C–H···π weak interactions in the crystal structure. In contrast to the other IRB salts, the IRB-4-CBSA salt and the IRB-2,5-CBSA salt also exhibit Cl···H interactions.

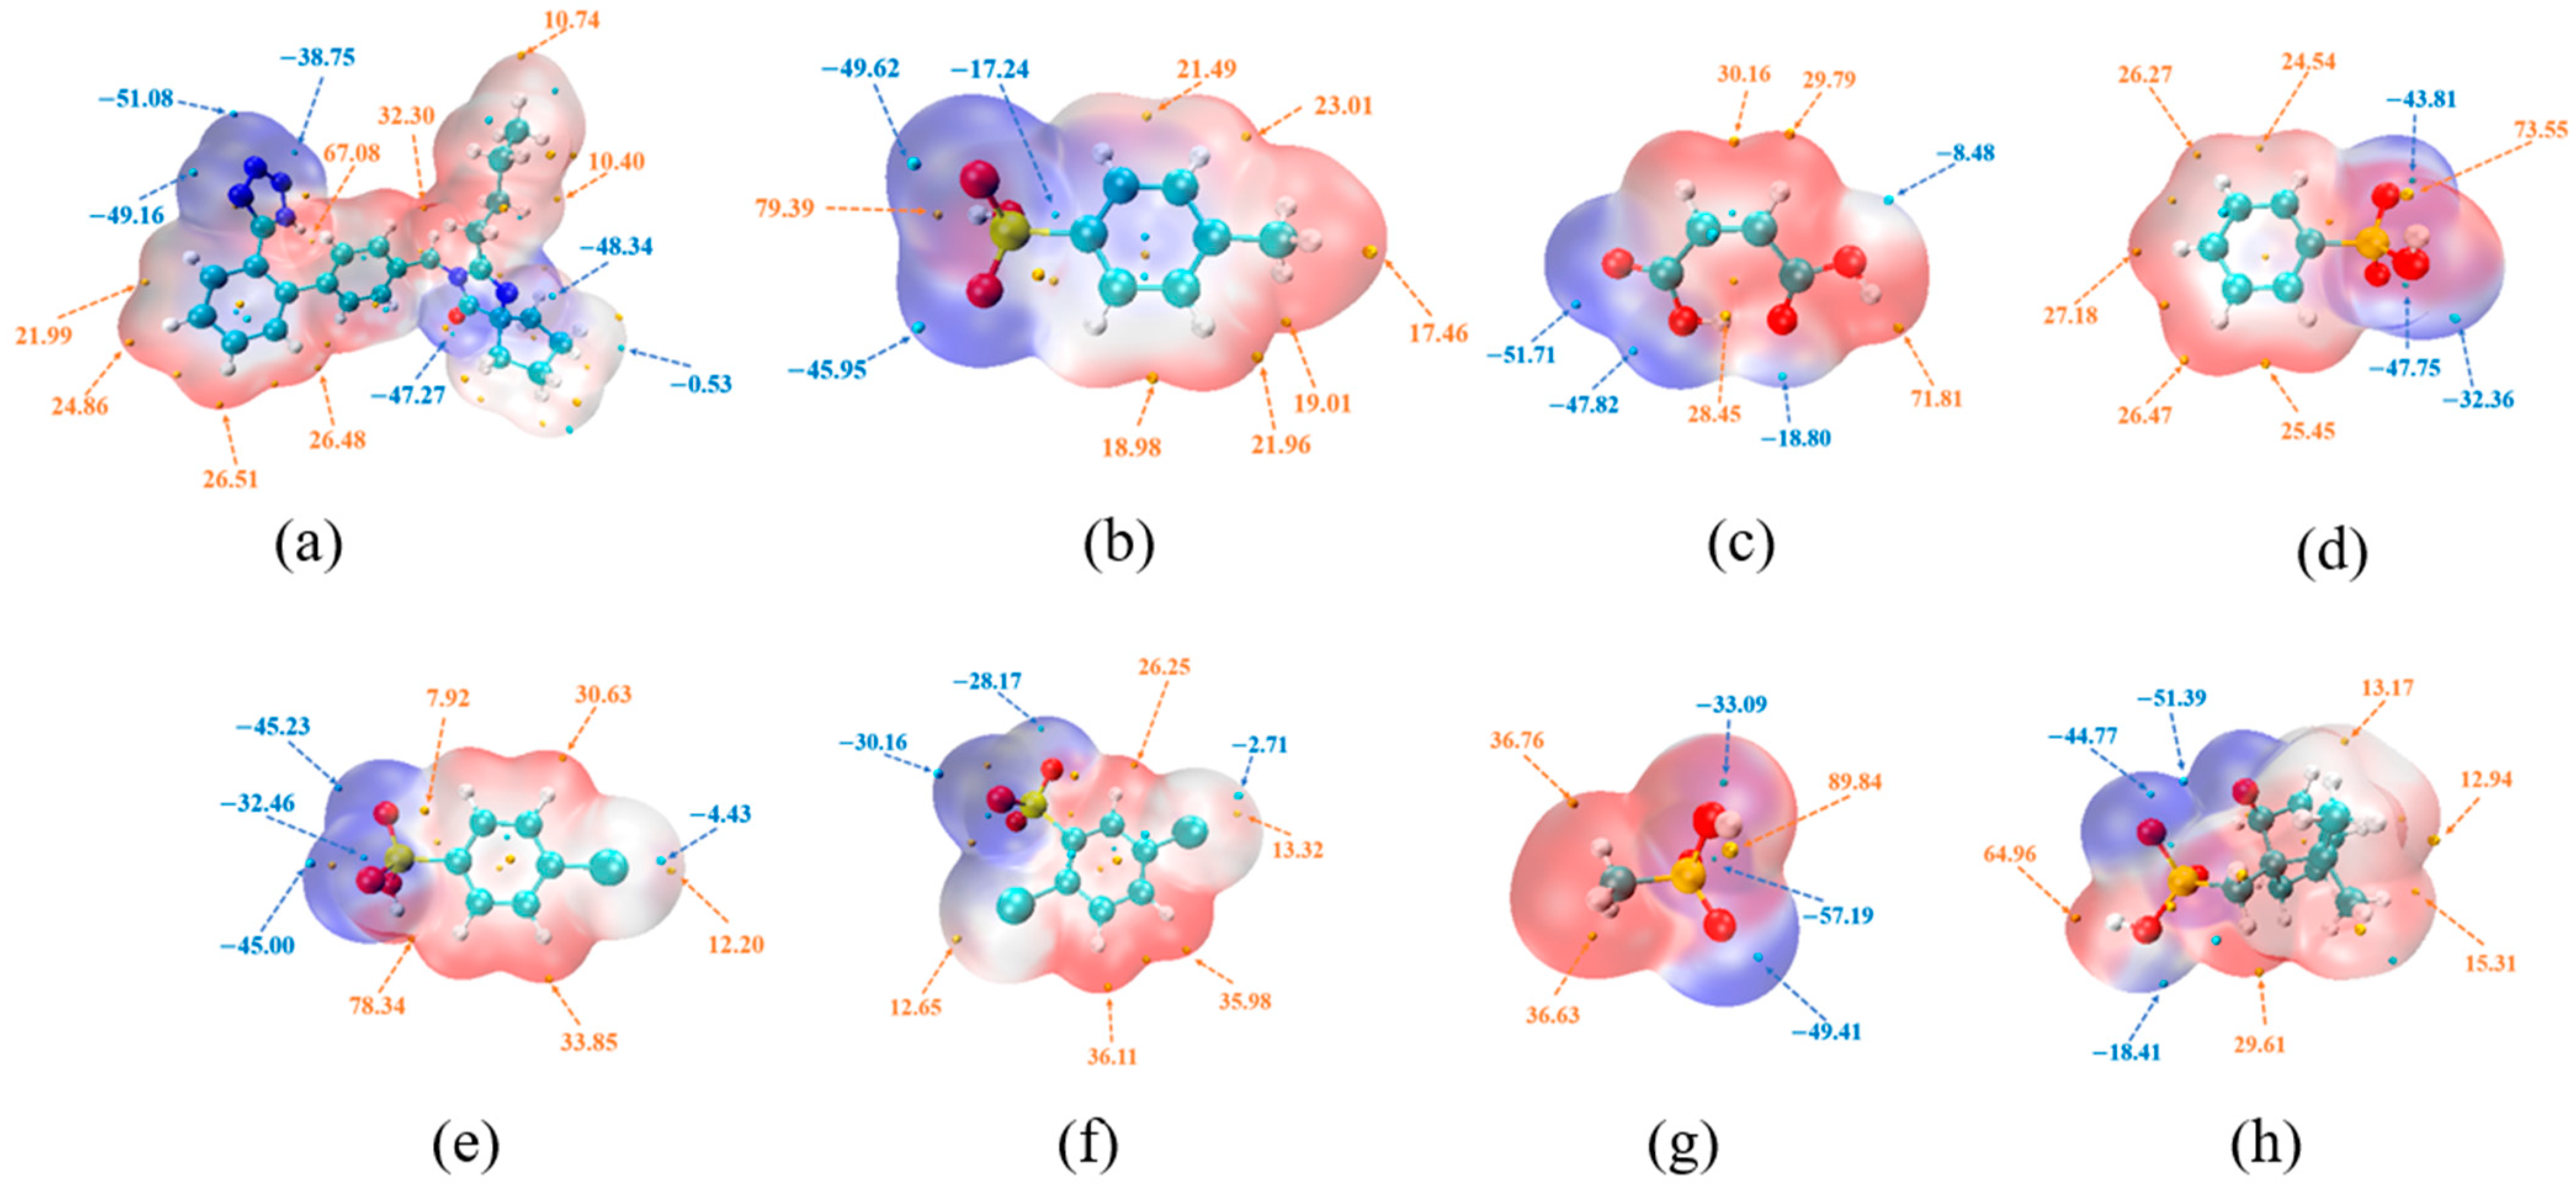
3.5.2. MEPS Analysis

HBs primarily arise from electrostatic attraction, and MEPS analysis provides insights into the intrinsic driving forces behind HB formation. Figure 20 shows the MEPS plots of IRB and the coformers, where the orange regions indicate positive potential and the blue regions indicate negative potential. The extrema of the positive and negative potentials are marked by orange and blue spheres, respectively. Among the benzenesulfonates and carboxylic acids, the maximum electrostatic potentials of the coformers TOSA, MAL, BSA, 4-CBSA, 2,5-CBSA, MSA, and CPSA are 79.39, 71.81, 73.55, 78.34, 36.11, 89.84, and 64.96 kcal/mol, respectively, and these maximum potentials are located near the hydroxyl groups of the carboxyl and sulfonic acid groups. They are typical HBDs, providing favorable conditions for the formation of charge-assisted N–H···O HBs. The imine group of the tetrazole ring has the largest electrostatic potential extremum (67.08 kcal/mol, Figure 20a) in the IRB, demonstrating a strong proton donating capacity; thus, each IRB salt contains a N1–H···Ocoformer HB.
As a binary acid, the hydroxyl group on one carboxyl group of MAL (electrostatic potential of 28.45 kcal/mol) is highly susceptible to forming an HB with the carbonyl oxygen on the other carboxyl group (electrostatic potential of −18.80 kcal/mol) with complementary electrostatic potentials (Figure 20c), resulting in the generation of an intramolecular HB. In contrast, the hydroxyl group (electrostatic potential of 71.81 kcal/mol) in the MAL structure, which is not involved in the intramolecular HB, has a very large electrostatic potential maximum, thus allowing the proton to transfer to the nitrogen atom on the IRB diazepine ring (electrostatic potential of −48.34 kcal/mol) (Figure 20c), consistent with the results of the single-crystal resolution.

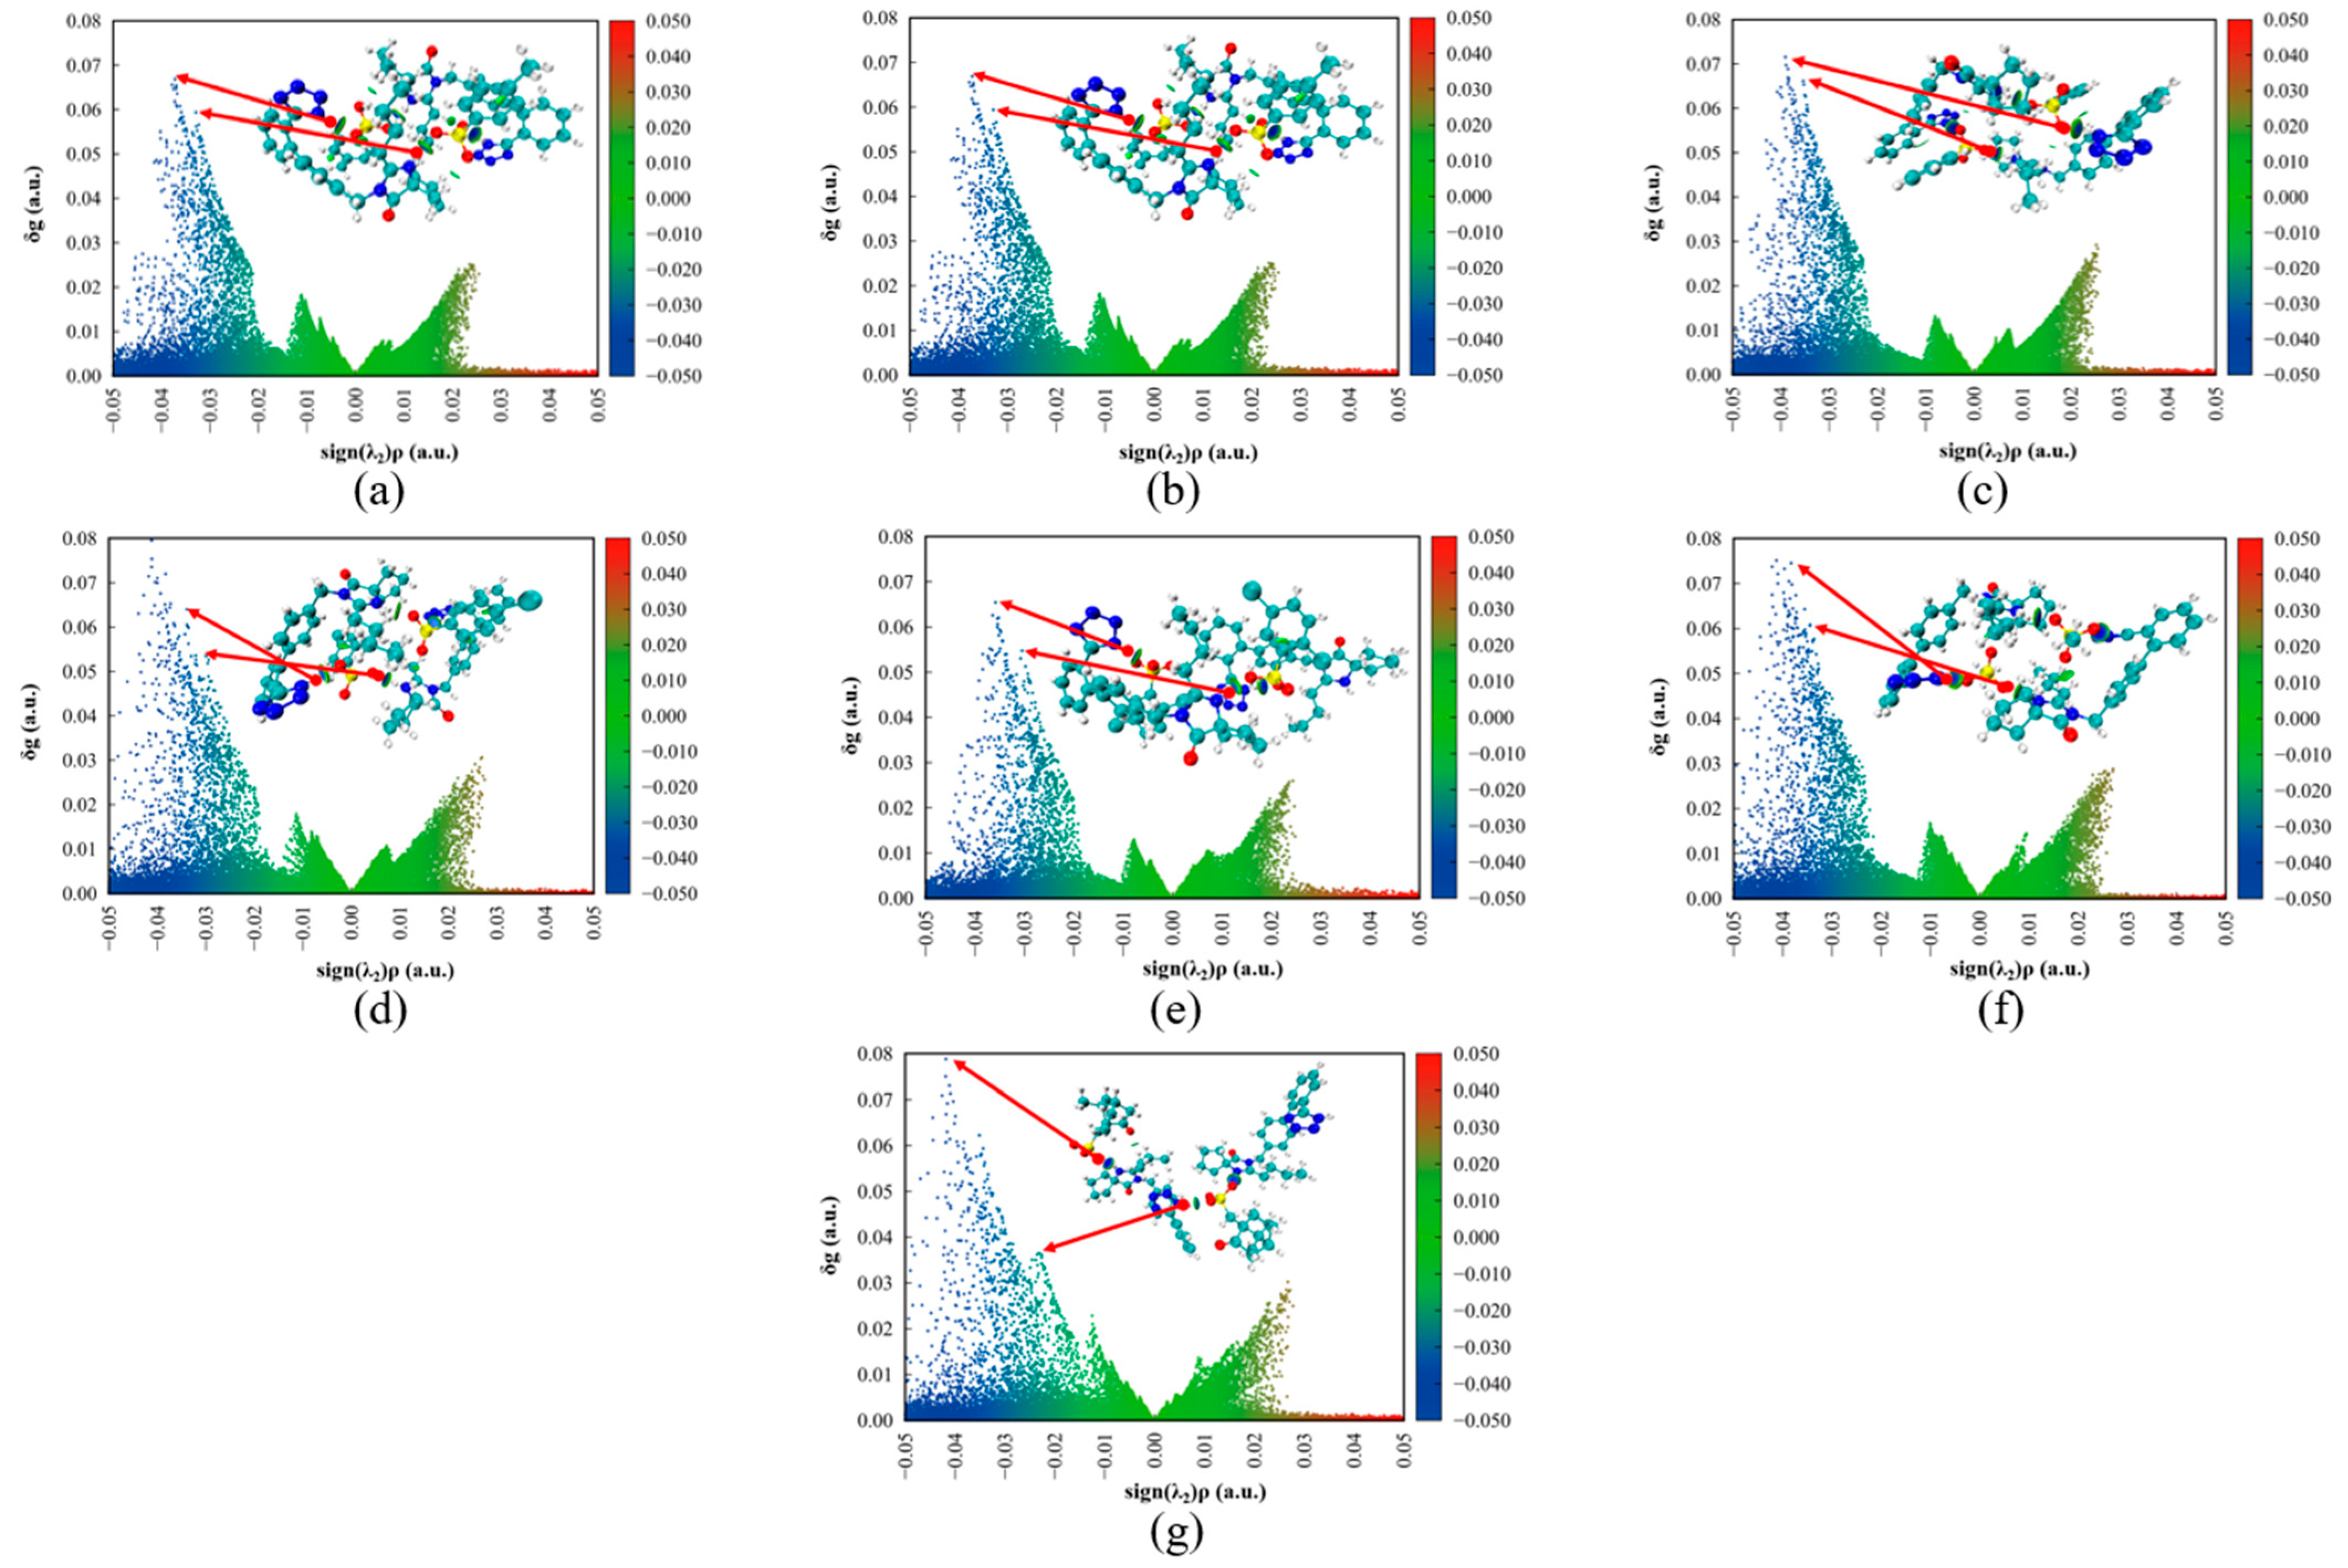
3.5.3. AIM and IGMH Analysis

In AIM theory, the electron density at the interaction critical point correlates positively with bond strength, making it a key metric for evaluating intermolecular interactions [63]. AIM analysis is based on the molecular clusters extracted from single crystals, considering the main hydrogen bonds present in the crystal structure of each IRB salt. As shown in Table S14, the Laplacian (∇2ρ) of the electron densities of all noncovalent interactions (NIRB–H···Ocoformers) is positive, thus determining their closed-shell topological nature, and the total electron energy density H is negative, indicating that the NIRB–H···Ocoformers interaction is a medium-strength HB.
In the IRB-MAL salts, the N1 site of the tetrazole ring and the N6 site of the diazepine ring of IRB formed HBs with the carboxyl group of the coformers. In the IRB sulfonate salt, the N1 and N6 sites of IRB formed HBs with the sulfonic acid groups of the coformers. The bond energies of the major HBs N1(IRB)–H1···O2(TOSA) and N6(IRB)–H6···O3(TOSA) in the IRB-TOSA salt are −13.52 and −12.02 kcal/mol, respectively. The bond energies of the major HBs N1(IRB)–H1···O4(BSA) and N6(IRB)–H6···O2(BSA) in the IRB-BSA salt crystals are −14.62 and −13.62 kcal/mol, respectively. The bond energies of the major HBs N1(IRB)–H1···O6(4-CBSA) and N6(IRB)–H6···O2(4-CBSA) in the IRB-4-CBSA salt crystals are −12.83 and −11.37 kcal/mol, respectively. The relative HB strengths follow IRB-BSA > IRB-TOSA > IRB-4-CBSA, which may account for the Td(IRB-BSA) > Tm(IRB-TOSA) > Tm(IRB-4-CBSA) observed in the thermal analysis in Section 3.4.1. Among these seven salts, the charge-assisted HB N6(IRB)–H6···O4(CPSA) bond energy formed by the diazepine ring of IRB with the sulfonic acid group of CPSA is the largest in absolute value (15.46 kcal/mol), which is consistent with the fact that the highest decomposition temperatures are observed for IRB-CPSA. Figure S11 shows the presence of a critical point for the HB of each NIRB–H···Ocoformers in the IRB salt, and the bonding paths associated with the HB can also be seen in the figure.
To further elucidate the differences in the intermolecular HB of the IRB salts, IGMH was performed on their supramolecular synthons. Figure 21 shows the scatter plot and filled isosurface plots for each supramolecular synthon. Within the scatter plot, the vertical axis (δg) represents the strength of intermolecular interactions, while the horizontal axis (sign(λ2)ρ(r)) distinguishes between attractive and repulsive interactions. In the filled isosurface plots, color-coded spindle markings within the molecular structures visually map interaction locations and strengths, corresponding to the scatter plot data. The further left the blue spikes in the scatter plot, the stronger the HB interaction. For the IRB-TOSA salt (Figure 21a), the two blue peaks (peak positions −0.037 and −0.033, respectively) on the scatter plot correspond to the N1(IRB)–H1···O2(TOSA) and N6(IRB)–H6···O3(TOSA) HBs in order from left to right. Compared to the N1(IRB)–H1···O4(BSA) and N6(IRB)–H6···O2(BSA) (corresponding to blue peak positions of −0.039 and −0.036, respectively) HBs in IRB-BSA (Figure 21b), the HB intensity of the IRB-TOSA salt was smaller, which supported the analytical results of AIM. For the seven salts, except for the IRB-CPSA salt (Figure 21g), the N1(IRB)–H1···O(coformer) HB is always stronger than the N6(IRB)–H6···O(coformer) HB, which is represented in the figure as a more leftward position of the spike. The presence of a large number of green regions in all seven IRB salts indicates that there are also more van der Waals interactions between the molecules.

4. Conclusions

To enhance the dissolution properties of IRB through a salt formation strategy, 45 potential coformers were selected based on FIM analysis, leading to the successful synthesis of seven new IRB salts: six sulfonates and one carboxylate (IRB-TOSA salt, IRB-MAL salt, IRB-BSA salt, IRB-4-CBSA salt, IRB-2,5-CBSA salt, IRB-MSA salt, and IRB-CPSA salt). TGA, DSC, DVS, and accelerated stability experiments demonstrated that the IRB-TOSA salt, IRB-MAL salt, IRB-BSA salt, IRB-4-CBSA salt, IRB-2,5-CBSA salt, and IRB-CPSA salt were stable over a 3 month period at 40 °C and 75% RH. The dissolution and IDRs of the seven IRB salts were determined in phosphate buffer at 37 °C and pH 6.8. The IDR values of the IRB-TOSA, IRB-MAL, IRB-BSA, IRB-4-CBSA, and IRB-MSA salts are, in order, 0.7383, 0.6140, 0.6728, 0.5613, and 0.3194 mg/(cm2·min), all significantly higher than IRB. Their maximum dissolution concentrations are 0.781, 0.798, 1.175, 0.632, and 1.044 mg/mL, in that order, which are 42.0%, 45.1%, 113.6%, 14.9%, and 89.8% higher compared to IRB, respectively. The IRB-TOSA and IRB-4-CBSA salts also possess excellent hygrothermal stability. In addition, in situ Raman spectroscopy confirmed that two IRB salts exhibiting hovering and spring–parachute dissolution profiles undergo incongruent dissolution.
SCXRD analysis and NMR spectroscopy confirmed that the proton transfers from the sulfonic acid/carboxyl groups of the coformers to the N atom in the diazepine ring of IRB. NH-in–H···OH-out HBs exist in the supramolecular synthons of all six IRB sulfonate salts but are absent in IRB-MAL salts. The deprotonation of the binary carboxylic acid coformer MAL, i.e., COO (OH-out), improves the HBA capacity of another neutral carboxyl group (Onon-H-out) by the electron-donating inductive effect and electron-donating field effect, which may lead to the rotation of the MAL molecule and the formation of the NH-in–H···O non-H-out and Nnon-H-in–H···OH-out HBs. In particular, one oxygen atom of the coformer 2,5-CBSA sulfonic acid group is able to participate in the formation of both dual-HBD type and dual-HBA type bifurcated HBs, and the three oxygen atoms of the CPSA sulfonic acid group are able to form HBs simultaneously. Moreover, all three oxygen atoms in the sulfonic acid group of the coformers formed HBs with IRB, reducing the available HB formation with water. This structural feature likely explains the enhanced moisture resistance observed in the IRB-TOSA, IRB-4-CBSA, and IRB-2,5-CBSA salts compared to their respective coformers. Finally, AIM and IGMH calculations revealed that the HB strengths influence the melting points (or decomposition temperatures) of the IRB-CPSA salt, IRB-BSA salt, IRB-TOSA salt, and IRB-4-CBSA salt. These findings highlight the potential of the IRB salts in this article as promising candidates for further pharmaceutical applications.

Supplementary Materials

The following supporting information can be downloaded at https://www.mdpi.com/article/10.3390/cryst15040342/s1: Table S1: Manufacturer information for chemicals; Table S2: Coformers used for screening experiments and screening results; Table S3: HB parameters in IRB-TOSA salt; Table S4: HB parameters in IRB-MAL salt; Table S5: HB parameters in IRB-BSA salt; Table S6: HB parameters in IRB-4-CBSA salt; Table S7: HB parameters in IRB-2,5-CBSA salt; Table S8: HB parameters in IRB-MSA salt; Table S9: HB parameters in IRB-CPSA salt; Table S10: HBD and HBA sites in seven IRB salt supramolecular synthons; Table S11: Summary of torsion angles of IRB conformations in IRB salts; Table S12: pH values of IRB salts before and after dissolution experiments; Table S13: IDR values of IRB salts in pH 6.8 buffers; Table S14: HB and topological parameters for IRB salts in AIM analysis; Figure S1: PXRD patterns of IRB form A calculated from the single-crystal structure (CCDC No. 1999411), IRB raw material, form A prepared experimentally, IRB form B calculated from the single-crystal structure (CCDC No. 130127), and form B prepared experimentally; Figure S2: PXRD patterns of IRB, seven coformers, and their synthesized products; Figure S3: Comparison of experimental and calculated PXRD for IRB salts; Figure S4: PXRD patterns of IRB salts before and after suspension experiments in methanol; Figure S5: DSC and TGA curves of IRB, coformers, and IRB salts; Figure S6: Adsorption–desorption isotherms of three IRB salts and coformers at 25 °C; Figure S7: PXRD patterns of IRB salt crystals under accelerated stability tests (40 °C, 75% RH); Figure S8: First 30 min dissolution behavior profiles of IRB-2,5-CBSA salt and IRB-CPSA salt crystals in pH 6.8 buffer at 37 °C; Figure S9: PXRD patterns of residue solids for IRB salts after dissolution experiments in pH 6.8 buffer; Figure S10: Hirshfeld surfaces of (a) IRB-TOSA salt, (b) IRB-MAL salt, (c) IRB-BSA salt, (d) IRB-4-CBSA salt, (e) IRB-2,5-CBSA salt, (f) IRB-MSA salt, and (g) IRB-CPSA salt; Figure S11: Topological geometry of IRB salts. (a) IRB-TOSA salt, (b) IRB-BSA salt, (c) IRB-MAL salt, (d) IRB-4-CBSA salt, (e) IRB-2,5-CBSA salt, (f) IRB-MSA salt, and (g) IRB-CPSA salt.

Author Contributions

Data curation, J.W.; formal analysis, J.W. and C.W.; methodology, J.W.; software, J.W., M.Z. and L.H.; resources, D.J.; writing—original draft, J.W., C.W. and Y.B.; writing—review and editing, J.W., M.Z., Y.B. and W.C. All authors have read and agreed to the published version of the manuscript.

Funding

This research received no external funding.

Data Availability Statement

The CIF files were deposited at the Cambridge Crystallographic Data Centre (CCDC) with the following numbers: 2407374, 2407376, 2407377, 2407379, and 2407390–2407392. These data can be obtained free of charge via https://www.ccdc.cam.ac.uk/structures (accessed on 3 December 2024). The original contributions presented in the study are included in this manuscript and the Supplementary Materials; further inquiries can be directed to the corresponding authors.

Acknowledgments

We would like to express our special thanks to Beijing Hifelg Technology Co., Ltd., and engineer Yuanwang Tang, who provided guidance and assistance in the operation of the time-gated Raman spectrometer and in the collection of Raman data. Thanks to eceshi (www.eceshi.com) for the NMR analysis.

Conflicts of Interest

Author Dingding Jing was employed by the company Asymchem Life Science (Tianjin) Co., Ltd. The remaining authors declare that the research was conducted in the absence of any commercial or financial relationships that could be construed as a potential conflict of interest.

References

  1. Peng, B.; Wang, J. Advances in drug-drug complexes based on the crystal engineering design. Yao Xue Xue Bao 2020, 55, 2358–2367. [Google Scholar]
  2. Shi, Q.; Chen, H.B.; Wang, Y.A.; Xu, J.; Liu, Z.Y.; Zhang, C. Recent advances in drug polymorphs: Aspects of pharmaceutical properties and selective crystallization. Int. J. Pharm. 2022, 45, 121320. [Google Scholar] [CrossRef]
  3. Zhang, Y.; Liu, H.; Chen, Z.; Meng, J.; Li, Y.; Qi, L.; Zhang, S.; Chen, X.; Lei, M. A drug-drug cocrystal and a co-amorphous form, prepared from honokiol and ligustrazine, inspired by Chinese patent medicine. Acta Crystallogr. Sect. B 2023, 79, 519–524. [Google Scholar] [CrossRef] [PubMed]
  4. Hao, S.; Li, J.; Mu, C.; Liu, D.; Yang, Y.; Li, Y.; Liu, T.; Wang, X.; Liu, F. Hepatoprotective Pyrazinamide–Baicalein Cocrystal with a Rare Ratio of 7:3. Cryst. Growth Des. 2023, 23, 885–891. [Google Scholar] [CrossRef]
  5. Wathoni, N.; Sari, W.A.; Elamin, K.M.; Mohammed, A.F.A.; Suharyani, I. A Review of Coformer Utilization in Multicomponent Crystal Formation. Molecules 2022, 27, 8693. [Google Scholar] [CrossRef]
  6. Bolla, G.; Sarma, B.; Nangia, A.K. Crystal Engineering of Pharmaceutical Cocrystals in the Discovery and Development of Improved Drugs. Chem. Rev. 2022, 122, 11514–11603. [Google Scholar] [CrossRef]
  7. Jiang, L.; Hu, X.; Cai, L. A Drug–Drug Multicomponent Crystal of Metformin and Dobesilate: Crystal Structure Analysis and Hygroscopicity Property. Molecules 2022, 27, 3472. [Google Scholar] [CrossRef]
  8. Li, M.; Sun, J.; Kuang, W.; Zhou, L.; Han, D.; Gong, J. Drug–Drug Multicomponent Crystals of Epalrestat: A Novel Form of the Drug Combination and Improved Solubility and Photostability of Epalrestat. Cryst. Growth Des. 2022, 22, 5027–5035. [Google Scholar] [CrossRef]
  9. Zhao, C.; Su, X.; Fang, L.; Shang, Z.; Li, Z.; Gong, J.; Wu, S. Multivariate Analysis of a Highly Effective Drug Combination Tablet Containing the Antiepileptic Drug Gabapentin to Enhance Pharmaceutical Properties with a Multicomponent Crystal Strategy. Cryst. Growth Des. 2022, 22, 7234–7247. [Google Scholar] [CrossRef]
  10. Fang, Z.; Zhang, B.; Xing, W.; Yu, H.; Xing, C.; Gong, N.; Lu, Y.; Du, G. An Evolving Role of Aqueous Piperazine to Improve the Solubility of Non-Steroidal Anti-Inflammatory Drugs. J. Pharm. Sci. 2022, 111, 2839–2847. [Google Scholar] [CrossRef]
  11. Hamideh, A.; Rahman, Z.; Dharani, S.; Khuroo, T.; Mohamed, E.M.; Nutan, M.T.H.; Reddy, I.K.; Khan, M.A. Preparation and characterization of dicarboxylic acids salt of aripiprazole with enhanced physicochemical properties. Pharm. Dev. Technol. 2021, 26, 455–463. [Google Scholar] [CrossRef] [PubMed]
  12. Ge, Y.; Yuan, Z.; Zhang, M.; Ming, Y.; Huang, X.; Wang, C.; Sun, C.C. Direct compression tablet formulation of trimetazidine through systematic screening of oxalate salts. Int. J. Pharm. 2025, 48, 125255. [Google Scholar] [CrossRef]
  13. Niu, Y.; Wang, L.; Yu, Y.; Li, Y.; Wu, Z.; Yan, C. Molecular adduct of amantadine ferulate presents a pathway for slowing in vitro/vivo releases and raising synergistic antiviral effects via dual optimization salification strategy. Crystengcomm 2021, 23, 4389–4401. [Google Scholar] [CrossRef]
  14. Ainurofiq, A.; Putro, D.S.; Ramadhani, D.A.; Putra, G.; Do Espirito Santo, L. A review on solubility enhancement methods for poorly water-soluble drugs. J. Rep. Pharm. Sci. 2021, 10, 137–147. [Google Scholar] [CrossRef]
  15. Desiraju, G.R. Crystal Engineering: The Design of Organic Solids; Elsevier: Amsterdam, The Netherlands, 1989; Volume 54. [Google Scholar]
  16. Wu, C.; Xiao, Y.; Jing, Y.; Yin, Q.; Bao, Y. New Insights into the Solubilization of Multicomponent Crystals: A Case Study of Pipemidic Acid. Cryst. Growth Des. 2023, 23, 3367–3383. [Google Scholar] [CrossRef]
  17. Yang, H.; Zhang, M.; Zhang, L.; Yu, F.; Hou, X.; Pan, Z.; Xie, C.; Gong, J.; Zhang, C.; Chen, W. Multicomponent Crystal Screening and Performance Testing of Sunitinib: A Combined Virtual and Experimental Study. Cryst. Growth Des. 2024, 24, 8112–8134. [Google Scholar] [CrossRef]
  18. Zhang, L.; Wu, D.; Zhang, M.; Yu, F.; Bao, Y.; Xie, C.; Hou, B.; Jing, D.; Zhang, C.; Chen, W. Theoretical and experimental study of pharmaceutical salts: A case of trimethoprim. Crystengcomm 2024, 26, 3808–3822. [Google Scholar] [CrossRef]
  19. Zhang, M.; Hou, X.; Yu, F.; Zhang, L.; Hou, B.; Zhou, L.; Xie, C.; Wu, S.; Chen, W. Synthesis, Characterization, and Analysis of Probenecid and Pyridine Compound Salts. Crystals 2024, 14, 670. [Google Scholar] [CrossRef]
  20. Cho, C.; Kang, P.; Jang, C.; Lee, S.; Lee, Y.J.; Choi, C. Physiologically based pharmacokinetic (PBPK) modeling to predict the pharmacokinetics of irbesartan in different CYP2C9 genotypes. Arch. Pharm. Res. 2023, 46, 939–953. [Google Scholar] [CrossRef]
  21. Araya-Sibaja, A.M.; de Campos, C.E.M.; Fandaruff, C.; Vega-Baudrit, J.R.; Guillén-Girón, T.; Navarro-Hoyos, M.; Cuffini, S.L. Irbesartan desmotropes: Solid-state characterization, thermodynamic study and dissolution properties. J. Pharm. Anal. 2019, 9, 339–346. [Google Scholar] [CrossRef]
  22. Ochsenbein, P.; Bonin, M.; Fadaei-Tirani, F.; Lemée, M.-H.; Kieffer, J.; Görl, D.; El-Hajji, M.; SchenkJoß, K. A score and nine years of irbesartan. Crystengcomm 2024, 26, 4566–4578. [Google Scholar] [CrossRef]
  23. Bocskei, Z.; Simon, K.; Rao, R.; Caron, A.; Rodger, C.A.; Bauer, M. Irbesartan crystal form B. Acta Crystallogr. Sect. C-Cryst. Struct. Commun. 1998, 54, 808–810. [Google Scholar] [CrossRef]
  24. Gao, Y.; Tian, J. Solubility of Irbesartan Form B in an Aqueous Ethanol Mixture. J. Chem. Eng. Data 2008, 53, 535–537. [Google Scholar] [CrossRef]
  25. Jansook, P.; Hnin, H.M.; Praphanwittaya, P.; Loftsson, T.; Stefansson, E. Effect of salt formation on γ-cyclodextrin solubilization of irbesartan and candesartan and the chemical stability of their ternary complexes. J. Drug Deliv. Sci. Technol. 2022, 67, 102980. [Google Scholar] [CrossRef]
  26. Wang, X.J.; Gao, D.; Li, D.X.; Xie, Q.H.; Deng, Z.W.; Zhang, H.L. Collecting the Molecular and Ionization States of Irbesartan in the Solid State. Cryst. Growth Des. 2020, 20, 5664–5669. [Google Scholar] [CrossRef]
  27. Delaney, S.P.; Pan, D.H.; Galella, M.; Yin, S.X.; Korter, T.M. Understanding the Origins of Conformational Disorder in the Crystalline Polymorphs of Irbesartan. Cryst. Growth Des. 2012, 12, 5017–5024. [Google Scholar] [CrossRef]
  28. Bartolucci, G.; Bruni, B.; Di Vaira, M.; Giannellini, V. 2-Butyl-4-oxo-3-{[2’-(1H-tetrazol-5-yl)biphenyl-4-yl]methyl}-3-aza-1-azoniaspiro[4.4]non-1-ene chloride 1.69-hydrate (irbesartan hydrochloride 1.69-hydrate). Acta Crystallogr. Sect. E-Crystallogr. Commun. 2007, 63, O1529–O1531. [Google Scholar] [CrossRef]
  29. Wang, L.; Zhou, L.; Bao, Y.; Wang, J. 2-n-Butyl-3-[2’-(1H-tetrazol-5-yl) biphenyl-4-ylmethyl]-1-azonia-3-azaspiro[4.4]non-1-en-4-one bromide sesquihydrate. Acta Crystallogr. Sect. Sect. E Struct. Rep. Online 2007, 63, o4933. [Google Scholar] [CrossRef]
  30. Araya-Sibaja, A.M.; Fandaru, C.; Guevara-Camargo, A.M.; Vargas-Huertas, F.; Zamora, W.J.; Vega-Baudrit, J.R.; Guillen-Girón, T.; Navarro-Hoyos, M.; Paoli, P.; Rossi, P.; et al. Crystal Forms of the Antihypertensive Drug Irbesartan: A Crystallographic, Spectroscopic, and Hirshfeld Surface Analysis Investigation. Acs Omega 2022, 7, 14897–14909. [Google Scholar] [CrossRef]
  31. Nair, A.S.; Harini, R.; Melissa, P.; Shah, K.; Nayak, U.Y.; Mahalaxmi, R.; Vamshi, K.T. Development and characterization of Irbesartan Co-Crystals. Res. J. Pharm. Technol. 2018, 11, 3932–3936. [Google Scholar] [CrossRef]
  32. Garg, A.; Yadav, S. Rapid Release Pharmaceutical Composition of Irbesartan Prepared by Co-Crystallization Method. IN202211051199, 2022–09–23.
  33. Maddileti, D.; Swapna, B.; Nangia, A. High Solubility Crystalline Pharmaceutical Forms of Blonanserin. Cryst. Growth Des. 2014, 14, 2557–2570. [Google Scholar] [CrossRef]
  34. Committee, N.P. Pharmacopoeia of the People’s Republic of China; China Medical Science and Technology Press: Beijing, China, 2020. [Google Scholar]
  35. Dokoumetzidis, A.; Papadopoulou, V.; Macheras, P. Analysis of Dissolution Data Using Modified Versions of Noyes–Whitney Equation and the Weibull Function. Pharm. Res. 2006, 23, 256–261. [Google Scholar] [PubMed]
  36. Kögler, M.; Heilala, B. Time-gated Raman spectroscopy—A review. Meas. Sci. Technol. 2021, 32, 012002. [Google Scholar] [CrossRef]
  37. Araya-Sibaja, A.M.; Urgellés, M.; Vásquez-Castro, F.; Vargas-Huertas, F.; Vega-Baudrit, J.R.; Guillén-Girón, T.; Navarro-Hoyos, M.; Cuffini, S.L. The effect of solution environment and the electrostatic factor on the crystallisation of desmotropes of irbesartan. RSC Adv. 2019, 9, 5244–5250. [Google Scholar] [CrossRef] [PubMed]
  38. Sheldrick, G. A short history of SHELX. Acta Crystallogr. Sect. A 2008, 64, 112–122. [Google Scholar] [CrossRef] [PubMed]
  39. Corpinot, M.K.; Bučar, D.-K. A Practical Guide to the Design of Molecular Crystals. Cryst. Growth Des. 2019, 19, 1426–1453. [Google Scholar] [CrossRef]
  40. Nauha, E.; Bernstein, J. “Predicting” Polymorphs of Pharmaceuticals Using Hydrogen Bond Propensities: Probenecid and Its Two Single-Crystal-to-Single-Crystal Phase Transitions. J. Pharm. Sci. 2015, 104, 2056–2061. [Google Scholar] [CrossRef]
  41. Issa, M.; Ferraz, H. Intrinsic Dissolution as a Tool for Evaluating Drug Solubility in Accordance with the Biopharmaceutics Classification System. Dissolut. Technol. 2011, 18, 6–13. [Google Scholar] [CrossRef]
  42. Zhang, X.; Zhou, L.; Wang, C.; Li, Y.; Wu, Y.; Zhang, M.; Yin, Q. Insight into the Role of Hydrogen Bonding in the Molecular Self-Assembly Process of Sulfamethazine Solvates. Cryst. Growth Des. 2017, 17, 6151–6157. [Google Scholar] [CrossRef]
  43. Zhang, J.; Lu, T. Efficient evaluation of electrostatic potential with computerized optimized code. Phys. Chem. Chem. Phys. 2021, 23, 20323–20328. [Google Scholar] [CrossRef]
  44. Lu, T.; Chen, F.W. Multiwfn: A multifunctional wavefunction analyzer. J. Comput. Chem. 2012, 33, 580–592. [Google Scholar] [CrossRef] [PubMed]
  45. Humphrey, W.; Dalke, A.; Schulten, K. VMD: Visual molecular dynamics. J. Mol. Graph. 1996, 14, 33–38. [Google Scholar] [CrossRef]
  46. Emamian, S.; Lu, T.; Kruse, H.; Emamian, H. Exploring Nature and Predicting Strength of Hydrogen Bonds: A Correlation Analysis Between Atoms-in-Molecules Descriptors, Binding Energies, and Energy Components of Symmetry-Adapted Perturbation Theory. J. Comput. Chem. 2019, 40, 2868–2881. [Google Scholar] [CrossRef] [PubMed]
  47. Lu, T.; Chen, Q.X. Independent gradient model based on Hirshfeld partition: A new method for visual study of interactions in chemical systems. J. Comput. Chem. 2022, 43, 539–555. [Google Scholar] [CrossRef]
  48. Sajjad, M.A.; Macgregor, S.A.; Weller, A.S. A comparison of non-covalent interactions in the crystal structures of two σ-alkane complexes of Rh exhibiting contrasting stabilities in the solid state. Faraday Discuss. 2023, 244, 222–240. [Google Scholar] [CrossRef] [PubMed]
  49. Bader, R.F.W.; Carroll, M.T.; Cheeseman, J.R.; Chang, C. Properties of atoms in molecules: Atomic volumes. J. Am. Chem. Soc. 1987, 109, 7968–7979. [Google Scholar] [CrossRef]
  50. Yang, D.; Cao, J.; Jiao, L.; Yang, S.; Zhang, L.; Lu, Y.; Du, G. Solubility and Stability Advantages of a New Cocrystal of Berberine Chloride with Fumaric Acid. ACS Omega 2020, 5, 8283–8292. [Google Scholar] [CrossRef]
  51. Koch, U.; Popelier, P.L.A. Characterization of C-H-O hydrogen bonds on the basis of the charge density. J. Phys. Chem. 1995, 99, 9747–9754. [Google Scholar] [CrossRef]
  52. Haneef, J.; Markad, D.; Chadha, R. Interaction Map Driven Cocrystallization of Ambrisentan: Structural and Biopharmaceutical Evaluation. Cryst. Growth Des. 2020, 20, 4612–4620. [Google Scholar] [CrossRef]
  53. Cruz-Cabeza, A.J. Acid–base crystalline complexes and the pKa rule. Crystengcomm 2012, 14, 6362–6365. [Google Scholar] [CrossRef]
  54. Zhao, Y.; Sun, B.; Jia, L.; Wang, Y.; Wang, M.; Yang, H.; Qiao, Y.; Gong, J.; Tang, W. Tuning Physicochemical Properties of Antipsychotic Drug Aripiprazole with Multicomponent Crystal Strategy Based on Structure and Property Relationship. Cryst. Growth Des. 2020, 20, 3747–3761. [Google Scholar] [CrossRef]
  55. Huang, Q.; He, J.; Zhong, N.; Zheng, G. Determination of azide ion in irbesartan by column—Switching ion chromatography. Chin. J. Pharm. Anal. 2013, 33, 1431–1434. [Google Scholar]
  56. Ren, S.; Liu, M.; Hong, C.; Li, G.; Sun, J.; Wang, J.; Zhang, L.; Xie, Y. The effects of pH, surfactant, ion concentration, coformer, and molecular arrangement on the solubility behavior of myricetin cocrystals. Acta Pharm. Sin. B 2019, 9, 59–73. [Google Scholar] [CrossRef] [PubMed]
  57. Bavishi, D.D.; Borkhataria, C.H. Spring and parachute: How cocrystals enhance solubility. Prog. Cryst. Growth Charact. Mater. 2016, 62, 1–8. [Google Scholar] [CrossRef]
  58. Li, C.; Wu, D.; Li, J.; Ji, X.; Qi, L.; Sun, Q.; Wang, A.; Xie, C.; Gong, J.; Chen, W. Multicomponent crystals of clotrimazole: A combined theoretical and experimental study. Crystengcomm 2021, 23, 6977–6993. [Google Scholar] [CrossRef]
  59. Wei, Y.; Zhang, L.; Wang, N.; Shen, P.; Dou, H.; Ma, K.; Gao, Y.; Zhang, J.; Qian, S. Mechanistic Study on Complexation-Induced Spring and Hover Dissolution Behavior of Ibuprofen-Nicotinamide Cocrystal. Cryst. Growth Des. 2018, 18, 7343–7355. [Google Scholar] [CrossRef]
  60. Deng, X.; Shi, W.; Qian, K.; Yang, J.; Yuan, S.; Li, H. Torsemide Crystalline Salts with a Significant Spring-Parachute Effect. AAPS PharmSciTech 2024, 25, 210–220. [Google Scholar] [CrossRef]
  61. Zhang, S.; Rasmuson, Å.C. Thermodynamics and Crystallization of the Theophylline–Glutaric Acid Cocrystal. Cryst. Growth Des. 2013, 13, 1153–1161. [Google Scholar] [CrossRef]
  62. Huang, M.; Shang, Z.; Zou, J.; Yang, D.; Yu, Q. Studies on the Tautomerism of Benzoylcyclohexane-1,3-dione and Its Derivatives by Ab Initio Calculation. J. Struct. Chem. 2002, 21, 678–682. [Google Scholar]
  63. Hu, W.; Gou, R.; Zhang, S.; Liu, Y.; Shang, F.; Chen, Y.; Bai, H. Theoretical investigation on the intermolecular interactions between 3-nitro-1,2,4-triazol-5-one and 2,6-diamino-3,5-dinitropyrazine-1-oxide using DFT methods. Chem. Pap. 2022, 76, 2747–2758. [Google Scholar] [CrossRef]
Figure 1. Two proton tautomer forms of IRB.
Crystals 15 00342 g001
Figure 2. Chemical structures of IRB and seven coformers.
Crystals 15 00342 g002
Figure 3. (a) FIM of IRB. (b) Potential sites in IRB for the formation of intermolecular HBs.
Crystals 15 00342 g003
Figure 4. Crystal structure of IRB-TOSA in (a) asymmetric unit; (b) 1D chain structure (green represents the asymmetric unit); (c) 2D planar structure view (purple represents 1D chains); (d) 3D stacked view.
Crystals 15 00342 g004
Figure 5. Crystal structure of IRB-MAL. (a) Asymmetric unit; (b) 1D chain structure (purple represents 1D chains); (c) 2D planar structure (purple represents 1D chains); (d) 3D stacked view.
Crystals 15 00342 g005
Figure 6. Crystal structure of IRB-BSA. (a) Ring structure (pink for asymmetric units, blue and orange shading for ring structures); (b) 1D chain structure (blue and orange shading for ring structures); (c) 2D planar structure view (blue and orange shading for ring structures); (d) 3D stacked view.
Crystals 15 00342 g006
Figure 7. Crystal structure of IRB-4-CBSA (green shading represents 1D chains, purple shading represents 2D planes). (a) Ring structure; (b) 1D chain structure; (c) 2D planar structure view; (d) 3D stacked view.
Crystals 15 00342 g007
Figure 8. Crystal structure of IRB-2,5-CBSA (light red shading represents 1D chains, light green shading represents 2D planes). (a) Asymmetric unit; (b) 1D chain structure; (c) 2D planar structure view; (d) 3D stacked view.
Crystals 15 00342 g008
Figure 9. Crystal structure of IRB-MSA (blue shading for ring structures). (a) Asymmetric unit; (b) 1D chain structure; (c) 2D planar structure view; (d) 3D stacked view.
Crystals 15 00342 g009
Figure 10. Crystal structure of IRB-CPSA (pink shading represents 1D chains, green shading represents 2D planes). (a) Asymmetric unit; (b) 1D chain structure; (c) 2D planar structure view; (d) 3D stacked view.
Crystals 15 00342 g010
Figure 11. Supramolecular synthons in IRB salts (Orange shading represents bifurcated HBs): (a) IRB-TOSA salt, IRB-BSA salt, IRB-4-CBSA salt, and IRB-MSA salt, (b) IRB-MAL salt, (c) IRB-2,5-CBSA salt, and (d) IRB-CPSA salt.
Crystals 15 00342 g011
Figure 12. 13C NMR of IRB in IRB and IRB salts. (a) IRB; (b) IRB-MAL; (c) IRB-2,5-CBSA.
Crystals 15 00342 g012
Figure 13. (a) Three torsion angles affecting IRB molecular conformation. (b,c) Overlay diagrams of IRB conformations found in IRB and IRB salt crystals (the two conformations of the IRB cation in IRB-TOSA, IRB-4-CBSA, IRB-MSA, and IRB-CPSA are recoded as IRB-coformer-a and IRB-coformer-b, respectively).
Crystals 15 00342 g013
Figure 14. Optical microscope images of (a) IRB form A, (b) IRB-TOSA salt, (c) IRB-MAL salt, (d) IRB-BSA salt, (e) IRB-4-CBSA salt, (f) IRB-2,5-CBSA salt, (g) IRB-MSA salt, and (h) IRB-CPSA salt.
Crystals 15 00342 g014
Figure 15. Dissolution profiles for IRB salts in pH 6.8 buffer.
Crystals 15 00342 g015
Figure 16. First 30 min dissolution behavior profiles of the IRB-TOSA salt, IRB-MAL salt, IRB-BSA salt, IRB-4-CBSA salt, and IRB-MSA salt in pH 6.8 buffer at 37 °C.
Crystals 15 00342 g016
Figure 17. Raman spectra of (a) IRB form B, the IRB-TOSA salt, and suspension process; (b) localized magnification at 2 min and 20 min of suspension.
Crystals 15 00342 g017
Figure 18. Optical microscope images of (a) IRB form B; (b) the IRB-TOSA salt after 20 min suspension in the buffer; (c) IRB-2,5-CBSA salt after 20 min suspension in the buffer.
Crystals 15 00342 g018
Figure 19. Raman spectra of (a) IRB form B, the IRB-2,5-CBSA salt, and suspension process; (b) localized magnification at 2 min and 20 min of suspension.
Crystals 15 00342 g019
Figure 20. MEPS mapped for (a) IRB and the coformers of (b) TOSA, (c) MAL, (d) BSA, (e) 4-CBSA, (f) 2,5-CBSA, (g) MSA, and (h) CPSA. The extrema of the positive and negative potentials are marked by orange and blue spheres, respectively.
Crystals 15 00342 g020
Figure 21. IGMH scatter plots and filled isosurfaces of IRB salts. (a) IRB-TOSA salt, (b) IRB-MAL salt, (c) IRB-BSA salt, (d) IRB-4-CBSA salt, (e) IRB-2,5-CBSA salt, (f) IRB-MSA salt, and (g) IRB-CPSA salt.
Crystals 15 00342 g021
Table 1. ΔpKa values of IRB and seven coformers.
CompoundspKaΔpKa
IRB4.16
TOSA−0.434.59
MAL1.832.33
BSA0.73.46
4-CBSA−0.834.99
2,5-CBSA−1.475.63
MSA−2.66.76
CPSA1.172.99
Table 2. The crystallographic parameters of IRB salt crystals.
CompoundIRB-TOSA SaltIRB-MAL SaltIRB-BSA Salt
Empirical formulaC25H29N6O+·C7H7O3SC25H29N6O+·C4H3O4C25H29N6O+·C6H5O3S
Formula weight600.73544.60586.70
Temperature/K113.15113.15113.15
Crystal systemtriclinicorthorhombicmonoclinic
Space group P 1 - P212121P21/n
a12.2685(3)9.27177(13)11.66260(10)
b15.9260(4)15.2804(2)16.1566(2)
c17.0796(3)19.6104(3)16.1328(2)
α87.798(2)9090
β71.313(2)90102.2080(10)
γ87.406(2)9090
Volume/Å33156.98(13)2778.34(7)2971.13(6)
Z, Z′4, 24, 14, 1
ρcalc (g/cm3)1.2641.3021.312
F(000)1272.01152.01240.0
Reflections collected51,03625,07649,384
Goodness-of-fit on F21.0451.0471.035
I >= 2σ (I)0.06280.05090.0421
wR2 indexes0.17490.10400.1088
CCDC No.240737424073772407376
CompoundIRB-4-CBSA saltIRB-2,5-CBSA saltIRB-MSA saltIRB-CPSA salt
Empirical formulaC25H29N6O+·C6H4ClO3SC25H29N6O+·C6H3Cl2O3SC25H29N6O+·CH3O3SC25H29N6O+·C10H15O4S
Formula weight621.14655.58524.63660.82
Temperature/K138.15138.15138.15295.15
Crystal systemmonoclinicmonoclinicmonoclinicmonoclinic
Space groupP21/cP21/nP21/cP21
a18.09020(10)8.98593(3)16.58400(10)11.79510(16)
b15.88270(10)16.63335(5)16.50230(1012.56572(19)
c22.84110(10)21.06129(6)19.74280(10)23.1805(3)
α90909090
β108.8710(10)93.1611(3)90.3500(10)90.5282(12)
γ90909090
Volume/Å36209.98(7)3143.162(15)5402.99(5)3435.52(9)
Z, Z′ *8, 24, 18, 24, 2
ρcalc (g/cm3)1.3291.3851.2901.278
F(000)2608.01368.02224.01408.0
Reflections collected62,49859,37798,67428,594
Goodness-of-fit on F21.0481.0531.1041.036
I >= 2σ (I)0.04850.03120.05740.0538
wR2 indexes0.12700.07930.16710.1353
CCDC No.2407379240739024073912407392
* Z refers to the number of molecules represented by the empirical molecular formula contained in a crystal cell, and Z′ refers to the number of molecules represented by the empirical molecular formula contained in an asymmetric unit.
Table 3. Types of HBs in six IRB sulfonate supramolecular synthons.
HB TypeHBA
(Sulfonic Acid Group)
HBD
(IRB)
IRB Salts
single HBone oxygentetrazolium ring N1–HIRB-TOSA, IRB-BSA, IRB-4-CBSA, IRB-MSA,
single HBone oxygendiazepine ring N6–HIRB-TOSA, IRB-BSA, IRB-4-CBSA, IRB-MSA, IRB-2,5-CBSA, IRB-CPSA
dual-HBD bifurcated HBone oxygentetrazolium ring N1–H
diazepine ring N6–H
IRB-2,5-CBSA
dual-HBA bifurcated HBtwo oxygenstetrazolium ring N1–HIRB-2,5-CBSA, IRB-CPSA
Table 4. Chemical shifts of H atoms in 1H NMR of IRB in IRB and IRB salts.
PositionChemical Shift/(ppm)
IRBIRB-TOSAIRB-BSAIRB-4-CBSAIRB-MSAIRB-CPSA
37.67 (m)7.70 (m)7.68 (m)7.67 (m)7.69 (m)7.68 (m)
47.55 (m)7.58 (m)7.55 (m)7.55 (m)7.57 (m)7.57 (m)
57.55 (m)7.58 (m)7.55 (m)7.55 (m)7.57 (m)7.57 (m)
67.67 (m)7.70 (m)7.68 (m)7.67 (m)7.69 (m)7.68 (m)
97.14 (m)7.26 (m)7.26
(d, J = 7.9 Hz)
7.26
(d, J = 7.9 Hz)
7.28
(d, J = 7.9 Hz)
7.29
(d, J = 7.8 Hz)
107.14 (m)7.19
(d, J = 8.0 Hz)
7.16
(d, J = 7.9 Hz)
7.15
(d, J = 7.9 Hz)
7.17
(d, J = 8.0 Hz)
7.18
(d, J = 7.8 Hz)
127.14 (m)7.19
(d, J = 8.0 Hz)
7.16
(d, J = 7.9 Hz)
7.15
(d, J = 7.9 Hz)
7.17
(d, J = 8.0 Hz)
7.18
(d, J = 7.8 Hz)
137.14 (m)7.26 (m)7.26
(d, J = 7.9 Hz)
7.26
(d, J = 7.9 Hz)
7.28
(d, J = 7.9 Hz)
7.29
(d, J = 7.8 Hz)
144.76 (s)4.90 (s)4.79 (s)4.79 (s)4.96 (s)4.94 (s)
172.40 (m)2.87
(t, J = 7.9 Hz)
2.86
(t, J = 7.9 Hz)
2.87
(t, J = 7.8 Hz)
2.90
(t, J = 7.8 Hz)
2.92
(t, J = 7.9 Hz)
181.51 (m)1.61 (m)1.59 (m)1.57 (m)1.61 (m)1.62 (m)
191.33 (m)1.41 (m)1.36 (m)1.37 (m)1.42 (m)1.42 (m)
200.87
(t, J = 7.3 Hz)
0.92
(t, J = 7.3 Hz)
0.89
(t, J = 7.4 Hz)
0.89
(t, J = 7.3 Hz)
0.93
(t, J = 7.3 Hz)
0.92
(t, J = 7.3 Hz)
221.82 (m),
1.96 (m)
2.01 (m),
2.18 (m)
1.99 (m),
2.16 (m)
1.99 (m),
2.16 (m)
2.01 (m),
2.19 (m)
2.03 (m),
2.20 (m)
231.96 (m)2.01 (m)1.99 (m)1.99 (m)2.01 (m)2.03 (m)
241.96 (m)2.01 (m)1.99 (m)1.99 (m)2.01 (m)2.03 (m)
251.82 (m),
1.96 (m)
2.01 (m),
2.18 (m)
1.99 (m),
2.16 (m)
1.99 (m),
2.16 (m)
2.01 (m),
2.19 (m)
2.03 (m),
2.20 (m)
Table 5. The S–O/C–O bond lengths of IRB carboxylate/sulfonate.
CompoundDS–O/DC–O (Å)ΔDS–ODC–O (Å)Proton Transfer
IRB-TOSA salt1.457, 1.446, 1.4580.011, 0.001, 0.012yes
IRB-MAL salt1.272, 1.241 0.031yes
IRB-BSA salt1.448, 1.453, 1.4440.005, 0.004, 0.009yes
IRB-4-CBSA salt1.447, 1.435, 1.4230.012, 0.024, 0.012yes
IRB-2,5-CBSA salt1.439, 1.460, 1.4580.021, 0.019, 0.002yes
IRB-MSA salt1.403, 1.437, 1.4620.034, 0.059, 0.025yes
IRB-CPSA salt1.431, 1.451, 1.4630.020, 0.032, 0.012yes
Table 6. The C–O bond length of the neutral carboxyl group in MAL and the IRB-MAL salt.
CompoundDC–O,COOH (Å)ΔDC–O,COOH (Å)
IRB-MAL salt1.240, 1.280 0.040
MAL 1.202, 1.2940.092
1.226, 1.3060.080
Table 7. Percentage increase in mass of three IRB salts and coformers during adsorption–desorption at 25 °C, RH = 40, 95%.
RH (%)Increase in Mass (%)
IRB-TOSAIRB-4-CBSAIRB-2,5-CBSATOSA4-CBSA2,5-CBSA
400.040.110.049.1134.8724.00
950.160.320.10182.42172.51145.11
Table 8. Summary of the various contact contributions to the Hirshfeld surfaces in the IRB salts.
CompoundH···H
(%)
O···H
(%)
N···H
(%)
C···H
(%)
Cl···H
(%)
C···N
(%)
C···O
(%)
Others
(%)
IRB-TOSA salt56.114.311.413.202.00.92.0
IRB-MAL salt51.916.312.711.802.92.51.9
IRB-BSA salt52.515.912.414.502.20.62.0
IRB-4-CBSA salt50.213.513.814.83.01.60.33.0
IRB-2,5-CBSA salt42.416.412.615.08.11.30.63.6
IRB-MSA salt56.314.015.010.601.31.71.1
IRB-CPSA salt55.918.413.310.7001.10.7
Disclaimer/Publisher’s Note: The statements, opinions and data contained in all publications are solely those of the individual author(s) and contributor(s) and not of MDPI and/or the editor(s). MDPI and/or the editor(s) disclaim responsibility for any injury to people or property resulting from any ideas, methods, instructions or products referred to in the content.

