

Process Optimization Simulation of Residual Stress in Martensitic Steel Considering Phase Transformation


Abstract
1. Introduction
2. Calculation Method of Residual Stress Considering Martensitic Transformation
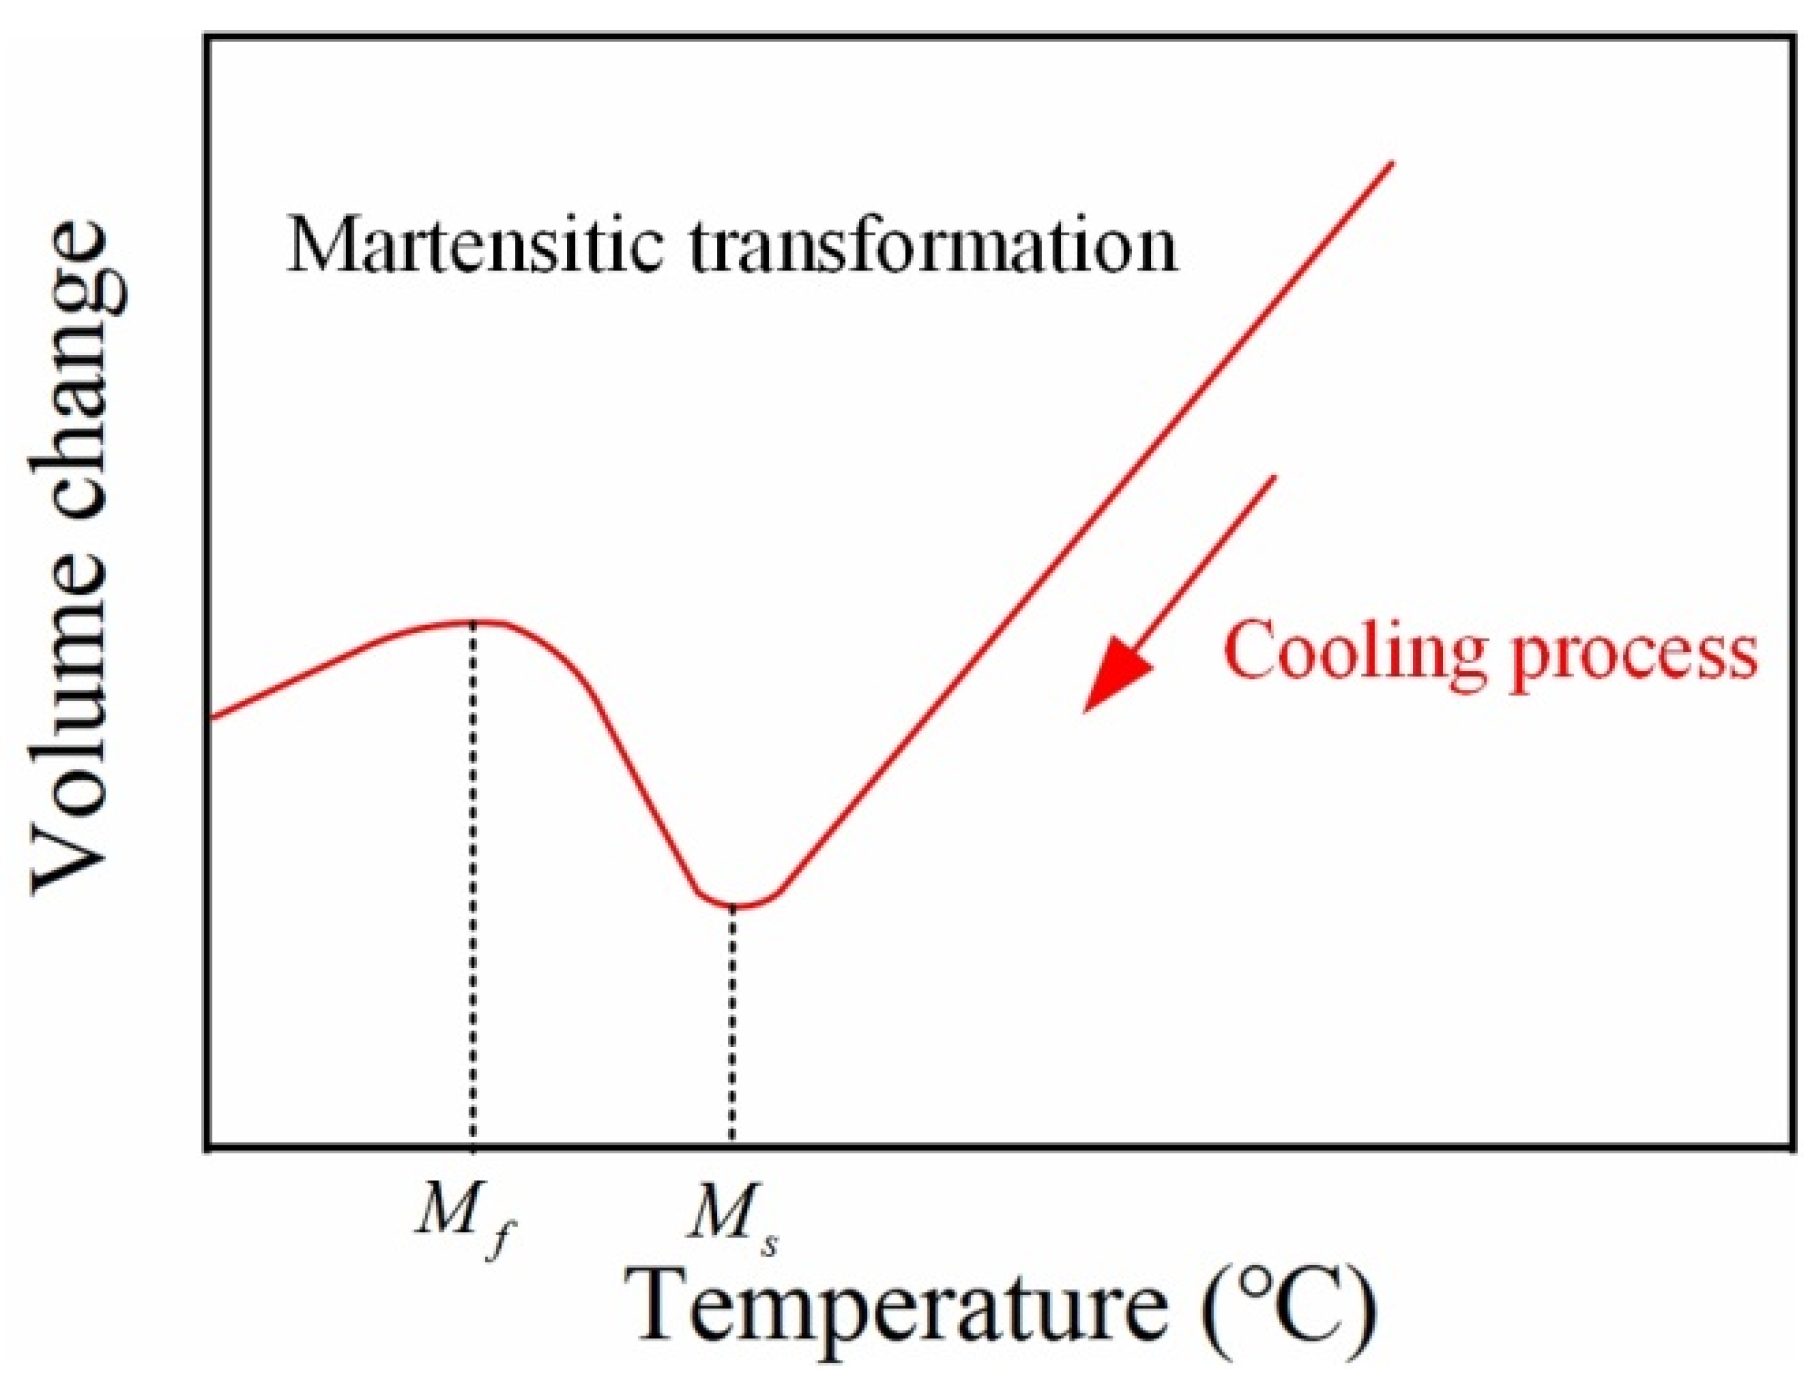
2.1. Microstructure Field Calculation
2.2. Temperature Field Calculation
2.3. Stress Field Calculation
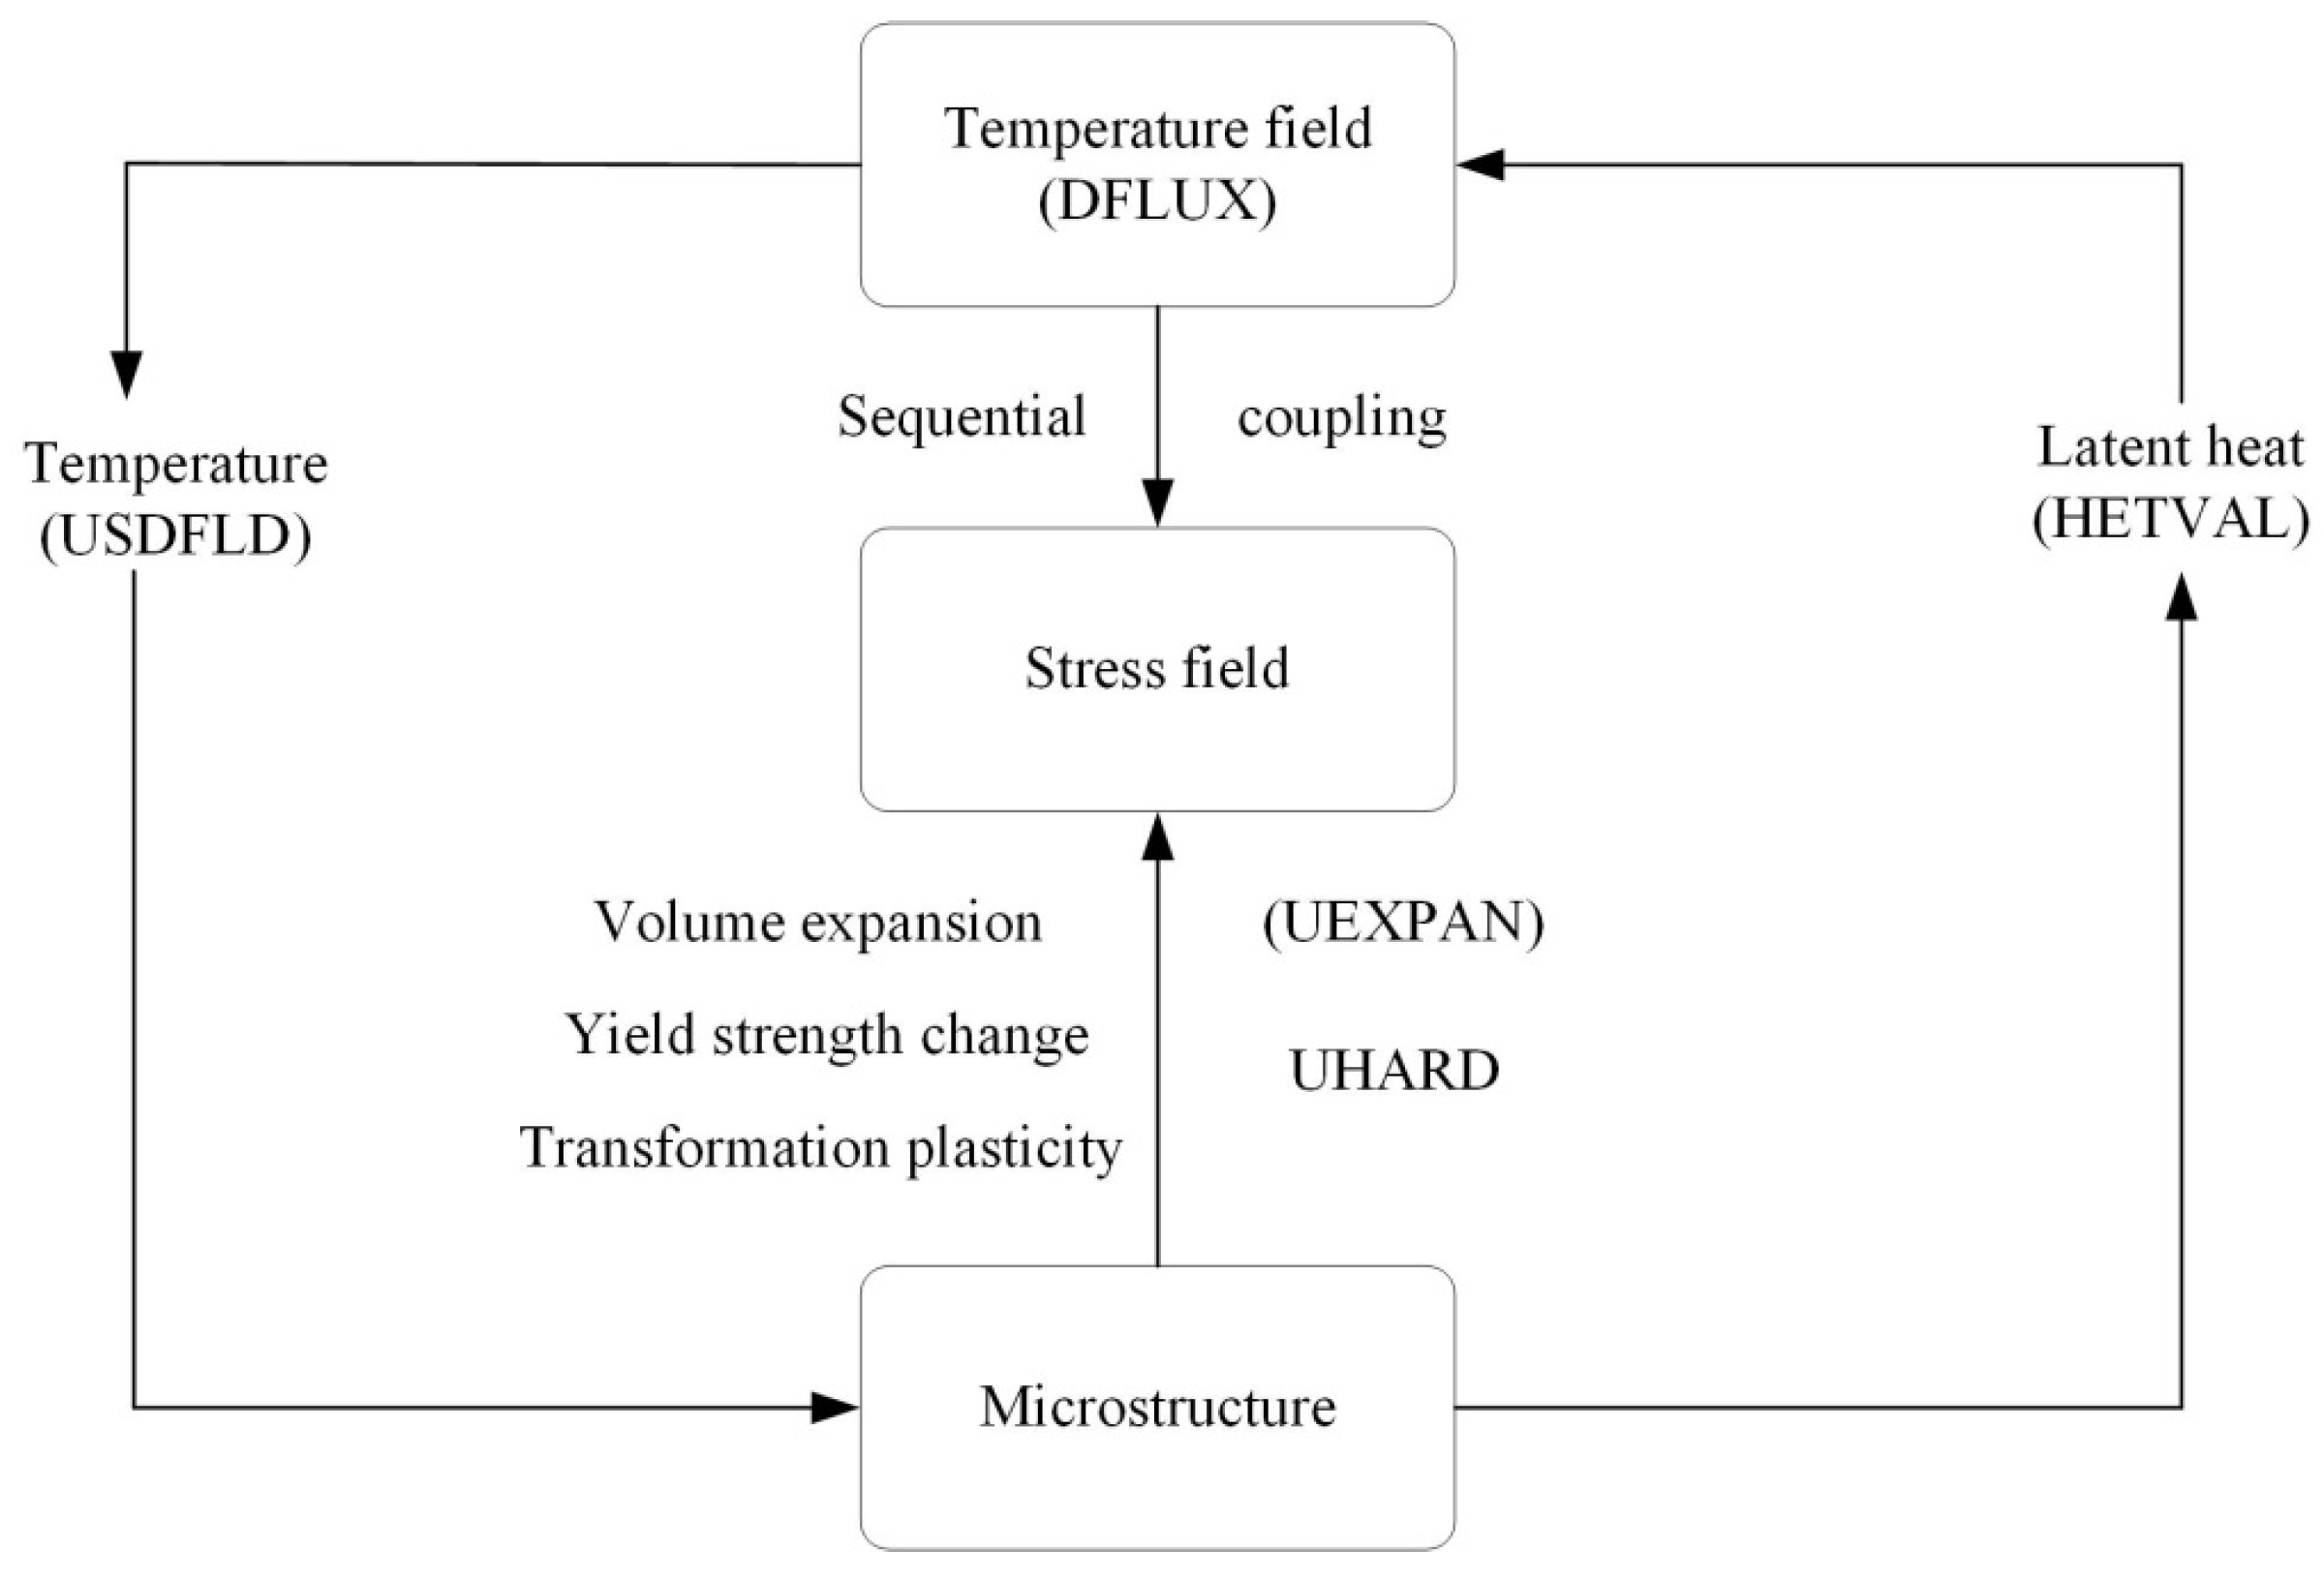
2.4. Simulation Route
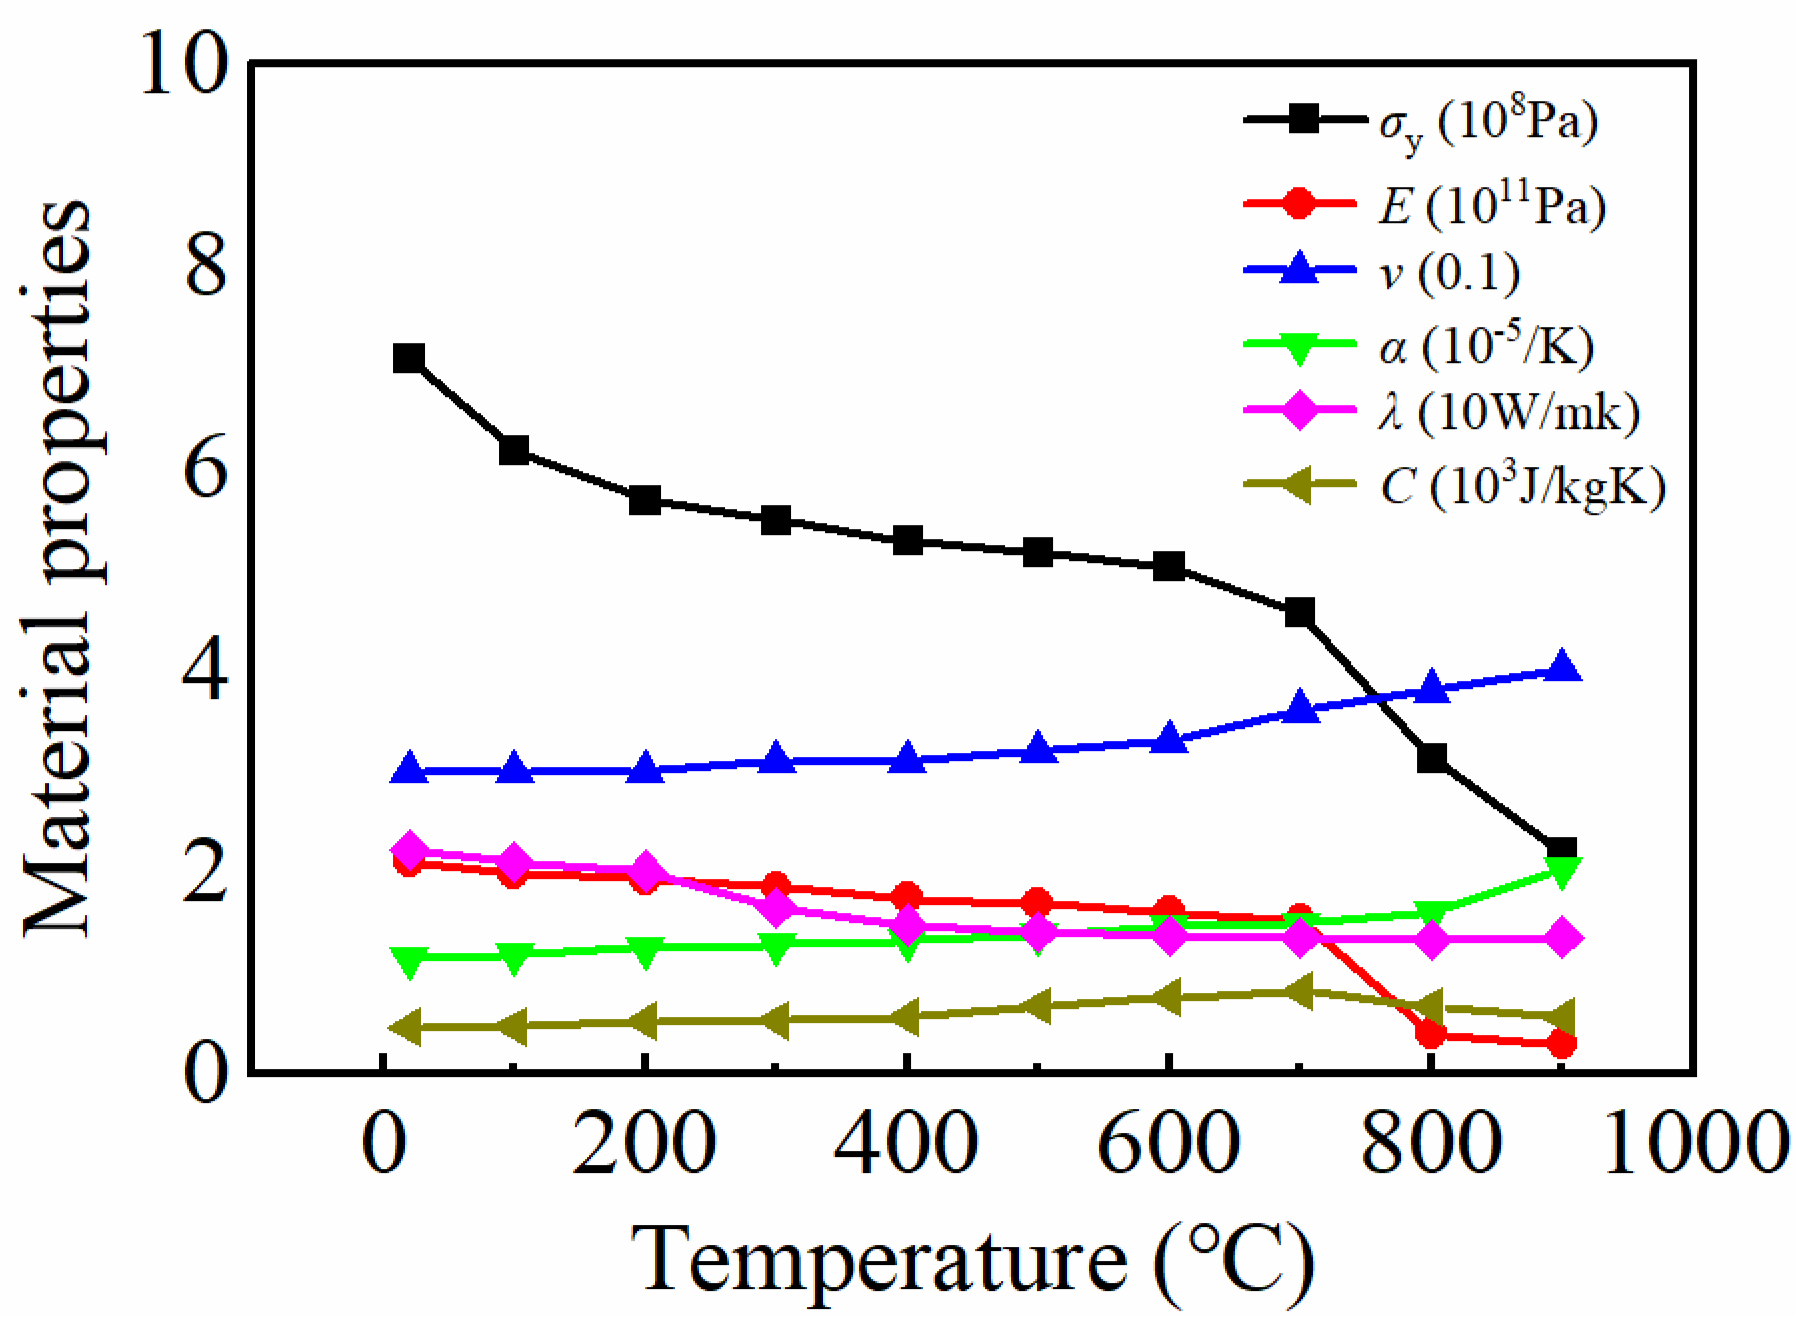
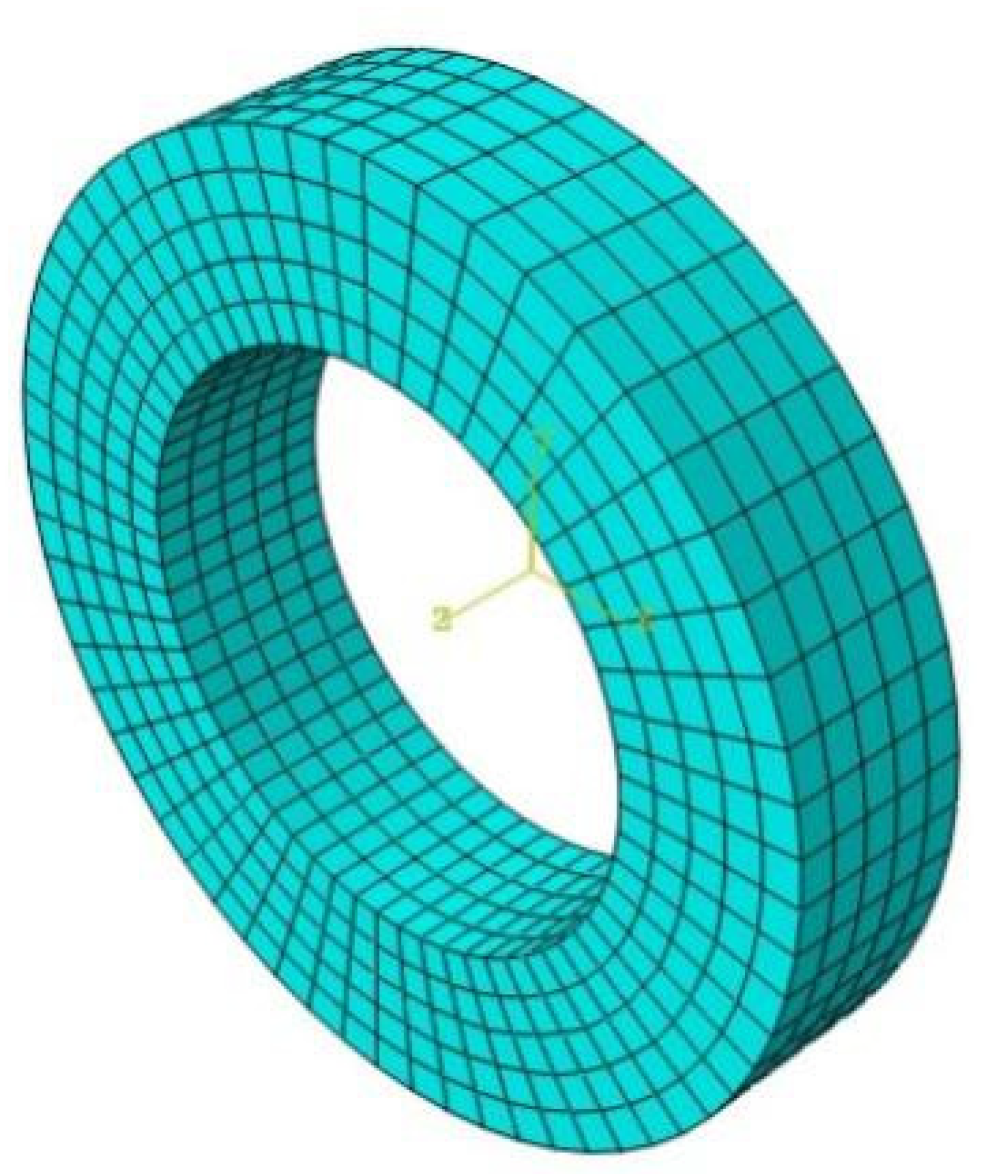
2.5. Calculation Model and Parameters
3. Heat Treatment Process Regulates Residual Stress
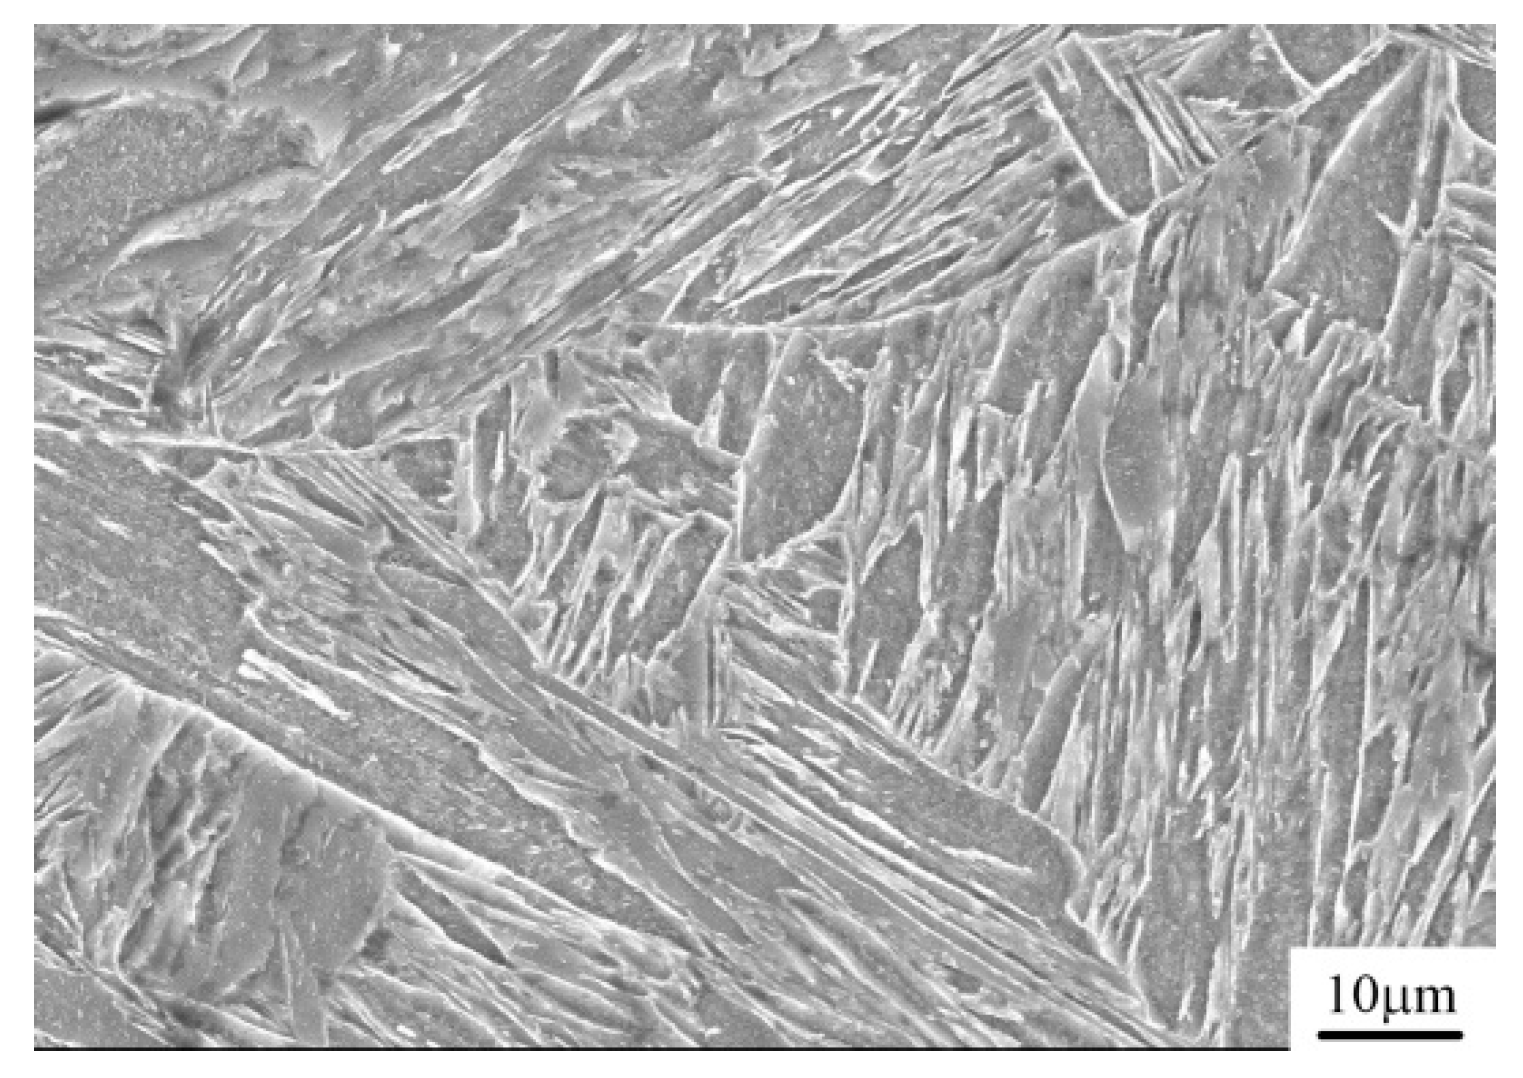
3.1. Microstructure
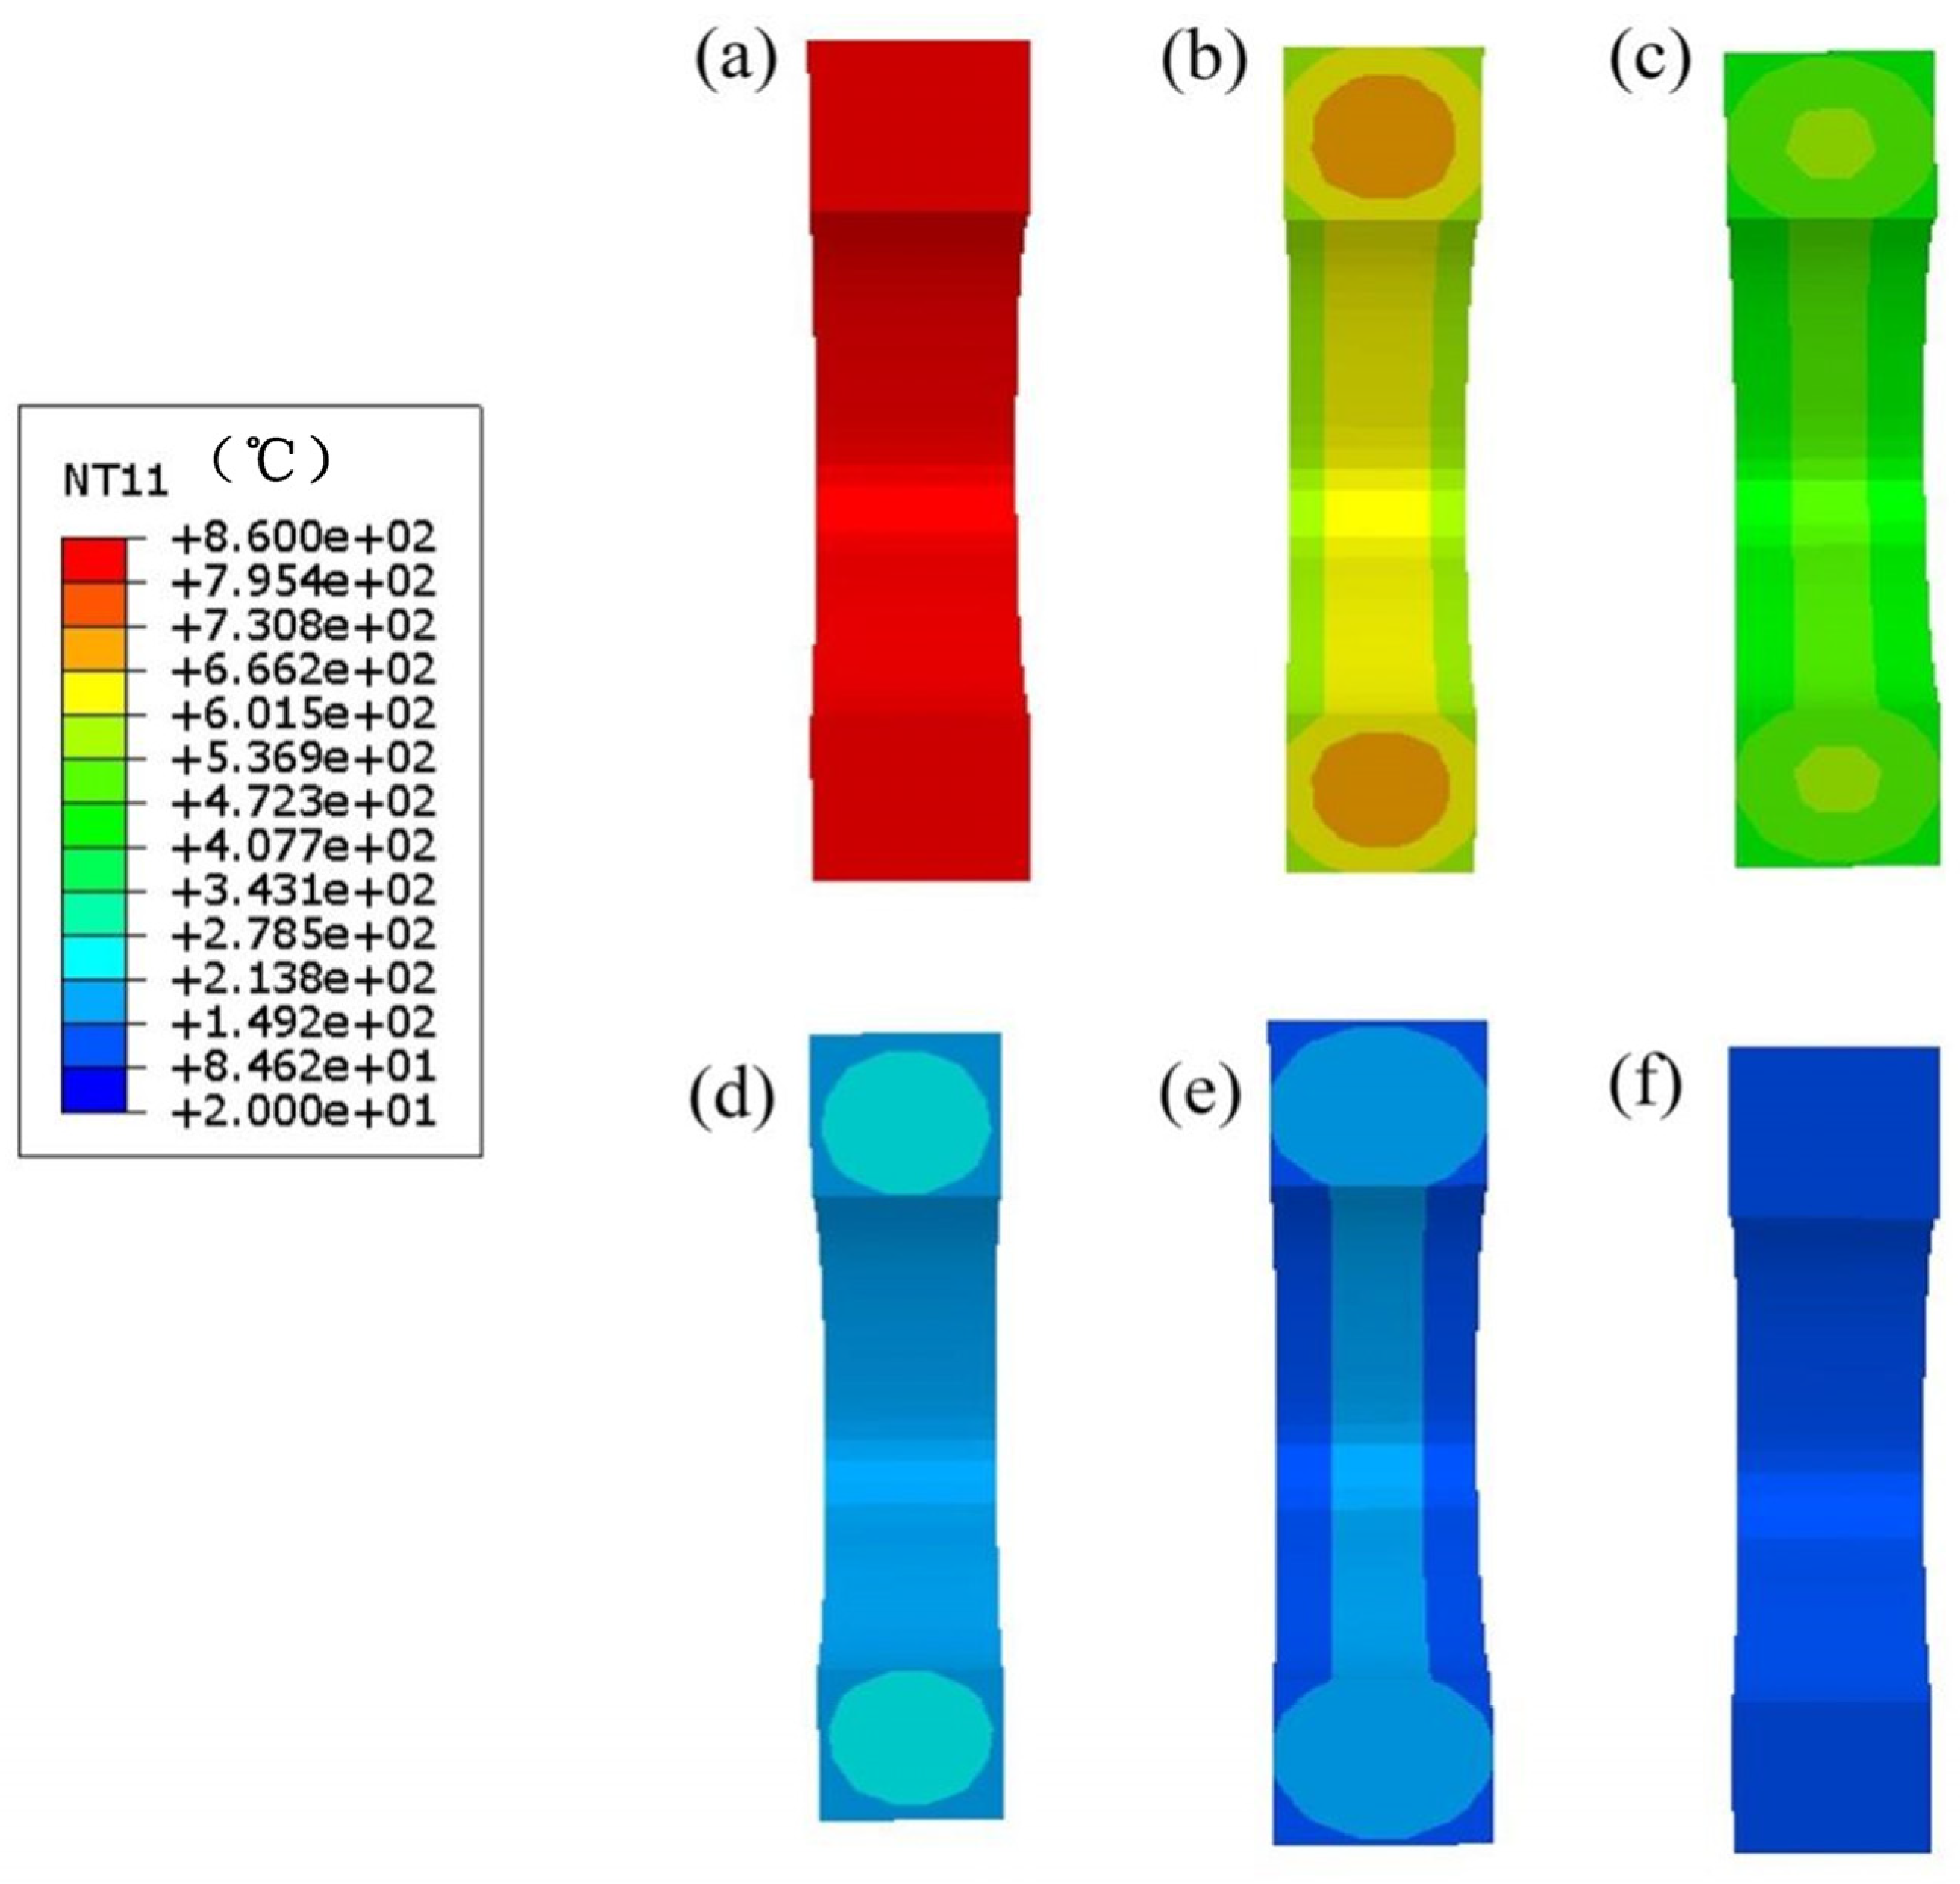
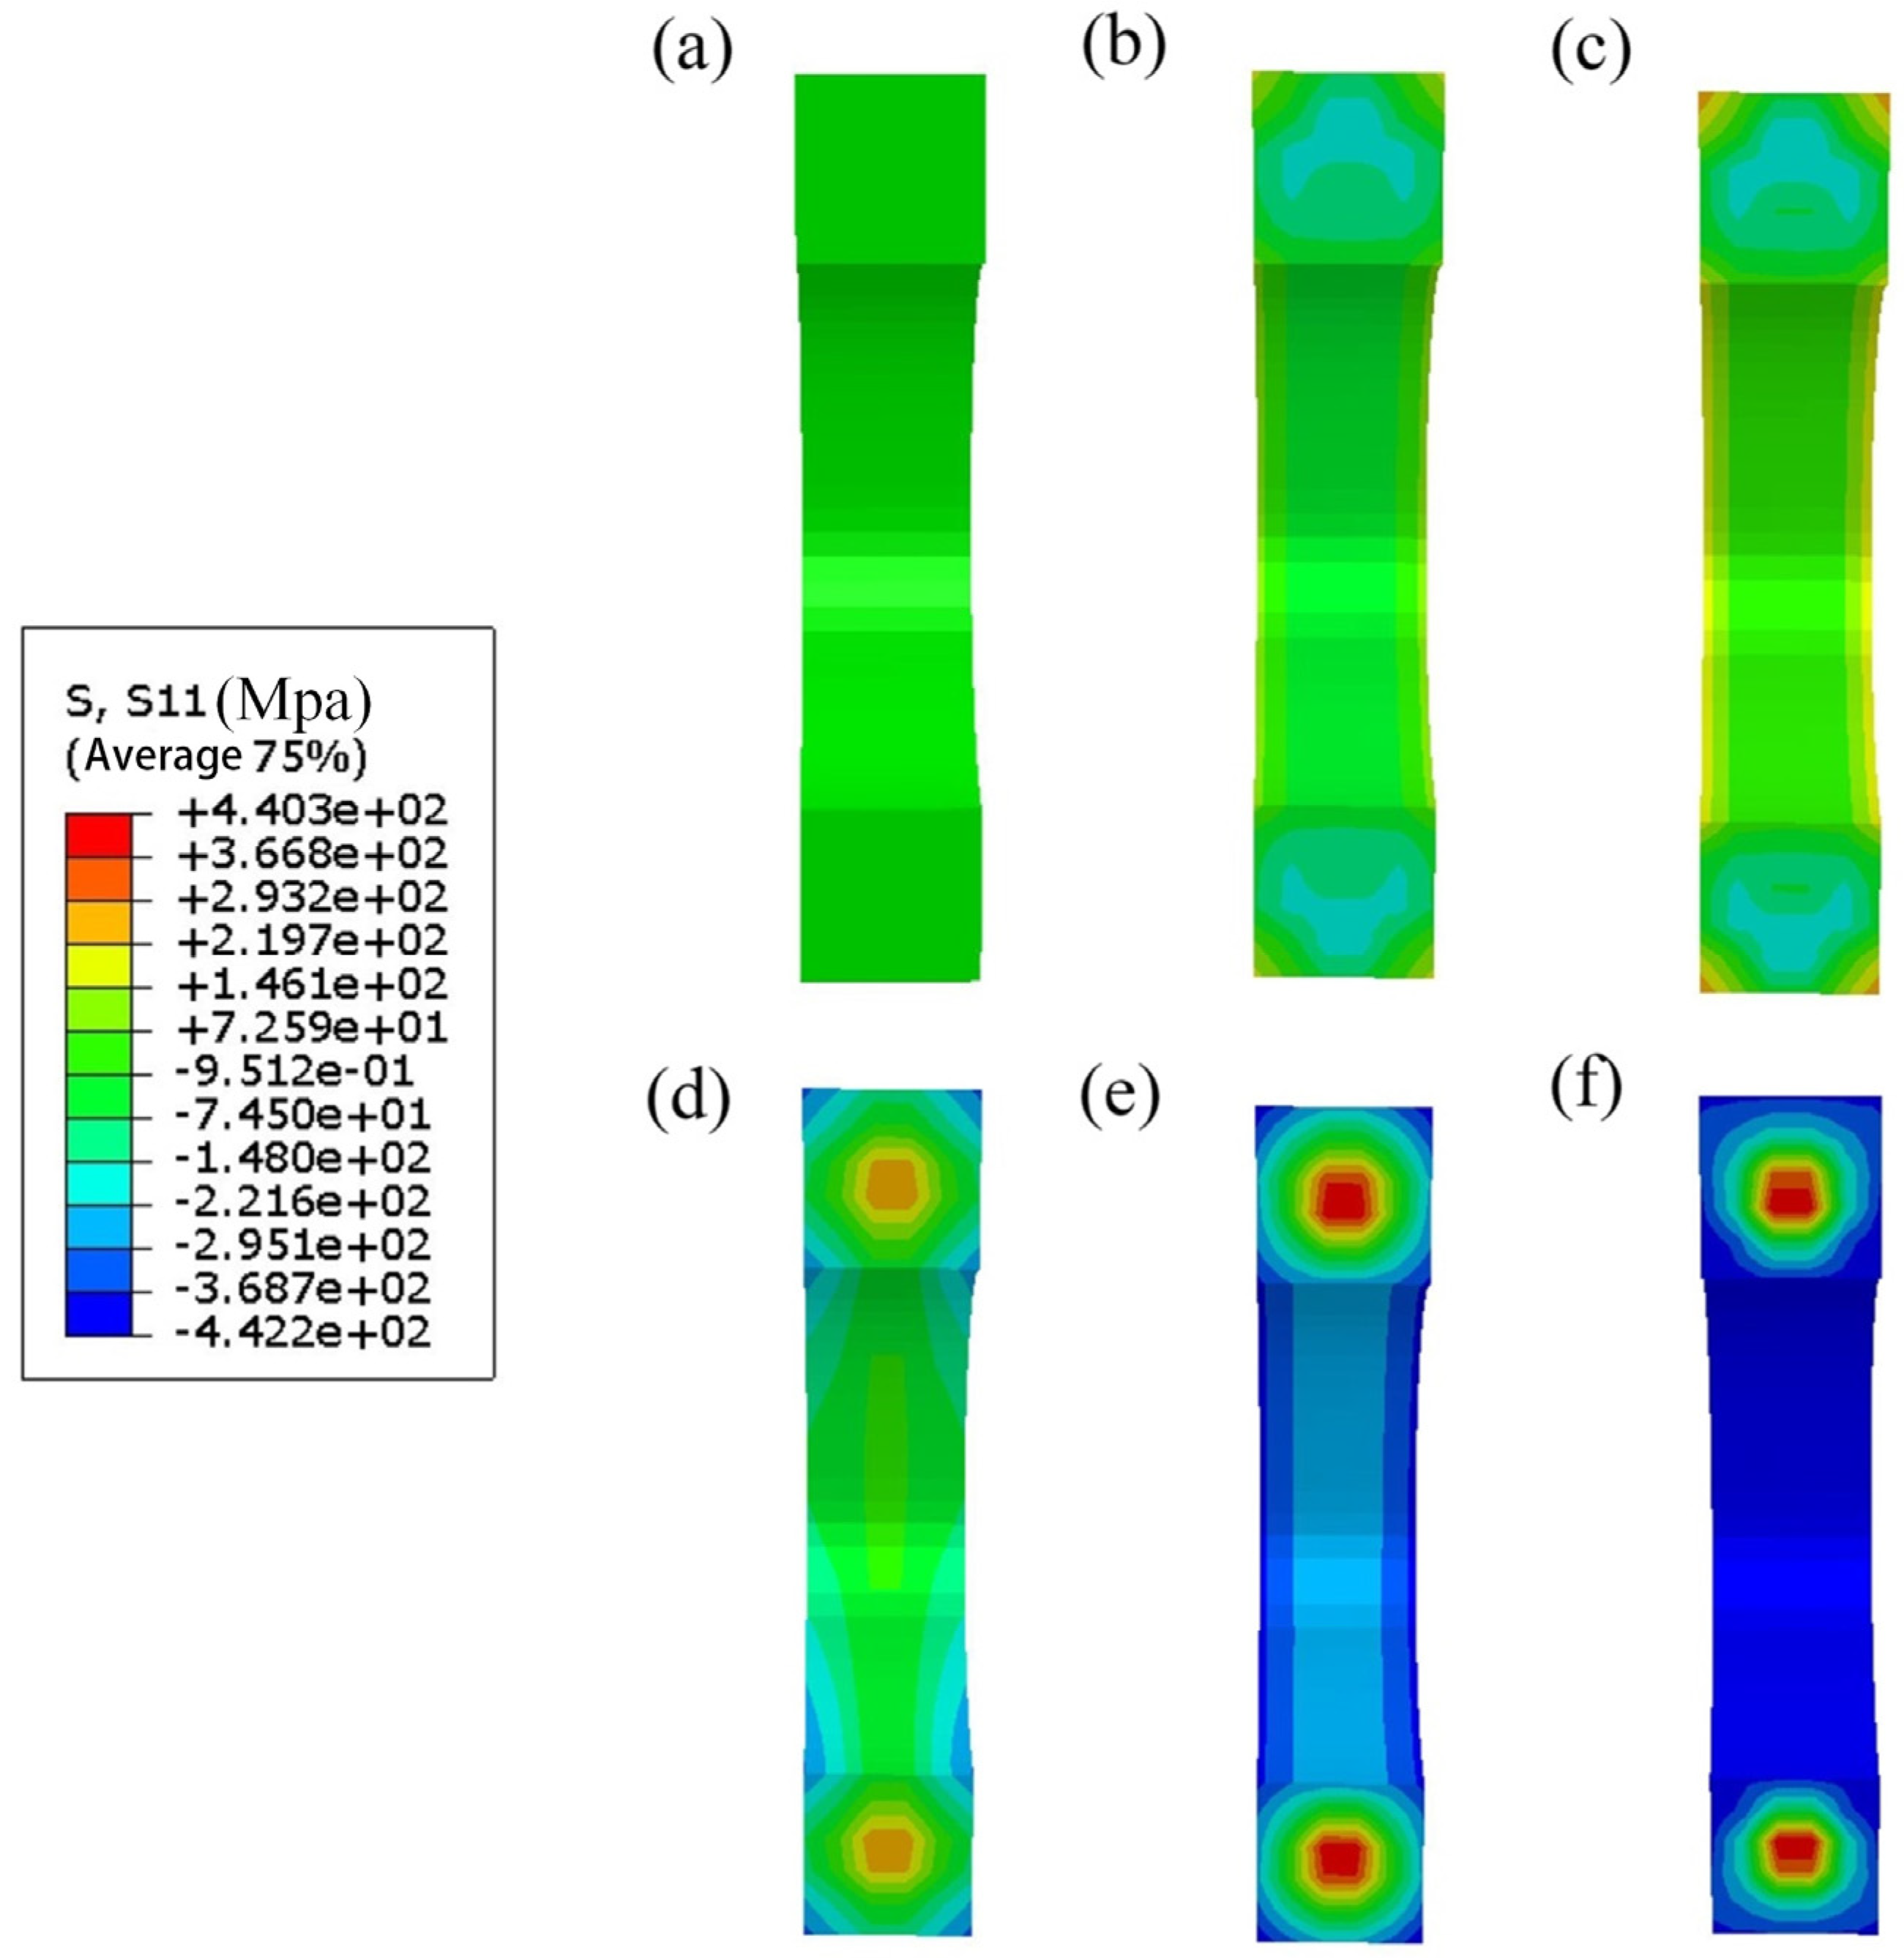
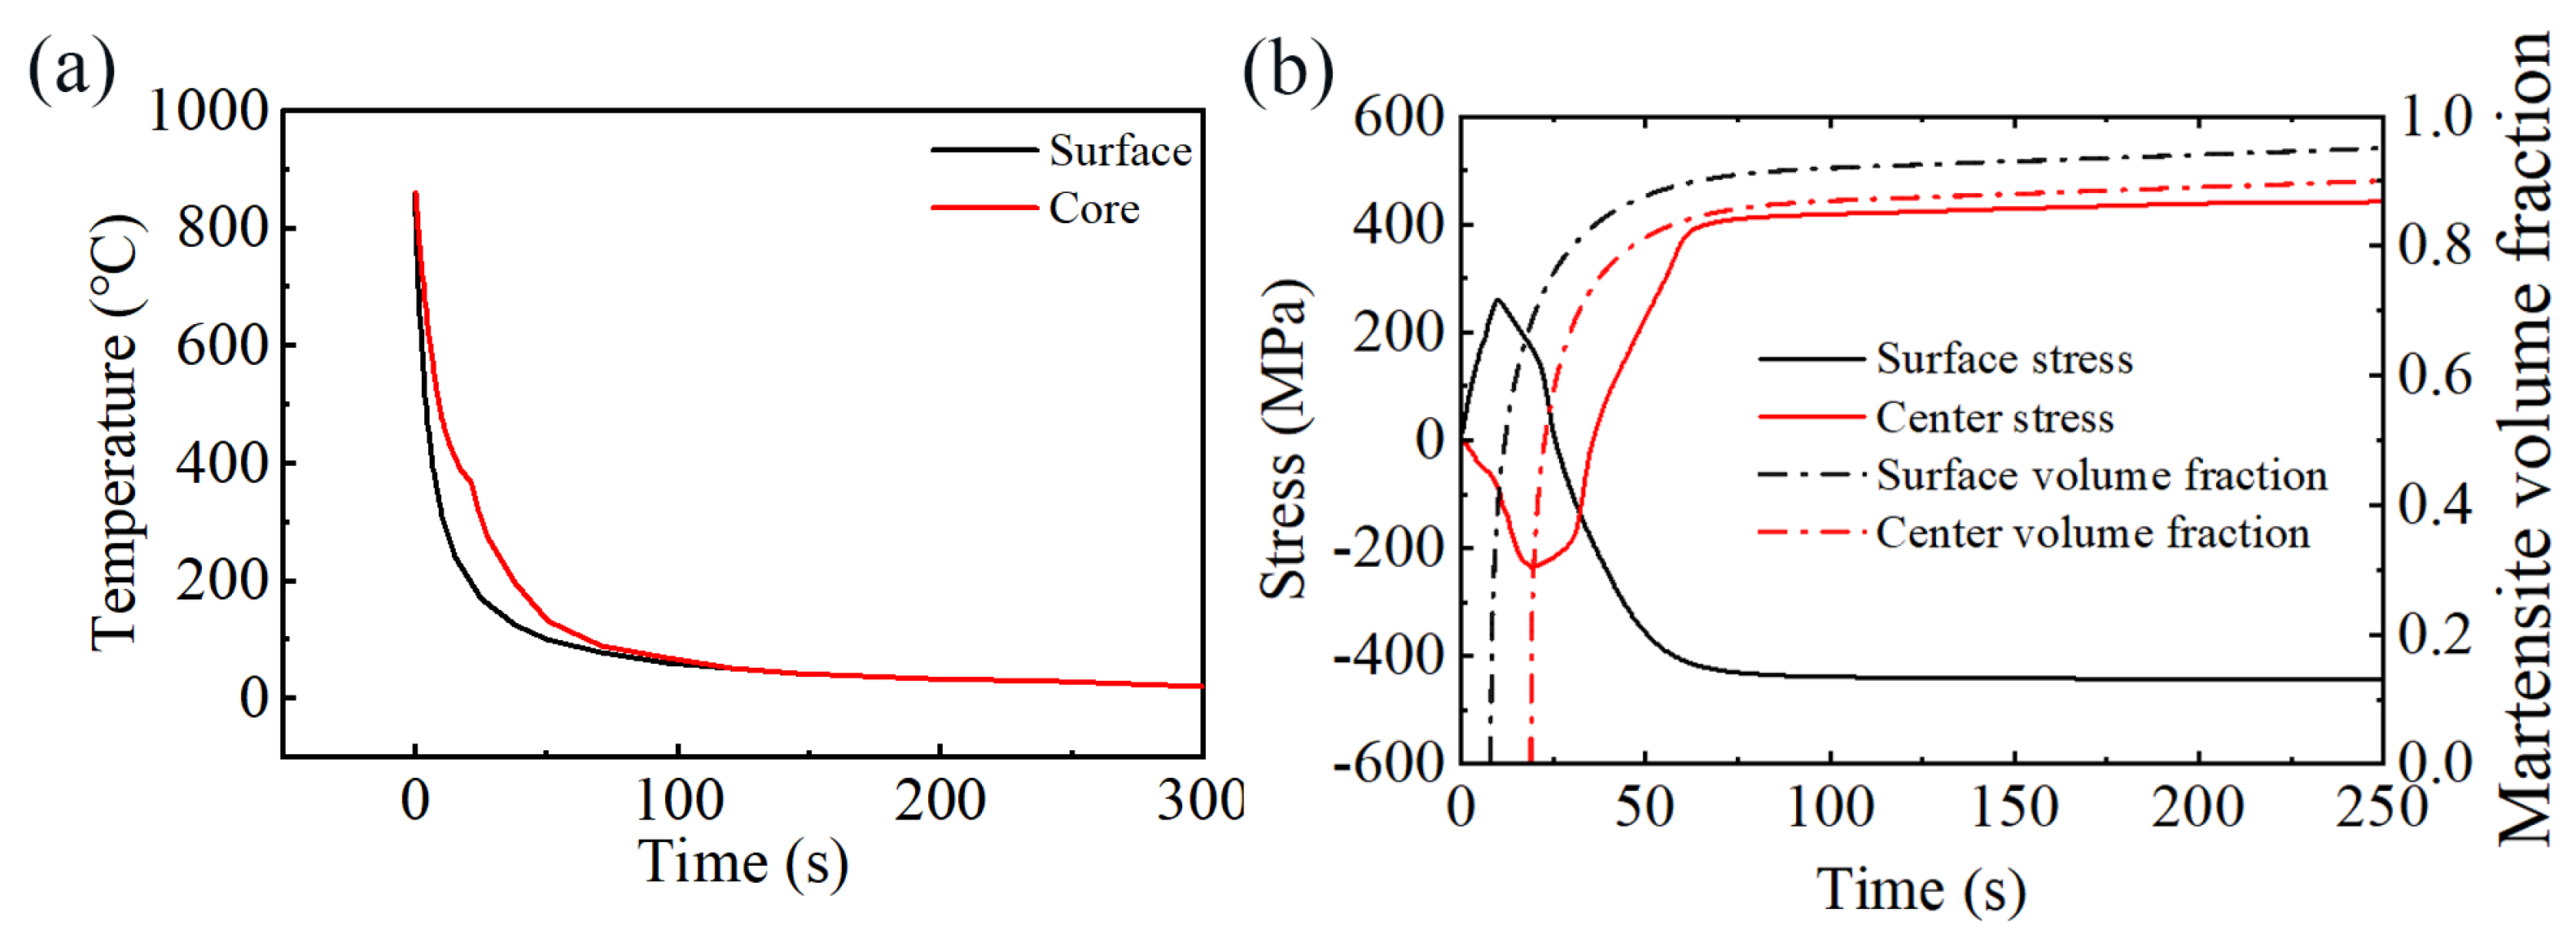
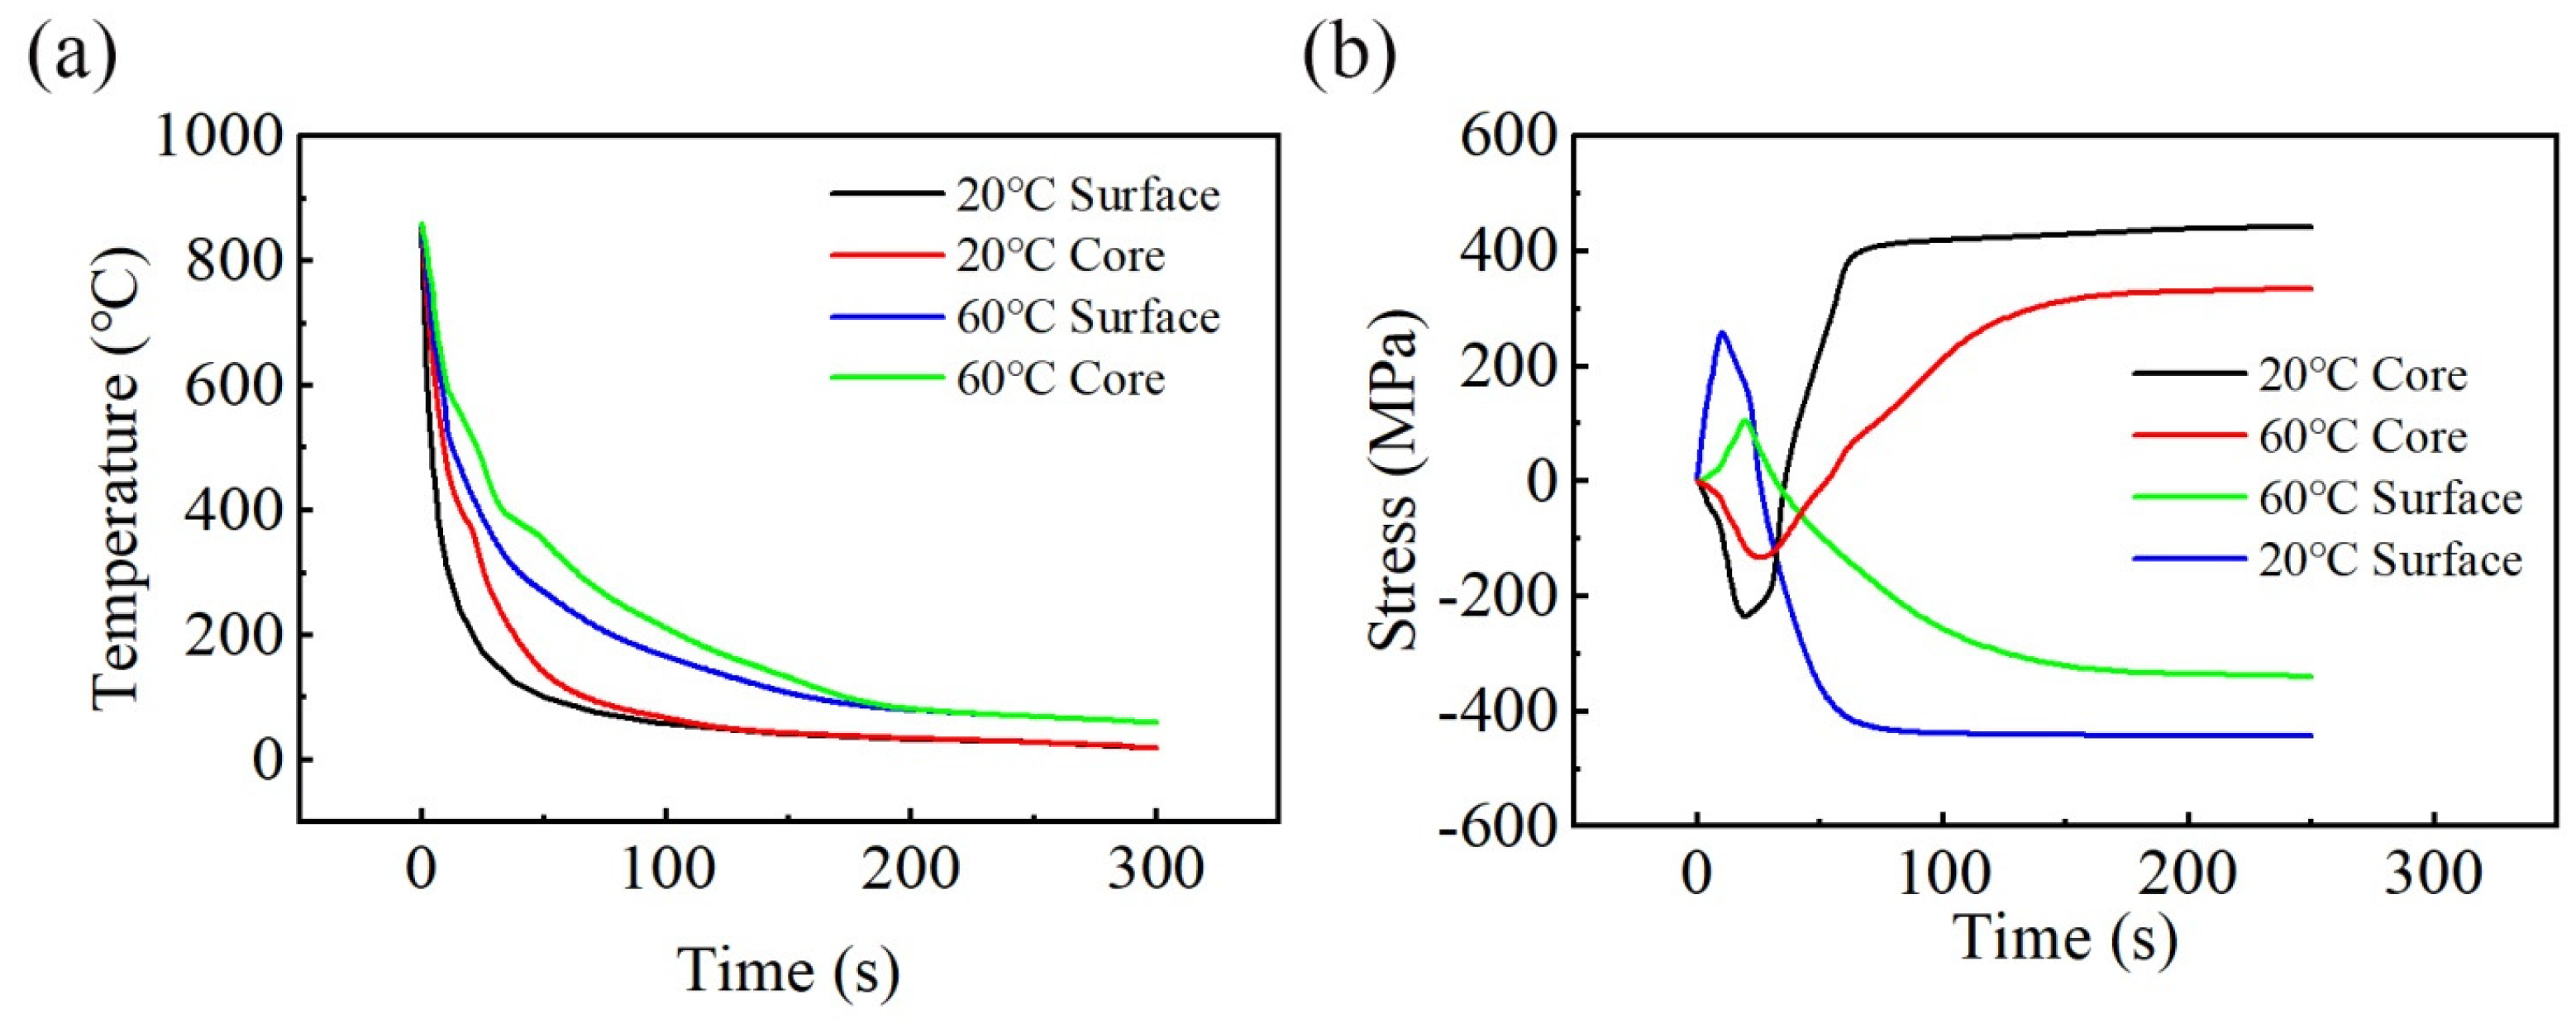
3.2. Temperature and Stress During Quenching
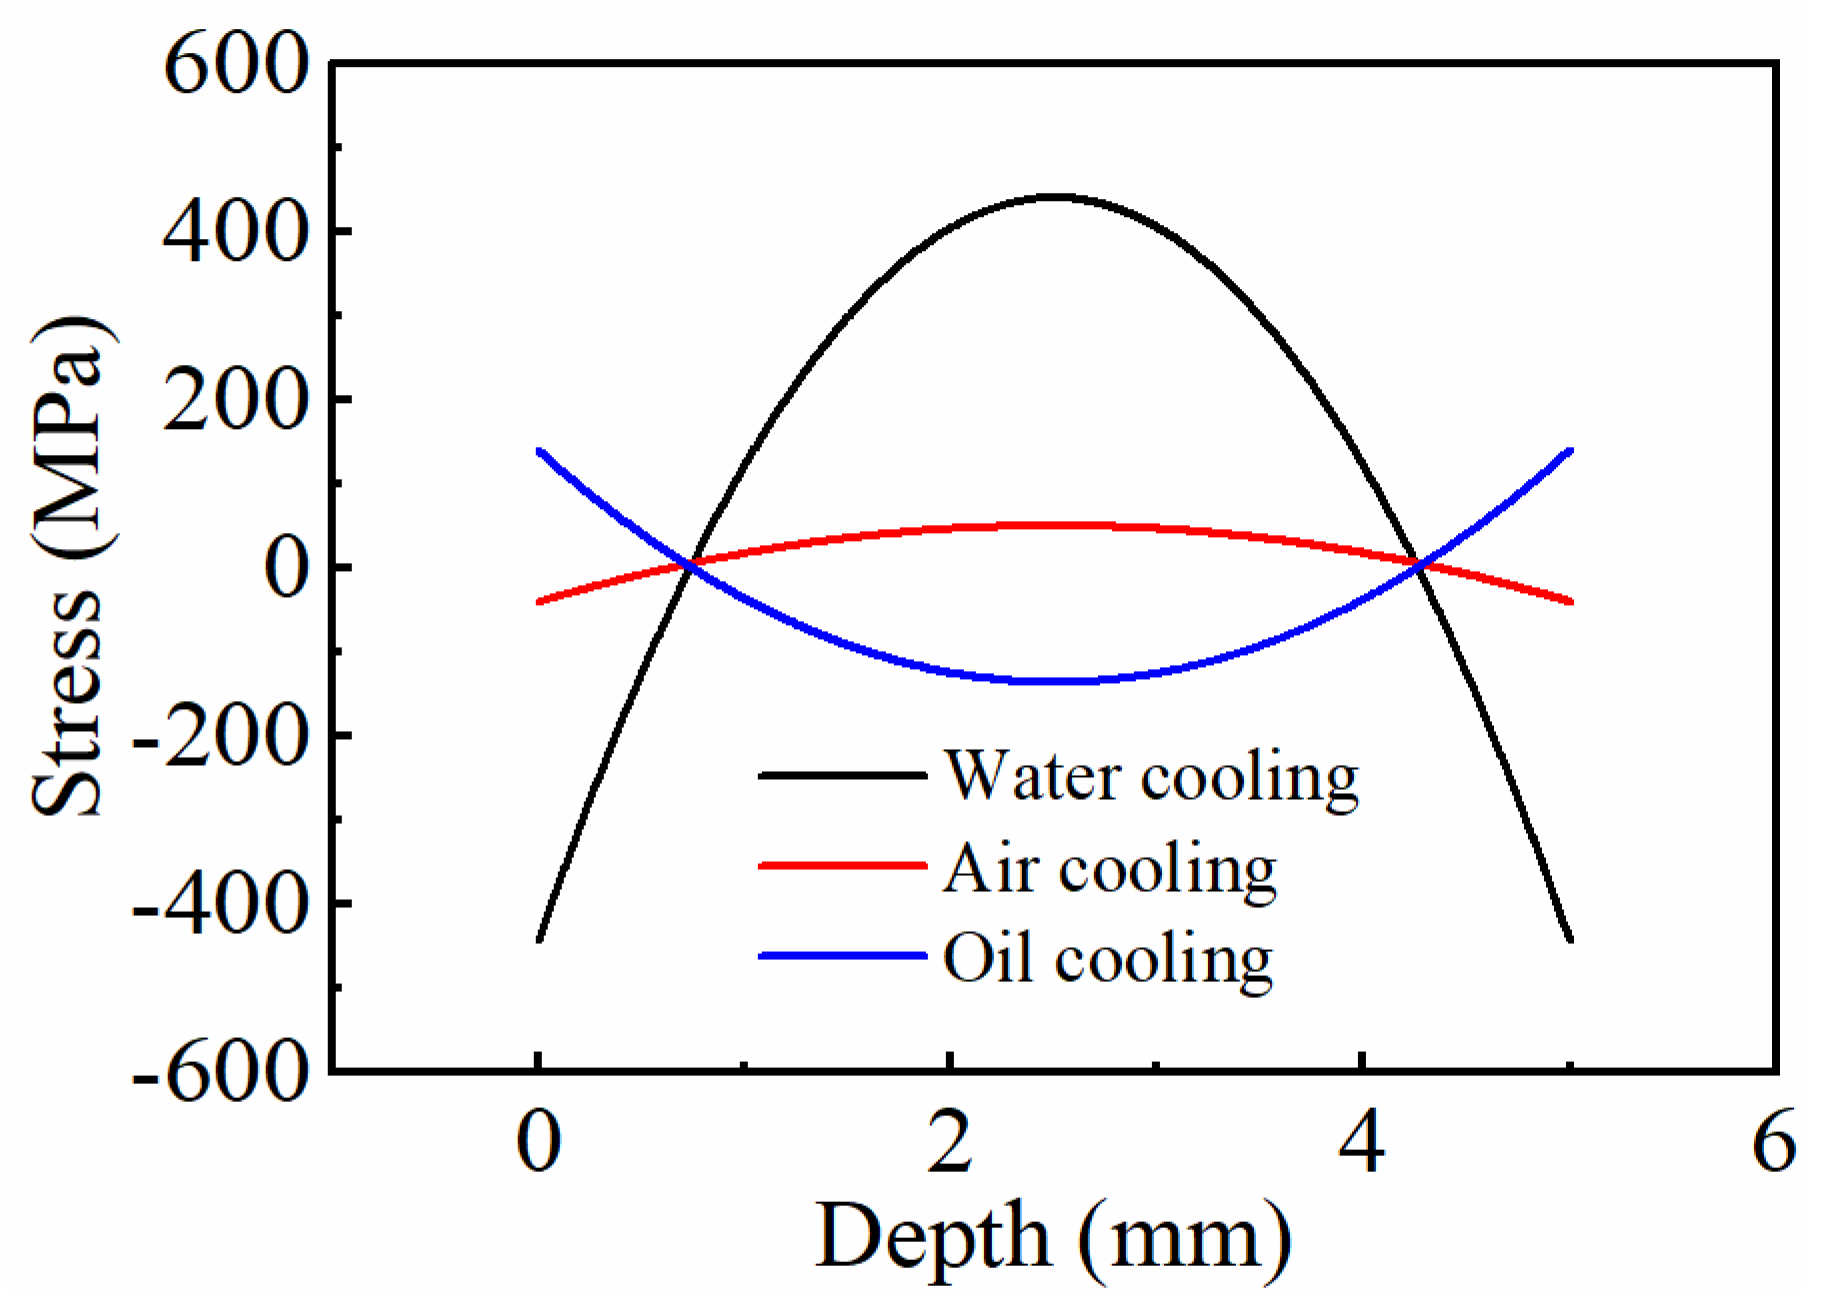
3.3. Influence of Quenching Medium on Residual Stress
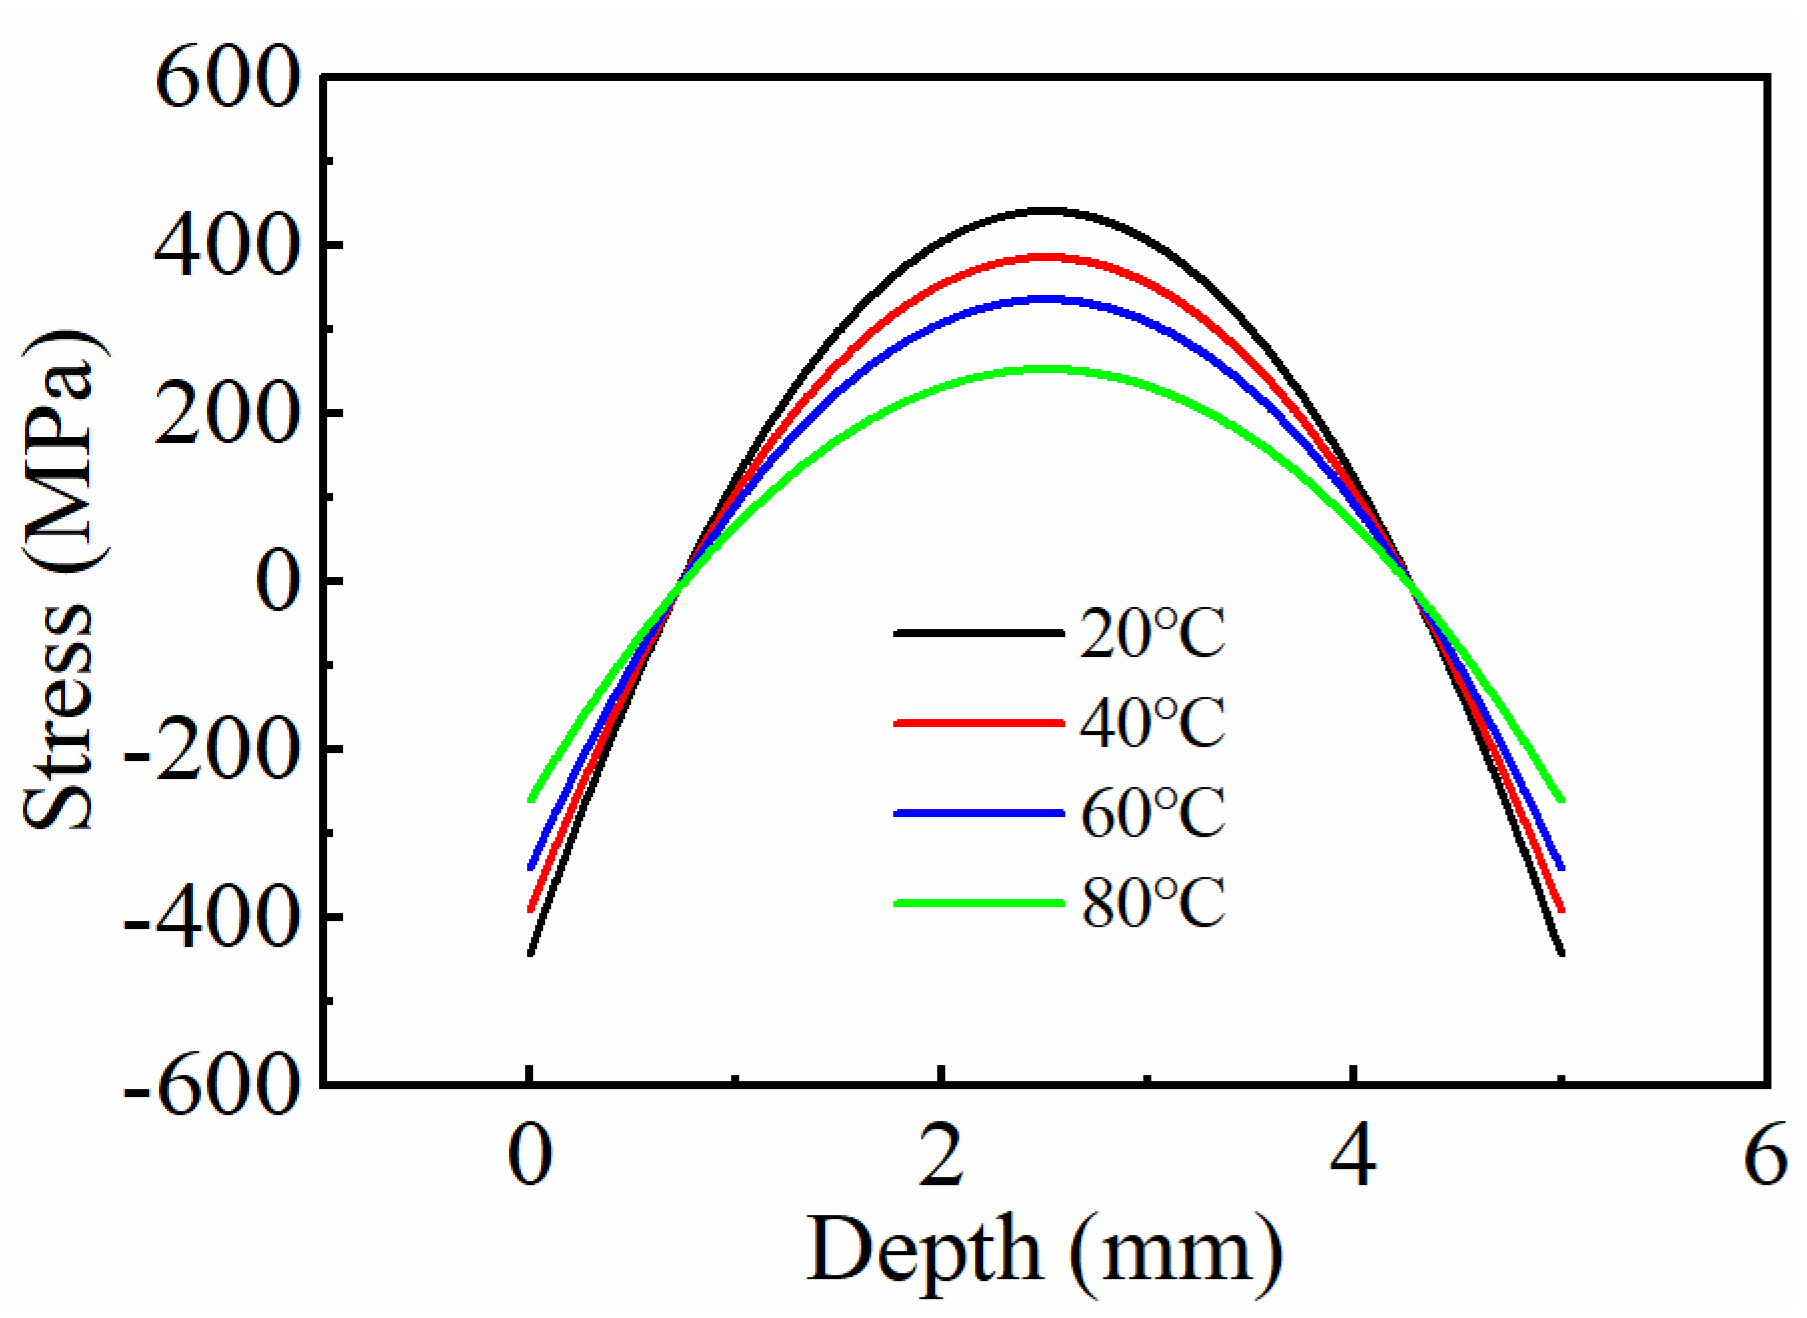
3.4. Influence of Cooling Rate on Residual Stress
4. Conclusions
Author Contributions
Funding
Data Availability Statement
Conflicts of Interest
References
- Pant, B.; Sundar, R.; Kumar, H. Studies towards development of laser peening technology for martensitic stainless steel and titanium alloys for steam turbine applications. Mater. Sci. Eng. A 2013, 587, 352–358. [Google Scholar] [CrossRef]
- Jiang, T.; Sun, J.; Wang, Y.; Liu, H.; Guo, S.; Liu, W.; Liu, Y. Strong grain-size effect on martensitic transformation in high-carbon steels made by powder metallurgy. Powder Technol. 2020, 363, 652–656. [Google Scholar]
- Zubairuddin, M.; Albert, S.; Vasudevan, M. Thermomechanical analysis of preheat effect on grade P91 steel during GTA welding. Mater. Manuf. Process. 2016, 31, 366–371. [Google Scholar]
- B’eres, L.; Irmer, W.; Balogh, A. Inconsistency of classification of creep resistant steels in European standard EN 288–3. Sci. Technol. Weld. Join. 2013, 2, 236–238. [Google Scholar]
- Kim, H.; Lee, M.; Yoon, S.; Vucko, F.; Lee, C.; Theirry, D. Diffusible hydrogen behavior and delayed fracture of cold rolled martensitic steel in consideration of automotive manufacturing process and vehicle service environment. J. Mater. Res. Technol. 2020, 9, 13483–13501. [Google Scholar]
- Boyle, E.; Northwood, D.; Bowers, R.; Sun, X.; Bauerle, P. Microstructural effects on residual stress, retained austenite, and case depth of carburized automotive steels. SAE Int. J. Mater. Manuf. 2009, 1, 697–708. [Google Scholar]
- Denis, S.; Archambault, P.; Gautier, E.; Simon, A.; Beck, G. Prediction of residual stress and distortion of ferrous and non-ferrous metals: Current status and future developments. J. Mater. Eng. Perform. 2002, 11, 92–102. [Google Scholar]
- Julien, R.; Velay, V.; Vidal, V.; Dahan, Y.; Forestier, R.; R’ezaï-Aria, F. Characterization and modeling of forged Ti-6Al-4V Titanium alloy with microstructural considerations during quenching process. Int. J. Mech. Sci. 2018, 142, 456–467. [Google Scholar]
- Denis, S.; Farias, D.; Simon, A. Mathematical model coupling phase transformations and temperature evolutions in steels. ISIJ Int. 1992, 32, 316–325. [Google Scholar]
- Koistinen, D.; Marburger, R. A general equation prescribing the extent of the austenite-martensite transformation in pure iron-carbon alloys and plain carbon steels. Acta Metall. 1959, 7, 59–60. [Google Scholar]
- Abdollahpoor, A.; Chen, X.; Pereira, M. Sensitivity of the final properties of tailored hot stamping components to the process and material parameters. J. Mater. Process. Technol. 2016, 228, 125–136. [Google Scholar] [CrossRef]
- Teixeira, J.; Marechal, D.; Wimpory, R.; Denis, S.; Lefebvre, F.; Frappier, R. Formation of residual stresses during quenching of Ti17 and Ti–6Al–4V alloys: Influence of phase transformations. Mater. Sci. Eng. A. 2022, 832, 142456. [Google Scholar] [CrossRef]
- Denis, S.; Sjostr, S.; Simon, A. Coupled temperature, stress, phase transformation calculation. Metall. Mater. Trans. A 1987, 18, 1203–1212. [Google Scholar] [CrossRef]
- Bhadeshia, H. Developments in martensitic and bainitic steels: Role of the shape deformation. Mater. Sci. Eng. A 2004, 378, 34–39. [Google Scholar] [CrossRef]
- Zhang, Y.; Zhan, D.; Qi, X.; Jiang, Z. Effect of tempering temperature on the microstructure and properties of ultrahigh-strength stainless steel. J. Mater. Sci. Technol. 2019, 35, 1240–1249. [Google Scholar] [CrossRef]
- Emanuelli, A.; Molinari, L.; Facchini, E.; Sbettega, S.; Carmignato, M.; Bandini, M. Effect of heat treatment temperature and turning residual stresses on the plain and notch fatigue strength of Ti-6Al-4V additively manufactured via laser powder bed fusion. Int. J. Fatigue 2022, 162, 107009. [Google Scholar] [CrossRef]
- Denis, S.; Gautier, E.; Sjostr, S.; Simon, A. Influence of stresses on the kinetics of pearlitic transformation during continuous cooling. Acta Metall. 1987, 35, 1621–1632. [Google Scholar] [CrossRef]
- Chobaut, N.; Carron, D.; Saelzle, P.; Drezet, J. Measurements and modeling of stress in precipitation-hardened aluminum alloy AA2618 during gleeble interrupted quenching and constrained cooling. Metall. Mater. Trans. A 2016, 47, 5641–5649. [Google Scholar] [CrossRef]
- Gaurav, D.; Chandan, P. Experimental investigation on microstructure, mechanical properties, and residual stresses of dissimilar welded joint of martensitic P92 and AISI 304L austenitic stainless steel. Int. J. Press. Vessel. Pip. 2021, 194, 104536. [Google Scholar]
- Rae, W. Thermo-metallo-mechanical modelling of heat treatment induced residual stress in Ti–6Al–4V alloy. Mater. Sci. Technol. 2019, 35, 747–766. [Google Scholar] [CrossRef]
- Tan, P.; Shen, F.; Li, B.; Zhou, K. A thermo-metallurgical-mechanical model for selective laser melting of Ti6Al4V. Mater. Des. 2019, 168, 107642. [Google Scholar] [CrossRef]
- Teixeira, J.; Denand, B.; Aeby, E.; Denis, S. Simulation of coupled temperature, microstructure and internal stresses evolutions during quenching of a β-metastable titanium alloy. Mater. Sci. Eng. A 2016, 651, 615–625. [Google Scholar] [CrossRef]
- Kumar, S.; Yadav, V.; Sharma, S.; Pandey, C.; Goyal, A.; Kumar, P. Role of dissimilar Ni-based ERNiCrMo-3 filler on the microstructure, mechanical properties and weld induced residual stresses of the ferritic/martensitic P91 steel welds joint. Int. J. Press. Vessel. Pip. 2021, 193, 104443. [Google Scholar] [CrossRef]
- Ahn, J.; He, E.; Chen, L.; Wimpory, R.; Dear, J.; Davies, C. Prediction and measurement of residual stresses and distortions in fibre laser welded Ti-6Al-4V considering phase transformation. Mater. Des. 2017, 115, 441–457. [Google Scholar] [CrossRef]
- Wang, X.; Hu, L.; Chen, D. Effect of martensitic transformation on stress evolution in multi-pass butt-welded 9% Cr heat-resistant steel pipes. Acta Metall. Sin. 2017, 53, 888–896. [Google Scholar]
- Zubairuddin, M.; Albert, S.; Mahadevan, S. Experimental and finite element analysis of residual stress and distortion in GTA welding of modified 9Cr-1Mo steel. J. Mech. Sci. Technol. 2014, 28, 5095–5105. [Google Scholar]
- Deng, D.A.; Murakawa, H. Prediction of welding residual stress in multi-pass buttwelded modified 9Cr–1Mo steel pipe considering phase transformation effects. Comput. Mater. Sci. 2006, 37, 209–219. [Google Scholar] [CrossRef]
- Ahmed, T.; Rack, H. Phase transformations during cooling in α+β titanium alloys. Mater. Sci. Eng. A 1998, 243, 206–211. [Google Scholar] [CrossRef]
- Chen, S.; Zhang, Y.; Wu, Q.; Gao, H.; Gao, Z.; Li, X. Effect of solid-state phase transformation on residual stress of selective laser melting Ti6Al4V. Mater. Sci. Eng. A 2021, 819, 141299. [Google Scholar] [CrossRef]
- Beres, L.; Balogh, A.; Irmer, W. Welding of martensitic creep-resistant steels. Weld. J. 2001, 80, 191–195. [Google Scholar]
- Goerres, G.; Revesz, T.; Duncan, J. The deformation of metals under small stresses during phase transformations. Proc. R. Soc. Lond. 1965, 283, 403–422. [Google Scholar]
- Leblond, J. Mathematical modelling of transformation plasticity in steels II: Coupling with strain hardening phenomena. Int. J. Plast. 1989, 5, 573–591. [Google Scholar]
- Leblond, J.; Devaux, J.; Devaux, J. Mathematical modelling of transformation plasticity in steels I: Case of ideal-plastic phases. Int. J. Plast. 1989, 5, 551–572. [Google Scholar]
- Liu, Y. Determination and Finite Element Simulation of Quench Stress Distribution in Medium Carbon Steel; Shanghai Jiao Tong University: Shanghai, China, 2017. [Google Scholar]
- Liu, Y.; Qin, S.; Zhang, J. Influence of Transformation Plasticity on the Distribution of Internal Stress in Three Water-Quenched Cylinders. Metall. Mater. Trans. A 2017, 48, 4943–4956. [Google Scholar] [CrossRef]
- Yang, G.; Xia, S.L.; Zhang, F.C.; Branco, R.; Long, X.Y.; Li, Y.G.; Li, J.H. Effect of tempering temperature on monotonic and low-cycle fatigue properties of a new low-carbon martensitic steel. Mater. Sci. Eng. A 2021, 826, 141939. [Google Scholar] [CrossRef]

| Quenching Temperatures (°C) | 20 | 40 | 60 | 80 |
|---|---|---|---|---|
| Surface residual stresses (MPa) | −442 | −390 | −340 | −260 |
| Core residual stresses (MPa) | 439 | 384 | 334 | 251 |
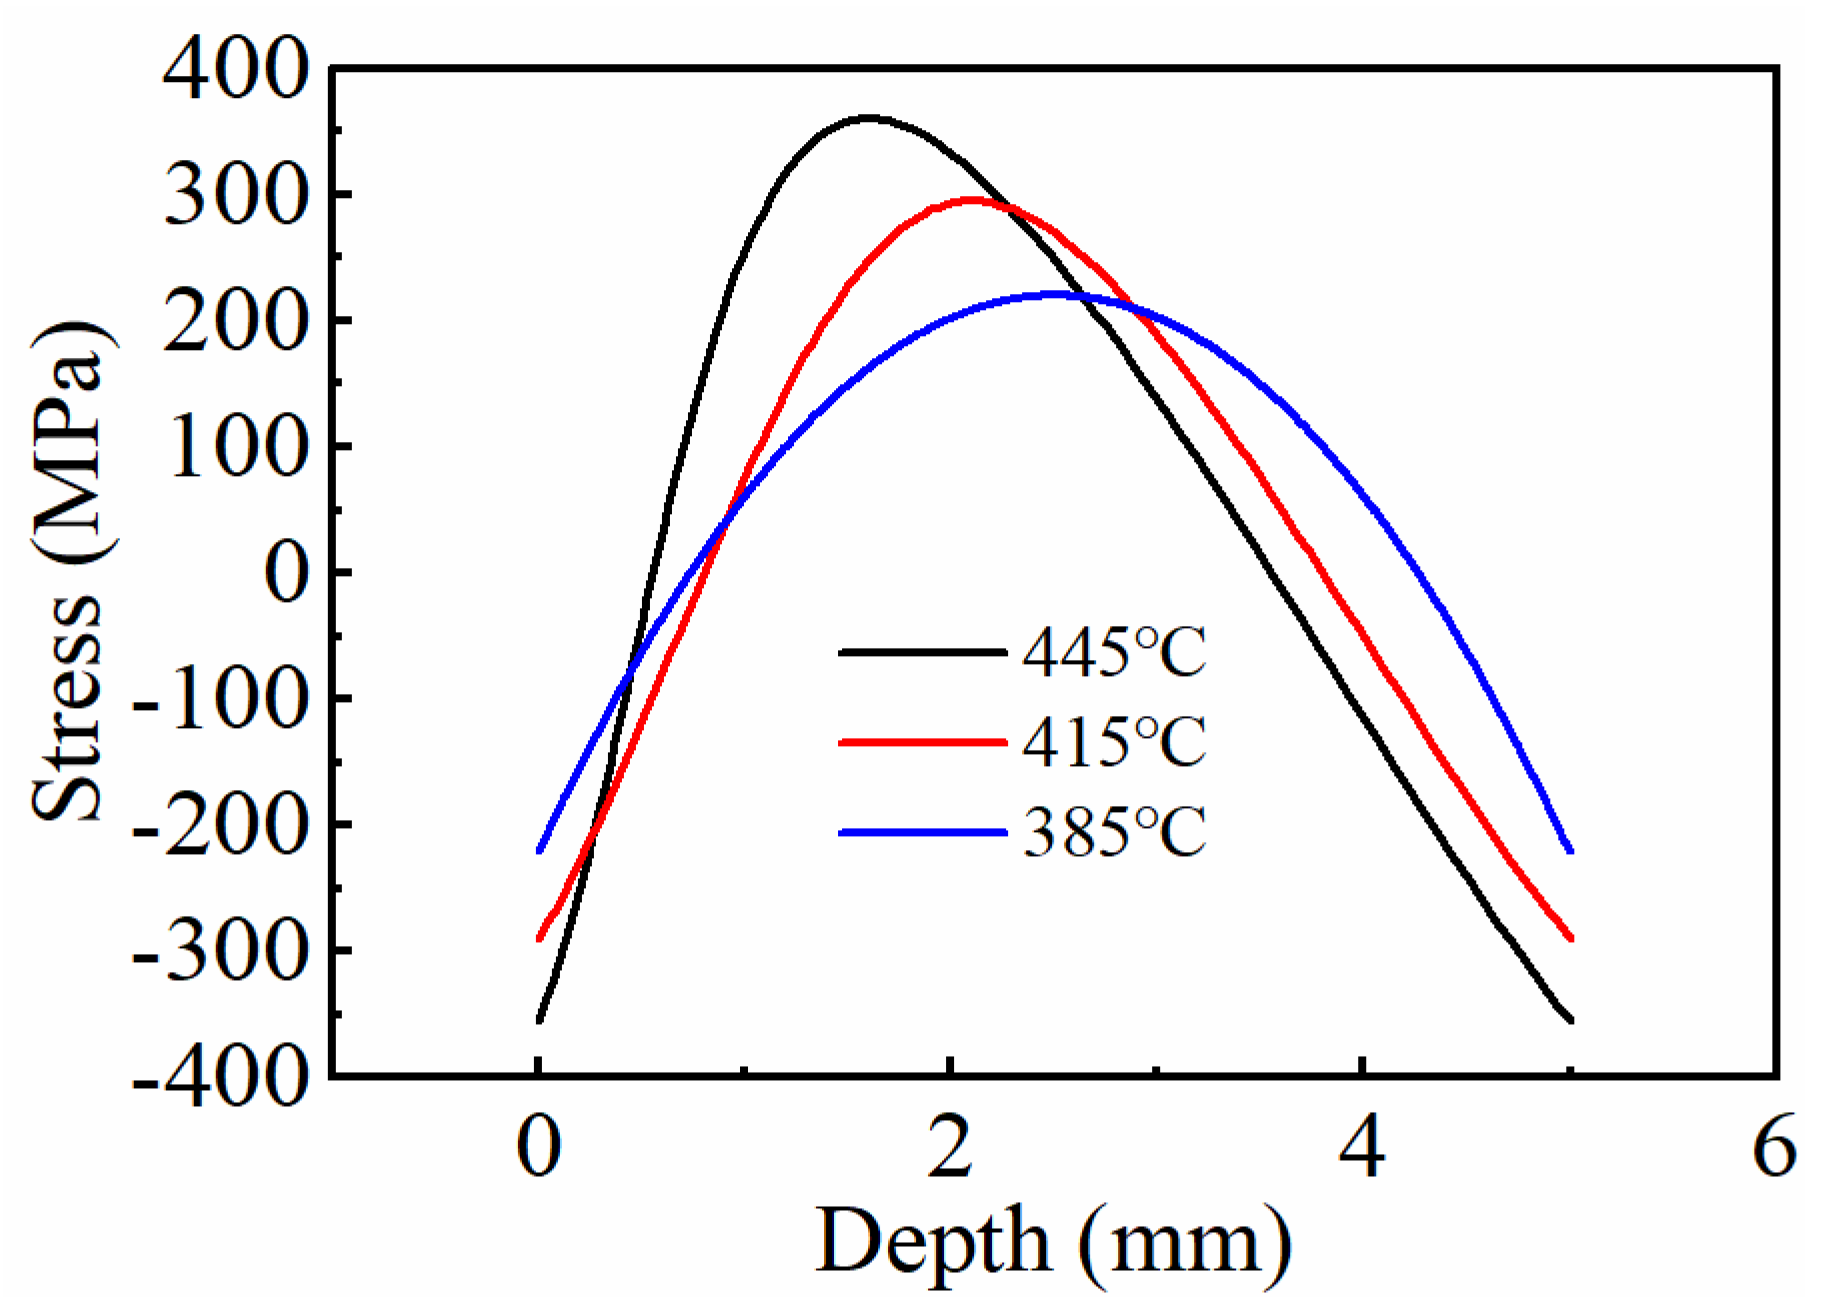
| Starting temperature of martensitic transformation (°C) | 445 | 415 | 385 |
| Finishing temperature of martensitic transformation (°C) | 270 | 240 | 210 |
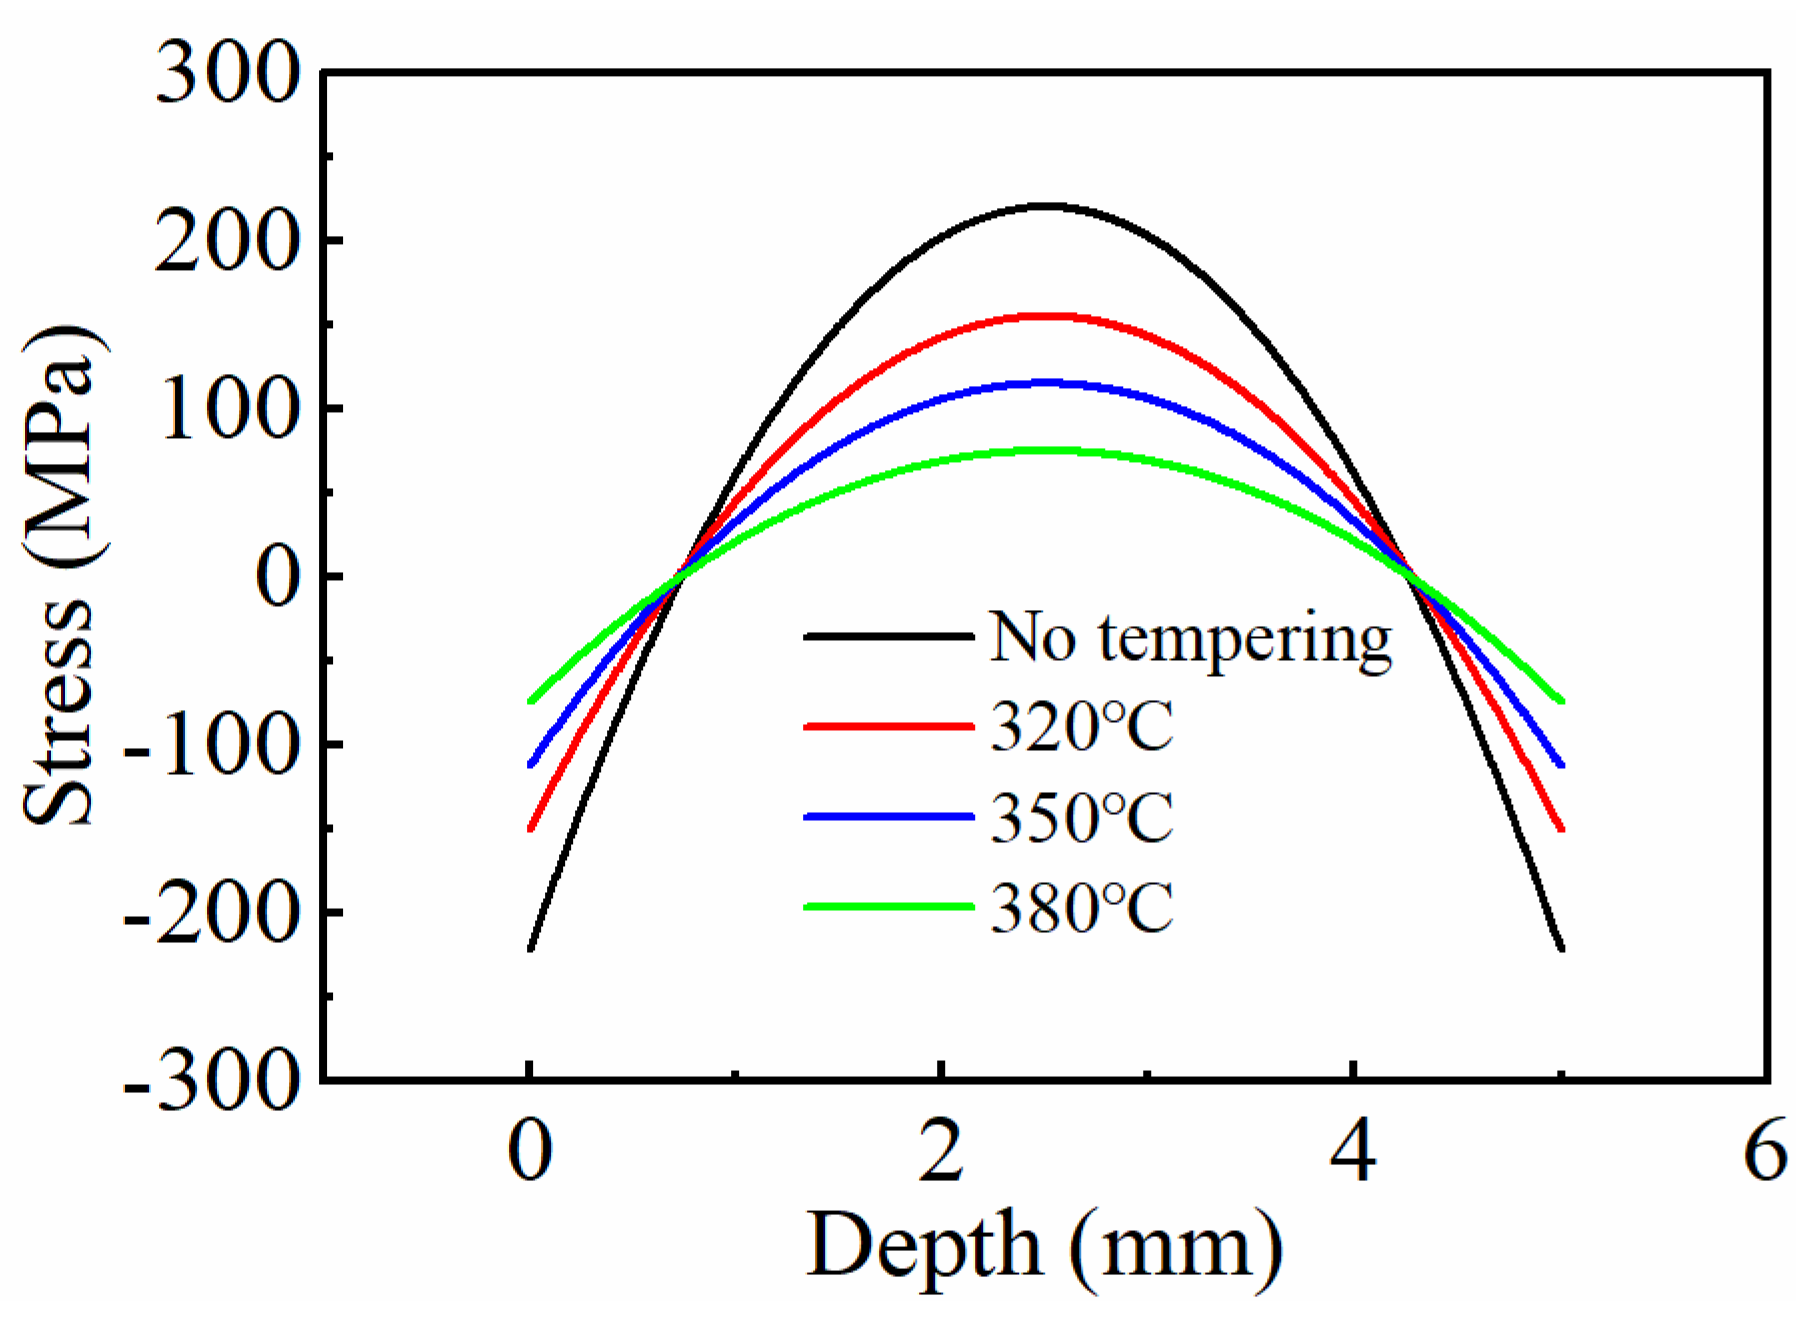
| Tempering Temperatures (°C) | No Tempering | 320 | 350 | 380 |
|---|---|---|---|---|
| Surface residual stresses (MPa) | −221 | −150 | −112 | −74 |
| Core residual stresses (MPa) | 220 | 154 | 114 | 74 |
Disclaimer/Publisher’s Note: The statements, opinions and data contained in all publications are solely those of the individual author(s) and contributor(s) and not of MDPI and/or the editor(s). MDPI and/or the editor(s) disclaim responsibility for any injury to people or property resulting from any ideas, methods, instructions or products referred to in the content. |
© 2025 by the authors. Licensee MDPI, Basel, Switzerland. This article is an open access article distributed under the terms and conditions of the Creative Commons Attribution (CC BY) license (https://creativecommons.org/licenses/by/4.0/).
Share and Cite
Cui, Y.; Yang, G. Process Optimization Simulation of Residual Stress in Martensitic Steel Considering Phase Transformation. Crystals 2025, 15, 330. https://doi.org/10.3390/cryst15040330
Cui Y, Yang G. Process Optimization Simulation of Residual Stress in Martensitic Steel Considering Phase Transformation. Crystals. 2025; 15(4):330. https://doi.org/10.3390/cryst15040330
Chicago/Turabian StyleCui, Yuzheng, and Guang Yang. 2025. "Process Optimization Simulation of Residual Stress in Martensitic Steel Considering Phase Transformation" Crystals 15, no. 4: 330. https://doi.org/10.3390/cryst15040330
APA StyleCui, Y., & Yang, G. (2025). Process Optimization Simulation of Residual Stress in Martensitic Steel Considering Phase Transformation. Crystals, 15(4), 330. https://doi.org/10.3390/cryst15040330