1. Introduction
Seamless steel pipe is widely used in the fields of vehicles, ships, oil, and machinery, especially for the oil mining industry, which is in great demand. At present, in the face of redulimited competition for oil resources on land, extreme cold regions, deep sea areas, and other special environmental mining is gradually popular. When seamless steel pipes transport oil and gas resources in special environments, due to the working environment, the steel pipes shrink, and the pipe wall is corroded in the low-temperature environment. In addition, when used in the underground, it will also be squeezed by forces in different directions. These special mining environments for the extraction of resources for the toughness of the oil well pipe requirements are also more stringent. The production process and the composition design of oil well pipes are also constantly adjusted to adapt to the special mining environment.
Nowadays, the main means of enhancing the toughness of oil well pipes is offline heat treatment and the addition of more alloying elements, but this invariably increases the energy and alloying costs [
1,
2]. The Thermal Mechanical Control Process (TMCP) cannot add too many alloying elements at the same time. The use of micro-alloyed steel, through rolling control, cooling control, and online heat treatment, results in an ultra-fine organization that further enhances the toughness of the steel pipe. Zhao et al.’s study confirms that the TMCP process modulation enhances the strengthening and refinement of steel materials [
3,
4]. At present, a new generation of TMCP technology represented by ultra-fast cooling has been maturely applied in the production of medium-thickness plates, bars, and hot-rolled plates and strips [
5,
6,
7,
8,
9]. However, the development and application of the TMCP process in the field of seamless steel pipe is still in its infancy due to the heterogeneous shape of the steel pipe, the internal hollow, and the complexity of the cooling conditions; the processing and deformation process is difficult to control. On the other hand, it is because of the complex hot forming of seamless steel pipe (piercing, continuous rolling, sizing (reducing) deformation) processing stage, through the control of rolling and the control of the cooling process, these complex deformations will be in the experimental steel deformation process to achieve the genetic and fine crystallization, deformation, and phase transformation of multiple synergistic reinforcing effects; the steel pipe’s toughness has been greatly enhanced. At present, the most used microalloying elements in TMCP steel are Nb, V, and Ti [
2,
10,
11]; the research object of this paper, 30MnNbRE, contains two microalloying elements, Nb and RE. Nb is the preferred microalloying element for TMCP high-strength steels, and the strain-induced precipitates of Nb not only realize strain accumulation but also have a significant role in fine grain strengthening in addition to the trace amount of RE elements in the steel to realize the metamorphic inclusions, refine the organization, and enhance the steel toughness method.
Rare earth elements have a special position in the periodic table, belonging to the 17 lanthanide elements; due to the similar atomic radius and ionic structure, the physical and chemical properties of rare earth elements are also very similar [
12,
13]. La and Ce are representatives of the rare earth elements, of which Ce is chemically active. The addition of Ce in the steel will be generated with the matrix with a relatively low Ce
2O
3, CeAlO
3, and other compounds. Ce in the solidification process of steel can be used as an effective inhomogeneous nucleation point to create conditions for grain refinement [
14]. The compounds generated after the addition of La to steel can also provide nucleation points, and these compounds will be biased at grain boundaries, inducing local distortion and hindering grain boundary migration. Some scholars have reported that the addition of appropriate amounts of rare earth elements to steel can improve its microstructure and enhance the effect of strong toughness and corrosion resistance [
12,
14]. Considering that the addition of rare earth Ce can refine the grain, on the basis of the original 30MnNbRE, the 30MnNbRE doped with trace amounts of Ce by characterizing the material properties to determine the optimal composition application considerations for application to practical production.
The continuous cooling curve of supercooled austenite is the temperature-time relationship between the transformation of supercooled austenite to other tissues under continuous cooling conditions for austenite that is about to undergo transformation at the critical transformation temperature. In practice, CCT diagrams are an important basis for optimizing the heat treatment process to obtain the desired organization and properties [
15]; they are widely used to set up different heat treatments and to predict the resulting microstructure and mechanical properties [
16,
17,
18,
19,
20,
21], and play an important role in guiding the development of low-carbon steels in practical production. The static CCT curve can be used to analyze the microstructure and properties of supercooled austenite under continuous cooling conditions and can be used to formulate heat treatment process routes. The dynamic CCT curve describes the microstructure transformation of steel during continuous cooling after thermal deformation, which is an important basis for formulating the rolling process and cooling process. In this paper, the static and dynamic CCT diagrams of 30MnNbRE steel are combined to formulate a reasonable thermal processing process to obtain the martensitic structure and required mechanical properties of the ideal 30MnNbRE steel. To determine the CCT curve of a material, it is necessary to measure the temperatures of the phase transition points on the temperature-expansion curve at different cooling rates. Currently, there are three methods to determine the temperature of the phase transition point on the CCT curve: vertex method, average method, and tangent method, among which the vertex method and average method are simple to operate, but there will be a large error with the real data. At present, there are three methods to determine the temperature at the phase change point: vertex method, average method, and tangent method, among which the vertex method and average method are simple to operate, but there will be a large error with the real experimental data. Due to the structure and specific capacity of different organizations of different types of steel, materials in the occurrence of solid-state phase change are often accompanied by discontinuous changes in volume, resulting in a thermal expansion curve in the phase change at the point of inflection, the tangent method is to make a tangent at this point of inflection, the tangent line and the curve of the separation point is the temperature of the phase change point.
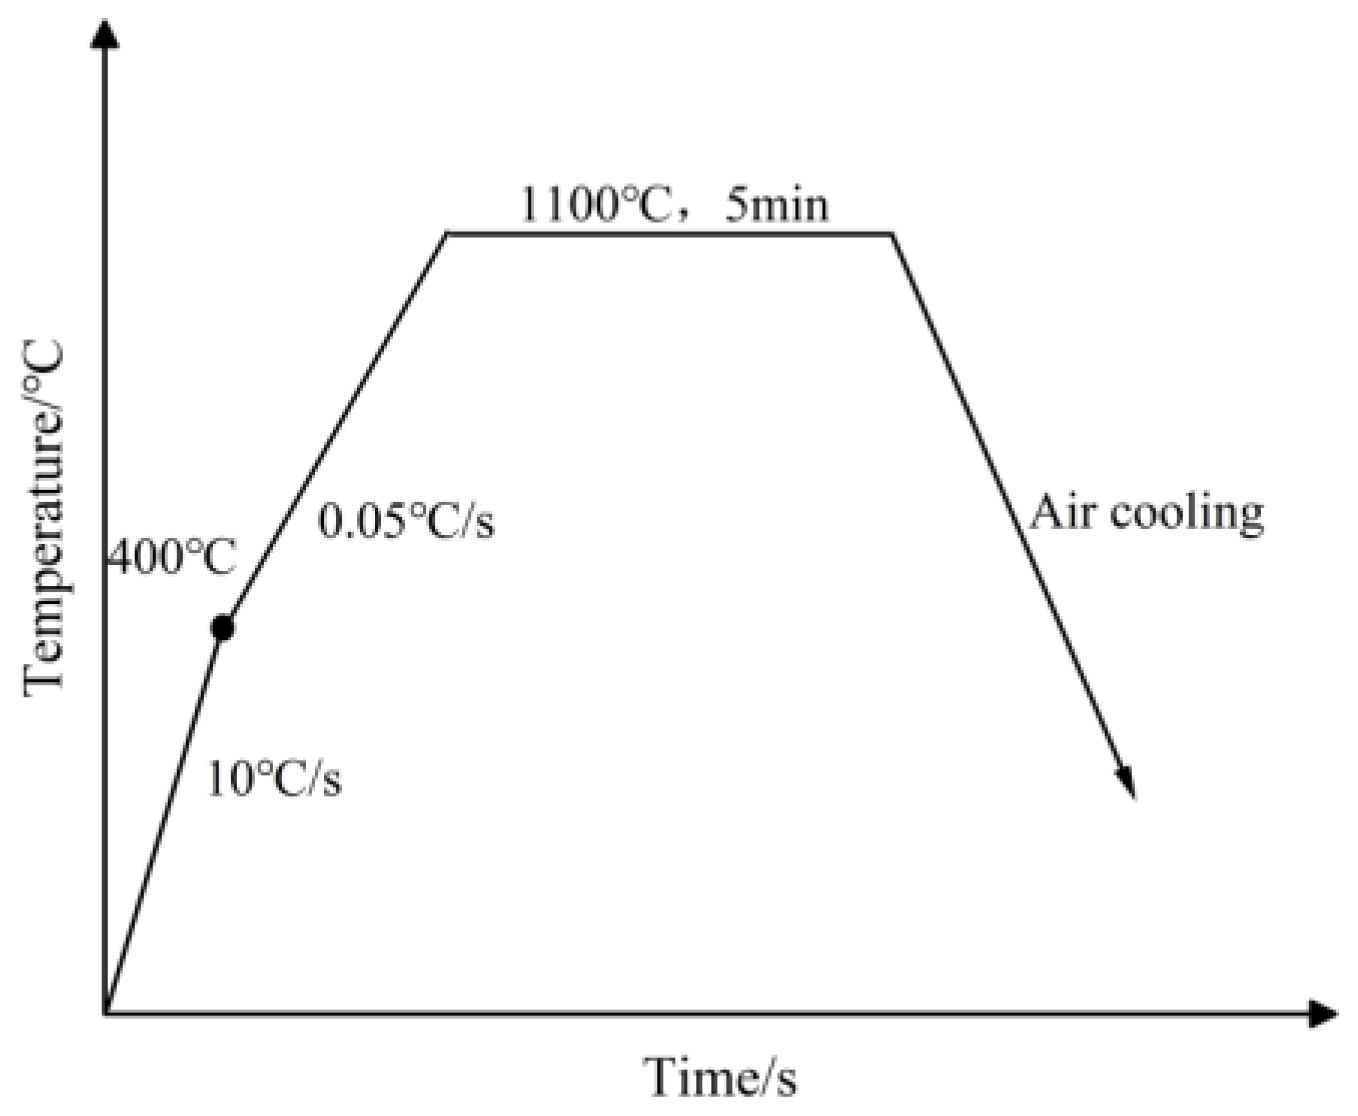
In order to further improve the toughness of 30MnNbRE steel for oil well tubing, we decided to investigate the continuous cooling phase transition behavior of 30MnNbRE steel doped with trace Ce. The addition of trace Ce combined with the CCT curve to develop a reasonable TMCP process for 30MnNbRE steel ensures that more martensitic organization and enhanced toughness can be obtained while also saving alloy and energy costs. In this study, the static and dynamic CCT curves of 30MnNbRE steel with dled austenite transformation law were observed in combination with the microstructure. By designing different sizing (reducing) deformation temperatures, the effects of different trace amounts of Ce on the trend of mechanical properties of 30MnNbRE steel at different deformation temperatures were investigated. Finally, the mechanism of the influence of Ce on the microstructure evolution and microhardness of 30MnNbRE steel is further discussed and analyzed. On this basis, it further provides a realistic theoretical reference basis for the design of oil well pipe steel composition and the optimization of controlled rolling and controlled cooling process parameters.
3. Results and Discussion
3.1. Critical Point and Ms Point
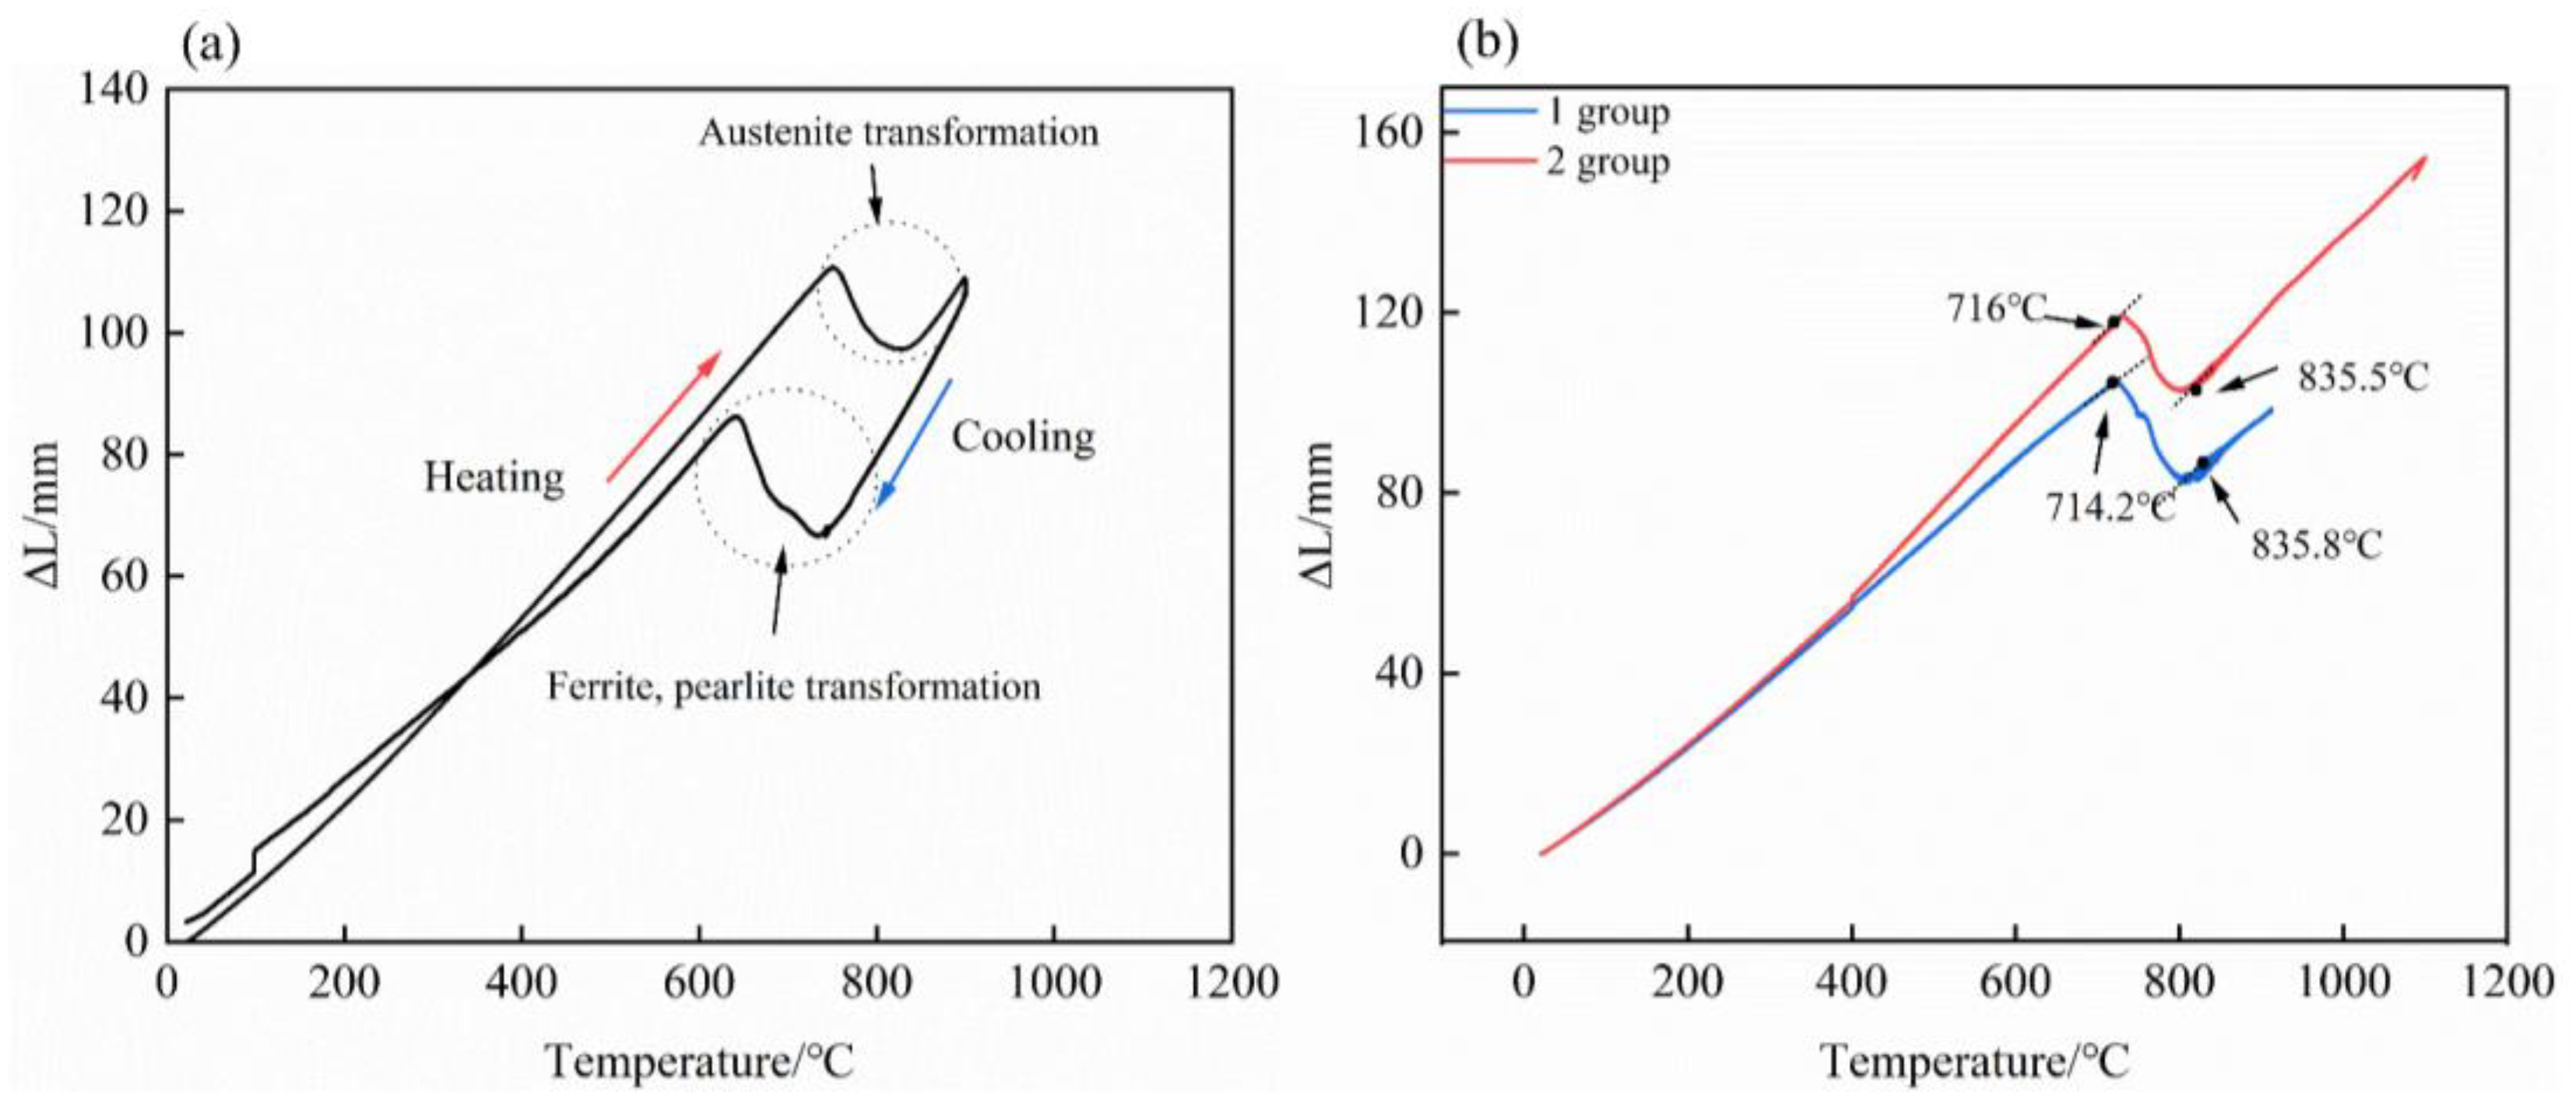
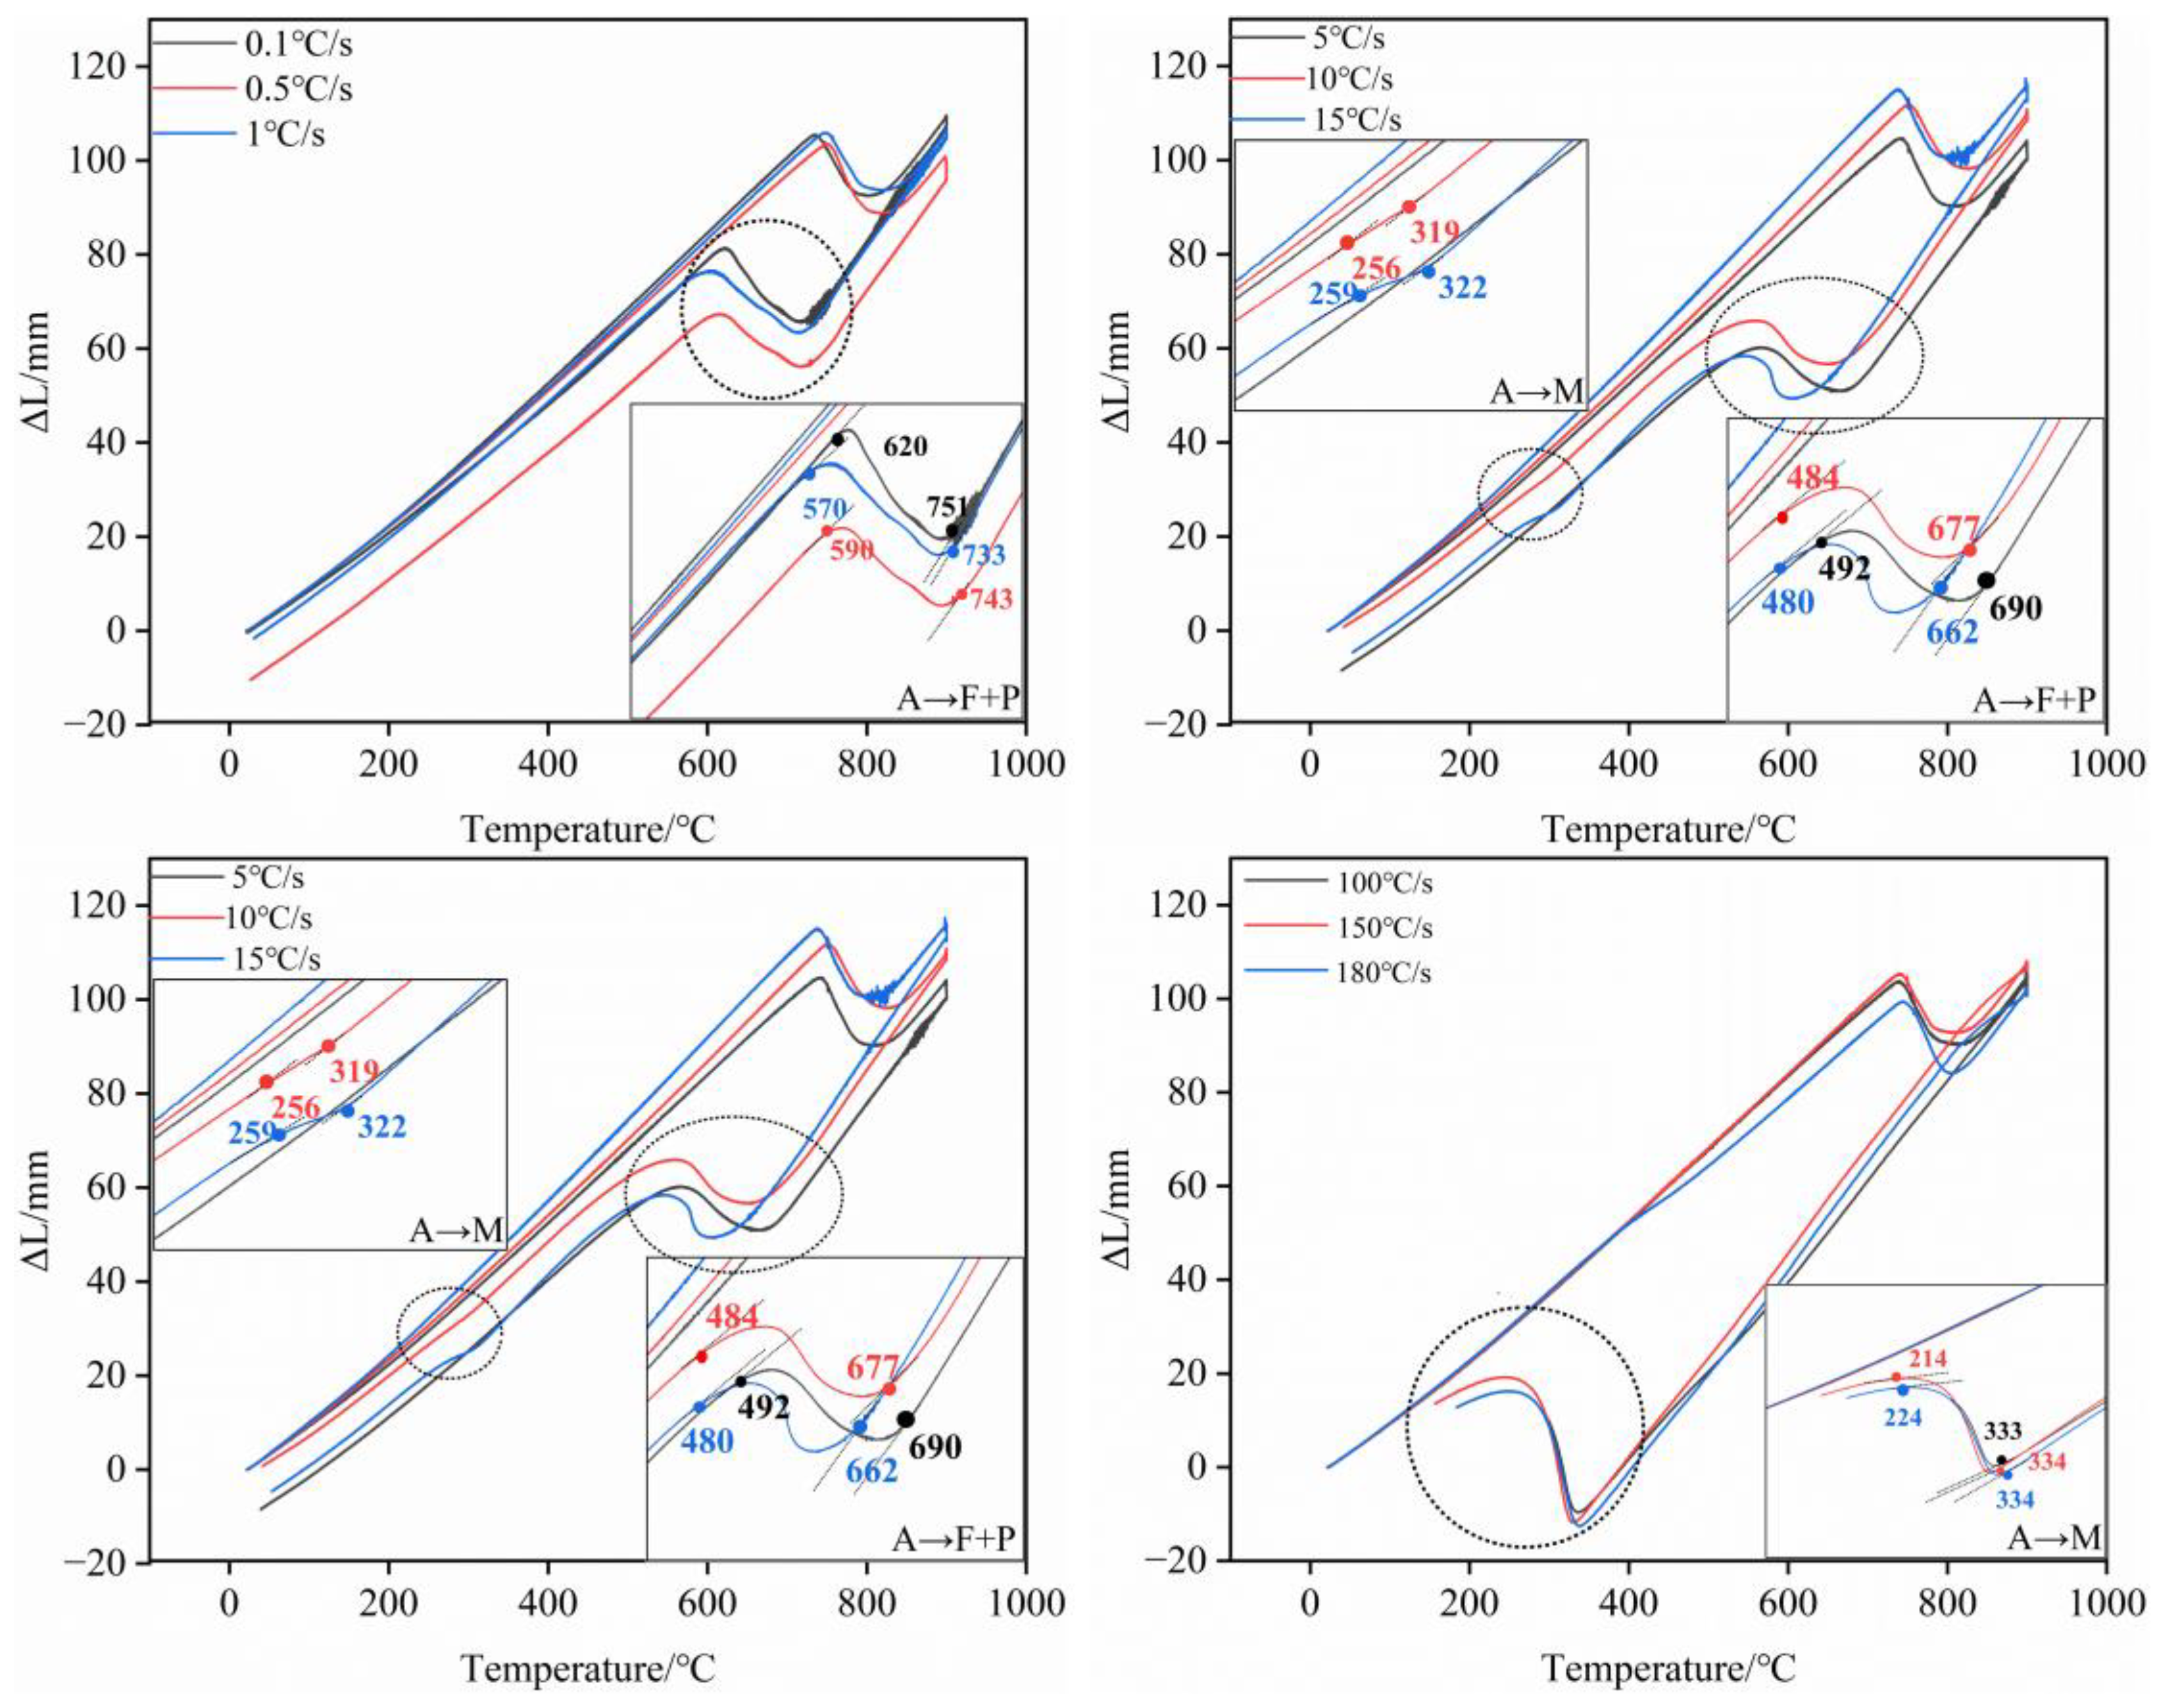
In this study, the temperature-expansion curve is drawn by expansion analysis. The tangent method is used to determine the phase transition temperature in the region where it occurs [
19]. Ac1 = 715.1 °C and Ac3 = 835.7 °C are measured after repeating the two sets of experiments, and the determination of the critical point is beneficial for the formulation of the subsequent cooling process. The Ms point is taken as the average of the temperature-expansion curves of the temperatures of 150 °C/s and 180 °C/s. The temperature-expansion curves are shown in
Figure 5a below, which is an example of the temperature expansion curve at 0.5 °C/s cooling to room temperature.
Figure 5a below is the temperature-expansion curve of 0.5 °C/s cooling to room temperature; for example, the whole temperature-expansion curve, such as the change of the schematic diagram,
Figure 5b, is the determination of the Ac1 and Ac3 phase change point of the temperature-expansion curve.
In addition, the critical phase transition point and Ms point of 0 Ce and 0.03 Ce experimental steels were determined in this experiment; the complete experimental records are in
Table 2. In the following table, it can be seen that the addition of the rare earth element Ce has a greater effect on the phase transition temperature. 0 Ce steel Ac1 temperature of 706 °C, 0.01 Ce and 0.03 Ce experimental steel Ac1 were 715.1 °C and 740 °C, respectively; here, the Ce additive content of the impact of the Ac1 is more pronounced, and the temperature of Ac1 is also accompanied by an increase in the content of Ce. For Ac3, it can be observed that only when the Ce content reaches a certain range, the temperature of Ac3 significantly improves, and the magnitude of the change is smaller compared to Ac1. Since the radius of Ce atoms is larger than that of Fe atoms [
22], and Ce enriched at the grain boundaries will hinder the diffusion of C, which leads to the completion of the transformation occurring at higher temperatures needed to increase the driving force of the phase transition, the temperature of Ac1 and Ac3 is increased.
From the above table, it can be seen that Ce significantly reduces the location of the Ms point, and summarizing the data, it can be seen that the reduction of the three different Ce contents of the material is about 11 °C. The reason for this phenomenon is that Ce content up to a certain value will reduce the interfacial energy bias at grain boundaries, improve the stability of the supercooled austenite, and increase the resistance to the transformation of austenite to the low-temperature organization. The larger the cooling rate, the larger the degree of subcooling [
23,
24]; in this case, to further complete the martensitic transformation, it must require a greater driving force and a larger degree of subcooling to complete the transformation to the low-temperature organization. Therefore, considering Ac1, Ac3, and Ms points, the continuous cooling curves of the experimental steel with 0.011% Ce content are analyzed in the following section.
3.2. Temperature-Expansion Curves of Each Specimen Under Different Cooling Rates
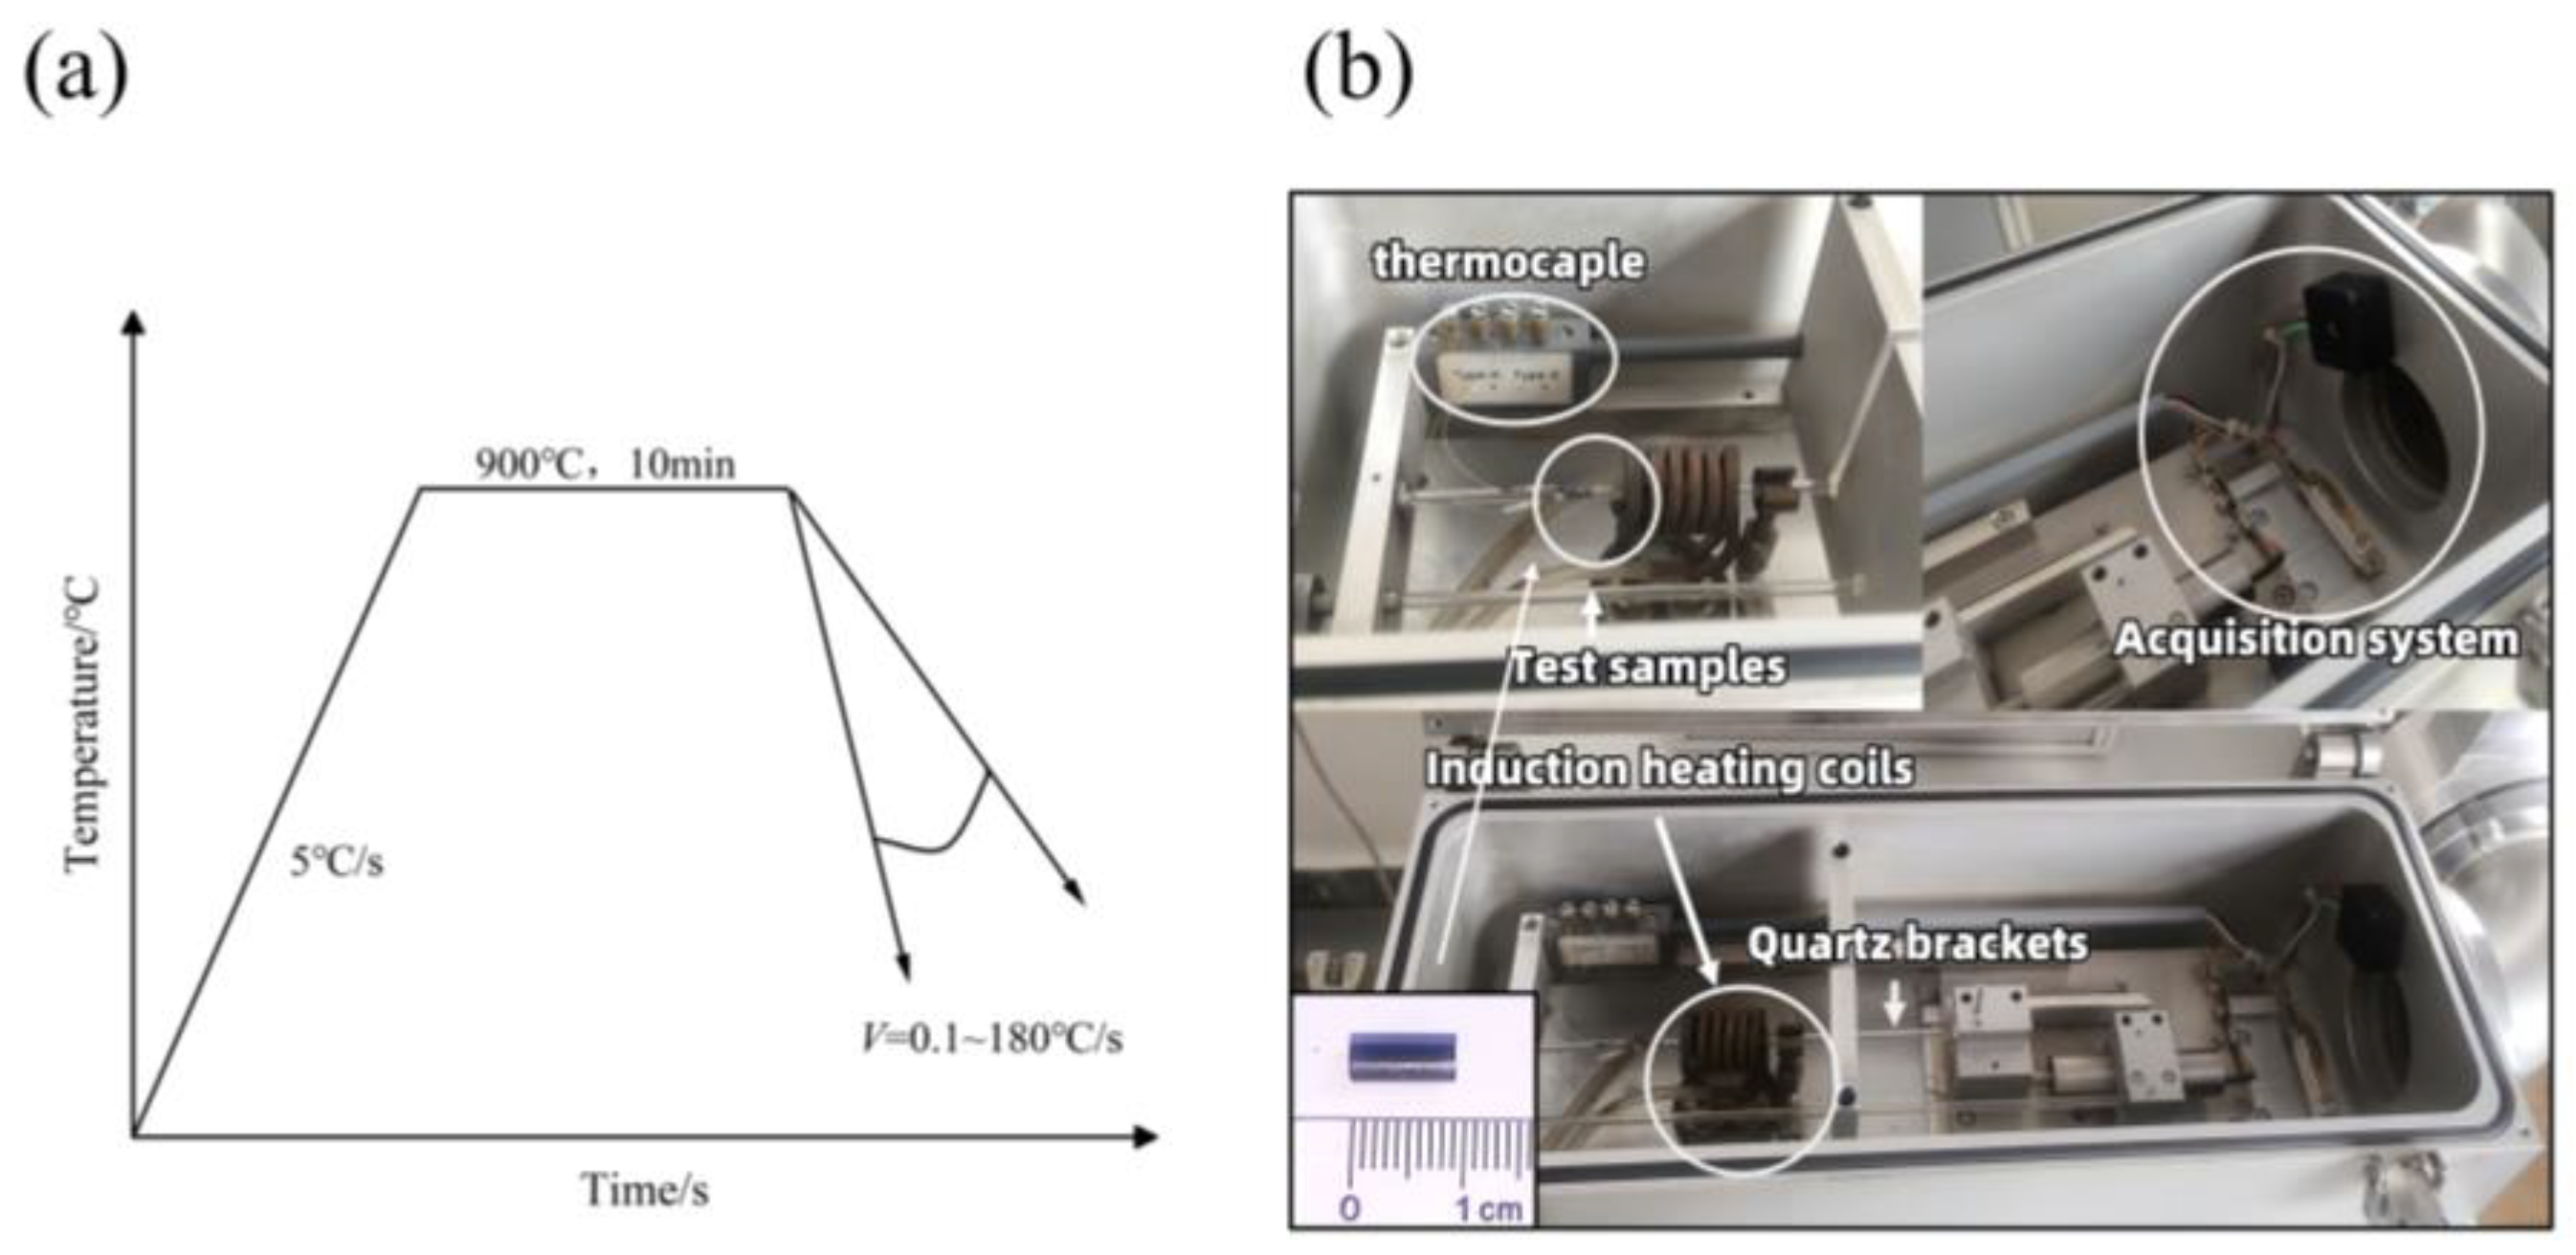
Determination of the austenite transition temperature plays an important role in plotting continuous cooling curves for the experimental steels [
20]. Twelve different cooling rates are selected in
Figure 6 below to determine further the temperature-expansion curves at the point of phase transition.
When austenite begins to undergo ferrite or martensite phase transformation, the crystal structure changes from a face-centered cubic structure to a body-centered cubic structure; therefore, the point in the expansion curve that deviates from the straight line corresponds to the onset temperature of the phase transformation. From
Figure 6, it can be observed that the austenite transformation occurs at high temperatures when the cooling rate is in the range of 0.1–1 °C/s for slow cooling. Combined with the microstructure and Vickers hardness judgment, the expansion curve at this time presents a stage of phase transformation that occurs; this stage occurs in the high-temperature ferrite and pearlite phase transformation. With a further increase in cooling rate to 5–10 °C/s, ferrite, pearlite, and bainite transformation occurs. The cooling rate was in the range of rapid cooling (15–50 °C/s) when the two-stage phase transformation of the bainite plus martensite phase transformation occurred. When the cooling rate is within the range of ultra-fast cooling (100–180 °C/s), a complete martensitic phase transformation occurs within this cooling range.
A comparison of SEM images of grain organization at different cooling rates shows that increasing the cooling rate can refine the grain size. The corresponding martensite slat widths of 0.88, 0.8, 0.73, and 0.63 μm were measured at 50, 100, 150, and 180 °C/s cooling rates, respectively, using Nano Measurer2.0 grain measurement software.
3.3. Microstructure and Microhardness Analysis
Figure 7 shows the SEM structure of 0.01 Ce experimental steel at different cooling rates. As can be seen from
Figure 7, the original organization of the specimen is mainly composed of ferrite and pearlite, and the distribution of ferrite grains is not uniform, which is mainly related to the internal composition of the specimen segregation. When the specimen is austenitized, this phenomenon of uneven grain distribution will be significantly improved.
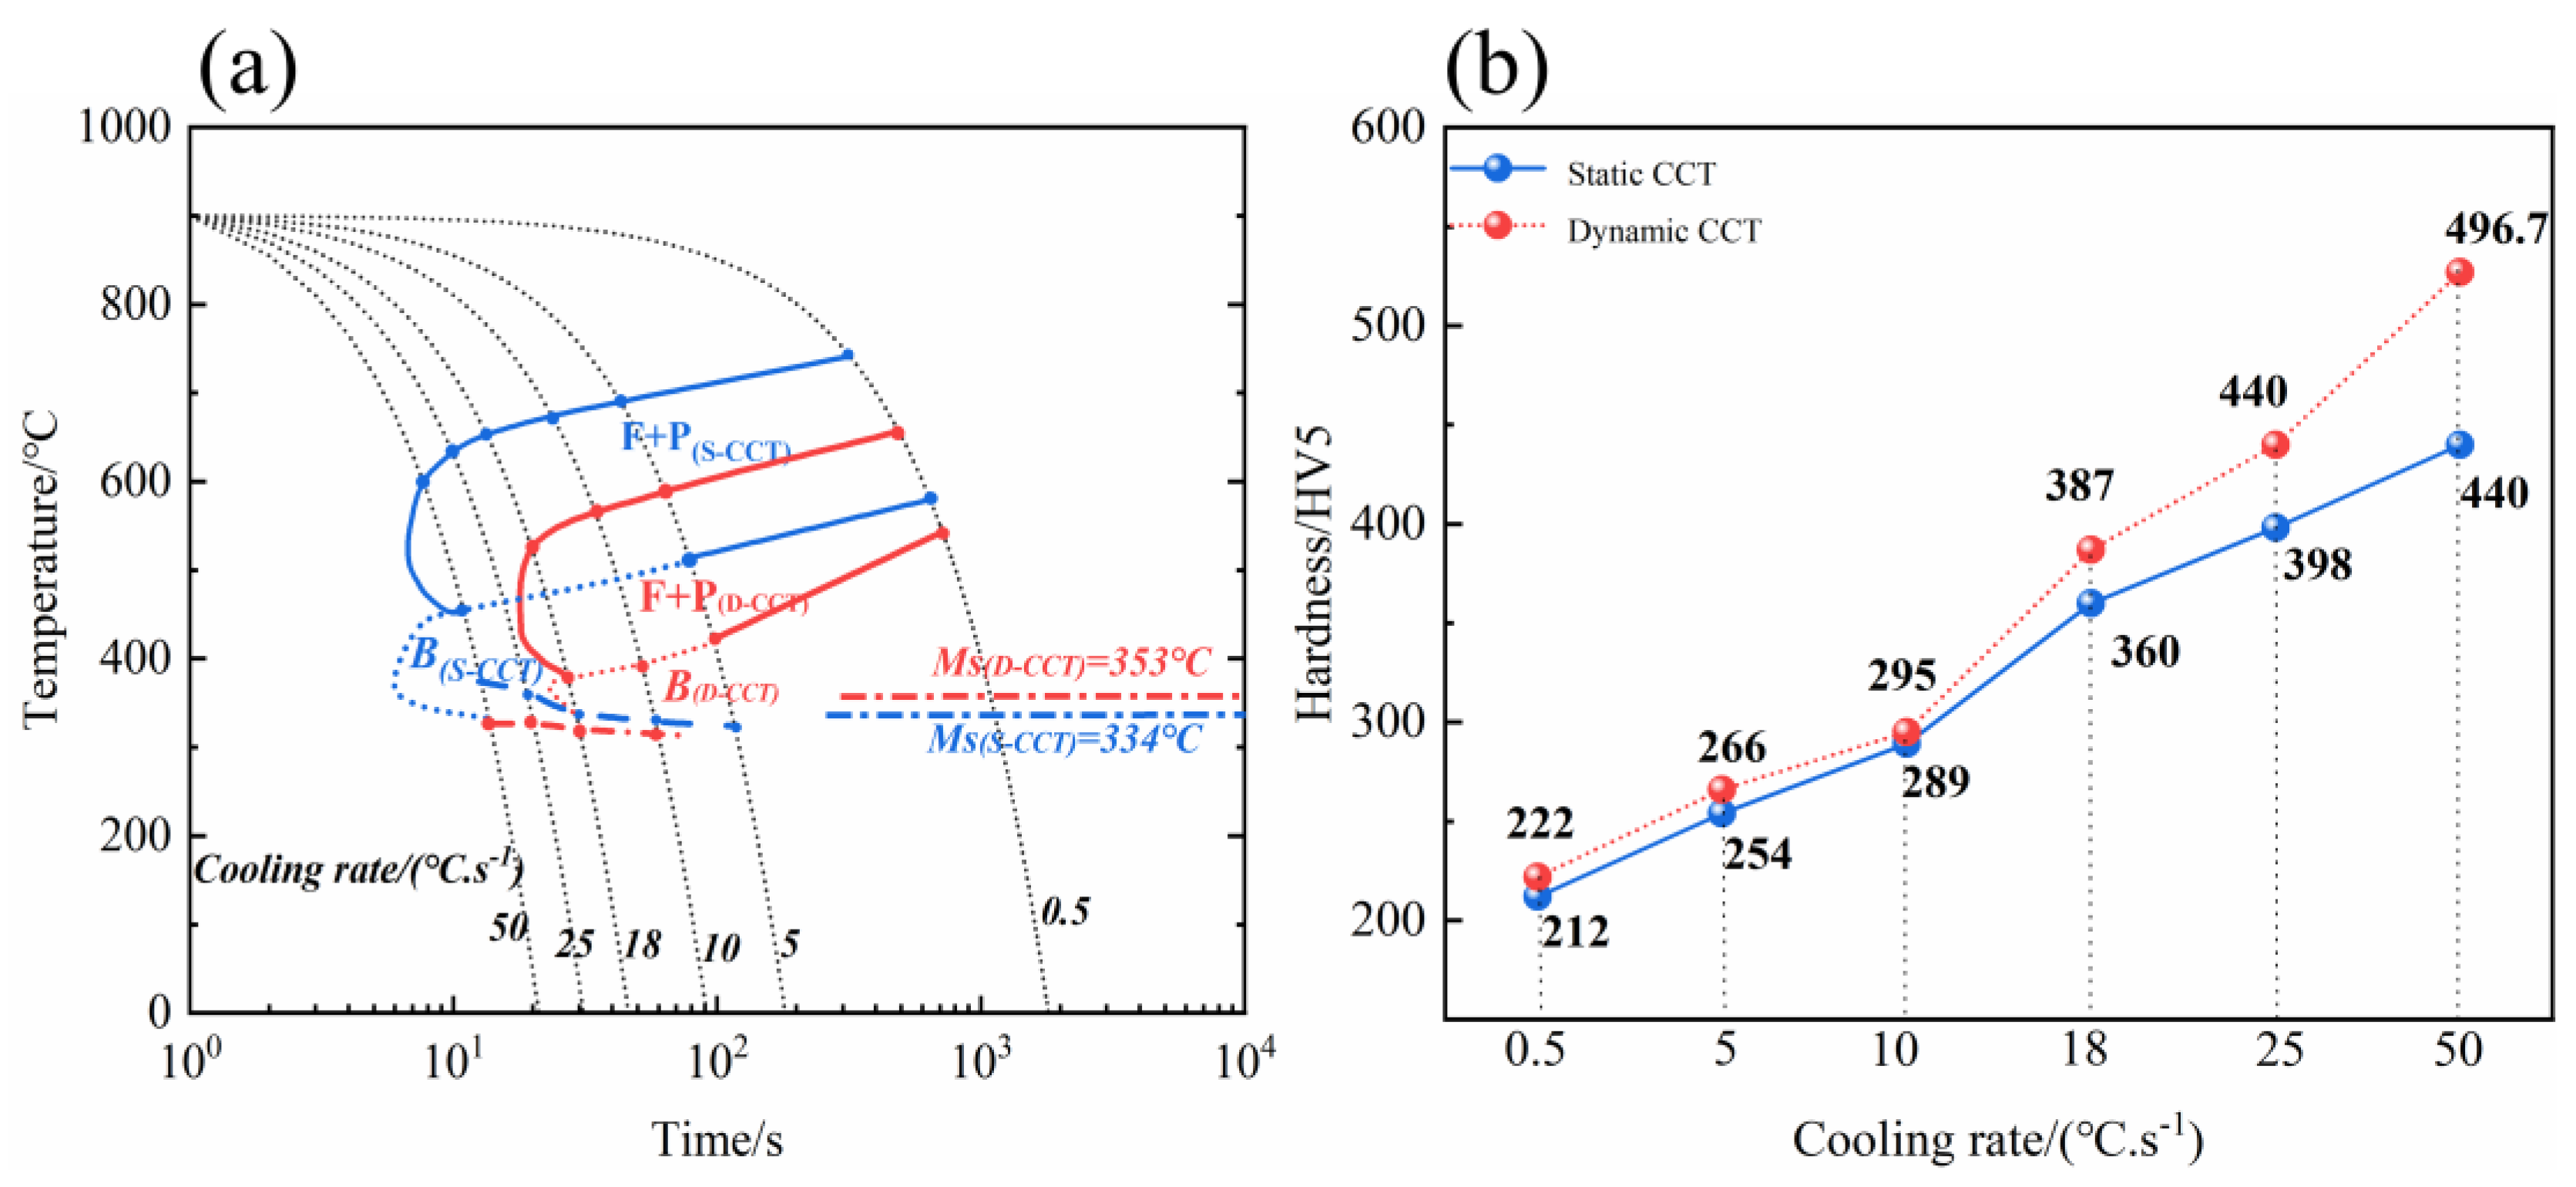
The continuous cooling transformation curve of subcooled austenite can be divided into three parts based on the phase transformation products. The high-temperature transformation region is the transformation of austenite to ferrite and pearlite, the medium-temperature transformation region is the transformation of austenite to bainite, and the low-temperature transformation region refers to the transformation of austenite to martensite. When the cooling rate is 0.5 °C/s below, the specimen room temperature organization is composed of ferrite and pearlite; when the cooling rate is 1 °C/s, the organization of the appearance of bainite waits until the cooling rate increases to 15 °C/s rapid cooling, and the organization begins to appear in the martensite organization, and with the increase in the cooling rate, the number of martensite increases, and the number of bainite organizations decreases; when the cooling rate reaches ultra-fast cooling at 100 °C/s and above, this is only a single martensitic transformation. On the other hand, the addition of rare earth elements (Ce) to the ultra-fast cooling will also promote the formation of martensite organizations. This is because the addition of Ce promotes the solid solution of Nb in the experimental steel, and the solid solution of Nb enhances the stability of austenite, which, in turn, improves the hardenability of the experimental steel and makes it easier to form martensite.
Table 3 and
Table 4 show the organization of the three experimental steels and their corresponding microhardnesses at 12 different cooling rates. From the statistical results, it can be seen that the microhardness increases with increasing cooling rate, and the temperature at which the supercooled austenite transformation begins decreases gradually. The increase in microhardness is mainly related to the organization of the specimen, and the increase in microhardness of the steel is further driven by the refinement of the martensitic slats. The microstructure at cooling rates of 10 °C/s and higher shows an increase in the amount of bainite and martensite in the organization, with a gradual decrease in the amount of softer ferrite in the specimen. When the cooling rate reaches the ultra-fast cooling of 50 °C/s after the organization is almost entirely composed of martensite organization, the microhardness tendency to increase gradually remains stable.
3.4. CCT Curve Analysis of 30MnNbRE
As can be seen from
Figure 8, the ferrite + pearlite transformation region, the bainite transformation region, and the martensite transformation region exist on the CCT curve of 0.01 Ce experimental steel. The comprehensive analysis of the room temperature microstructure of the experimental steel under different cooling conditions shows that the sequence of tissue evolution of the experimental steel during continuous cooling is ferrite → pearlite → bainite → martensite.
Only ferrite and pearlite transformations occur in the high-temperature transformation zone, bainite transformation dominates in the medium-temperature zone, and martensite transformation mainly occurs in the low-temperature zone. However, a small amount of bainite transformation also occurs when the cooling rate is low, mainly because the Cr and Mo carbide-forming elements in the experimental steel can inhibit the decomposition and diffusion of austenite and increase the gestation time of supercooled austenite [
25,
26,
27], thus delaying the transformation of ferrite and bainite so that the ferrite transformation is shifted to the high-temperature zone and the bainite transformation is shifted to the intermediate-temperature zone.
On the other hand, it is because the rare earth element Ce attenuates the ability of the primary austenite to release carbon during the bainite transformation process. Ce provides favorable conditions for bainite nucleation in the carbon-poor zone by impeding the diffusion of other atoms and increasing the rich-poor side gaps where the carbon concentration fluctuates within the primary austenite grains [
28]. Ce promotes the transformation of austenite to bainite and shifts the ferrite-pearlite phase transition zone to the right.
The dynamic CCT experiment and the static CCT experiment data processing methods are the same.
Figure 9 shows the continuous cooling curves of supercooled austenite at the same cooling rate for the dynamic CCT experiment and the static CCT experiment, with the solid part being the dynamic CCT curve and the dashed part being the static CCT curve. Comparing the Ms points of the two sets of experiments, it is observed that there exists a deformation amount of the dynamic CCT curve whose Ms point position is higher. This is because, with the further increase of the cooling rate, the atomic diffusion rate in the matrix is reduced, but because the grain undergoes deformation, which leads to the deformation process in the location near the grain boundary having a higher deformation storage energy, it is easy to become the location of martensitic phase transformation. In the cooling rate, the application of appropriate deformation is conducive to the occurrence of martensitic phase transformation.
The reason for the increase in the temperature at the beginning of the bainite phase transition point in the dynamic CCT curve is the presence of precipitates at the grain boundaries and inside the grains of the experimental steel. The microhardness of the experimental steel increases due to the deformation of the grains in the organization by external factors, which increases the strength and dislocation density of the supercooled austenite. On the other hand, plastic deformation promotes the diffusion and lattice reorganization of C and Fe atoms, which facilitates the deformation-induced precipitation of microalloying elements. These precipitates present provide nucleation points for the bainite phase transformation, and the bainite transformation time is advanced.
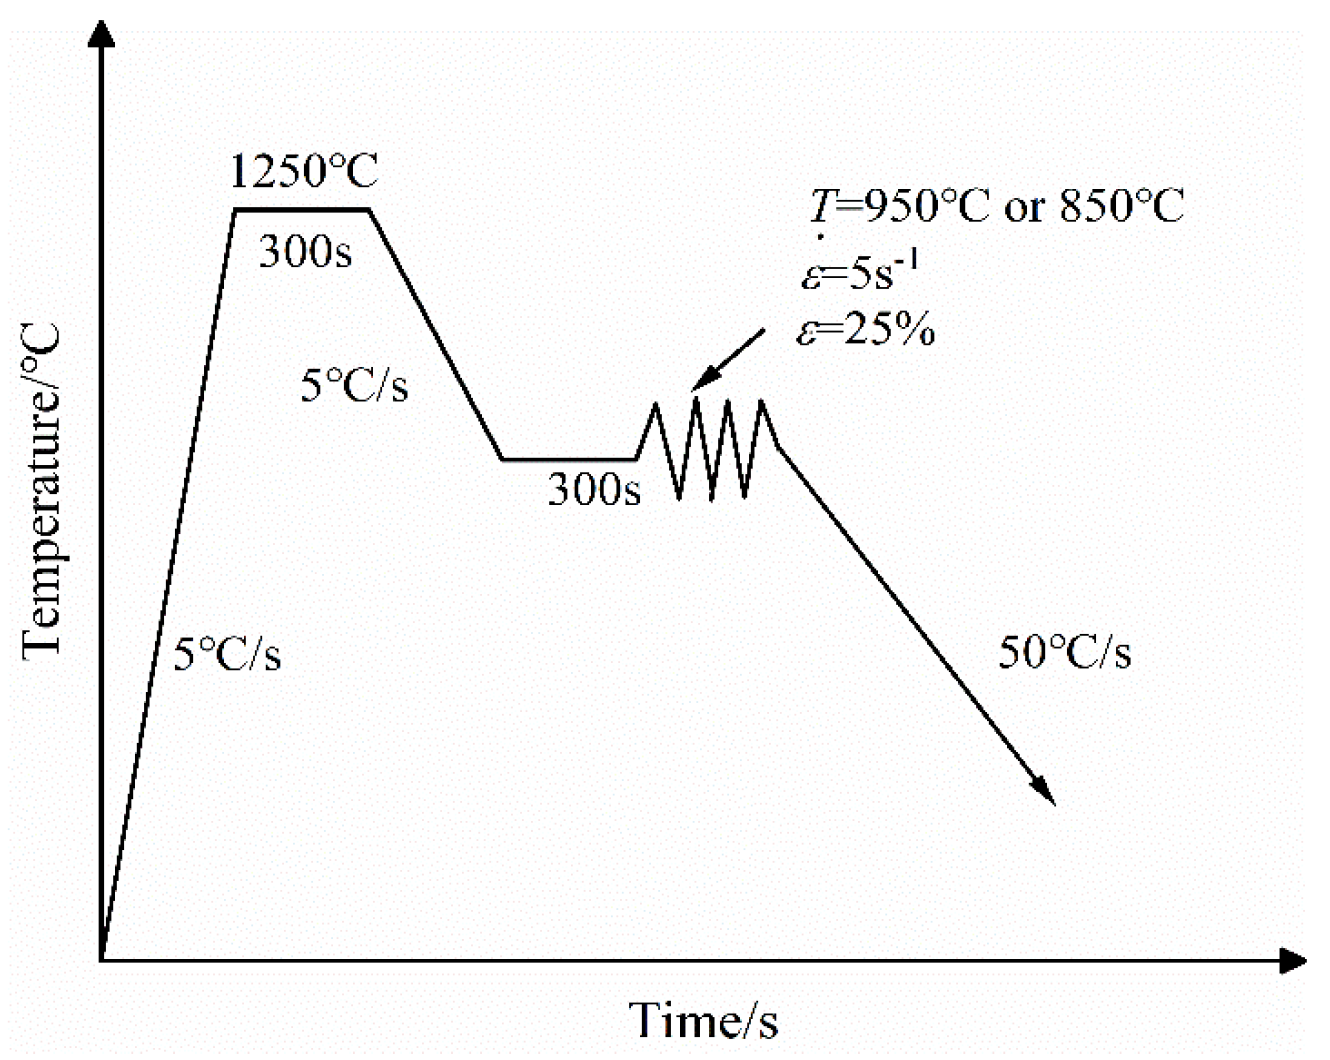
3.5. Microstructure and Microhardness Analysis Under Different Sizing (Reducing) Deformation Temperatures
Figure 10 shows the SEM histograms of the three compositions of experimental steels cooled to room temperature at 50 °C/s when the sizing (reducing) deformation temperatures were 850 °C and 950 °C, respectively. From the figure, it can be seen that the microstructure of the 0 Ce experimental steel is mainly composed of granular bainite, a small amount of slate martensite, and massive MA islands after the 850 °C sizing (reducing) deformation. Compared with the 0 Ce experimental steel, the martensite content of the two experimental steels containing Ce is significantly higher than that of the experimental steel without added Ce, except for a small amount of MA islands and GB in 0.01 Ce and 0.03 Ce. Under the same cooling conditions, a comparative analysis of the microstructure of the two deformation temperatures of 950 °C and 850 °C cooled to room temperature can show that reducing the deformation temperature is conducive to the formation of bainite organization, the bainite phase transition zone is expanded, and the martensite phase transition is hindered.
When the sizing (reducing) deformation temperature is taken as 850 °C, the experimental steel is deformed in the austenite unrecrystallized zone. The deformation of austenite can increase the interfacial area per unit volume of austenite, introduce subdeformed structures within the grain, and act as nucleation points within the grain at deformation zones or cell boundaries. These defects and the increase in stored energy can provide favorable conditions for the nucleation of bainite, which can increase the bainite phase transition temperature with a leftward shift of the phase transition zone. The reason for the delay in martensitic phase transformation is twofold: on the one hand, the phase transformation driving force decreases with decreasing deformation temperature, and on the other hand, the reason is because of the effect of expanding the bainite phase transformation zone in the experimental steels, which delays the onset of the martensitic phase transformation.
Figure 11 shows the statistical microhardness changes of 0.01 Ce experimental steel after cooling to room temperature at 50 °C/s at sizing (reducing) deformation temperatures of 950 °C and 850 °C, respectively. Comparing the microhardness values of the two different deformation temperatures in the figure, combined with the above analysis, it is found that the experimental steel is more favorable for martensitic slat formation, and the microhardness value of the experimental steel is higher under the condition of ultra-fast cooling to room temperature after sizing (reducing) diameter deformation at 950 °C. The reason for the highest microhardness of 0.01 Ce experimental steel in
Figure 11 is that after cooling 0.03 Ce and 0.01 Ce to room temperature at 50 °C/s, on the one hand, 0.03 Ce steel is doped with more trace amounts of Ce compared with 0.01 Ce steel, resulting in the formation of a larger bainite zone after cooling, which leads to the expansion of martensitic zone is impeded; on the other hand, a larger amount of Ce in 0.03 Ce steel would form, more Ce in 0.03 Ce steel will form inclusions about Ce leading to a decrease in the microhardness of the experimental steel. 0.03 Ce and 0 Ce are both cooled to room temperature at 50 °C/s; due to the absence of Ce in the 0 Ce steel, which cannot be used to refine the grain size through the Ce, the microhardness of the experimental steel of 0.03 Ce is greater than that of the 0 Ce steel.
3.6. Effect of Different Cooling Rates and Ce Content on Grain Size
In the dynamic CCT experiments, the martensitic slat widths of the three steels were 0.92 μm, 0.81 μm, and 0.83 μm for 0 Ce, 0.01 Ce, and 0.03 Ce, respectively, after deformation and cooling to room temperature by 50 °C at a sizing (reduction) temperature of 950 °C. This indicates that Ce doping in steel produces a grain refining effect on the ferrite grains and martensite slat bodies. In the static CCT experiment, the ferrite grain size decreased from 5.12 μm to 1.02 μm when the cooling rate was increased from 0.1 °C/s to 25 °C/s. Similarly, the martensitic slat width was refined from 0.95 μm to 0.63 μm when the cooling rate was increased from 10 °C/s to 180 °C/s. This is because the subcooling degree increased with the larger cooling rate. This is because as the cooling rate increases, the degree of subcooling also increases. The larger subcooling degree leads to a gradual decrease in the phase transition temperature and an increase in the diffusion capacity of the elements, thus inducing grain refinement. The ferrite grain size and martensite slat width were refined with the increase in cooling rate.


