1. Introduction
GaN-based electronic and optoelectronic devices are predominantly fabricated on foreign substrates such as sapphire, silicon carbide, and silicon. Substrate selection has traditionally prioritized large surface areas and affordability, often at the expense of structural quality and threading dislocation density (TDD). However, lattice and thermal expansion mismatches between GaN and these foreign substrates, combined with the inherent difficulties in depositing high-quality GaN epitaxial layers, result in elevated TDD within the epitaxial structures. This, in turn, increases manufacturing costs and degrades device performance.
In contrast, GaN-on-GaN technology, which utilizes native GaN substrates, offers significant advantages. Devices constructed on native substrates demonstrate markedly lower TDD, are easier to manufacture, and exhibit enhanced performance [
1,
2,
3]. Despite these benefits, the widespread adoption of GaN-on-GaN technology is hindered by the limited availability and small size of high-quality GaN substrates. Currently, substrates with superior structural quality, characterized by low TDD and the Borrmann effect, are limited to a maximum diameter of 2 inches [
4].
The highest structural quality of GaN crystals is obtained using the basic ammonothermal method [
5,
6]. The process operates as follows: polycrystalline GaN, serving as the feedstock, is dissolved in supercritical NH
3 in one zone of the autoclave. The dissolved material is then transported to a second zone, where the solution becomes supersaturated, resulting in the crystallization of GaN on native seeds. A carefully maintained temperature gradient between the dissolution and crystallization zones facilitates the convection-driven transport of dissolved material.
To enhance the solubility of GaN, mineralizers are added to the NH
3. The highest structural-quality GaN crystals are achieved using the basic ammonothermal method, where basic sodium amide (NaNH
2) serves as the mineralizer [
7,
8]. This crystallization process is carried out in autoclaves with an inner diameter of 100 mm and a height of 2 m, at temperatures ranging from 400 °C to 600 °C and NH
3 pressures of up to 400 MPa.
One of the fundamental challenges in ammonothermal crystallization is understanding the processes occurring in the crystal growth zone. Due to the use of high pressures, large volumes, and a highly corrosive environment, observing the growth process in situ is not feasible in most cases. High difficulty of in situ measurement is caused by supercritical ammonia with mineralizers, which limits the use of installation and autoclave materials to very small groups [
9]. It should be noted that some in situ observations were conducted using laboratory-scale autoclaves with small internal diameters [
10,
11]. Consequently, computer simulations are used to predict the flow of NH
3 from the feedstock zone to the crystallization zone, based on the temperature distribution measured at the outer walls of the autoclave [
12,
13]. In the case that inner wall temperatures are boundary condition, they are usually computed. Recently, Schimmel et al. [
14] provided an insightful summary of the current state, challenges, and prospects in ammonothermal numerical simulations.
Lately, authors calculated the convective flow of NH
3 in an ammonothermal autoclave [
15]. The same working autoclave was modeled, but in this work, crystal seeds are included, and the domain is reduced only to growth zone. The study specifically examined the flow dynamics within the growth zone of the autoclave during the crystallization process. The computational findings demonstrated strong alignment with experimental observations, particularly in terms of the growth rate (thickness) and the structural quality of the crystallized ammonothermal GaN (Am-GaN).
In this research, we further investigate the convective flow of NH
3 during a typical basic ammonothermal crystallization process, with particular emphasis on the influence of GaN crystal growth on NH
3 flow behavior. The study focuses on crystals reaching an average thickness of up to 3 mm. An increase in crystal thickness was shown to affect flow patterns [
16,
17]. In the authors’ opinion, since the optimization of the growth process is very important for crystals’ structural quality, and the industrial application of GaN and the comparison of computational to experimental results was possible, the presented research is very important for autoclave and technology development. There is also a lack of data presenting comparisons of 3D big scale autoclaves (inner diameter above 100 mm) simulation to experimental results. This work is crucial for designing innovative growth zone configurations in the ammonothermal GaN process and advancing our understanding of the crystallization mechanisms involved.
2. Materials and Methods
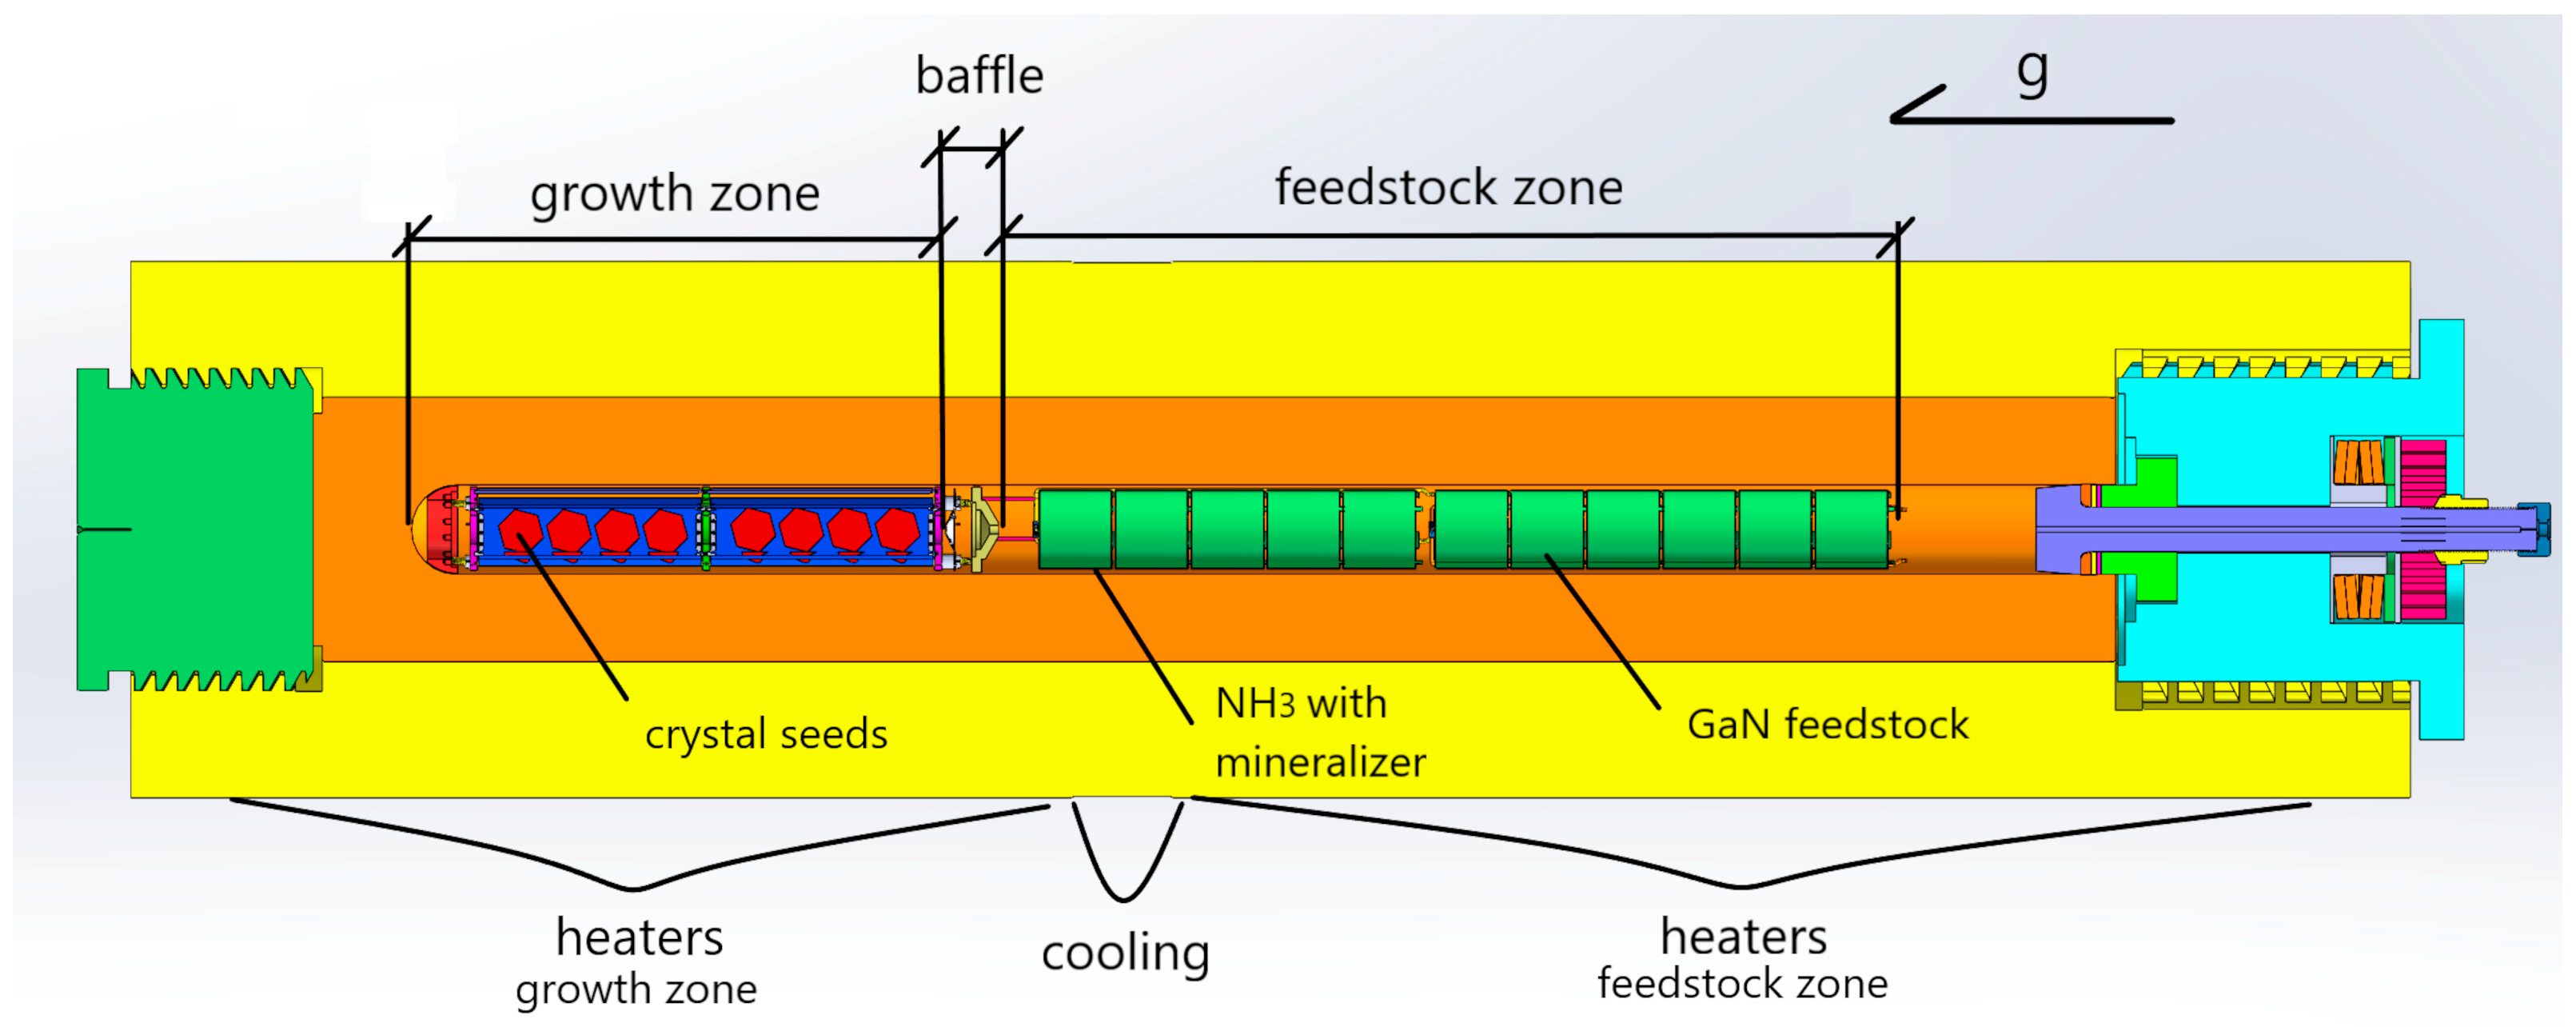
Ammonothermal crystallization processes were conducted in high-pressure autoclaves with an inner diameter of 100 mm. The internal setup, which has a total length of 1800 mm, is divided as follows: One-third of the length (bottom) serves as the growth zone, while two-thirds (top) is designated for the feedstock zone.
Figure 1 presents a 3D computer-aided design (CAD) model of the autoclave and its installation, which was used for the convective flow calculations during the crystallization process. Further details on the crystal growth zone setup can be found elsewhere [
15,
18,
19].
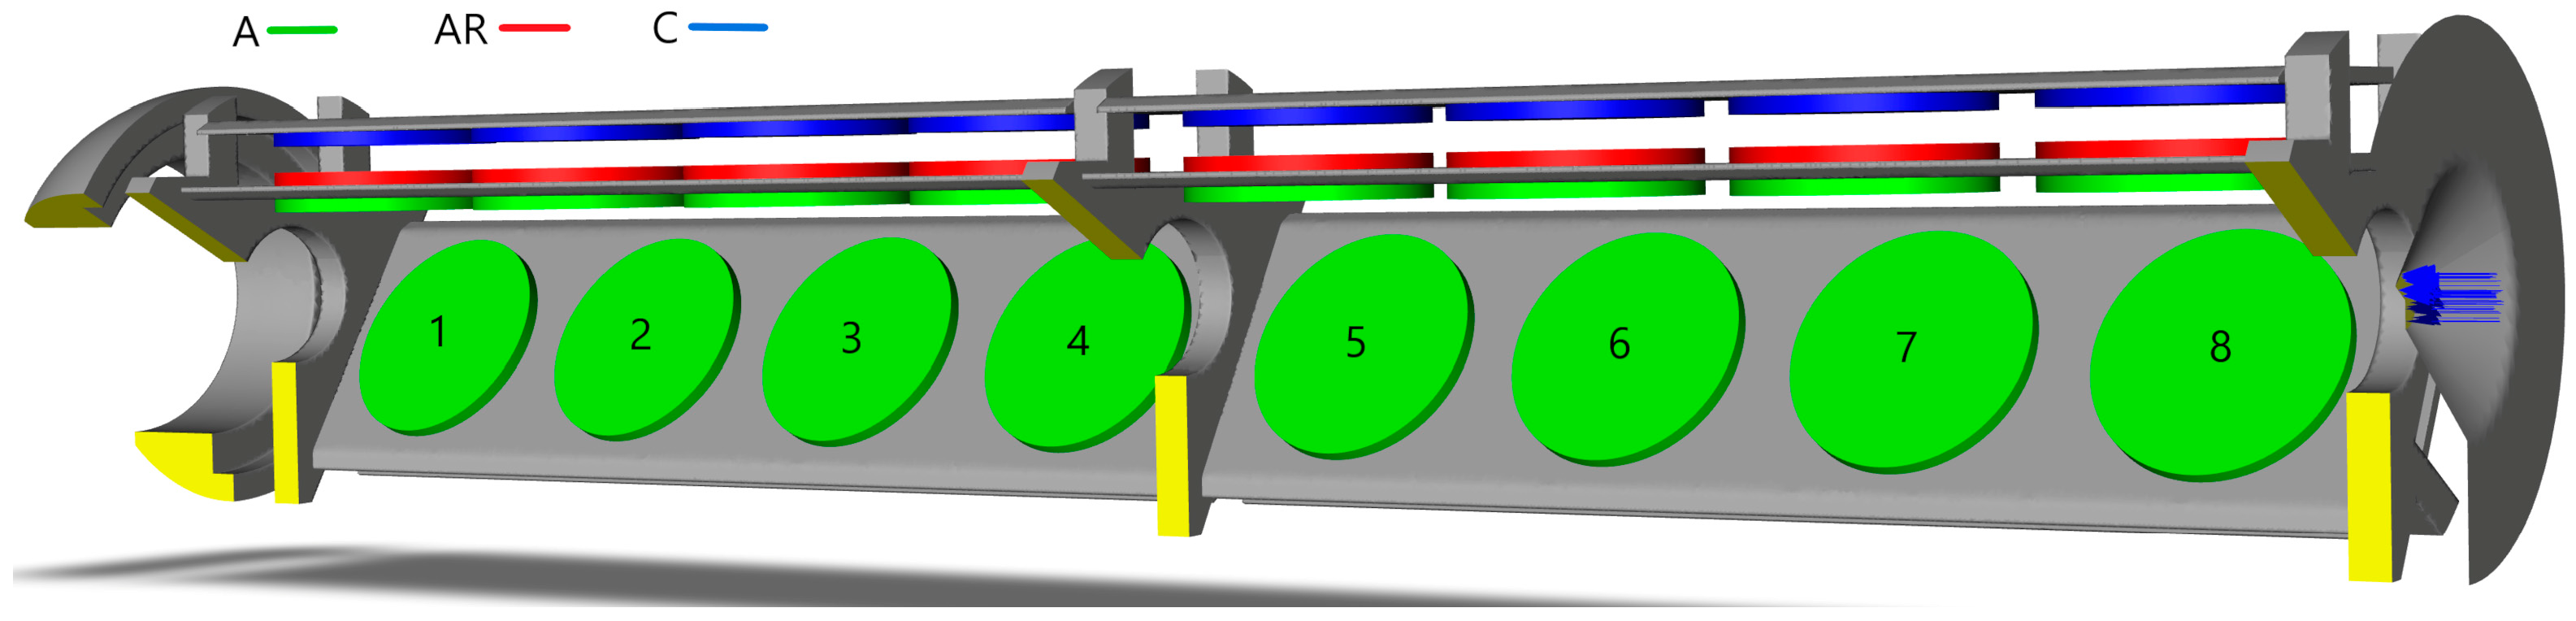
The solid part of the crystal growth zone in the CFD geometry is shown in
Figure 2. Two model geometries were used for the calculations: one with crystals that are 1 mm thick and another with crystals that are 3 mm thick. The crystals were modeled as 40 mm diameter discs, colored green, red, or blue (see
Figure 2). The colors represent different radial positions of the crystal seed: green for position A, red for position AR, and blue for position C. Numbers are used to denote the vertical positions of the crystals, referred to as “levels”. Additionally, since there is a central ring connecting two sets of plate holders, levels 1–4 are designated as the “bottom floor” and levels 5–8 are designated as the “top floor”.
The 3D model domain was confined to the inner walls of the autoclave, the baffle, and the baffle orifice (serving as the inlet, which allows for reverse flow). The inlet is positioned at the baffle orifice and is indicated by blue arrows in
Figure 2. The metal casing of the chamber and the furnace positioned next to outside walls were excluded from the model.
To investigate the effect of crystal thickness on growth conditions, two geometries were used. The initial stage of the growth process was represented by a geometry with 1 mm thick crystals, while the final stage of the growth process was represented by a geometry with 3 mm thick crystals. The CFD models differed only in the seed configurations.
The analysis of convective transport of the supercritical fluid in the growth zone of the ammonothermal autoclave was performed using a 3D approximation in ANSYS FLUENT 2023 R1, provided by Ansys Inc., Washington, PA, USA [
20]. The unstructured mesh consisted of approximately 1,000,000 polyhedral elements. Compared to previous models described in [
15], the element density was improved, although the same hardware and similar software setup were used. The main difference was the increased mesh density, a reduced domain focusing solely on the growth zone, and the inclusion of crystal seeds in the geometry. The element sizes ranged from 1 mm to 3 mm across most of the domain, with the exception of the inlet and its immediate vicinity, where 0.5 mm elements were applied. Three boundary layers with growth ratio of 1.1–1.2 were added to each solid wall in the fluid region, resulting in element thicknesses of less than 1 mm in the first layer. Good convergence was achieved (for continuity absolute criterion of 10
−4 and for other residuals lower magnitude of convergence), and both smaller time steps and the denser mesh produced similar convergence behavior and results. To obtain a quasi-stable, but transient solution, several days of computation were needed. Ammonia properties were approximated and extrapolated as linear functions [
15] of temperature (for ammonia properties please see [
11,
21,
22]). Crystal holders and mounting rings were modeled as nickel with assumed constant properties:
while GaN (seeds) properties were treated as:
density: ρ = 6100 kg/m3;
specific heat: Cp = 590 J/(kg·K) [
23];
thermal conductivity: k = 75 W/(m·K) [
24,
25].
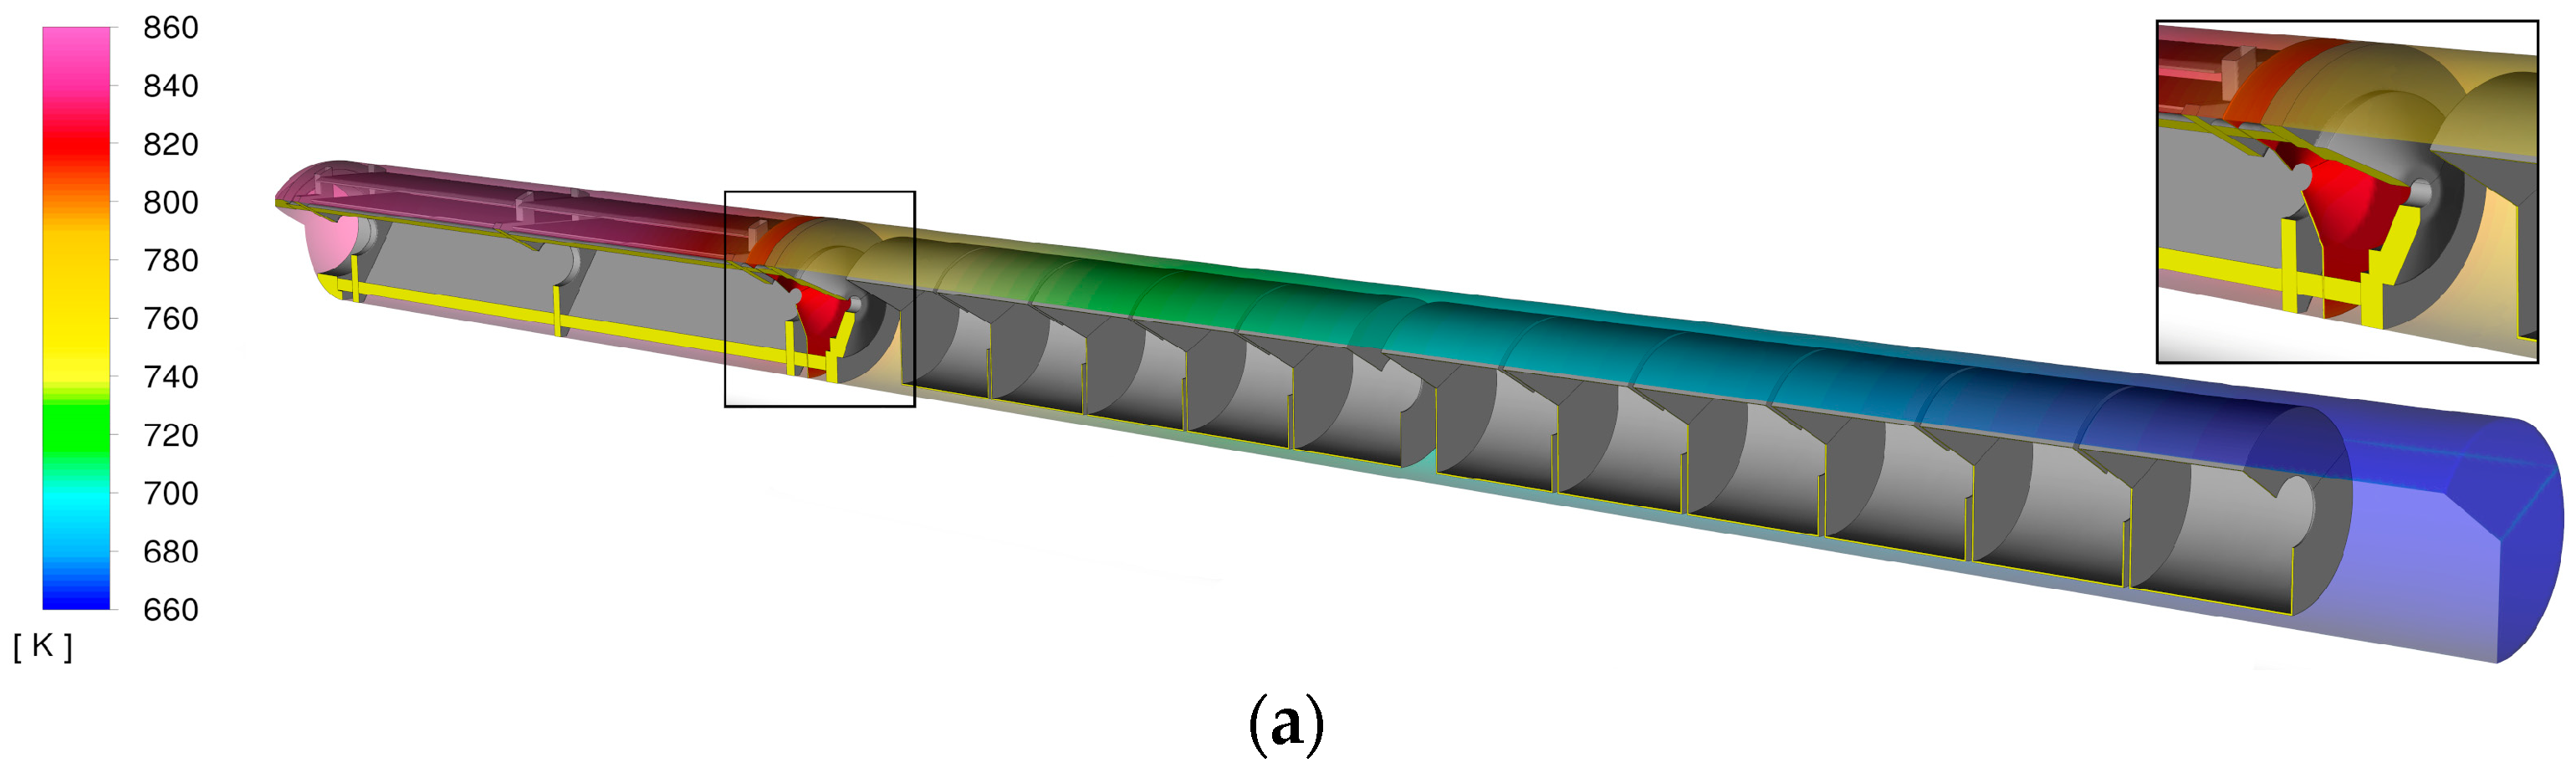
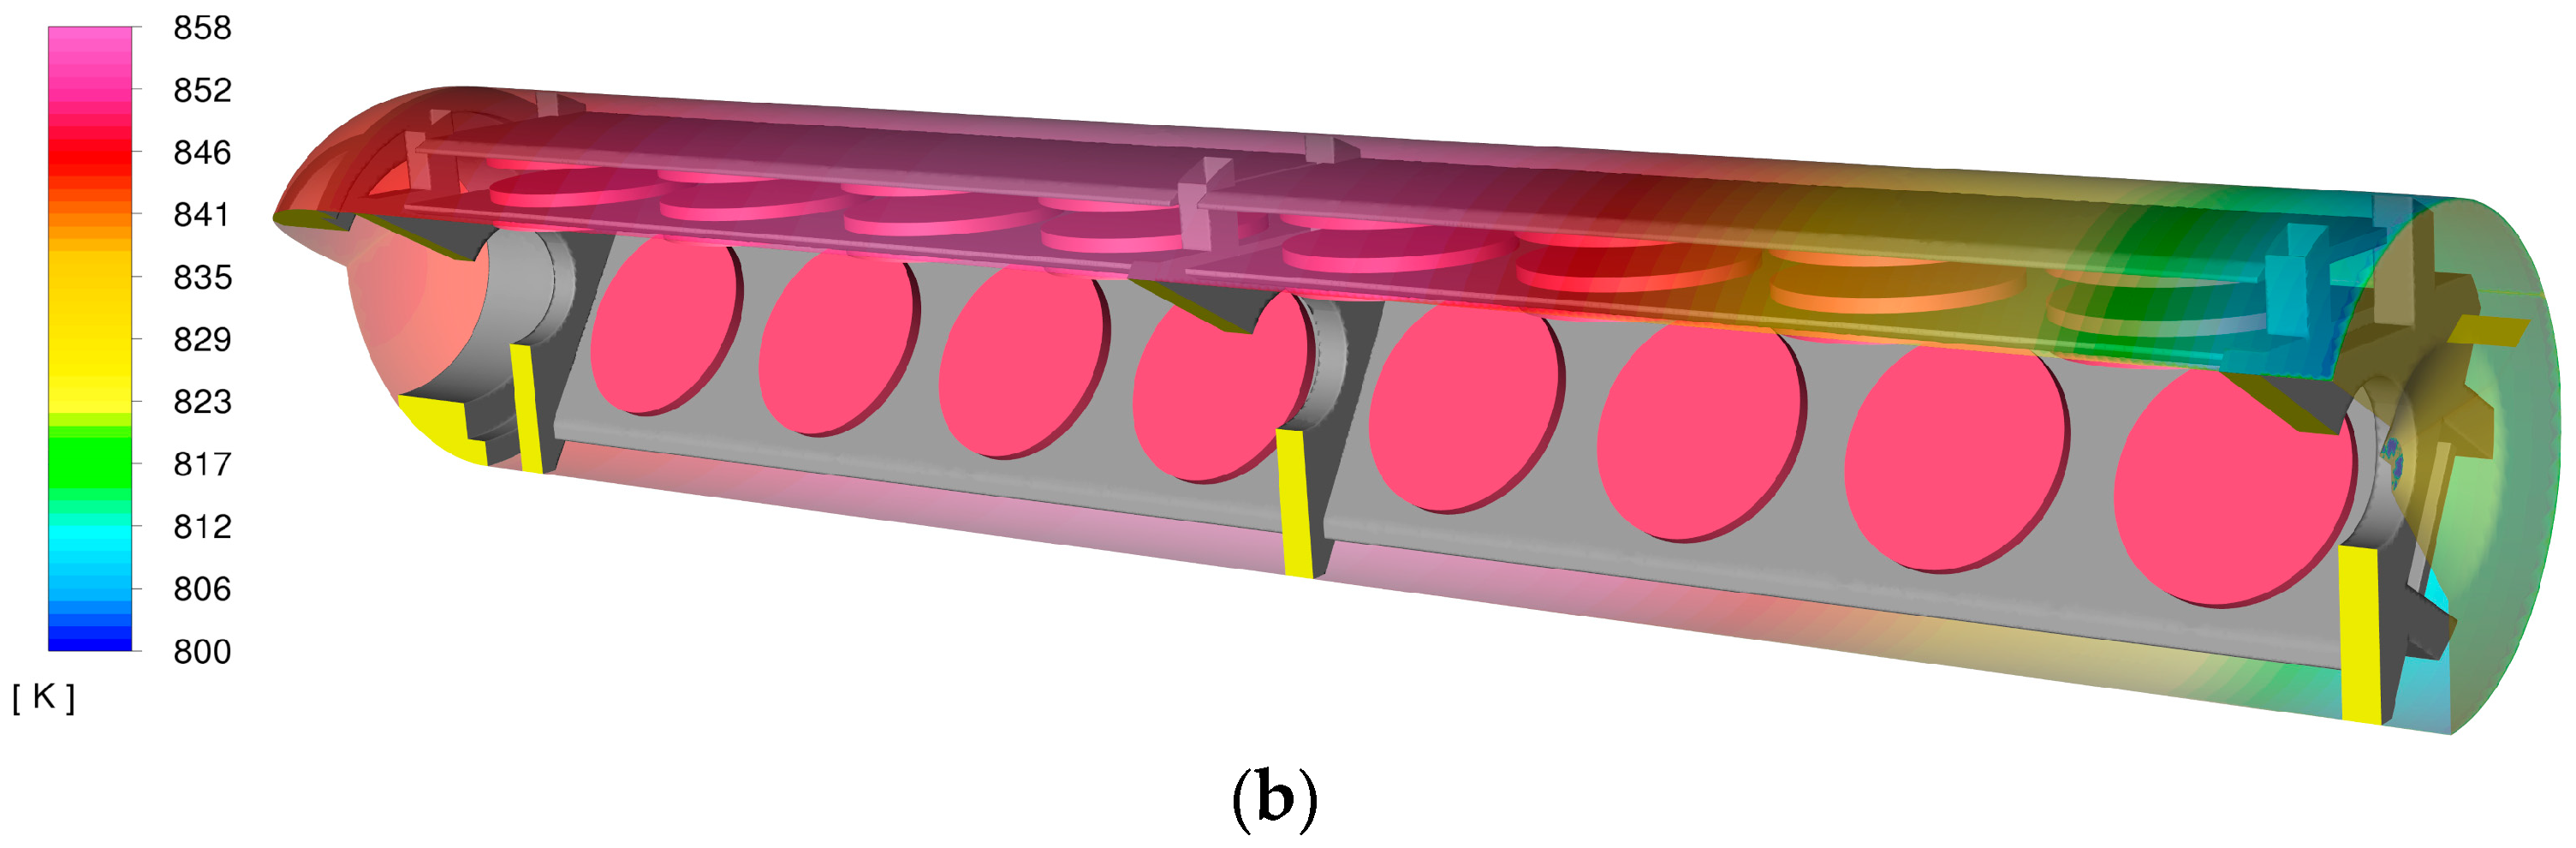
The temperature boundary conditions were defined based on experimental measurements conducted within an air-filled autoclave. Throughout the thermal process, 12 K-type thermocouples were strategically placed to make contact with the vessel’s interior wall, capturing temperature variations. To replicate these real-world conditions in the computational model, a polynomial interpolation method was used. The resulting temperature profile, shown in the color map in
Figure 3, represents the temperature distribution along the boundary. Since the model geometry was reduced to only the growth zone, boundary conditions for the baffle and orifice were also required. The baffle temperature (T = 830 K) (highlighted in red at the right end of
Figure 3a) and the pressure inlet temperature (T = 800 K) were extracted from a simulation including both the growth and feedstock zones (
Figure 3a). A pressure inlet with backflow capability was applied to the orifice of the baffle (blue arrows in
Figure 2). In addition, a turbulence intensity of 2% was assumed in the inlet. A transient pressure-based solver with the κ-ω SST turbulence model was used for the computations [
26,
27]. The time step was adjusted from 0.05 s to 1 s until repeatable transient results were obtained and the temperature in the solid parts stabilized; for the presented transient results, a time step of 0.5 s was chosen.
3. Results
The calculation results indicated that the flow was transient (
Videos S1 and S2), with significant changes in both velocity and direction, as well as temperature variations of up to several degrees. These transient changes appeared to be oscillatory in nature, with one cycle lasting between 60 and 90 s, depending on the model geometry or the convergence of the calculation. Different time periods were observed for thinner and thicker seeds. The mean results presented below are based on several full cycles. For a case with 1 mm thick crystals, it was two cycles, and for 3 mm crystals it was four cycles.
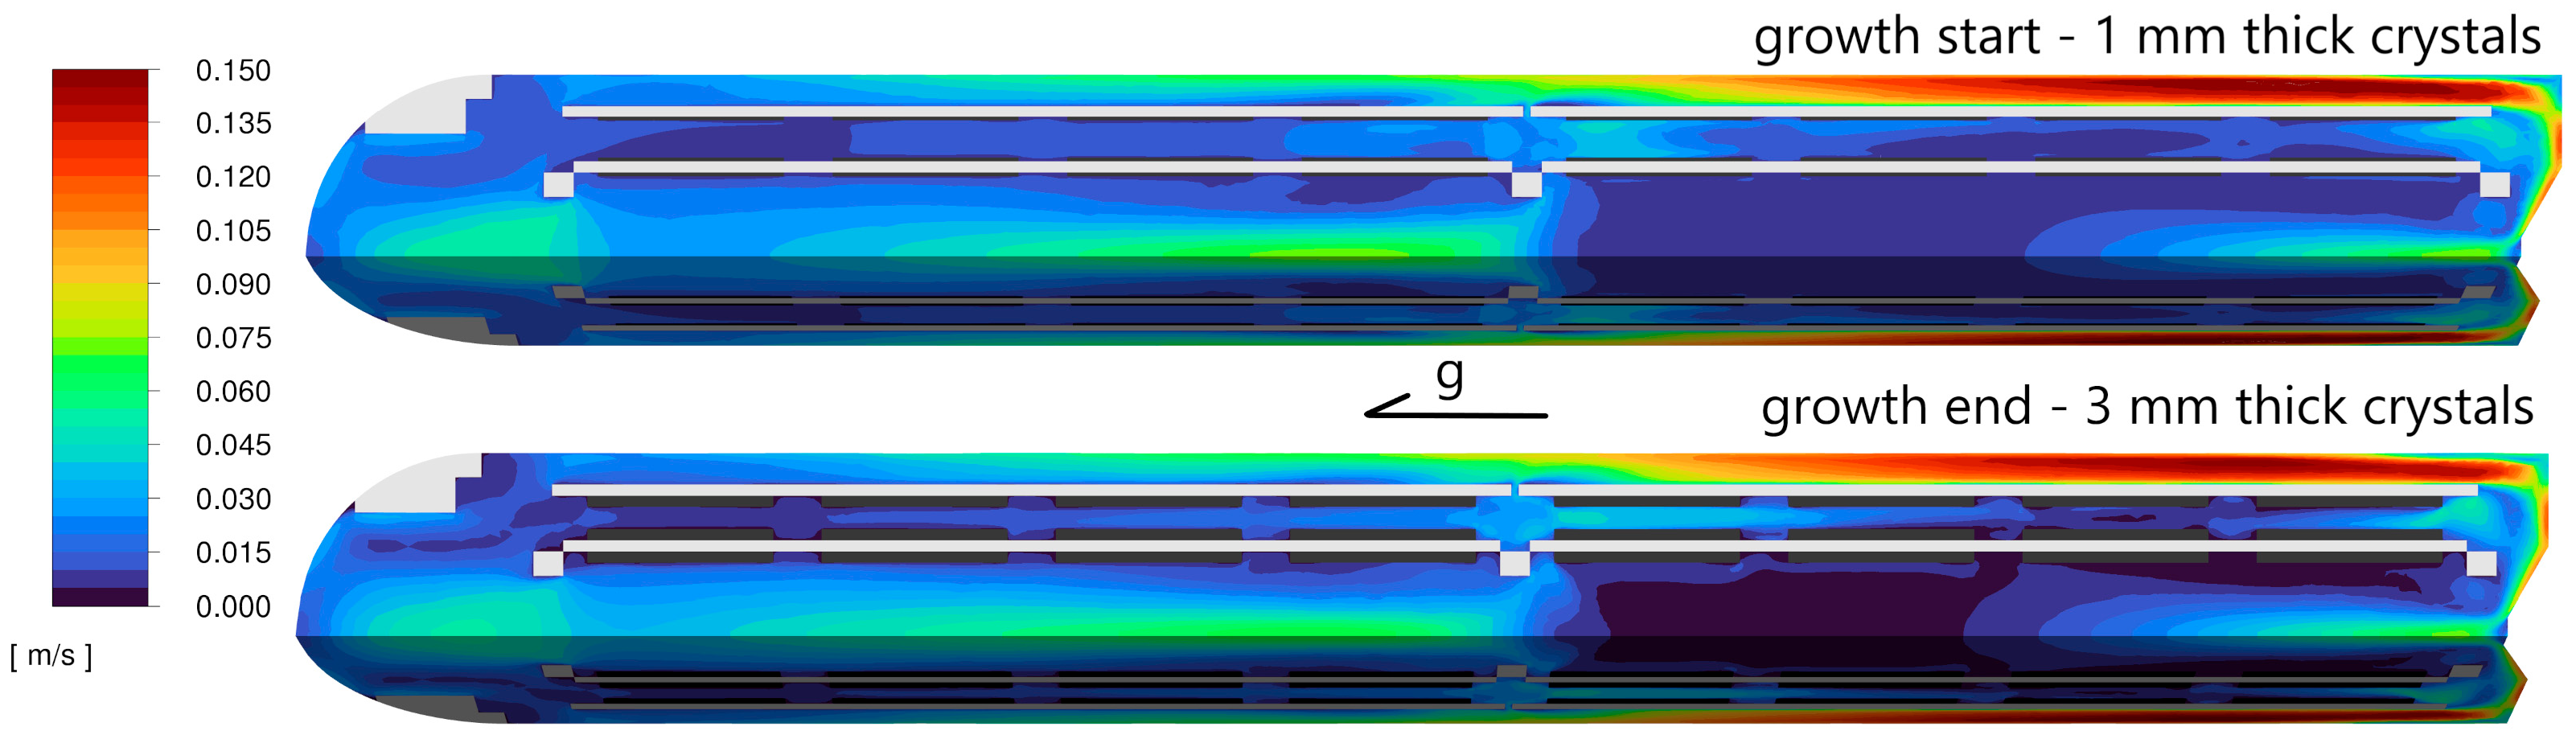
The average velocity in the symmetry plane is shown in
Figure 4. The symmetry plane intersects the crystals and crystal holders at the midpoint. A comparison between the beginning and the end of the growth process is presented. Velocity values range from 1 cm/s to 17 cm/s. The values are slightly higher at the end of the growth, but the distribution is similar in both cases. The Reynolds number, calculated for a velocity of 17 cm/s with a characteristic length of l = 0.01 m (the largest gap between plate C and the wall, where the maximum velocity occurs), was 10
4. For the middle mounting ring orifice, with a velocity of 6 cm/s and a characteristic length equal to the orifice diameter (l = 0.032 m), the Reynolds number was 1.2 × 10
4. These values confirmed the possibility of turbulence occurrence.
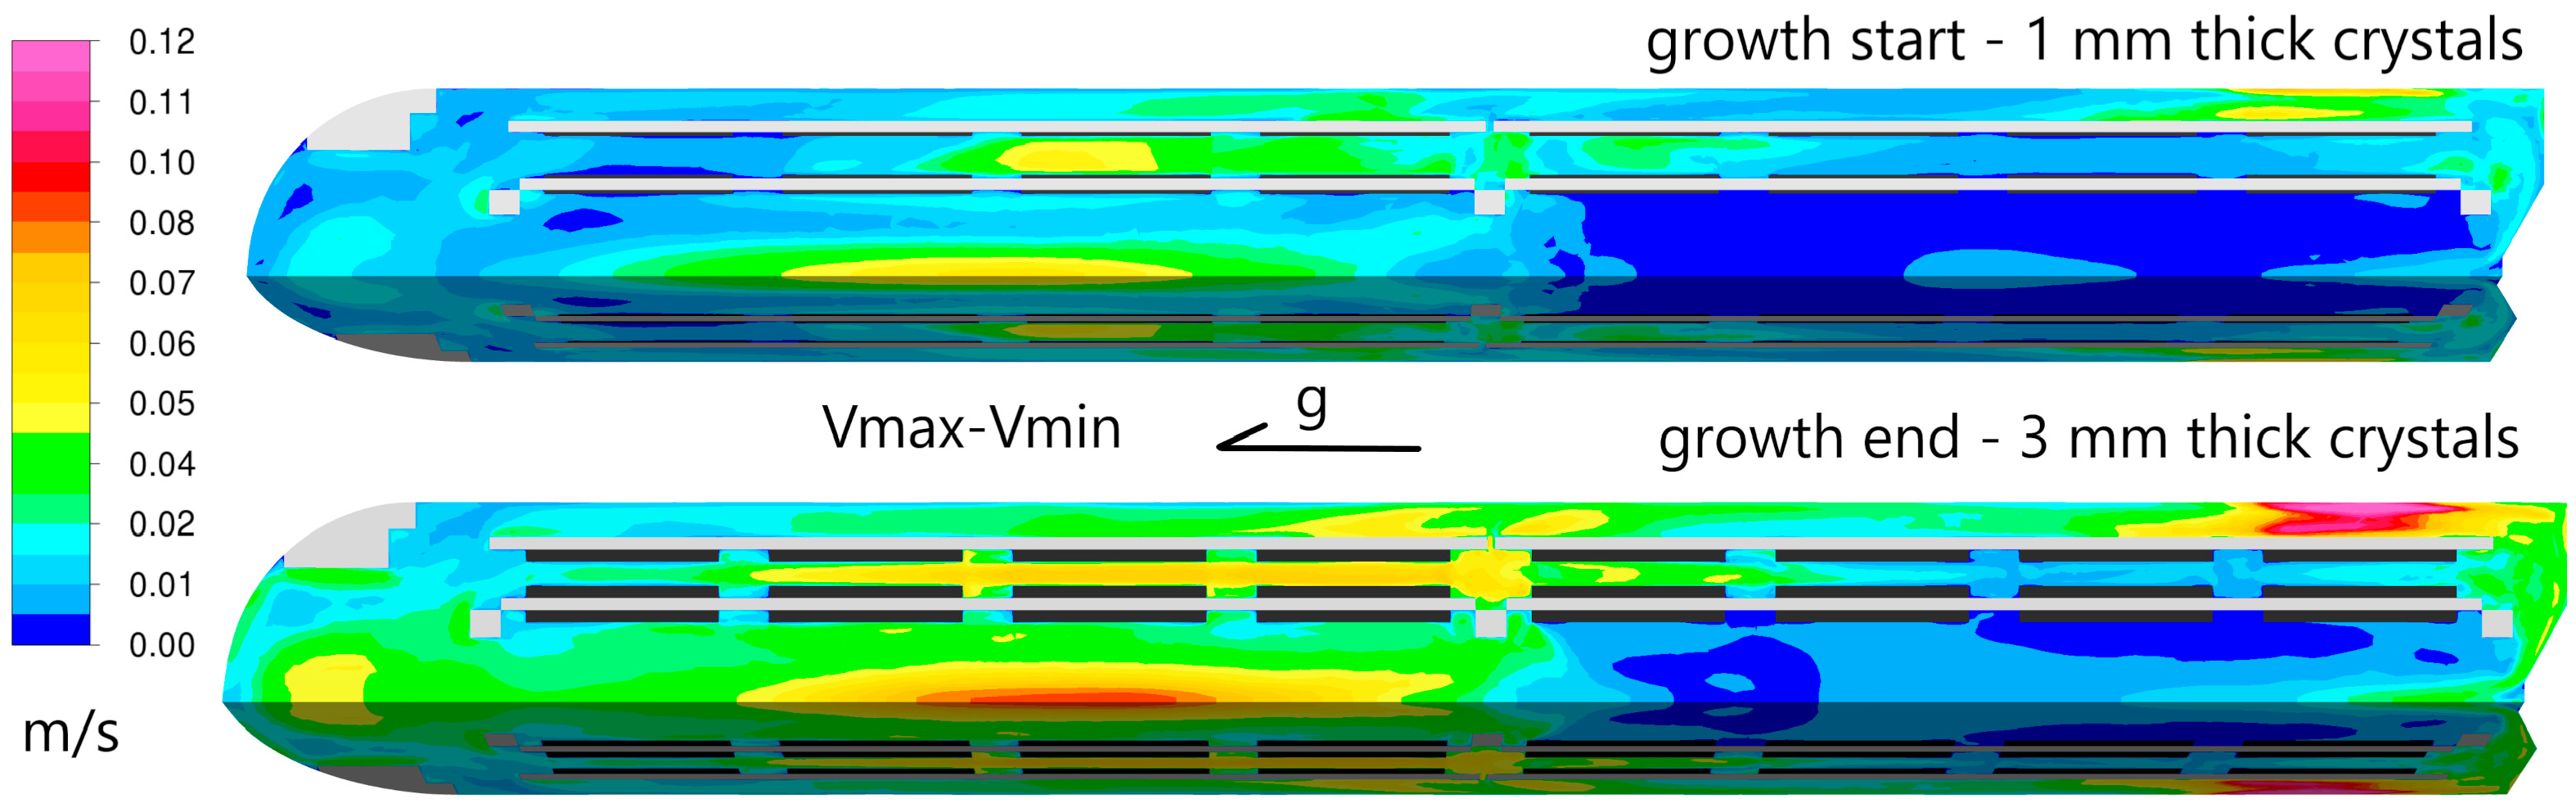
To illustrate the changes in velocity magnitude over one oscillatory cycle, the difference between the maximum and minimum velocity values for each discrete volume was calculated. These values are shown in
Figure 5. The velocity changes were more pronounced for the 3 mm thick crystals, which represent the end of the growth process. The differences ranged from less than 1 cm/s to 6 cm/s at the beginning of the growth, while at the end of the growth, the maximum change in velocity magnitude reached nearly 12 cm/s. This indicates that transient changes were more significant and occurred over a larger portion of the growth zone volume for thicker crystals.
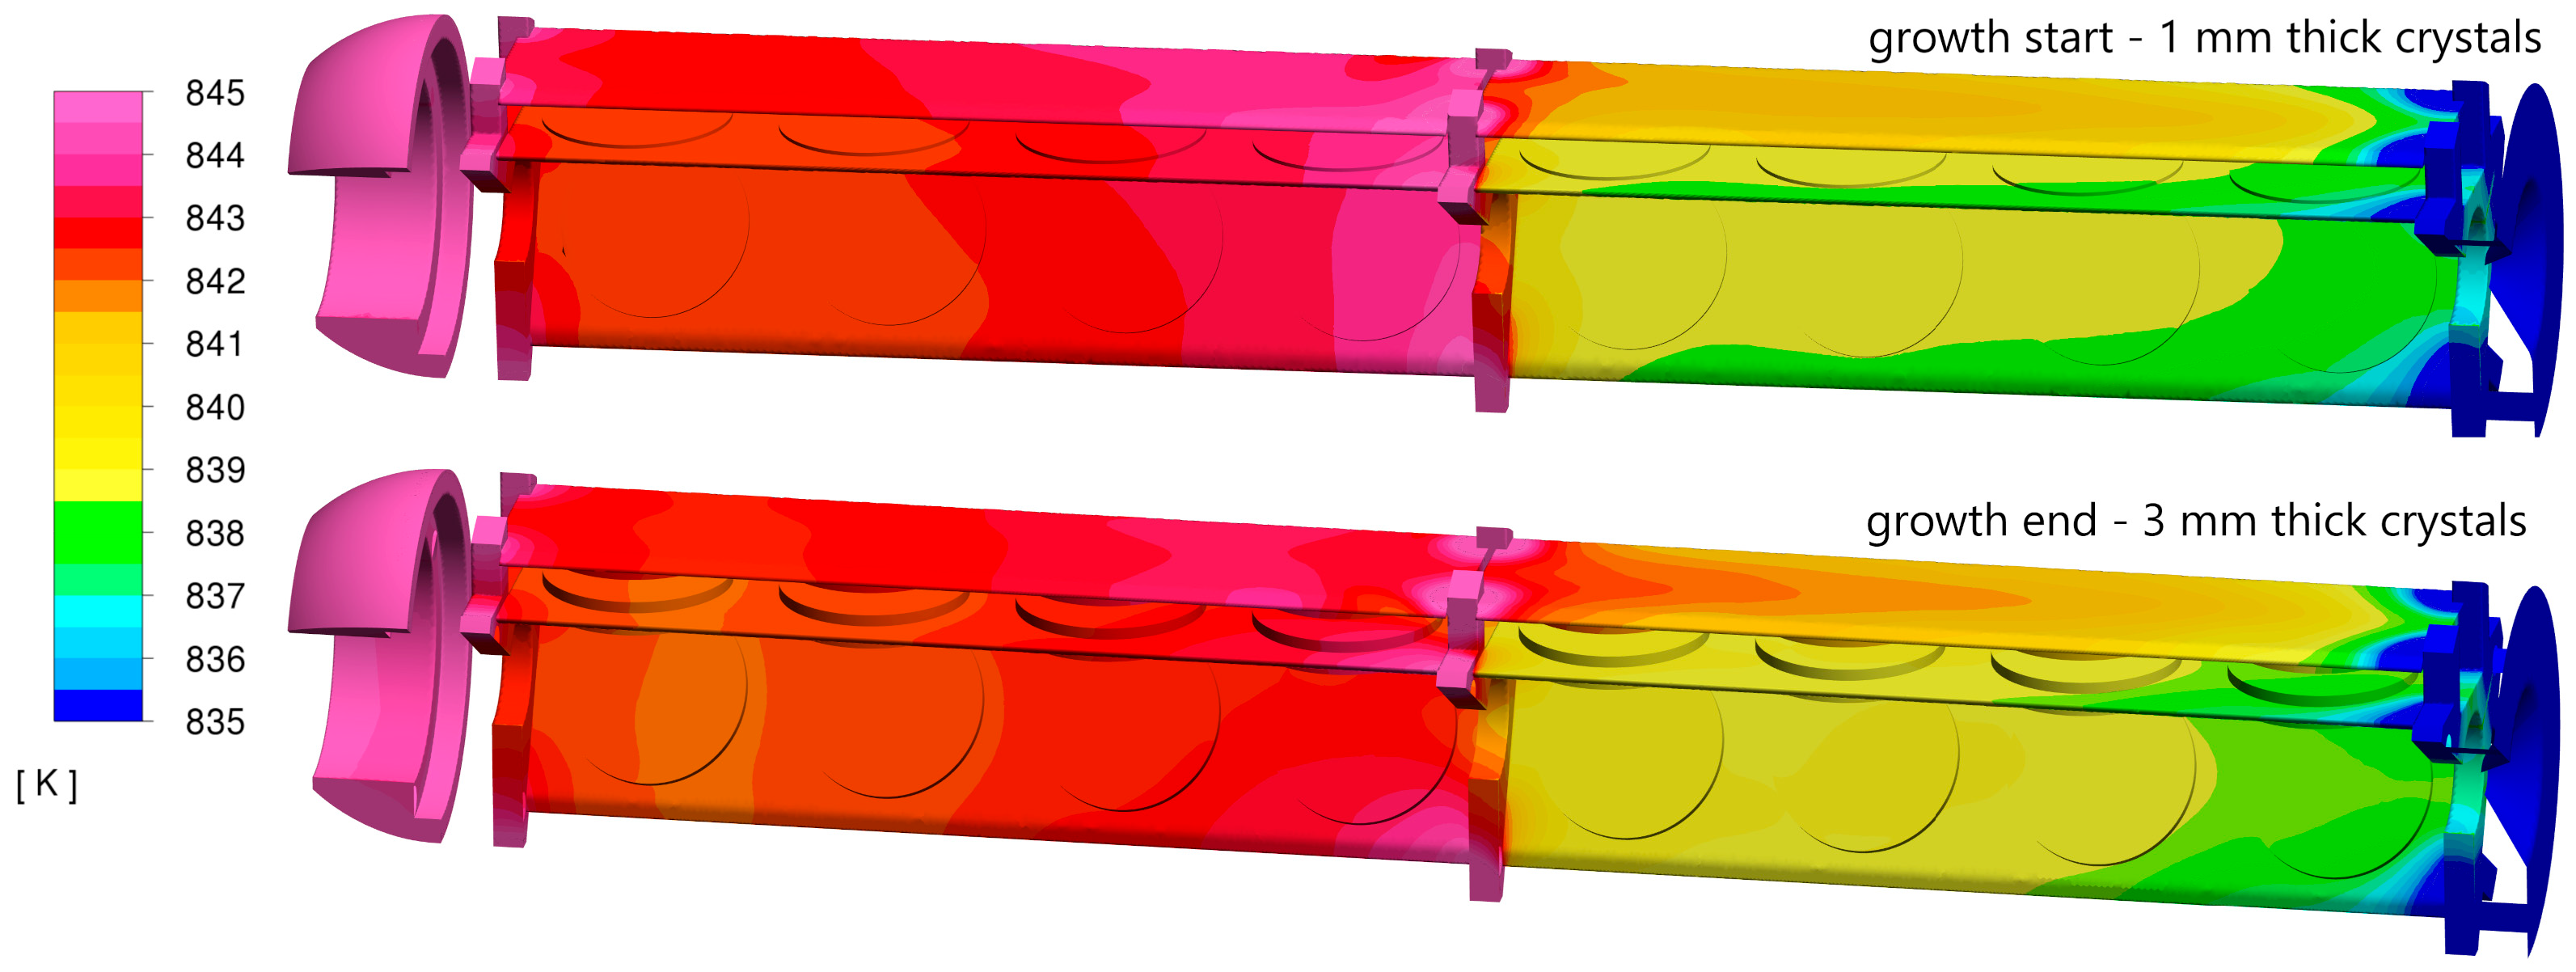
Figure 6 shows the temperature distribution across the growth zone installation and the crystals at the beginning and end of the crystallization process (solid parts of the model domain). While the temperature distribution was similar in both cases, one notable difference emerged. The temperature of mounting plate C on the top floor became higher as the crystals became thicker. The temperature difference between the top floor plates (A and C) was more pronounced at the end of the growth process (right side of the figure, bottom section), with a temperature difference of up to 5 °C. The temperature of the bottom floor crystal holders also showed a greater difference for thicker crystals, though the difference remained smaller, up to 1–2 °C. It is also important to note that the average temperature on the top floor was several degrees lower compared to the bottom floor. Additionally, there was a noticeable temperature gradient around the middle mounting ring, with parts beneath the ring being hotter than those above it.
The temperature and velocity of the fluid were found to be transient. While the changes exhibited characteristics similar to oscillatory behavior, they did not fully conform to this pattern. It is worth noting that the magnitude of these changes was significantly smaller in the model representing the beginning of growth compared to the model representing the end of growth. Comparing transient results is inherently challenging, and various methods for analysis are presented in this paper.
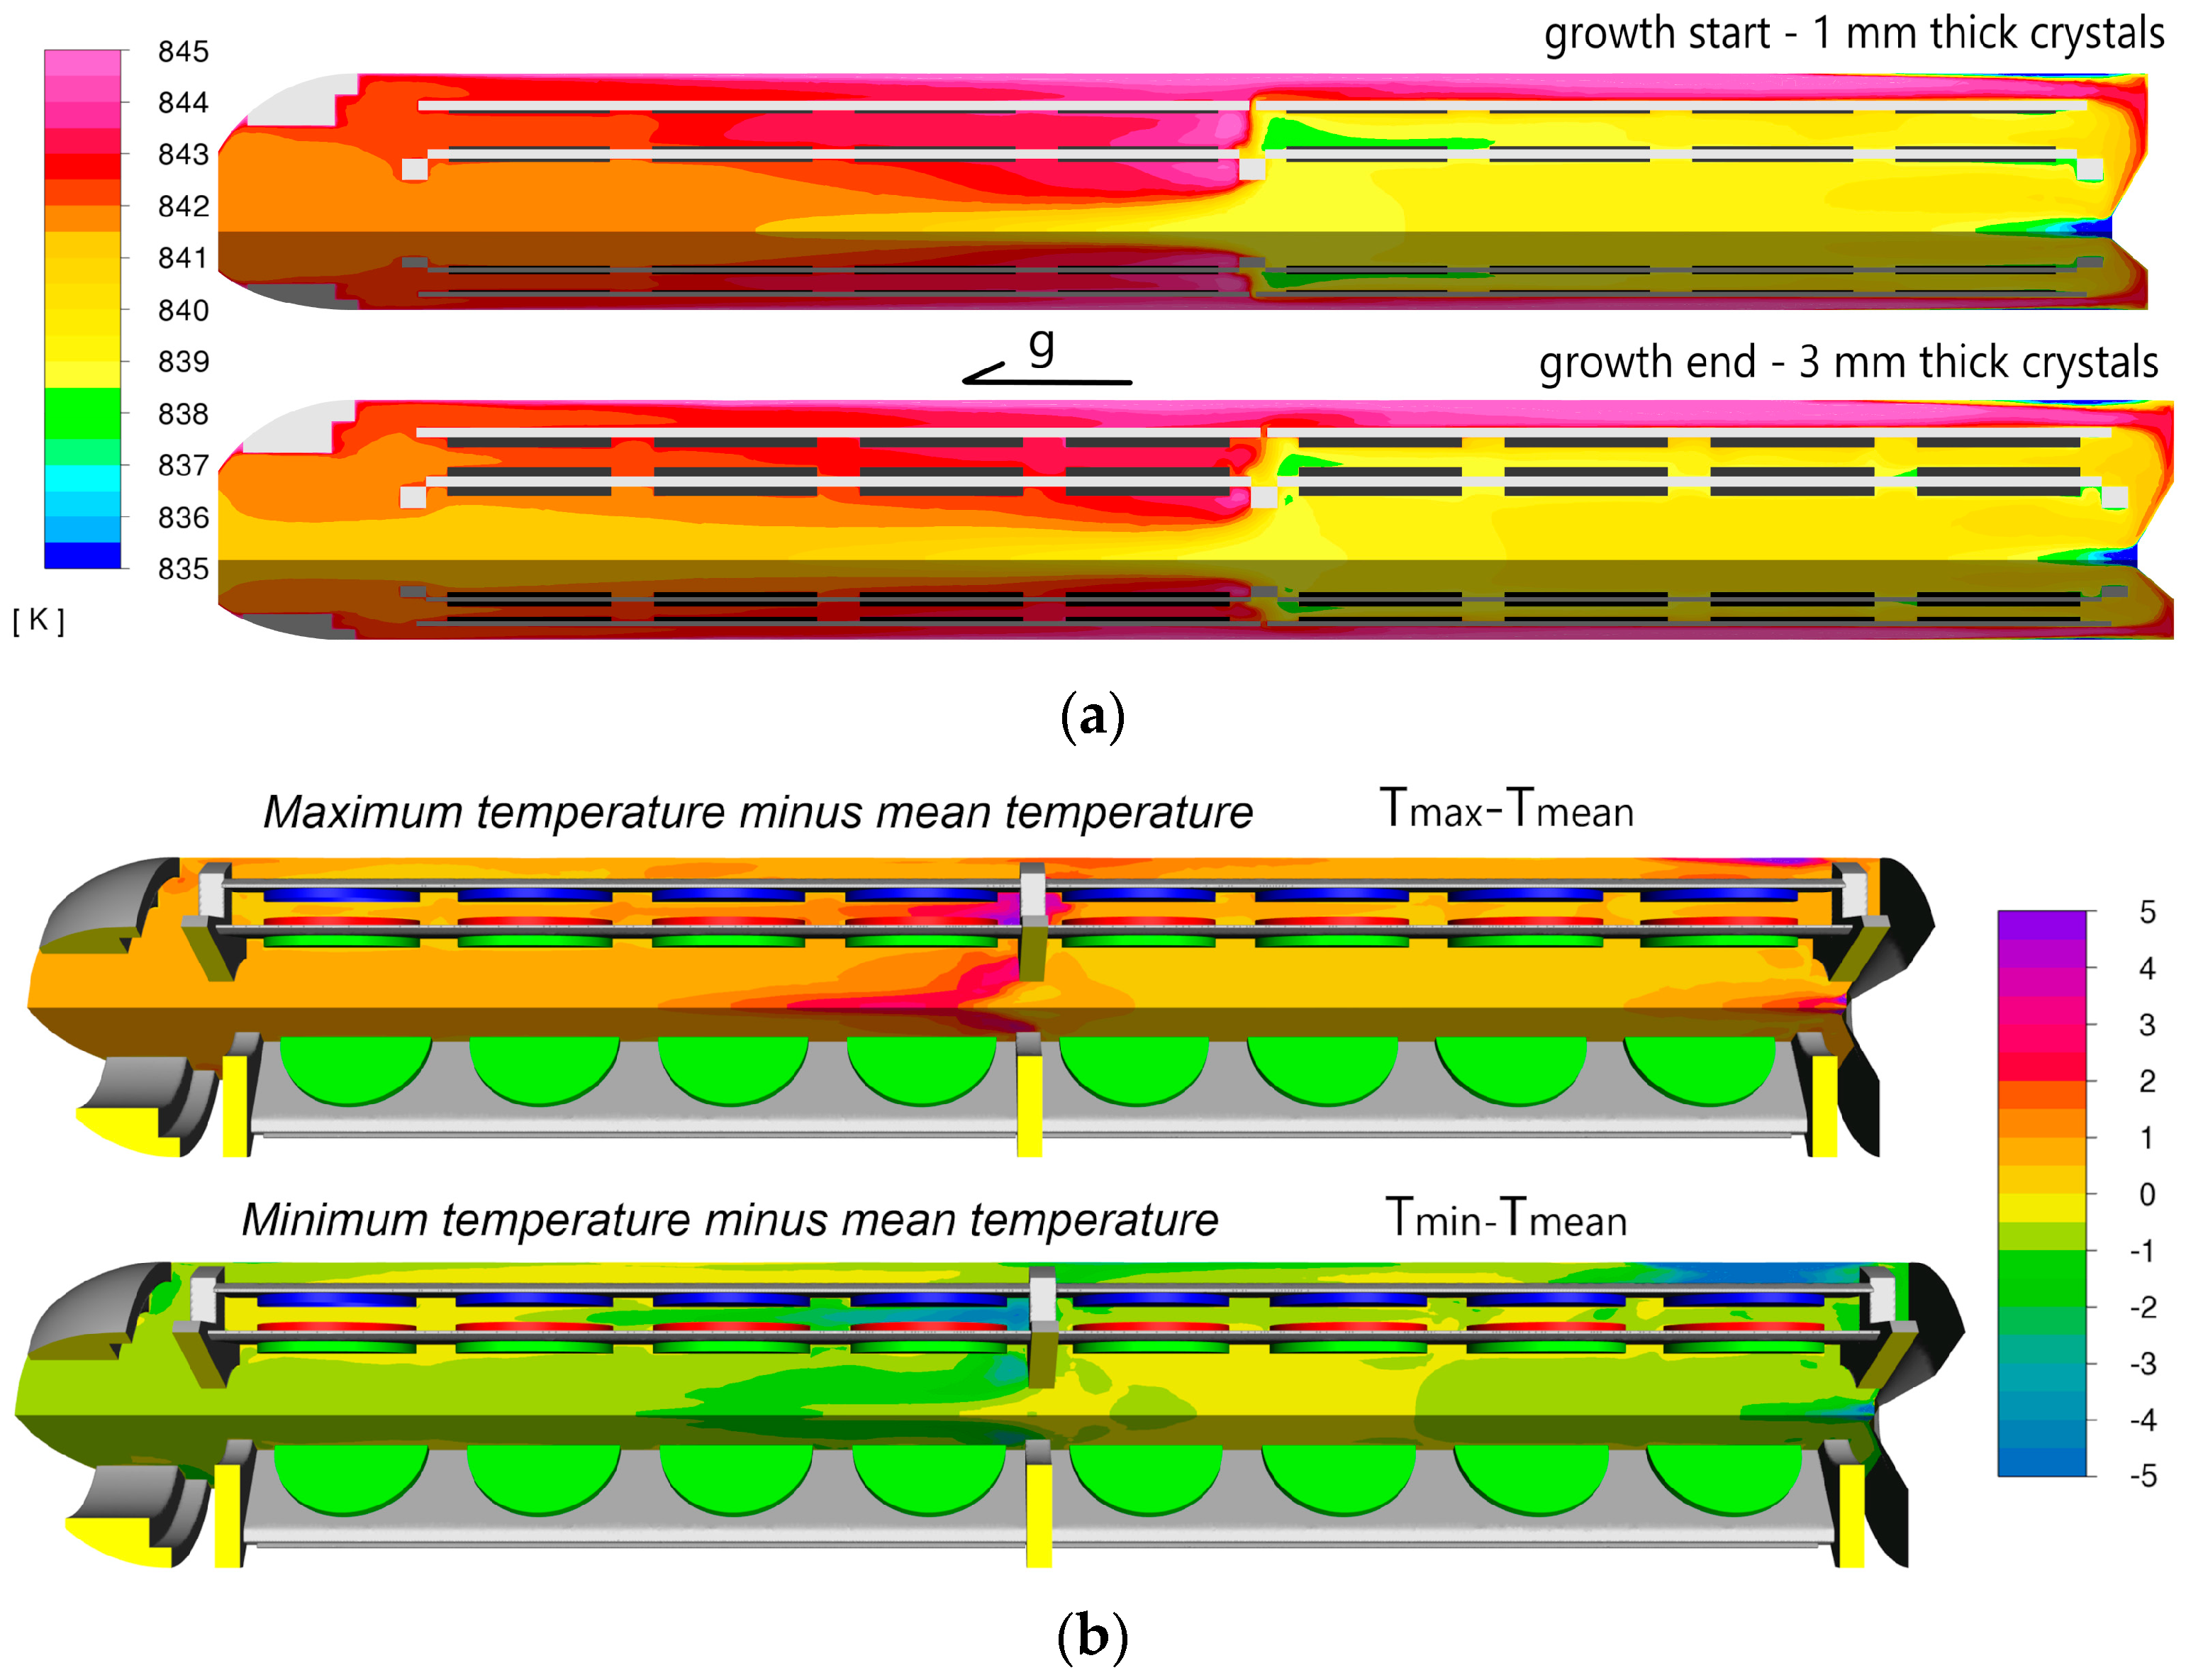
The first results, shown in
Figure 7a, illustrate the thermal changes observed at the beginning and end of the growth process. This figure depicts the average fluid temperature distribution at two stages: the start of crystallization (1 mm thick crystals) and the end (3 mm thick crystals). The temperatures were averaged over one oscillatory cycle. The general distribution of mean temperatures was found to be very similar in both cases, with differences largely confined to a range of 1–2 °C.
As previously mentioned, transient changes in temperature distribution were significantly higher at the end of growth. The maximum and minimum temperatures recorded (independently for each cell) over approximately one minute (one “oscillation” cycle) minus mean values are presented in
Figure 7b. The results are shown exclusively for the model representing the end of growth, as the differences were more pronounced in this scenario. The temperature differences between the maximum and minimum values for each element were substantial, reaching up to 8 °C in some regions. Notably large variations were observed at levels 3, 4, and 5. It is also worth highlighting that at certain moments, the crystals were nearly 5 °C warmer than the surrounding NH
3. This kind of temperature distribution is particularly evident in the regions corresponding to the minimum fluid temperature, as shown in the lower part of
Figure 7b.
Figure 8 presents a comparison of the average temperatures of the fluid and the installation components (including the crystals). The hottest crystals were located closest to the autoclave wall (position C). The largest temperature difference between the top surface of the crystals and the surrounding fluid mean temperature was also observed at positions near the wall.
Another noteworthy observation is that the fluid on the top floor was cooler than on the bottom floor, suggesting that the middle ring (connecting the crystal holders) acted as a thermal “barrier”. An enlarged view of the lower floor is provided in
Figure 8a, while an enlargement of the upper floor is shown in
Figure 8b.
Figure 9 illustrates the temperature distribution on two planes parallel to the top surfaces of the crystals (where growth occurs) and the crystal holders. The time point shown was selected due to the significant temperature variations observed near the crystals. A similar temperature distribution persisted for several seconds (up to ten) (
Videos S1 and S2) during each cycle.
In the distribution presented, a noticeable temperature difference is evident at level 4, position C, and levels 3–5, position AR (marked in
Figure 9). Additionally, it appears significant that temperature changes occur in both vertical and horizontal directions within the plane. In other words, cold fluid streams surrounded by warmer fluid were observed intermittently, lasting a few seconds and moving across the top surfaces of the crystals at levels 3–5.
4. Discussion
Due to the retrograde solubility phenomenon [
8], a typical basic ammonothermal crystallization process proceeds as follows: Initially, all the seed crystals are maintained at a lower temperature than the feedstock material, resulting in a back-etching process. In the next step, known as temperature crossing, the temperature profile changes such that the growth zone containing the seed crystals is heated above the feedstock zone temperature. This initiates the growth process, causing GaN to crystallize on the surfaces of the native seeds. Over time, the temperatures stabilize, achieving the desired temperature difference between the feedstock and growth zones, which is then maintained. A CFD simulation of this final stage (growth) is presented in this paper.
It is worth noting that all steps of the process are important [
28], particularly the temperature crossing, during which the growth zone becomes hotter than the feedstock zone, initiating mixing between the zones. Another critical aspect of the process is the transition to the growth condition. Determining how to achieve the final growth condition, such as the duration of the transition phase, is a significant question [
28]. The two cases presented in this study focus on the growth stage of the process, and all conclusions and results are based on these conditions.
The CFD model is considered robust and a valuable tool for future geometry assessments, showing improvements compared to previous generations. The possibility of turbulence formulation was confirmed through velocity values and Reynolds number estimations. Reynolds number values (magnitude of 104) show that flow is at least in the transitional region of turbulence. Based on computational results, flow is highly turbulent, but they are dependent on the model and its calibration. The RANS family of turbulence models was applied, which calculates average velocity directions and values as well as turbulence energy (energy associated with velocity fluctuations). The results show that the calculated average values of velocity and temperature at given time points are transient and oscillatory, indicating that the flow is highly turbulent.
Thus, the flow is not only turbulent (with transient fluctuations in velocity and related properties) but also exhibits transient changes in the average values of velocity and temperature. These transient effects were found to be significant and of particular interest. Different methods for presenting these findings are shown, and some conclusions are proposed.
The main difference between the presented models and previous ones (see [
15]) is that the domain includes only the growth zone. This domain selection is a novel approach in ammonothermal autoclaves convective flow simulation. The presented approach reduces the size of the spatial discretization, resulting in faster convergence times. While this method appears to be effective, it is contingent upon an initial CFD model of the entire installation (including the growth zone, baffle, and feedstock zone). Only after comparing the results of both models and using some outputs from the full-domain simulation as boundary conditions for the submodel domain can this approach be validated. Flow patterns near the baffle were confirmed to be similar for both domains, and the growth-zone-only model was evaluated as highly useful, providing good approximations.
However, the applicability of this submodeling approach may depend on the geometry of the installation. In the presented case, the presence of a double baffle facilitates the implementation of the submodel and the selection of the submodel domain.
Another significant difference from previous model generations is the inclusion of the crystal geometry. It was found that the crystals significantly affect both flow patterns and temperature distribution. The geometry used in the calculations is an idealized version of the actual installation. In practice, crystal seeds often vary in size, shape, and distribution during growth runs, unlike the regular arrangement assumed in the model. This suggests that modeling non-uniform crystal distributions and potentially incorporating smaller installation components could yield better approximations and provide additional insights into convective flow during different growth processes.
Despite these idealizations, the comparison between the CFD simulations and the experimental growth thickness increases is promising. Some examples of the relationship between temperature distribution and growth rates are discussed below.
The influence of crystal thickness on temperature distribution is illustrated in
Figure 6. For instance, thicker crystals result in slightly higher temperatures on the top floor (at the two crystal holders on the right) compared to the thinner crystal model. Crystal thickness also alters the cross-sectional area of the fluid flow, which, in some cases, can significantly impact velocity distribution within the installation. For the crystal sizes presented (1 mm and 3 mm), the difference in mean velocity values was not substantial (as shown in
Figure 4). However, changes in velocity distribution and transient behavior were clearly noticeable. These changes were particularly evident when comparing maximum and minimum velocity values. For thicker crystals at the end of the growth process (3 mm), the difference between maximum and minimum velocity magnitudes was greater, indicating more pronounced transient changes (see
Figure 5).
The presented results primarily focus on temperature distribution. The minimum and maximum temperatures recorded for each cell (discrete volume) during a single cycle subtracted by mean value are shown in
Figure 7b. An intriguing observation is that there are moments when the fluid temperature exceeds that of the crystal seeds adjacent to the fluid. In the case of retrograde solubility, this could indicate a temporary lack of supersaturation on the growing surface. Furthermore, transient thermal conditions could lead to uneven supersaturation across the growth surface.
The most significant difference between maximum and minimum fluid temperatures was observed at levels 4 and 5 (see
Figure 2), which correspond to the lowest growth rates. Since transient changes are challenging to present directly, mean values were used to link crystal thickness increases to temperature distribution. Mean values of the fluid and installation temperatures are shown in
Figure 8.
Figure 8b reveals that crystals at position C are a few degrees hotter than those at position AR in front of them. The fluid flowing between these two positions has a temperature similar to the crystals at position AR. In previous work [
15], it was demonstrated that position C exhibits a much higher growth rate than position AR. In fact, position AR on the top floor has the lowest growth rate among the six possible positions. Based on the CFD results, it is evident that the temperature difference between the fluid and the crystal surface significantly impacts the growth rate.
The final type of CFD results presented focuses on selected time points within the transient temperature fields. These temperature distributions are depicted on planes parallel to the crystal growth surfaces. It was observed that, at certain moments, a cold fluid stream forms in front of the crystals on levels 4 and 5 (and occasionally on level 3, though on a smaller scale), surrounded by hotter fluid for a few seconds. An example of such a state is shown in
Figure 9.
These temperature distributions are noteworthy for two main reasons. First, levels 4 and 5 exhibit the smallest average thickness increment. Second, K. Grabiańska et al. [
29] demonstrated that levels 4 and 5 typically show the lowest structural quality of grown crystals. This suggests that transient changes in the temperature field during the growth stage negatively affect the structural quality of the crystals. As flow becomes more turbulent, the likelihood and extent of transient changes increase. Conversely, low turbulence in the flow can enhance mixing, leading to greater uniformity in temperature and velocity distributions [
27]. These findings suggest that transient changes and turbulent flow are important criteria for optimizing the installation and thermal program.
Transient results also revealed that the increasing thickness of crystals during the growth stage plays a significant role. In the presented results, the mean temperature and velocity distributions differed only slightly between 1 mm and 3 mm thick crystals. However, as shown in
Figure 6,
Figure 7a and
Figure 8, transient changes were more pronounced in the 3 mm crystal case. This could be related to narrower gaps between crystals at positions AR and C, which are aligned but slightly offset, as well as differences in heat transfer through the solid parts of the installation. Thicker crystals exhibit better thermal conductivity compared to the surrounding fluid.
To apply these criteria for optimizing the installation and thermal program, a precise turbulence model is essential. The presented RANS model application, while useful, should not be considered a highly precise simulation of the flow and have some limitations [
26,
28,
30]. The results, though valuable for optimization, are limited in accuracy and require further validation. Spatial discreditation detailed study and turbulence model calibration is needed in many cases of industrial application of similar calculation. Another important factor is the lack of confirmed properties of NH
3 in a given condition (for example viscosity, specific heat, and conductivity). A more detailed estimation of growth rates based on temperature distribution would require precise solubility data. Recent work on solubility by Grabiańska et al. [
8] could be applied for such calculations.
An additional step in model development would be to include both diffusive and convective transport of Ga in NH3. Modeling diffusion accurately requires precise turbulence calculations, as turbulence significantly enhances mixing and increases the effective diffusion coefficient compared to laminar flow. However, diffusion models and coefficients have not yet been thoroughly validated for the presented type of calculation. This remains an intriguing topic for future research.
Nevertheless, the mean temperature distribution appears to be a reliable factor for validating installation performance using CFD computations. These results are also instrumental in advancing the application of more sophisticated turbulence models, such as Large Eddy Simulation (LES) [
30]. The precision of LES depends heavily on the element size in the mesh. Comparing LES results with those of the presented models could be beneficial for model validation, mesh density evaluation, and overall mesh distribution planning. These topics are planned to be explored in future work.
5. Conclusions
CFD models demonstrated that when designing an autoclave installation, both the initial and final sizes of the crystals must be taken into account. Turbulence formulation was confirmed, and the calculated results indicated highly turbulent flow, leading to significant transient changes. Several examples of transient result presentations were provided, emphasizing both mean results and selected time-point analyses, as both carry crucial information. Mean results revealed a strong correlation with the growth ratio, while temperature distributions at selected time points highlighted connections to lower structural quality at positions 4 and 5.
Transient effects, amplified by turbulence, should also be factored into installation evaluations, as they appear to negatively impact the growth process compared to stationary conditions. In the authors’ opinion, more uniform velocity and temperature distributions are preferable for enhancing the crystal growth rate and structural quality. For detailed and precise simulations, diffusion and turbulence models need to be incorporated; however, their application and setup for CFD simulations of the ammonothermal process are not yet well-established. Turbulence scale and occurrence are likely influenced by the thermal program and installation geometry.
The presented results provide insights for optimizing the external wall temperature profile, while also demonstrating that installation geometry significantly affects temperature distribution. These findings represent an initial step toward applying different turbulence models and optimizing installation design. Although the geometry in the calculated models was slightly simplified, with small mounting elements excluded, the approach serves as a foundational step for modifying and refining installation design.
In the models, crystal seed size and shape were assumed to be identical for all positions, and the seeds were evenly distributed throughout the growth zone. This uniformity does not always reflect real-world growth runs. Future studies could investigate how variations in crystal size and positional distribution affect velocity and temperature distributions.
Additionally, newly available solubility data could enable the assessment of supersaturation in future models, though this was not included in the presented simulations. Future work will focus on optimizing installation geometry and thermal programs. Efforts could include minimizing turbulence through design and thermal modifications or applying more advanced turbulence models.
For these objectives, CFD models, like those presented, will remain valuable tools for evaluating and improving the ammonothermal growth process.


