Article

Investigation of the Electrical Properties of Polycrystalline Crednerite CuMn1−xMgxO2 (x = 0–0.06)-Type Materials in a Low-Frequency Field

1
Faculty of Physics, West University of Timisoara, Bd. V. Parvan No. 4, 300223 Timisoara, Romania
2
Institute for Advanced Environmental Research, West University of Timisoara (ICAM-WUT), Oituz Str., No. 4, 300086 Timisoara, Romania
3
National Institute of Research and Development for Electrochemistry and Condensed Matter, Dr. A. P. Podeanu Str., No. 144, 300569 Timişoara, Romania
*
Author to whom correspondence should be addressed.
Crystals 2025, 15(2), 184; https://doi.org/10.3390/cryst15020184
Submission received: 28 November 2024 / Revised: 4 February 2025 / Accepted: 7 February 2025 / Published: 14 February 2025
(This article belongs to the Section Inorganic Crystalline Materials)

Abstract

:
CuMn1−xMgxO2 (x = 0–0.06) polycrystalline samples were prepared using the hydrothermal method at T = 100 °C for 24 h in Teflon-line stainless steel autoclaves. The samples were crystallized, forming crednerite structures (C2/m space group), and the Mg2+ substitution onto the Mn3+ site induced small changes in the unit cell parameters and volume. Based on complex impedance measurements made between 20 Hz and 2 MHz, at different concentrations of Mg ions (x), the electrical conductivity (σ), the electric modulus (M), and the complex dielectric permittivity (ε) were determined. The conductivity spectrum, σ(f, x), follows the Jonscher universal law and enables the determination of the static conductivity (σDC) of the samples. The results showed that, when increasing the concentration x from 0 to 6%, σDC varied from 15.36 × 10⁻⁵ S/m to 16.42 × 10⁻⁵ S/m, with a minimum of 4.85 × 10⁻⁵ S/m found at a concentration of x = 4%. Using variable range hopping (VRH) and correlated barrier hopping (CBH) theoretical models, the electrical mechanism in the samples was explained. The band gap energy (Wm), charge carrier mobility (μ), number density (NC) of effective charge carriers, and hopping frequency (ωh) were evaluated at different concentrations (x) of substitution with Mg. In addition, using measurements of the temperature dependence of σDC(T) between 300 and 400 K, the thermal activation energy (EA) of the samples was evaluated. Additionally, the dielectric behavior of the samples was explained by the interfacial relaxation process. This knowledge of the electrical properties of the CuMn1−xMgxO2 (x = 0–0.06) polycrystalline crednerite is of interest for their use in photocatalytic, electronic, or other applications.

1. Introduction

Recently, promising results have been obtained regarding the photoelectrochemical applications of compounds from the Cu+M3+O2 delafossite family [1], in which M can be a 3d metal or a rare earth metal [2]. Much is known about p-type delafossite metal oxides, such as CuCrO2, CuFeO2, and CuAlO2 [3,4,5], which have applications in many fields, such as photovoltaic devices [6], photocatalysis [7], and environmental protection [8]. In recent years, researchers have paid special attention to copper–manganese-based oxide compounds (such as crednerite, CuMnO2) [9,10,11,12], which, due to the Jahn–Teller effect of Mn3+ ions crystallizing in the C2/m space group [11], has a lower symmetry than the R-3m space group, which is characteristic of the delafossite family [3,4,5].
The CuMnO2 crednerite compound can be prepared using different methods, such as solid phase sintering [13], hydrothermal synthesis at 80–210 °C [9,14], microwave-assisted hydrothermal synthesis [15], or coprecipitation [16]. Some studies have focused on the synthesis methods that enable the obtainment of crednerite CuMnO2 compounds with nanometric particle sizes (50–100) nm [10,12] that can be used in solar cells [9] as a photocathode material or as photocatalysts [17]. Also, an ultrasound-assisted co-precipitation method has been used to obtain CuMnO2 nanocrystals with a particle size distribution between 20 and 50 nm [10]. In Ref. [18], using a novel hydrothermal method for preparing CuMnO2 nanoflakes, the authors obtained nanoflakes with a thickness of about 10 nm, making them suitable for applications in Li-ion batteries and supercapacitors. As a result, in addition to the option of obtaining nanometric-sized CuMnO2 crednerite particles to improve their physical properties, another strategy is the substitution, i.e., the introduction, of Mg, Al, or Fe ions into the CuMnO2 crednerite structure [19,20,21]. In this way, the electronic structure of CuMnO2 can be changed, which led to the modification of its structural, magnetic, and optical properties [19,20,21,22]. Similar behavior is encountered for other CuM3+O2 materials upon substitution; for example, the substitution of Cr with Mg ions in CuCrO2 induced a decrease in electrical resistivity [23]. The effect of doping CuCrO2 delafossite oxide with Ge ions on its structural, dielectric, and magnetic properties [24] has also been studied; the results, obtained by investigating the dielectric parameters at room temperature at a range of frequencies from 40 Hz to 1 MHz [24], showed that both Ge-doped and un-doped CuCrO2 ceramic exhibited strong dielectric properties, with real dielectric permittivity values (ε′) of approximately 104 in a low-frequency range. In Ref. [25], it is shown that the characteristic activation energy of conductive processes, from CuGaO2 delafossite powder doped with Ca and Mg ions, varies between 0.3 eV and 0.57 eV, according to the Arrhenius law. However, few works are known regarding the determination of the electrical properties, such as the electrical modulus (M), electrical conductivity (σ), and complex dielectric permittivity (ε), of the CuMnO2 crednerite compound, both in the undoped and doped state. In our previous paper [26], based on complex impedance measurements in the low-frequency field and at different temperatures between 30 and 120 °C, the frequency dependence and temperature dependence of the electrical conductivity, σ(f, T), of the crednerite material Cu1+xMn1−xO2 (x = 0 and 0.06) was determined. The results enabled the determination of the static component (σDC) and, subsequently, the dynamic component (σAC) of the electrical conductivity and the evaluation of the thermal activation energy for the investigated sample, both for x = 0 and x = 0.6.
In this paper, the effect of the concentration, x, of substitution with Mg in polycrystalline crednerite samples of CuMn1−xMgxO2 (x = 0, 0.02, 0.04, and 0.06) on the electrical conductivity σ(f, x), the electrical modulus M(f, x), and the complex dielectric permittivity ε(f, x) was investigated. For this, complex impedance measurements were performed on the samples over a range of frequencies from 20 Hz to 2 MHz. The samples’ thermal activation energy (EA) was evaluated using static measurements of the temperature dependence of the static conductivity (σDC) of samples within a temperature range from 300 K to 400 K. The electrical conduction mechanisms in the samples were explained using Mott’s VRH (variable range hopping) theoretical model [27] and the CBH (correlated barrier hopping) model [28]. The dielectric behavior of the samples was interpreted in terms of the interfacial relaxation process.

2. Materials and Methods

2.1. Synthesis Using the Hydrothermal Method

Low-temperature hydrothermal synthesis was used for the synthesis of crednerite-type materials (CuMn1−xMgxO2), at concentrations of x = 0, 0.02, 0.04, and 0.06, according to the slightly modified hydrothermal method proposed previously for CuMnO2 synthesis [9,19]. The following reactants were used: Cu(NO3)2·3H2O, (1−x)Mn(NO3)2·4H2O, and x Mg(NO3)2·6H2O, with x = 0, 0.02, 0.04 and 0.06. An aqueous solution of 2.5M NaOH was prepared, in which the precursors were dissolved sequentially and stirred for approximately 30 min; then, all samples were moved to a Teflon-lined stainless steel autoclave. An earlier report on the synthesis of stoichiometric crednerite compounds indicates that their formation depends strongly on the pH and temperature [12].
In this paper, the pH of the solution was 12 and the synthesis was performed at 100 °C for 24 h, for all samples. At the end of the thermal treatment, the solution recovered from the autoclave was filtered and washed several times with distilled water, and the obtained powder was dried in an oven at 90 °C, for approximately 1 h.

2.2. Characterization Techniques

Room-temperature X-ray diffraction pattern data were collected using a PANalytical X’pert Pro diffractometer (PANalytical, Almelo, The Netherlands) with Cu-Kα radiation, and Rietveld refinements were performed using these diffractograms and the FULLPROF program from FullProf Suite (version April 2021) [29].
The vibrational properties of the obtained crednerite compounds were characterized at room temperature by Raman spectroscopy, using an SR 500i AR model spectrometer (Andor Technology Ltd., Belfast, UK), equipped with a 50 mW and 514 nm laser (Stellar-Pro Select model from MODU-LASER). The objective lens used to perform the excitation and to treat the Raman radiation was an Olympus optical microscope with Nikon 50X/0.4 objective. The measured samples were pressed under pellets with a 3 mm diameter, using a manual press.
Using an LCR meter (Agilent E-4980-A type, California, CA, USA), in conjunction with a laboratory experimental setup [30], like ASTM D150-98 [31], complex impedance measurements were performed for the obtained crednerite samples over a frequency range of 20 Hz–2 MHz at room temperature. Based on these measurements, the electrical conductivity (σ) of the samples, their electrical modulus (M), and their complex dielectric permittivity (ε) were determined.

3. Results and Discussion

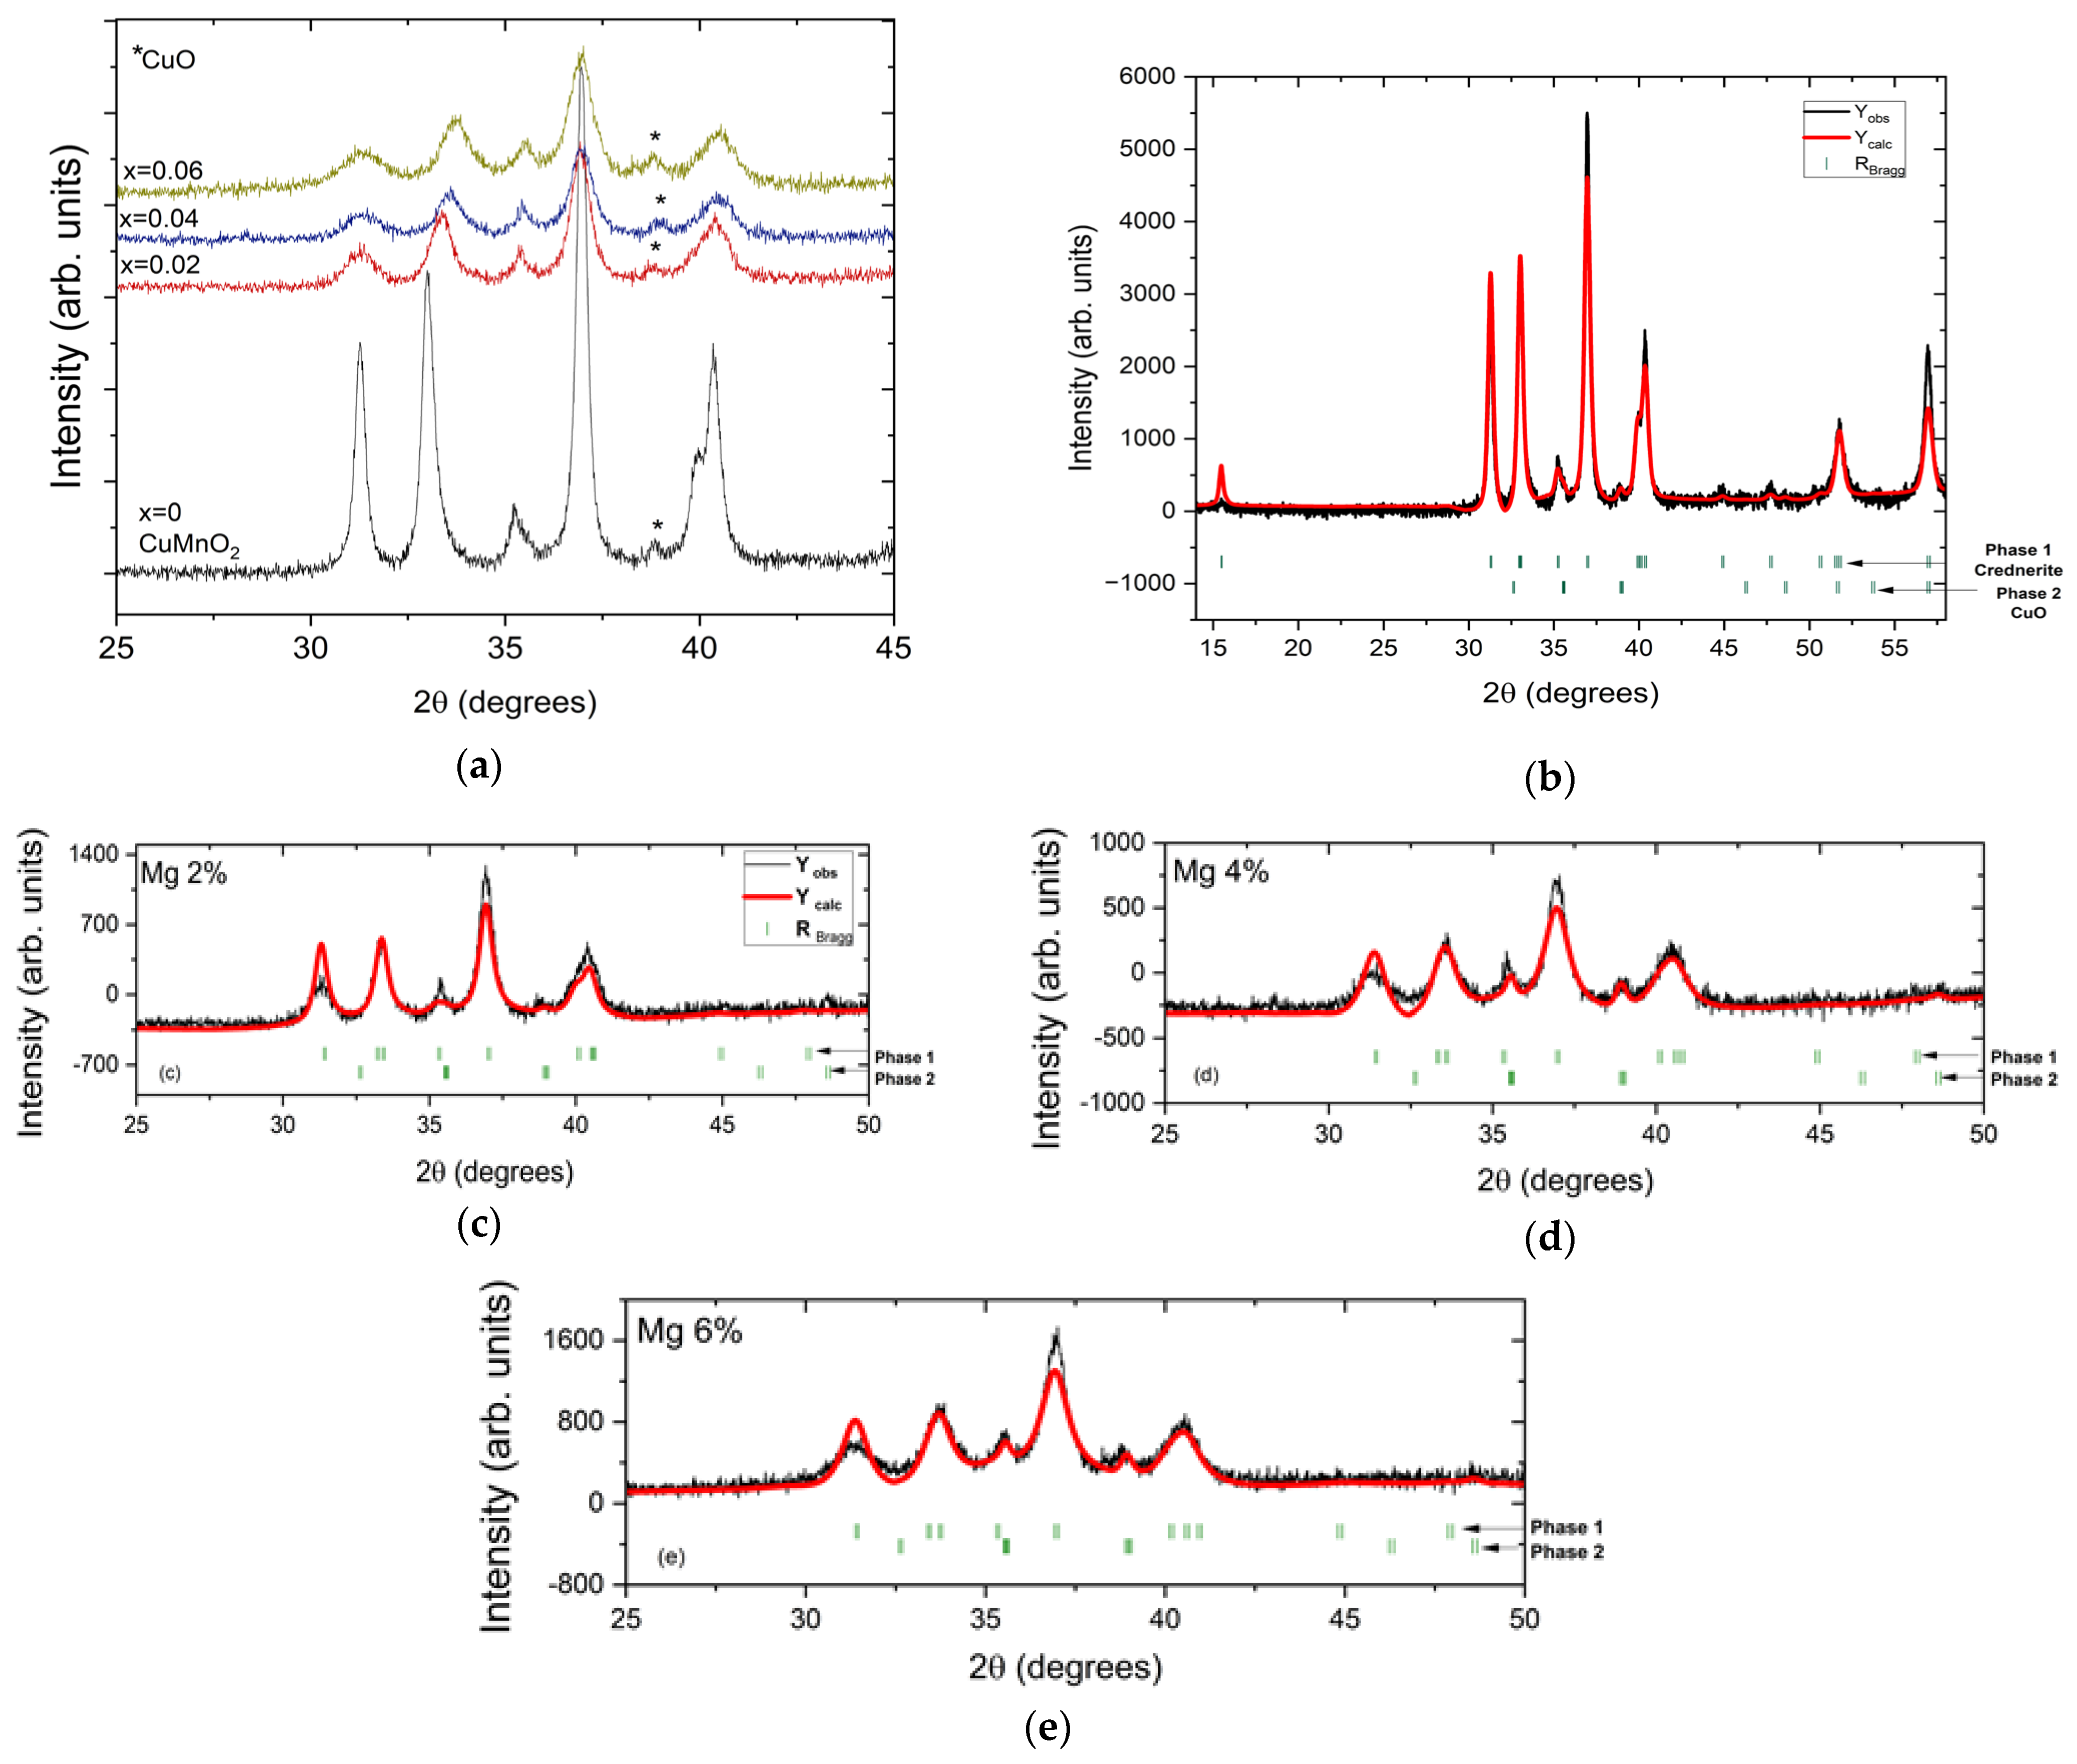
3.1. X-Ray Diffraction Analysis

The X-ray diffraction analysis indicated that all the obtained samples crystallized within the crednerite-type structure [11], that the peaks were well defined for all CuMn1−xMgxO2 compounds, and that their width slightly increased upon substitution with Mg, as seen in Figure 1a. This increase in the width of the peaks obtained from the XRD analysis indicated a decrease in the crystallite size due to substitution with Mg (as can be seen in Table 1). The Rietveld refinement of the X-ray data for CuMn1−xMgxO2 compounds using the C2/m space group is shown in Figure 1b–e. The atomic positions of Mn, Cu, and O are as follows: Mn(0, 0, 0), Cu(0, 0.5, 0.5), and O(0.38104, 0, 0.14163). The weak extra peak (around 2θ = 39°, tagged with a star in Figure 1a) was indexed as the secondary phase of CuO. Also, using the Rietveld refinement, the CuO phase content in the synthesized samples was evaluated; the results are presented in Table 1.
The effect of substitution with Mg2+ ions on the crednerite structure was observed using the unit cell volume; there was a small decrease, due to small changes in the unit cell parameters and angles, from 92.157(3) Å3 for x = 0 to 90.485(6) Å3 for x = 0.06 (see Table 1). A similar behaviour, i.e., a decrease in the unit cell volume due to the substitution of Mn with Mg, was also reported in reference [19], and, in that study, the authors considered that the limit of substitution of Mn with Mg was x = 0.06.

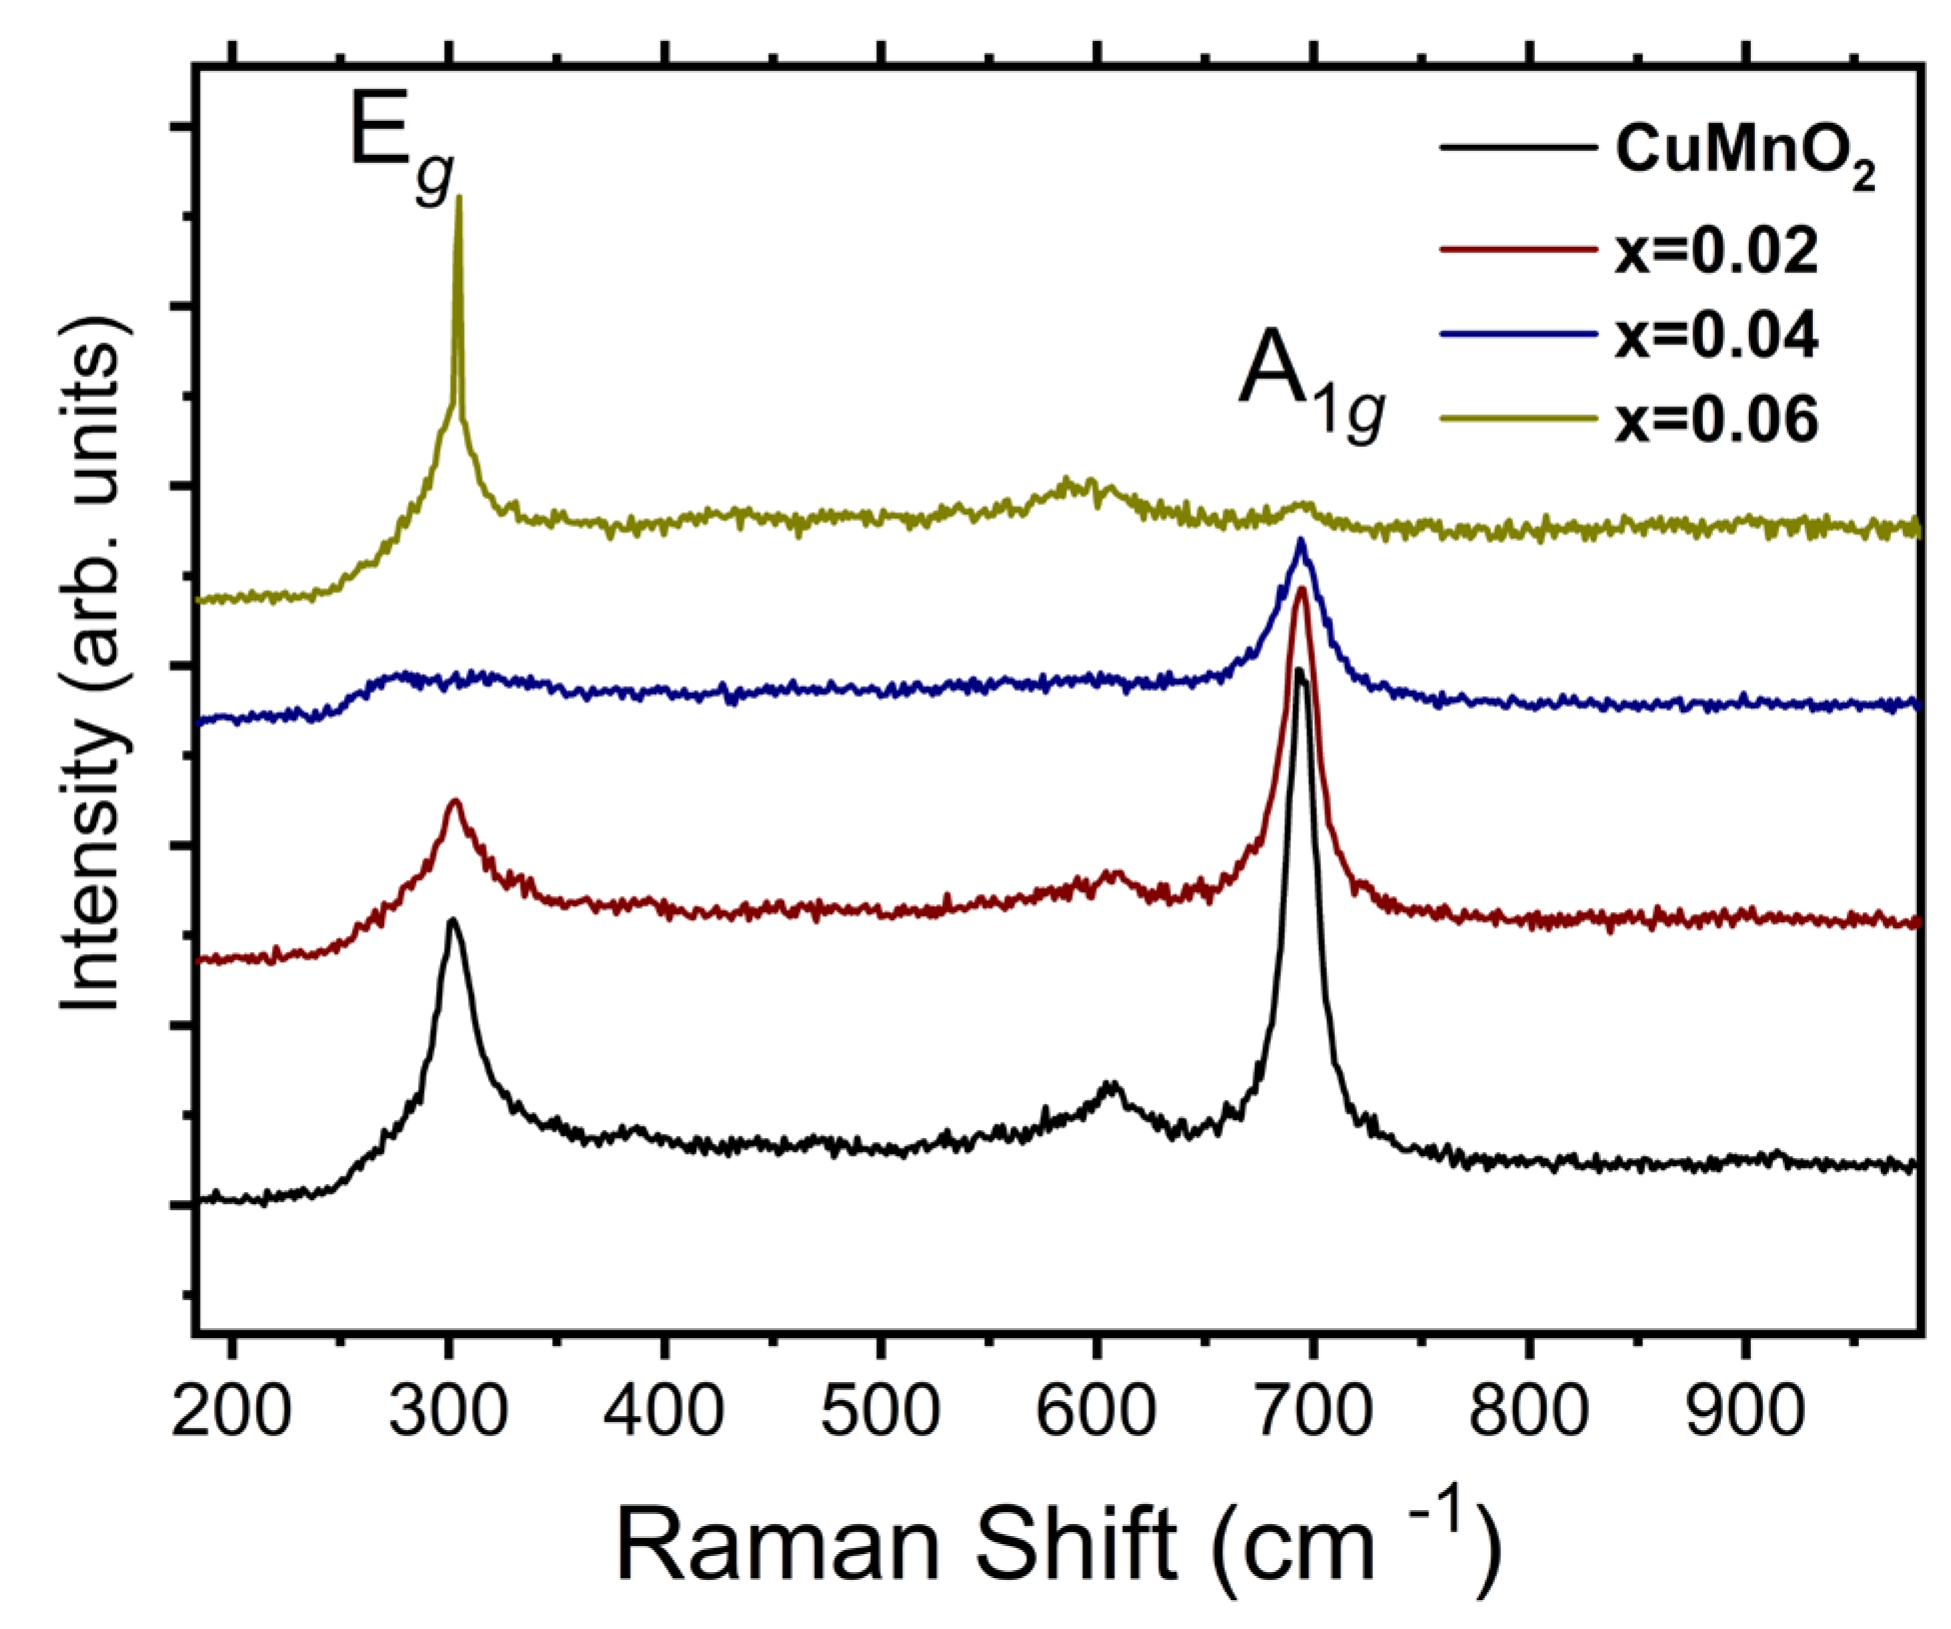
3.2. Raman Spectroscopy

The Raman spectra of the CuMn1−xMgxO2 (x = 0, 0.02, 0.04, and 0.06) crednerite compounds, obtained at room temperature, are shown in Figure 2. As seen in Figure 2, the Raman modes were characterized by two intense peaks at ~695 cm−1 and 320 cm−1, with different intensities depending on the sample.
The delafossite CuMO2 structure (R-3m space group) was reported with two Raman active modes: the mode A1g, which was attributed to O-Cu-O vibration along the c axis (around 700 cm−1 for CuMO2) [32,33,34], and Eg, derived from MO6 octahedra vibrations and thus, in the triangular lattice, perpendicular to the c axis (352 cm−1 for CuFeO2 [32], 457 cm−1 for CuCrO2 [32], 418 cm−1 for CuAlO2 [33], and 368 cm−1 for CuGaO2 [34].
For CuMnO2 crednerite, which has a delafossite-derivative structure, when synthesized via the sol–gel route [35] an intense Raman peak at 679 cm−1 and two weak Raman active modes, at 314 cm−1 and 381 cm−1, respectively, were observed.
The peak around 600 cm−1 was associated with the presence of a CuO secondary phase in all samples [36].

3.3. Electrical Properties

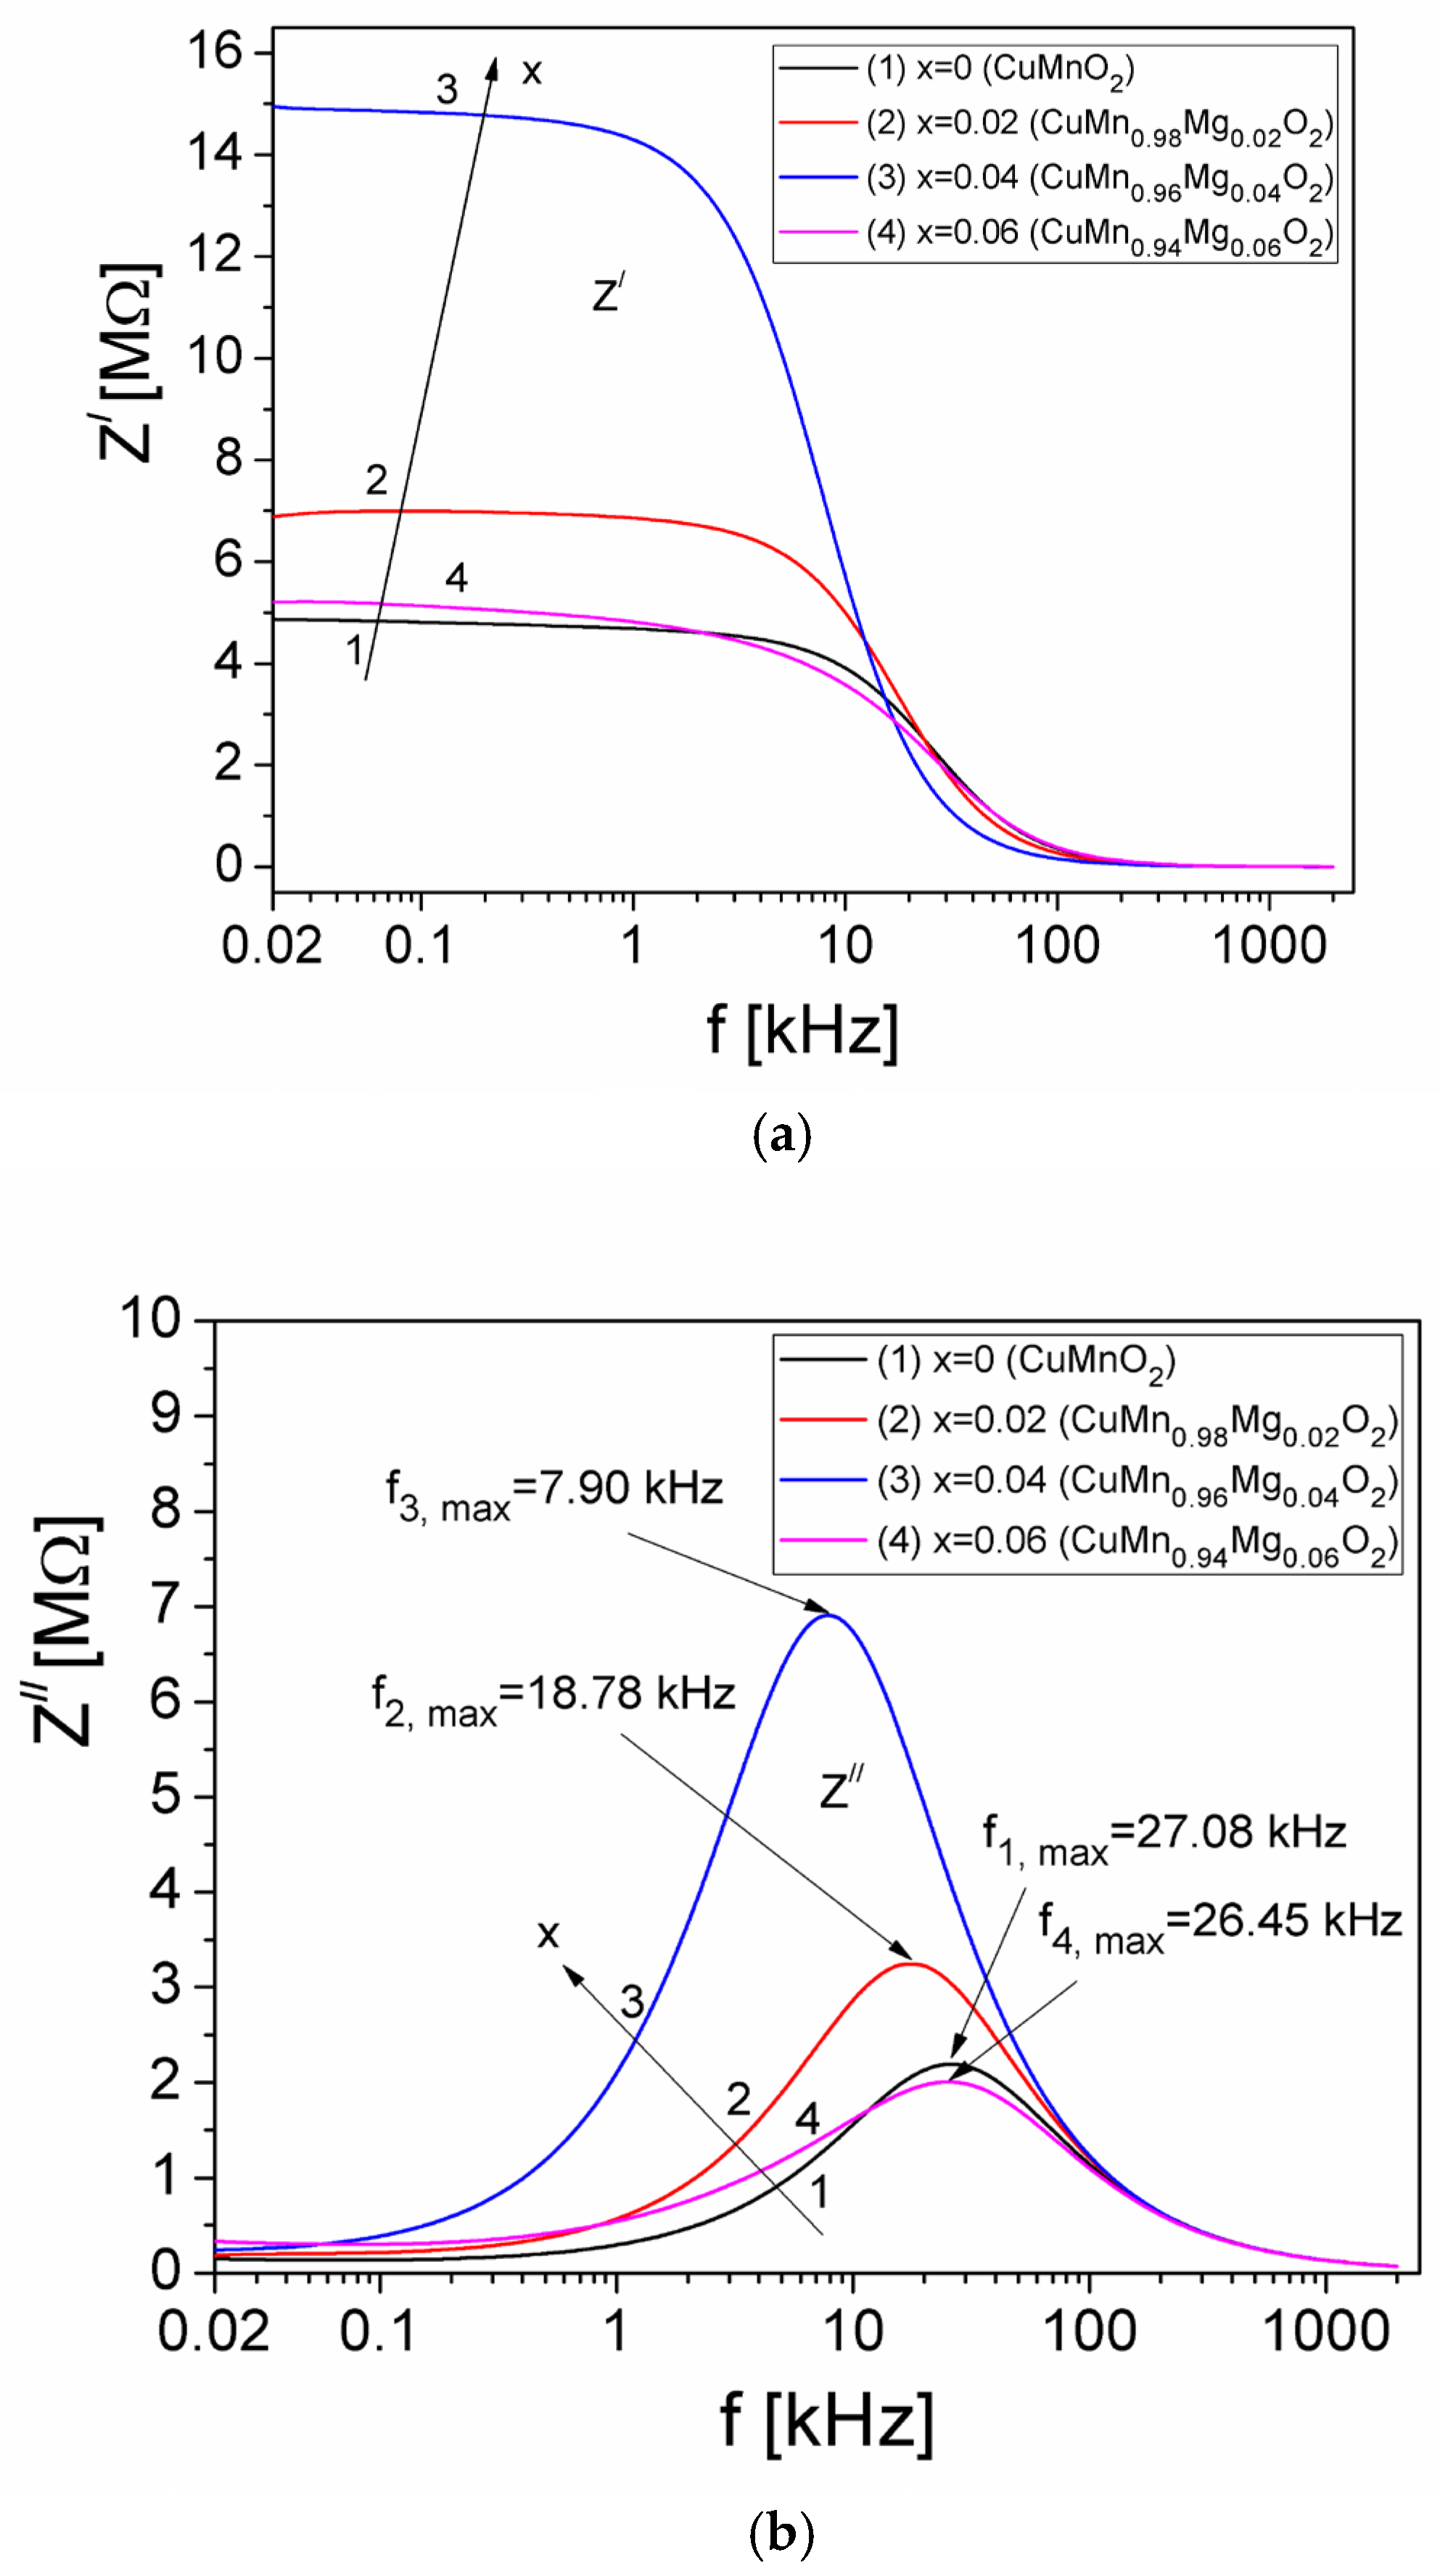
3.3.1. Complex Impedance

To analyze the electrical properties of the samples, complex impedance measurements were performed. Each sample of crednerite CuMn1−xMgxO2 (x = 0, 0.02, 0.04, and 0.06), which measured d = 8 mm in length, was inserted into a cylindrical glass tube with an internal cross-sectional area of A = 11.34 mm2, in contact with two copper electrodes, which represented a capacitive measuring cell [30], connected to an LCR meter (Agilent E4980A). For each concentration, x, of Mg in the crednerite sample, the real (Z′) and imaginary (Z″) components of the complex impedance of measurement cell filled with sample were measured, using a frequency ranging from 20 Hz to 2 MHz. The results, obtained at room temperature, are presented in Figure 3.
In Figure 3a, we can observe that, for each concentration, x, of Mg in CuMn1−xMgxO2, the real component, Z′, of the measurement cell remains approximately constant with the frequency, up to approximately 1 kHz; then, it decreases rapidly until approximately 100 kHz, after which Z′ decreases very slowly up to 2 MHz and the curves practically overlap. On the other hand, as can be seen in Figure 3b, the Z″ component of the measurement cell presents a maximum value for all concentrations, x, of Mg at a frequency denoted by fi,max (with i = 1 for x = 0, i = 2 for x = 0.02, i = 3 for x = 0.04, and i = 4 for x = 0.06). The appearance of this maximum value of the Z″ component shows the existence of an electrical relaxation process in the samples within the measurement cell [37], due to the presence of mobile charge carriers [27,28].
From the Debye equation, 2πfmaxτ = 1 [38], the experimental values of fi,max from Figure 3b and the relaxation times τZ corresponding to each concentration, x, of Mg substituted within CuMnO2 crednerite material were determined. The obtained values of τZ are presented in Table 2.

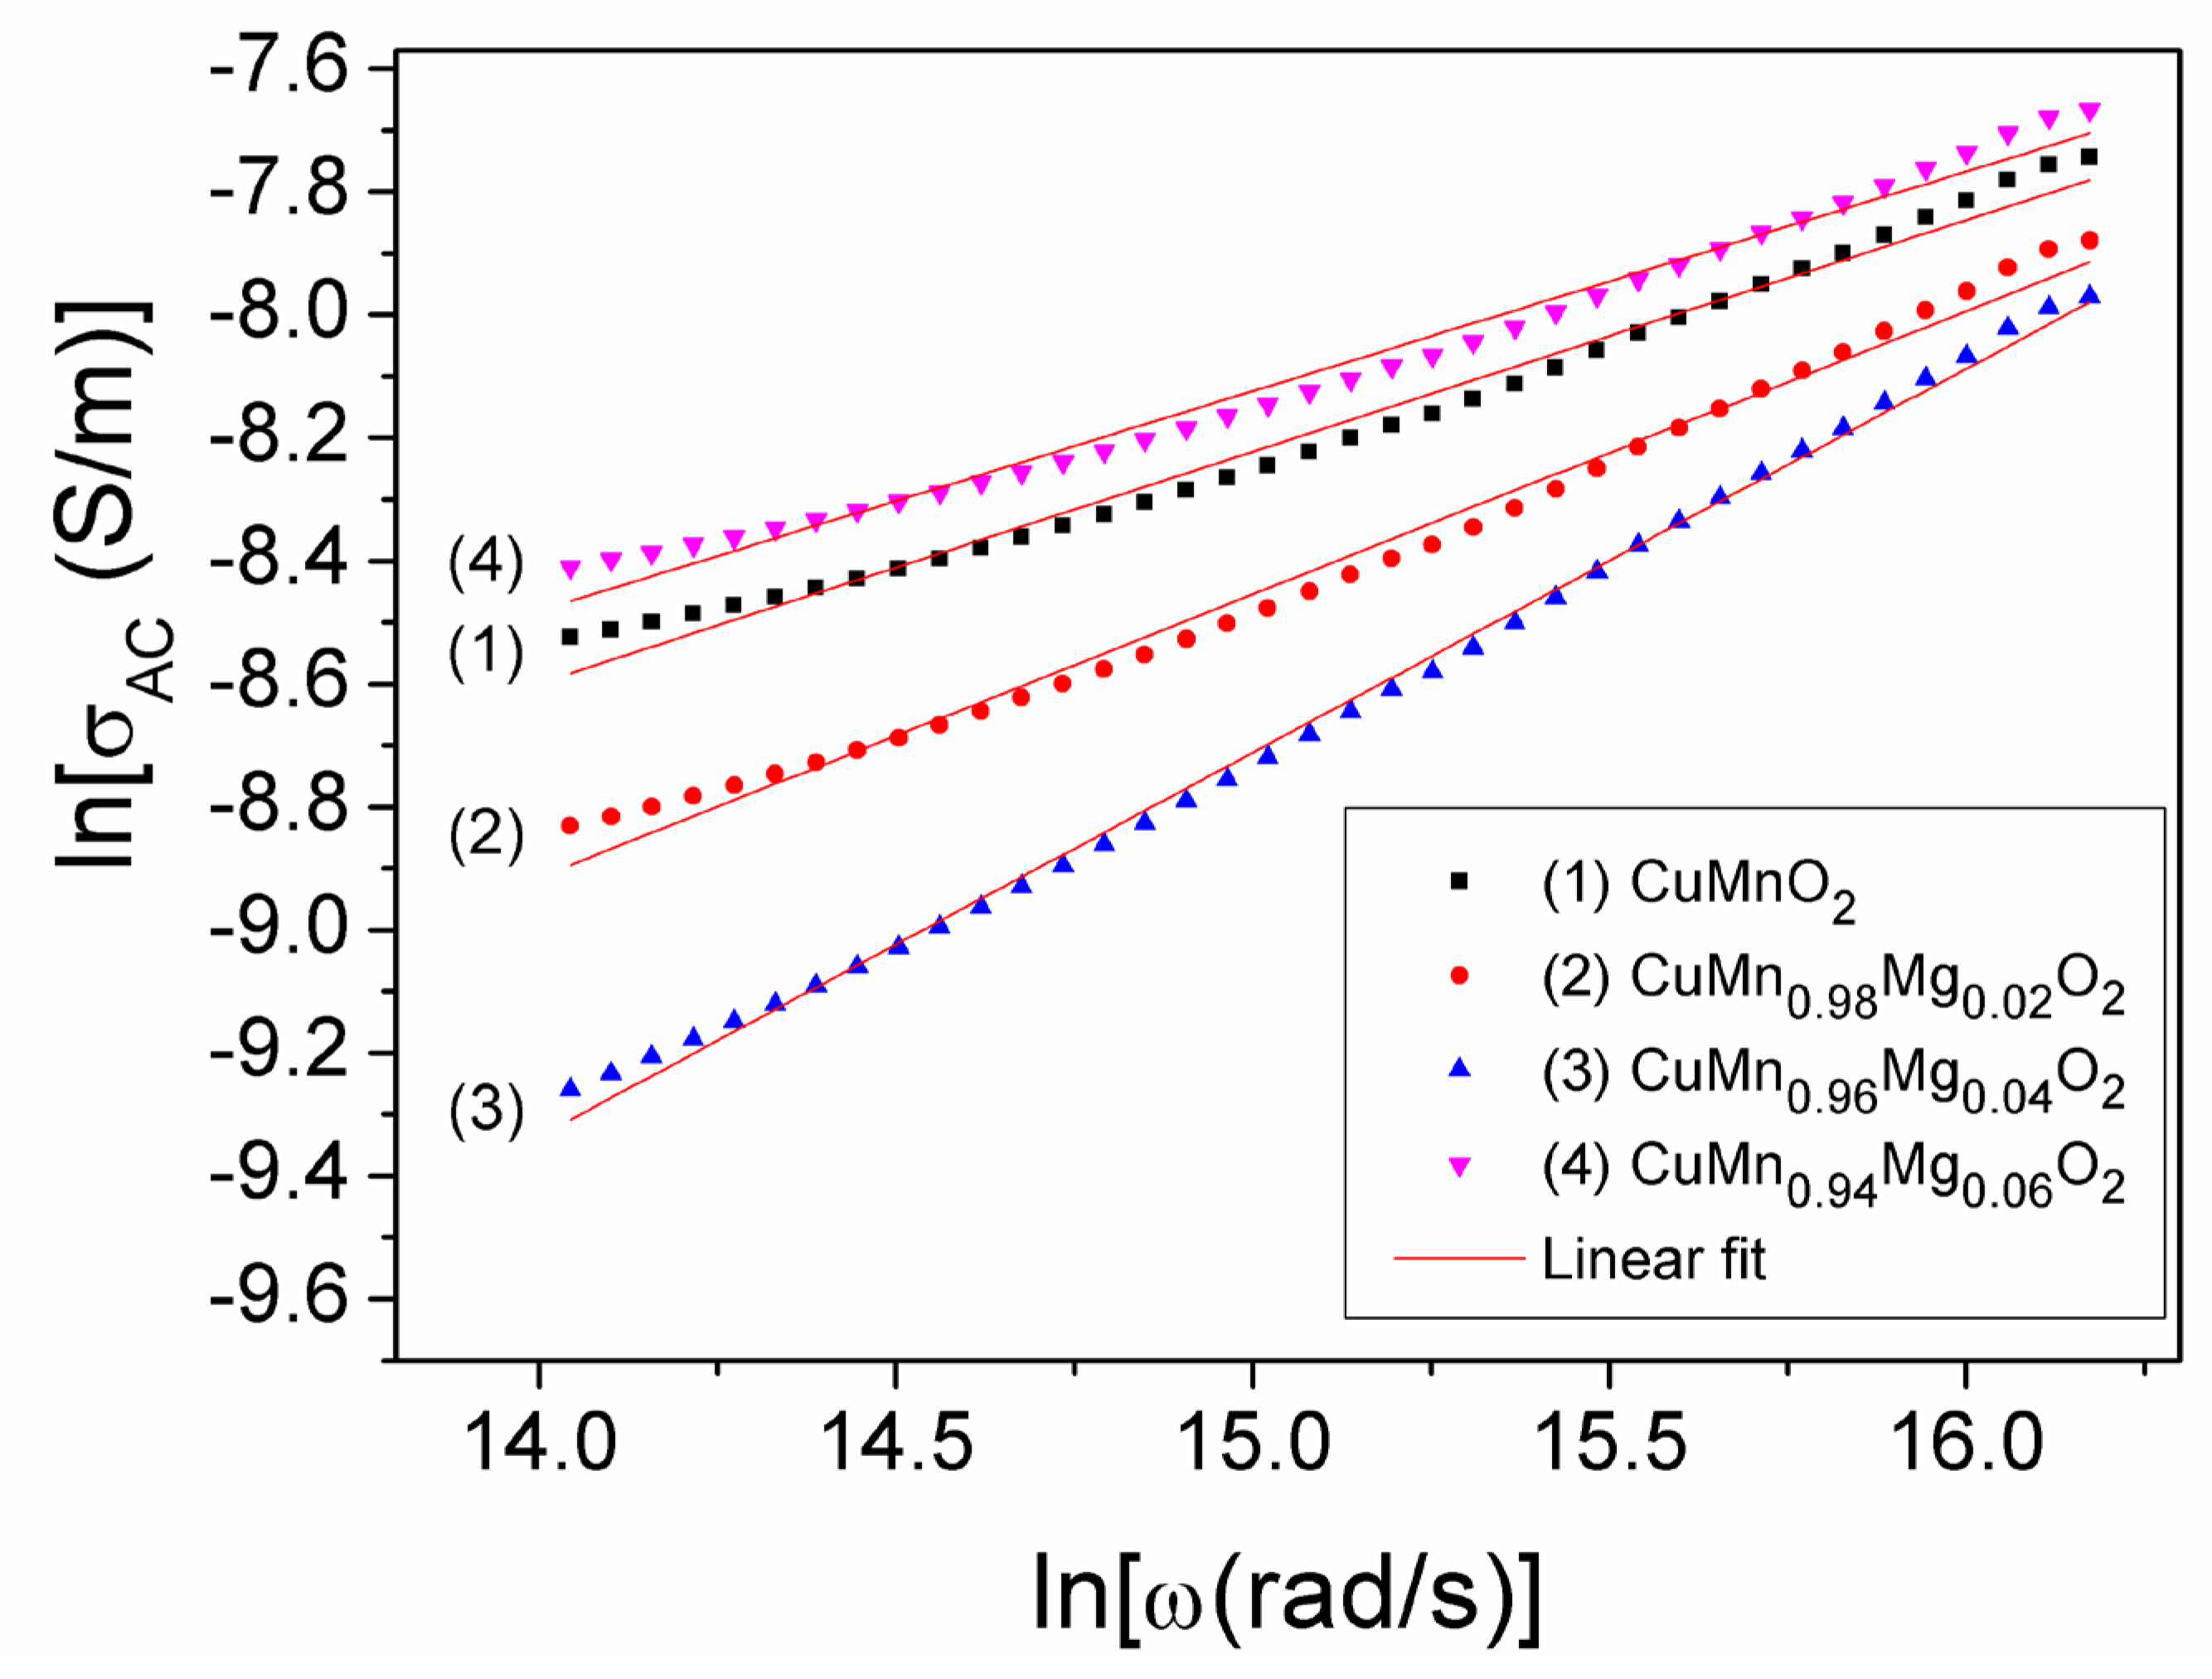
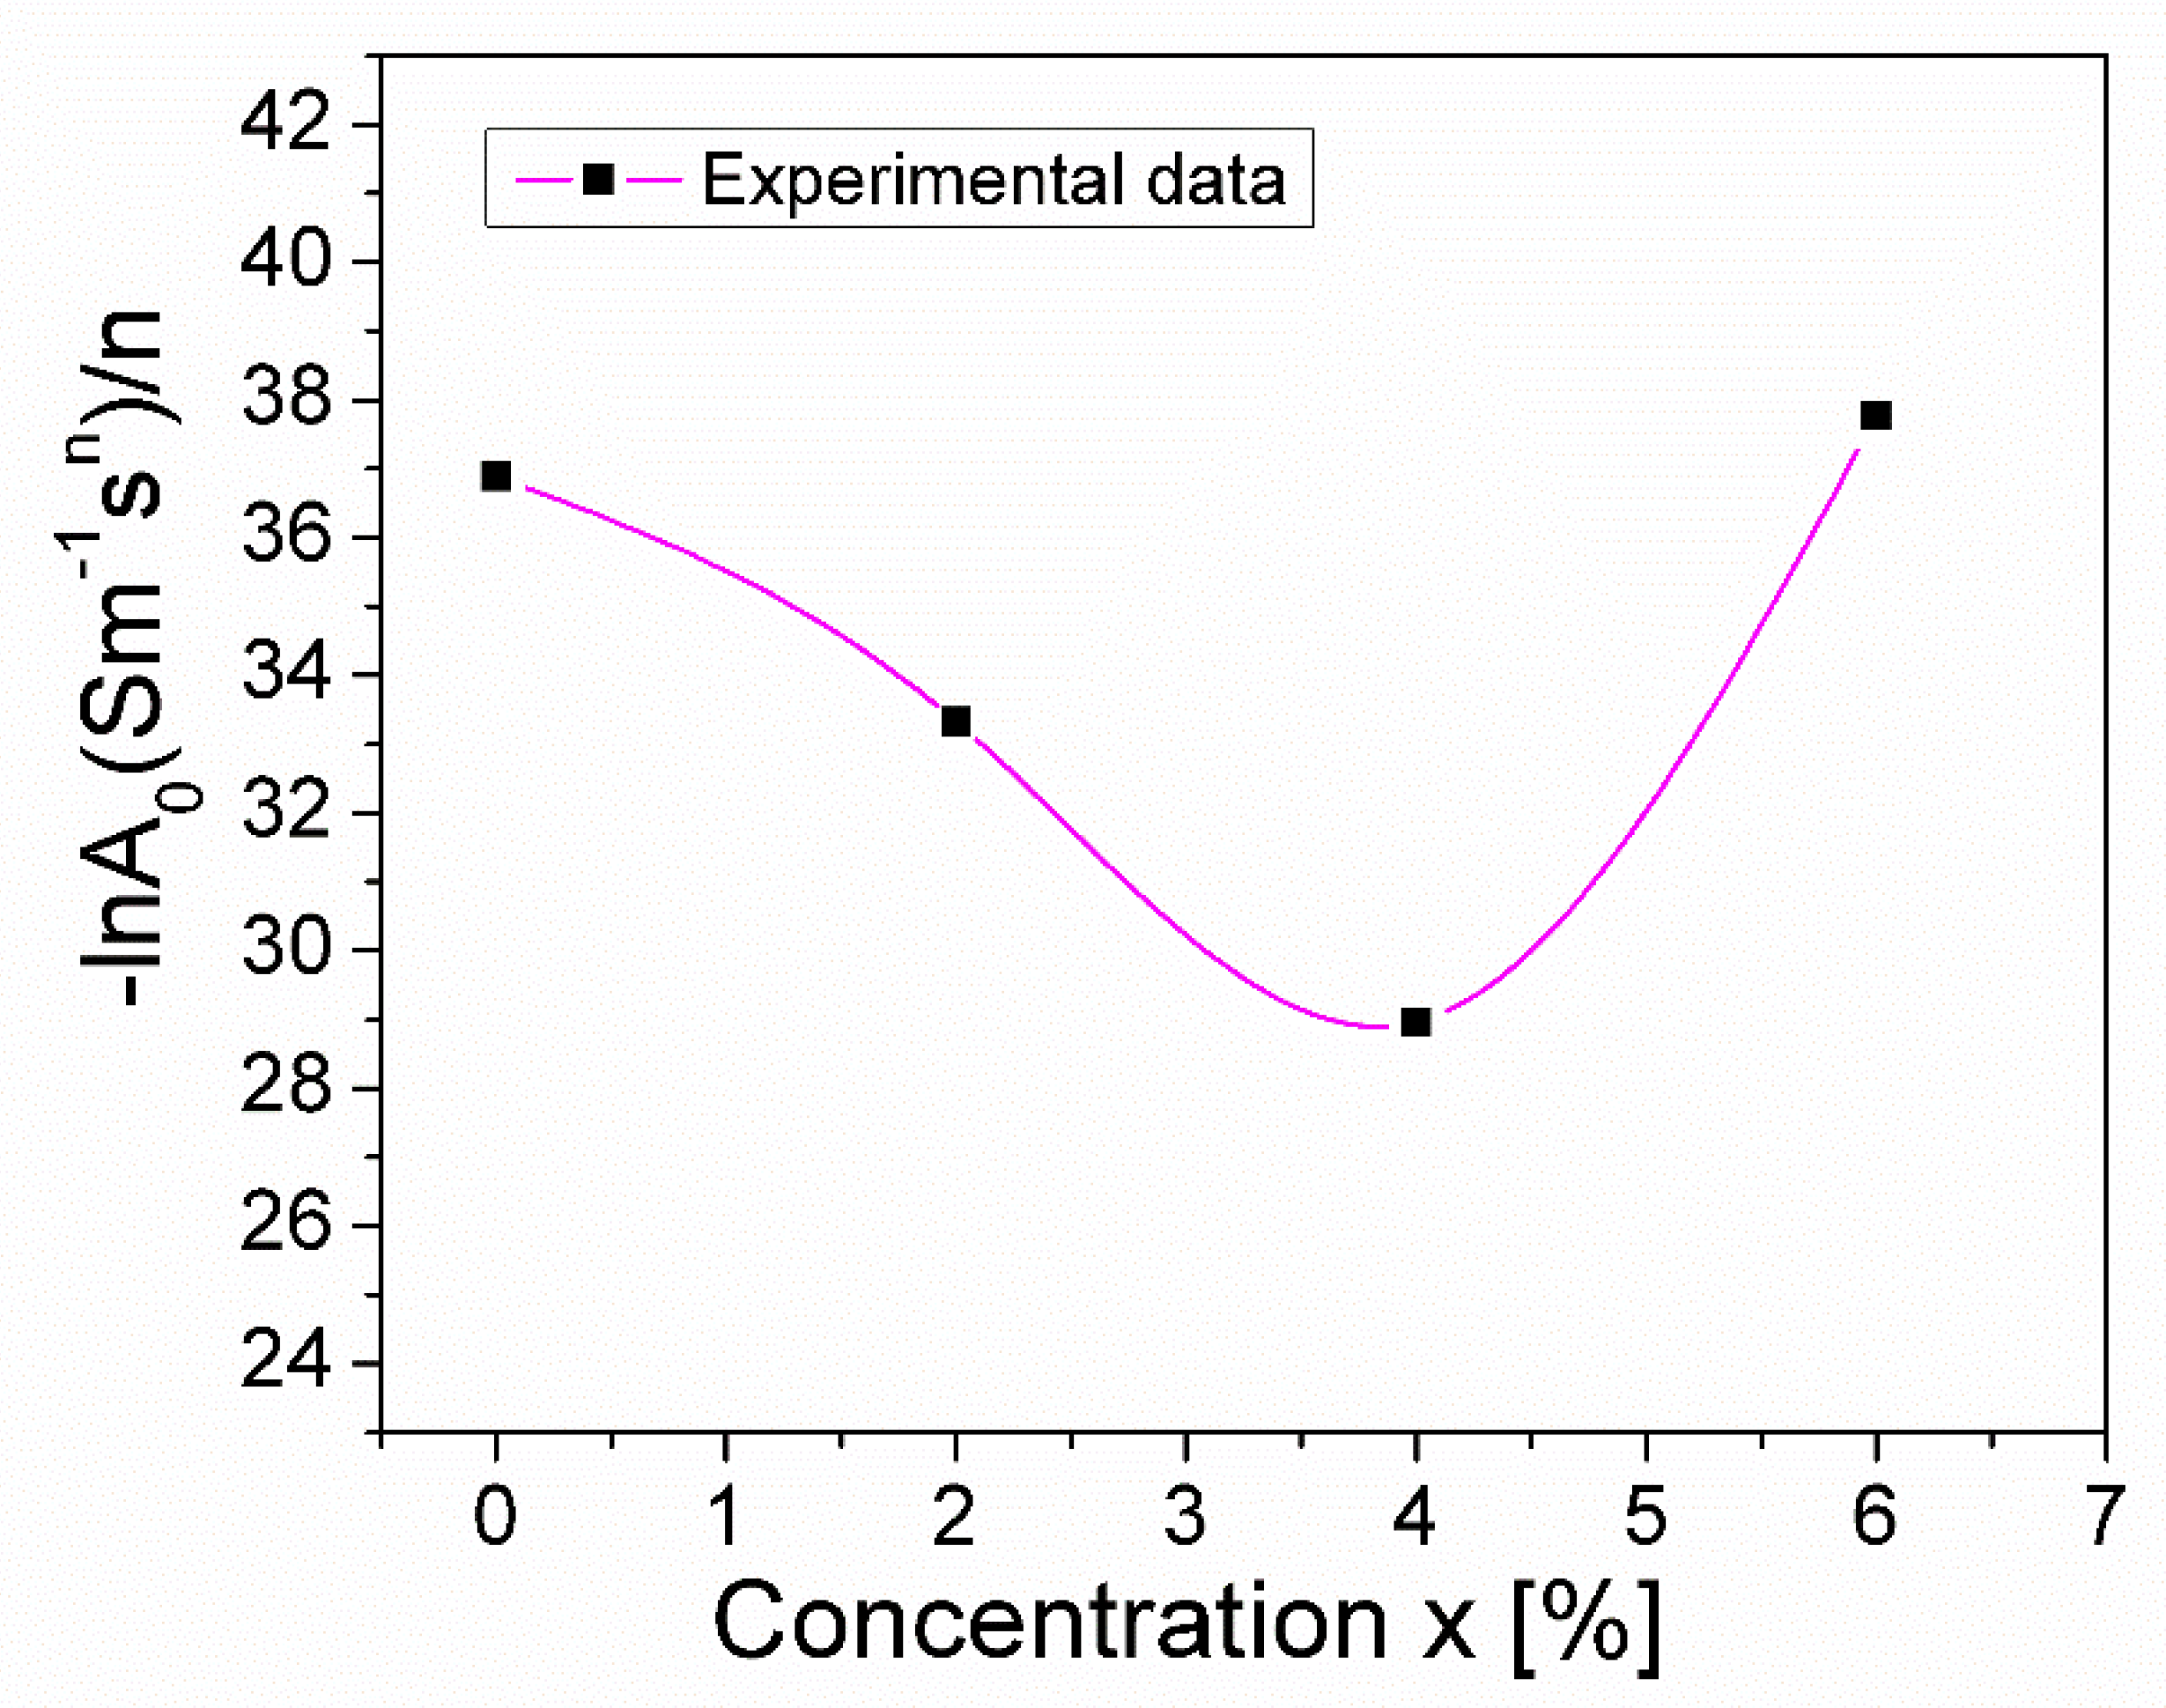
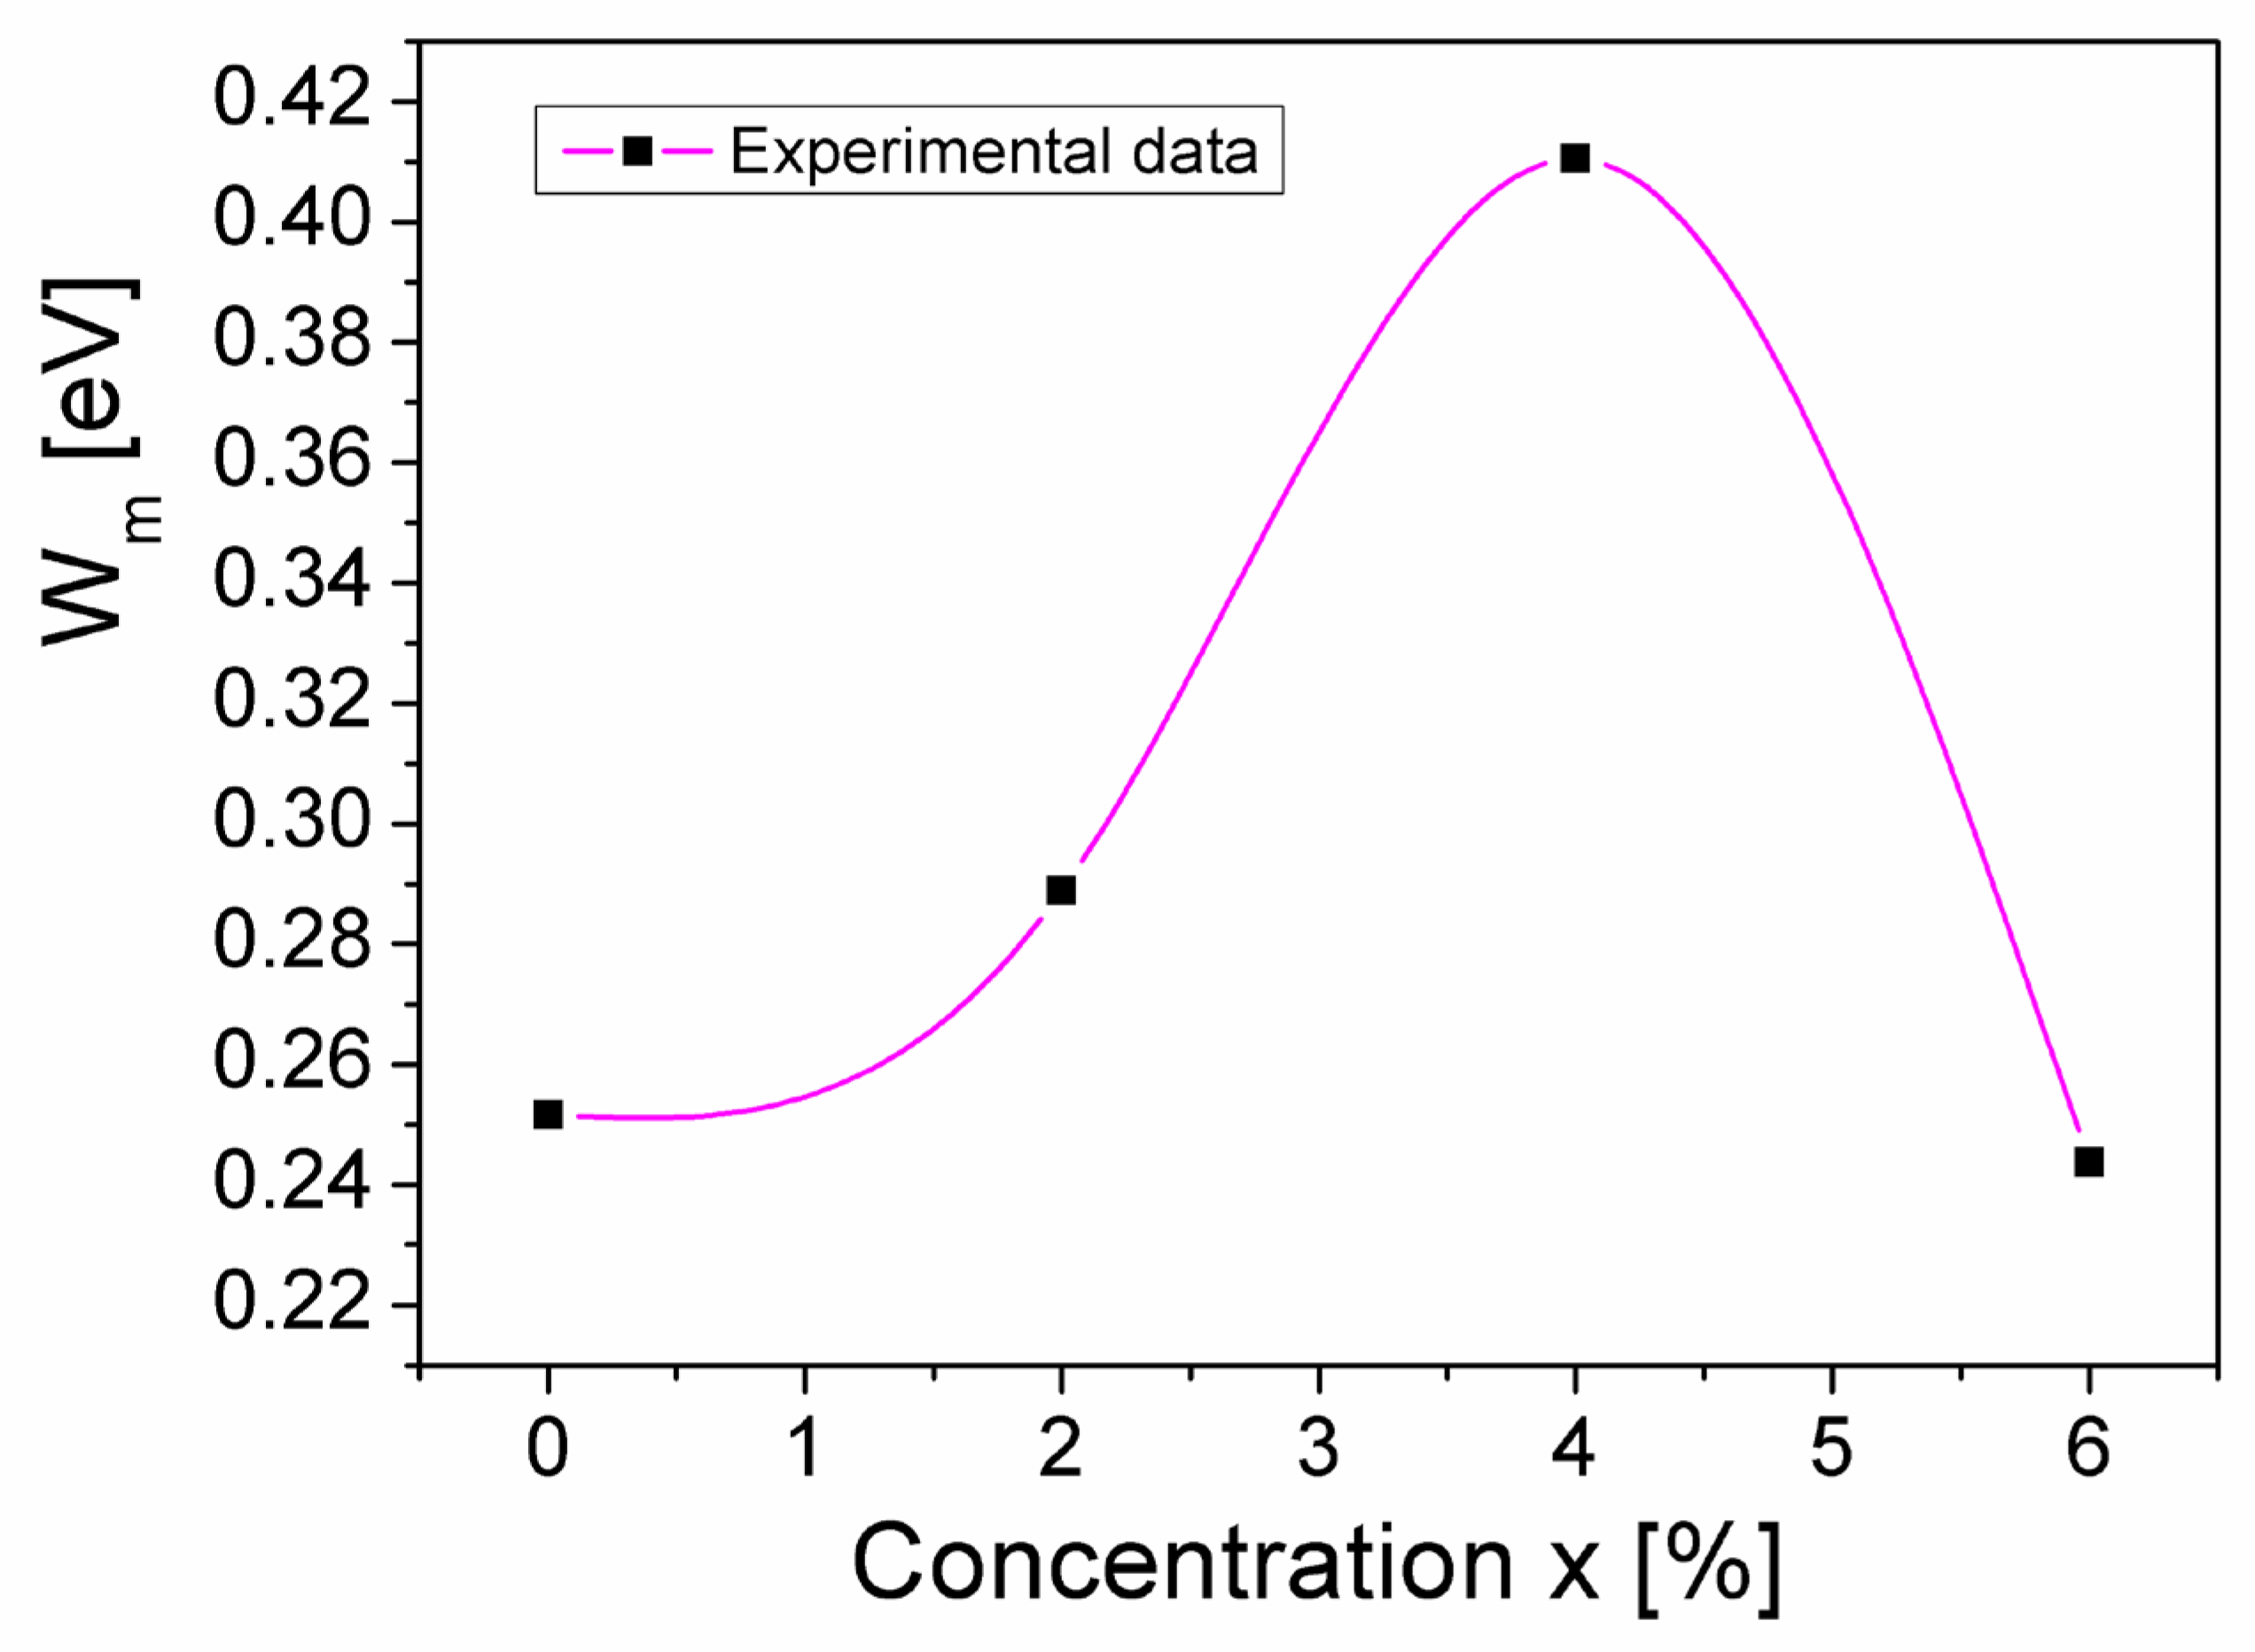
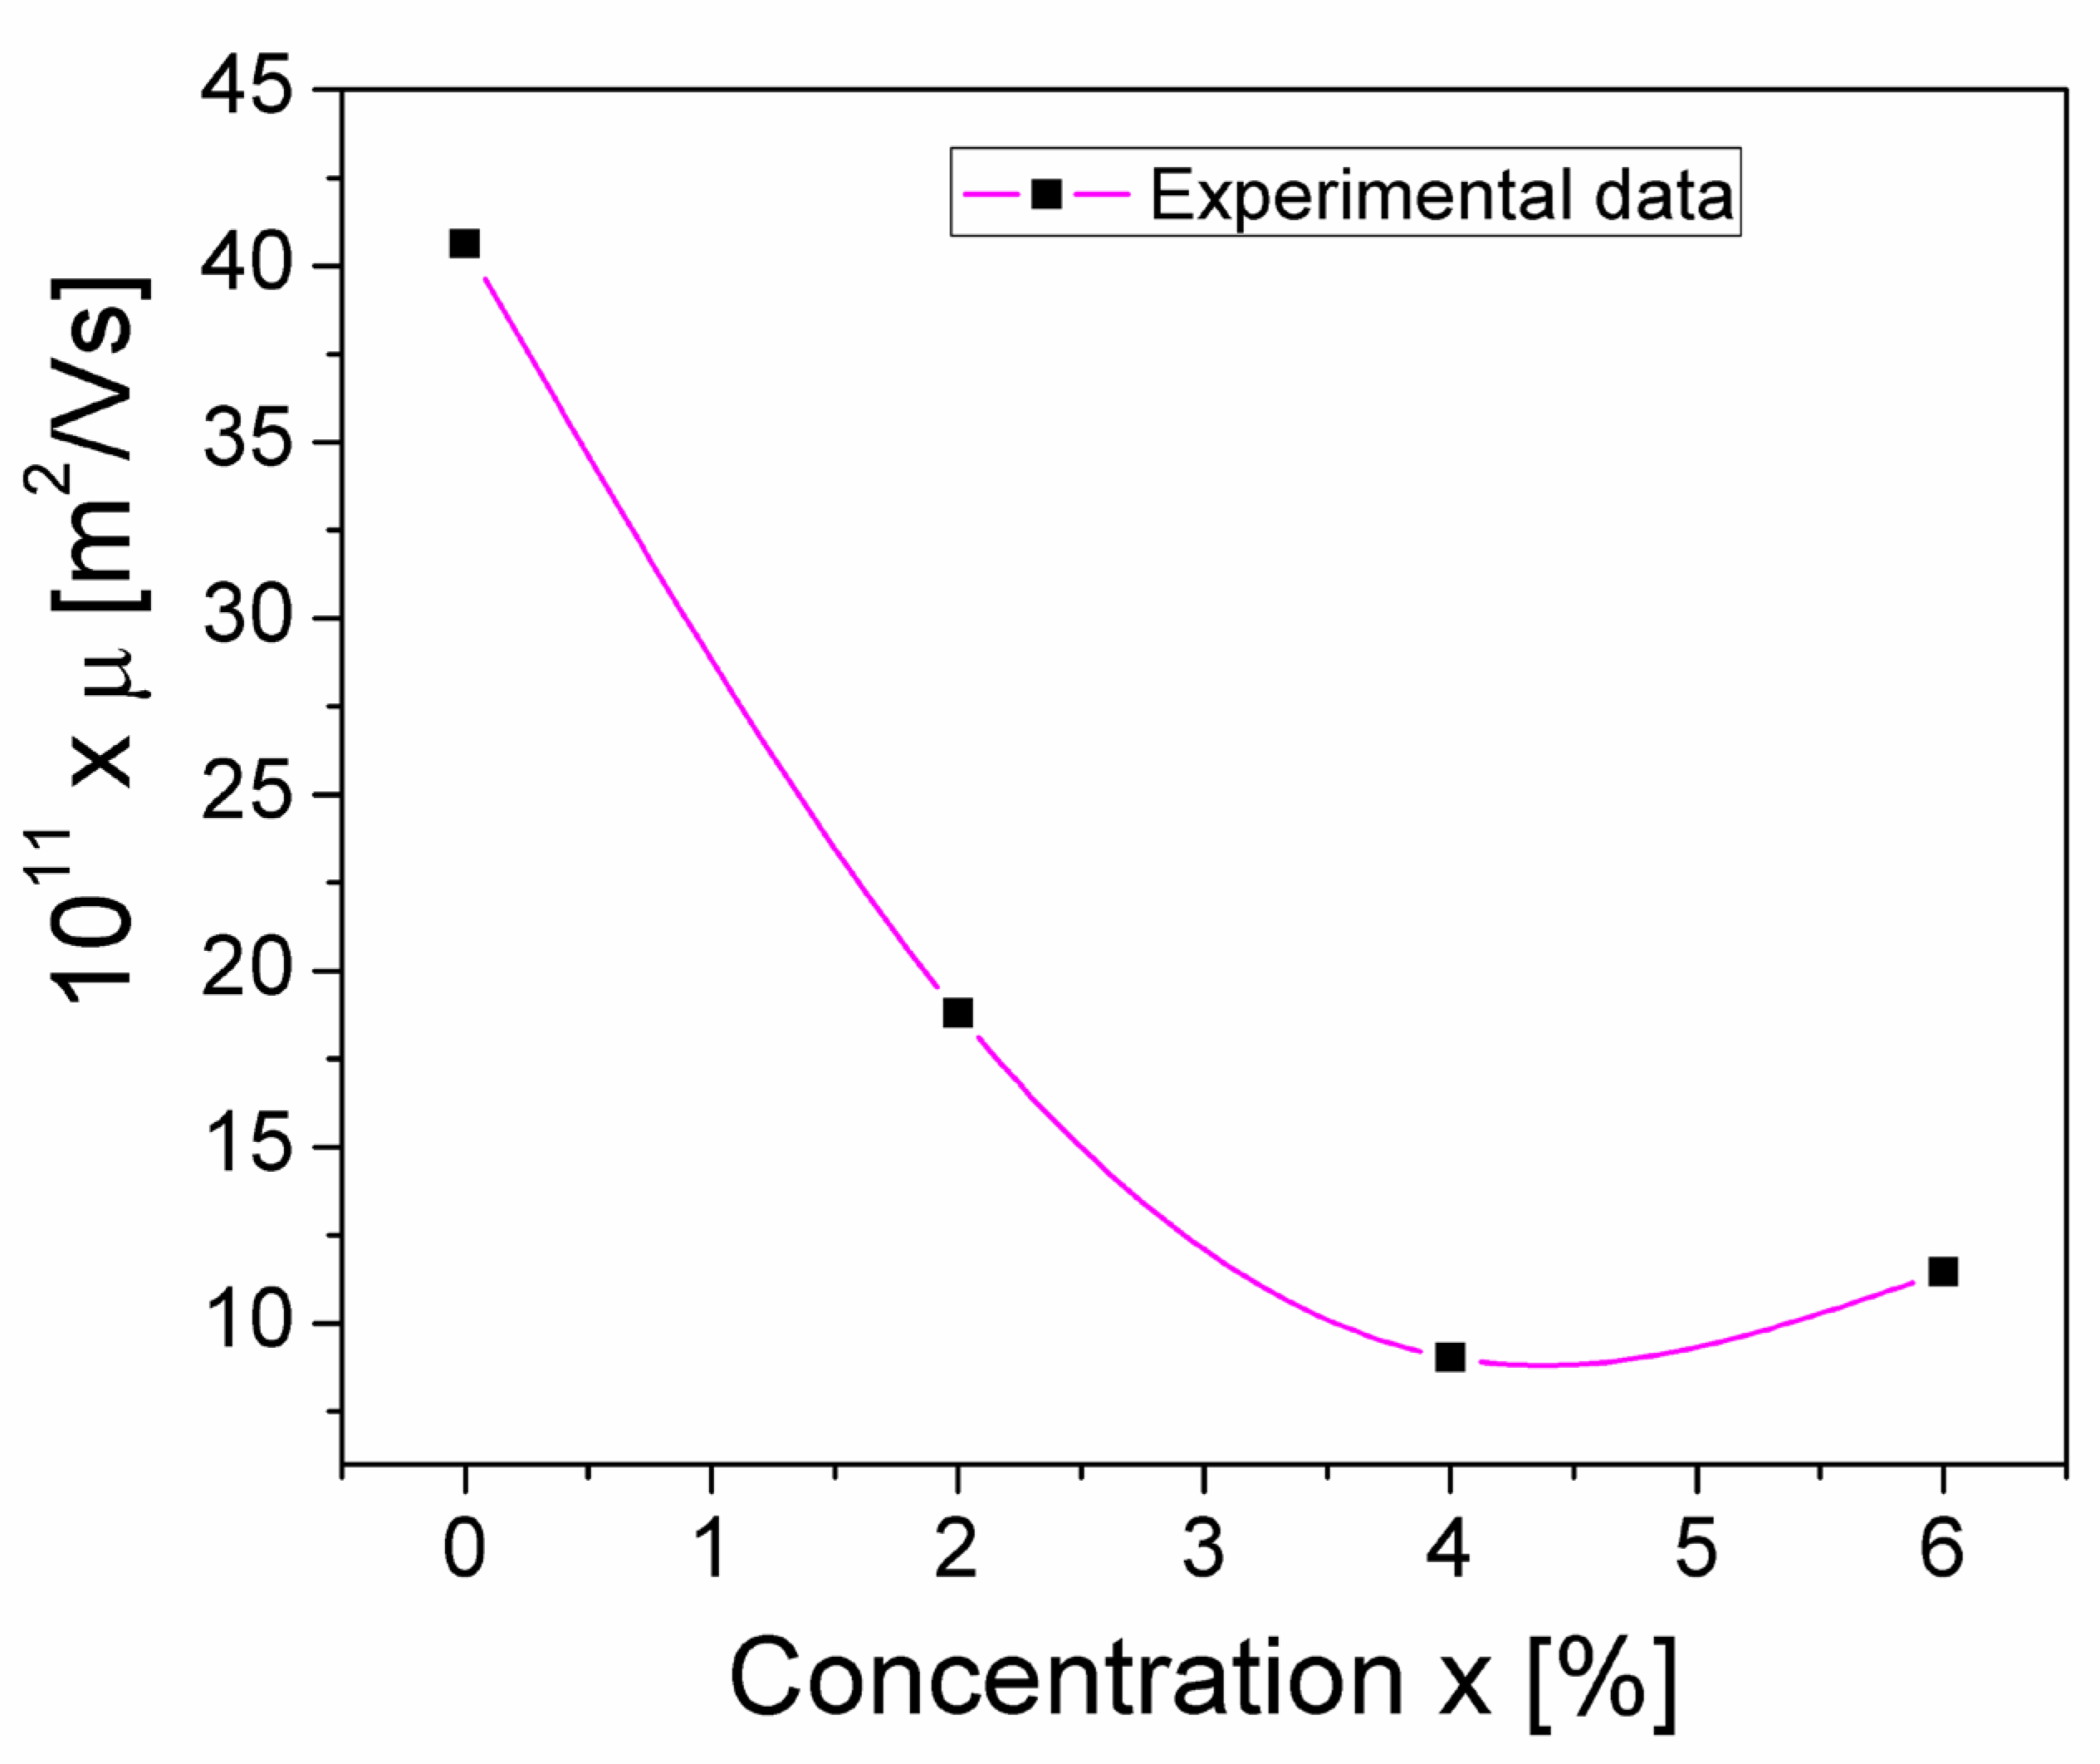
3.3.2. DC and AC Conductivity

Knowing the experimental values Z′ and Z″ of the complex impedance of the measurement cell filled with CuMn1−xMgxO2 from Figure 3, the total electrical conductivity σ of the samples was determined using the following equation:
σ = Z Z 2 + Z 2 d A
where d = 8 mm is the length of the sample and A = 11.34 mm2 is its cross-sectional area.
The frequency dependence of the electrical conductivity σ of the samples, under a frequency range of 20 Hz–2 MHz and at different concentrations (x) of Mg in CuMn1−xMgxO2, is shown in Figure 4.
As seen in Figure 4, for each concentration (x) of substituted Mg, the conductivity consists of two components according to Jonscher’s universal law [39], which is given by the following equation:
σ ( ω ) = σ D C + σ A C
where σDC represents the static conductivity (DC-conductivity), which does not vary with frequency, and σAC represents the dynamic conductivity (AC-conductivity), which rapidly increases with frequency.
As can be seen in Figure 4, σDC depends on x, practically irrespective of frequency below 0.1 kHz; obtained values of σDC are listed in Table 2. In Table 2, we can observe that, by increasing the concentration (x) from 0 to 0.06, σDC varies from 15.36 × 10⁻⁵ S/m to 16.42 × 10⁻⁵ S/m, with a minimum value of 4.98 × 10⁻⁵ S/m presented at a concentration of x = 0.04. Our obtained values for σDC are similar to those obtained by other authors for CuFe1−xCrxO2 (0 < x < 1) delafossite samples [37] or for Cu1+xMn1−xO2 crednerite samples (with x = 0–0.10) [40,41], where the substitution determines the increase in electrical resistivity.
In the region of high frequencies (Figure 4), the dynamic conductivity, σAC, increases rapidly with frequency for each concentration (x) of Mg substituted into crednerite material CuMn1−xMgxO2; this is correlated with the dielectric relaxation processes, due to charge carriers from the localized states within the samples [39], as follows:
σ A C = A 0 ω n
In Equation (3) n is an exponent dependent on frequency (0 < n < 1) [42] and A0 is a pre-exponential factor, given by the relation [40,43]:
A 0 = ω h n σ D C
where ωh is the crossover (hopping) frequency [42], i.e., the transition frequency from the DC regime to the AC regime, according to the universal Jonscher law [39].
If we logarithmize Equation (3), we obtain a near-linear relationship between ln(σAC) and ln(ω), whose graphic representation is shown in Figure 5 at different concentration values (x) of substituted Mg in the CuMn1−xMgxO2 crednerite sample. By fitting the experimental dependencies ln(σAC)(ln(ω)), we were able to determine both the exponent n and the parameter A0 corresponding to each concentration (x) of Mg substituted in the samples. The obtained results are listed in Table 2.
As can be observed from Table 2, increasing the concentration of the Mg substitution from x = 0 to x = 0.06, causes the exponent, n, to vary from 0.376 to 0.357, reaching a maximum value of 0.624 at x = 0.04. This variation in n can be correlated with the variation in concentration, x, of the ratio –lnA0/n (Figure 6), as shown in Refs. [44,45,46,47]. An appreciable change in this ratio (Figure 4) corresponds to a change in the static conductivity, σDC, due to the substitution of Mn3+ with Mg2+ (Figure 5). This modification in conductivity, σDC, may also be due to the presence of the CuO secondary phase, which was found in different quantities in the investigated samples and was highlighted using XRD analysis (see Table 1).
However, the presence of CuO is not the only cause that determines the electrical conductivity of the samples. Regarding the overall conductivity of the samples, we must also take into account the conductivity of the CuMn1−xMgxO2 particles, as well as the hopping of charge carriers from one particle to another. Thus, we should note that the sample with the smallest crystallite size (the one with x = 0.04) had the lowest electrical conductivity. The smallest crystallite size was associated with the highest surface area/volume ratio, i.e., that with the highest number of lattice defects, which are inevitable on a grained surface.
Considering the values of A0, n, and σDC from Table 2, using Equation (4), we determined, for the first time, the hopping frequency, ωh, corresponding to each concentration, x, of substituted Mg in the sample of CuMn1−xMgxO2; the values we obtained are listed in Table 2. The hopping frequencies, fh = ωh/, which indicate the switching frequency from the DC conductivity regime to the AC regime, are also shown in Figure 5 for each value, x, of Mg concentration.
In the high-frequency region, corresponding to σAC conductivity (Figure 4), the variation in frequency at different concentrations, x, of Mg is similar to the σAC dependence previously found for different temperatures σAC(f, T) [26]. As a result, for the analysis of this conduction mechanism at high frequencies, the correlated barrier hopping model (CBH) proposed by Pike [28] was used. This model explains σAC dependence as being due to the short distance hopping of charge carriers between sites separated by energy barriers of different heights [39,42]. According to the CBH model, the exponent n (see Table 2), or its first approximation [28], is given by the following equation:
n = 1 6 k B T W m
where kB is the Boltzmann constant, T is the absolute temperature, and Wm represents the maximum barrier height (equal to the band gap energy) [26,28]. Considering the values n of the samples (see Table 2) and knowing that the thermal energy, kBT, at room temperature (T = 300 K) is KBT = 0.026 eV, Wm can be determined using Equation (5). In Figure 7, the concentration dependence of the energy barrier, Wm, of the CuMn1−xMgxO2 samples is presented.
From Figure 7, it can be seen that, as the concentration of Mg substitution (x) in the crednerite sample CuMn1−xMgxO2 increases from 0 to 0.06, the band gap energy, Wm, varies from 0.25 eV to 0.24 eV, reaching a maximum value of 0.41 eV at x = 0.04. This “increase and decrease” of Wm associated with x aligns with the variation in σDC conductivity associated with the concentration of substituted Mg (see Table 2); this does not have a simple cause. First of all, we must keep in mind that Wm is determined by conductivity measurements of samples that do not have a single phase. Thus, Wm is an apparent (effective) quantity, because it results from the overall conductivity of the sample (which is determined by the presence of the secondary phase CuO, the crystallinity of the grains, the surface defects, the surface/volume ratio, and, last but not least, the lattice vibrations). If we consider the lattice vibrations, we cannot help but notice, in Figure 2 and Figure 7, that the sample corresponding to x = 0.04 has the most attenuated Raman spectra peaks and the highest apparent Wm energy. Also, the sample with x = 0.04 has the highest surface/volume ratio and, hence, the highest number of surface defects. These defects act as traps for the mobile charge carriers and make it more difficult for them to jump from one localized state to another; therefore, again, the apparent Wm is higher.

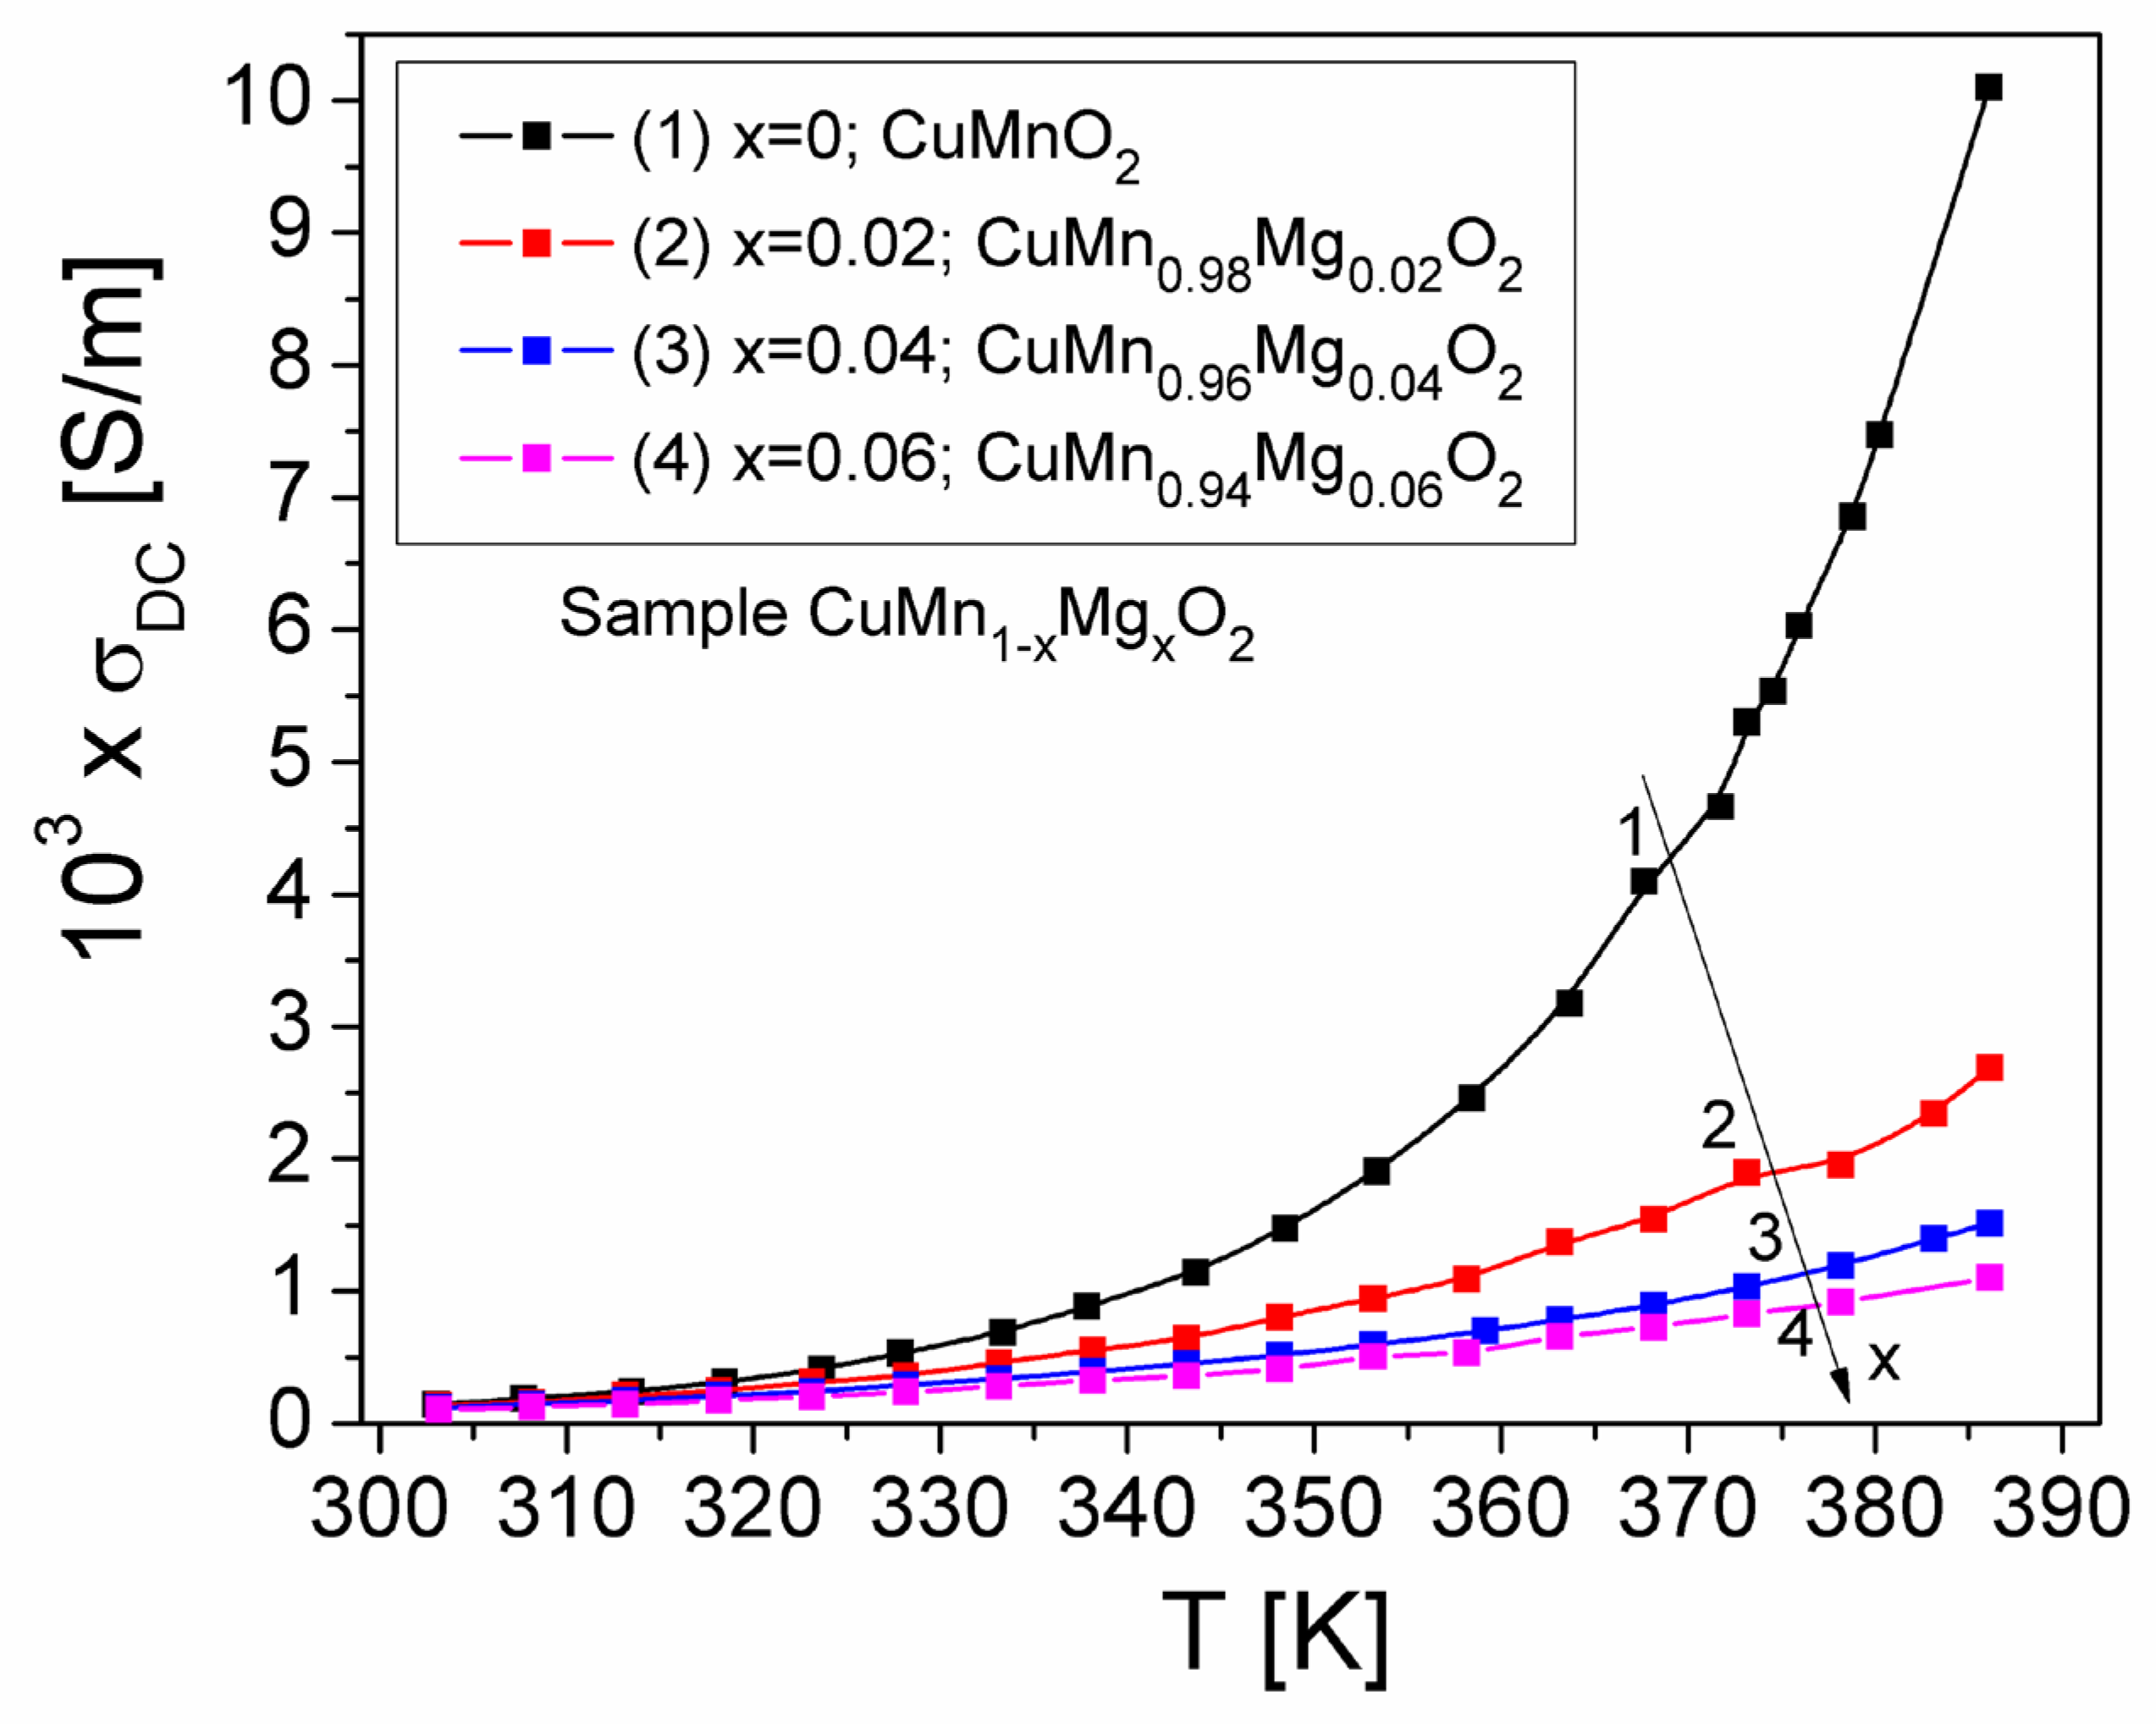
Temperature Dependence of DC Conductivity

To investigate the temperature dependence of the static conductivity, σDC(T), of the CuMn1−xMgxO2 crednerite samples with concentration values of x = 0, 0.02, 0.04, and 0.06, we performed static measurements of the electrical resistance, R, of the samples at different temperatures, T, ranging from 300 to 390 K, using the method described in Ref. [30].
Figure 8 shows the temperature dependence of the σDC(T) conductivity of the CuMn1−xMgxO2 crednerite samples. The static conductivity, σDC(T), increases with temperature (Figure 8) for all concentrations (x) of substituted Mg, indicating that the conduction process is thermally activated in the temperature range of 300–390 K within a static field. At the same time, the increase in σDC conductivity with temperature, for each concentration (x) of Mg, demonstrates a semiconductor-type behavior; this is due to the increase in the drift mobility of charge carriers in the sample, according to Mott’s VRH model [27]. Also, in Figure 8, we can observe that, by increasing the concentration of substituted Mg in the crednerite CuMn1−xMgxO2 sample, the conductivity, σDC, decreases. Similar behavior of the static conductivity, σDC(T), with the temperature was also obtained for other materials such as Cu1+xMn1−xO2 (x = 0 and 0.06) crednerite materials [26] or vivianite polycrystalline materials [48].
If the values σDC(T), corresponding at all values, x of the Mg concentration, agree with the VRH model [27], it results:
σ D C ( T ) = σ 0 exp T 0 / T 1 / 4
where, σ0 represents the pre-exponential factor of the conductivity and T0 is the characteristic temperature coefficient, which can be calculated from the relationship [26,27],
T 0 1 / 4 = 4 E A , c o n d k B T 3 / 4
where EA,cond is the thermal activation energy of conduction.
By applying the logarithm of Equation (6), Figure 9 presents the experimental dependence, ln(σDC) on (1/T1/4), of each sample, corresponding to the concentration of substituted Mg (x) in CuMn1−xMgxO2. From the linear fitting of the experimental dependence ln(σDC)(1/T1/4) (Figure 9), the values of the slope ( T 0 1 / 4 ) of these dependences, corresponding to each Mg concentration, x, were obtained and are indicated in Figure 9. Using the determined T0 values and Equation (7), the thermal activation energy of conduction, EA,cond, was calculated for three temperatures (300 K, 323 K, and 353 K) per concentration values (x) of Mg. These values are shown in Table 3, where it is observed that, with an increase in temperature, EA,cond increases for all Mg concentrations. Additionally, from Table 3, it is observed that, at a constant temperature, increasing the concentration (x) of Mg leads to a decrease in EA,cond, which corresponds to a decrease in σDC conductivity, as also observed in Figure 8. The values obtained for EA,cond are in agreement with those obtained by other authors in Ref. [37] (0.43 eV), for the CuFe0.165Cr0.835O2 delafossite sample doped with 3% Mg or in Ref. [25] (0.57 eV) for the delafossite powder of CuGaO2 sample, respectively 0.3 eV for CuGa0.98Ca0.02O2.
As a result, in Figure 8 and Figure 9, we can observe that the temperature dependence of the conductivity component in DC-related studies do not demonstrate a reverse trend, as in the case of the component in AC-related studies, which can be observed in the other figures in the paper. We consider that this could be due to the complexity of the samples and to the inclusion of a CuO secondary phase in the samples.
According to Mott’s VRH model for the conduction mechanism, the hopping distance, Rh, and the hopping energy, Wh, are defined [27] by the following equations:
R h = 9 8 a k B T N ( E F ) 1 / 4
W h = 3 4 π R h 3 N ( E F )
In these relations, a ≈ 109 m−1, is the degree of localization and N(EF) is the density of localized states near the Fermi level, EF [27], which can be determined with the relation [26,27]:
N ( E F ) = λ a k B T 3 4 E A , c o n d 4
where, λ ≈ 16.6, is a dimensionless constant [27]. Equations (8)–(10) allow the calculation of the hopping distance, Rh, hopping energy, Wh and the density of localized states at the Fermi level, N(EF), knowing the EA,cond values of the samples (Table 3) at the three temperatures, T. The calculated values are listed in Table 3. From Table 3 it is observed that at a constant concentration, x of Mg, N(EF) remains constant and is independent of temperature. Additionally, Table 3 shows that at a constant temperature, both Rh and Wh decrease with increasing x. Also, at a constant x, as the temperature increases, the hopping distance, Rh decreases while the hopping energy, Wh increases. This behavior can be attributed to the interaction of charge carriers with phonons [49].
According to the Mott and Davis VRH theoretical model [27], regarding the transport of charge carriers in the investigated samples, the relationship which establishes a link between the hopping frequency ωh and the static conductivity σDC, can be written in the form,
σ D C = N C e 2 R h 2 ω h 12 π k B T
where, e is the charge of electron, NC is the number density of effective charge carriers [47] and Rh is the hopping distance (Table 3). As a result, based on VRH model and Equation (11), NC can be determined for the first time, at room temperature, for such crednerite type samples. The obtained values for NC are indicated in Table 2. It can be observed that NC increases with increasing x and the NC values corresponding to concentrations x = 0.02 and x = 0.04 are close to the NC values for CuMnO2 (x = 0). We must note that NC is correlated with EA,cond, that is, the lower EA,cond, the higher Nc (see Table 2 and Table 3). The results obtained are like those obtained by other authors in Ref. [47] for crednerite CuFeO2 doped with 3% Mg. It is known that [37,47], the charge carriers’ mobility μ, of crednerite samples can be determined, with the relation:
μ = σ D C e   N C
From Equations (11) and (12) by performing some simple computations we obtained for the first time a new simplified equation that allows determination of the mobility μ, of the charge carriers from CuMn1−xMgxO2 crednerite investigated samples, for all concentrations x of Mg substituted:
μ = R h 2 ω h 12 π V T
where VT = kBT/e, is the thermal voltage, which, at room temperature (T = 300 K), has a value of 26 mV. Using Equation (13), the Mg concentration dependence of the charge carrier’s mobility, μ, was determined; this μ(x) dependence is shown in Figure 10. The μ values are of the same order of magnitude as values obtained by other authors for similar samples of crednerite [37].
As seen in Figure 10, a sharp decrease in μ is observed as the concentration increases above x = 0, reaching a minimum at x = 0.04. This shows that the mobility of the charge carriers decreases in the substituted samples compared to the unsubstituted CuMnO2 crednerite sample (x = 0).
This behavior is a combined result of several causes; because the samples have two phases (CuO and CuMn1−xMgxO2, with different percentages between samples), the size of the crystallites and the surface/volume ratio change, and, therefore, the defects differ from one sample to another due to the surface. If we are only considering the surface/volume ratio, the sample with x = 0 has the largest crystallite size, so surface defects have a lower proportion than the volume; therefore, surface traps for mobile charge carriers are less frequent in the sample with x = 0, leading to higher charge carrier mobility. We also have to note the correlation between crystallite size and charge carrier mobility (the sample with x = 0.04 has the smallest crystallite size and the lowest charge carrier mobility value). Also, the percentage of the secondary phase seems to affect the mobility of charge carriers; in Table 1 and Figure 10, we note that the sample with x = 0.04 has the highest percentage of CuO and the lowest mobility of charge carriers.
This reduction in mobility leads to a decrease in the static conductivity, σDC, at room temperature, as also observed experimentally (Figure 4 and Table 2).

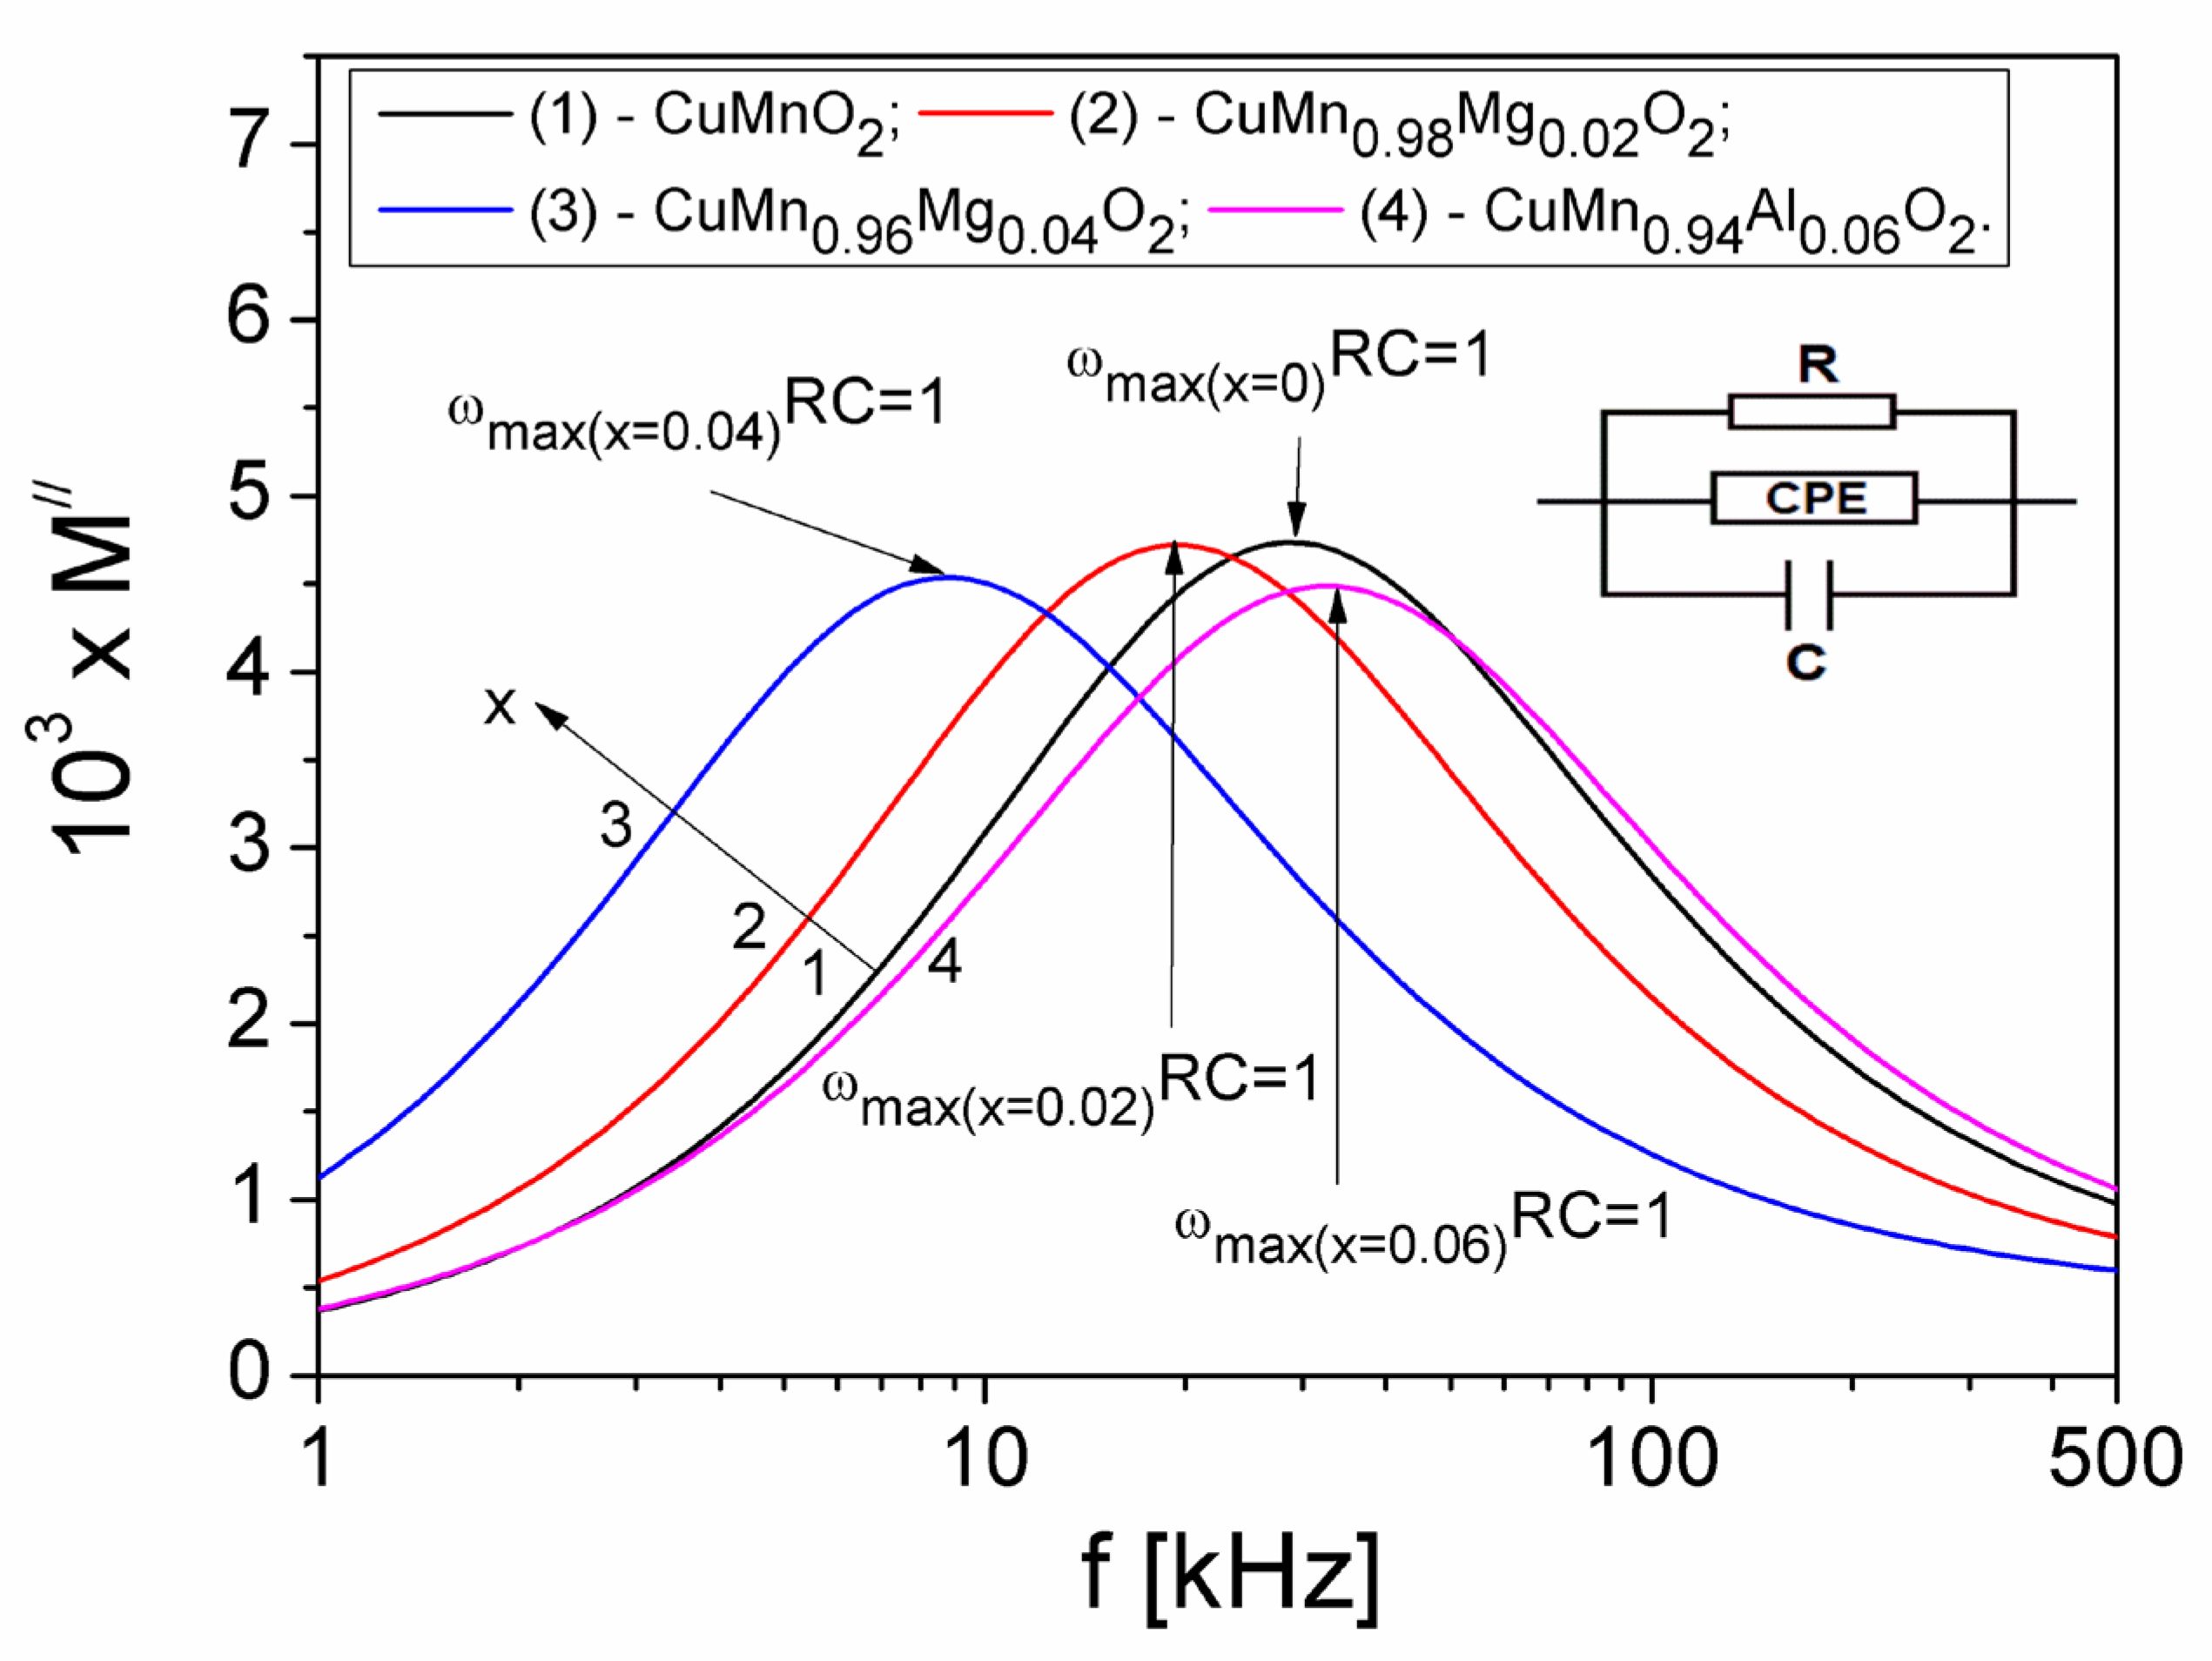
3.3.3. Electrical Modulus

It is known that the electrical relaxation processes in samples in the form of powders [50] can be investigated by analyzing the frequency behavior of the real (M′) and imaginary (M″) components of the electric modulus, M. The components M′ and M″, can be computed with the relations:
M = ω ε 0 A d Z
M = ω ε 0 A d Z
where ε0 is the permittivity of the free space.
Frequency dependence of the real (M′) and imaginary (M″) components of the electric modulus of samples, in the frequency range (20 Hz–2 MHz) and at different concentrations x of substituted Mg in the crednerite CuMnO2 material, is shown in Figure 11.
From Figure 11, it can be observed that, at a low frequency, M′ is very small for all substituted Mg concentrations (x) in the crednerite sample CuMn1−xMgxO2, which shows that the polarization effects at the electrode–sample interface are reduced [51]. By increasing the frequency f, the M′ component increases continuously and trends towards a constant value of approximately 0.0115 for each value of x, namely the concentration of substituted Mg. The imaginary component M″ presents a maximum for each concentration x, corresponding to a frequency, fmax,(M). From Figure 3b and Figure 11), it can be observed that, at any concentration of Mg in the crednerite sample CuMn1−xMgxO2, fmax(M) > fmax(Z) [52]. This indicates that the analysis based on M″ offers a better separation between the relaxation processes and conduction losses than one based solely on Z″ or ε″ [51]. Using the Debye equation, we have computed the relaxation times τM, the obtained values being listed in Table 2.
In the technique of impedance spectroscopy [53], the sample to be investigated is placed in a capacitive cell, whose equivalent circuit is a parallel circuit made up of the capacity C and the resistance R of the material (here, the crednerite sample). Sometimes, to estimate the electrical properties of a real material with conduction losses, the R-C equivalent circuit will also include the constant phase element (CPE), which is introduced due to the deviation from the ideal capacitive behavior of the material in the capacitive measurement cell [52]; therefore, the equivalent electrical model will be RQC, which also takes into account the constant phase element. The presence of this element “Q” in the equivalent circuit of the investigated material is correlated with the universal Jonscher law, which can be calculated using the following equation [54]:
C = R 1 n Q 1 / n
In this relationship, n is the exponent obtained from AC-conductivity measurements, being indicated in Table 2, for each value x of the concentration of Mg substituted in the crednerite sample, CuMn1−xMgxO2.
To estimate the R, C and Q values and their dependence on the concentration x of the Mg substituted in the crednerite sample, CuMn1−xMgxO2, in Figure 12, both the dependence M″ (f) for different values x of the concentration of Mg substituted and the equivalent parallel circuit RQC, were represented.
It is known [53] that, in terms of RC electric circuit, the relaxation time τM can be defined with the relation, τM = RC, meaning that the Debye equation can be written in the following form: 2πfmaxRC = 1. At the same time, the peak amplitude M”(f), as seen in the curves in Figure 12, is proportional to the capacitance C, i.e., M”max = C0/2C, where C0 is the capacitance of the cell without a sample (C0 = 0.0125 pF). As a result, with these relationships, the R and C values corresponding to each concentration of substituted Mg in the crednerite material CuMn1−xMgxO2 can be determined. The values obtained are shown in Table 2. Knowing these R and C values, as well as the values of the exponent n from Table 2, we can determine the values of the constant phase element “Q” using Equation (16), as shown in Table 2.
In Table 2, it is observed that the capacity C of the equivalent electrical circuit of the CuMn1−xMgxO2 crednerite samples increases from 1.320 pF (for x = 0) to 1.393 pF (for x = 0.06). This increase in the capacity C will determine an increase in the dielectric polarization and therefore in the dielectric permittivity by increasing the concentration of substituted Mg in the CuMn1−xMgxO2 crednerite sample (x). Table 2 also shows that, when increasing the concentration of Mg from x = 0 to x = 0.06, the electrical resistance R of the samples varies from 4.151 MΩ to 3.502 MΩ, reaching a maximum value of 12.892 MΩ at x = 0.04. This behaviour is consistent with the electrical conductivity of the samples and depends on several factors already mentioned.
From another perspective, the behaviour of the resistance, R, of the equivalent electric circuit is correlated to the mobility of the charge carriers in the samples (see Table 2 and Figure 10), as this behaviour is specific to materials with low dielectric losses [53]. The decrease in the resistance, R, when the concentration increases from 0.04 to 0.06 shows a decrease in the mobility of the charge carriers in the samples and therefore a possible increase in the dielectric losses [53].

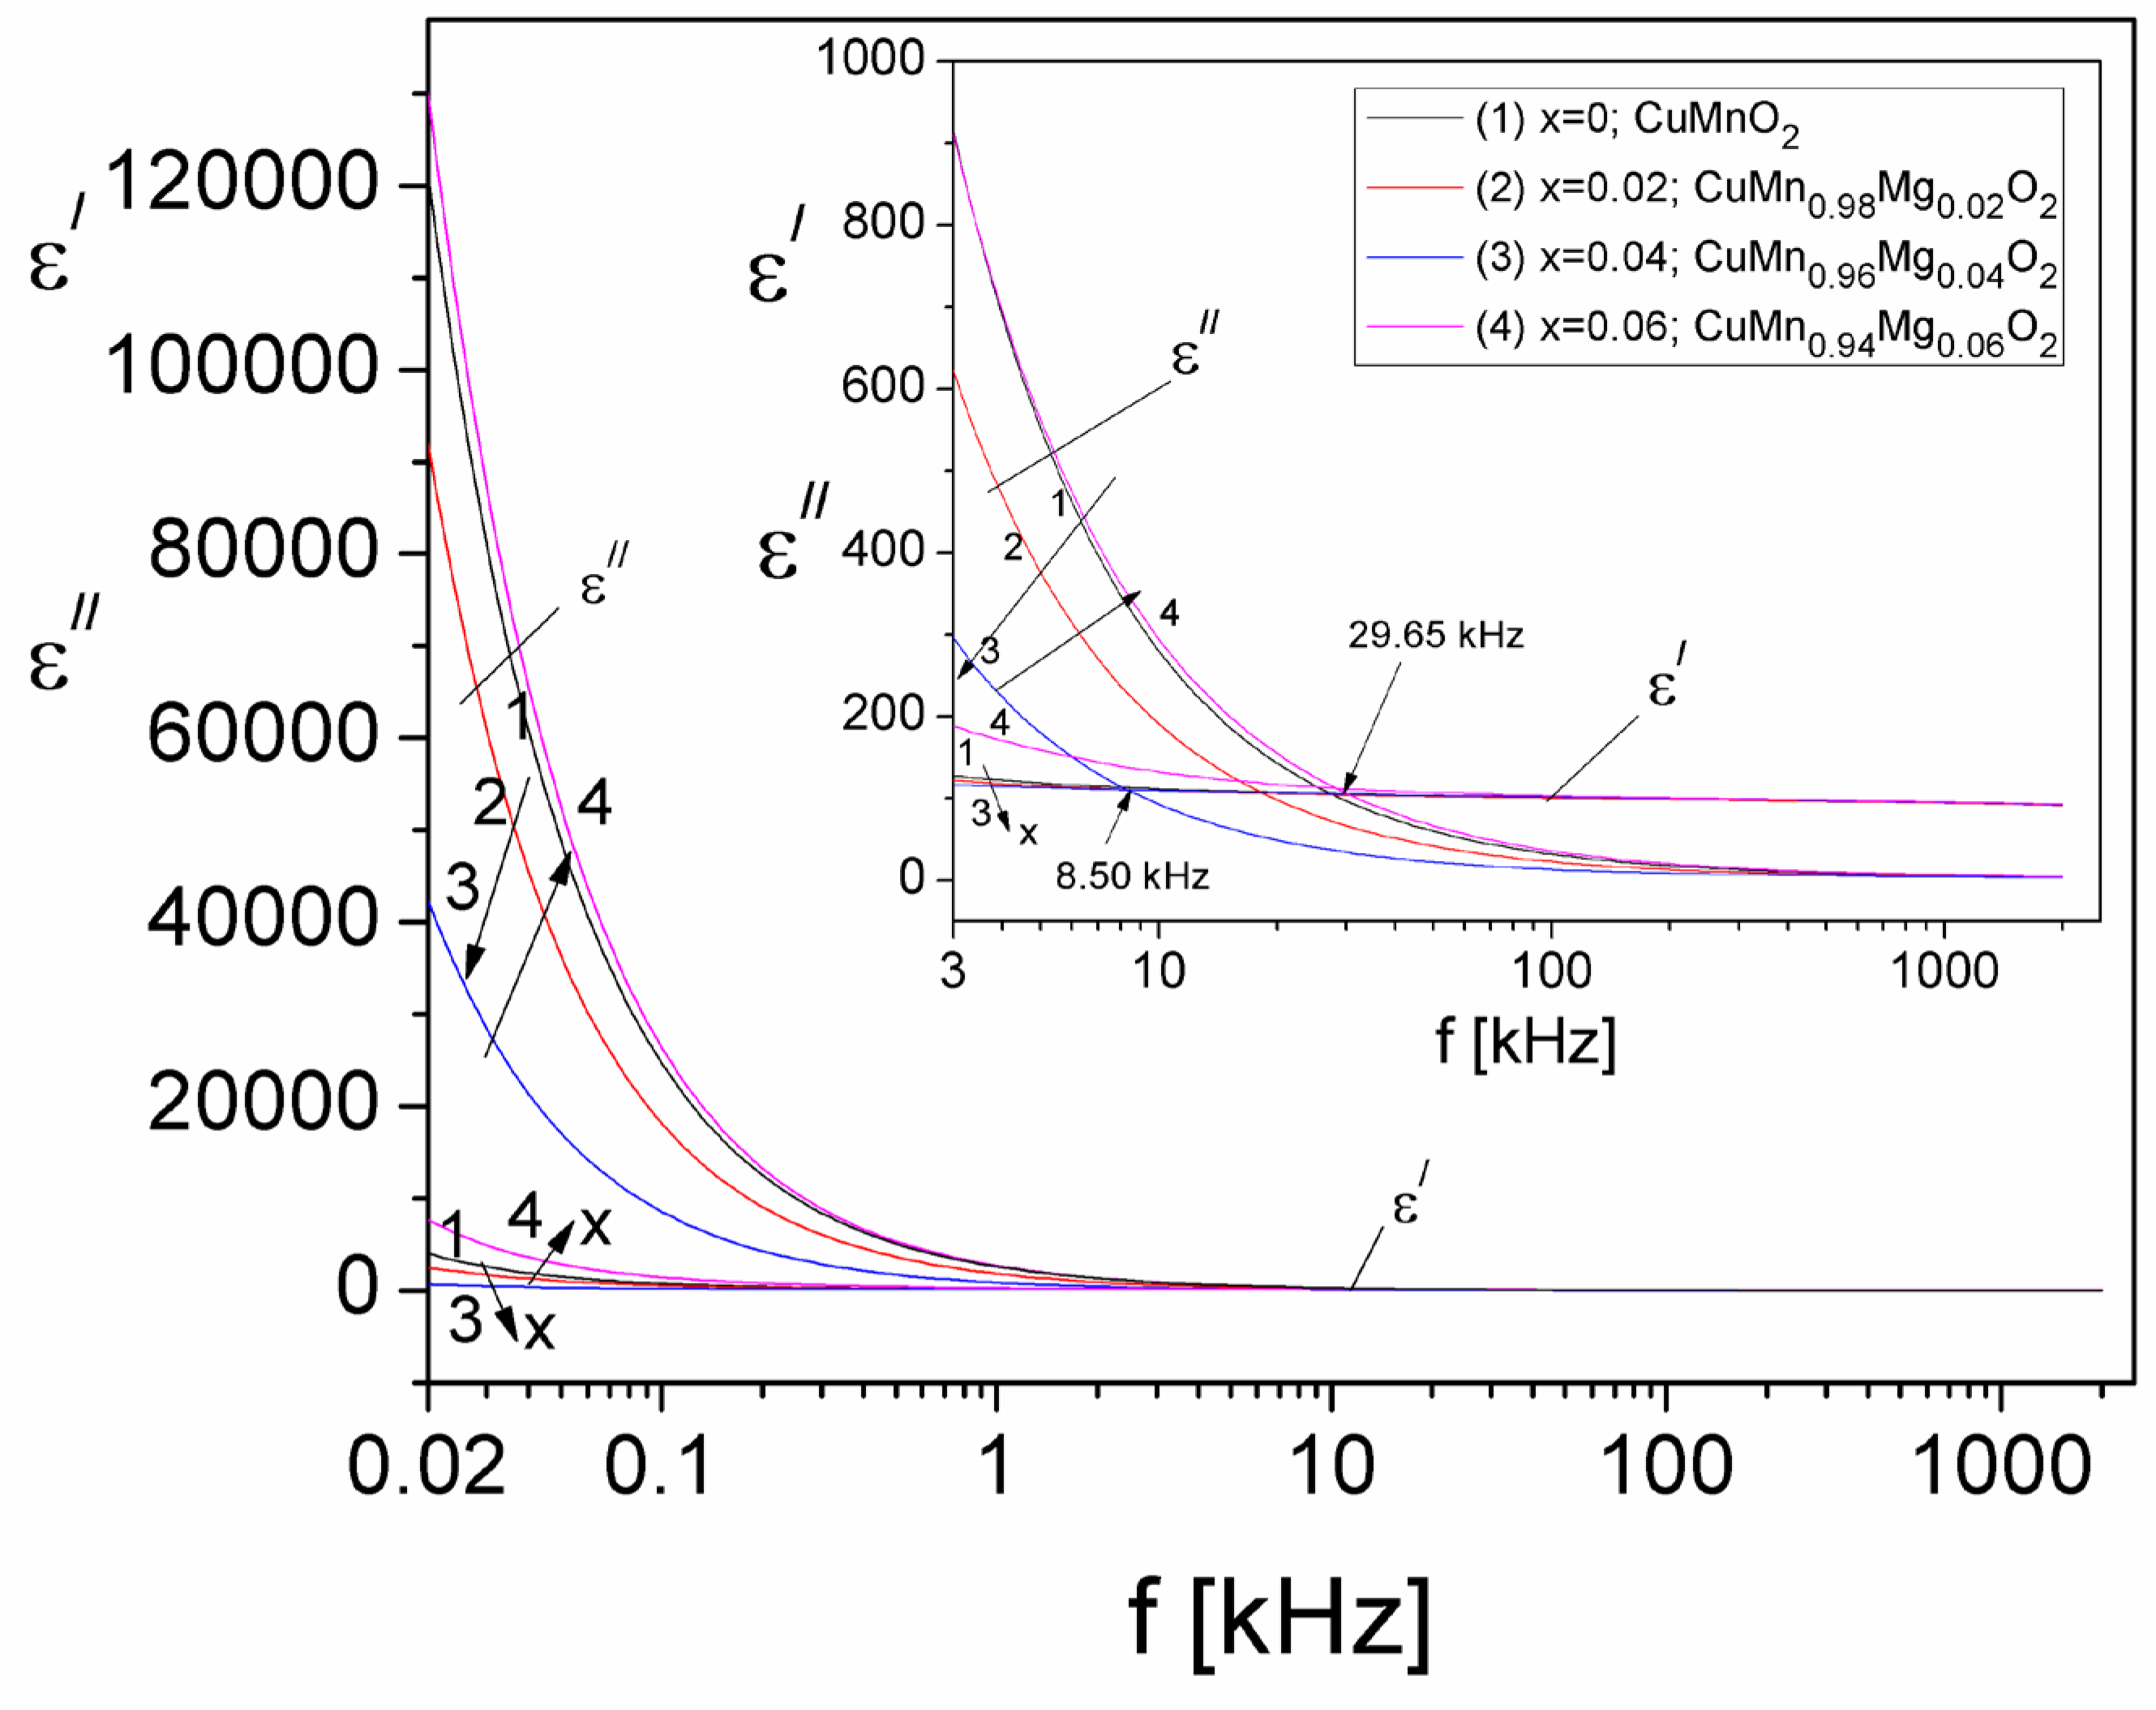
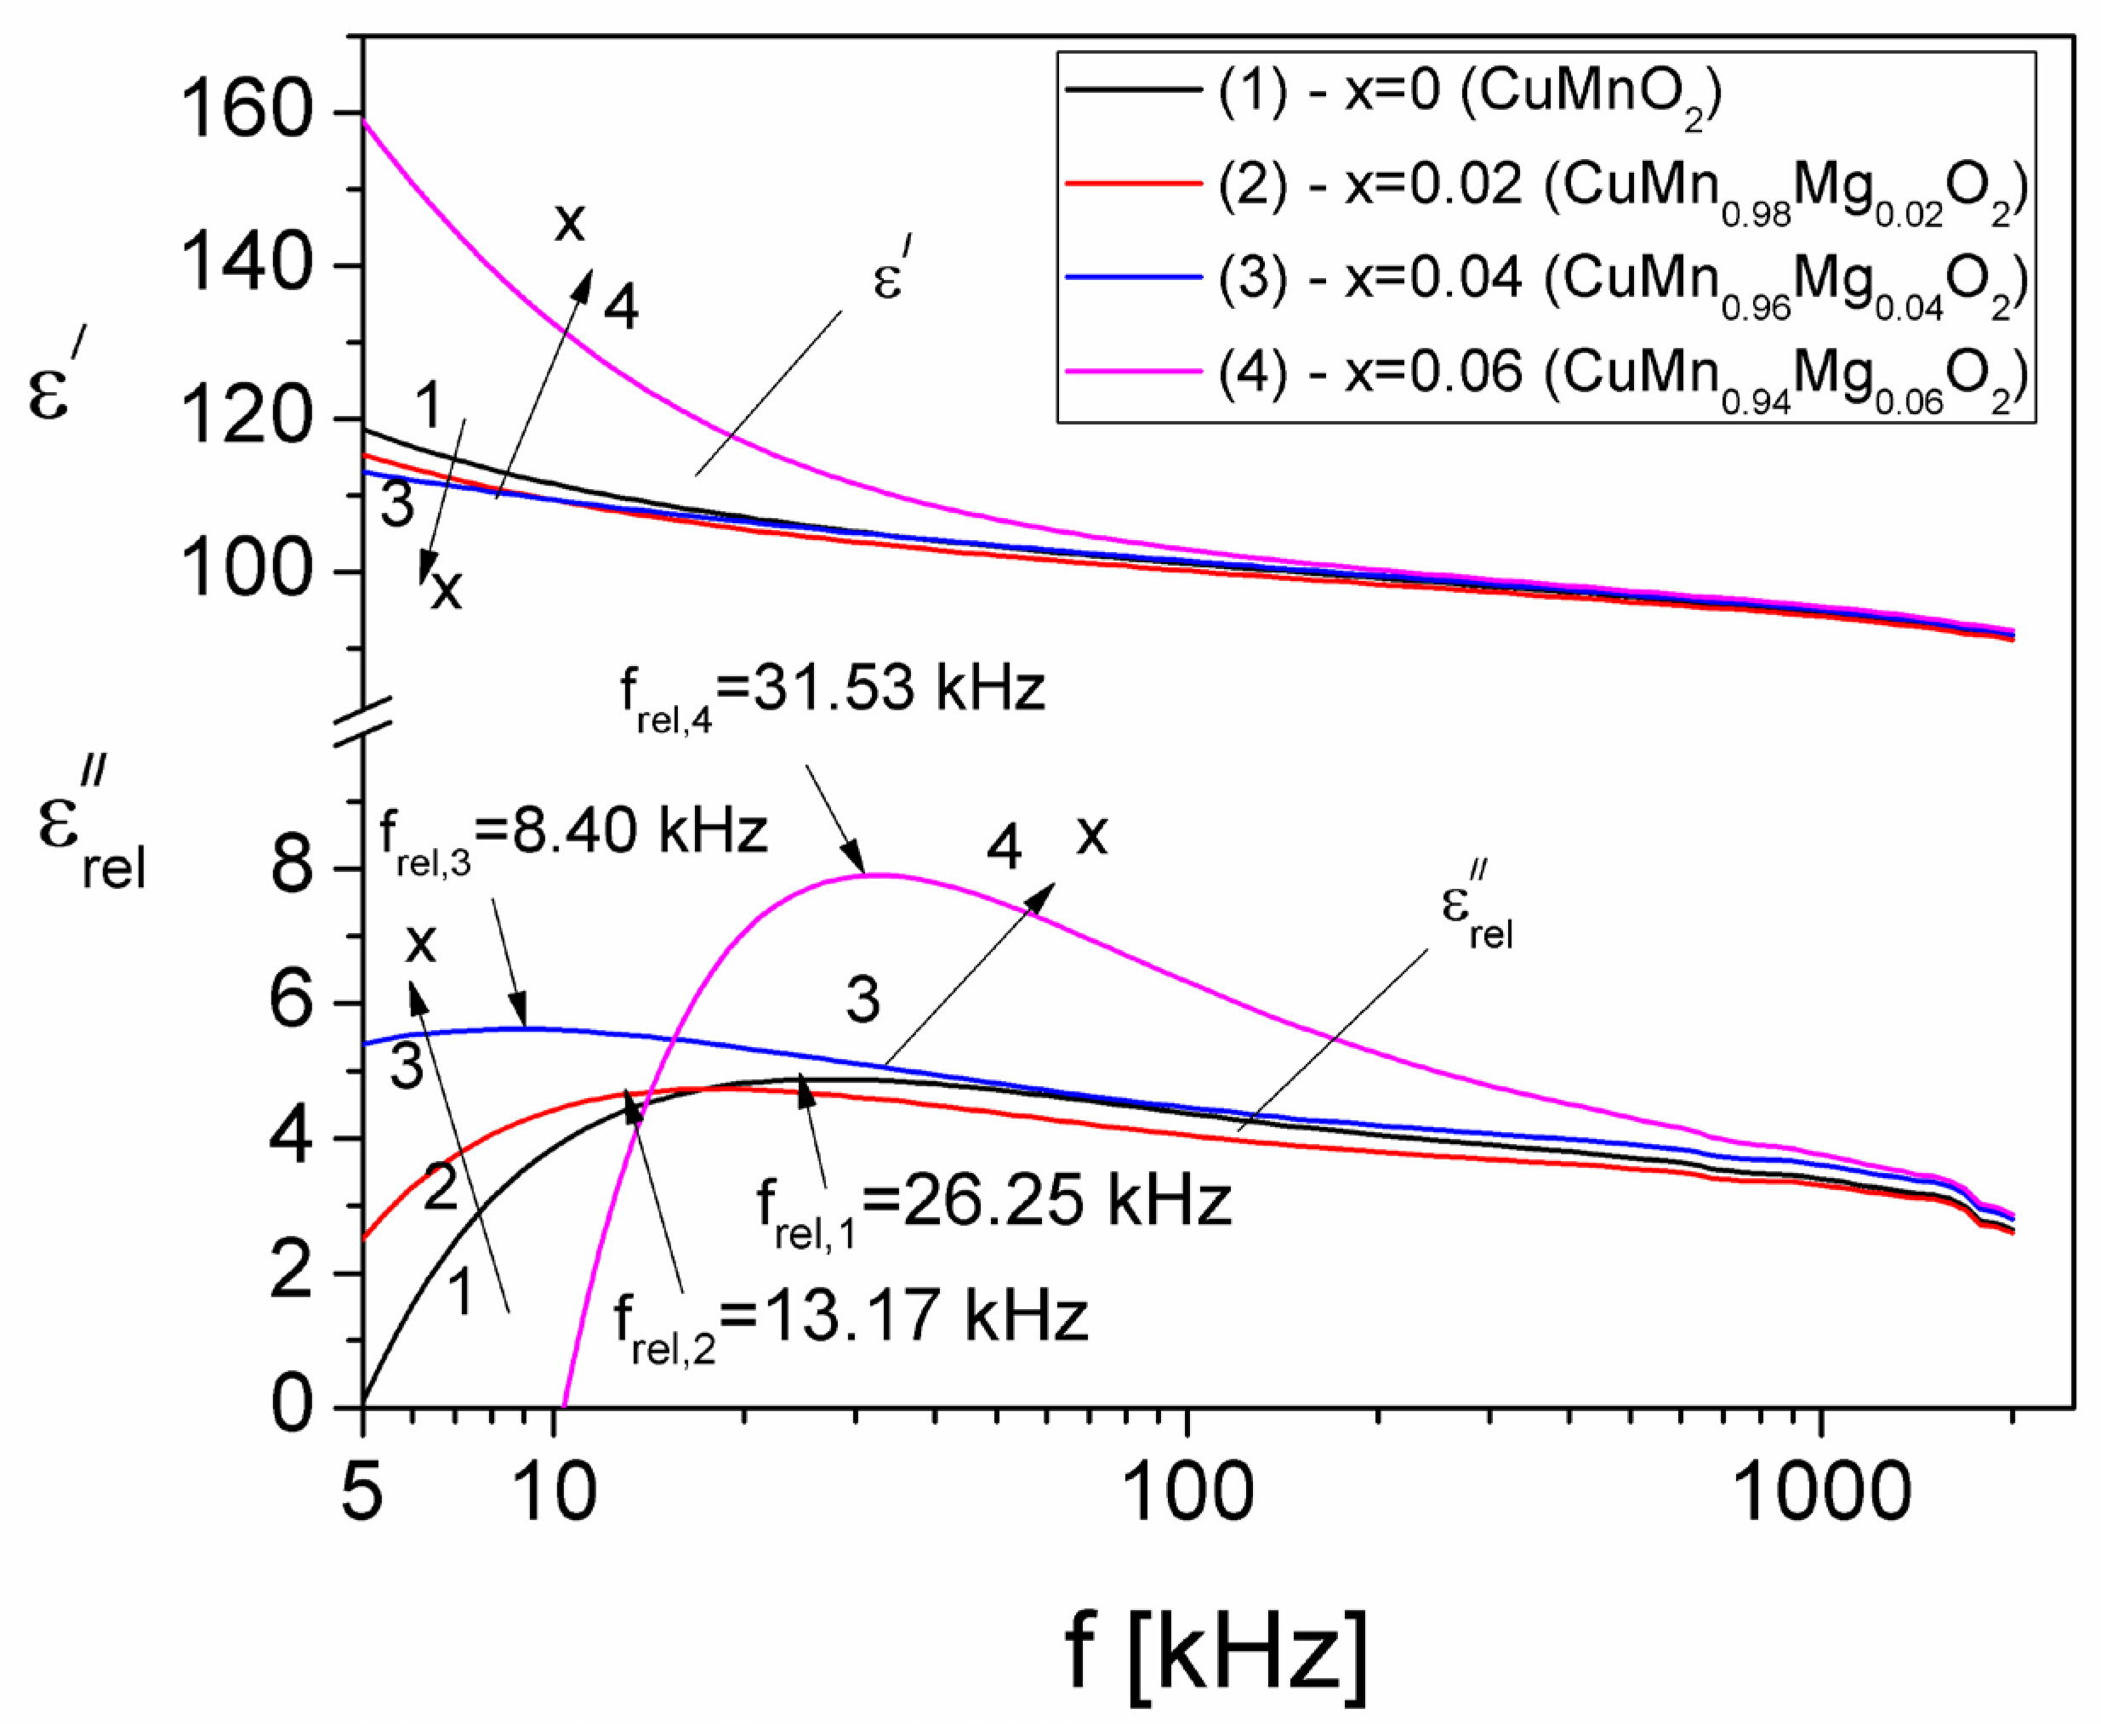
3.3.4. Complex Dielectric Permittivity

The real ε′ and imaginary ε″ components of the complex dielectric permittivity were determined based on the values M′ and M″ (Figure 11) of the electric modulus, using the following equation:
ε = M M 2 + M 2 ,   ε = M M 2 + M 2
The frequency dependence of ε′ and ε″ components for different values of concentration of substituted Mg ions in the CuMn1−xMgxO2 crednerite sample is presented in Figure 13.
From Figure 13, one can observe that both ε′ and ε″ decrease with increasing frequency, for all concentration values of substituted Mg in the crednerite sample. At the same time, it should be specified that for all concentration values (x), for frequencies up to those in the 8.50–29.65 kHz range (see the inset in Figure 13), the values of ε″ are much higher than those of the real component, ε′, thus indicating high conduction losses in samples at frequencies below the mentioned frequency range. For frequencies higher than those located in the range from 8.5 to 26.95 kHz, it can be seen from Figure 13 that the values of ε″ become lower than the values of ε′, which indicates that the relaxation losses become important and that those due to the electrical conduction become negligible [55]. It is known [55] that the total dielectric losses in a material are given by the following equation:
ε ( ω ) = ε c o n d ( ω ) + ε r e l ( ω )
where ε c o n d are the losses due to electrical conduction and ε r e l are the losses due to dielectric relaxation. It is also known that. ε c o n d = σ c o n d / 2 π f ε 0 [55], and, by considering that σcond = σDC (the σDC values are given in Table 2), the losses due to electrical conduction can be computed. By eliminating the conduction losses ( ε c o n d ) from Equation (18), we could determine, in this way, the losses due only to dielectric relaxation ε r e l in the investigated crednerite samples, CuMn1−xMgxO2 (x = 0–0.06), for the first time. Figure 14 shows the frequency dependence of both real, εʹ, and imaginary, ε r e l , components, due to only the dielectric relaxation losses in the investigated samples, in the frequency range from 5 kHz to 2 MHz, where the losses due to dielectric relaxation become significant.
From Figure 14, it is observed that, for each concentration value (x) of substituted Mg in the CuMn1−xMgxO2 samples, the real component, εʹ, decreases with an increase in frequency. For a fixed frequency, such as f = 5 kHz, the variation in the εʹ component of the complex dielectric permittivity with a fixed concentration of substituted Mg is similar to the variation in the electrical conductivity of the investigated samples (see Figure 4) and can be explained based on the polarization mechanism; it is determined by the number of space charge carriers in the sample and by the hopping exchange of the charges between two localized states [56]. The component ε r e l has a maximum value at frel frequency, which moves from 26.25 kHz (for x = 0) to 31.53 kHz (for x = 0.06). This shows the existence of a dielectric relaxation process attributed to the interfacial polarization phenomenon, also known as Maxwell–Wagner–Sillars polarization [47]. This type of polarization is characteristic of composites and granular materials, where electrical charges accumulate on the surface of the grains, leading, thus, to the occurrence of a large electrical dipole associated with each grain. In other words, it is the result of the interplay between the mobility of charge carriers within the grains and the inability to hop from one grain to another.
Using the Debye equation and the experimental values of frel from Figure 14, the relaxation times, τrel, corresponding to each concentration value (x) of substituted Mg in the CuMn1−xMgxO2 crednerite sample were determined. The values obtained for τrel are shown in Table 2. The values of τrel are close to those of τM, which confirms that the study of the frequency dependence of the electrical modulus, M(f), is very useful in the possibility of highlighting dielectric relaxation processes, especially in the case of samples that present high conduction losses and can thus hide the dielectric relaxation maximum.

4. Conclusions

Polycrystalline crednerite CuMn1−xMgxO2 (x = 0–0.06) samples were prepared using low-temperature hydrothermal synthesis (100 °C) for 24 h, starting from Cu(NO3)2·3H2O, (1−x) Mn(NO3)2·4H2O, and x Mg(NO3)2·6H2O, in Teflon-lined stainless steel autoclaves. The samples were characterized using X-ray diffraction at room temperature, which showed that they crystallize within a crednerite structure, while Raman spectroscopy showed two Raman active modes observed at ~300 cm−1 and ~700 cm−1, characteristic of ABO2-type compounds.
Based on the complex impedance measurements performed at a range of frequencies from 20 Hz to 2 MHz at room temperature and at different concentrations (x) of Mg substituted into CuMn1−xMgxO2, some electrical properties of the samples in the low-frequency field were investigated, based on the VRH and CBH theoretical models. The results show that, at all concentrations of substituted Mg, the conductivity spectrum σ(f, x) for samples consists of both the static component σDC and the dynamic component σAC, in agreement with Jonscher’s universal law.
Using the results of the XRD analysis and the static conductivity measurements (σDC) of CuMn1−xMgxO2 crednerite samples, the hopping frequency (ωh), the number density of effective charge carriers (NC), and the mobility of the charge carriers (μ), corresponding to each concentration of substituted Mg, were determined for the first time. Also, the mechanism of electrical conduction in samples at high frequencies was explained using the correlated barrier hopping model (CBH), thus determining the band gap energy, Wm. The measurements of the temperature dependence of static conductivity, σDC(T), in the range of 300–400 K, enabled the determination of the thermal activation energy (EA) of samples, which decreases from 0.518 eV (for x = 0) to 0.286 eV (for x = 0.06).
A method to evaluate the resistance R, the capacity C, and the constant phase element (CPE) of the equivalent electrical circuit of the investigated samples, depending on the concentration of substituted Mg, was proposed, considering the Jonscher universal law.
Allowing for the values determined for the static conductivity, σDC, by eliminating the conduction losses from samples, we highlighted the existence of a relaxation process at all concentrations of Mg substituted into CuMn1−xMgxO2 crednerite samples, which was attributed to the interfacial relaxation.
Knowing the electrical properties of polycrystalline crednerite-type materials, specifically CuMn1−xMgxO2 (with x = 0–0.06), at different frequencies and concentrations of substituted Mg, is useful for clarifying the electrical conduction mechanisms in these materials, as well as for their use in photocatalytic applications (dye-sensitized solar cells or photocatalysis), electronics (semiconductor devices and sensors), and other applications.

Author Contributions

Conceptualization, I.M., C.N.M. and M.P.; methodology, I.M. and C.N.M.; software, M.P. and C.N.M.; validation, I.M. and M.P.; formal analysis, C.N.M.; investigation, M.P. and I.M.; writing—original draft preparation, I.M.; writing—review and editing, I.M., C.N.M. and M.P.; supervision, C.N.M. All authors have read and agreed to the published version of the manuscript.

Funding

This research received no external funding.

Data Availability Statement

The data presented in this study are available upon request from the corresponding author.

Acknowledgments

The author MP is thankful for the financial support they received from the project Start Grant from West University of Timisoara.

Conflicts of Interest

The authors declare that there are no conflicts of interest.

References

  1. Benreguia, N.; Abdi, A.; Mahroua, O.; Trari, M. Photoelectrochemical properties of the crednerite CuMnO2 and its application to hydrogen production and Mn+ reduction (Mn+ = Cd2+, Pd2+, Zn2+, Ni2+ and Ag+). J. Mater. Sci. Mater. Electron. 2021, 32, 10498–10509. [Google Scholar] [CrossRef]
  2. Williamson, B.A.D.; Buckeridge, J.; Brown, J.; Ansbro, S.; Palgrave, R.G.; Scanlon, D.O. Engineering valence band dispersion for high mobility p-type semiconductors. Chem. Mater. 2017, 29, 2402–2413. [Google Scholar] [CrossRef]
  3. Xiong, D.; Zeng, X.; Zhang, W.; Wang, H.; Zhao, X.; Chen, W.; Cheng, Y. Synthesis and Characterization of CuAlO2 and AgAlO2 Delafossite Oxides through Low-Temperature Hydrothermal Methods. Inorg. Chem. 2014, 53, 4106–4116. [Google Scholar] [CrossRef] [PubMed]
  4. Xiong, D.; Xu, Z.; Zeng, X.; Zhang, W.; Chen, W.; Xu, X.; Wang, M.; Chenget, Y.-B. Hydrothermal synthesis of ultrasmall CuCrO2 nanocrystal alternatives to NiO nanoparticles in efficient p-type dye-sensitized solar cells. J. Mater. Chem. 2012, 22, 24760–24768. [Google Scholar] [CrossRef]
  5. Xiong, D.; Qi, Y.; Li, X.; Liu, X.; Tao, H.; Chen, W.; Zhao, X. Hydrothermal synthesis of delafossite CuFeO2 crystals at 100 °C. RSC Adv. 2015, 5, 49280–49286. [Google Scholar] [CrossRef]
  6. Younsi, M.; Manaa, S. Synthesis and characterization of rich delafossite CuYO2+x application for solar energy conversion. Energy Procedia 2013, 36, 638–641. [Google Scholar] [CrossRef]
  7. Zhao, Q.-M.; Zhao, Z.-Y.; Liu, Q.-L.; Yao, G.-Y.; Dong, X.-D. Delafossite CuGaO2 as promising visible-light-driven photocatalyst: Synthesize, properties, and performances. J. Phys. D Appl. Phys. 2020, 53, 135102. [Google Scholar] [CrossRef]
  8. Hossain, S.A.; Sarkar, S.; Bose, S.; Das, P. Synthesis, characterization, and application of delafossites as catalysts for degrading organic pollutants and degradation mechanisms: A detailed insight. Surf. Interf. 2023, 42, 103281. [Google Scholar] [CrossRef]
  9. Zhang, Q.; Xiong, D.; Li, H.; Xia, D.; Tao, H.; Zhao, X. A facile hydrothermal route to synthesize delafossite CuMnO2 nanocrystals. J. Mater. Sci. Mater. Electron. 2015, 26, 10159–10163. [Google Scholar] [CrossRef]
  10. Poienar, M.; Lungu, A.; Sfirloaga, P.; Lungu, M.; Mihali, C.V.; Vlazan, P. Use of ultrasound-assisted co-precipitation route to obtain CuMnO2 semiconductor nanomaterials. Chem. Pap. 2019, 73, 1541–1546. [Google Scholar] [CrossRef]
  11. Kondrashev, I.D. The crystal structure and composition of crednerite, CuMnO2. Sov. Phys. Crystallogr. 1959, 3, 703–706. [Google Scholar]
  12. Poienar, M.; Martin, C.; Lebedev, O.I.; Maignan, A. Advantage of low-temperature hydrothermal synthesis to grow stoichiometric crednerite crystals. Solid State Sci. 2018, 80, 39–45. [Google Scholar] [CrossRef]
  13. Amrute, A.P.; Łodziana, Z.; Mondelli, C.; Krumeich, F.; Perez-Ramirez, J. Solid-state chemistry of cuprous delafossites: Synthesis and stability aspects. Chem. Mater. 2013, 25, 4423–4435. [Google Scholar] [CrossRef]
  14. Sheets, W.C.; Mugnier, E.; Barnabe, A.; Marks, T.J.; Poeppelmeier, K.R. Hydrothermal synthesis of delafossite-type oxides. Chem. Mater. 2006, 18, 7–20. [Google Scholar] [CrossRef]
  15. Poienar, M.; Banica, R.; Sfirloaga, P.; Ianasi, C.; Mihali, C.V.; Vlazan, P. Microwave-assisted hydrothermal synthesis and catalytic activity study of crednerite-type CuMnO2 materials. Ceram. Intern. 2018, 44, 6157–6161. [Google Scholar] [CrossRef]
  16. Ma, C.; Pan, J.; Chen, C.; Dong, Y.; Yao, F.; Wang, F.; Song, M. Investigation into the roles of interfacial H2O structure in catalytic oxidation of HCHO and CO over CuMnO2 catalysts. J. Environ. Sci. 2024, 137, 310–320. [Google Scholar] [CrossRef]
  17. Yin, C.; Zhou, S.; Zhang, K.; Bai, J.; Lv, Y.; Zhang, X.; Li, X.; Xu, A. Crednerite CuMnO2 as highly efficient Fenton-like catalysts for p-nitrophenol removal: Synergism between Cu(I) and Mn (III). J. Clean. Prod. 2021, 319, 128640. [Google Scholar] [CrossRef]
  18. Cheng, C. A novel hydrothermal route of preparing CuMnO2 nanoflakes and their application in Li-ion batteries and supercapacitors. APL Mater. 2023, 11, 071105. [Google Scholar] [CrossRef]
  19. Poienar, M.; Sfirloaga, P.; Martin, C.; Ursu, D.; Vlazan, P. Hydrothermal synthesis of crednerite CuMn1−xMxO2 (M = Mg, Al; x = 0−0.08): Structural characterization and magnetic properties. J. Mater. Sci. 2018, 53, 2389–2395. [Google Scholar] [CrossRef]
  20. Shukla, K.K.; Shahi, P.; Gopal, S.; Kumar, A.; Ghosh, A.K.; Singh, R.; Sharma, N.; Das, A.; Sinha, A.K.; Joshi, A.G.; et al. Magnetic and optical properties of Fe doped crednerite CuMnO2. RSC Adv. 2015, 5, 83504–83511. [Google Scholar] [CrossRef]
  21. Ushakov, A.V.; Streltsov, S.V.; Khomskii, D.I. Orbital structure and magnetic ordering in stoichiometric and doped crednerite CuMnO2. Phys. Rev. B 2014, 89, 024406. [Google Scholar] [CrossRef]
  22. Poienar, M.; Vecchini, C.; Andre, G.; Daoud-Aladine, A.; Margiolaki, I.; Maignan, A.; Lappas, A.; Chapon, L.; Hervieu, M.; Damay, F.; et al. Substitution Effect on the Interplane Coupling in Crednerite: The Cu1.04Mn0.96O2 Case. Chem. Mater. 2011, 23, 85–94. [Google Scholar] [CrossRef]
  23. Okuda, T.; Jufuku, N.; Hidaka, S.; Terada, N. Magnetic, transport, and thermoelectric properties of the delafossite oxides CuCr1−xMgxO2 (0 ⩽ x ⩽ 0.04). Phys. Rev. B 2005, 72, 144403. [Google Scholar] [CrossRef]
  24. Rattanathrum, P.; Taddee, C.; Chanlek, N.; Thongbai, P.; Kamwanna, T. Structural and physical properties of Ge-doped CuCrO2 delafossite oxide. Cer. Intern. 2017, 43, S417–S422. [Google Scholar] [CrossRef]
  25. Jlaiel, F.; Elkhouni, T.; Amami, M.; Strobel, P.; Ben Salah, A. Structural and physical properties of the (Ca, Mg)-doped delafossite powder CuGaO2. Mat. Res. Bull. 2013, 48, 1020–1026. [Google Scholar] [CrossRef]
  26. Malaescu, I.; Lungu, A.; Marin, C.N.; Sfirloaga, P.; Vlazan, P.; Brindusoiu, S.; Poienar, M. Temperature dependence of the dynamic electrical properties of Cu1+xMn1−xO2 (x=0 and 0.06) crednerite materials. Cer. Intern. 2018, 44, 11610–11616. [Google Scholar] [CrossRef]
  27. Mott, N.F.; Davis, E.A. Electronic Processes in Non-Crystalline Materials; Clarendon: Oxford, UK, 1979. [Google Scholar]
  28. Elliot, S.R. AC conduction in amorphous chalcogenide and pnictide semiconductors. Adv. Phys. 1987, 36, 135–217. [Google Scholar] [CrossRef]
  29. Carvajal, J.R. Recent advances in magnetic structure determination by neutron powder diffraction. Phys. B Cond. Matter. 1993, 192, 55–69. [Google Scholar] [CrossRef]
  30. Malaescu, I.; Ercuta, A.; Sfirloaga, P.; Poienar, M.; Vlazan, P.; Lungu, A.; Marin, C.N.; Lungu, M. Methods of morpho-structural characterization and determination of the electrical and magnetic properties of metal oxides. In The Fundamentals and Challenges of Oxide Materials; Lungu, M., Marin, C.N., Eds.; Cambridge Scholars Publishing: London, UK, 2023; Chapter 2; pp. 49–50. [Google Scholar]
  31. ASTM D150-98; Standard Test Methods for AC Loss Characteristics and Permittivity (Dielectric Constant) of Solid Electrical Insulation. ASTM International: West Conshohocken, PA, USA, 2017.
  32. Aktas, O.; Truong, K.D.; Otani, T.; Balakrishnan, G.; Clouter, M.J.; Kimura, T.; Quirion, G. Raman scattering study of delafossite magnetoelectric multiferroic compounds: CuFeO2 and CuCrO2. J. Phys. Cond. Matter 2012, 24, 036003. [Google Scholar] [CrossRef]
  33. Pellicer-Porres, J.; Segura, A.; Martínez, E.; Saitta, A.M.; Polian, A.; Chervin, J.C.; Canny, B. Vibrational properties of delafossite CuGaO2 at ambient and high pressures. Phys. Rev. B 2005, 72, 064301. [Google Scholar] [CrossRef]
  34. Pellicer-Porres, J.; Martínez-García, D.; Segura, A.; Rodríguez-Hernández, P.; Muñoz, A.; Chervin, J.C.; Garro, N.; Kim, D. Pressure and temperature dependence of the lattice dynamics of CuAlO2 investigated by Raman scattering experiments and ab initio calculations. Phys. Rev. B 2006, 74, 184301. [Google Scholar] [CrossRef]
  35. Benreguia, N.; Barnabé, A.; Trari, M. Preparation and characterization of the semiconductor CuMnO2 by sol-gel route. Mater. Sci. Semicond. Process. 2016, 56, 14–19. [Google Scholar] [CrossRef]
  36. Deng, Y.; Handoko, A.D.; Du, Y.; Xi, S.; Yeo, B.S. In Situ Raman Spectroscopy of Copper and Copper Oxide Surfaces during Electrochemical Oxygen Evolution Reaction: Identification of CuIII Oxides as Catalytically Active Species. ACS Catalysis. 2016, 6, 2473–2481. [Google Scholar] [CrossRef]
  37. Lalanne, M.; Demont, P.; Barnabé, A. Ac conductivity and dielectric properties of CuFe1−xCrxO2:Mg delafossite. J. Phys. D Appl. Phys. 2011, 44, 185401. [Google Scholar] [CrossRef]
  38. Debye, P. Polar Molecules; Chemical Catalog Company, Inc.: New York, NY, USA, 1929. [Google Scholar]
  39. Jonscher, A.K. Universal Relaxation Law, 1st ed; Chelsea Dielectrics Press: London, UK, 1996; pp. 198–200. [Google Scholar]
  40. Bessekhouad, Y.; Gabes, Y.; Bouguelia, A.; Trari, M. The physical and photo electrochemical characterization of the crednerite CuMnO2. J. Mater. Sci. 2007, 42, 6469–6476. [Google Scholar] [CrossRef]
  41. Chen, H.; Hsu, D. Characterization of crednerite-Cu1.1Mn0.9O2 films prepared using sol–gel processing. Appl. Surf. Sci. 2014, 290, 161–166. [Google Scholar] [CrossRef]
  42. Funke, K. Jump relaxation in solid electrolytes. Prog. Solid State Chem. 1993, 22, 111–195. [Google Scholar] [CrossRef]
  43. Malaescu, I.; Sfirloaga, P.; Marin, C.N.; Bunoiu, M.O.; Vlazan, P. Experimental Investigations on the Electrical Conductivity and Complex Dielectric Permittivity of ZnxMn1−xFe2O4 (x = 0 and 0.4) Ferrites in a Low-Frequency Field. Crystals 2024, 14, 437. [Google Scholar] [CrossRef]
  44. Papathanassiou, A.N. Specific feature of mixed alkali effect in the a.c. conductivity of ion-conducting glasses. Mater. Lett. 2005, 59, 1634–1635. [Google Scholar] [CrossRef]
  45. Papathanassiou, A.N. Novel feature of the universal power law dispersion of the ac conductivity in disordered matter. J. Non-Cryst. Solids 2006, 352, 5444–5445. [Google Scholar] [CrossRef]
  46. Cramer, C.; Brunklaus, S.; Ratai, E.; Gao, Y. New Mixed Alkali Effect in the ac Conductivity of Ion-Conducting Glasses. Phys. Rev. Lett. 2003, 91, 26601. [Google Scholar] [CrossRef] [PubMed]
  47. Lalanne, M.; Barnabé, A.; Mathieu, F.; Tailhades, P. Synthesis and thermostructural studies of a CuFe(1−x)Cr(x)O(2) delafossite solid solution with 0 < x <1. Inorg. Chem. 2009, 48, 6065–6071. [Google Scholar] [PubMed]
  48. Brindusoiu, S.; Poienar, M.; Marin, C.N.; Sfirloaga, P.; Vlazan, P.; Malaescu, I. The electrical conductivity of Fe3(PO4)2·8H2O materials. J. Mater. Sci. Mater. Electron. 2019, 30, 15693–15699. [Google Scholar] [CrossRef]
  49. Viswanathan, M.; Anil Kumar, P.S.; Bhadram, V.S.; Narayana, C.; Bera, A.K.; Yusuf, S.M. Influence of lattice distortion on the Curie temperature and spin–phonon coupling in LaMn0.5Co0.5O3. J. Phys. Condens. Matter 2010, 22, 346006. [Google Scholar] [CrossRef] [PubMed]
  50. Horn, T.; Deutschlander, S.; Lowen, H.; Maret, G.; Keim, P. Fluctuations of orientational order and clustering in a two-dimensional colloidal system under quenched disorder. Phys. Rev. E 2013, 88, 062305. [Google Scholar] [CrossRef] [PubMed]
  51. Harun, M.H.; Saion, E.; Kassim, A.; Mahmud, E.; Hussain, M.Y.; Mustafa, I.S. Dielectric Properties of Poly (vinyl alcohol)/Polypyrrole Composite Polymer Films. J. Adv. Sci. Arts. 2009, 1, 9–16. [Google Scholar]
  52. Wang, Y.; Liu, H.; Yan, T.; Zhao, J.; Li, J.; Guo, S.; Sun, S.; Sun, R.; Lu, Z.; Wang, D. Significantly reduced conductivity in strontium titanate-based lead-free ceramics by excess bismuth. Mater. Lett. 2022, 309, 131453. [Google Scholar] [CrossRef]
  53. Barsoukov, E.; Macdonald, J.R. Impedance Spectroscopy: Theory, Experiments and Applications; Wiley: New York, NY, USA, 2005. [Google Scholar]
  54. Iwasaki, M.; Hara, M.; Kawada, H.; Tada, H.; Ito, S. Cobalt Ion-Doped TiO2 Photocatalyst Response to Visible Light. J. Coll. Interf. Sci. 2000, 224, 202–204. [Google Scholar] [CrossRef] [PubMed]
  55. Scaife, B.K. Principles of Dielectrics; Clarendon Press: Oxford, UK, 1998. [Google Scholar]
  56. Kumar, G.; Rani, R.; Sharma, S.; Batoo, K.M.; Singh, M. Electric and dielectric study of cobalt substituted Mg–Mn nanoferrites synthesized by solution combustion technique. Ceram. Intern. 2013, 39, 4813–4818. [Google Scholar] [CrossRef]
Figure 1. (a) Superposition of XRD patterns of CuMn1−xMgxO2 (x = 0, x = 0.02, x = 0.04, and x = 0.06); experimental X-ray powder diffraction pattern (black line) and calculated pattern (red line) of CuMn1−xMgxO2 ((b) for x = 0, (c) for x 0.02, (d) for x = 0.04, and (e) for x = 0.06). In (be), the upper row of vertical marks corresponds to Bragg reflections of phase 1 (crednerite phase), and the lower row corresponds to phase 2 (CuO phase), which are indicated by the horizontal arrows.
Crystals 15 00184 g001
Figure 2. Room-temperature Raman spectra for CuMn1−xMgxO2 materials with x = 0, 0.02, 0.04, and 0.06.
Crystals 15 00184 g002
Figure 3. The frequency dependence of Z′ (a) and Z″ (b) components of the complex impedance of measurement cell, which was filled with CuMn1−x MgxO2 and measured at room temperature.
Crystals 15 00184 g003
Figure 4. The frequency dependence of the conductivity, σ, at different concentrations, x, of Mg substituted into the CuMnO2 crednerite material, at room temperature.
Crystals 15 00184 g004
Figure 5. The lnσAC(lnω) dependence at different concentrations, x, of Mg substituted into CuMn1−xMgxO2 samples.
Crystals 15 00184 g005
Figure 6. The concentration dependence of the ratio (–lnA0/n) in CuMn1−xMgxO2 crednerite at room temperature.
Crystals 15 00184 g006
Figure 7. The concentration dependence of the band gap energy (Wm) for the CuMn1−xMgxO2 samples.
Crystals 15 00184 g007
Figure 8. Temperature dependence of the static conductivity, σDC(T), of crednerite CuMn1−xMgxO2 samples for different concentrations (x) of substituted Mg.
Crystals 15 00184 g008
Figure 9. The ln(σDC)(T−1/4) plots of CuMn1−xMgxO2 crednerite samples for different concentration values (x) of substituted Mg, which agree with the VRH model.
Crystals 15 00184 g009
Figure 10. The concentration dependence of the charge carrier’s mobility (μ) from the CuMn1−xMgxO2 crednerite samples at room temperature.
Crystals 15 00184 g010
Figure 11. The frequency dependence of the M′ and M″ components of the electric modulus of the CuMn1−xMgxO2 crednerite samples at different concentration values (x) of substituted Mg.
Crystals 15 00184 g011
Figure 12. The frequency dependence of the M″ component in samples at different values of x. The inset figure shows an equivalent electric circuit for the sample.
Crystals 15 00184 g012
Figure 13. The frequency dependence of the real, ε′, and imaginary, ε″, components of the complex dielectric permittivity at different values of the concentration of substituted Mg (x).
Crystals 15 00184 g013
Figure 14. Frequency dependence of the real, εʹ, and imaginary components, ε r e l , due to dielectric relaxation, for different concentration values (x) of substituted Mg.
Crystals 15 00184 g014
Table 1. Unit cell parameters, volume, crystallite size, CuO phase content, and agreement parameters (χ2, RBragg, and RF) from the Rietveld refinement in space group C2/m for XRD diffractograms of CuMn1−xMgxO2 materials with x = 0, 0.02, 0.04, and 0.06. The isotropic factors Uiso (or Biso) are kept constant for each refinement, as follows: Biso = 0.154 for Mn, Biso = 0.555 for Cu, and Biso = 1.000 for O.
SamplesCuMnO2CuMn0.98Mg0.02O2CuMn0.96Mg0.04O2CuMn0.94Mg0.06O2
a (Å)5.5875(5)5.5379(1)5.5133(1)5.4921(2)
b (Å)2.8848(2)2.8899(6)2.8889(5)2.8928(5)
c (Å)5.8915(5)5.8949(2)5.8805(1)5.8859(2)
β (deg)103.969 (1)104.335(2)104.519(2)104.622(2)
Volume (Å3)92.157(3)91.406(4)90.671(3)90.485(6)
Crystallite size (Å)212129 65 66
CuO phase content1.92%3.66%4.55%4.09%
χ26.892.712.111.97
RBragg9.626.756.875.91
RF12.007.796.945.50
Table 2. The electrical parameters of crednerite samples, CuMn1−xMgxO2 (x = 0–0.06), were obtained using electric measurements.
SamplesCuMnO2CuMn0.98Mg0.02O2CuMn0.96Mg0.04O2CuMn0.94Mg0.06O2
τZ [μs]5.888.7320.156.02
τM [μs]5.488.0817.754.88
τrel [μs]6.0610.5318.955.03
σDC [S/m]15.360 × 10−510.385 × 10−54.854 × 10−516.420 × 10⁻⁵
n0.3760.4610.6240.357
A0[Sm−1sn]9.48 × 10−72.13 × 10−70.141 × 10−713.97 × 10⁻⁷
ωh[rad/s]7.434 × 1056.938 × 1054.867 × 1056.855 × 105
NC[m−3]2.350 × 10243.436 × 10243.344 × 10248.907 × 1024
R [MΩ]4.1516.10912.8923.502
C [pF]1.3201.3231.3771.393
Q [nFsn−1]2.5330.7350.0843.626
Table 3. Mott parameters of the crednerite samples of CuMn1−xMgxO2 for different concentrations of substituted Mg (x = 0, 0.02, 0.04, and 0.06).
x [%]T [K]N (EF) [cm−3 eV−1]EA,cond [eV]Rh [nm]Wh [eV]
x = 03002.313 × 10160.46923.140.833
3232.313 × 10160.49622.710.880
3532.313 × 10160.53022.210.941
x = 2%3009.416 × 10160.33016.290.586
3239.416 × 10160.34915.990.620
3539.416 × 10160.37315.640.662
x = 4%3002.008 × 10170.27313.480.485
3232.008 × 10170.28913.230.513
3532.008 × 10170.30912.940.548
x = 6%3002.470 × 10170.25912.800.460
3232.470 × 10170.27412.560.487
3532.470 × 10170.29312.290.521
Disclaimer/Publisher’s Note: The statements, opinions and data contained in all publications are solely those of the individual author(s) and contributor(s) and not of MDPI and/or the editor(s). MDPI and/or the editor(s) disclaim responsibility for any injury to people or property resulting from any ideas, methods, instructions or products referred to in the content.

