Abstract
This study involved the preparation of dense Ti-10wt.%Mo alloys using selective laser melting (SLM) with a powder combination of pure titanium (Ti) and pure molybdenum (Mo). Integrating temperature stress numerical simulations and actual data elucidates the correlation between linear laser energy density and residual stress. The impact of linear energy density on the surface roughness, densification behavior, microstructural development, and mechanical properties of SLM-processed Ti-10Mo components was also examined. As linear energy density diminished from 0.125 J/mm to 0.233 J/mm, surface roughness reduced from 18.2 μm to 4.4 μm, while relative compactness increased from 94.9% to 99.8%, respectively. It is necessary to reduce the friction between the puncture needle or implant needle and human tissue, enhancing comfort and precision. The microstructural investigation revealed that SLM-processed Ti-10Mo alloys consist of a phase combination of hexagonal tight-packed (hcp) α-Ti and body-centered cubic (bcc) β-Ti, with heterogeneous conchoidal microstructures found in the samples. Furthermore, as the laser energy input increased, Mo powder particles were mostly fully melted, leading to a significant rise in the microhardness value. The as-built Ti-10Mo alloys exhibited a high ultimate tensile strength of 860 MPa and an elongation of 32.9% at a linear laser energy density of 0.15 J/mm, with the fracture morphology indicating a mixed fracture mode mostly characterized by ductile fracture. This research can enhance the prospective bio-application of Ti-Mo alloys.
1. Introduction
As an emerging laser additive manufacturing technology, selective laser melting (SLM) offers significant potential in bio-medical industries, owing to its excellent capabilities to fabricate complex geometrical components with exceptional precision, high flexibility, and minimal material waste. Meanwhile, titanium and conventional titanium alloys are widely utilized as implant metal materials due to their low specific weight, outstanding biocompatibility, good mechanical properties, and superior corrosion resistance [1,2,3]. Therefore, extensive research has been performed in the field of SLM-processed titanium alloys, especially Ti-Al systems such as Ti-Al-V [4,5] and Ti-Al-Nb [6,7]. However, for all the work mentioned above, the V and Al elements are toxic, which hurts the application of these alloys. It is reported that after long-term implantation in vivo, the release of Al and V may cause Alzheimer’s disease and mental disorders [8]. In addition, the elastic moduli of most titanium alloys (55–100 GPa) are much higher than that of human bone (10–30 GPa) [9,10], resulting in a stress-shielding effect, which may lead to excessive bone resorption and final implant failure [11,12]. It has been demonstrated that α-phase stabilizer elements contribute positively to achieving higher elastic modulus and strength, and β-phase stabilizer elements result in lower Young’s modulus and better formability [13,14].
Many attempts have been made to develop non-toxic and non-allergenic elements of stable β-phase elements, such as Nb, Mo, Zr, and Ta [15,16]. For instance, Fischer et al. reported that a homogeneous Ti-Nb alloy can be achieved through the SLM process at a volumetric energy density of 200 J/mm3, resulting in minimal Nb particle presence and porosity levels below 3% [17]. Sing et al. investigated the effects of laser process parameters on the forming qualities of SLM-processed Ti-Ta alloys [18]. Their findings indicated that both laser power and scanning speed significantly affect the forming qualities of these alloys. Compared with other β-phase stabilizer elements, Mo attracts much attention due to its low density and low elastic modulus. Moreover, Mo exhibits the least cytotoxicity and the highest cell viability of all, and it is also instrumental in regulating pH balance in the human body [17,19]. Vrancken et al. concluded that the presence of unmelted Mo particles has no visible effect on the mechanical properties of Ti6Al4V-Mo parts [20].
Therefore, the binary Ti-Mo alloys are regarded as a viable option for orthopedic implants. Although extensive research has been conducted on biocompatibility, much remains to be understood, particularly concerning Ti-Mo alloys. Hence, it is essential to systematically investigate their microstructure evolution and mechanical properties. In this study, binary Ti-10wt.%Mo alloys were fabricated by SLM technology. To explore the service performances of Ti-Mo alloys, it is essential to understand how process parameters affect thermal and residual stress distribution during the SLM process. The surface roughness, relative density, microhardness, and tensile properties under different process parameters were also investigated. The relationship between the laser energy input, microstructure, and mechanical properties of in situ-SLM-processed Ti-10Mo alloys was also analyzed and discussed.
2. Experimental Procedure
2.1. FEM Modeling for SLM
Due to the large laser energy density and short acting time of the SLM process, it is prone to generating large temperature gradients and stress concentrations, leading to uneven stress distribution in the sample [21]. Hence, a coupled analysis of the temperature field and stress is necessary for simulating the SLM forming process. This study utilizes a three-dimensional finite element model (FEM) that employs a sequentially coupled thermal–mechanical approach to investigate the evolution of both thermal and residual stress during the SLM process of binary Ti-Mo alloys. The temperature-dependent values of the average expansion coefficient, thermal conductivity, density, and specific heat are reported in Figure 1.
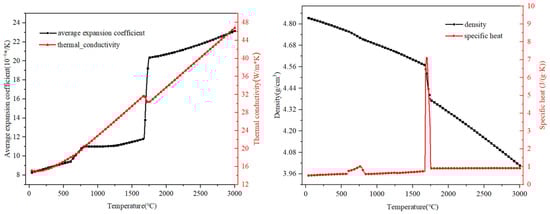
Figure 1.
Thermal–physical properties of Ti-10Mo alloys under different temperatures.
The SLM process is a nonlinear transient heat conduction phenomenon accompanied by rapid heating and cooling. The governing equation of heat conduction given by the Fourier series can be stated as Equation (1).
where is the density; is the specific heat; is the temperature, is time; is the thermal conductivity; and Q is the intensity of the heat source.
The boundary conditions in the SLM process mainly refer to the heat exchange between the outer surface of the powder bed and the surrounding environment, including the heat absorbed by the metal powder and the transferred heat between the surface of the powder bed and the external environment [22]. The boundary conditions referring to the reports of Waqar et al. and Luo et al. [23,24,25] can be stated as Equations (2)–(5).
where Ts represents the boundary temperature.
where T is the temperature of the molten pool and qs is the rate of heat flux.
where T is the temperature of the molten pool; h is the heat convection coefficient; and Ts is the temperature of the surroundings.
where is the Stefan–Boltzmann constant; is the heat radiation coefficient; T is the temperature of the molten pool; and Ts is the temperature of the surroundings.
The laser beam model used for the energy distribution was based on a Gaussian heat source given by Equation (6).
where k is the laser energy absorption coefficient; P is the laser power; r is the distance from any point on the powder bed to the center of the laser spot; and r0 is the radius of the laser spot.
The Von Mises yield criterion was utilized for simulating the SLM stress field [26,27,28], and is defined as Equation (7).
where is the equivalent stress; , , and are the principal stress of the X, Y, and Z directions.
The FEM was developed using ANSYS Mechanical APDL 19.0 Software. employing the element birth and death method. The 3D model consisted of two components: three powder layers with dimensions of 0.6 mm × 0.5 mm × 0.03 mm and a substrate measuring 0.7 mm × 0.7 mm × 0.1 mm. Notably, to enhance efficiency and decrease computational demands, the substrate was fine-meshed only adjacent to the powder bed region and coarse-meshed away from it [29], as shown in Figure 2.
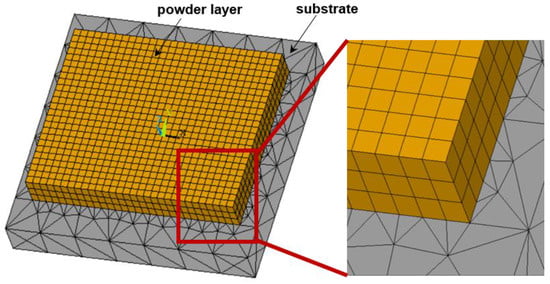
Figure 2.
The established 3D FEM.
2.2. Materials Preparation
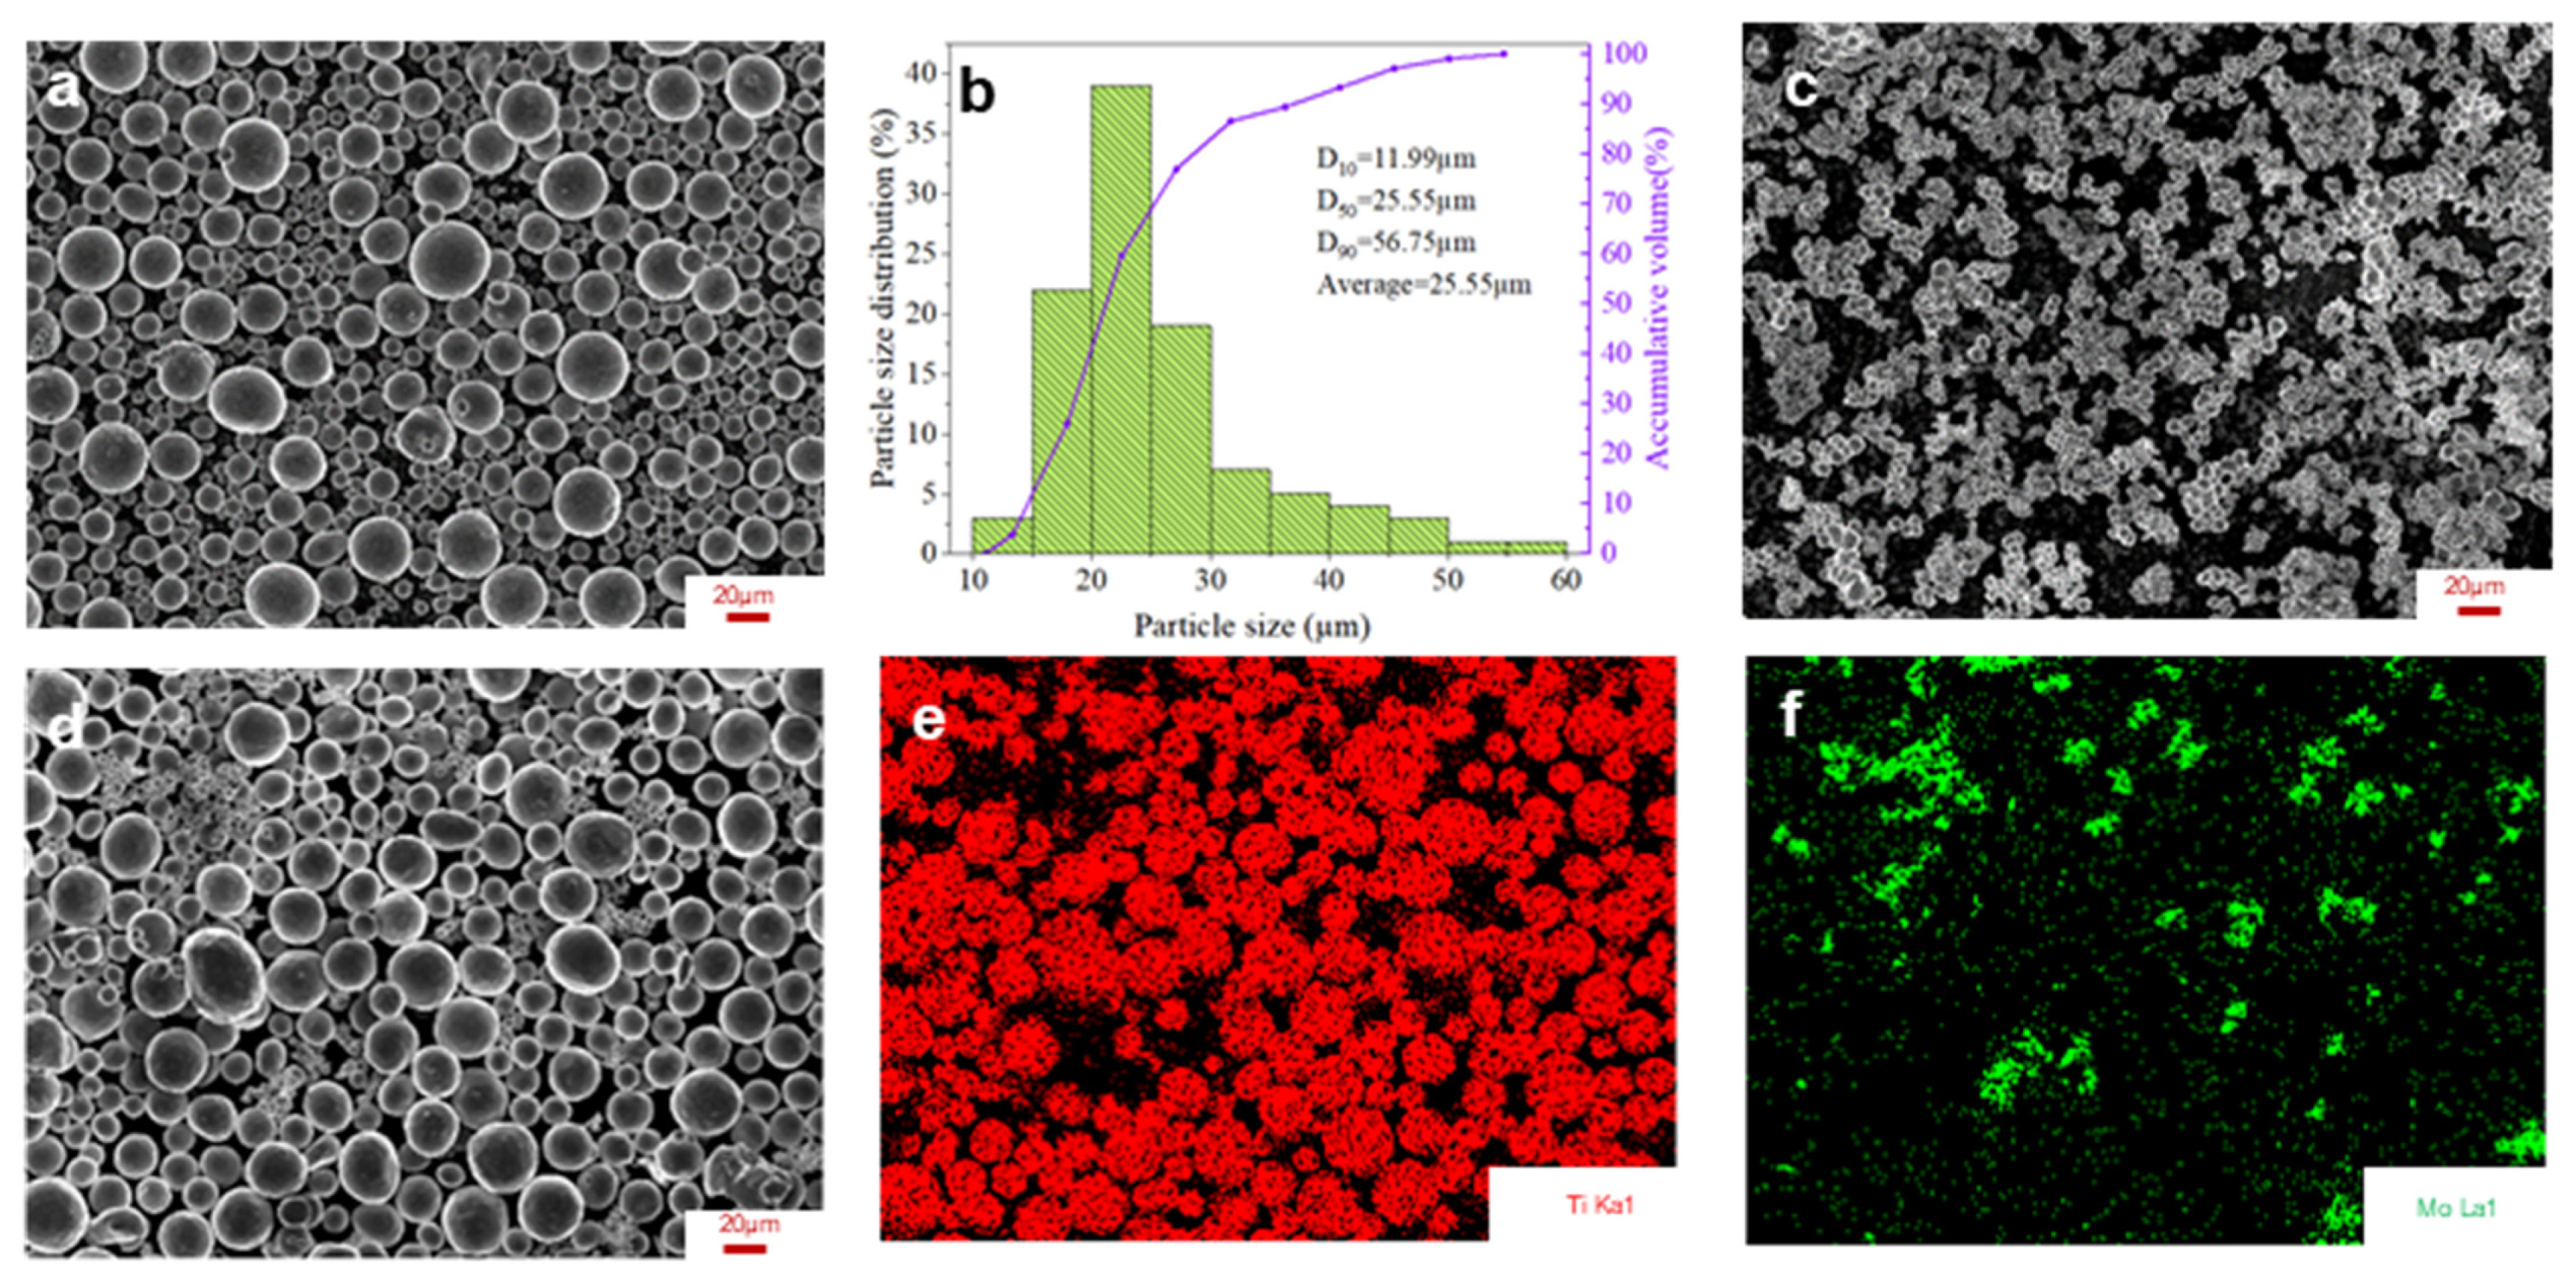
Commercial pure titanium powder (Ti) and molybdenum powder (Mo) purchased from Suzhou XDM 3D Printing Technology Co., Ltd. (Suzhou, China) with high purity (>99 wt.%) were employed as precursor feedstock. The chemical compositions are listed in Table 1. In this study, the elemental Ti powder and Mo powder were mixed in a weight proportion of 90:10. To obtain a homogeneous feedstock of composite powders, Ti-10Mo powders were subjected to mechanical mixing for 90 min at a rotation speed of 300 rpm, with a ball-to-powder weight ratio of 1:5, using a QM-3SP2 planetary ball miller (Nanjing Nanda Instrument Co., Ltd., Nanjing, China). The morphologies and composition analysis of pure Ti, pure Mo, and mixture powders are shown in Figure 3. As can be seen, the pure Ti powders were nearly spherical and uniform (Figure 3a) with a particle size of d50 = 25.55 μm (Figure 3b), while the pure Mo powders were irregular in shape and aggregated (Figure 3c) compared to the pure Ti powders. Notably, the mixture powders were homogeneously dispersed (Figure 3d–f) after mechanical mixing.

Table 1.
Chemical compositions of pure Ti and Mo powders.

Figure 3.
Morphology and composition analysis of the powders: (a,b) SEM micrographs and particle size distributions of pure Ti powders; (c) SEM micrographs of pure Mo powders; (d–f) SEM micrographs and element distributions of Ti-10Mo powder.
2.3. In Situ Fabrication of Ti-10Mo Samples by SLM
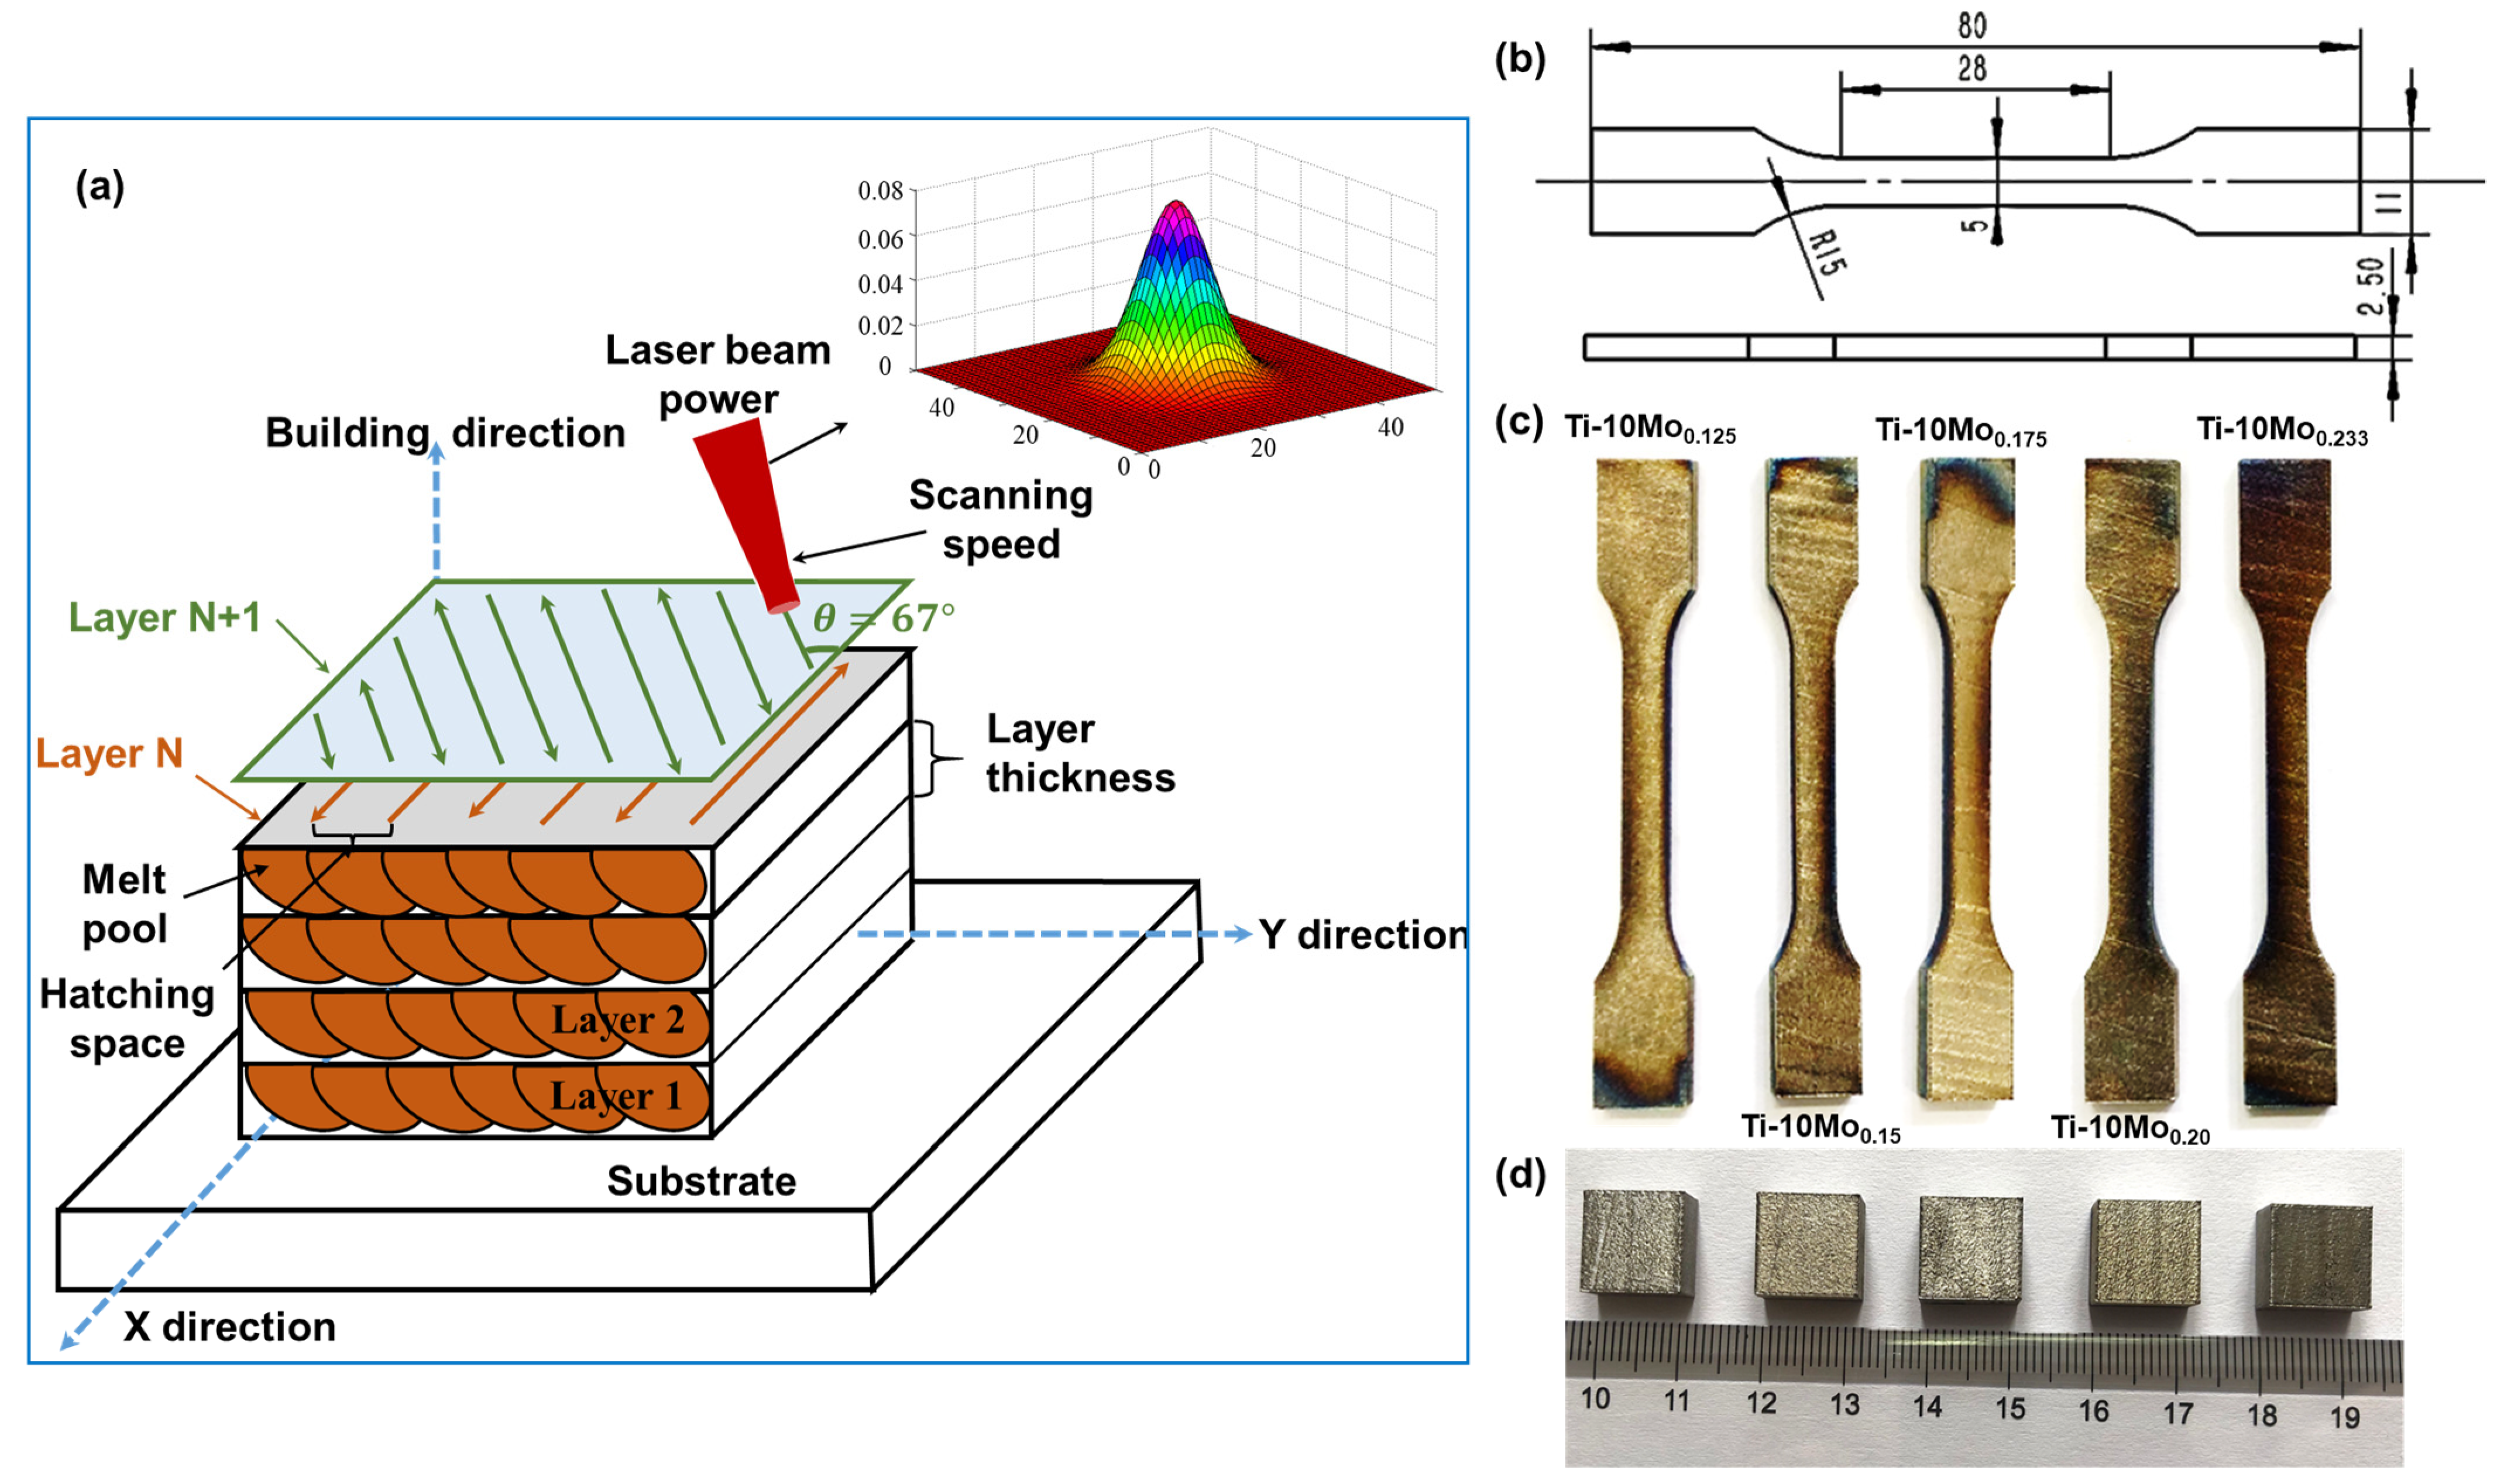
The SLM machine utilized for fabricating Ti-10Mo samples was equipped with a 300 W single-mode fiber laser, operating at a wavelength of 1060 nm, and was applied to a pure titanium substrate. A bi-directional scanning strategy was implemented to reduce residual stress, with a 67° rotation applied between successive layers. A pure Ar atmosphere was used to prevent oxidation during the whole process. To investigate the effect of laser energy input on the properties of the as-fabricated Ti-10Mo specimens, the laser energy input was characterized by combining the laser power and the scanning speed. The linear laser energy density E (J/mm) is calculated using Equation (8):
where P is the laser power; V is the scanning speed.
The specific scanning speed and laser power are listed in Table 2. Accordingly, the samples were named Ti-10Mo0.125, Ti-10Mo0.150, Ti-10Mo0.175, Ti-10Mo0.20, and Ti-10Mo0.233 according to the linear laser energy density. The hatch spacing and layer thickness were fixed at 100 μm and 30 μm, respectively. Cubic parts with a dimension of 10 mm × 10 mm × 10 mm for material characterization and specimens for tensile tests were manufactured. The SLM process and as-fabricated samples are shown in Figure 4.
Table 2.
The process parameters of SLM.
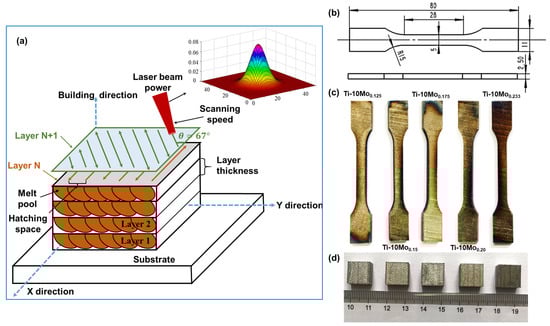
Figure 4.
Schematic illustration of SLM process and as-fabricated samples: (a) Schematic illustration of SLM process. (b) Dimensions of samples for tensile tests. (c) SLM-processed samples for tensile tests. (d) SLM-processed cubic parts for material characterization.
2.4. Characterizations
Before the material characterization, the SLM-processed cubic specimens were ground and polished using a YMP-2 grinding and polishing integrated machine (Shanghai Jinxiang Machinery Equipment Co., Ltd., Shanghai, China) to mitigate the effects of oil stains and scratches on the testing results. The surface morphologies were observed using a LEICA DM 2700M optical microscope (Wetzlar, Germany) and an MFD-D white light interferometer (California, USA). For metallographic examinations, the cubic specimens were ground and polished based on standard metallographic procedures, and then chemically etched using home-made Keller’s Reagent (HF:HNO3:H2O = 2:1:15) for 20 s. The relative density was estimated using quantitative image analysis (Image-Pro Plus Software, Version 6.0) on optical micrographs, which can be expressed as Equation (9). Notably, the relative density of each sample was measured in three different areas and the average value was taken.
where is the area of the defects; is the area of the total image.
The phase formations of the as-fabricated parts were characterized using X-ray diffraction (XRD) (D2 PHASER, Bruker AXS, Germany) with Cu Kα radiation, operated at 40 kV and 30 mA in a 2θ range of 10–90° using a step size of 0.02° and a scanning rate of 5°/min.
2.5. Mechanical Testing
The residual stress of as-fabricated Ti-10Mo samples was measured at the center of the top surface on a JHMK-L multi-point measurement machine (Nanjing Juhang Technology Co., Ltd., Nanjing, China) using the hole-drilling method (HDM). The diameter and depth of the drilling hole were 2 mm and 3 mm, respectively. Figure 5 illustrates the principle diagram of strain measurements, and the residual stress using HDM can be calculated according to Equation (10).
where , , and represent the strain of three different directions; and represent the maximum and minimum principal stress, respectively; θ is the angle between and the reference axis of strain gauge No. 1; E is the elasticity modulus of materials; and and are the release coefficient of strain.
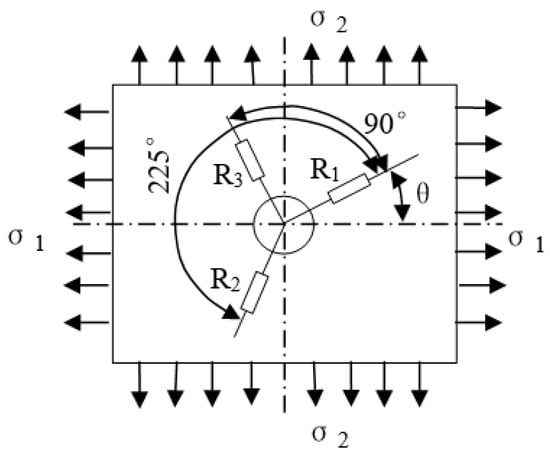
Figure 5.
Schematic diagram of strain measurement.
The Vickers hardness measurements were performed on mirror-polished surfaces using an HVS-1000 ZCM-XY digital microhardness indenter (Shanghai Suoyan Testing Instrument Co., Ltd., Shanghai, China) with a load of 200 g and a dwell time of 15 s. To reduce the measurement error, each specimen was measured five times and the average value was taken. According to ASTM E 8M, tensile tests were performed at room temperature on a BYSE9700 testing machine (Bangyi Precision Measuring Instrument Co., Ltd., Shenzhen, China) at a strain rate of 10−3 s−1. The SLM-processed specimens shown in Figure 4b,c for tensile tests were built as rectangular beams, and the tensile test loading direction was perpendicular to the building direction for all five samples. Moreover, the tensile yield strength and elongation were calculated using the 0.2% offset method from the measured stress–strain curves. All tensile tests were conducted at room temperature. The fracture surfaces were observed using scanning electron microscopy (SEM) (Zeiss, Oberkochen, Germany).
3. Results and Discussion
3.1. Subsection Residual Stress Evolution
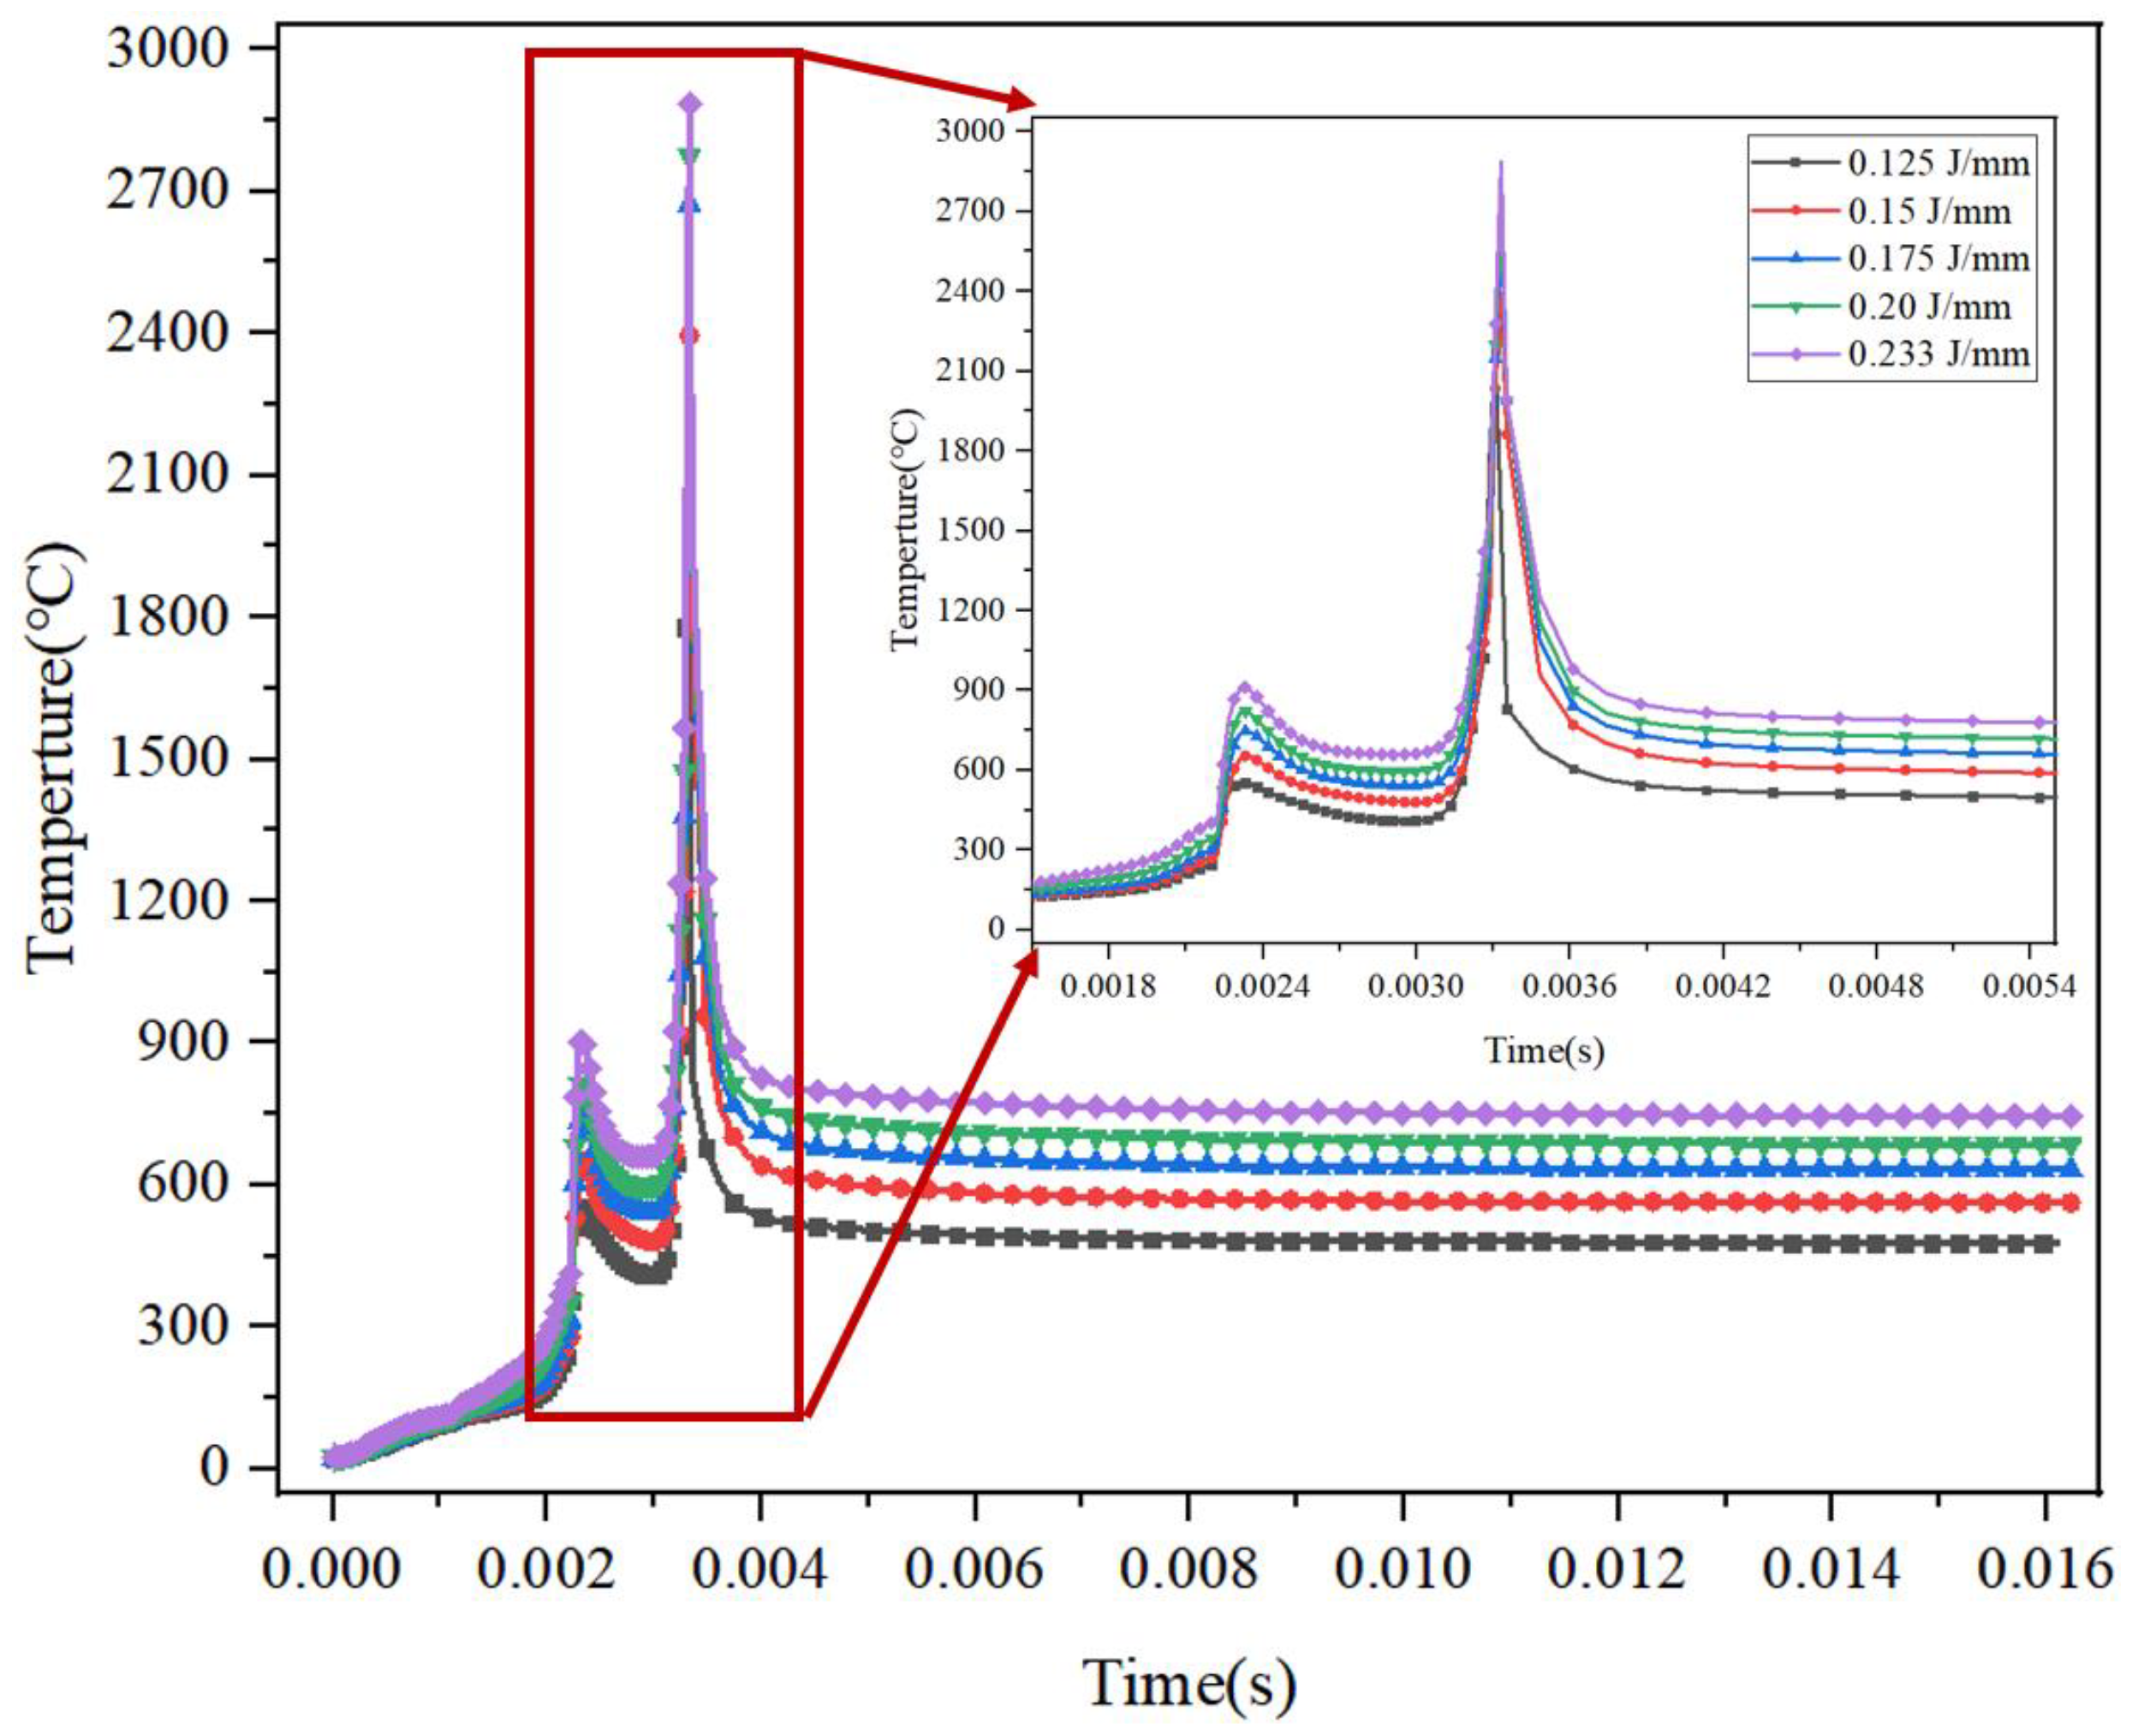
The residual stress in SLM-processed components is primarily thermal stress, indicating its relevance to temperature evolution. To better understand the evolution of the residual stress, the transient thermal history of Ti-10Mo samples prepared at different linear energy densities is shown in Figure 6. It can be noted that the temperature distributions are generally similar across the samples. Each temperature–history profile shows two temperature peaks. The first peak occurs when the laser heat source moves to a position adjacent to the current point, causing the heat generated by the melting powder to transfer to the surrounding area. The second peak is observed when the laser is at the testing point, resulting in the molten pool reaching its highest temperature. Additionally, each profile can be divided into two stages including heating and cooling. The temperature of the molten pool decreases as the laser heat source moves away from the testing point. The peak temperature and the maximum cooling rate obtained by differentiating the temperature curves are listed in Table 3. As linear energy density increases, the temperature gradient also increases, leading to an increment in the maximum cooling rate. Hence, the cooling rate is found to be proportional to the linear energy density.
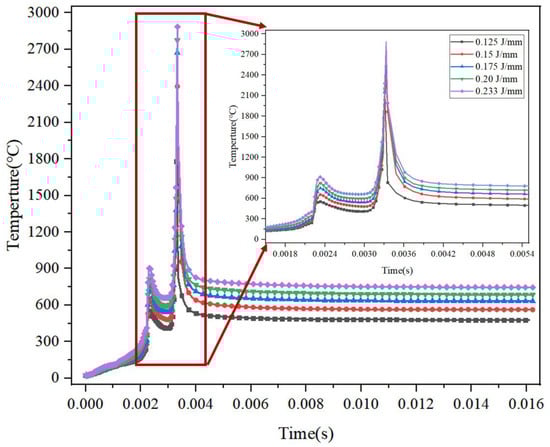
Figure 6.
Transient thermal history under different linear energy densities.
Table 3.
Simulation results under different linear energy densities.
Figure 7 shows the Von Mises, X, Y, and Z component stress distributions of Ti-10Mo alloys under a laser power of 150 W and a scanning speed of 1200 mm/s. It can be observed that the Von Mises stress is evenly distributed along the laser scanning path, and the maximum values of stress are observed close to the edges, resulting from the higher cooling rate and temperature gradient at the edge. In addition, the Gaussian distribution of the laser heat source is also a key factor that cannot be ignored. Moreover, the stress values in Figure 7b–d have both positive and negative values, indicating that the stresses in the X, Y, and Z directions are different modes. The stresses in the X and Z directions are mainly tensile stress, whereas the Y-direction stress is mainly compressive stress. This can be the reason for the thermal expansion of the molten pool, generating a certain compressive stress on the nearby regions. Figure 7 illustrates the distributions of Von Mises stress, as well as the X, Y, and Z component stresses under a laser power of 150 W and a scanning speed of 1200 mm/s. It can be observed that the Von Mises stress is uniformly distributed along the laser scanning path, with the maximum values occurring near the edges due to the higher cooling rate and temperature gradient in those regions. Additionally, the Gaussian distribution of the laser heat source is a significant factor that cannot be ignored. Moreover, the stress values depicted in Figure 7b–d exhibit both positive and negative values, indicating that the stresses in the X, Y, and Z directions represent different modes. The stresses in the X and Z directions are predominantly tensile, whereas the Y-direction stress is primarily compressive. This phenomenon may be attributed to the thermal expansion of the molten pool, which generates a certain degree of compressive stress in the adjacent regions.
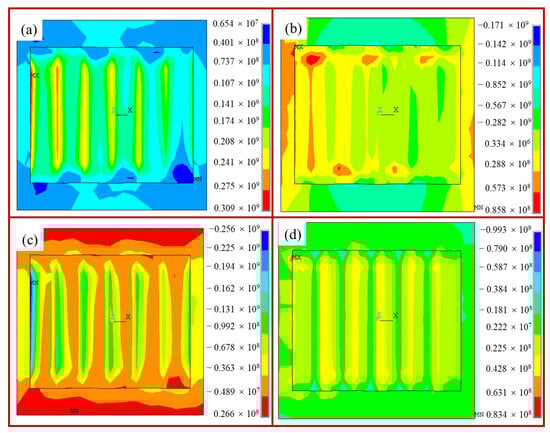
Figure 7.
An example of residual stress distribution in the SLM specimen under laser power of 150 W and scanning speed of 1200 mm/s: (a) Von Mises stress; (b) X-direction stress; (c) Y-direction stress; (d) Z-direction stress.
The simulation results for the maximum values of Von Mises stress, as well as the X, Y, and Z component stress, alongside the experimental results for residual stress, are presented in Table 4. It can be found that the cooling rate and transient thermal history are the primary factors that significantly influence residual stresses. Hence, residual stress is found to be proportional to the linear energy density, like the stresses in the X, Y, and Z directions. Moreover, the maximum values of Von Mises stress are recorded as 309 MPa, 338 MPa, 367 MPa, 419 MPa, and 440 MPa at linear laser energy densities of 0.125 J/mm, 0.150 J/mm, 0.175 J/mm, 0.20 J/mm, and 0.233 J/mm, respectively. The simulation results align well with the experimental measurements, with an error range of 17% to 23%.
Table 4.
Comparison of the simulation data and experimental results of stress (unit: MPa).
3.2. Surface Morphology
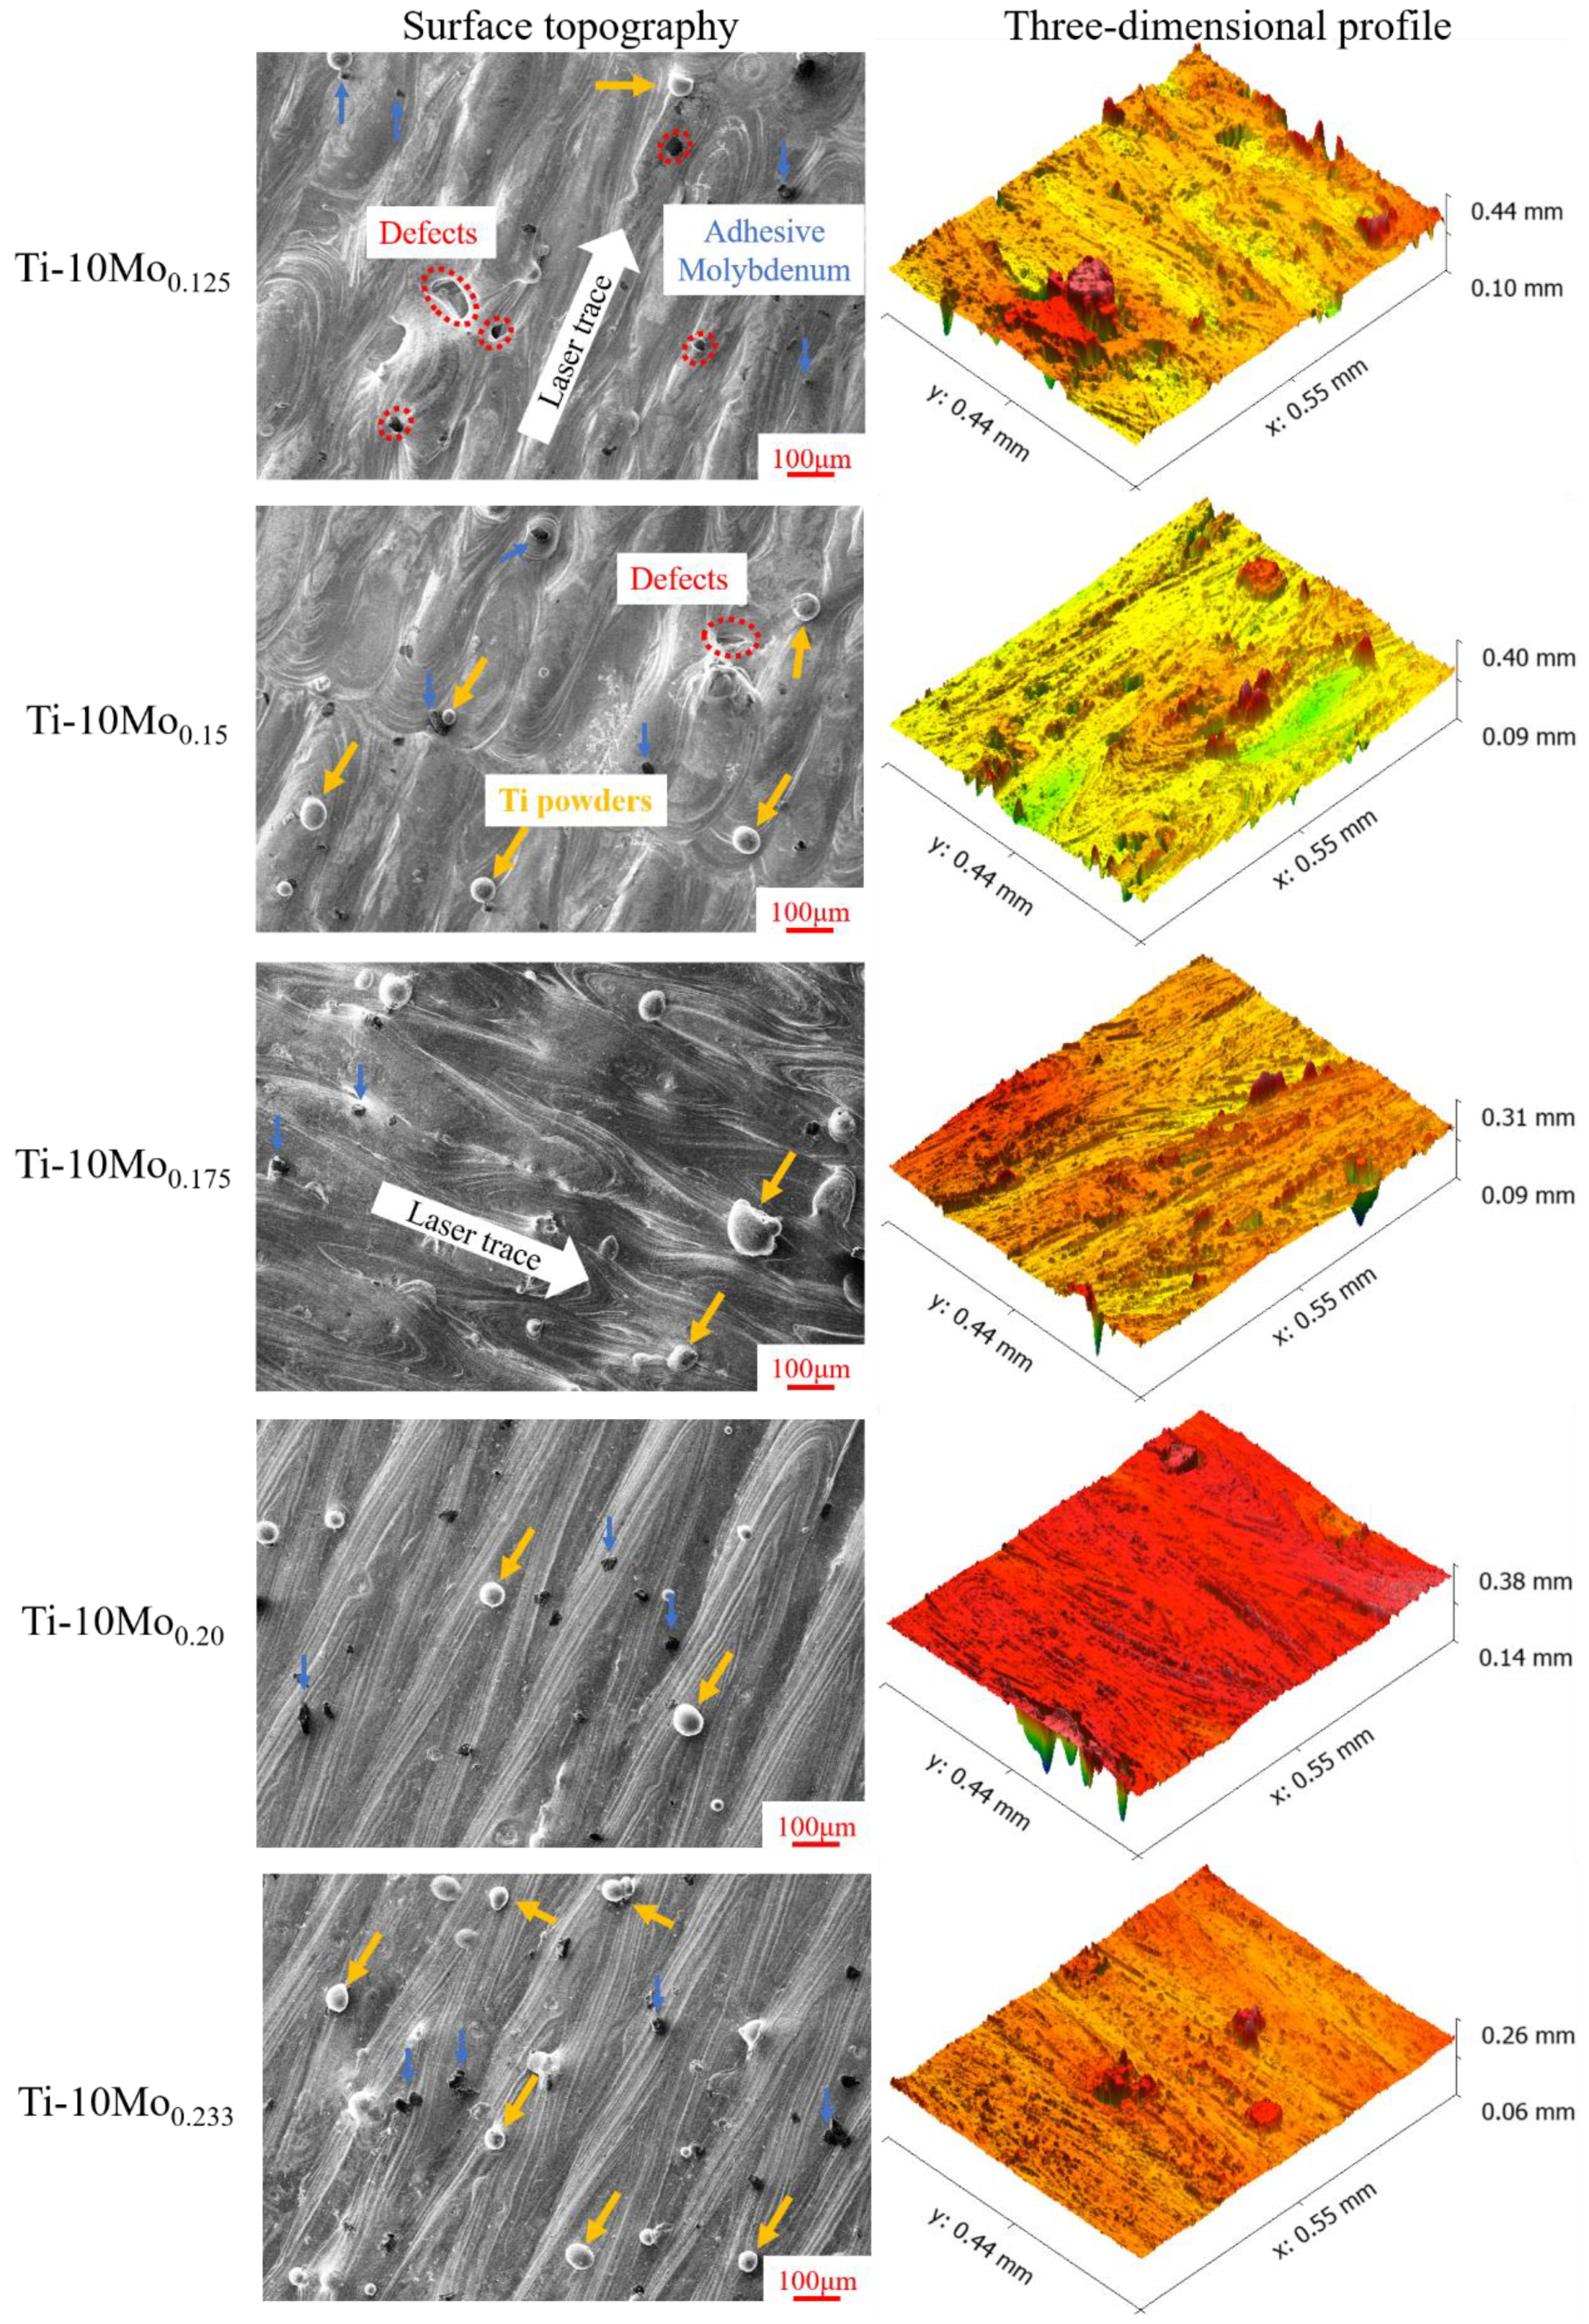
The surface topographies and three-dimensional profiles of SLM-processed Ti-10Mo alloys are shown in Figure 8. When the linear laser energy density is 0.125 J/mm, a small number of pores and irregular flow front adhered with spherical particles can be observed. As the laser power increases or the scanning speed decreases, that is, with the increase in laser energy density, the surface defects are significantly reduced, but the issue of powder adhesion becomes more pronounced. This phenomenon is related to the dynamic viscosity of a molten pool [30], as defined in Equation (11)
where m is the atomic mass; K is the Boltzmann constant; T is the temperature of the molten pool; and is the surface tension. When using a larger laser energy density, the temperature of the molten pool is increased, resulting in a lower liquid viscosity. Accordingly, the flowability of the molten pool increases, leading to a flatter surface with a uniform flow front. Nevertheless, a higher laser energy input can cause liquid splashing, resulting in the formation of spherical particles that become embedded on the surface of the as-fabricated samples.
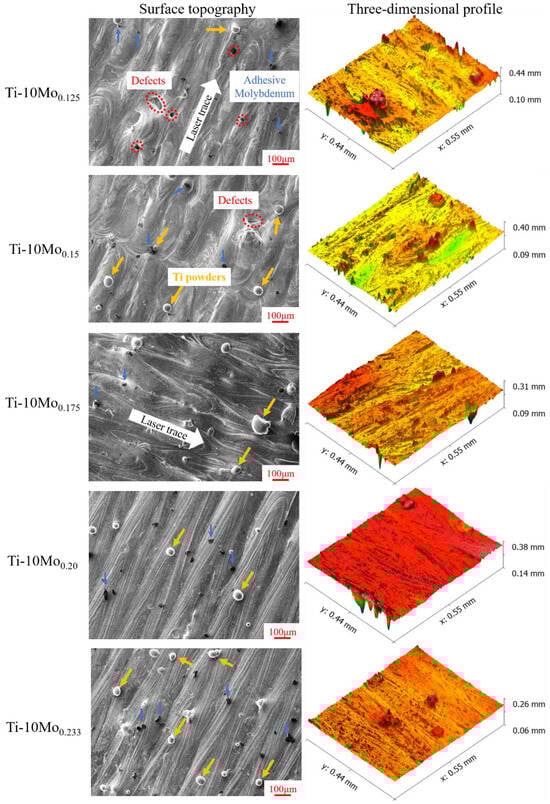
Figure 8.
Surface topographies of as-built Ti-10Mo alloys at various linear laser energy densities.
Moreover, the three-dimensional profiles exhibit significant differences due to the different processing parameters, as also confirmed by the variations in surface roughness. Table 5 systematically summarizes the surface roughness and relative compactness of the as-built Ti-10Mo alloys. It can be noted that the average surface roughness of the Ti-10Mo0.125 sample is up to 18.2 μm, and the relative density is only 94.9%. With the linear energy density increasing to 0.233 J/mm, the average surface roughness decreases by 75.8% and the relative compactness is increased by 5.2%. These results indicate that higher laser power or lower scanning speed contributes to reduced surface roughness and enhanced relative compactness. This observation coincides with the surface morphology results, which show that the laser trace becomes smoother and flatter with increasing linear energy density.
Table 5.
Surface characterization of as-built Ti-10Mo alloys (unit: μm).
3.3. Microstructural Characterization
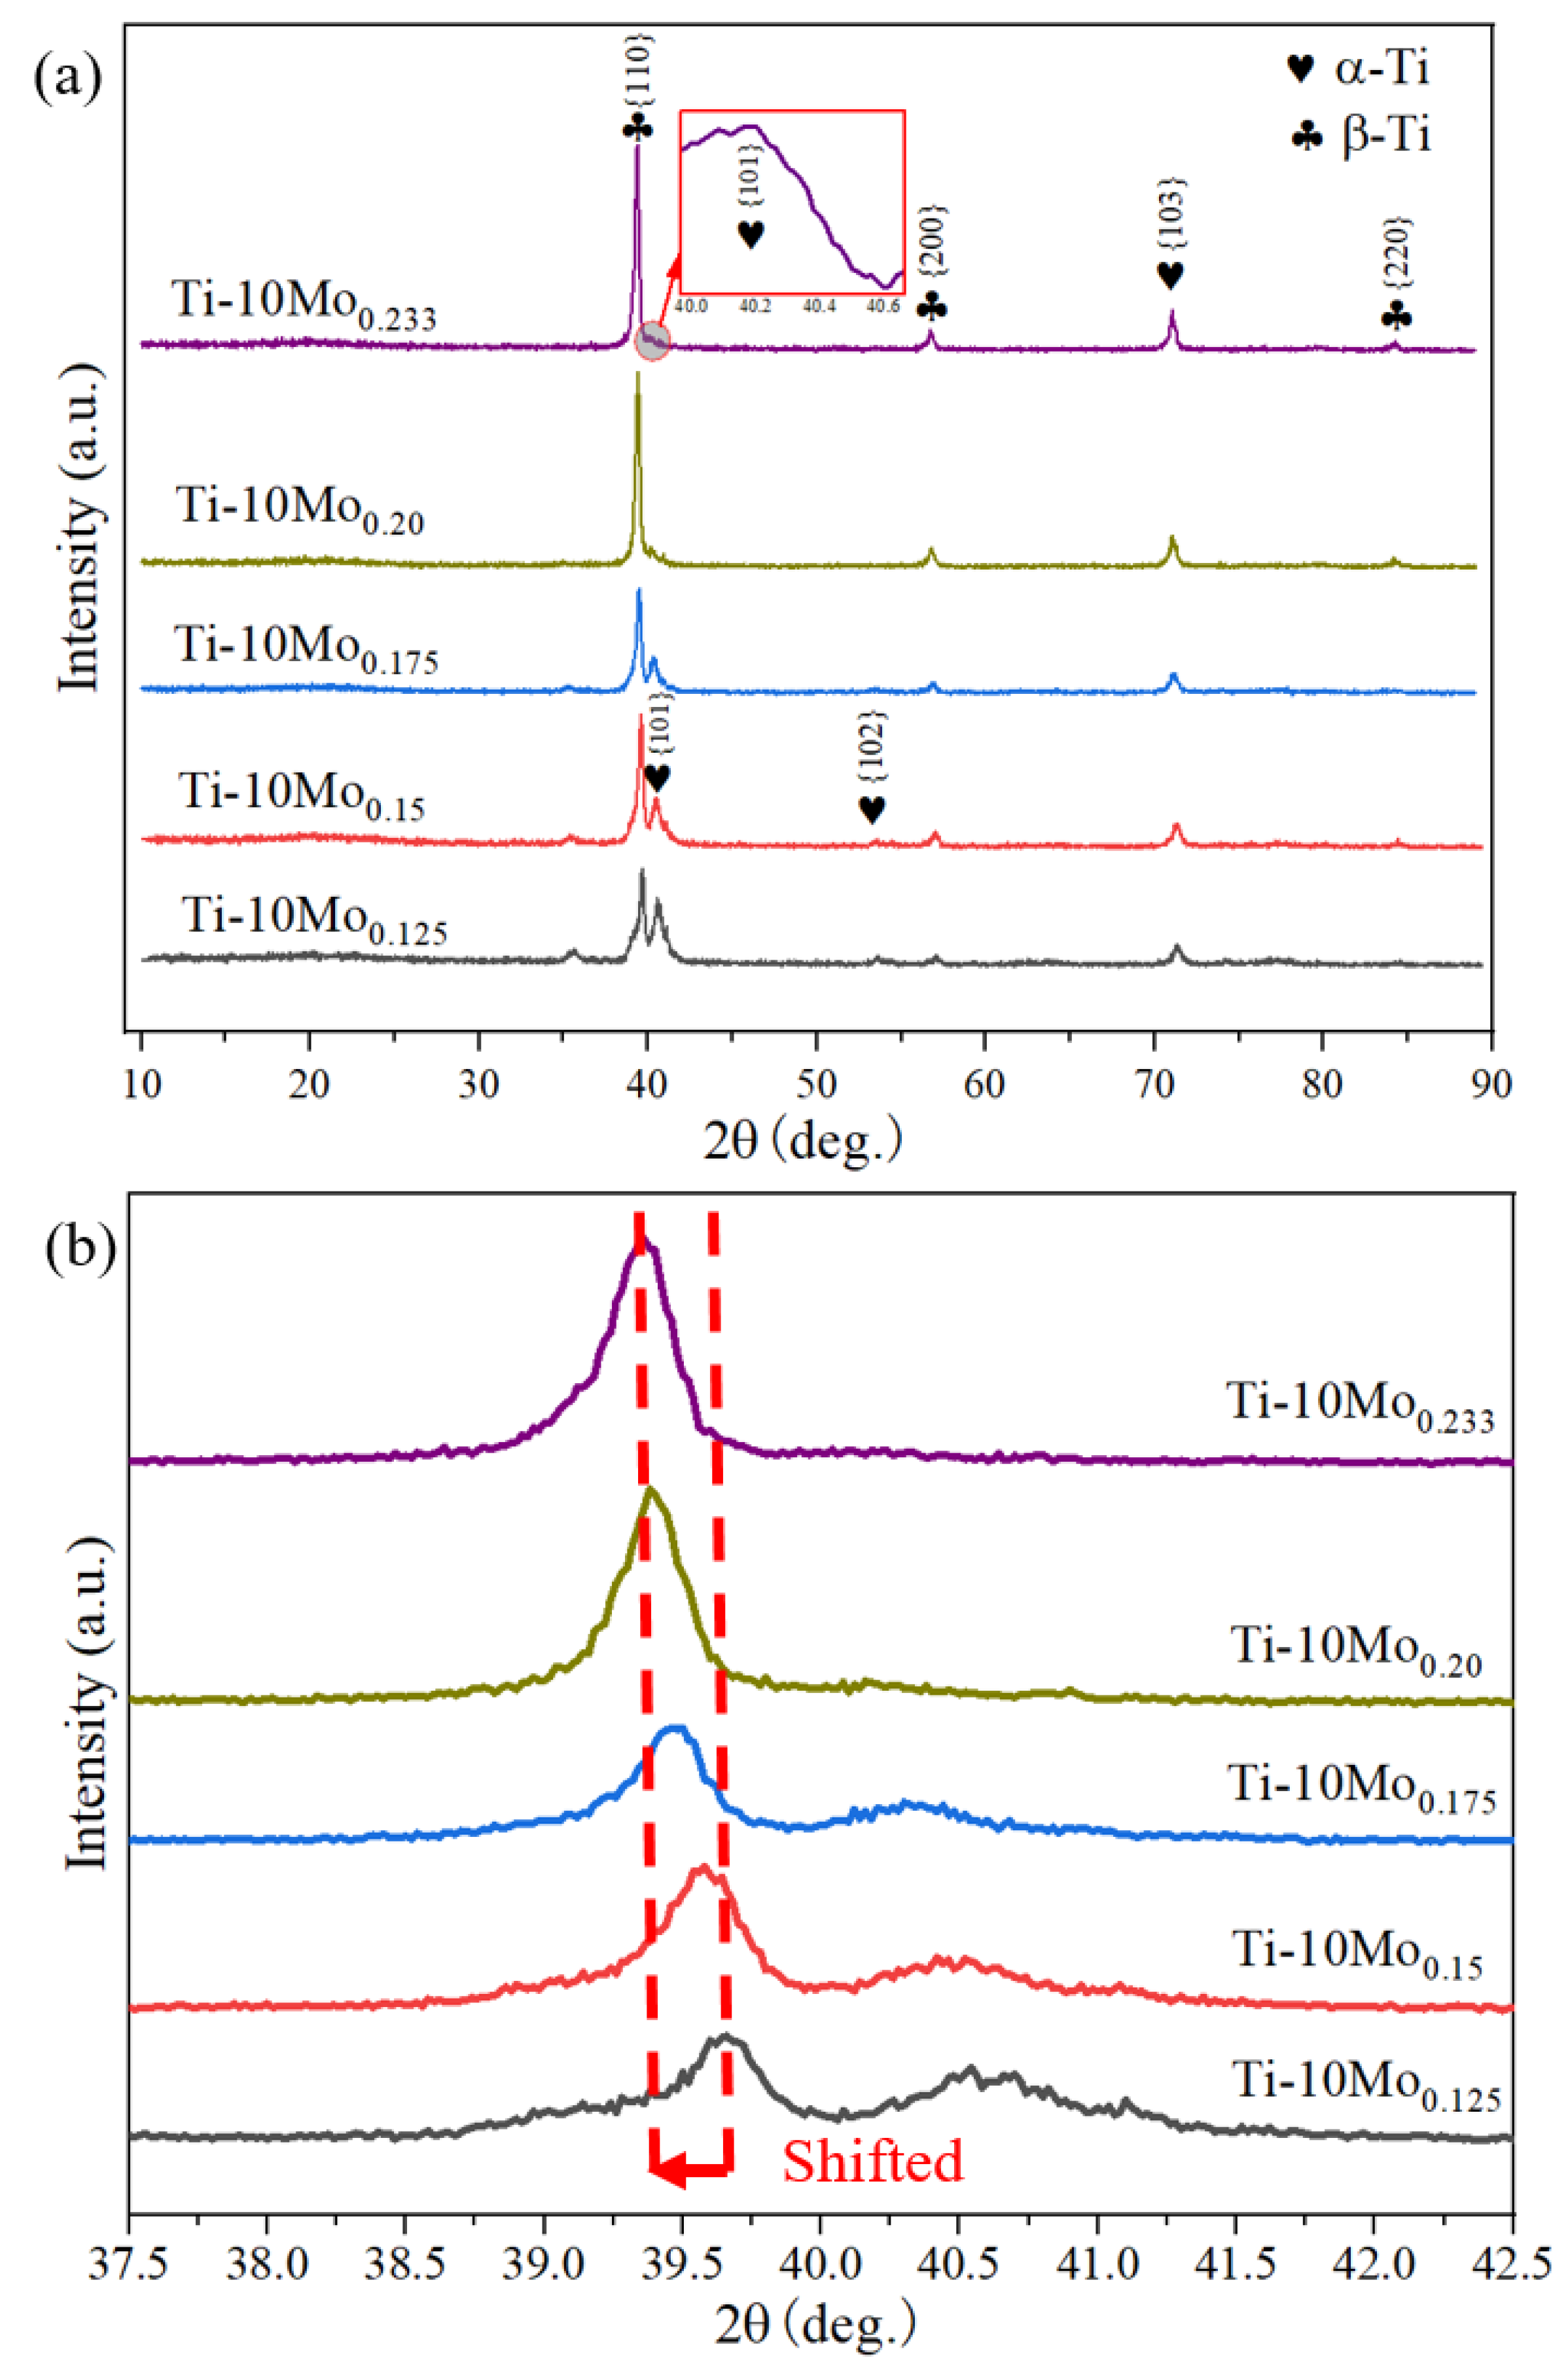
Figure 9 shows the XRD patterns of the SLM-processed Ti-10Mo alloys under various linear energy densities. The distinct diffraction peaks indicate that the SLM-processed Ti-10Mo alloys comprise a mixed phase of hexagonal close-packed (hcp) α-Ti and body-centered cubic (bcc) β-Ti at room temperature, with α-Ti exhibiting higher intensity. However, the diffraction peaks corresponding to the pure Mo phase are absent in all five samples, which aligns with the findings of Xie et al. and Kang et al. [31,32]. As Mo serves as a significant β-stabilizer, the critical cooling rate required to retain the β phase is reduced, and the transformation from the β to α′ phase is suppressed by lowering the martensitic starting temperature. This results in the retention of the bcc β-Ti structure during the rapid cooling and solidification of the SLM process [20,23]. As the linear laser energy density increases from 0.125 to 0.233 J/mm, the peaks corresponding to the β phase increase slightly, while the diffraction peaks of the α phase exhibit a slight reduction. This phenomenon can be explained by the fact that the β-stabilizer Mo particles were more sufficiently melted with the increasing laser energy density. On the one hand, the concentration of Mo particles could be below the detection limit of X-ray diffraction, which is sensitive primarily to crystalline phases. On the other hand, the size and distribution of the Mo particles might affect their visibility in the XRD analysis. Smaller particles or those in an amorphous state may not produce distinct diffraction peaks. Hence, Mo particles are not visualized at the XRD spectra. Additionally, in theory, due to the high cooling rate of the SLM process, the lattice stress increases, leading to a higher 2θ location. However, the 2θ angles of the diffraction peaks are slightly left-shifted according to the local view shown in Figure 9b. This shift can be attributed to the larger atomic radius of Mo compared to that of Ti. Consequently, the increased presence of Mo particles as substitutional atoms leads to an expansion of the lattice constant of the Ti matrix. Bragg’s law is described in Equation (12),
where d is the lattice constant, λ is the wavelength of the incident wave, and θ is the angle between the incident light and the crystal plane. It can be found that the higher d leads to lower θ [33], which explains the reason for a slight left shifting in the 2θ angle [33].
2 × d × sinθ = nλ
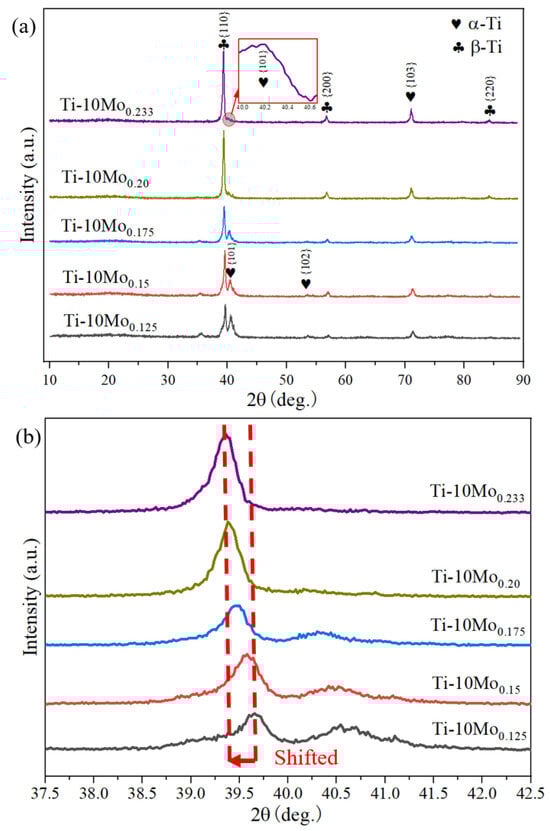
Figure 9.
XRD patterns of SLM-processed Ti-10Mo alloys under various linear energy densities: (a) overview and (b) local view.
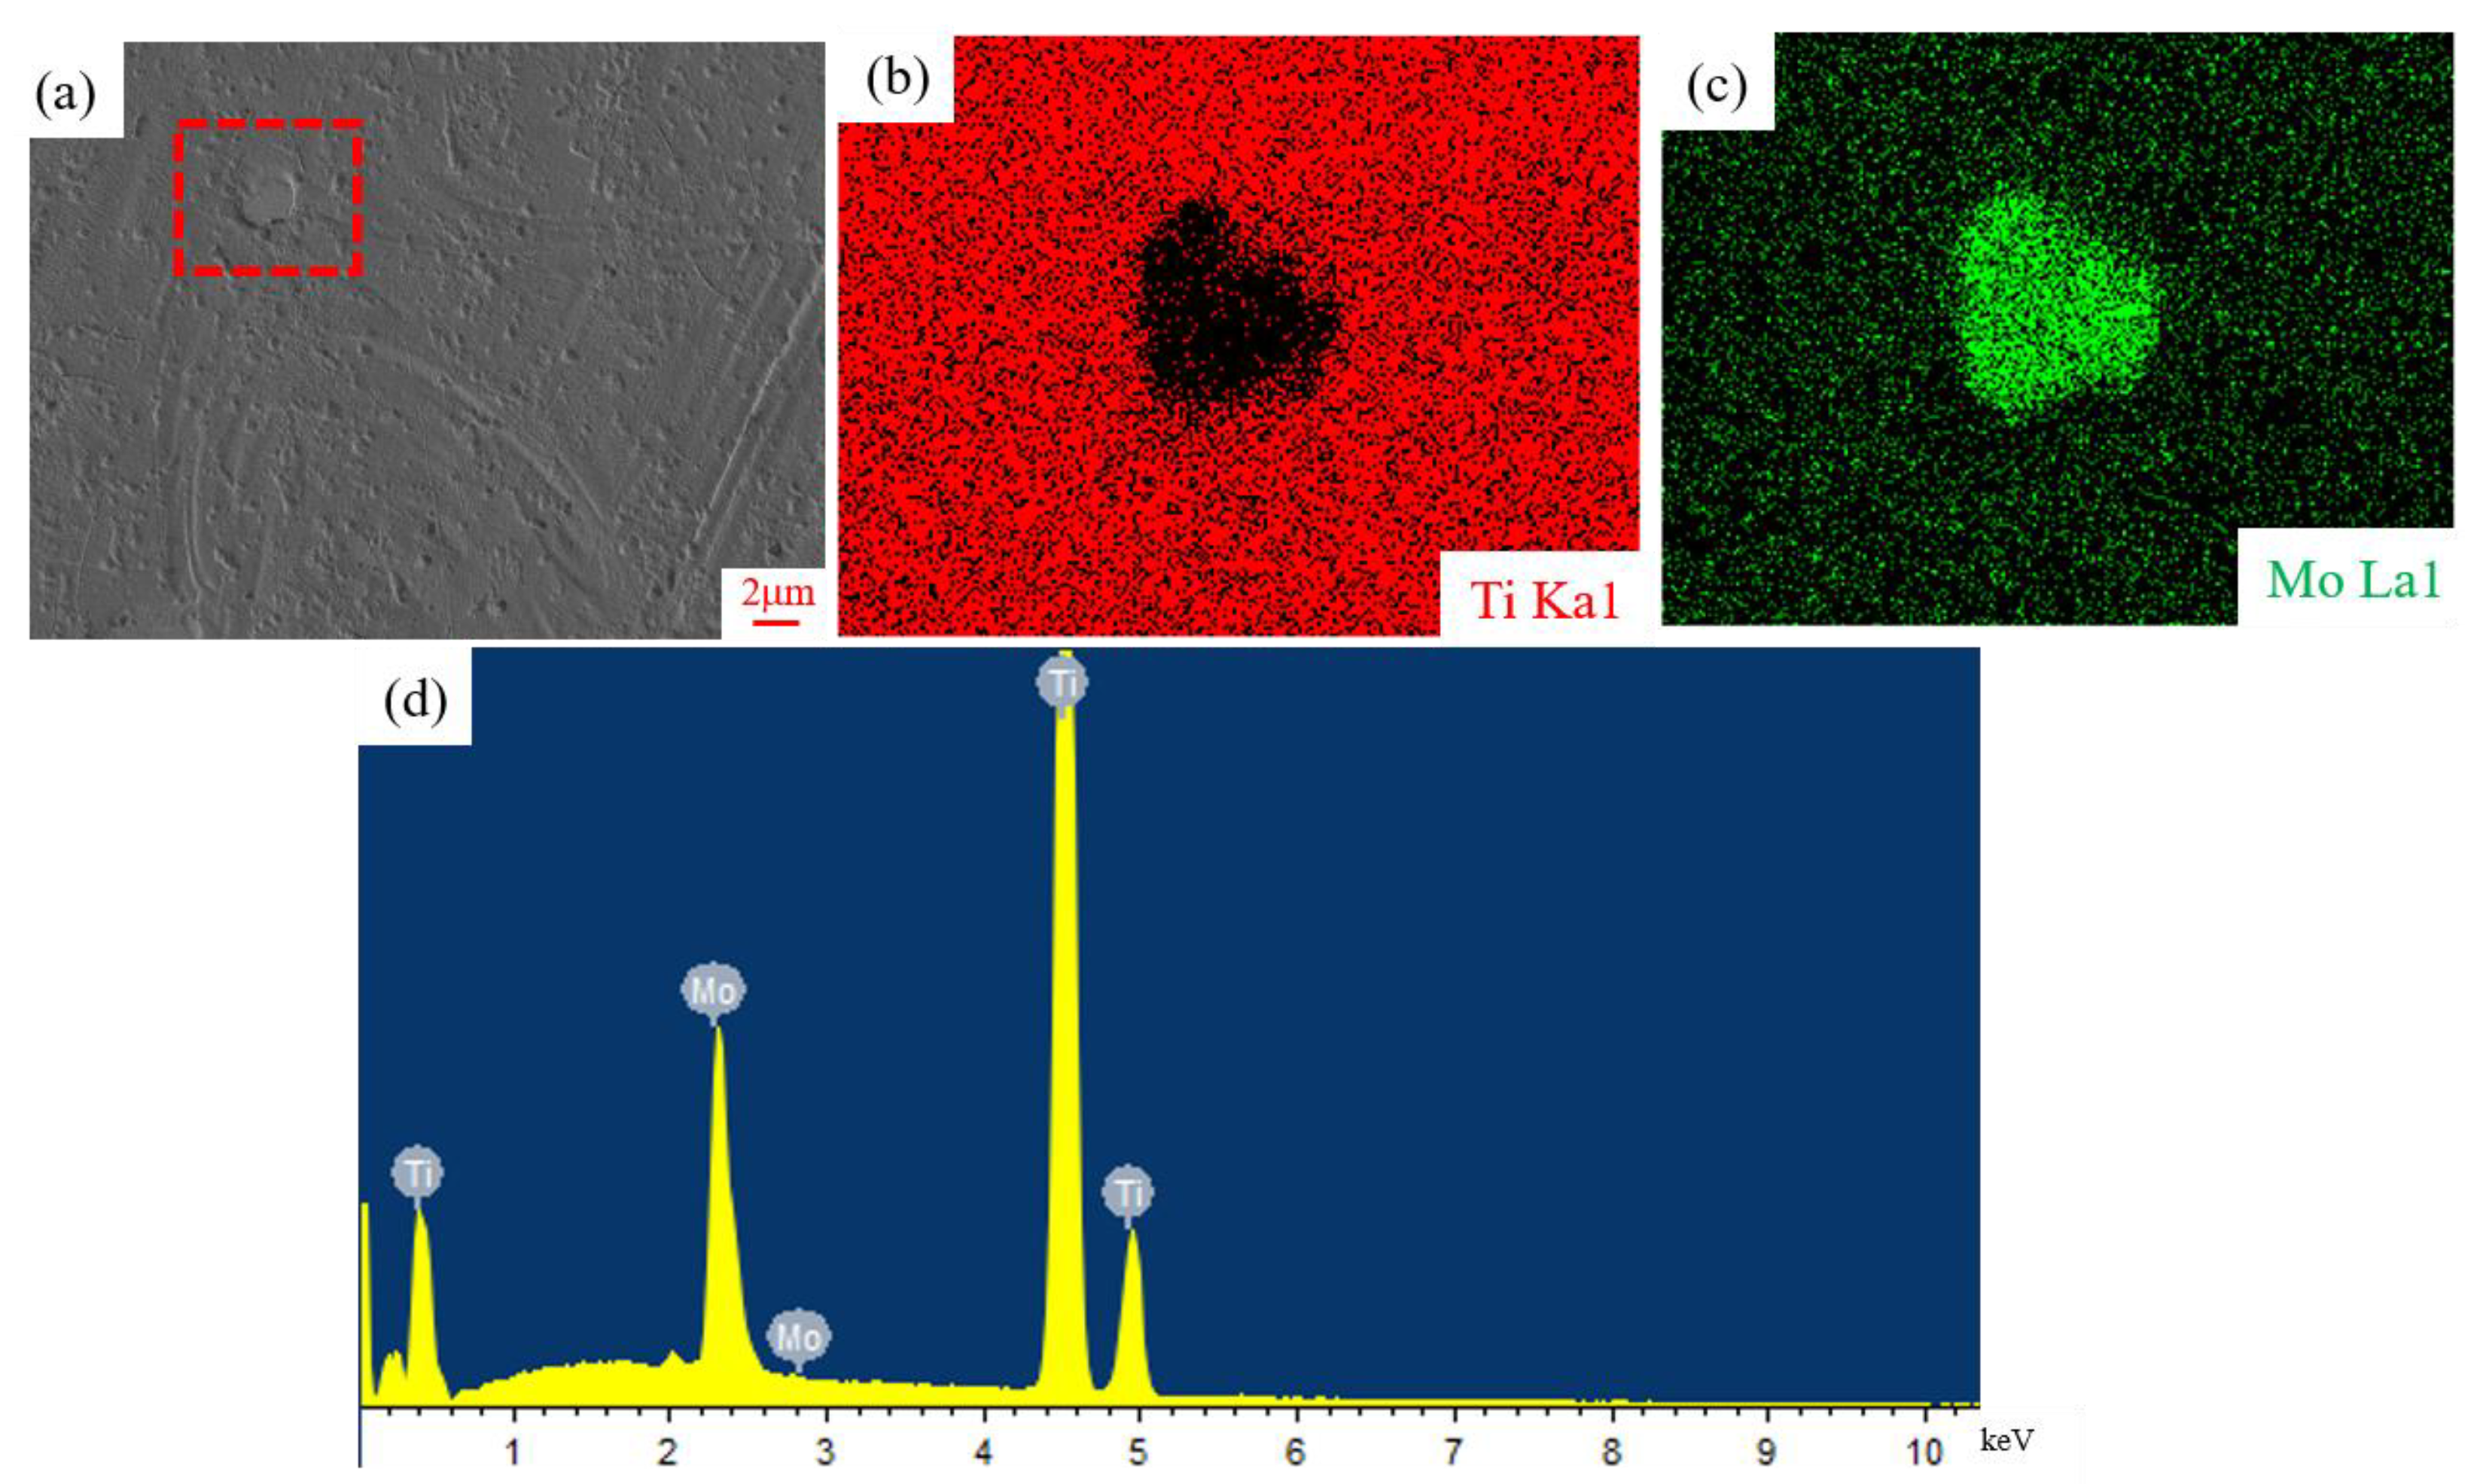
The etched microstructures of SLM-processed Ti-10Mo alloys are depicted in Figure 10. It is noted that the angle between the two layers of laser traces is observed to be approximately 67°, aligning with the designed scanning strategy outlined in the experimental section. Meanwhile, samples prepared with low laser energy input exhibit a heterogeneous conchoidal microstructure, as illustrated in Figure 10a–c. With increasing linear energy density, the higher laser energy input leads to the remelting of the melt trace. Consequently, the dissolution of the heterogeneous conchoidal microstructure can be observed, as presented in Figure 10d,e. Furthermore, it is worth noting that some unmelted or partially melted Mo powder particles are randomly distributed along the boundary of the melt trace. This phenomenon can be attributed to the high melting point of Mo (2380 °C), which causes the Mo particles to remain partially melted while the Ti particles are fully fused under a high-energy laser beam. Consequently, solid Mo was driven by the stirring effect of Marangoni flow within the molten pool, resulting in the accumulation of Mo at the boundary of the melt trace during the SLM process. As demonstrated in Figure 11, some unmelted or partially melted Mo powder particles can be detected in the EDS results.
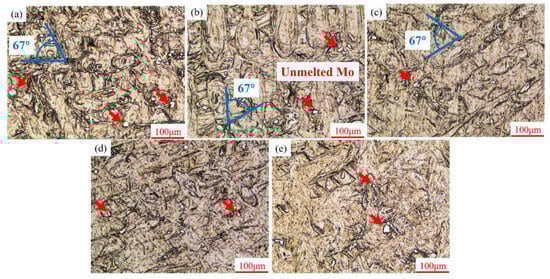
Figure 10.
Optical microstructures of SLM-processed Ti-10Mo alloys at various linear energy densities: (a) 0.125 J/mm, (b) 0.15 J/mm, (c) 0.175 J/mm, (d) 0.20 J/mm, and (e) 0.233 J/mm.

Figure 11.
EDS results of Ti-10Mo0.233 sample: (a) SEM micrographs; (b,c) mapping distribution of Ti and Mo elements (the corresponding region marked with red dotted frame in (a)); (d) EDS spectrum.
3.4. Microhardness
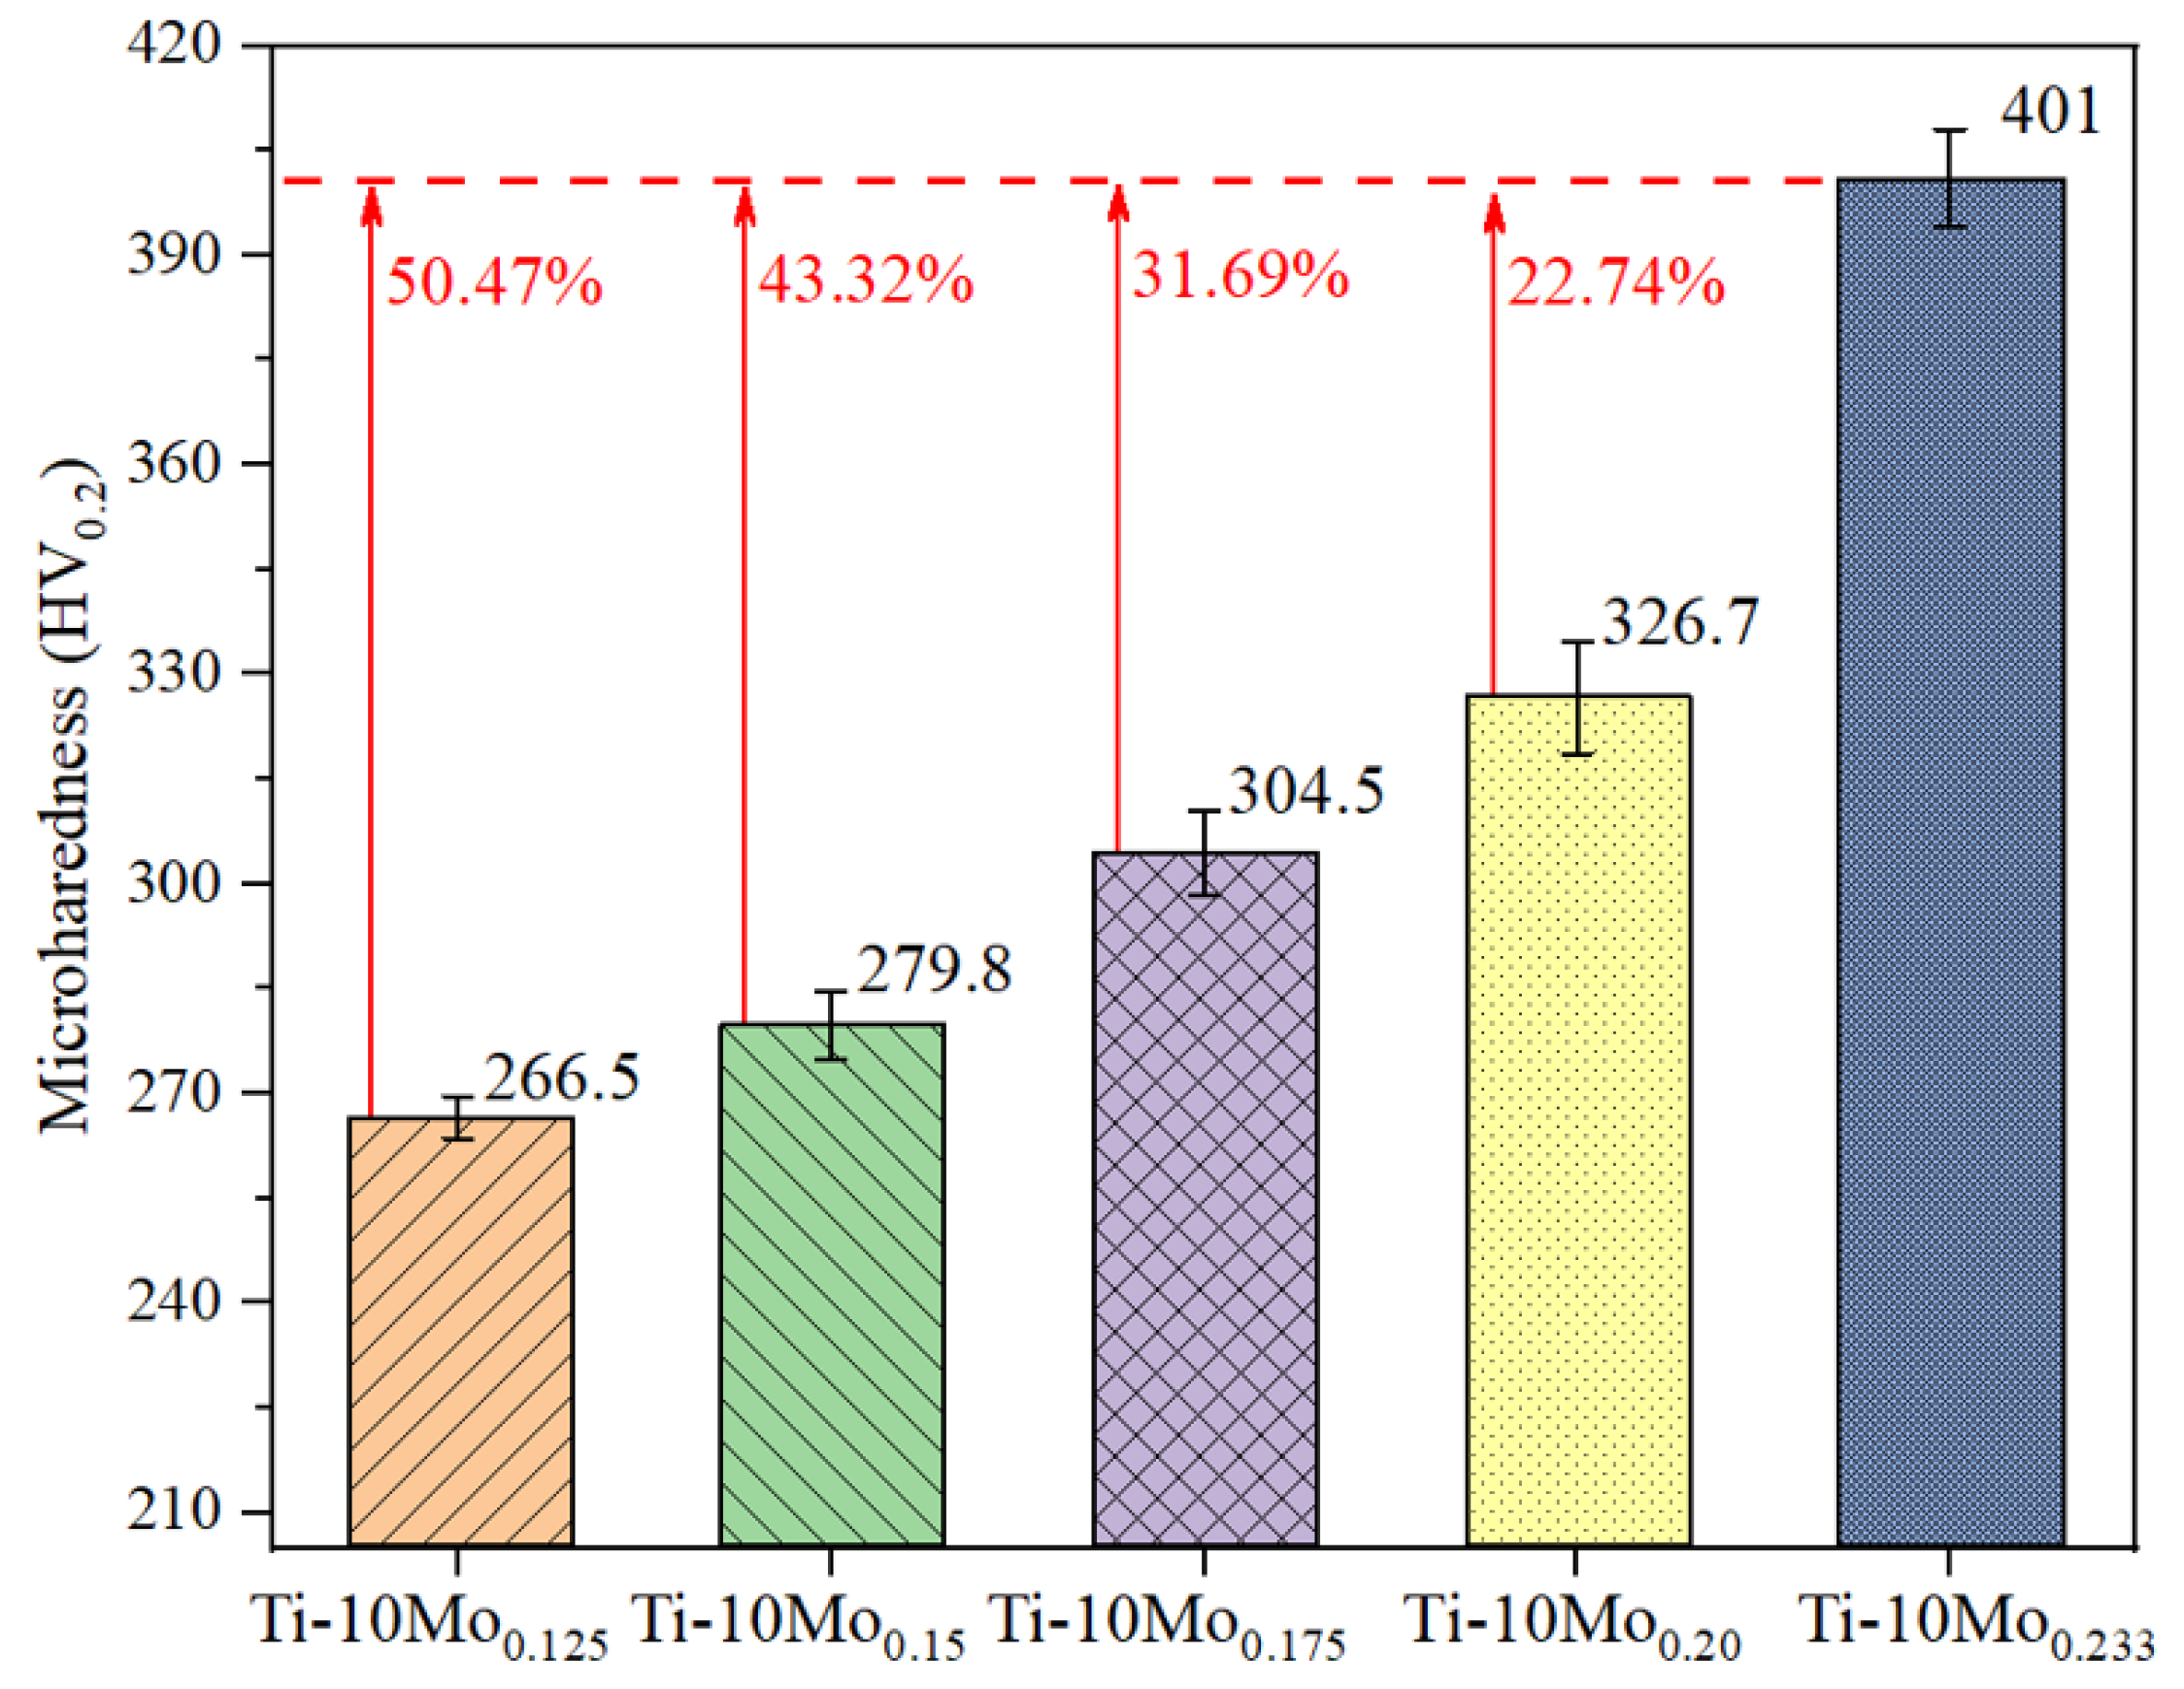
The microhardness of different SLM-processed Ti-Mo samples is shown in Figure 12. At an energy input of 0.125 J/m, the microhardness is 266.5 HV0.2, attributed to the presence of large voids resulting from incomplete powder melting. It can be concluded that high linear laser energy density correlates with increased microhardness, consistent with the trend observed in the relative density of the samples (Table 4). Once the linear energy density is up to 0.233 J/mm, the sample exhibits the highest microhardness with the value of 401HV0.2, which is 50.47%, 43.32%, 31.69%, and 22.74% higher than that of the Ti-10Mo0.125, Ti-10Mo0.150, Ti-10Mo0.175, and Ti-10Mo0.2 samples, respectively. From the XRD results, it can be found that the peaks of the β phase increase slightly, while those of the α phase exhibit a minor weakening with the increasing laser energy density. Nevertheless, the differences in the quantities of α-Ti and β-Ti are not significantly distinct. Accordingly, the differences in porosity and the Mo particle content within the samples synergistically lead to the variation in microhardness.
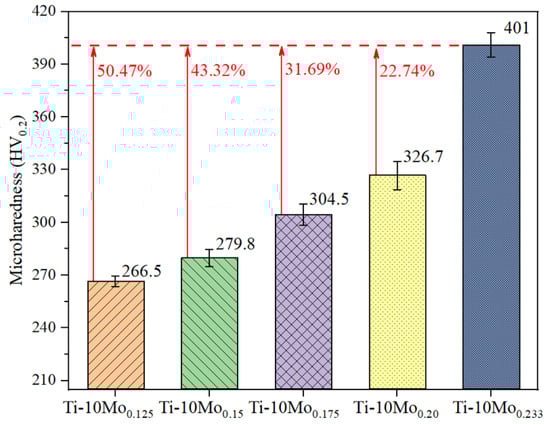
Figure 12.
Microhardness of SLM-processed Ti-10Mo alloys.
3.5. Tensile Properties
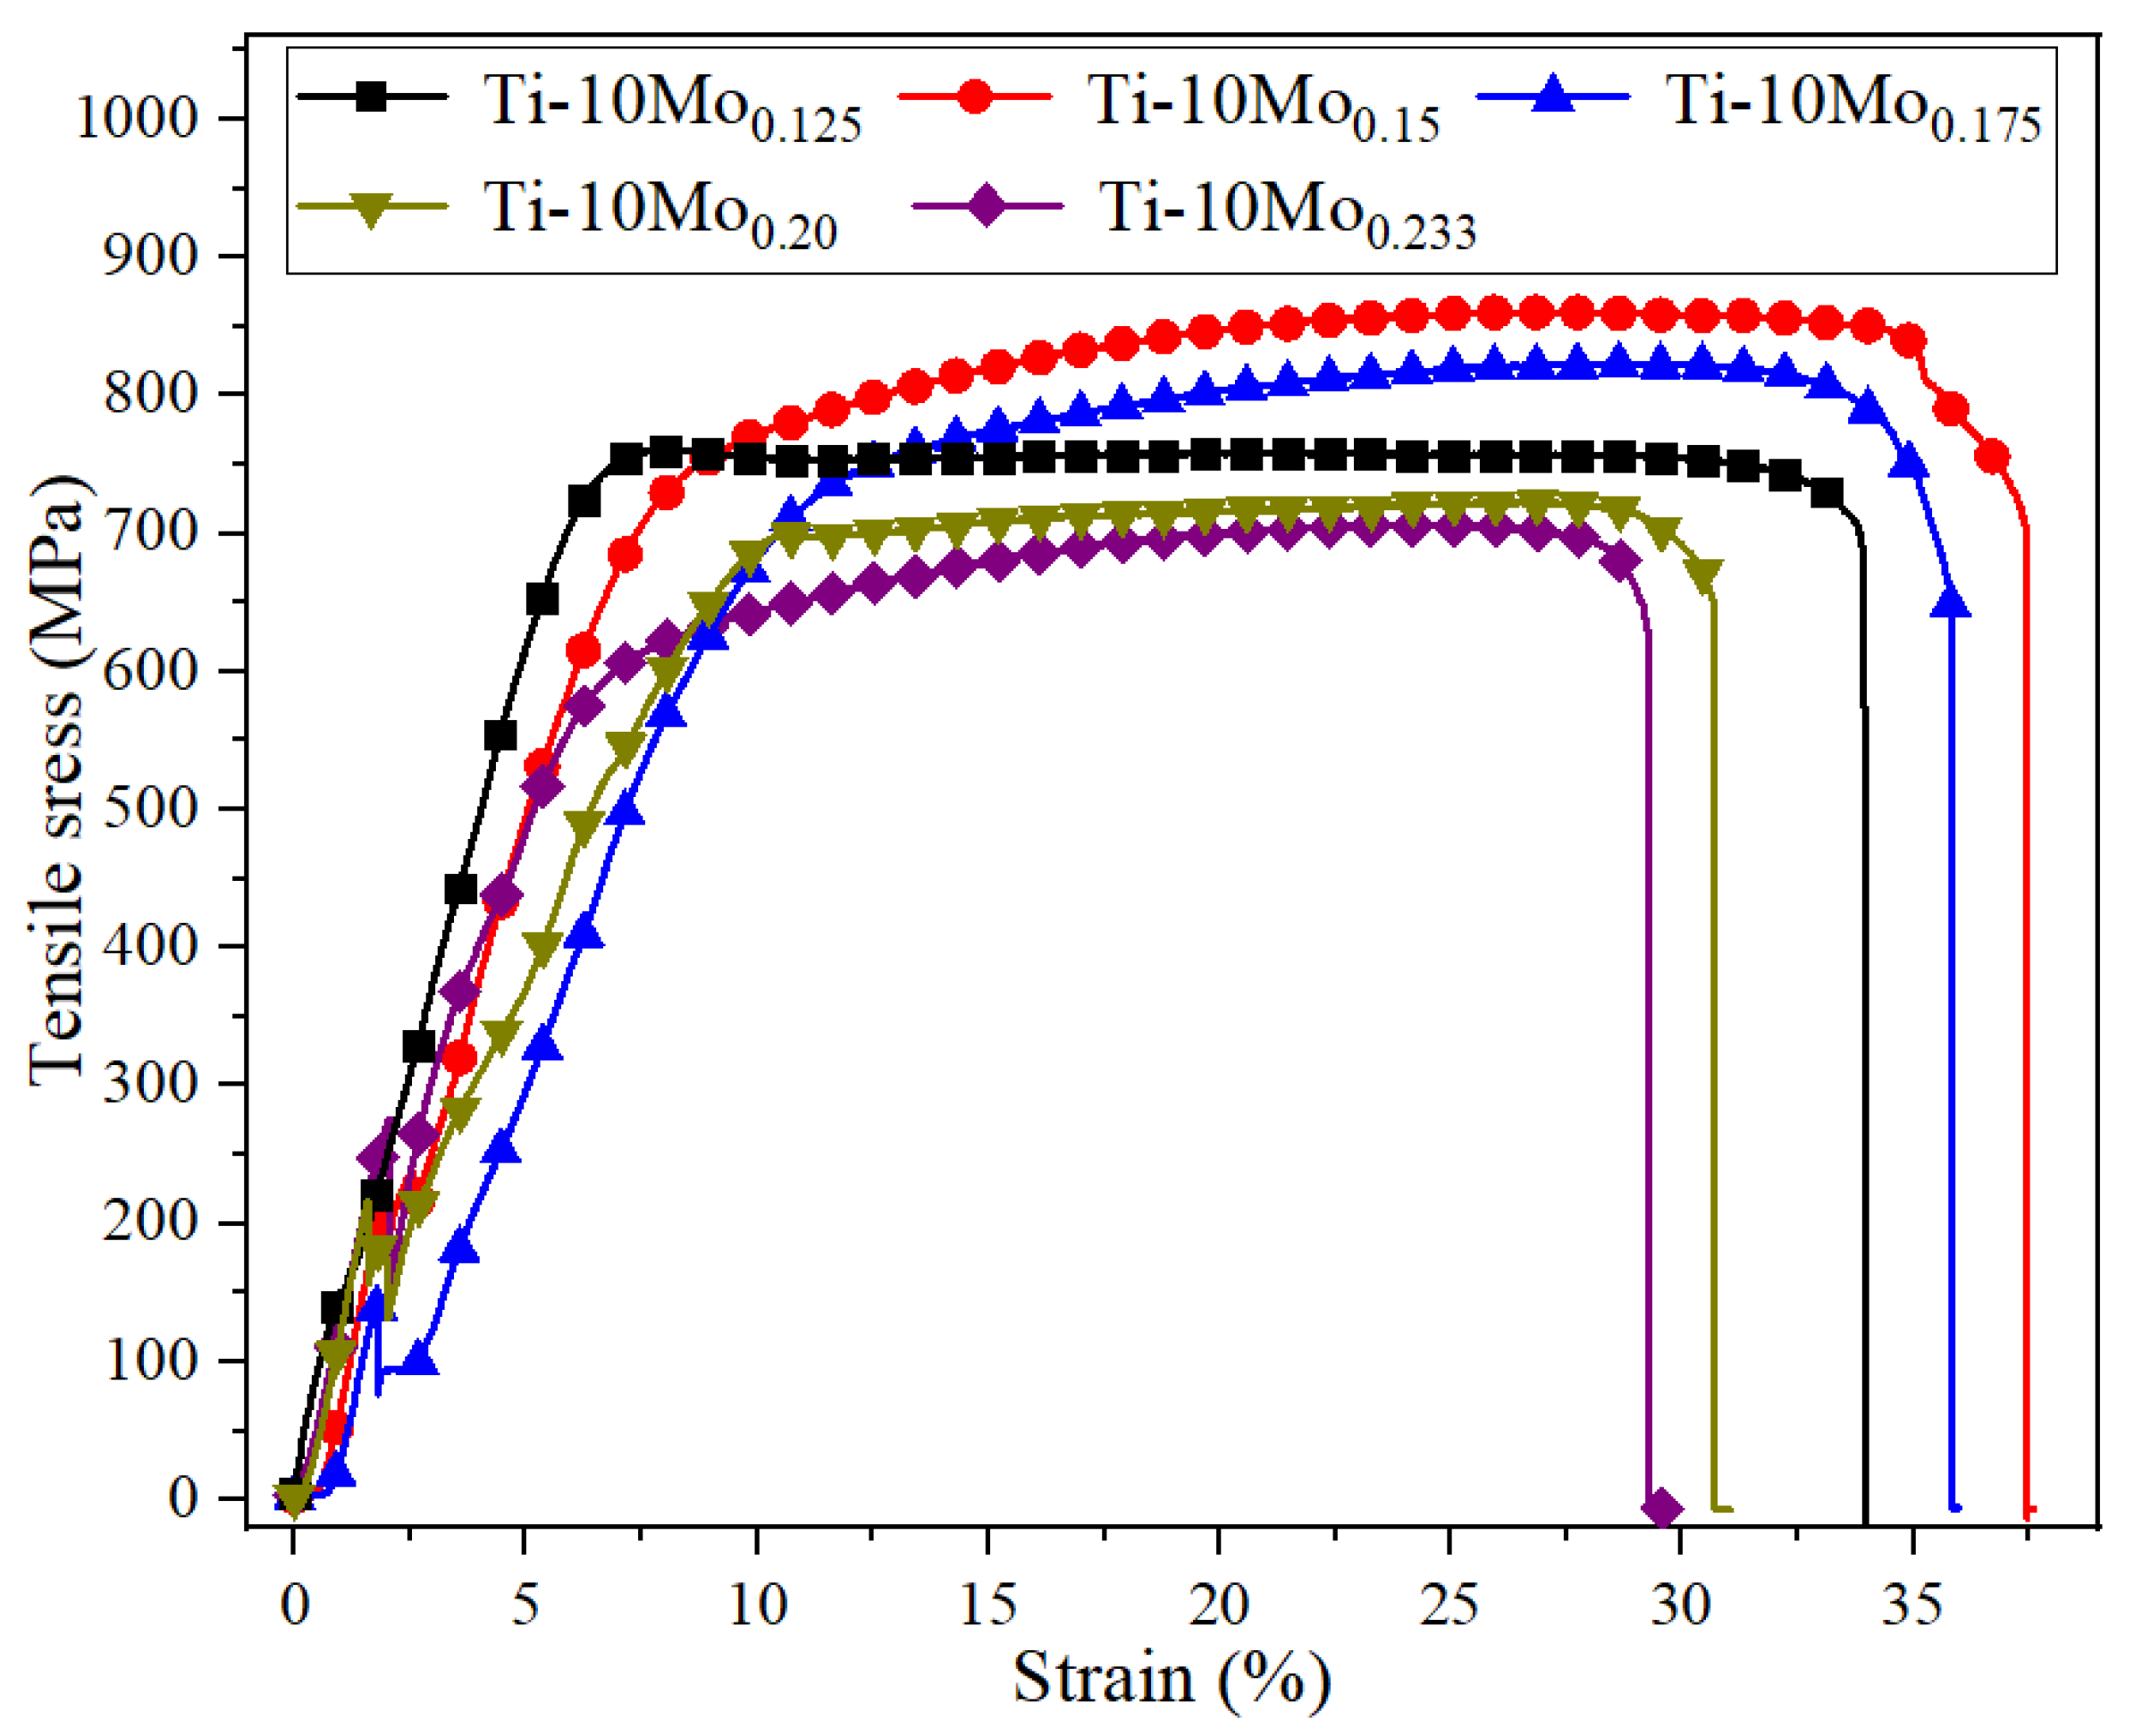
Figure 13 shows the stress–strain curves of SLM-processed Ti-10Mo alloys at various laser energy densities, with the detailed results summarized in Table 6. When the linear energy density is 0.150 J/mm, the ultimate tensile strength (UTS) and yield strength (YS) reach the peak values of 860 MPa and 752 MPa, respectively, with an elongation of 32.9%. With the decrease or increase in the linear energy density from this value, both the UTS and YS decrease, implying that there exists an optimal value of linear laser energy density that can improve the tensile properties of SLM-processed Ti-10Mo alloys. As the linear laser energy density increases to 0.233 J/mm, the SLM-processed Ti-10Mo alloys present the lowest UTS of 706 MPa and the elongation decreases to 25.6%, which are 17.9% and 22.2% lower than those of Ti-10Mo0.150. The UTS order of SLM-processed Ti-10Mo alloys at room temperature is Ti-10Mo0.150 > Ti-10Mo0.175 > Ti-10Mo0.125 > Ti-10Mo0.20 > Ti-10Mo0.233. Specifically, except for the Ti-10Mo0.125 sample, the variation trend of UTS is negatively correlated with the linear laser energy density, while microhardness shows a positive correlation with linear energy density. In other words, the higher the hardness value, the lower the UTS value. The highly concentrated energy input of the SLM process and the characteristics of layer-by-layer scanning create an excessive thermal gradient, resulting in high residual stress that significantly limits tensile performance. Furthermore, the dissolution of molybdenum is also a crucial factor that cannot be ignored. As the linear laser energy density increases, the melted molybdenum element significantly influences the microstructure size and phase transition, a finding that is further verified in the XRD pattern results.
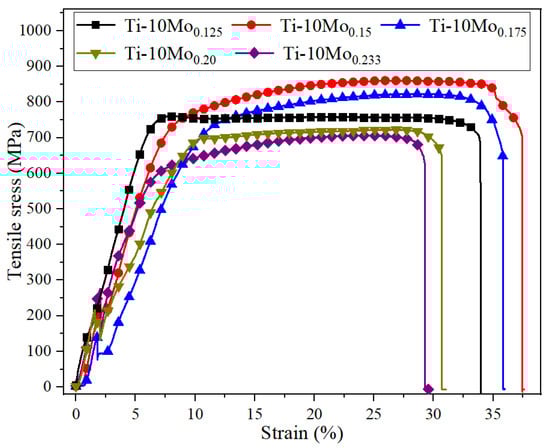
Figure 13.
Stress–strain curves of SLM-processed Ti-10Mo alloys in this work.
Table 6.
Tensile properties of SLM-processed Ti-10Mo specimens in this work.
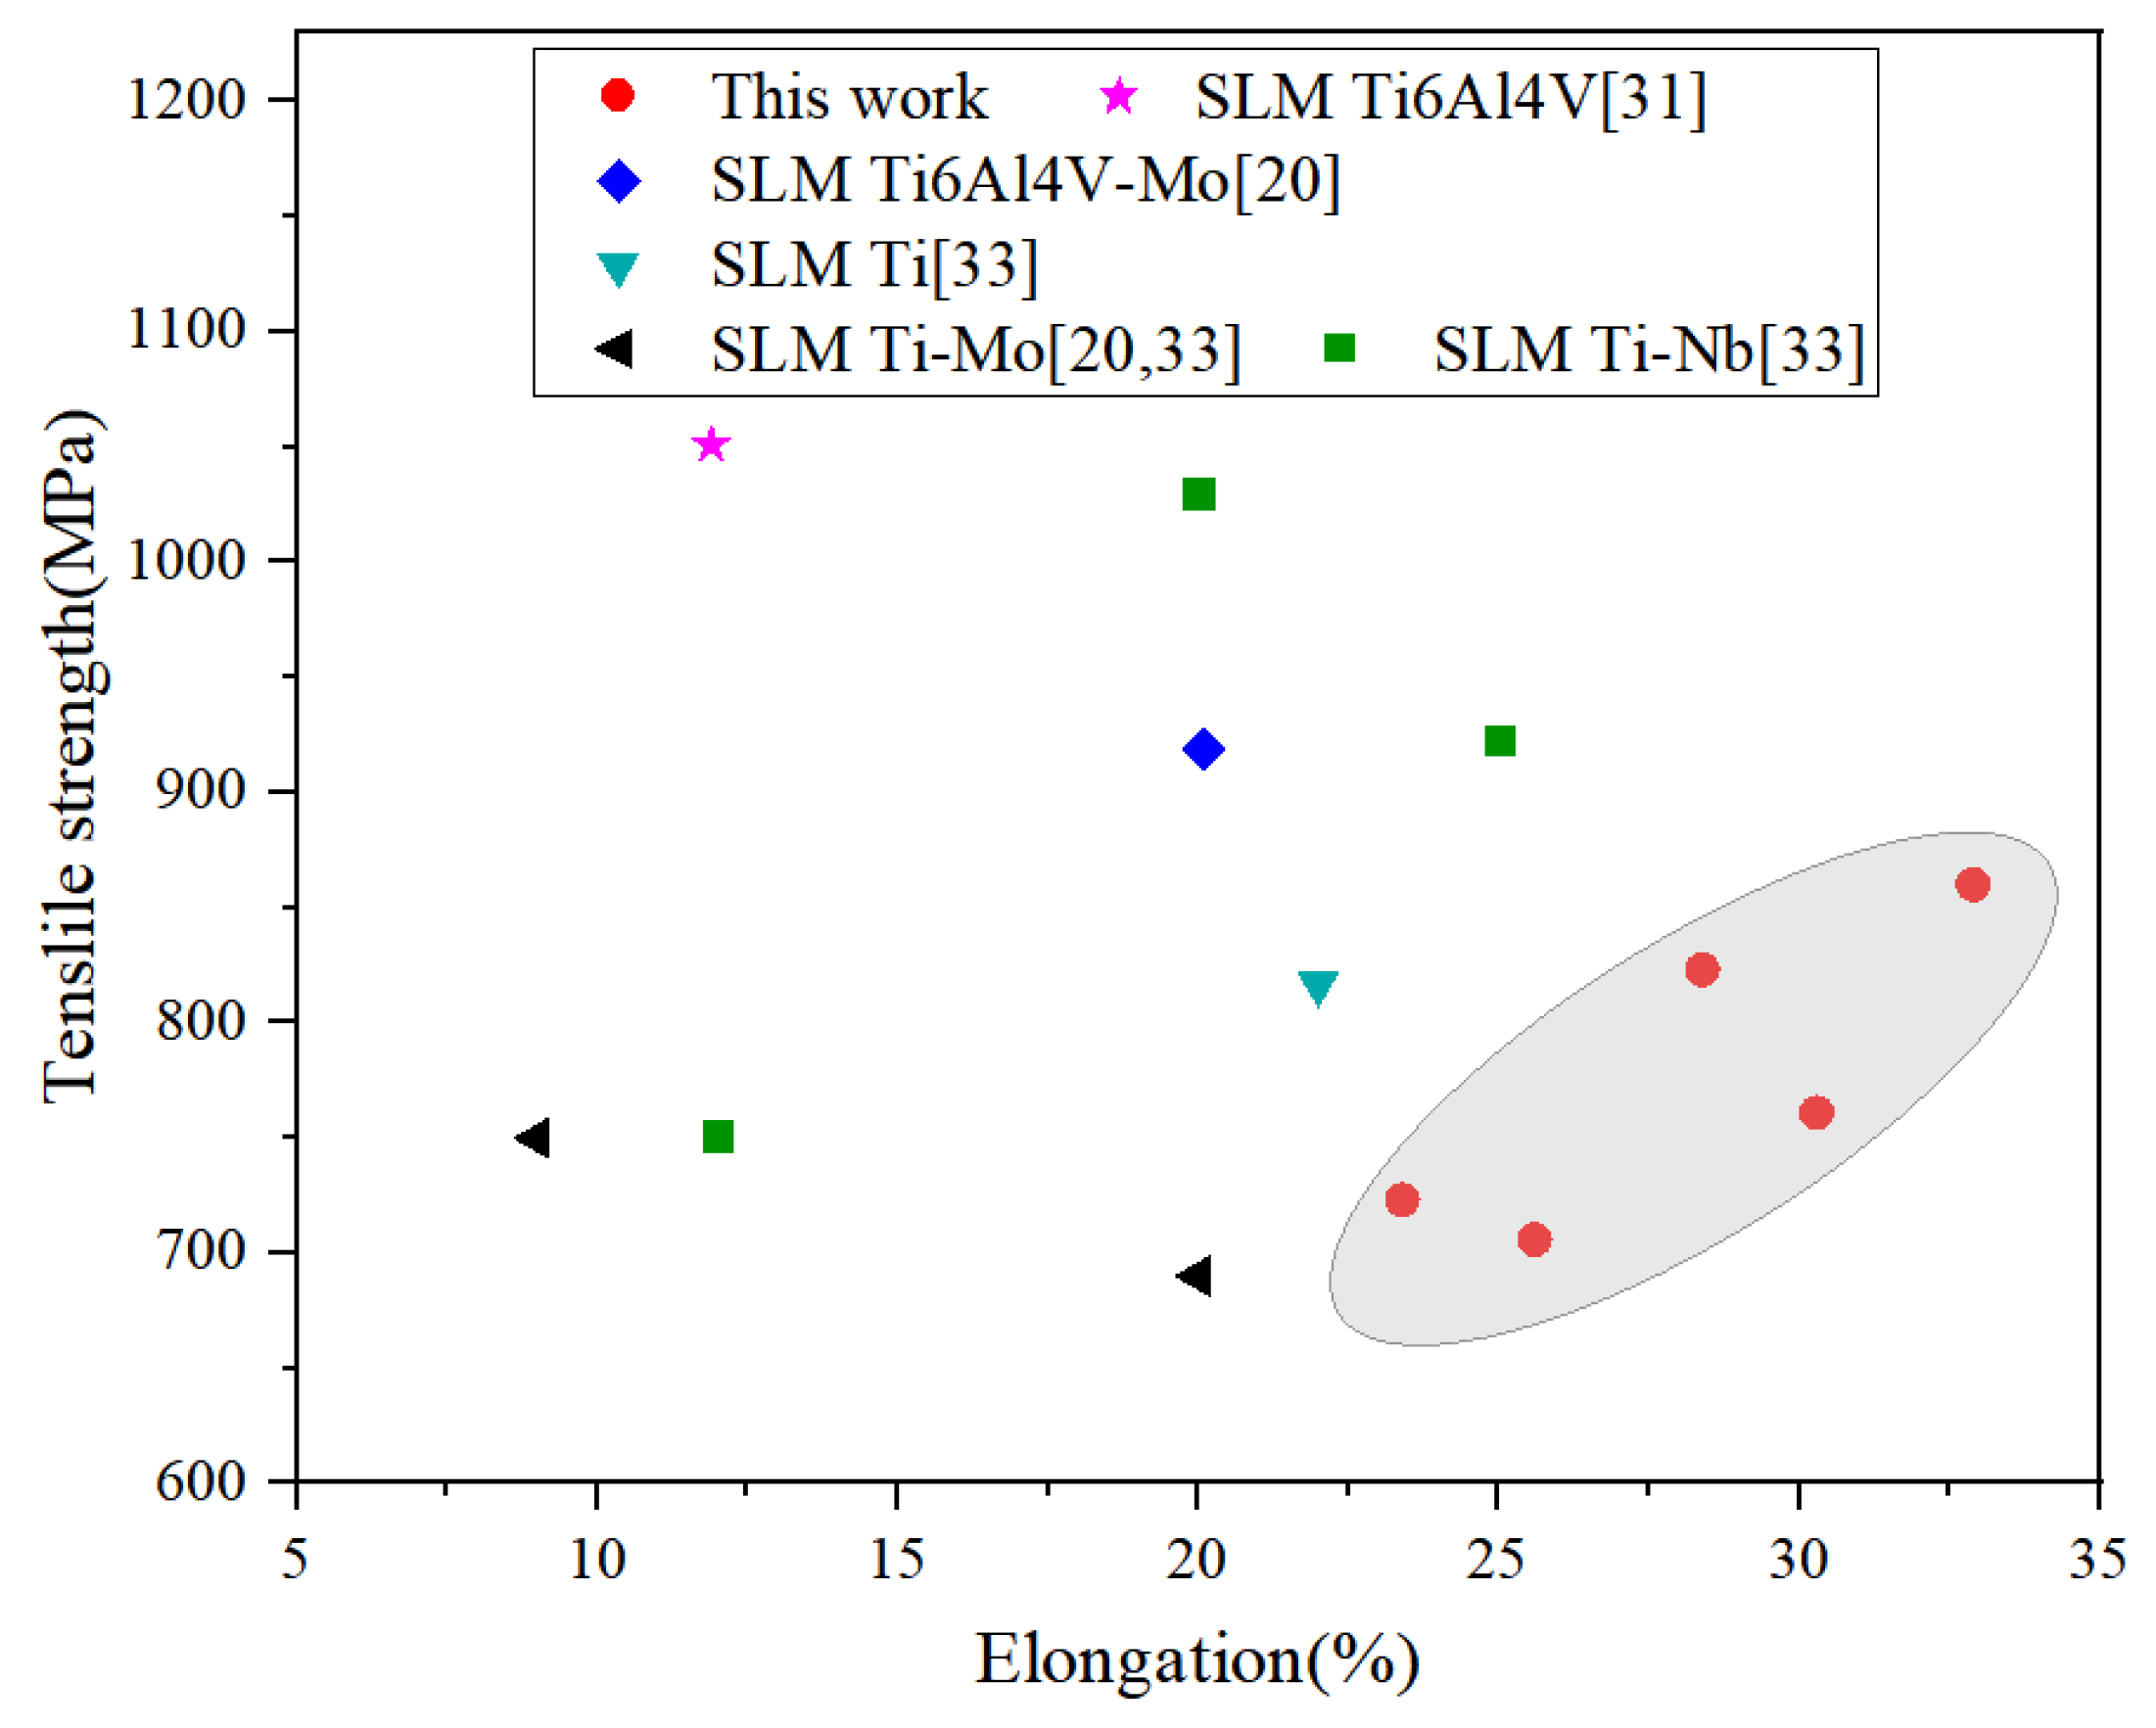
Figure 14 compares the UTS and elongation of SLM-processed Ti-10Mo alloys from this study with those of binary titanium alloys reported by others. The as-built Ti-10Mo alloys in this work show nearly no difference in the UTS values compared to those of SLM-processed Ti-Mo alloys in other research. Nevertheless, the elongation values surpass those of most previously reported SLM-fabricated titanium alloys, indicating that the as-built Ti-10Mo alloys in this work exhibit significantly greater ductility.
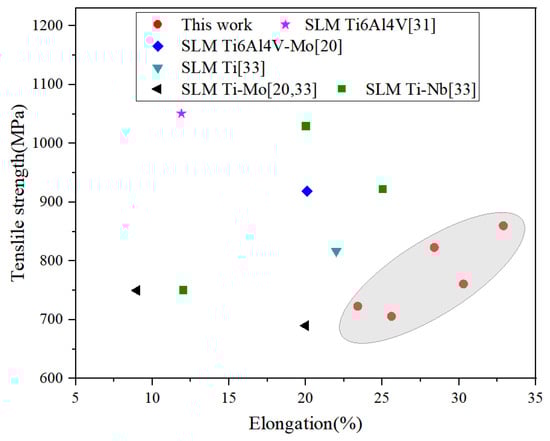
Figure 14.
Ultimate tensile strength of SLM-processed Ti-10Mo alloys in this work (marked with grey area) compared to typical SLM-processed titanium alloys.
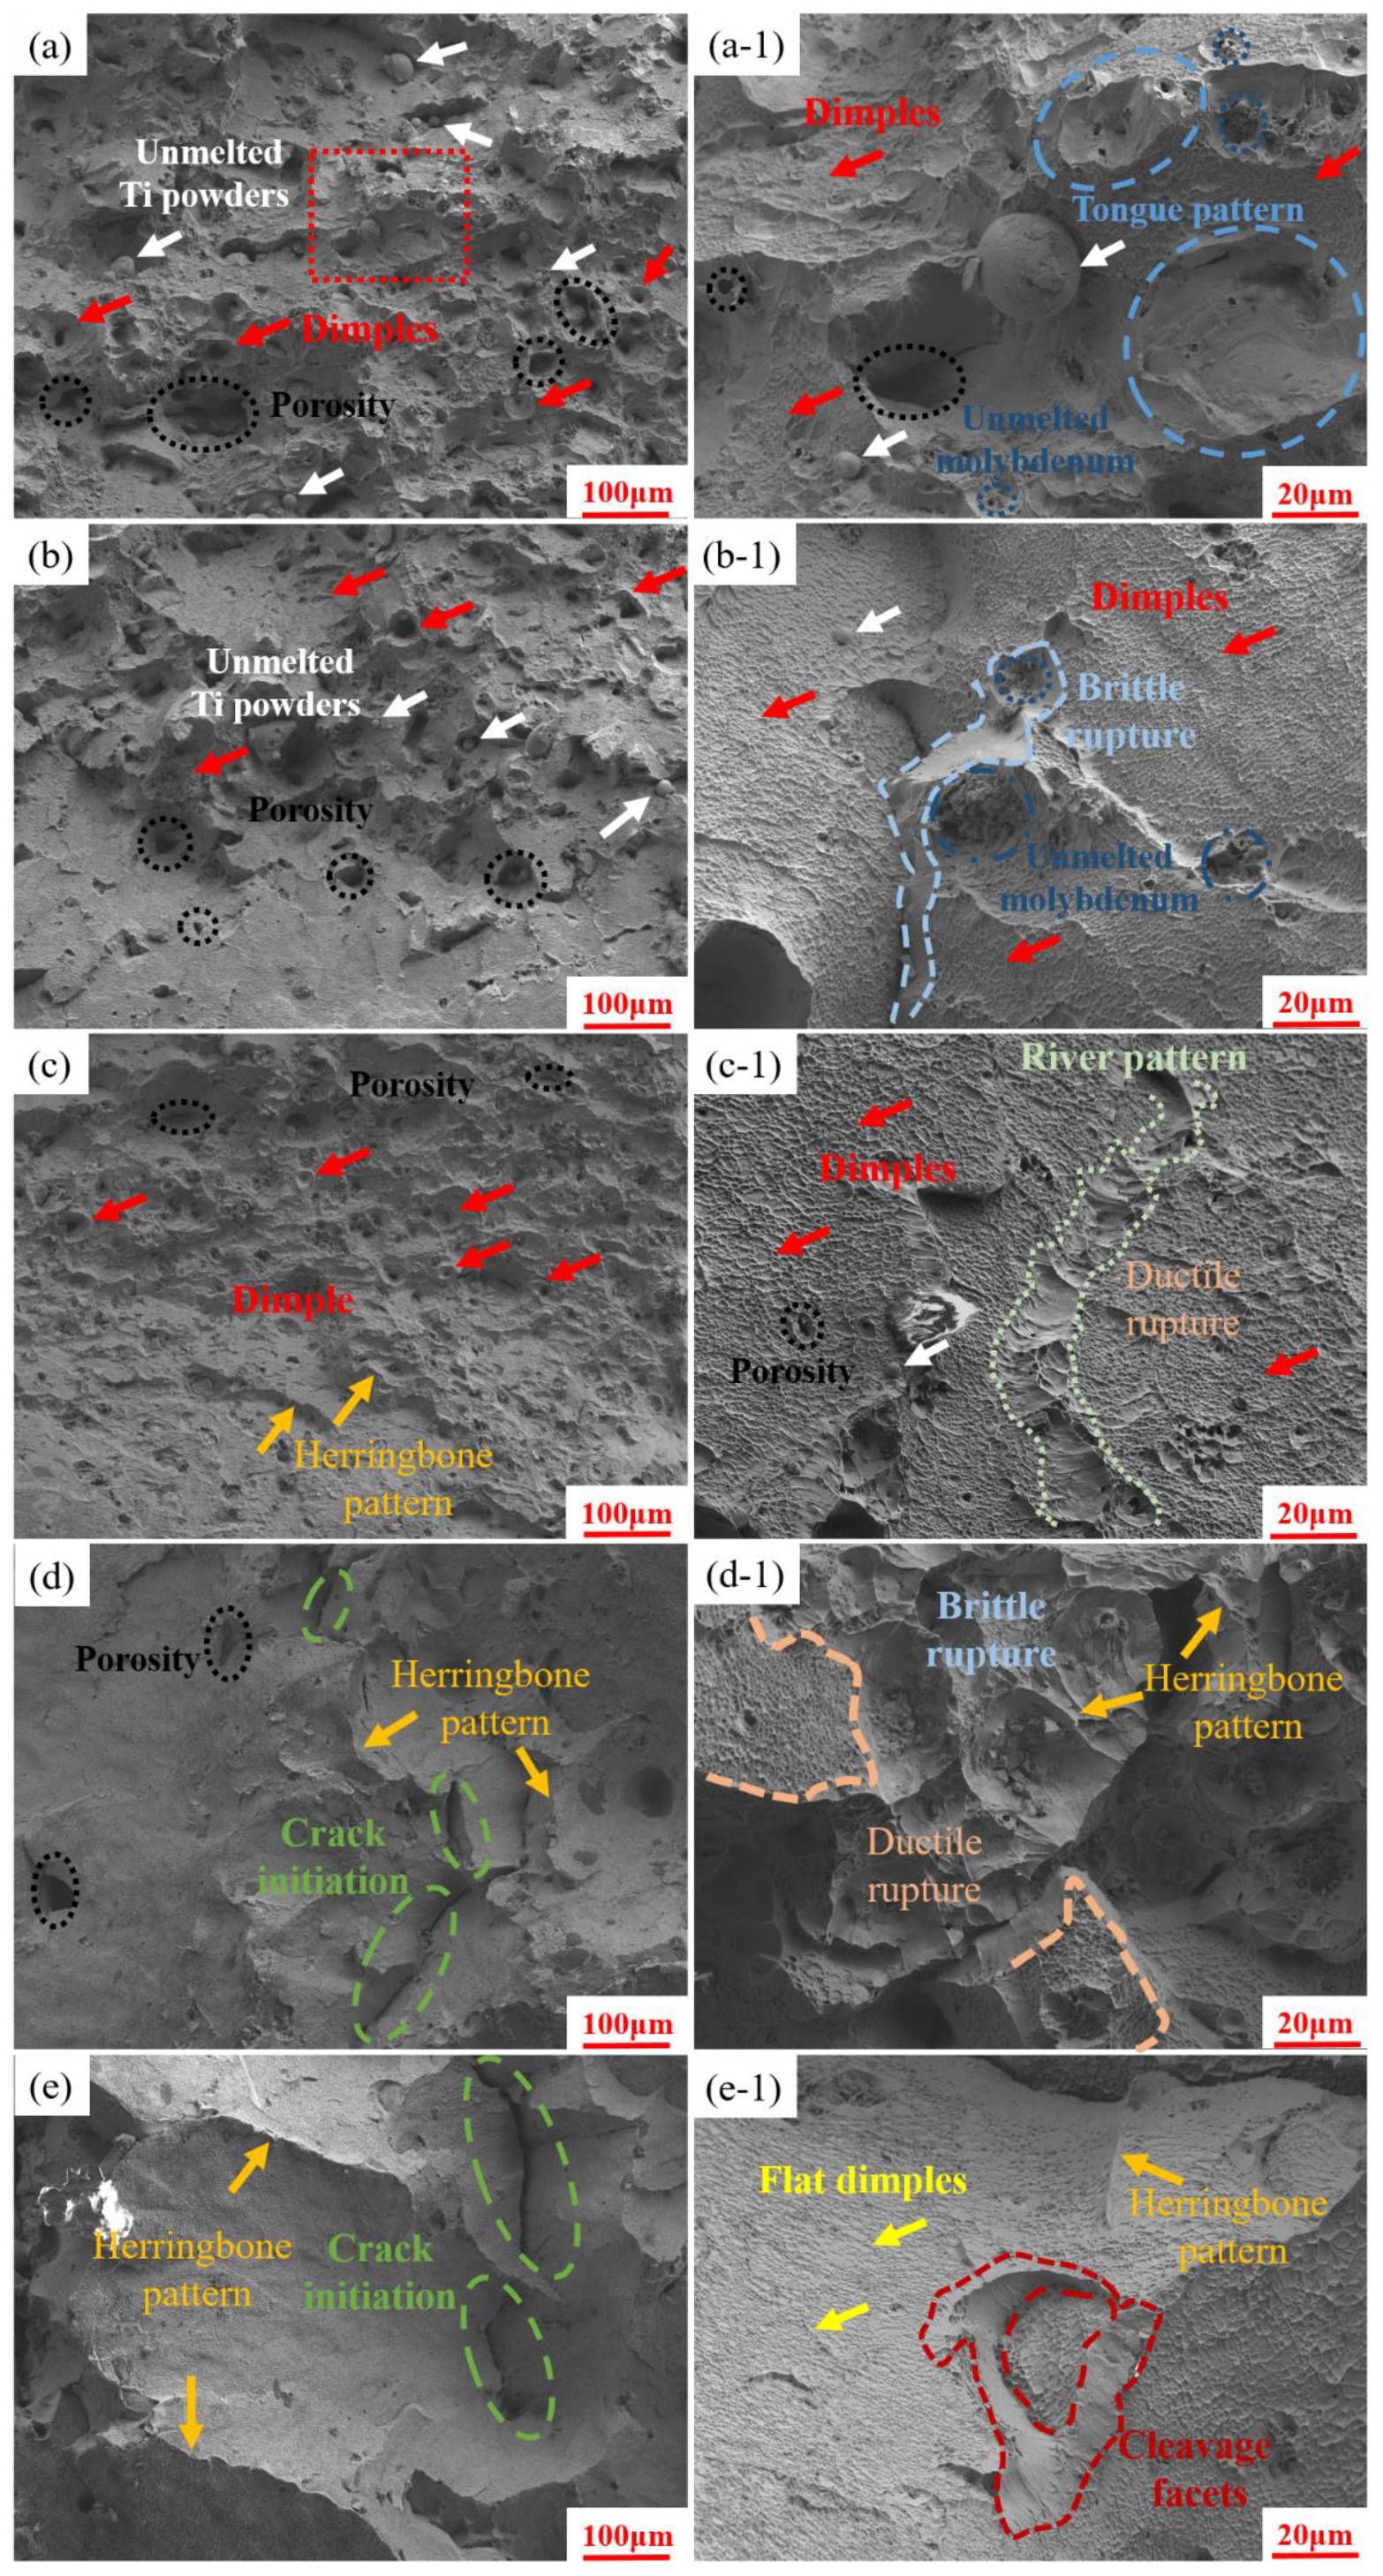
Representative tensile fracture surfaces of various samples obtained at different linear energy densities are shown in Figure 15. For the sample obtained at a linear energy density of 0.125 J/mm, some unmelted Ti and Mo particles appear on the fracture surface, as seen in Figure 15a. Notably, tongue patterns can be observed around the unmelted powder particles, and numerous micro-pores with irregular shapes are also clearly visible (Figure 15(a-1)). It can be deduced that the presence of pores and unmelted particles likely contributes to the premature fracture of Ti-10Mo0.125 tensile samples, indicating that the applied laser energy density is inadequate for fully melting the powder particles. Consequently, the bonding strength is weakened between layers. This primarily accounts for the lower tensile strength observed in the Ti-10Mo0.125 sample compared to the Ti-10Mo0.150 and Ti-10Mo0.175 samples. Furthermore, the existence of micro-pores is closely related to the surface compactness mentioned above. As illustrated in Figure 15b,c, it can be found that the number of unmelted powder particles and the size of micro-pores significantly decreased at higher linear energy density (0.150 and 0.175 J/mm).
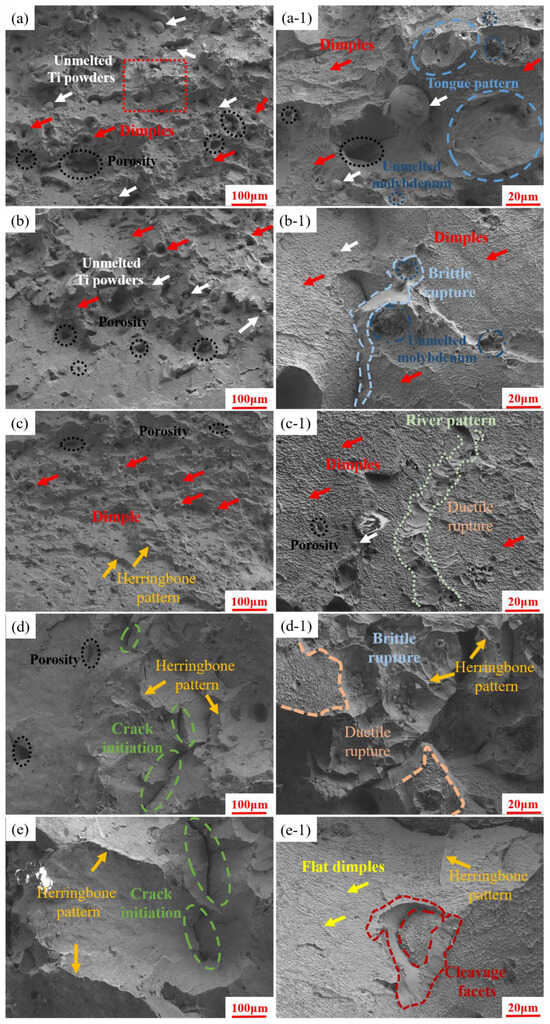
Figure 15.
Tensile fracture morphologies of different samples: (a,a-1) Ti-10Mo0.125, (b,b-1) Ti-10Mo0.150, (c,c-1) Ti-10Mo0.175, (d,d-1) Ti-10Mo0.20, and (e,e-1) Ti-10Mo0.233.
The fracture mainly exhibits a typical ductile character with numerous deep and spiral dimples. The local magnification of fracture morphology in Figure 15(b-1,c-1) presents substantial fine and uniform small dimples. Therefore, SLM-processed Ti-10Mo0.150 and Ti-10Mo0.175 samples perform superior tensile properties. When the linear energy density is up to 0.200 J/mm, initiated cracks are generated on the fracture surface, and the fracture surface displays rugged herringbone shapes (Figure 15d,e). Moreover, some cleavage facets and randomly distributed shallow dimples can be observed on the fracture surface (Figure 15(d-1,e-1). This indicates that the fracture mechanism of the as-fabricated Ti-10Mo0.20 and Ti-10Mo0.233 samples is a predominant brittle fracture that is accompanied by a ductile fracture. Generally, the ductility of samples is proportional to the size and depth of dimples [34], so it is reasonable to expect that the ductility of the Ti-10Mo0.20 and Ti-10Mo0.233 samples is lower than the other samples, which is in agreement with the elongation results.
4. Conclusions
In this study, the effects of linear energy densities on the surface morphologies, microstructures, and mechanical properties of SLM-processed Ti-Mo alloys were investigated. The main conclusions drawn from the findings are as follows:
- (1)
- The residual stress in SLM-processed components is influenced by the cooling rate and temperature evolution. The maximum values of Von Mises stress increased with the higher linear energy density, and both the simulation and experimental results showed a good agreement, with an error range of 17–23%.
- (2)
- The applied linear energy density significantly influenced the densification and roughness of SLM-processed Ti-10Mo parts. As the linear energy density increased from 0.120 J/mm to 0.233 J/mm, the surface roughness decreased from 18.2 μm to 4.4 μm and relative compactness increased from 94.9% to 99.8%.
- (3)
- The SLM-processed Ti-10Mo samples present a special conchoidal two-phase structure, including hexagonal close-packed (hcp) α-Ti and body-centered cubic (bcc) β-Ti. With the linear energy density increases, the β-stabilizer Mo particle was nearly completely melted, leading to an increment in the densification.
- (4)
- The Ti-10Mo alloys prepared at a linear energy density of 0.15 J/mm exhibited the highest UTS and YS of 860 MPa and 752 MPa with a ductile fracture. However, when a higher linear energy density was applied, the fracture mechanism was a predominantly brittle fracture that was accompanied by a ductile fracture.
Author Contributions
Conceptualization, data curation, writing—original draft preparation, methodology and writing—review and editing, X.D.; formal analysis and investigation, Y.S.; supervision, J.H. All authors have read and agreed to the published version of the manuscript.
Funding
This research was financially supported by the Natural Science Foundation of Jiangsu Province for Young Scholars (No. BK20240316) and the Natural Science Foundation of the Higher Education Institutions of Jiangsu Province (Grant No. 23KJB460030).
Data Availability Statement
The data presented in this study are available on request from the corresponding author.
Conflicts of Interest
The authors declare that they have no known competing financial interests or personal relationships that could have appeared to influence the work reported in this paper.
Abbreviations
The following abbreviations are used in this manuscript:
| SLM | Linear dichroism selective laser melting |
| FEM | Finite element model |
| SEM | Scanning electron microscopy |
| HDM | Hole-drilling method |
| UTS | Ultimate tensile strength |
| YS | Yield strength |
| hcp | Hexagonal tight-packed |
| bcc | Body-centered cubic |
References
- Nguyen, D.S.; Park, H.S.; Lee, C.M. Optimization of selective laser melting process parameters for Ti-6Al-4V alloy manufacturing using deep learning. J. Manuf. Process. 2020, 55, 230–235. [Google Scholar] [CrossRef]
- Carter, F.M.; Porter, C.; Kozjek, D.; Shimoyoshi, K.; Fujishima, M.; Irino, N.; Cao, J. Machine learning guided adaptive laser power control in selective laser melting for pore reduction. CIRP Ann. Manuf. Technol. 2024, 73, 149–152. [Google Scholar] [CrossRef]
- Liu, S.J.; Lee, M.; Choi, C.; Shin, K. Effect of additive manufacturing of SUS316L using selective laser melting. J. Mater. Res. Technol. 2023, 24, 9824–9833. [Google Scholar] [CrossRef]
- Lu, S.L.; Zhang, Z.J.; Liu, R.; Qu, Z.; Li, S.J.; Zhou, X.H.; Duan, Q.Q.; Zhang, B.N.; Zhao, X.M.; Zhao, W.; et al. Tailoring hierarchical microstructures to improve the strength and plasticity of a laser powder bed fusion additively manufactured Ti-6Al-4V alloy. Addit. Manuf. 2023, 71, 103603. [Google Scholar] [CrossRef]
- Qian, J.; Zhang, L.; Tang, S.L. Preparation of Spherical Porous and Spherical Ti6Al4V Powder by Copper-Assisted Spheroidization Method. JOM 2023, 76, 1276–1283. [Google Scholar] [CrossRef]
- Zhang, X.; Liu, G.; Yi, J.; Liu, H.X. TiN/Ti-Al-Nb composite coatings prepared by in-situ synthesis assisted laser cladding process on Ti6Al4V titanium alloy surface. Surf. Technol. 2020, 49, 61–68. [Google Scholar]
- Zhou, Y.H.; Li, W.P.; Zhang, L.; Zhou, S.; Jia, X.; Wang, D.; Yan, M. Selective laser melting of Ti-22Al-25Nb intermetallic: Significant effects of hatch distance on microstructural features and mechanical properties. J. Mater. Process. Technol. 2020, 276, 116398. [Google Scholar] [CrossRef]
- Asri, R.I.M.; Harun, W.S.W.; Samykano, M.; Lah, N.A.C.; Ghani, S.A.C.; Tarlochan, F.; Raza, M.R. Corrosion and surface modification on biocompatible metals: A review. Mater. Sci. Eng. C Mater. Biol. Appl. 2017, 77, 1261–1274. [Google Scholar] [CrossRef]
- Hanada, S.; Masahashi, N.; Semboshi, S.; Jung, T.K. Low Young’s modulus of cold groove-rolled β Ti–Nb–Sn alloys for orthopedic applications. Mater. Sci. Eng. A-Struct. Mater. Prop. Microstruct. Process. 2021, 802, 140645. [Google Scholar] [CrossRef]
- Li, S.L.; Lee, W.T.; Yeom, J.T.; Kim, J.G.; Oh, J.S.; Lee, T.; Liu, Y.; Nam, T.H. Towards bone-like elastic modulus in Tisingle bondNbsingle bondSn alloys with large recovery strain for biomedical applications. J. Alloys Compd. 2022, 925, 166724. [Google Scholar] [CrossRef]
- Shahzamanian, M.M.; Banerjee, R.; Dahotre, N.B.; Srinivasa, A.R.; Reddy, J. Analysis of stress shielding reduction in bone fracture fixation implant using functionally graded materials. Compos. Struct. 2023, 321, 117262. [Google Scholar] [CrossRef]
- Zhang, C.Y.; Zeng, C.Y.; Wang, Z.F.; Zeng, T.; Wang, Y. Optimization of stress distribution of bone-implant interface (BII). Biomater. Adv. 2023, 147, 213342. [Google Scholar] [CrossRef] [PubMed]
- Eldabah, N.M.; Shoukry, A.; Khair-Eldeen, W.; Kobayashi, S.; Gepreel, M.A.H. Design and characterization of low Young’s modulus Ti-Zr-Nb-based medium entropy alloys assisted by extreme learning machine for biomedical applications. J. Alloys Compd. 2023, 968, 171755. [Google Scholar] [CrossRef]
- Namini, A.S.; Dilawary, S.A.A.; Motallebzadeh, A.; Asl, M.S. Effect of TiB2 addition on the elevated temperature tribological behavior of spark plasma sintered Ti matrix composite. Comp. Part B Eng. 2019, 172, 271–280. [Google Scholar] [CrossRef]
- Jia, Y.J.; Han, W.Z. Beta phase controls hydride precipitation within alpha phase in dual-phase Zr-2.5Nb. Scripta. Mater. 2025, 256, 116419. [Google Scholar] [CrossRef]
- Lourenço, L.M.; Correa, R.M.; Almeida, D.S.G.; Kuroda, P.A.B.; Zambuzzi, W.F.; Grandini, C.R. Development of new β Ti-10-Mo-Mn alloys for biomedical applications. J. Alloys Compd. 2024, 1008, 176524. [Google Scholar] [CrossRef]
- Fischer, M.; Joguet, D.; Robin, G.; Peltier, L.; Laheurte, P. In situ elaboration of a binary Ti-6Nb alloy by selective laser melting of elemental titanium and niobium mixed powders. Mater. Sci. Eng. C. 2016, 62, 852–859. [Google Scholar] [CrossRef]
- Sing, S.L.; Wiria, F.E.; Yeong, W.Y. Selective laser melting of titanium alloy with 50 wt% tantalum: Effect of laser process parameters on part quality. Int. J. Refract. Met. Hard Mater. 2018, 77, 120–127. [Google Scholar] [CrossRef]
- Li, W.; Song, Y.; Qian, X.; Zhou, L.; Zhu, H.; Shen, L.; Dai, Y.; Dong, F.; Li, Y. Radiomics analysis combining gray-scale ultrasound and mammography for differentiating breast adenosis from invasive ductal carcinoma. Front. Oncol. 2024, 14, 1390342. [Google Scholar] [CrossRef]
- Vrancken, B.; Thijs, L.; Kruth, J.P.; Van Humbeeck, J. Microstructure and mechanical properties of a novel β titanium metallic composite by selective laser melting. Acta Mater. 2014, 68, 150–158. [Google Scholar] [CrossRef]
- Kahlert, M.; Wegener, T.; Laabs, L.; Vollmer, M.; Niendorf, T. Influence of Defects and Microstructure on the Thermal Expansion Behavior and the Mechanical Properties of Additively Manufactured Fe-36Ni. Materials 2024, 17, 4313. [Google Scholar] [CrossRef] [PubMed]
- Yang, Y.B.; Lin, H.; Li, Q. A computationally efficient thermo-mechanical model with temporal acceleration for prediction of residual stresses deformations in, W.A.A.M. Virtual Phys. Prototyp. 2024, 19, e2349683. [Google Scholar] [CrossRef]
- Luo, Z.B.; Zhao, Y.Y. Numerical simulation of part-level temperature fields during selective laser melting of stainless steel 316L. Int. J. Adv. Manuf. Technol. 2019, 104, 1615–1635. [Google Scholar] [CrossRef]
- Waqar, S.; Guo, K.; Sun, J. FEM analysis of thermal and residual stress profile in selective laser melting of 316L stainless steel. J. Mater. Process. 2021, 66, 81–100. [Google Scholar] [CrossRef]
- Markovic, P.; Scheel, P.; Wróbel, R.; Leinenbach, C.; Mazza, E.; Hosseini, E. Cyclic mechanical response of LPBFHastelloy X over a wide temperature strain range: Experiments modelling. Int. J. Solids Struct. 2024, 305, 113047. [Google Scholar] [CrossRef]
- Xiao, Z.X.; Chen, C.P.; Zhu, H.H.; Hu, Z.H.; Nagarajan, B.; Guo, L.B.; Zeng, X.Y. Study of residual stress in selective laser melting of, T.i.6.A.l.4.V. Mater Design. 2020, 193. [Google Scholar] [CrossRef]
- Zhang, J.; Liu, C.; Hu, Q.D.; Liu, Q.; Li, H. Residual Stress Characterization in Additively Manufactured Titanium Alloy Rod-Type Specimens Prepared by Laser Powder Bed Fusion. JOM 2024. [Google Scholar] [CrossRef]
- Chen, C.; Yin, J.; Zhu, H.; Xiao, Z.; Zhang, L.; Zeng, X. Effect of overlap rate and pattern on residual stress in selective laser melting. Int. J. Mach. Tools Manuf. 2019, 145. [Google Scholar] [CrossRef]
- Weldeanenia, G.K.; Kassegne, K.S.; Perumalla, R.J. Minimization of melt-pool field variables fluctuation during selective laser melting of Ti6Al4V alloy through computational investigation. Model. Simul. Mater. Sci. Eng. 2025, 33, 015002. [Google Scholar] [CrossRef]
- Yi, H.; Jiao, F.R.; Cao, H.J.; Zhang, J.; Zou, Y. Numerical simulations of molten pool dynamics in wire-arc directed energy deposition processes: A review. J. Manuf. Process. 2025, 134, 970–997. [Google Scholar] [CrossRef]
- Xie, F.X.; He, X.B.; Cao, S.L.; Lu, X.; Qu, X. Structural characterization and electrochemical behavior of a laser-sintered porous Ti–10Mo alloy. Corros Sci. 2013, 67, 217–224. [Google Scholar] [CrossRef]
- Kang, N.; Li, Y.; Lin, X.; Feng, E.; Huang, W. Microstructure and tensile properties of Ti-Mo alloys manufactured via using laser powder bed fusion. J. Alloys Compd. 2019, 771, 877–884. [Google Scholar] [CrossRef]
- Luo, H.Y.; Sun, X.; Xu, L.; He, W.; Liang, X. A review on stress determination and control in metal-based additive manufacturing. Theor. Appl. Mech. Lett. 2023, 13, 100396. [Google Scholar] [CrossRef]
- Arya, P.K.; Jain, N.K.; Sathiaraj, D. Microstructure mechanical properties of additively manufactured Ti6Al4VxCryNi alloy. CIRP J. Manuf. Sci. Technol. 2024, 53, 67–80. [Google Scholar] [CrossRef]


Disclaimer/Publisher’s Note: The statements, opinions and data contained in all publications are solely those of the individual author(s) and contributor(s) and not of MDPI and/or the editor(s). MDPI and/or the editor(s) disclaim responsibility for any injury to people or property resulting from any ideas, methods, instructions or products referred to in the content. |
© 2025 by the authors. Licensee MDPI, Basel, Switzerland. This article is an open access article distributed under the terms and conditions of the Creative Commons Attribution (CC BY) license (https://creativecommons.org/licenses/by/4.0/).