Abstract
1Cr18Ni9Ti and Monel composite metal coatings with five different spraying distances were prepared by arc spraying technology. The density, hardness, friction, and wear properties and acid corrosion rate of the coatings with different spraying distances were studied by X-ray diffraction, scanning electron microscopy, Rockwell hardness test, and friction and wear test. Research shows that the spraying distance has a significant effect on the density, hardness, porosity, friction, and wear properties and corrosion rate of the coating. When the spraying distance is 250 mm, the coating has the maximum density and hardness, the minimum porosity and corrosion rate, and the minimum friction coefficient and wear volume. Cu3.8ni and cr0.19fe0.7ni0.11 compounds in the coating have significant effects on the friction, wear, and hardness of the coating. The results show that too-high or too-low spraying distance will lead to pores and large particle agglomeration in the coating, which will affect the surface physical properties of the coating.
1. Introduction
The surface of steel structures is prone to corrosion during contact with acidic, alkaline, and other liquid environments, leading to a decrease in material properties and significant economic losses. Arc spraying technology has been widely recognized in fields such as aerospace and petrochemicals [1,2,3] due to its advantages in corrosion resistance, long service life, and low cost, and it has been applied to large-scale steel structure protection projects.
1Cr18Ni9Ti is an austenitic stainless steel with superior corrosion resistance, good mechanical properties, and welding performance, especially in high-temperature and corrosive environments [4,5]. However, under specific erosion and wear conditions, the surface quality of 1Cr18Ni9Ti deteriorates, which can significantly reduce its service life [6]. It is particularly prone to galvanic corrosion in salt fog environments [7]. Monel alloy, a nickel-based alloy containing copper, iron, and manganese, features a unique single-phase austenitic structure that offers excellent resistance to high temperatures and highly saline seawater environments [8,9,10]. Monel exhibits superior corrosion resistance in alkaline solutions and dilute hydrochloric, sulfuric, and phosphoric acids [11]. However, its high nickel content makes it relatively expensive [12]. The alloy’s exceptional corrosion resistance stems from its strong passivation ability, which can be compromised by improper heat treatment. Therefore, precise control of heat treatment parameters is essential to optimize performance [13]. Previous studies have shown that elements such as Cu, Cr, and Fe play critical roles in influencing the microstructure, phase evolution, surface hardness, friction, and wear properties of nickel-based alloy coatings [14,15,16,17,18,19,20,21,22]. Most current research focuses on improving individual materials’ properties and processing techniques, such as 1Cr18Ni9Ti and Monel alloy. Common approaches include heat treatment and surface coating to enhance corrosion and wear resistance. However, there is little research on developing composite coatings for these two materials using arc spraying technology.
In this study, the excellent physical properties of 1Cr18Ni9Ti are combined with the corrosion resistance of Monel alloy. Arc spraying technology prepares a composite metal coating on a 45# steel substrate. The performance of the composite coating is evaluated in detail through density and hardness measurements, scanning electron microscopy (SEM), friction wear testing, and acidic corrosion testing. This research aims to determine the optimal spraying distance for heterogeneous dual-wire composite spraying of 1Cr18Ni9Ti and Monel. The findings have significant potential to enhance steel structures’ service life and reliability in complex environments.
2. Experimental Materials and Methods
2.1. Coating Preparation
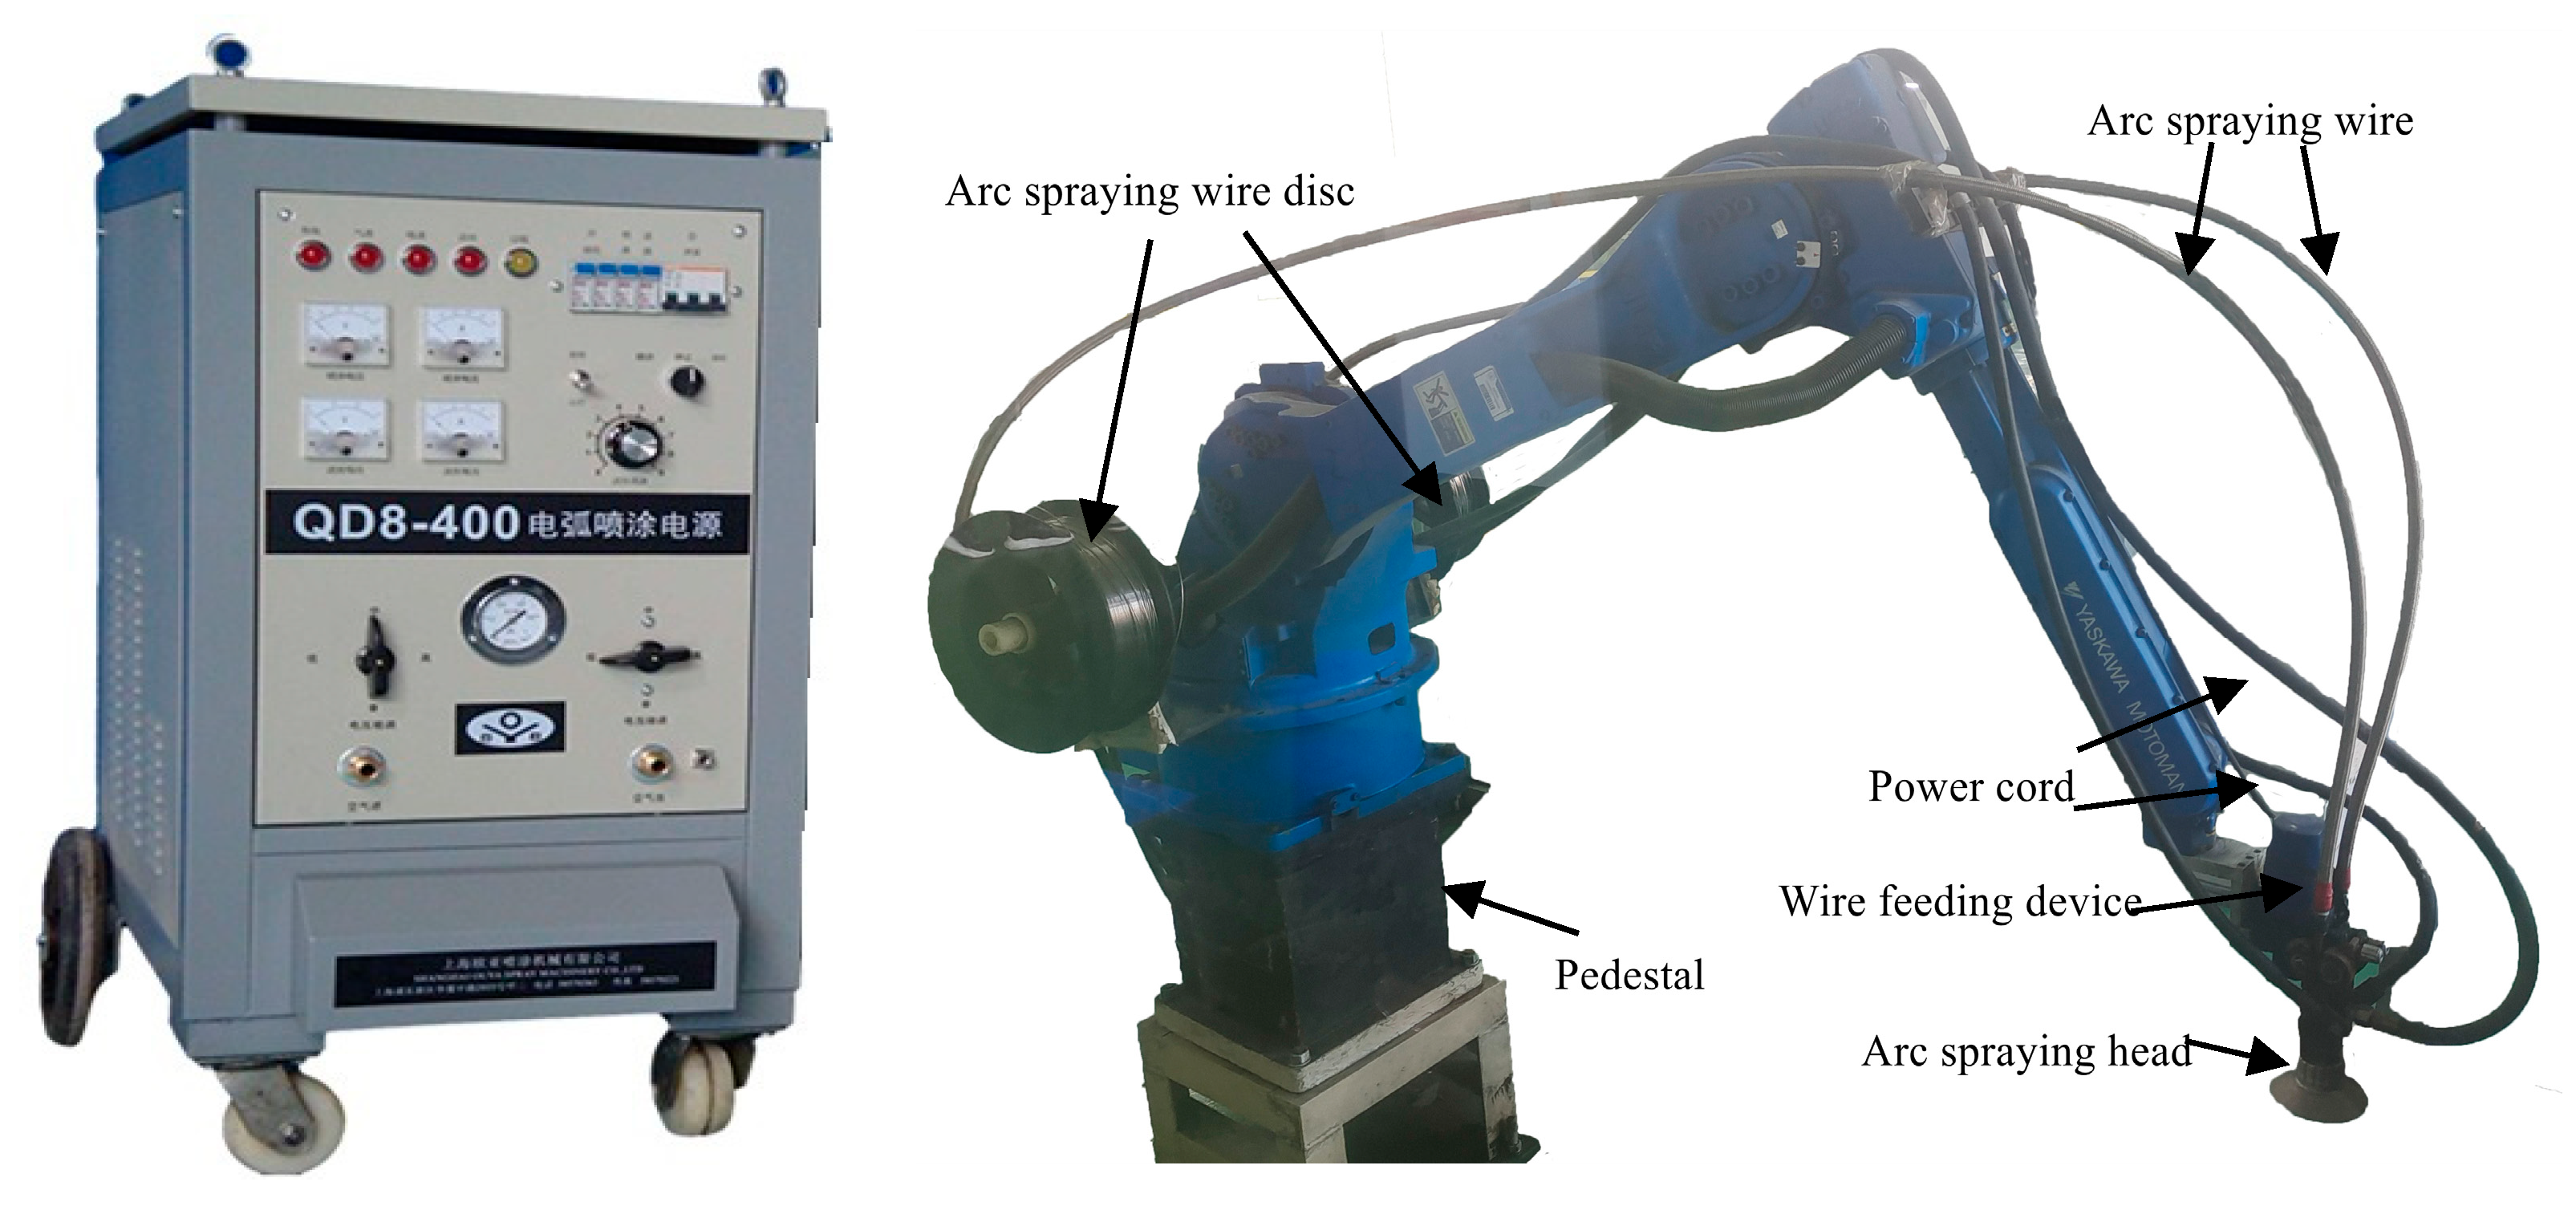
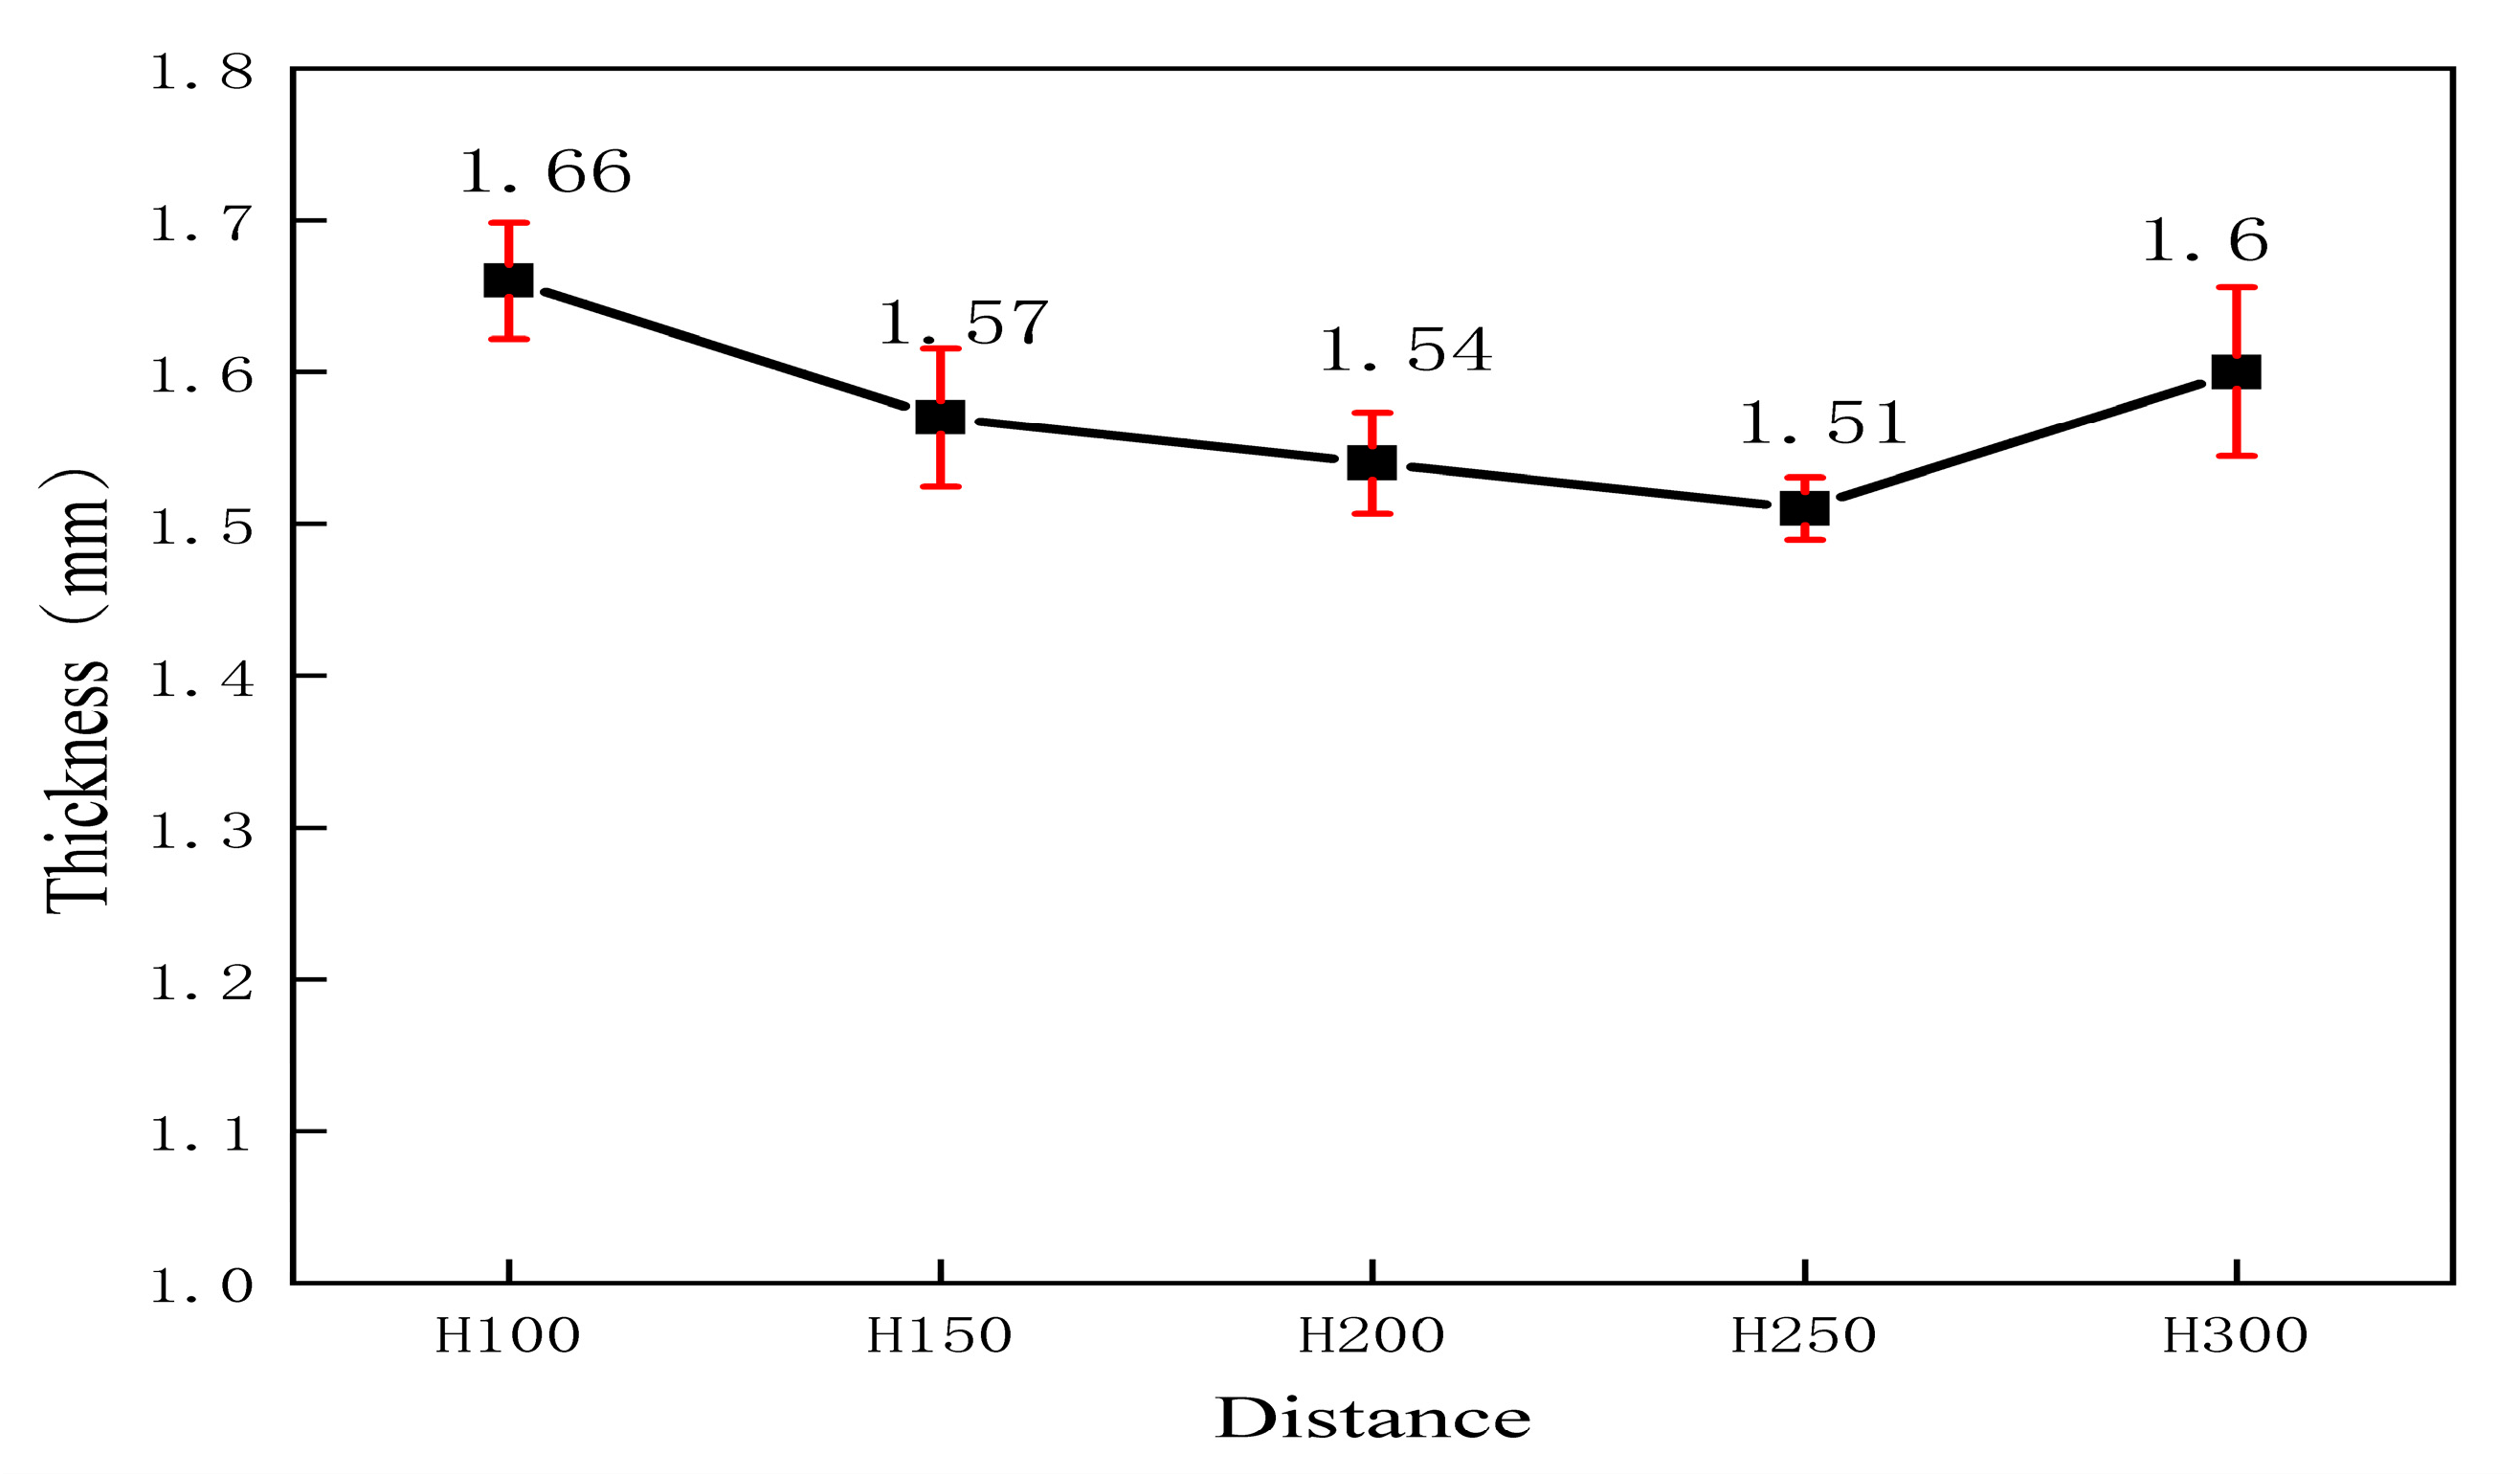
The substrate material used in this experiment was 45# steel (Table 1), with dimensions of 400 mm × 100 mm × 8 mm. The substrate material was cleaned with acetone to remove surface oil stains and rust. Then, brown corundum particles were used for sandblasting to ensure that the surface roughness of the substrate material reached Ra2.5 or above. This step improves the bonding strength between the coating and the substrate material. After sandblasting the substrate, arc spraying was performed. The equipment used was a QD8-400 arc spraying machine produced by Shanghai Eurasia Spray Machinery Co., Ltd. and a Yaskawa robot. As shown in Figure 1, the arc spraying machine allows the adjustment of parameters such as wire feeding speed and spraying current. The wires used in the experiment were 1Cr18Ni9Ti and Monel alloys, and their chemical compositions are shown in Table 2. The diameter of both wires was 2.0 mm, the test filaments were sprayed according to the ratio of 1:1, and the compressed air pressure for spraying was 0.65 MPa. The average thickness of the sprayed coating is 1.5 mm, and the average thickness distribution of the five sprayed distances is shown in Figure 2. Samples were prepared using the process parameters in Table 3, with experiments conducted at five different spraying distances. The distance between the nozzle of the arc spraying machine and the substrate surface was set at 100 mm, 150 mm, 200 mm, 250 mm, and 300 mm. They were represented as H100, H150, H200, H250, and H300, respectively, in the following figures. These distances were used to explore the optimal spraying effect.

Table 1.
Main chemical composition of 45# steel (wt.%).
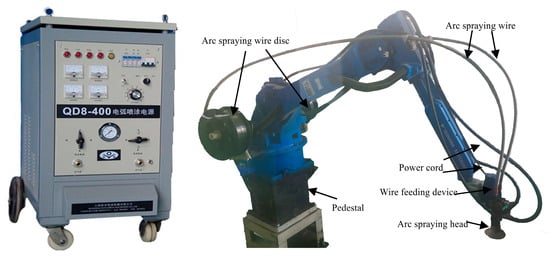
Figure 1.
Arc Spraying Equipment.
Table 2.
Main Chemical Composition of the Two-Wire Materials (wt.%).
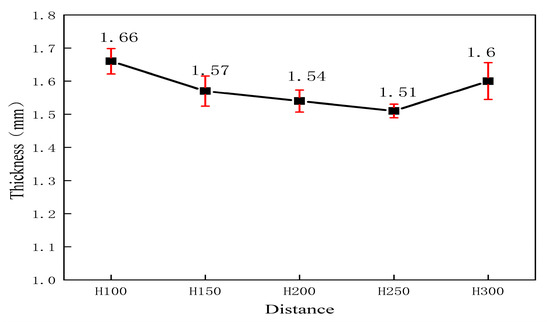
Figure 2.
Distribution diagram of average coating thickness for five spraying distances.
Table 3.
Spraying Process Parameters.
2.2. Coating Characterization Methods and Performance Testing
(1) Use the HandySCAN BLACK (CREAFORM INC., Lévis, QC, Canada) three-dimensional scanner produced by the Quebec Provincial CREAFORM INC.to measure the volume of the five samples, The three-dimensional data were processed using Geomagic Wrap software (version 2021.0.0.3008) to calculate the volume of the samples, the scanned sample was weighed with a balance, and then the density of the sample was calculated. The hardness of the five samples was measured using a Huayin HR-150A (Laizhou, China) Rockwell hardness tester, with a load of 150 kg and a loading time of 15 s. Each sample was tested at six points, and the average value of the six test data was obtained. The surface morphology of the samples was observed using a Hitachi S-4800 (Tokyo, Japan) scanning electron microscope (SEM), and surface phase analysis was also performed.
(2) Porosity calculation. After the process of inlaying, grinding, and polishing of the spray-coated specimen section, the pictures were processed using Image-Pro Plus 6.0 software. Five SEM pictures were randomly selected for analysis and converted into images with large contrasting colours to ensure that the pore portion was displayed in red, and then the percentage of the pore area to the whole field of view area was calculated, and the average value was taken to obtain the porosity of different coatings.
(3) After polishing the sprayed coating samples, a PCM5100W metallurgical microscope (Jinan, China) was used to inspect them. A UMT-5 multifunctional friction (Billerica, MA, USA) wear tester, employing a reciprocating friction wear mode, was used to conduct wear-resistance tests on the coatings. The friction counterpart was a GCr15 steel ball with a diameter of 10 mm and a hardness of 62 HRC. The experimental load was 30 N, the friction speed was 20 mm/s, and the testing time was 900 s. After the test, the friction and wear properties of the coating were characterized and analyzed by friction coefficient, three-dimensional morphology of wear marks, and wear rate. The wear rate is calculated from (1):
where W is the wear rate (mm3 · n−1 · m−1), V is the wear volume (mm3), D is the sliding stroke (m), and l is the load (N).
(4) Corrosion rate calculation. The corrosion rate was determined by calculating the weight change of the specimen by immersing the coated specimen in a 5% sulfuric acid solution for a test period of 10 h. After the static corrosion test, clean and dry the sample and weigh it. The difference between the two masses is the mass loss caused by corrosion. The corrosion rate is calculated as v = (W1 − W2)/St, where W1 is the mass of the sample before the test (mg); W2 is the mass of the sample after the test (mg); S is the area of the sample (cm2); and t is the test time (h).
(5) Acid invasion test. This test selected concentrated hydrochloric acid and concentrated nitric acid for the 3:1 ratio of acid solution, the use of cotton swabs dipped in the solution to wipe the surface of the specimen, the corrosion time of 6 s. After acid etching, the samples were washed with clean water, wiped with anhydrous ethanol, and dried with cold air. Finally, the changes of surface morphology were observed by Hitachi s-4800 scanning electron microscope (SEM).
3. Results and Discussion
3.1. Sample Density
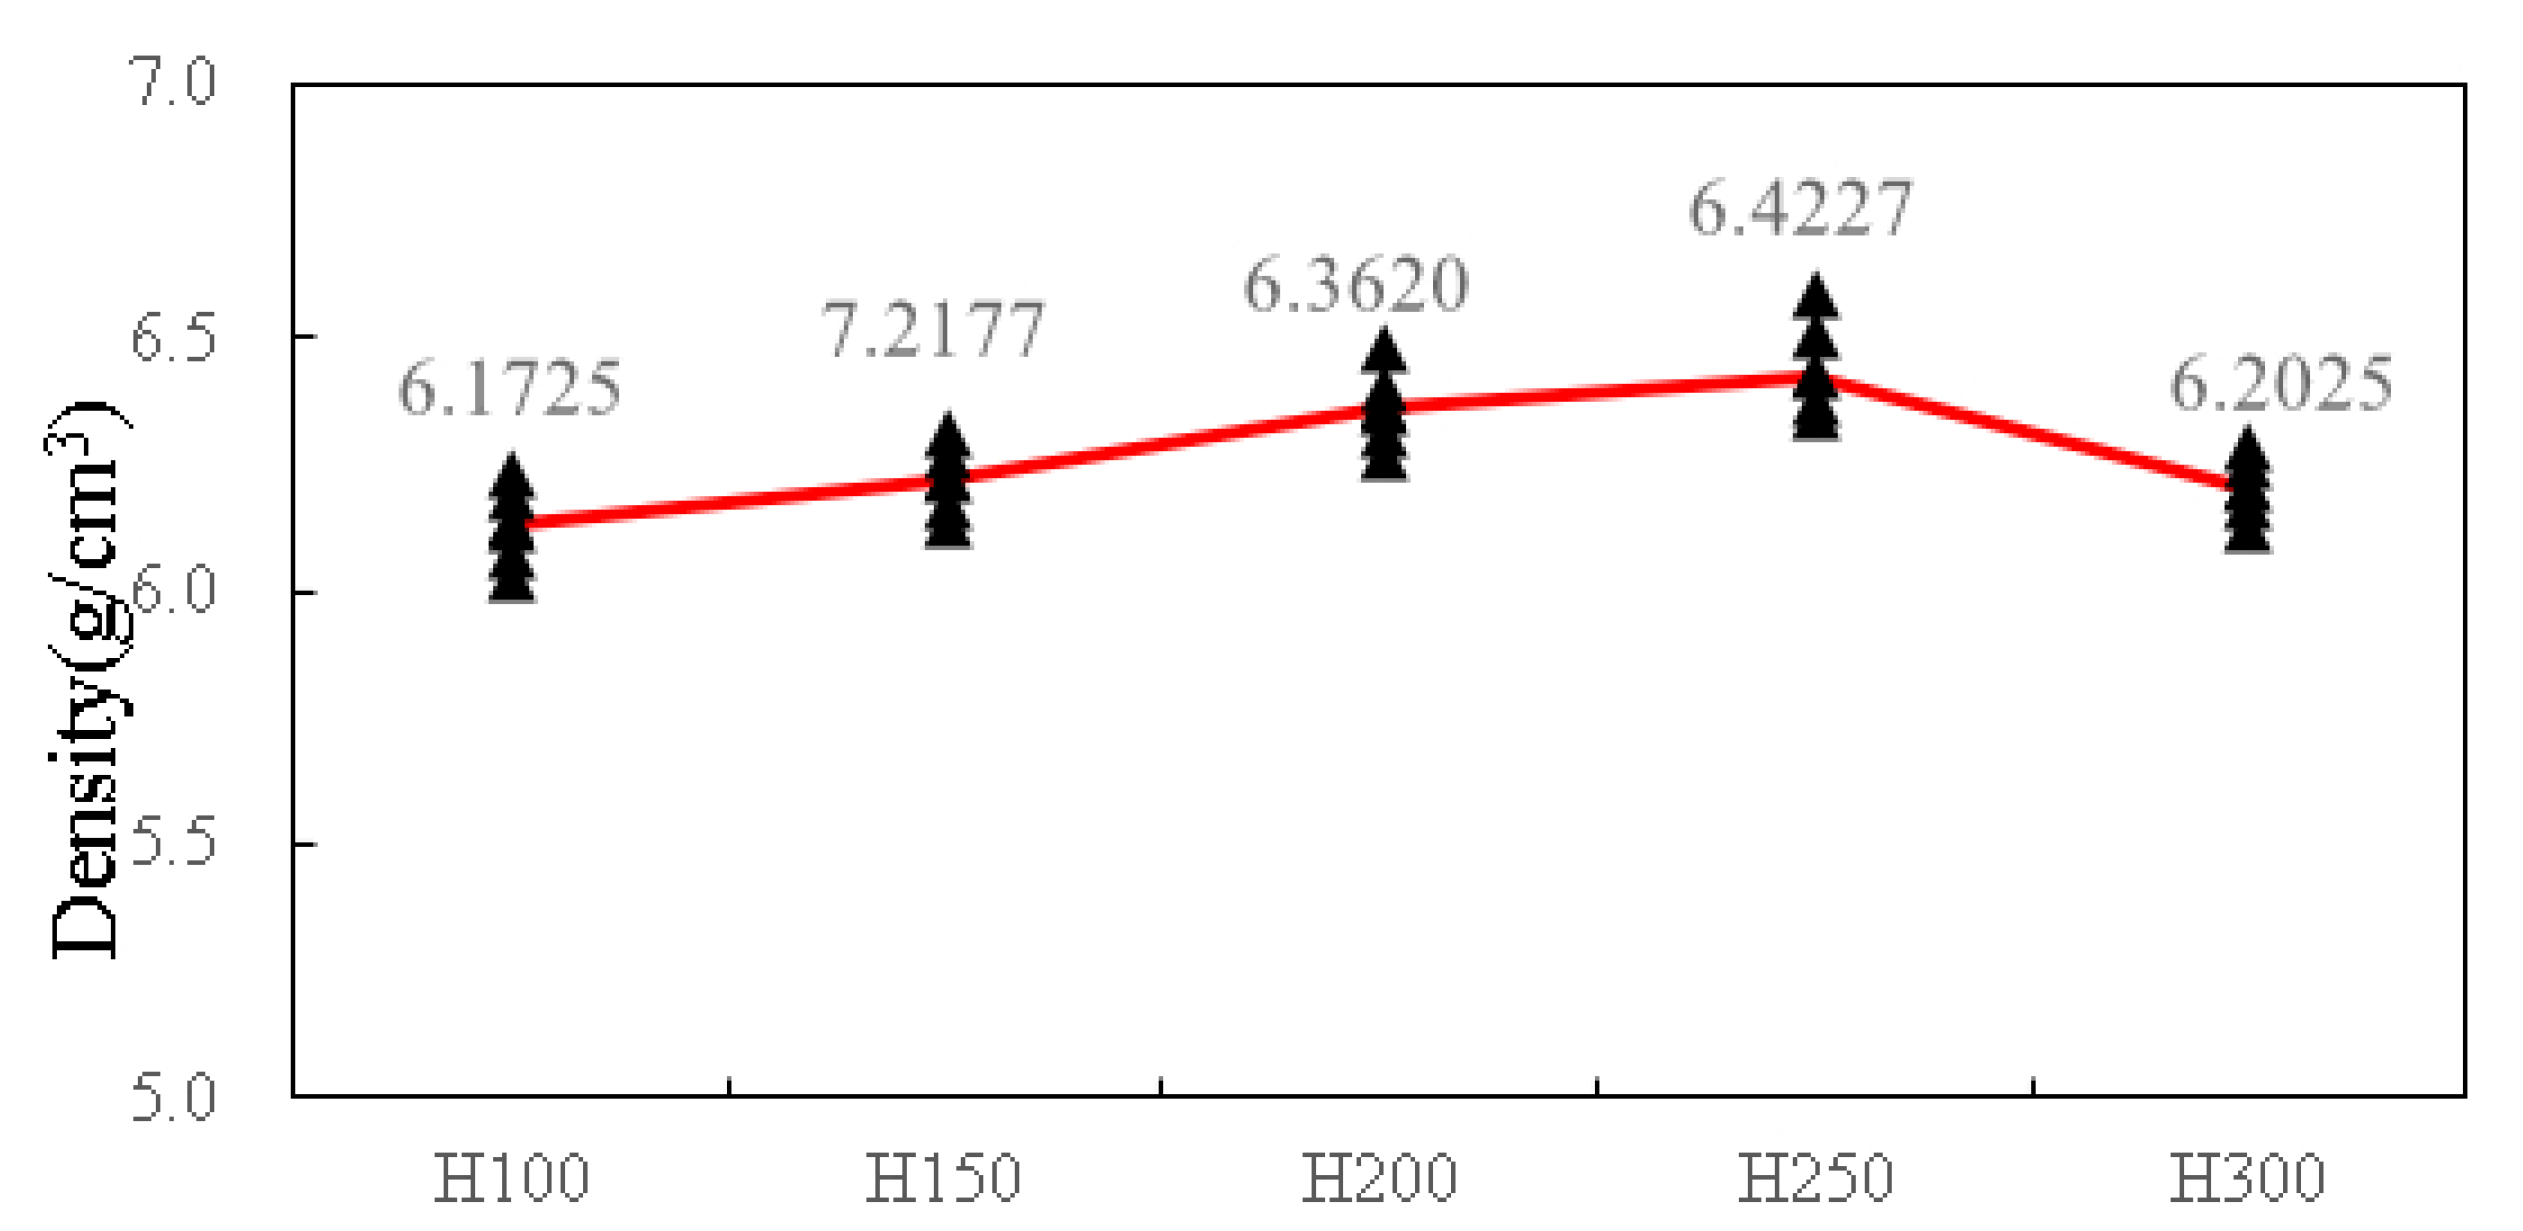
The density of the arc-sprayed coating samples varies compared to the density of the original wire material. Coating density can reflect the compactness of the coating to a certain extent. The higher the density, the more compact the coating and the lower the porosity [23]. The variation in sample density with spraying distance is shown in Figure 3. When the spraying distance is 100 mm, the sample density reaches the minimum value of 6.1257 g/cm3. As the spraying distance increases, the sample density gradually increases, reaching a maximum value of 6.4227 g/cm3 at a spraying distance of 250 mm. After that, the density decreases gradually. When the distance between the spray nozzle and the substrate surface is too close, the metal droplets are not sufficiently atomized due to the effect of the high-speed airflow. Large metal droplets attach to the substrate surface, leading to particle accumulation. Conversely, the metal droplets are sufficiently atomized when the nozzle is too far from the substrate. However, they experience a longer exposure time in the air, causing their temperature to drop and their adhesion to weaken. This results in the formation of pores between the metal droplets, reducing the density of the sprayed coating.

Figure 3.
Density Distribution Curve of Sprayed Coatings at Different Distances.
3.2. Coating Hardness
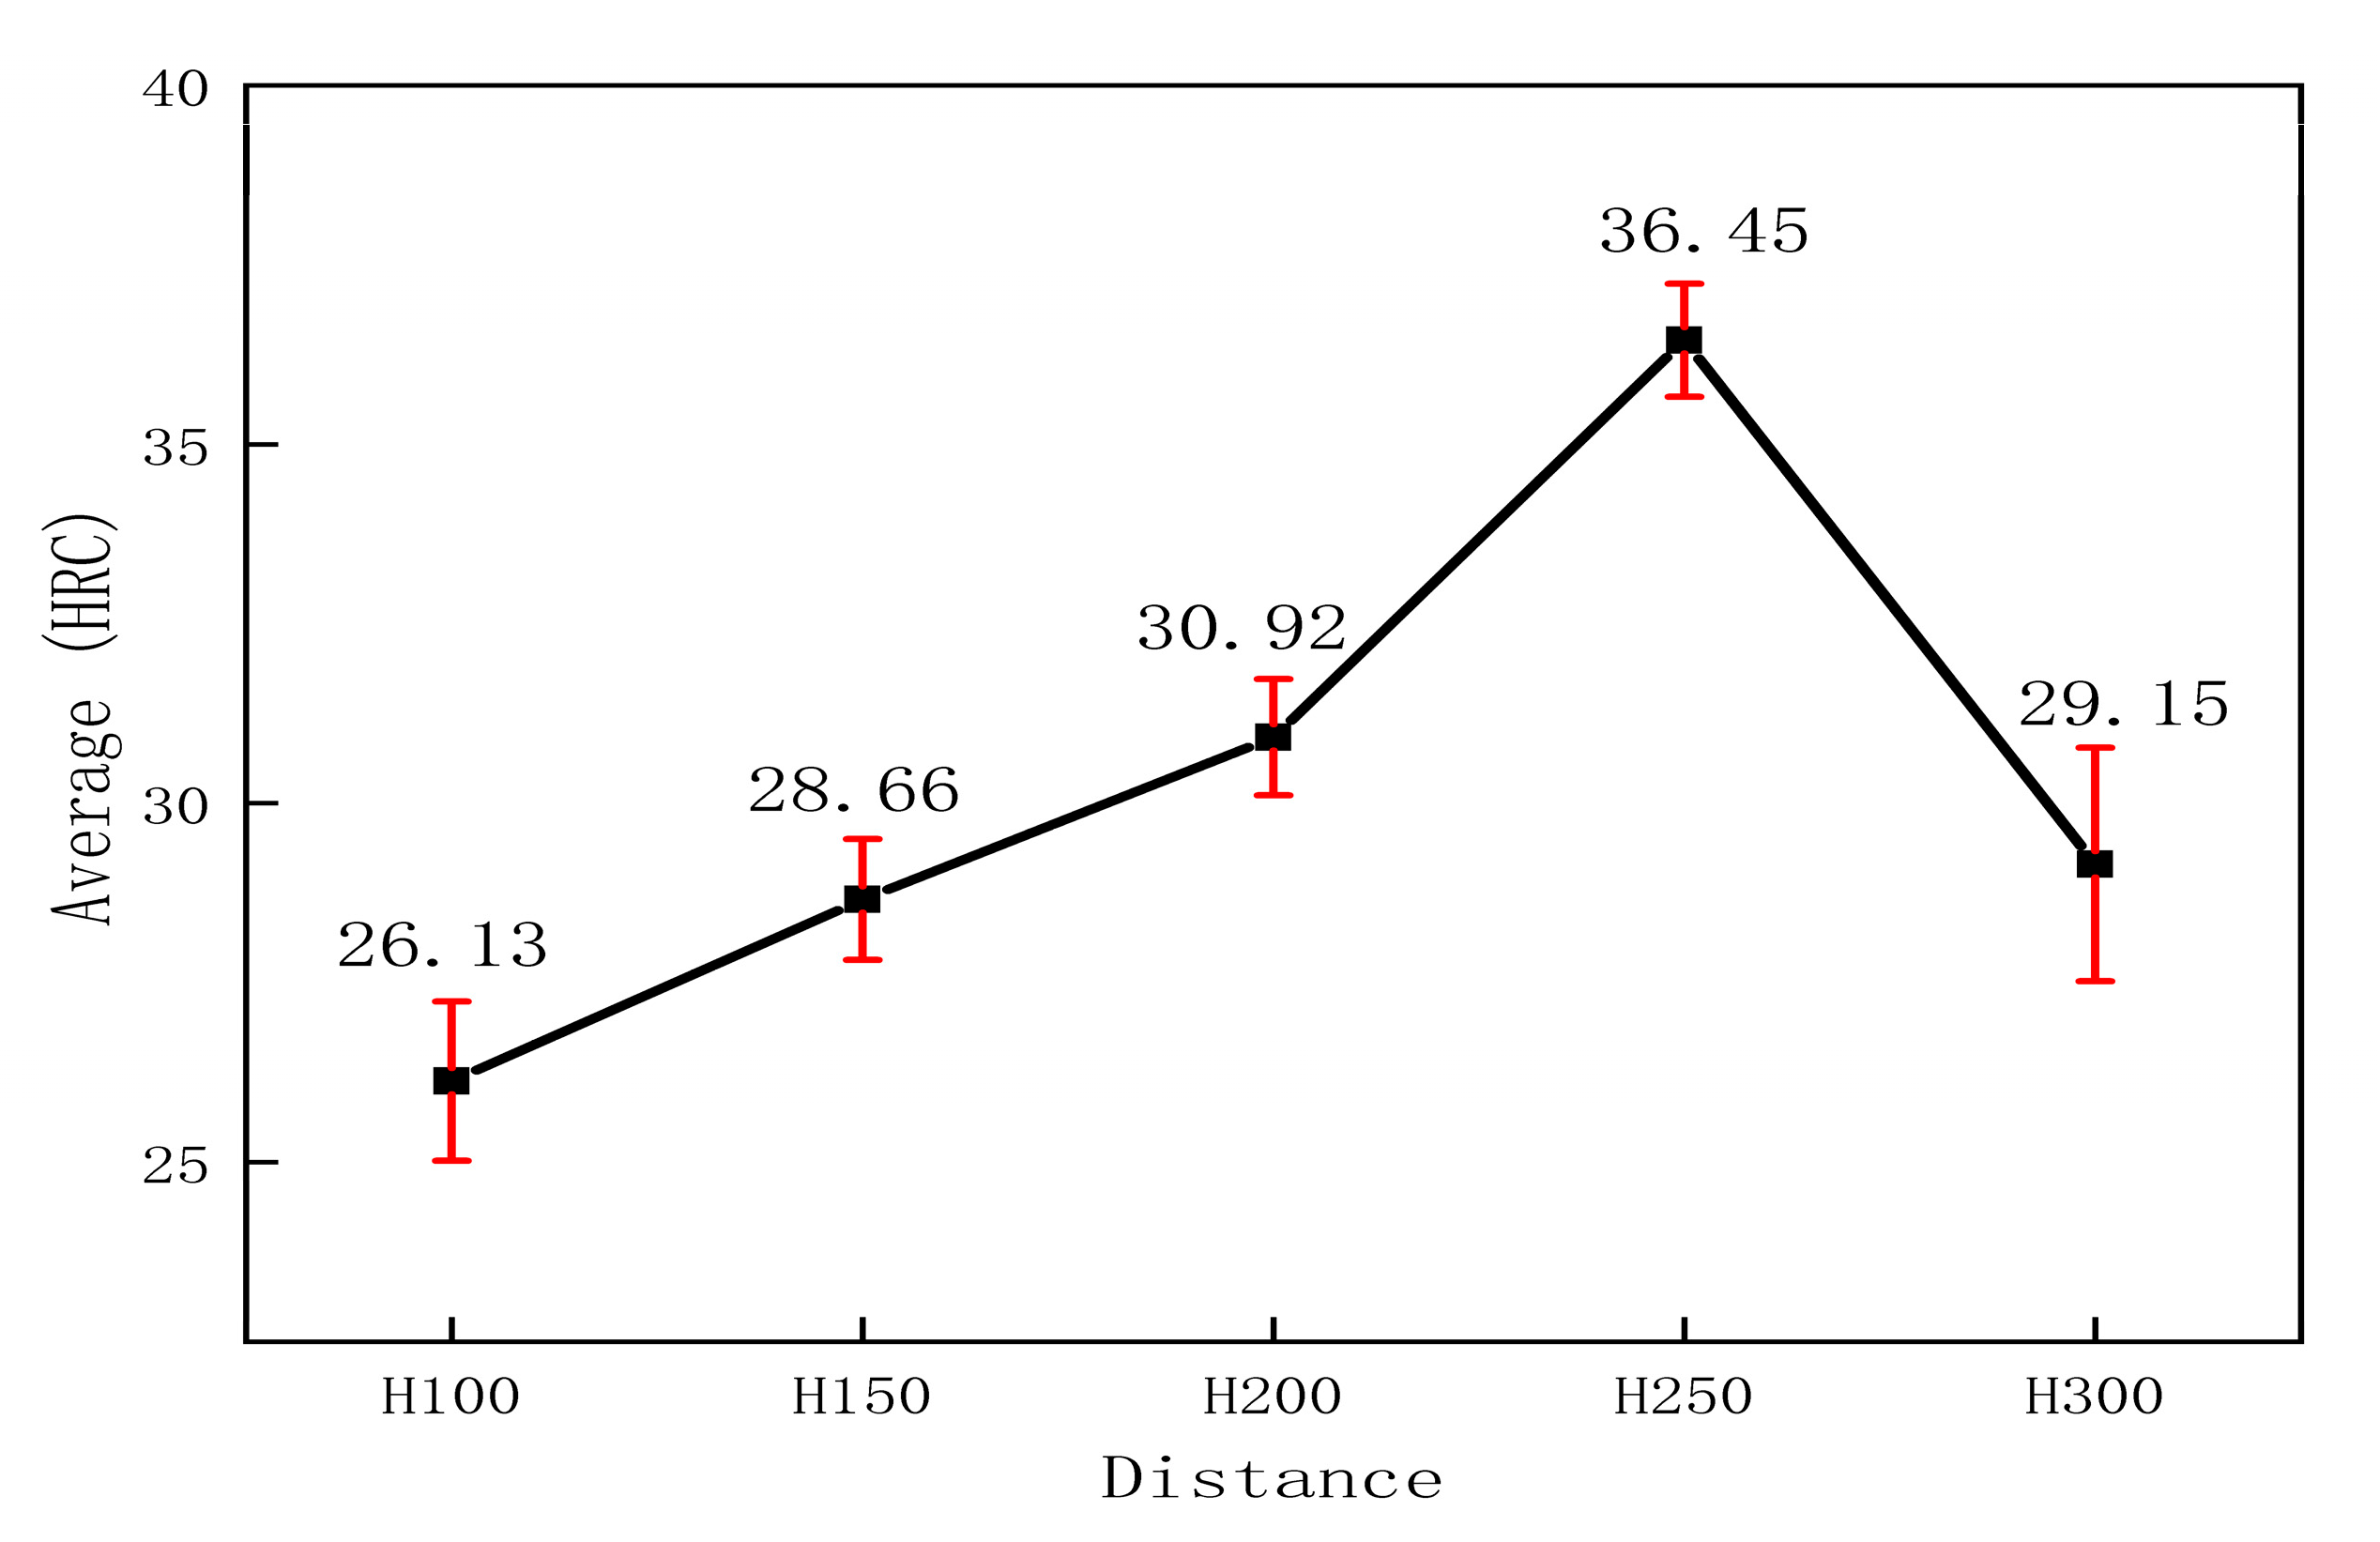
The surface hardness of the 1Cr18Ni9Ti and Monel alloy coating samples was tested, and it was found that the average Rockwell hardness of the five sprayed samples ranged from 26.13 to 36.45 HRC. Figure 4 shows the distribution of hardness values for the five samples. The hardness distribution shows that the samples’ average hardness values are related to the spraying distance. When the spraying distance is 100 mm, the average hardness is the lowest, at 26.13HRC. As the spraying distance increases, the hardness of the sprayed coating gradually increases, reaching a maximum value of 36.45 HRC at a spraying distance of 250 mm, after which the hardness gradually decreases. By comprehensively analyzing the scatter distribution of hardness, the variation curve of average hardness values, and the variation trend of density, it can be concluded that the spraying distance significantly affects the formation of the sprayed coating. Whether the metal droplets are fully atomized directly affects the formation of large particle agglomeration on the substrate surface, creating uneven porosity within the sprayed coating and indirectly affecting the coating’s hardness.
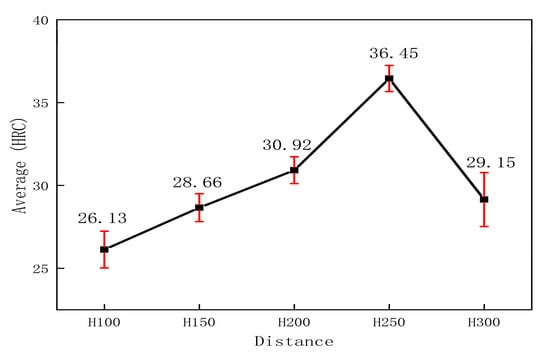
Figure 4.
Scatter Distribution of Hardness Values for Sprayed Coatings at Different Distances.
3.3. Characterization of Coating Surface Morphology and Calculation of Porosity
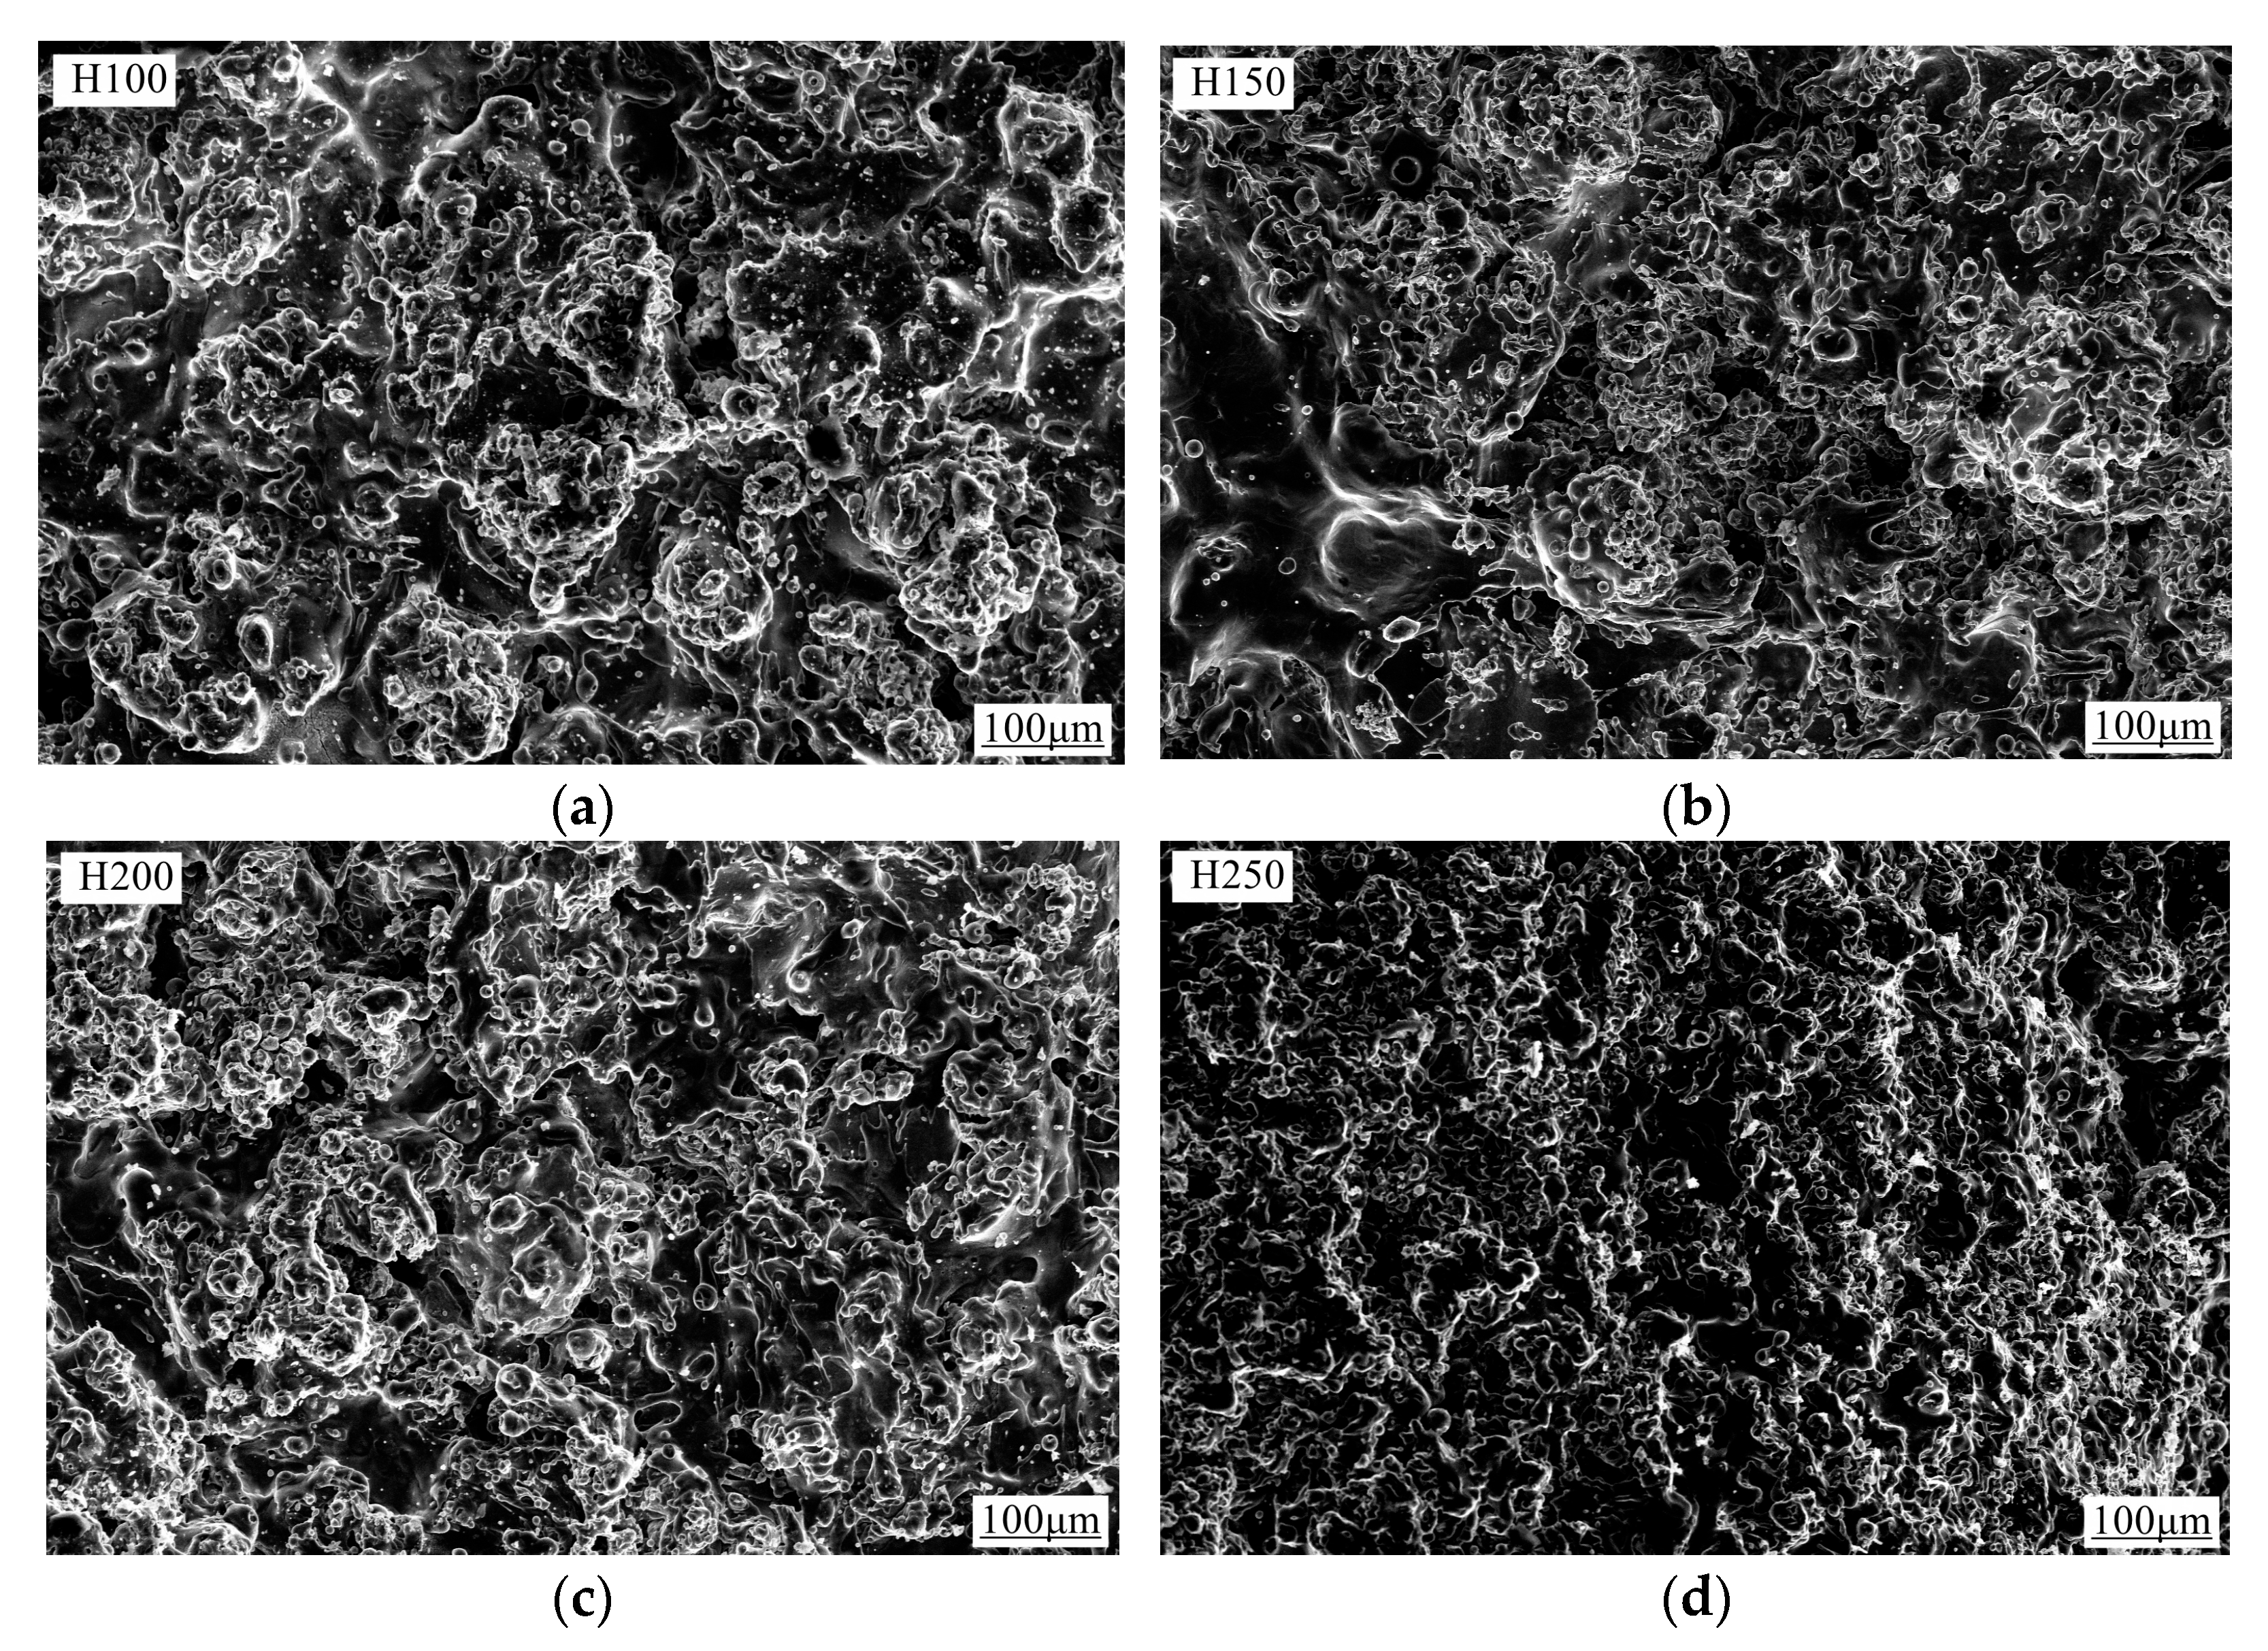
The microstructure of the arc-sprayed coating samples was observed, as shown in Figure 5a–e. The surface of the alloy coating is rough with obvious ups and downs. The roughness of the five coating surfaces is different, and the roughness of the surface in Figure 5d is more uniform than that of other coating surfaces. During arc spraying, the wire melts due to short-circuit heating. The molten droplets are propelled onto the substrate surface under the impact of high-speed airflow. The droplets rapidly spread out and gradually deposit, forming flattened particles. These flattened particles overlap layer by layer, forming a tight lamellar structure and particle accumulation. The flat particles are stacked layer by layer and finally form a compact sheet structure and particle accumulation structure, which are closely attached to the substrate surface and play a good shielding role, as shown in Figure 5f.

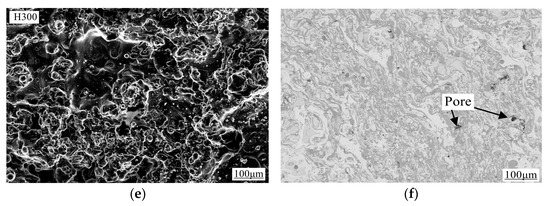
Figure 5.
Microstructure of Sprayed Coatings at Different Spraying Distances. (a–e) micromorphology of the test surfaces at five spraying distances; (f) scanning photographs of the H150 cross-section.
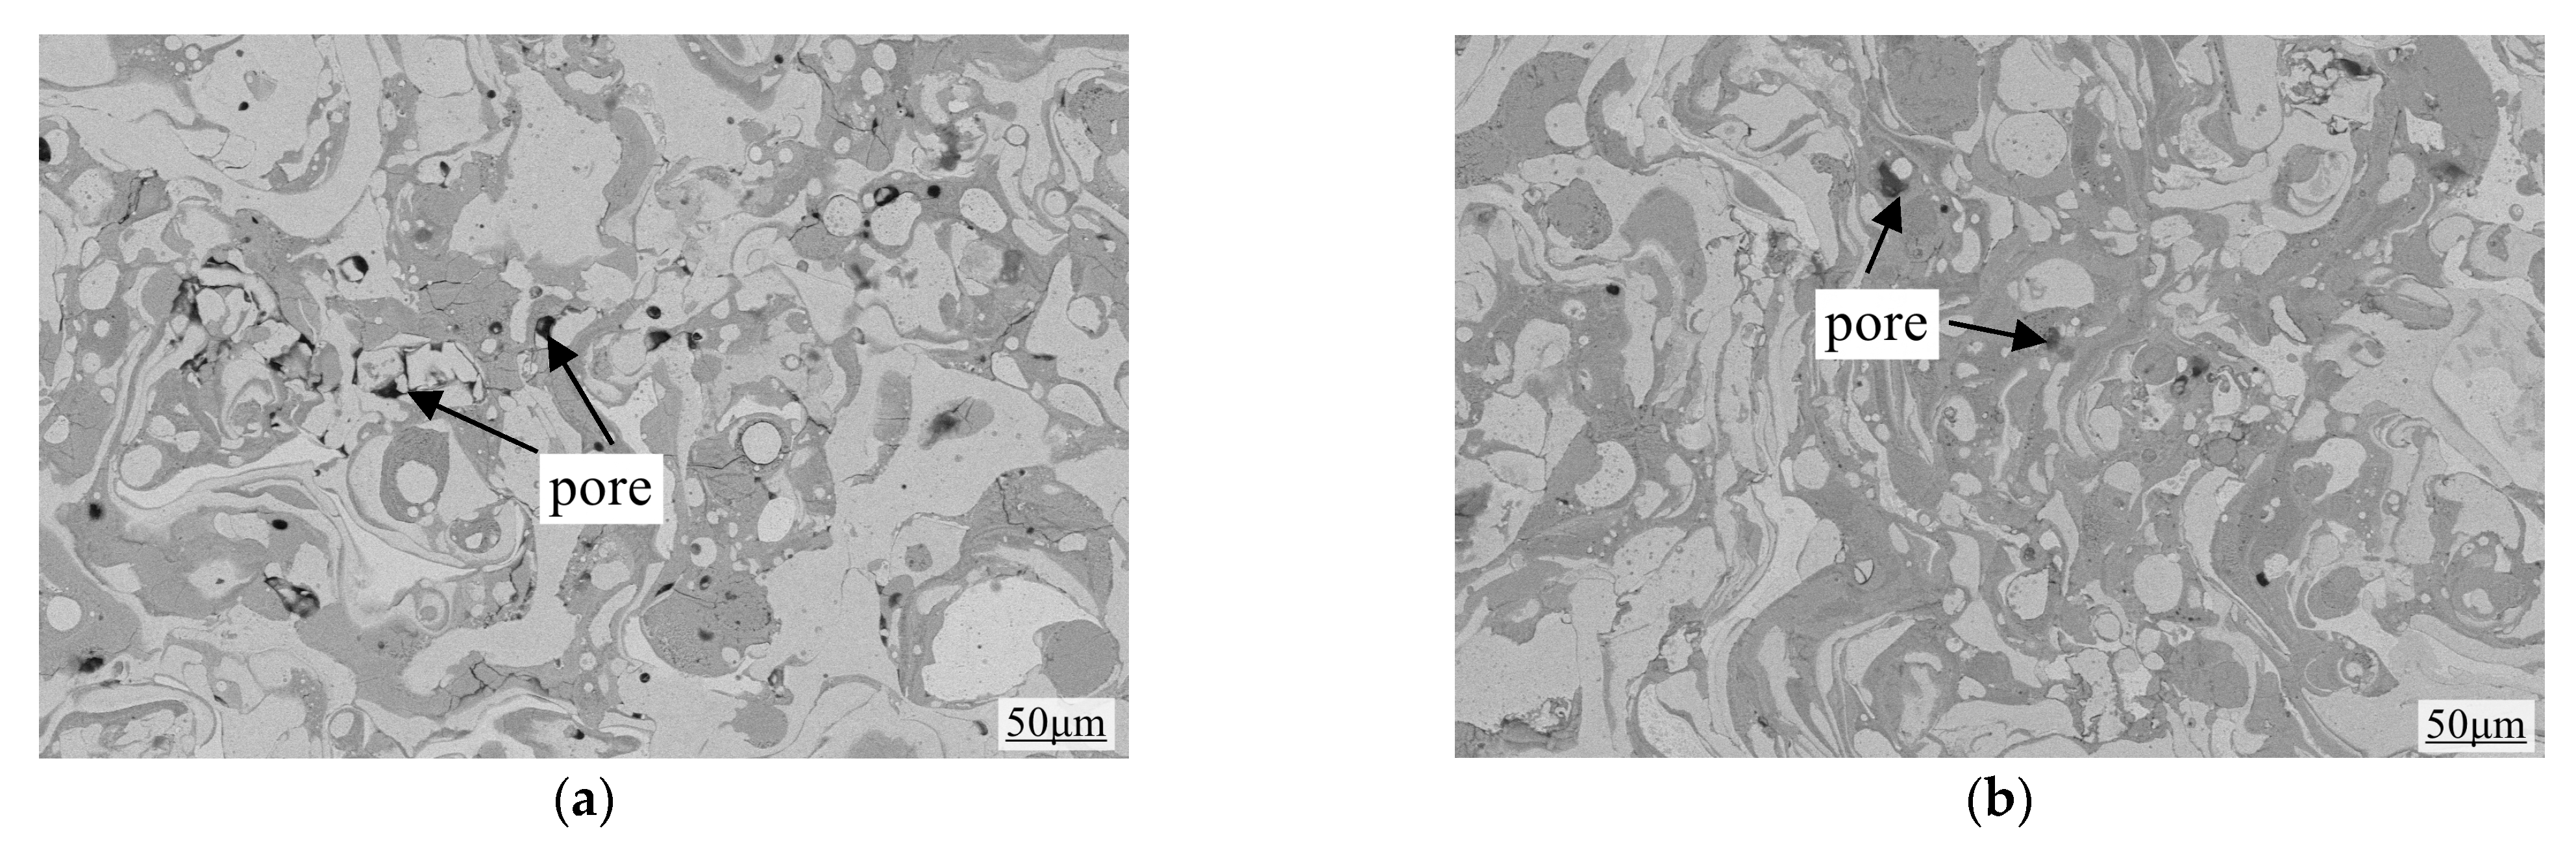
Figure 6 is a scanning electron microscope photograph of the coating section when the spraying distance is 100 mm and 250 mm. It can be seen that the coating presents a typical compact layered structure, which is composed of flattened particles, oxides, and pores. The reason for the layered structure is that the huge energy generated when the wires at both ends are short-circuited makes the wires melt and form droplets. The droplets are atomized by high-pressure gas, and the small particles formed after instant atomization quickly hit the substrate surface, spreading and solidifying to form a layered structure. The whole section is mainly composed of oxides, large particle accumulation, etc. The existence of oxide phase is caused by the inevitable contact reaction between part of the droplet surface and oxygen in the atmosphere during the spraying process, and the oxide phase formed by these reactions will affect the spreading of the droplet to a certain extent, and then affect the continuity of the coating, forming pores or holes [24].
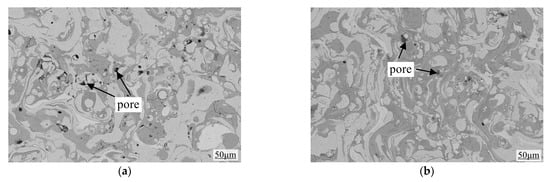
Figure 6.
Scanning Electron Micrographs of Coating Cross-Sections. (a) Scanning photograph of H100 cross-section; (b) Scanning photograph of H250 cross-section.
Different spraying distances form different pores. Spraying distance affects the molten droplet particles in the air flight time and the molten droplet metal particles sprayed to the substrate material in the process. The size of the spraying speed, temperature, and kinetic energy, will affect the distribution of unmelted particles inside the coating, which in turn will affect the porosity inside the coating. When the spraying distance is 100 mm, there is a large particle agglomeration phenomenon and obvious porosity on the surface of the sprayed coating. The reason for this is that the spraying distance is relatively close. The molten metal droplets are not fully atomized under the action of high-speed airflow, and the coating sprayed onto the surface of the substrate does not solidify in time, leading to the phenomenon of hanging coating, which produces large particle agglomeration and porosity. When the spraying distance is 250 mm, the surface of the sprayed coating shows a uniform lamellar structure, with uniform particle size, analyzing the reason why the molten metal droplets can be completely atomized under the action of high-speed airflow and spread completely on the surface of the substrate to form uniform metal particles, reducing the generation of pores. With the further increase of the spraying distance, the molten metal droplets are exposed in the air for a longer period of time, the adhesion on the surface of the substrate decreases, the spatial mesh structure forms, and the internal porosity of the coating is significantly increased.
By scanning the sections of sprayed coatings with different heights, five SEM images were taken for each section. The coating sections were analyzed by Image Pro Plus 6.0 software, and the average value was calculated. The porosity distribution of coatings with different spraying distances was obtained, as shown in Figure 7.
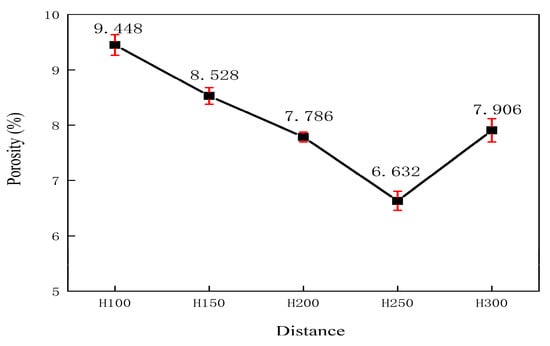
Figure 7.
Porosity Distribution.
3.4. Analysis of Coating Friction and Wear Behavior
3.4.1. Coating Friction Factor Analysis
UMT-5 Multifunctional Friction and Wear Tester calculates the coefficient of friction by measuring the force generated during friction. The test is performed by sensor detection when a specific load of 30N is applied to the test and the reciprocating friction speed is 20 mm/s. During the friction test, the tester measures the friction force occurring between the contacting surfaces, which allows the coefficient of friction to be measured directly by the built-in sensor. The coefficient of friction (μ) is the ratio between the friction force (Ff) and the perpendicular load (Fn), where Ff is the measured friction force and Fn is the normal force acting on the specimen surface.
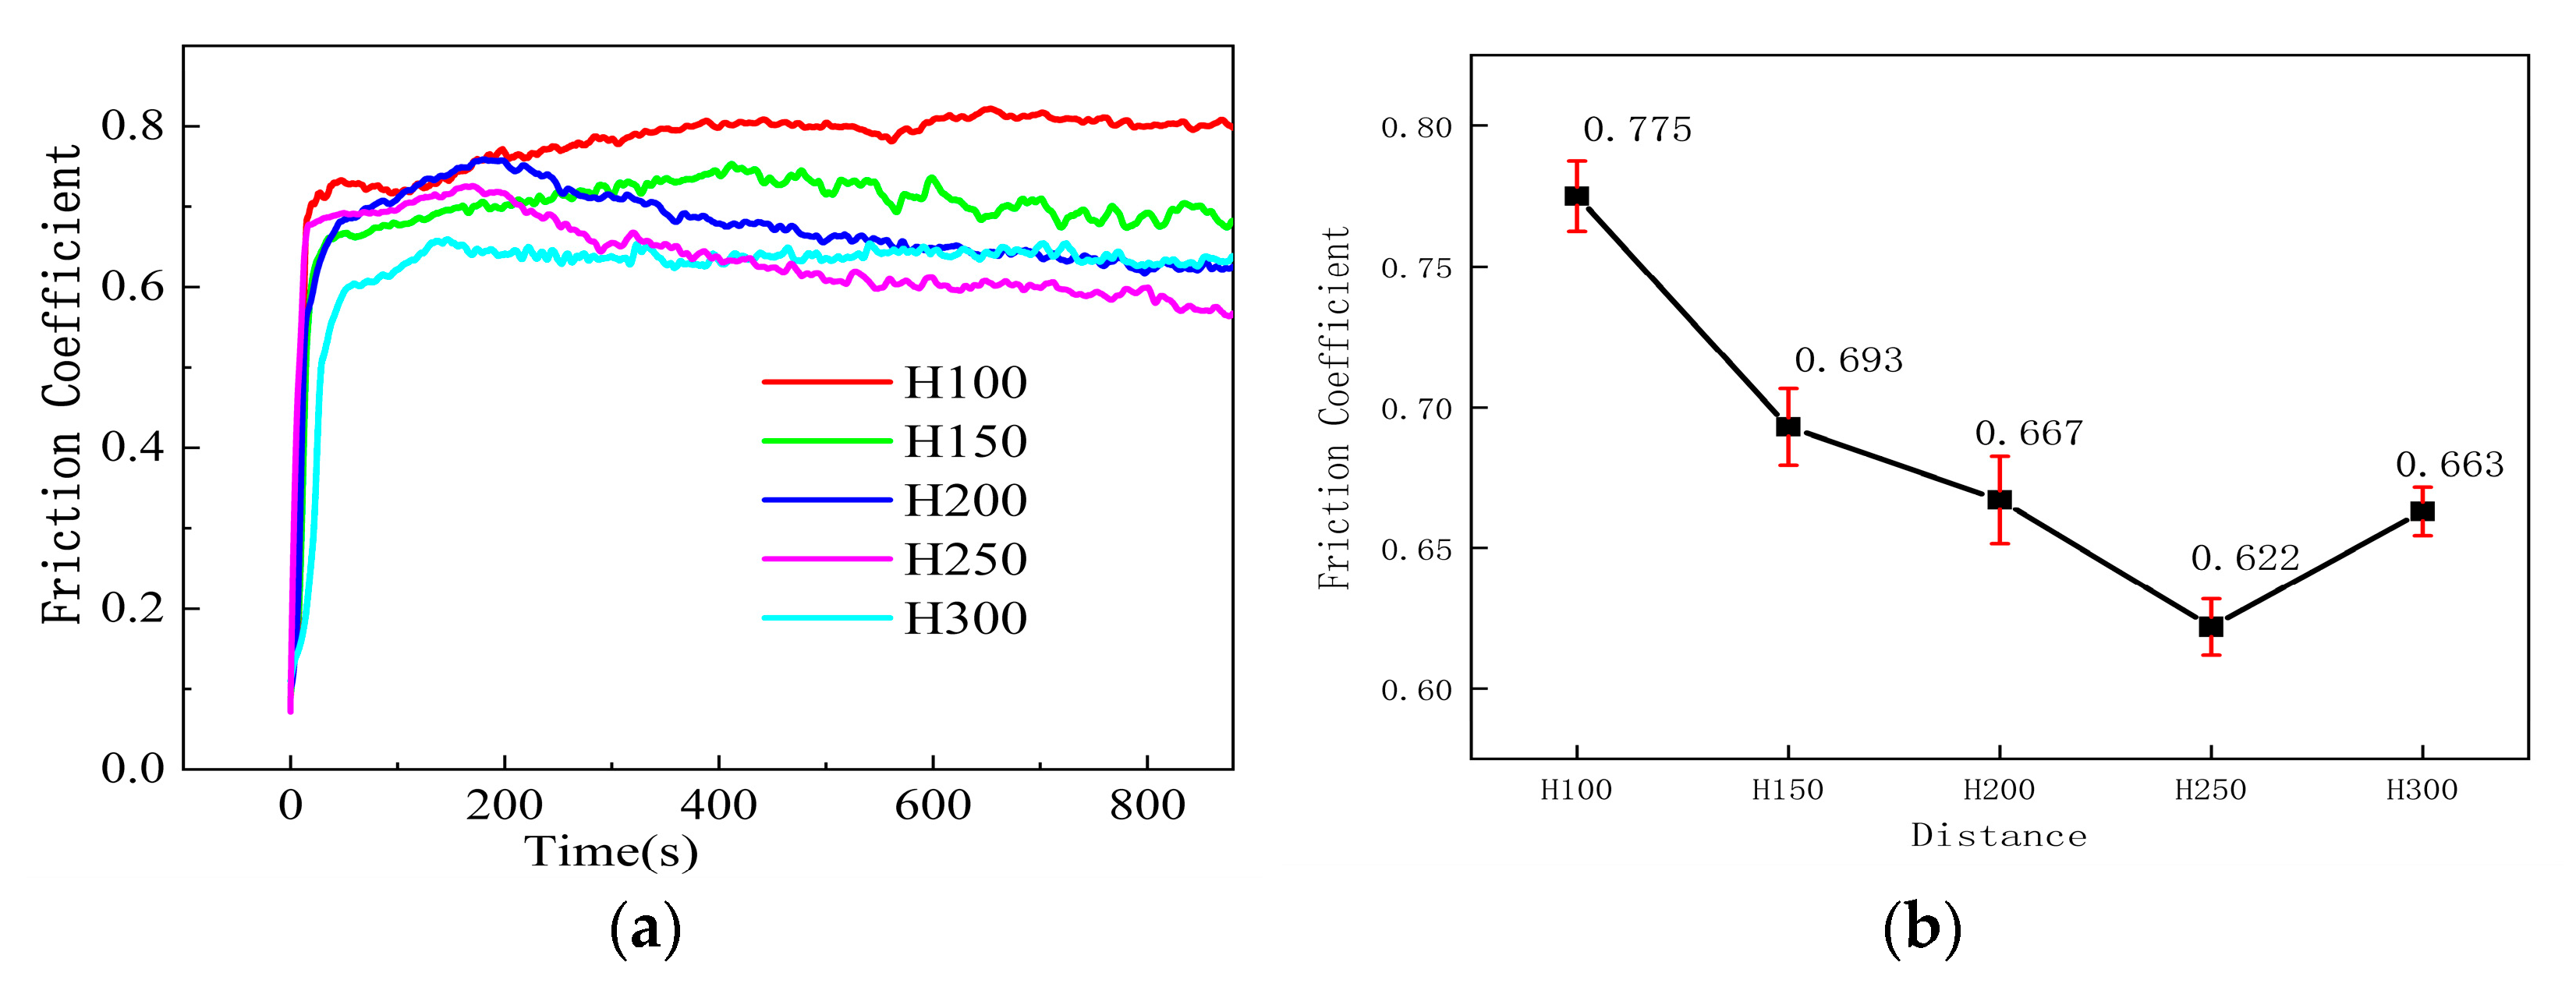
As shown in Figure 8, a and b are the curves of the friction coefficient of the coating of the arc-sprayed sample as a function of time. The polished sample surface is relatively smooth in the initial friction stage, resulting in a low friction coefficient. As dry friction continues, the friction coefficient rapidly increases due to the formation of wear particles and other substances during the friction process. These particles create dents on the coating surface, increasing the contact area between the wear ball and the coating. Over time, the wear particles gradually fill in the dents, further increasing the surface friction coefficient. The friction coefficient is closely related to the material’s physical properties. The lower the friction coefficient, the better the material’s wear resistance. After 200 s, friction enters the steady wear stage, and the friction coefficient remains relatively stable. Figure 6a shows the variation of the friction coefficient during the testing process, while Figure 6b shows the variation in friction coefficients for different spraying distances. When the spraying distance is 100 mm, the friction coefficient reaches a maximum value of 0.7752. As the spraying distance increases, the friction coefficient gradually decreases. It reaches a minimum of 0.6214 at 250 mm. After that, it rises again.
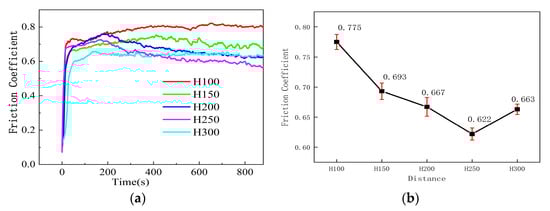
Figure 8.
Variation of Friction Coefficient with Time. (a) Five coating friction coefficient curve change diagrams; (b) Average friction coefficient of five coatings.
By comparing the sample density, average hardness, and friction coefficient values, it was found that the trends in density and average hardness were similar. This phenomenon is attributed to the influence of pore structure within the samples′ density and hardness. However, the variation trend in the friction coefficient is opposite to that of density and average hardness, indicating that the denser the coating, the higher its hardness, and the lower its friction coefficient. Phase analysis results showed that when the spraying distance was 250 mm, the friction coefficient of the sprayed coating was the lowest. The precipitation of elemental Cu and Cu3.8Ni in the coating was vital in reducing the friction coefficient.
3.4.2. Analysis of Coating Wear Performance
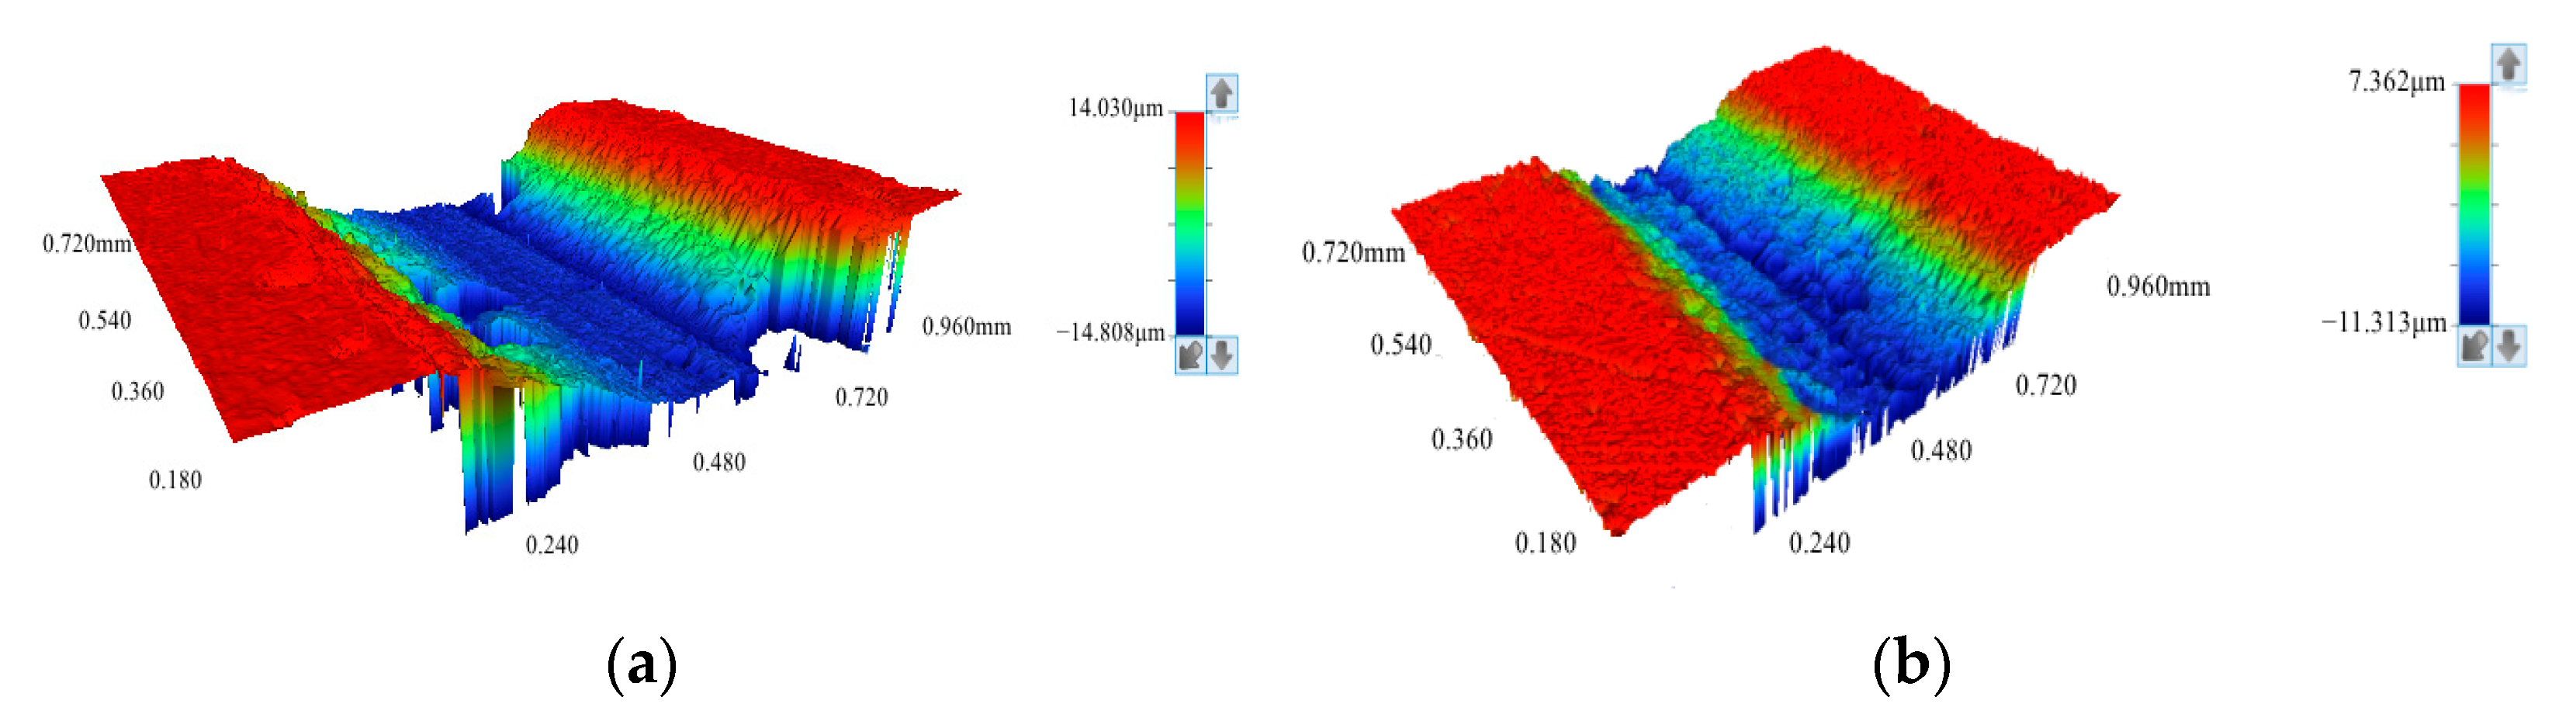
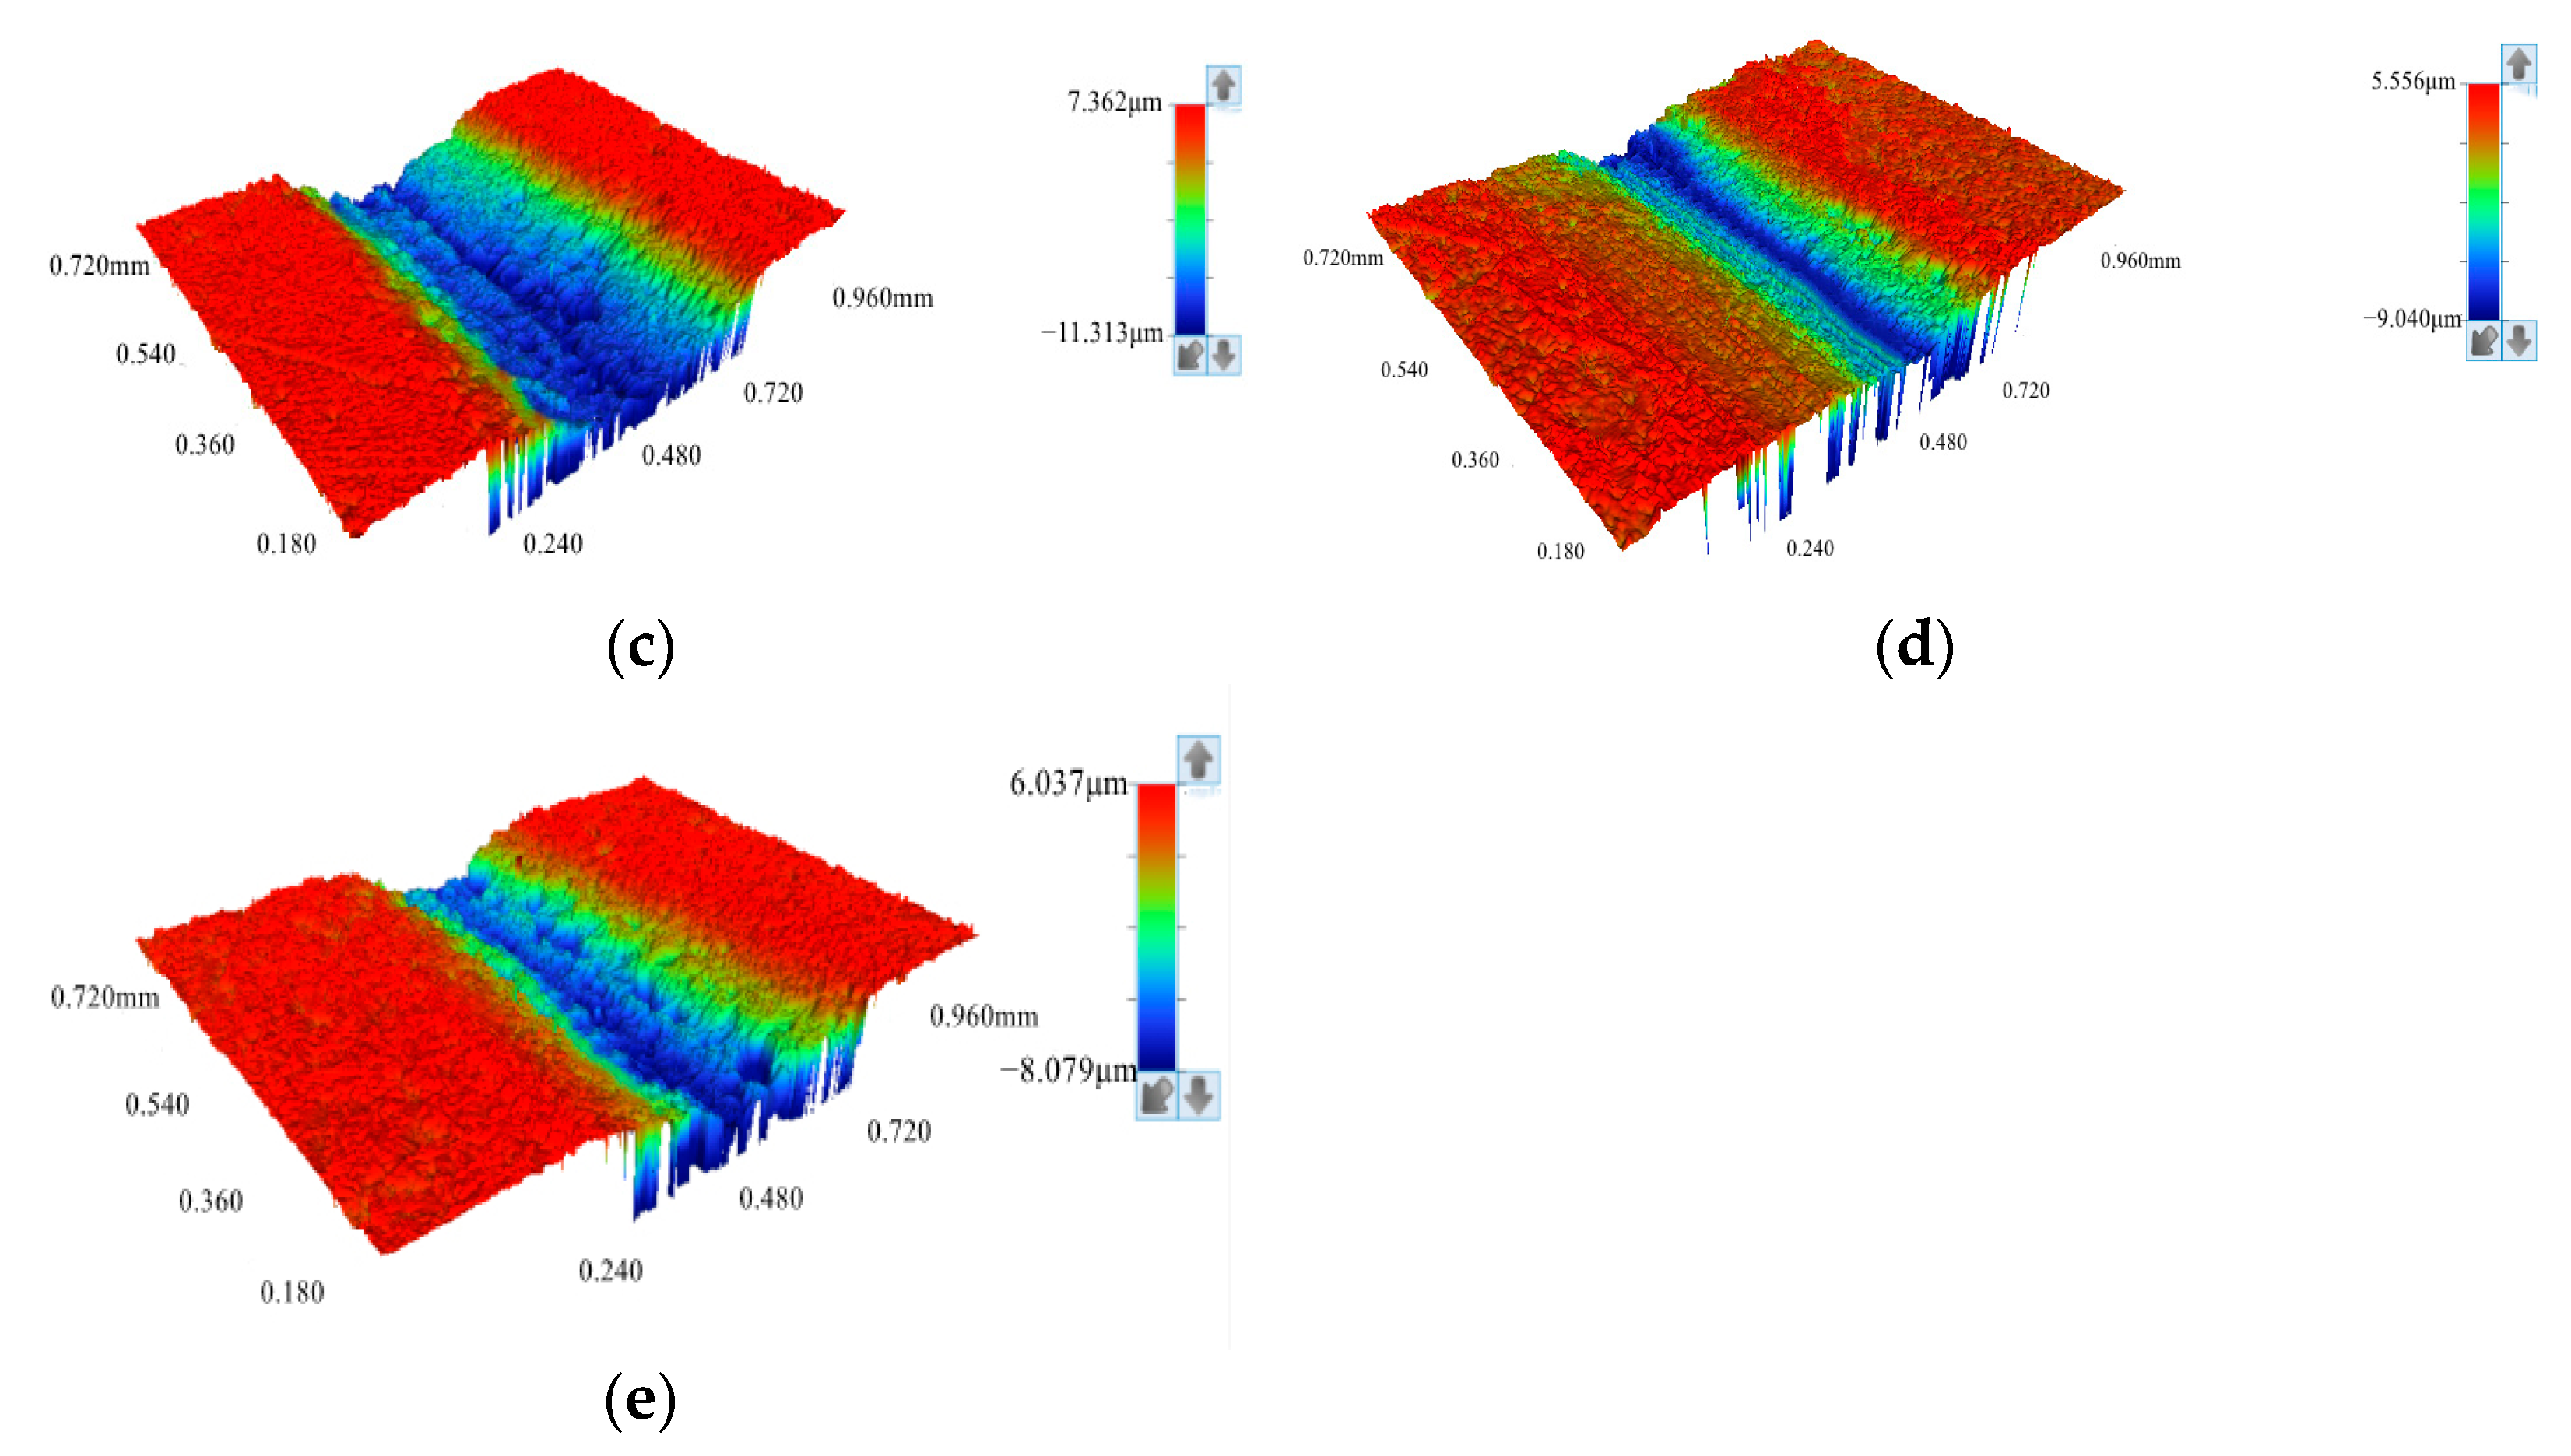
Figure 9 shows the three-dimensional morphology of the abrasion marks of five spray distance coatings after friction and wear tests. It can be seen that the shape of the abrasion marks of the five coatings is close to one another, showing a large abrasion mark width and abrasion mark depth. The wear interiors of the five coatings are not smooth, with many obvious bumps and pits. Among them, A coating has the largest abrasion mark width and depth, and exhibits the largest abrasion volume, the worst abrasion resistance, and the worst structural integrity under friction load. D coating is analyzed in comparison with the other coatings. It has a shallower depth of abrasion mark, the smallest width of abrasion mark, the smallest abrasion volume, and the best structural integrity under friction load, which reflects the good friction and abrasion resistance performance. The spraying distance of 250 mm showed the best wear performance of the coating.


Figure 9.
3D Morphology of Abrasion Marks of Coatings. (a) Spray distance 100 mm; (b) Spray distance 150 mm; (c) Spray distance 200 mm; (d) Spray distance 250 mm; (e) Spray distance 300 mm.
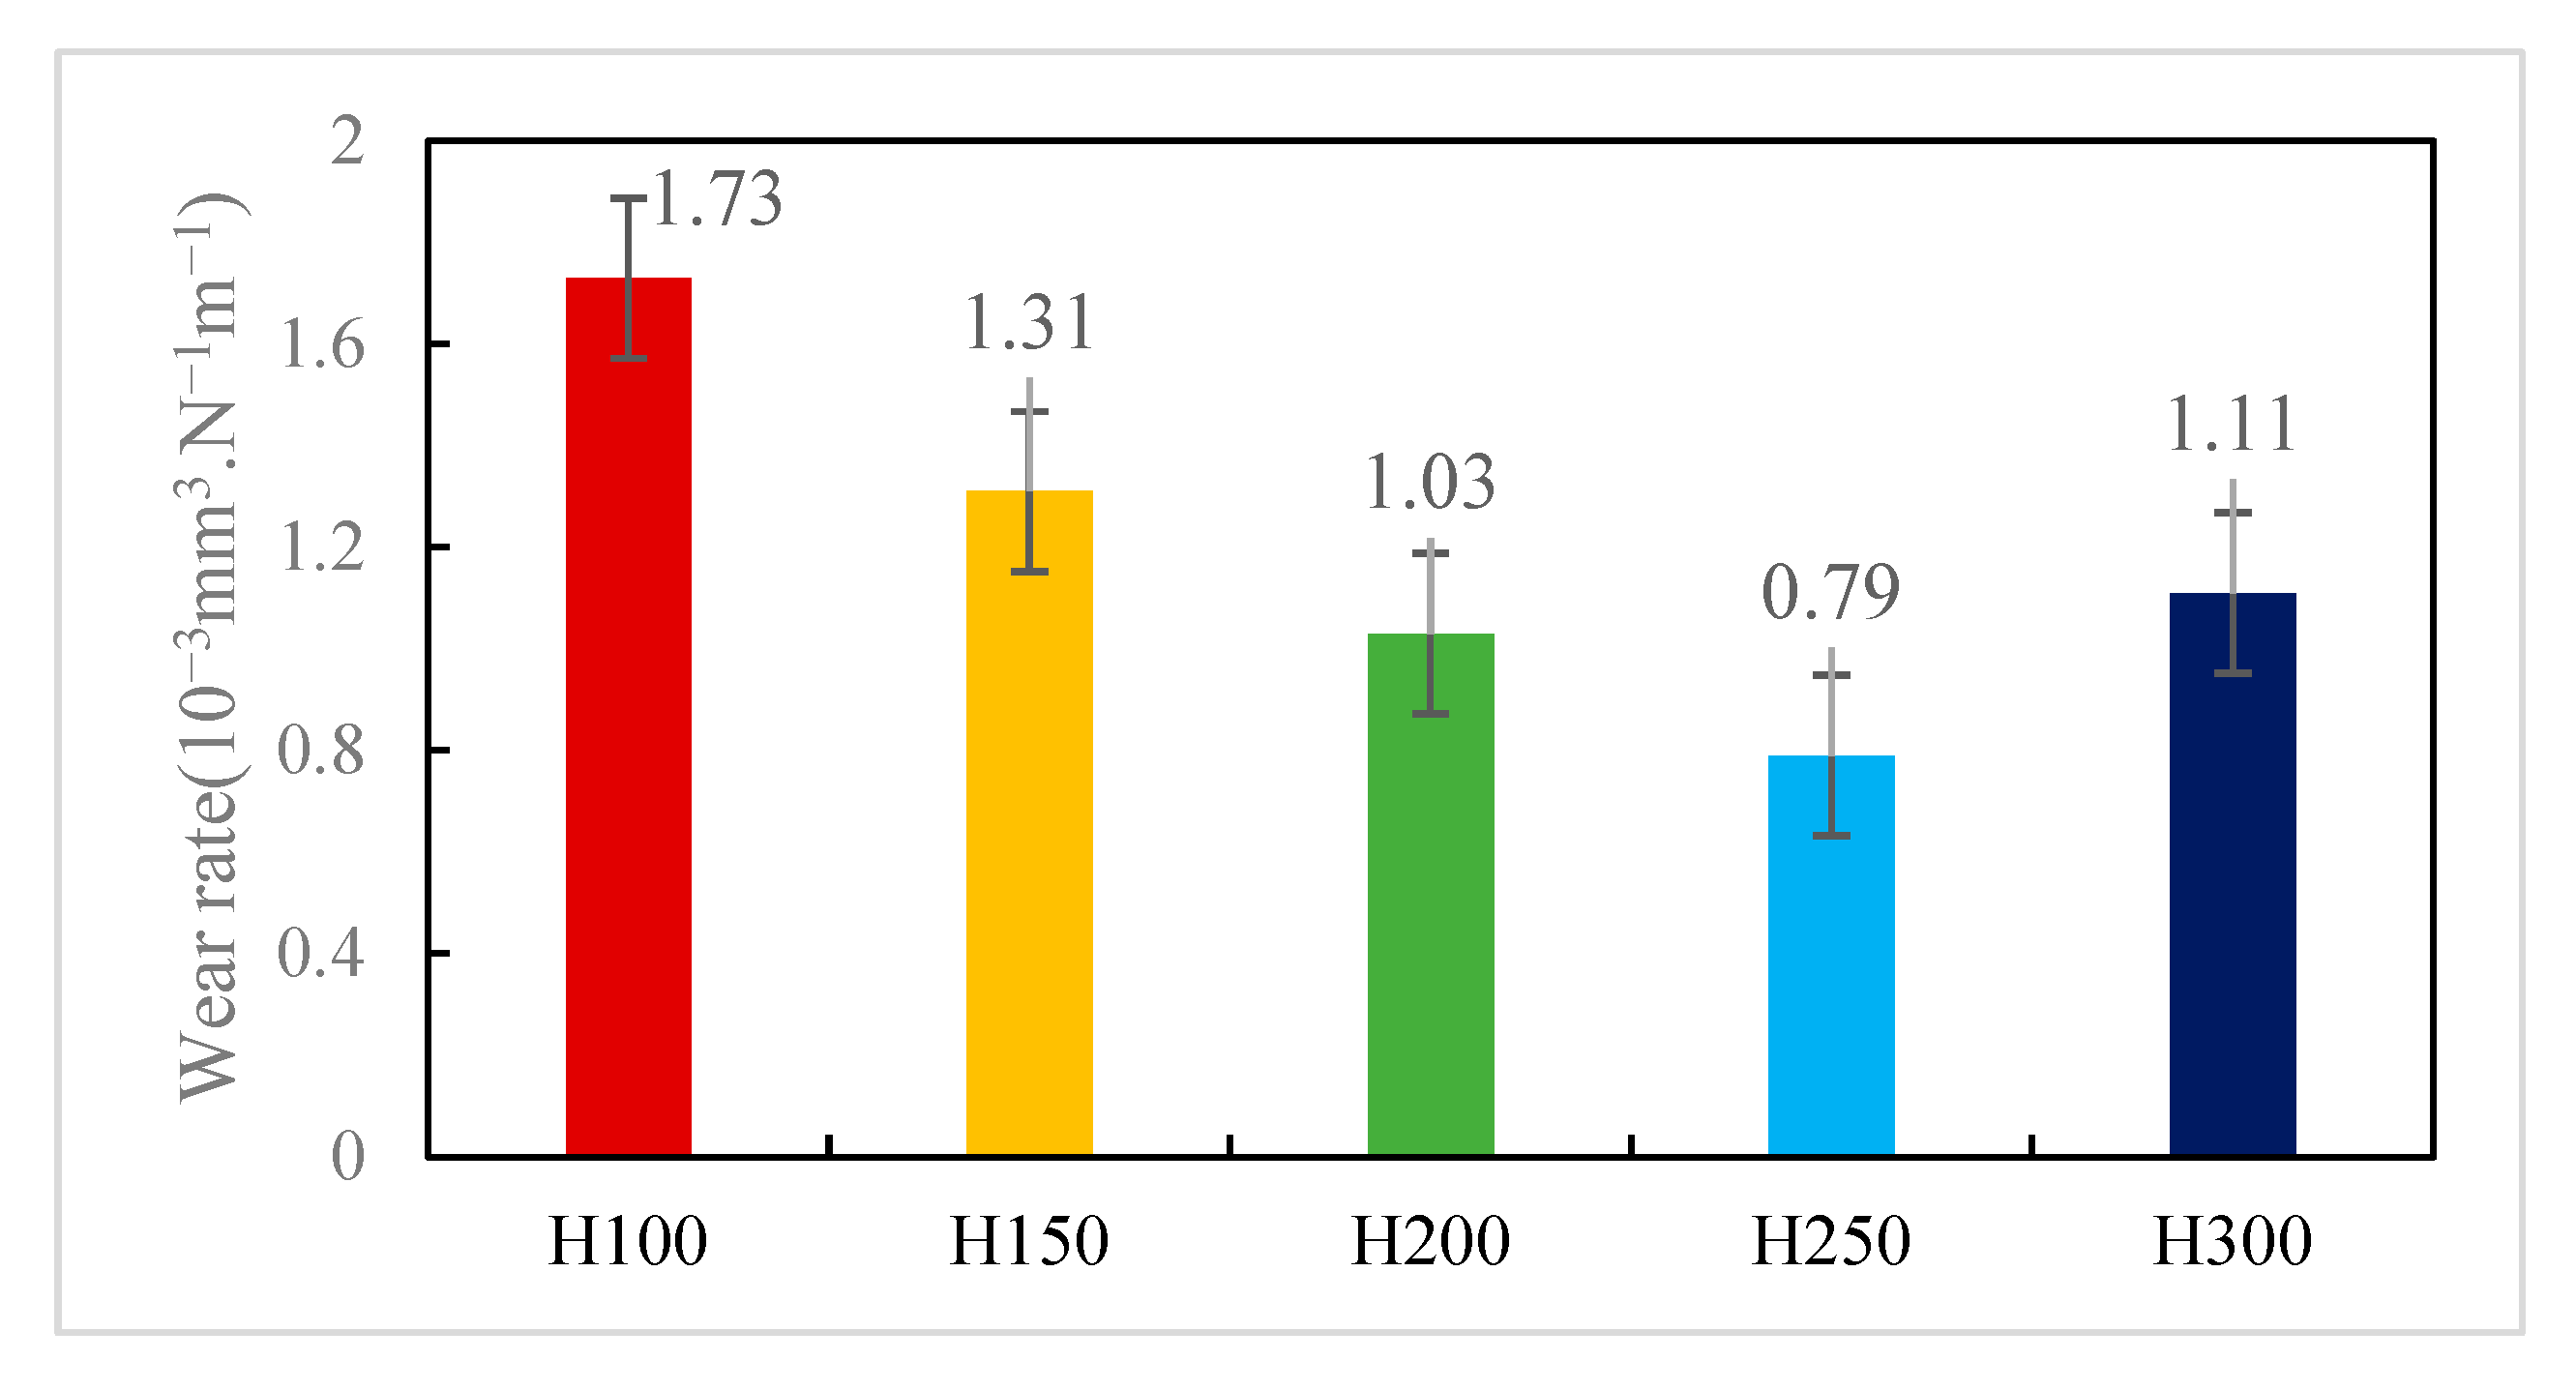
Figure 10 shows the wear rate of the five coatings. The total volume loss of the wear marks of the coatings can be calculated by vision software. The average wear rates of the five coatings are 1.73 × 10⁻³, 1.31 × 10⁻³, 1.03 × 10⁻³, 0.79 × 10⁻³, and 1.11 × 10⁻³ mm3 · N−1 · m−1, respectively. Coating H100 has the highest wear rate and the worst wear resistance, while coating H250 has the lowest wear rate and shows good wear resistance. According to the previous comprehensive analysis of density, hardness, and porosity, the wear rate of the coating is affected by density, hardness, and porosity.

Figure 10.
Wear Rate of Coating.
3.5. Coating Phase Analysis
The superposition of the scattering intensity of each atom forms the diffraction intensity in XRD. For elements present in relatively low concentrations, only a small number of atoms within each unit cell participate in forming the crystal structure, leading to weaker diffraction peaks [25]. The composition of the 1Cr18Ni9Ti and Monel wires is relatively complex, resulting in various compounds forming in the coating. In the phase analysis of the coating, some phases with weak diffraction intensity were excluded. Qualitative analysis of the phases in the sprayed coating was conducted using XRD. The five groups of sprayed samples were prepared with the same wire material and identical spraying parameters, with only the spraying distance being adjusted. XRD analysis showed that the surface composition of the sprayed samples was essentially the same, as shown in Figure 11.
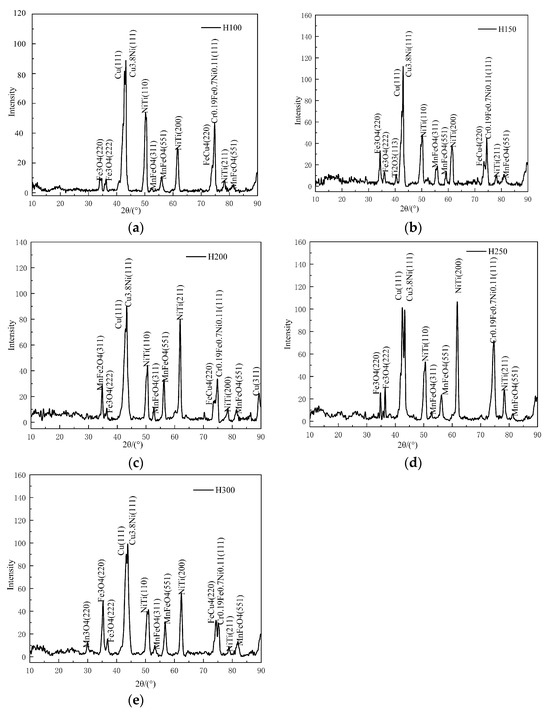
Figure 11.
XRD Pattern of Sprayed Coatings. (a) Spray distance 100 mm; (b) Spray distance 150 mm; (c) Spray distance 200 mm; (d) Spray distance 250 mm; (e) Spray distance 300 mm.
The two spray wires contain higher concentrations of Fe and Ni. XRD spectrum analysis revealed that Fe forms multiple compounds, including Fe3O4, MnFeO4, and Cr0.19Fe0.7Ni0.11. Ni is present in compounds such as Cu3.8Ni and Ni-Ti. Fe is chemically active during spraying in the high-temperature molten state and effortlessly combines with oxygen to form oxides. Ti has multiple crystal structures, including body-centered cubic, hexagonal close-packed, and face-centered cubic structures. Ti strongly bonds with Ni, Cr, and Fe, forming stable intermetallic compounds. These compounds have high melting points and hardness, improving the physical properties of the alloy [26]. At around 882 °C, Ti’s body-centered cubic and hexagonal close-packed structures are relatively stable. However, in the molten state at high temperatures, the stability of Ti’s crystal structure decreases significantly, and it easily forms intermetallic compounds with various elements. Ni-Ti compounds were observed in all coatings at diffraction angles of 50°, 62°, and 78°. Although Ti content is relatively low in the spray wire materials, its strong bonding ability with Ni in the molten state leads to the formation of Ni-Ti compounds, which exhibit high diffraction peak intensity in the phase analysis.
When the diffraction angle was 43°, all five sprayed coatings showed double diffraction peaks. Especially at a spraying distance of 250 mm, clear double diffraction peaks were formed. In the state of high-temperature melting, the metal grains undergo the cyclic transformation process of remelting and recrystallization, which promotes the redistribution and structural reorganization of elements. In this process, Cu reacts with Ni to form Cu3.8Ni. The formation of Cu3.8Ni is closely related to the almost unlimited dissolution characteristics of Cu in the grain. Cu can dissolve almost unlimitedly in the Ni lattice, usually forming a face-centered cubic solid solution with Ni, indicating that Cu3.8Ni has a face-centered cubic structure [27]. This stable alloy phase significantly improves the friction performance of the material. During friction, copper tends to be evenly distributed and slightly enriched in the grain boundary regions [28]. It helps to form a natural lubricating film, effectively reducing the friction coefficient at the interface. Thus, Cu3.8Ni not only plays a crucial role in improving the microstructure of the coating but also effectively reduces the friction coefficient and wear rate. Cu3.8Ni enhances the wear resistance of the coating.
At a diffraction angle of 74° the spraying distance was 250 mm and no double diffraction peaks were observed, but at other spraying distances, double diffraction peaks appeared. Due to the similar atomic radii and electronegativity of Fe, Ni, and Cr [29], Fe and Cr have relatively high solubility in Ni. These three elements’ physical properties and interactions are crucial for forming specific solid solutions and compounds. Cr significantly enhances the alloy’s corrosion resistance and thermal stability, Fe contributes to toughness, and Ni provides good wettability and corrosion resistance. The interactions and equilibrium among these elements in the molten state determine the final phase structure and distribution. During the spraying process, the short-circuiting of the metal wire generates intense thermal energy, causing the metal droplets to melt rapidly and bond closely with the substrate surface. The high Cr, Fe, and Ni concentrations in the spray wires diffuse, dissolve, and recombine to form new alloy phases. The high-speed airflow facilitates rapid cooling of the sprayed coating, promoting the formation of refined grains and reducing phase segregation [30]. This promotes the generation of complex, wear-resistant phases. A certain amount of Cr, Fe, and Ni compounds were detected in the XRD spectrum, forming cr0.19fe0.7ni0.11 phase. [31]. The supersaturation and precipitation of Cr, Fe, and Ni elements form this phase. Cr, Fe, and Ni atoms rearrange and crystallize in specific proportions, forming a stable Cr0.19Fe0.7Ni0.11 solid solution structure. The presence of Cr0.19Fe0.7Ni0.11 significantly increases the microhardness of the coating, which helps the coating resist wear and effectively reduces wear volume.
3.6. Coating Acid Corrosion Resistance Test
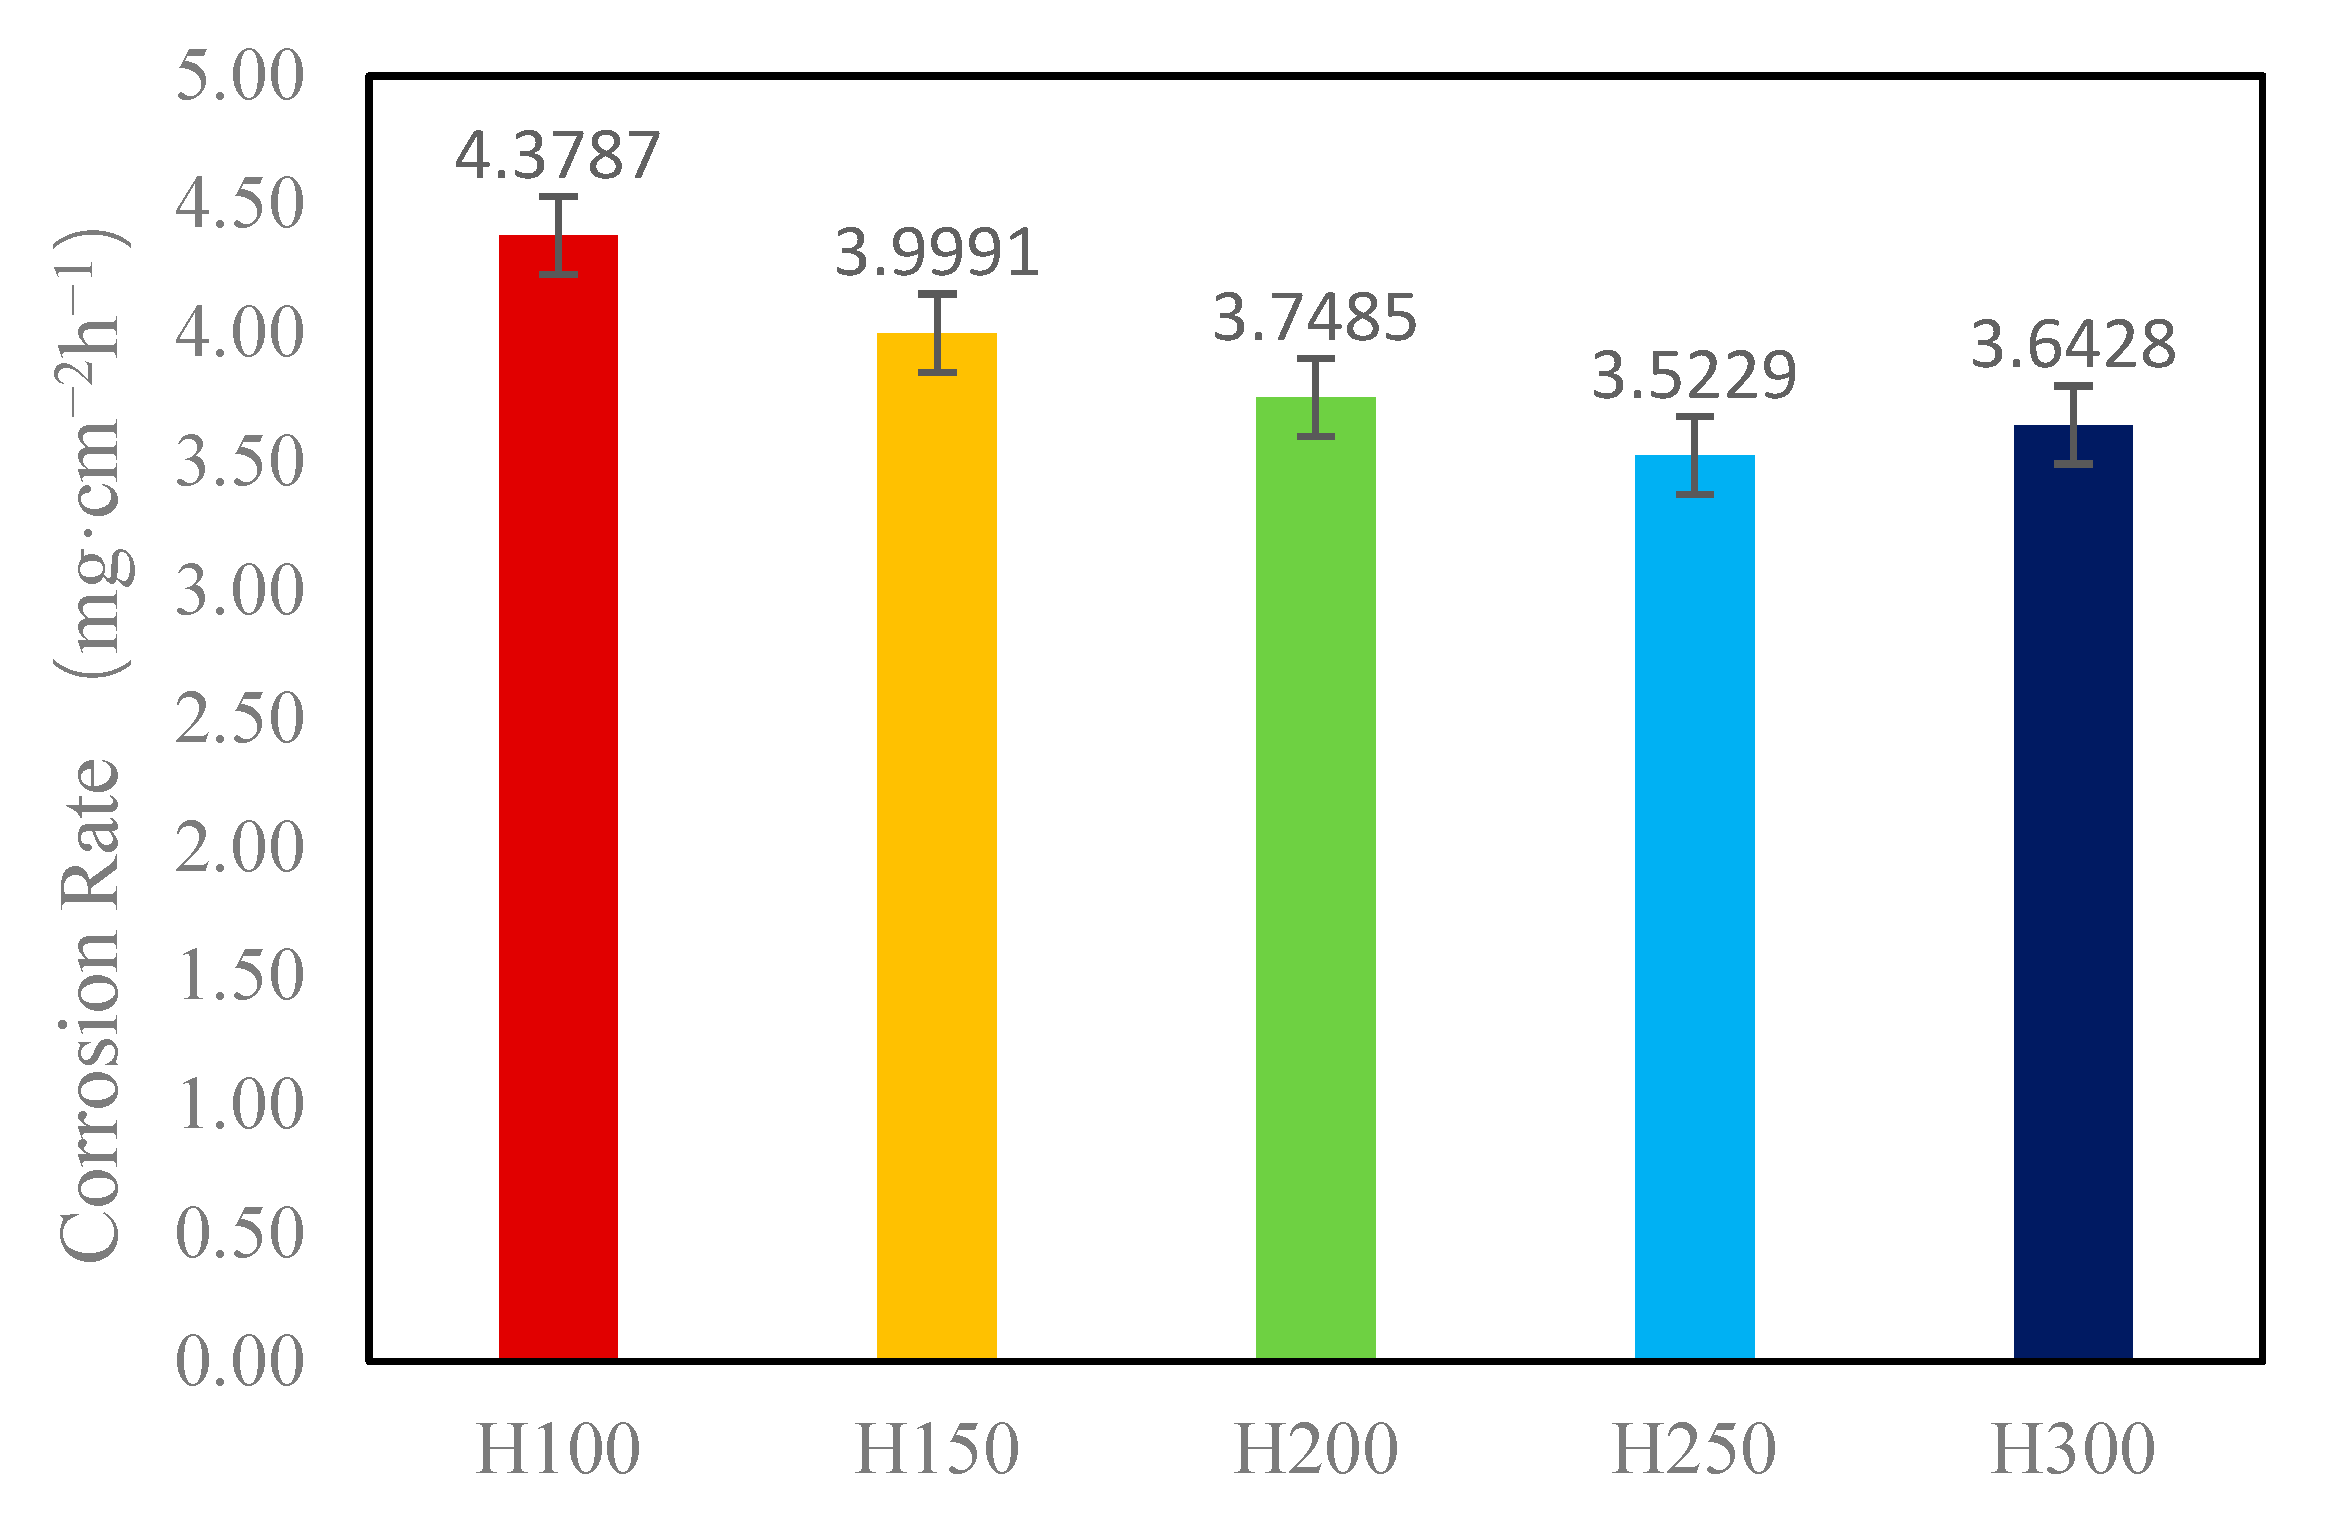
Figure 12 shows the corrosion rate of arc-sprayed coatings at five different spraying distances. The coatings were immersed in a 5% sulfuric acid solution. The main components of these sprayed samples include Fe, Cu, and Ni alloys. According to the corrosion performance tests of Ni-Cu alloys in air reported in the literature [32], nickel-copper alloys exhibit the fastest corrosion rate in a 5% sulfuric acid solution. The surface of the coatings primarily consists of Fe, Cu, and Ni compounds, and when reacting with 5% sulfuric acid, the oxide phases on the surface react first. The sample with a spraying distance of 100 mm had the fastest corrosion rate of 4.3787 mg·cm−2·h−1, while the sample with a spraying distance of 250 mm had the slowest corrosion rate of 3.5229 mg·cm−2·h−1.
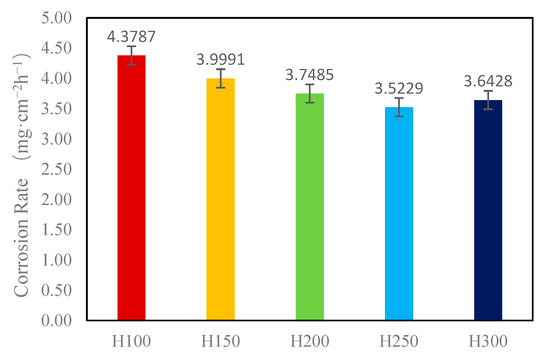
Figure 12.
Corrosion Rate of Sprayed Coatings.
The arc spraying process involves molten particles stacking through high-speed airflow to form the coating. During the stacking process, pores are on and within the coating, reducing the coating’s wear and corrosion resistance [33]. SEM observations revealed the presence of significant pores within the arc-sprayed coatings. These pores significantly reduce the density and hardness of the alloy. Furthermore, the presence of pores increases the contact area between the sprayed surface and the acid solution, thereby accelerating the corrosion rate of the coating.
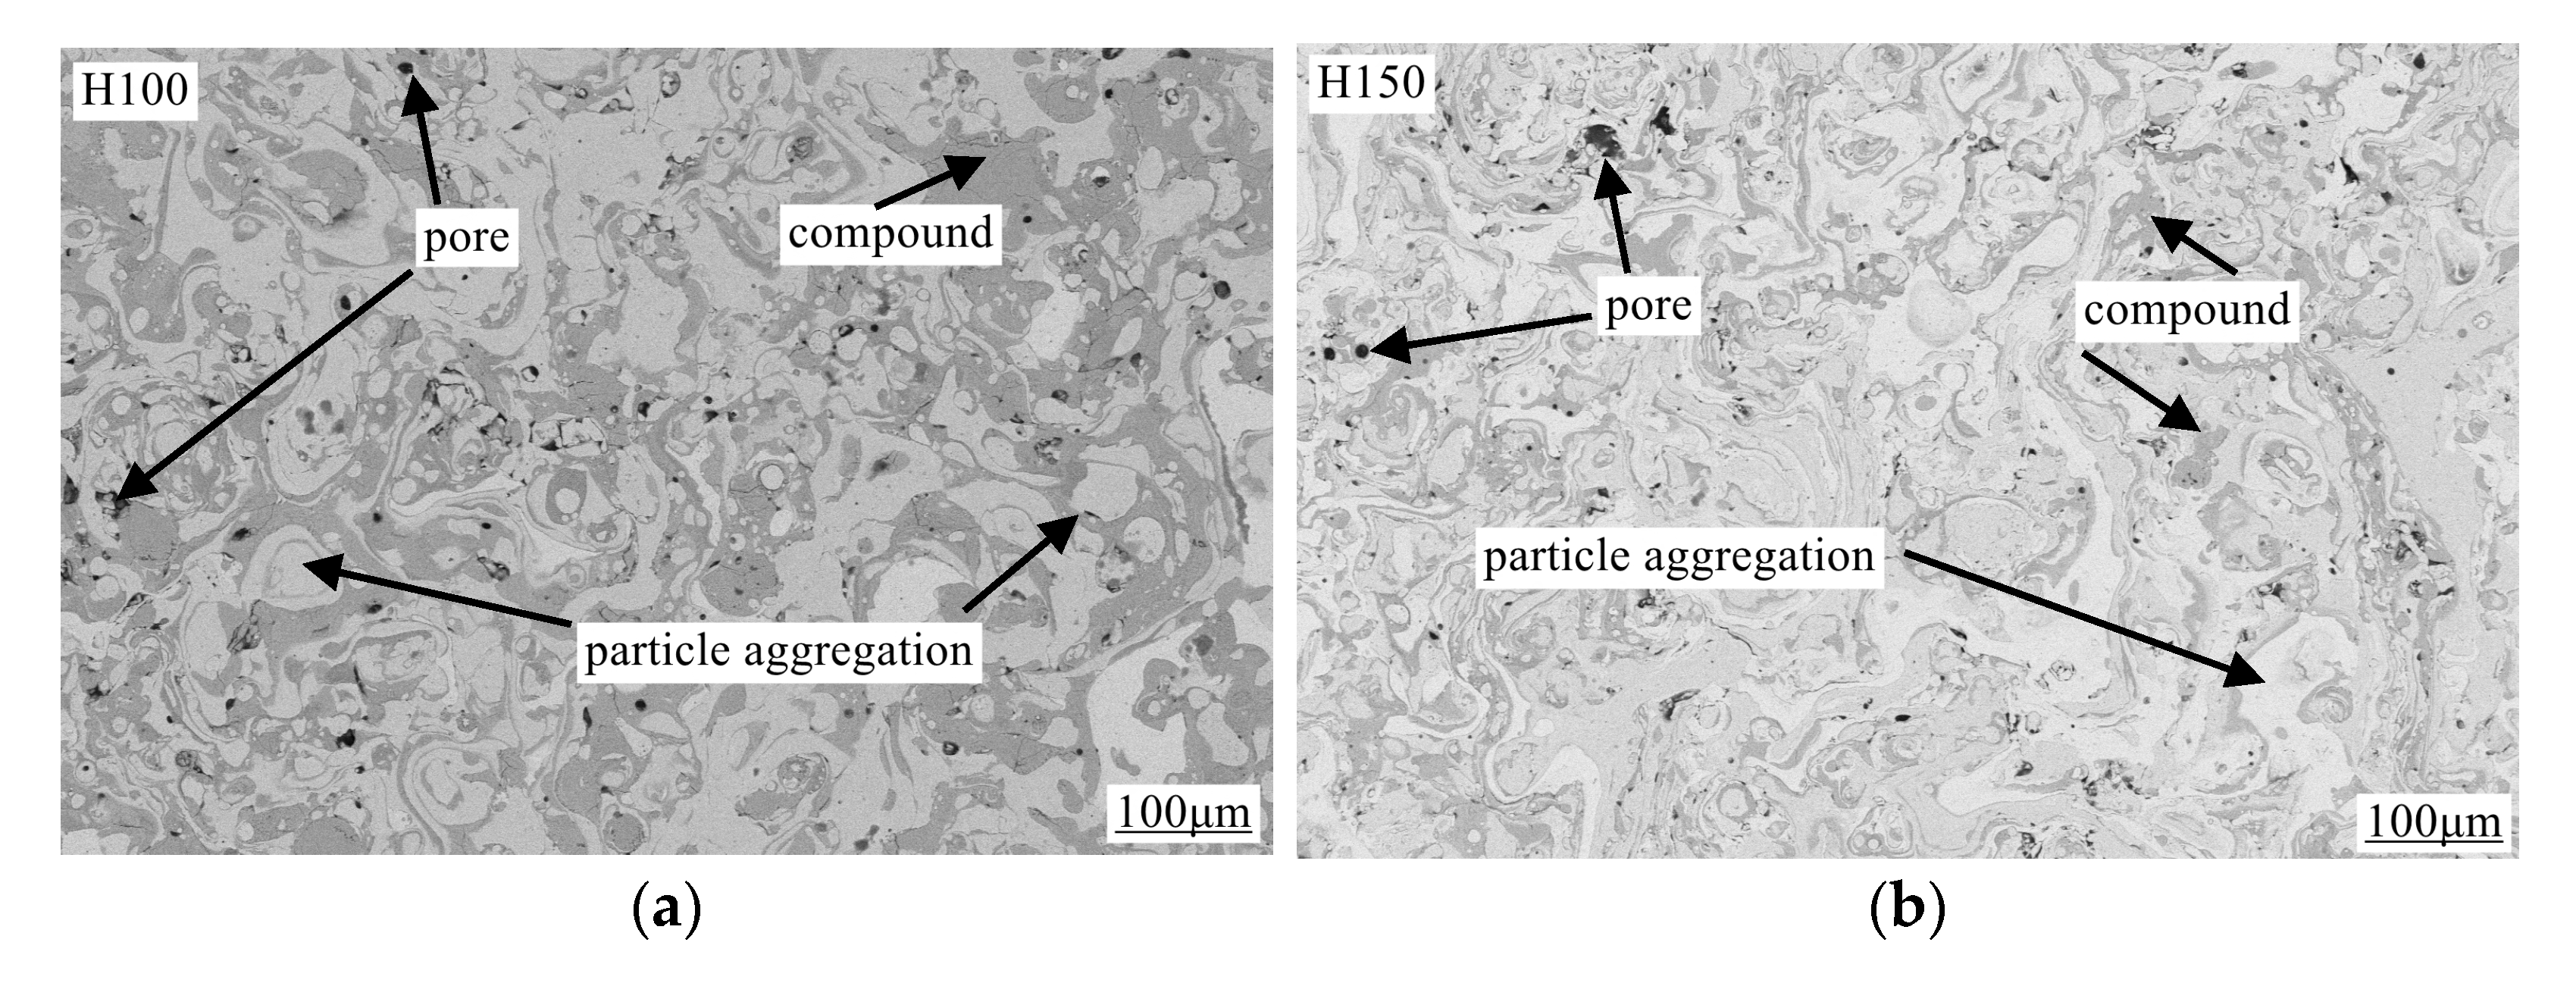
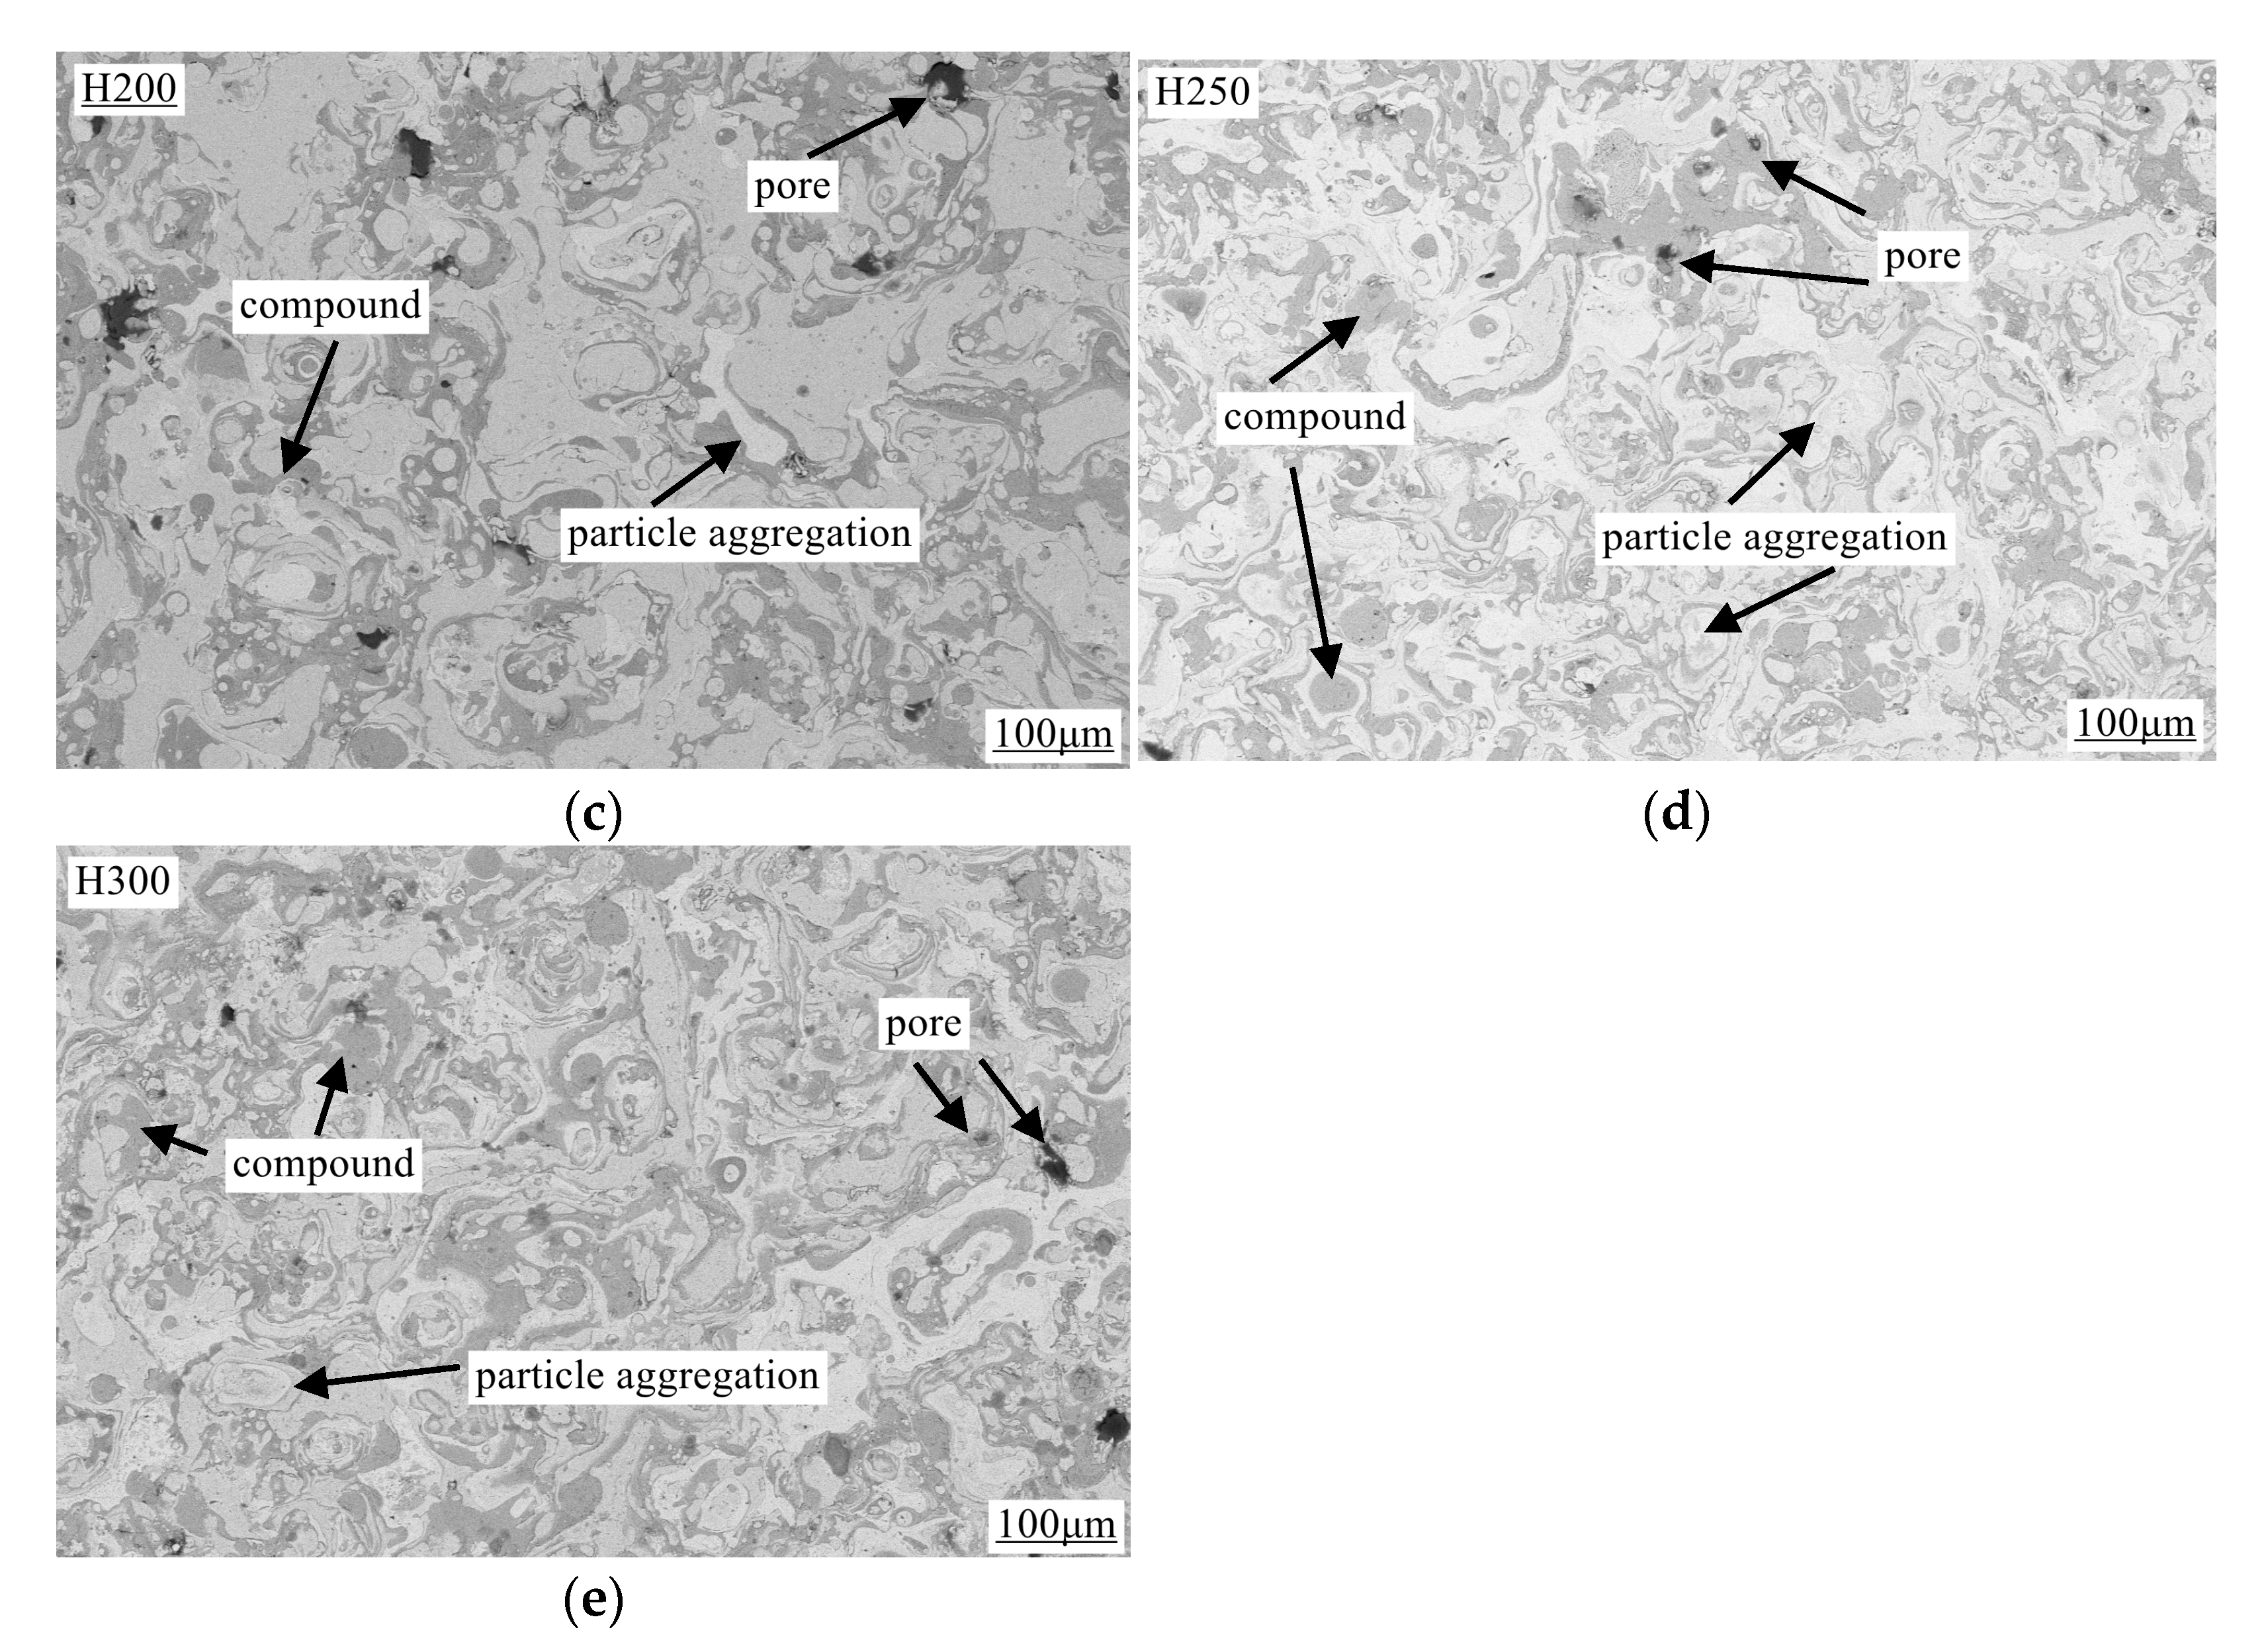
Figure 13 shows the SEM analysis of the cross-sectional surface morphology of the coating after acid etching. Significant pores, compounds, and large particle agglomeration are visible in the images. At a spraying distance of 100 mm, the images show more internal pores, and the accumulation of compounds and large particles is more pronounced and scattered. As the spraying distance increases to 250 mm, the internal pores are significantly reduced, the diameter of the large particles becomes smaller, and the distribution is more uniform. The distribution of the compounds also appears more consistent.
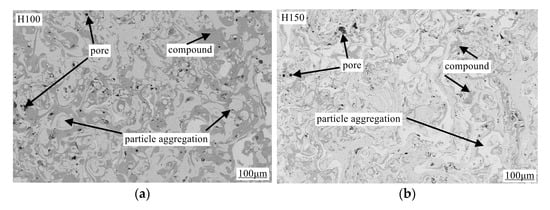
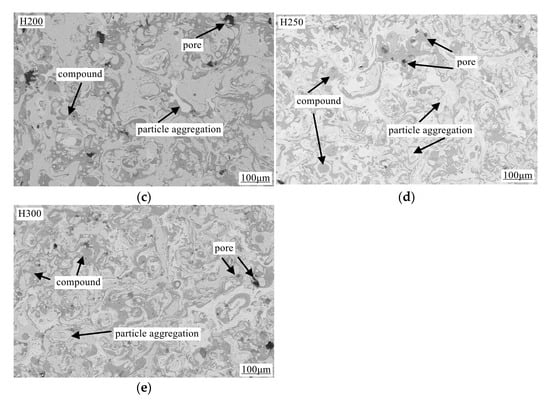
Figure 13.
Surface Morphology of Sprayed Coating After Acid Etching. (a) Spray distance 100 mm; (b) Spray distance 150 mm; (c) Spray distance 200 mm; (d) Spray distance 250 mm; (e) Spray distance 300 mm.
4. Conclusions
This study used arc spraying technology to prepare 1Cr18Ni9Ti and Monel-sprayed coatings on the surface of 45# steel. The density, hardness, surface microstructure, friction, wear behavior, and corrosion resistance of the coatings sprayed at five different distances were investigated. The main conclusions are as follows:
- The surface morphology of the sprayed coatings is relatively rough, with many pores between the particles. In the phase analysis of the sprayed coatings, at a spraying distance of 250 mm and a diffraction angle of 73°, a single Cr0.19Fe0.7Ni0.11 phase alloy precipitated, which contributed to the increase in the microhardness of the coating.
- From the friction and wear behavior analysis, the friction coefficient of the sprayed coatings is closely related to the density and hardness of the coatings. When the spraying distance was 100 mm, the friction coefficient reached its maximum value of 0.7752. As the spraying distance increased to 250 mm, the friction coefficient decreased to a minimum of 0.6214. The variation curve of the friction coefficient is positively correlated with density and hardness. At a diffraction angle of 43°, Cu and Cu3.8Ni phases were observed, indicating that the composition of the coating plays an active role in reducing the friction coefficient and inhibiting wear.
- In the acidic corrosion test, at a spraying distance of 250 mm, the coating exhibited the highest density of 6.4227 g/cm3, the highest Rockwell hardness of 31.3 HRC, a porosity of 6.63%, a wear rate of 0.79 × 10⁻³ mm3·N−1·m−1, the lowest friction coefficient of 0.6214, and the lowest acidic corrosion rate of 3.5229 mg·cm−2·h−1. Coatings sprayed at other distances had more pores and lower compactness. This reduced compactness increased the contact area between the acid and the coating, accelerating the corrosion process.
Author Contributions
Conceptualization, J.Y.; Methodology, J.W. and J.Y.; Software, L.Z.; Writing—review and editing, Z.Y. All authors have read and agreed to the published version of the manuscript.
Funding
This research was funded by the Tangshan Science and Technology Bureau project “Microstructure Analysis and Performance Change Law of Nickel based Arc Spraying Anti-Corrosion Coating” (No. 131302118b).
Data Availability Statement
The data sets generated during and/or analyzed during the current study are available from the corresponding author on reasonable request.
Conflicts of Interest
Jianxin Wang is employed by the company Tangshan Talent Development Group Co., Ltd. The remaining authors declare that the research was conducted in the absence of any commercial or financial relationships that could be construed as a potential conflict of interest.
References
- Qiang, W.; Kang, M.; Liu, J.; Ndumia, J.N. Microstructure and Wear Performance of High-Velocity Arc Sprayed FeMnCrNiBNbAl Coating. Coatings 2024, 14, 428. [Google Scholar] [CrossRef]
- Li, B.; Yang, D.; Liu, Z.; He, J.; Bai, J.; Jiang, H.; Tian, Y.; Zhang, Z.; Liu, S. Fabrication, Microstructure and Corrosion Resistance of Zn/Al Composite Coating by Arc Spraying. Coatings 2023, 13, 1406. [Google Scholar] [CrossRef]
- Rakhadilov, B.; Magazov, N.; Kakimzhanov, D.; Apsezhanova, A.; Molbossynov, Y.; Kengesbekov, A. Influence of Spraying Process Parameters on the Characteristics of Steel Coatings Produced by Arc Spraying Method. Coatings 2024, 14, 1145. [Google Scholar] [CrossRef]
- Li, S.J.; Mao, D.Y.; He, Z.H.; Lu, B.; Liu, J.; Wang, Y.L.; Liu, H. Forming Performance of 1Cr18Ni9Ti Stainless Steel Laser Oscillating Welding Joints. Hot Work. Technol. 2025, 51–55, 64. [Google Scholar] [CrossRef]
- Xu, X.J.; Lin, W.Q.; Lu, H. Defect Reason on Outer Surface of 1Cr18Ni9Ti Stainless Steel Oil Return Tube. Corros. Prot. 2020, 41, 70–74. [Google Scholar]
- Wang, Y.F.; Zhao, Y.T.; Ma, H.H.; Ren, H.P. Effect of heat treatment on corrosion resistance of 1Cr18Ni9Ti and 2Cr13 steel plate welded joint. Heat Treat. Met. 2021, 46, 7–11. [Google Scholar] [CrossRef]
- Yang, Y.; Jiang, L.H.; Luo, S.H.; Hu, H.B.; Tang, T.G.; Zhang, Q.M. Effect of strain on microstructure evolution of 1Cr18Ni9Ti stainless steel during adiabatic shearing. J. Mater. Eng. Perform. 2016, 25, 29–37. [Google Scholar] [CrossRef]
- Gangloff, R.P.; Ha, H.M.; Burns, J.T.; Scully, J.R. Measurement and Modeling of Hydrogen Environment-Assisted Cracking in Monel K-500. Metall. Mater. Trans. A 2014, 45, 3814–3834. [Google Scholar] [CrossRef]
- Yang, M.H.; Li, X.W.; Sun, C.H.; Ruan, Y. Microstructure and Properties of Monel K-500 Alloy in Synergetic Modulation of Directional Solidification and Thermal Processing. Acta Metall. Sin. 2024, 61, 1–13. [Google Scholar]
- Jia, X.M.; Wang, J.; Liu, T.Y.; Zheng, H.B.; Wang, Q.Y.; Xi, Y.C.; Dong, L.J. Effect of aging temperature on microstructure and properties of Monel K500 alloy. Iron Steel Vanadium Titan. 2023, 44, 160–166. [Google Scholar] [CrossRef]
- Zhu, Y.L.; Zheng, W.J.; Song, Z.G.; Feng, H. Development and Application of Nickel-copper Alloy in China. Hot Work. Technol. 2019, 48, 23–26. [Google Scholar] [CrossRef]
- Luo, L.X.; Liu, R.Z.; Xiao, Q.; Sun, H.; Ma, Y.L.; Shi, Y.J.; Zhang, C.; Ma, X.L.; Zhang, Z. Microstructure and properties of Zn–Al–Ni–Cu composite coating prepared by arc spraying. Electroplat. Finish. 2023, 42, 27–36. [Google Scholar] [CrossRef]
- Ge, Y.; Tan, P.; Li, Z.F.; Wang, J.Y.; Wang, Q.B.; Yang, B.J. Study on mechanical properties of Monel porous plate. Powder Metall. Ind. 2017, 27, 34–38. [Google Scholar] [CrossRef]
- Siddiqui, A.A.; Dubey, A.K. Recent trends in laser cladding and surface alloying. Opt. Laser Technol. 2021, 134, 106619. [Google Scholar] [CrossRef]
- Cheng, E.C.; Liu, J.; Zhang, J.; Wang, T.X.; Liu, L.H.; Li, Y.F. Microstructure and friction and wear properties of laser cladding Fe-Cr-Ni alloy layer. Trans. Mater. Heat Treat. 2022, 43, 143–152. [Google Scholar] [CrossRef]
- Yang, X.T.; Zhou, J.; Wang, X.H.; Wei, H.L.; Zeng, R.; Yang, Q.B.; Li, W.S. Effect of Cu Content on Microstructure and Tribological Properties of Ni-Based Directional Structure Alloy Coatings. Rare Met. Mater. Eng. 2022, 51, 1420–1426. [Google Scholar]
- Zhang, H.Y.; Wang, F.R.; Du, S.M.; Zeng, Z.X.; Cai, H.; Liu, E.Y. Effect of Ni Element on Microstructure and Tribological Properties of Plasma Sprayed Iron-Based Coatings. Min. Metall. Eng. 2021, 41, 150–155. [Google Scholar]
- Elttayef, A.K.; Abass, L.N.; Abd Al-Latif, L.G. Improvement mechanical properties of Inconel and Monel alloys synthesis by laser coating. Opt. Laser Technol. 2019, 109, 49–54. [Google Scholar] [CrossRef]
- Krelling, A.P.; Melo, F.S.; Almeida, E.A.S.; da Costa, C.E.; Milan, J.C.G. Microstructure and properties of borided Monel 400 alloy. Mater. Res. Express 2019, 6, 106410. [Google Scholar] [CrossRef]
- Kostryzhev, A.G.; Marenych, O.O.; Pan, Z.; Li, H.; van Duin, S. Strengthening mechanisms in Monel K500 alloyed with Al and Ti. J. Mater. Sci. 2023, 58, 4150–4164. [Google Scholar] [CrossRef]
- Wang, K.; Qi, H.; Ma, S.; Wang, L.; He, N.; Li, F. Effect of Nickel Addition on Solidification Microstructure and Tensile Properties of Cast 7075 Aluminum Alloy. Crystals 2023, 13, 1589. [Google Scholar] [CrossRef]
- Karlina, A.I.; Karlina, Y.I.; Kondratiev, V.V.; Kononenko, R.V.; Breki, A.D. Study of Wear of an Alloyed Layer with Chromium Carbide Particles After Plasma Melting. Crystals 2023, 13, 1696. [Google Scholar] [CrossRef]
- Wu, S.; Ning, Y.; Xie, H.; Tian, H.; Lv, J.; Liu, B. Study on the galvanic corrosion behavior of copper-nickel/titanium alloys under simulated seawater environment. J. Solid. State Electrochem. 2024, 28, 2315–2329. [Google Scholar] [CrossRef]
- Wielage, B.; Pokhmurska, H.; Student, M.; Gvozdeckii, V.; Stupnyckyj, T.; Pokhmurskii, V. Iron-Based Coatings Arc-Sprayed with Cored Wires for Applications at Elevated Temperatures. Surf. Coat. Technol. 2013, 220, 27–35. [Google Scholar] [CrossRef]
- Zeng, J.; Li, K.J.; LÜ, J.J.; Zhao, J.; Liu, Q.; He, Q.B. Effect of solution and two-stage aging on microstructure and hardness of Cu-containing nickel-based alloys. Trans. Mater. Heat Treat. 2024, 45, 113–122. [Google Scholar] [CrossRef]
- Liu, J.; Li, J.; Yang, H.L.; Ruan, J.M. Microstructure of titanium-nickel alloy by mechanical alloying. J. Cent. South Univ. (Sci. Technol.) 2015, 46, 1202–1207. [Google Scholar]
- Liu, X.Z.; Shen, Q.W.; Liu, X.Z.; Chen, J.; Zhu, L.W.; Qi, J. Effect of Heat Treatment Temperature on the Spectral Properties of Cu-Ni Coating. Spectrosc. Spectr. Anal. 2015, 35, 1094–1098. [Google Scholar]
- Yang, X.; Wang, X.; Zhou, J.; Wei, H.; Zeng, R.; Li, W. Effect of Cu addition on the microstructure and tribological performance of Ni60 directional structure coating. Int. J. Miner. Metall. Mater. 2023, 30, 715–723. [Google Scholar] [CrossRef]
- Yao, K.; Liu, Z.D.; Liu, Q.B. Effect of Laser Power on Microstructure and Properties of Ni-Based Alloy Coatings on 30CrMnSiA Steel. J. Therm. Spray Technol. 2022, 31, 2136–2146. [Google Scholar] [CrossRef]
- Zhao, Y.; Chen, Y.; Zhang, T.; Yu, T. Laser fabricated nickel-based coating with different overlap modes. Mater. Manuf. Process. 2021, 36, 1618–1630. [Google Scholar] [CrossRef]
- Zhao, Y.; Guan, C.; Chen, L.; Sun, J.; Yu, T. Effect of process parameters on the cladding track geometry fabricated by laser cladding. Optik 2020, 223, 165447. [Google Scholar] [CrossRef]
- Lu, S.Y. Super Stainless Steel and High Nickel Corrosion Resistant Alloys; Chemical Industry Press: Beijing, China, 2012; p. 355. [Google Scholar]
- Wang, H.Z.; Zhou, X.Y.; Liu, M.; Jia, L.; Huang, Y.F.; Wang, H.D. Research Progress of the Sealant Decreased Thermal Spray Coating Porosity. Mater. Rep. 2023, 37, 210–228. [Google Scholar]


Disclaimer/Publisher’s Note: The statements, opinions and data contained in all publications are solely those of the individual author(s) and contributor(s) and not of MDPI and/or the editor(s). MDPI and/or the editor(s) disclaim responsibility for any injury to people or property resulting from any ideas, methods, instructions or products referred to in the content. |
© 2025 by the authors. Licensee MDPI, Basel, Switzerland. This article is an open access article distributed under the terms and conditions of the Creative Commons Attribution (CC BY) license (https://creativecommons.org/licenses/by/4.0/).