
Compositional Design, Microstructure, and Thermal Processing of Aluminum-Based Complex Concentrated Alloys

 , ,
, ,  ,
, 
Abstract
1. Introduction
2. Materials and Methods
- Widely available components in the Greek metallurgical industry.
- Does not significantly increase the specific weight of the alloy.
- Provides positive properties to the alloy for its final application.
3. Results
3.1. Thermo-Physical Parameters for Phase Formation in HEAs/CCAs
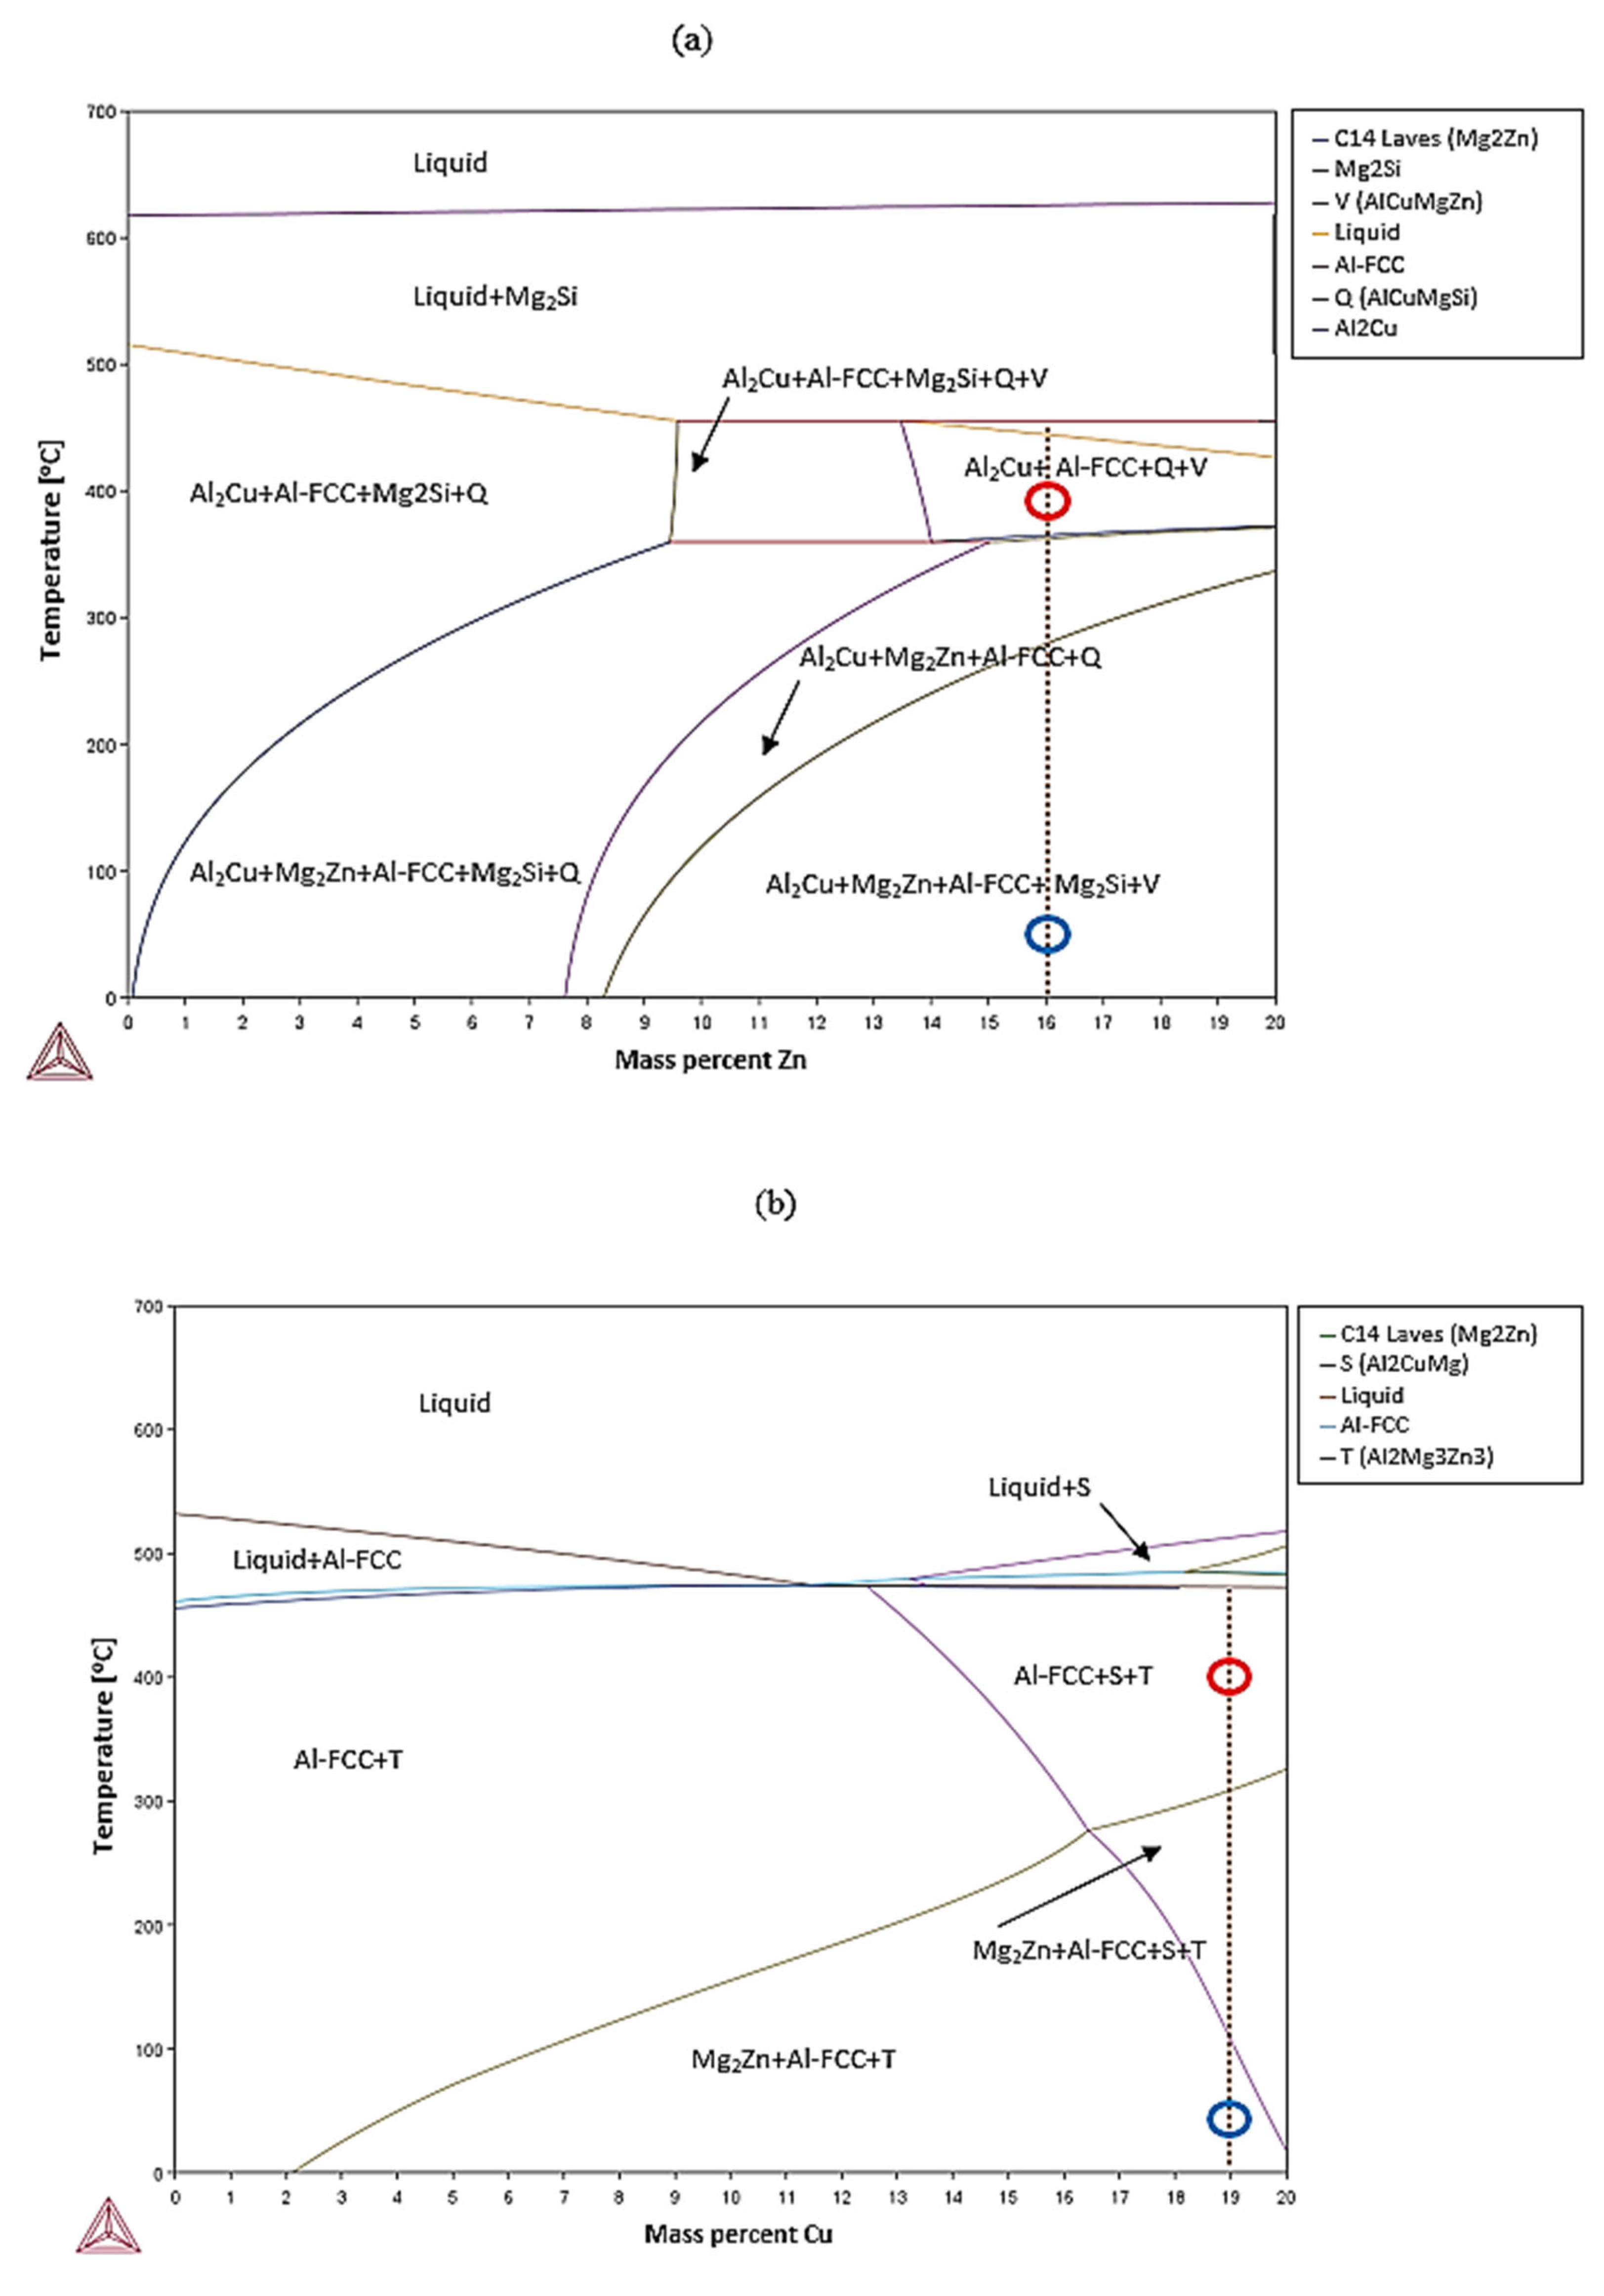
3.2. CALPHAD Methodology and Equilibrium Phase Diagrams
3.3. Microstructural Characterization
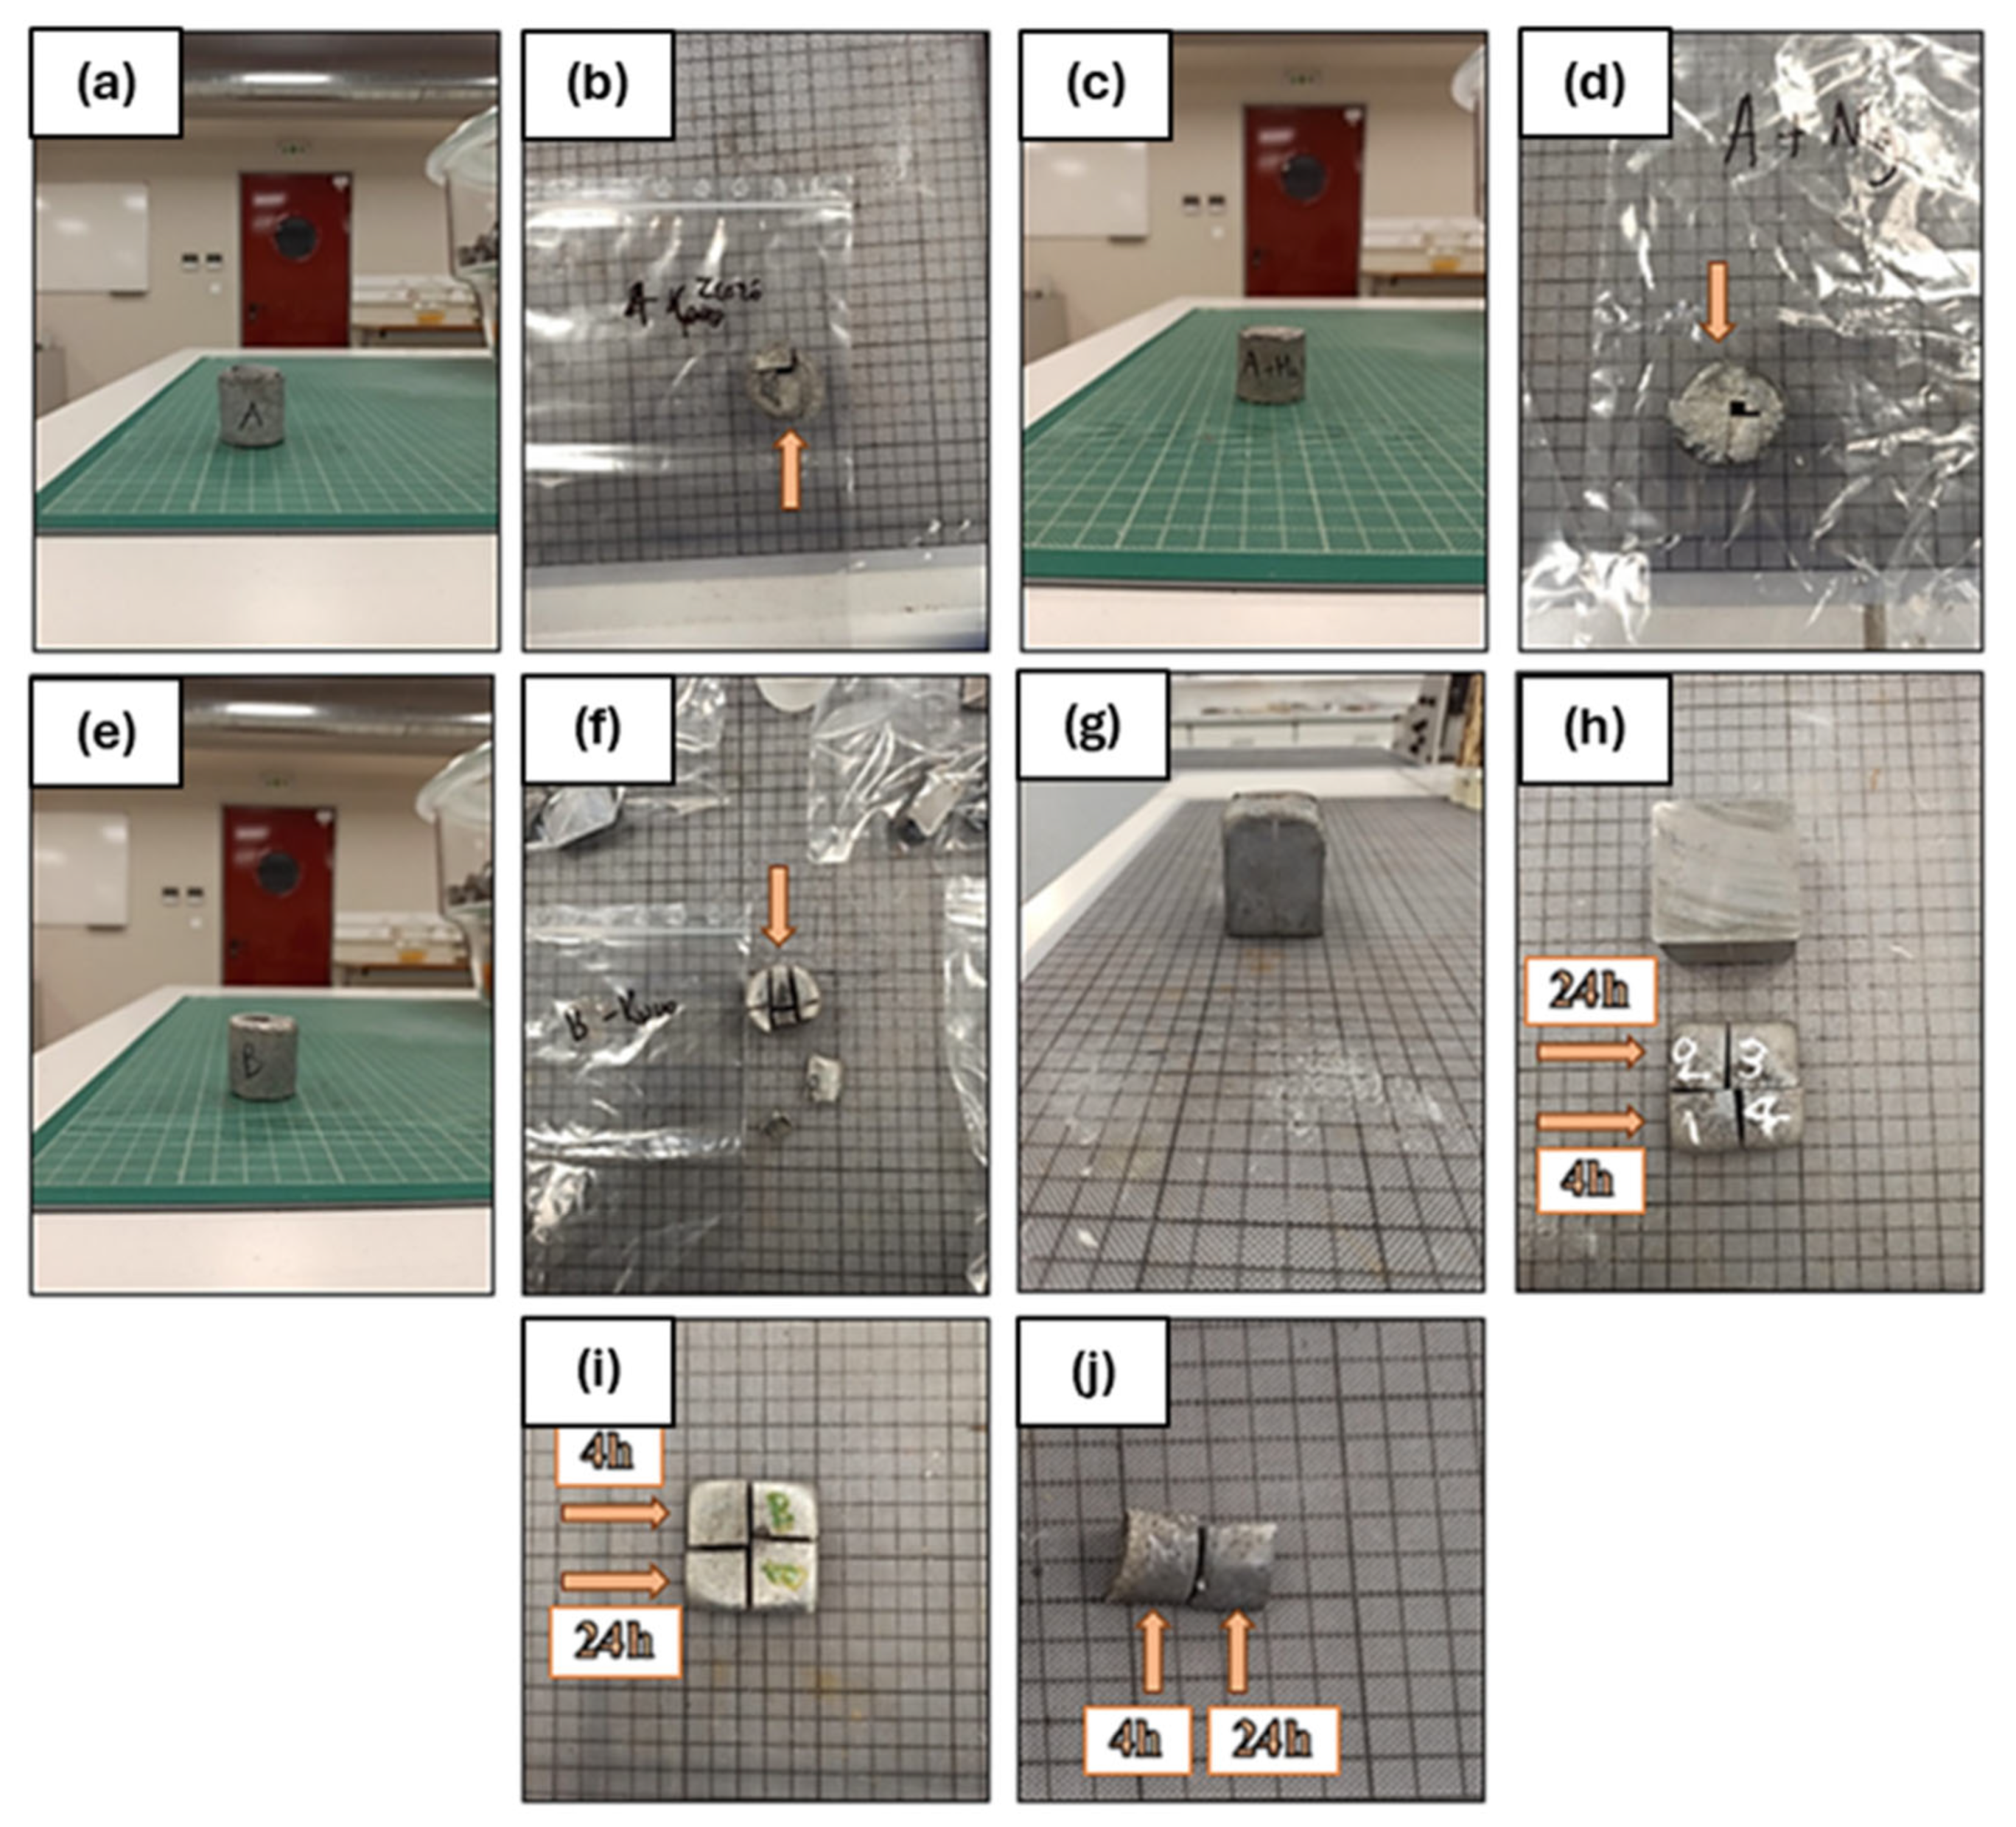
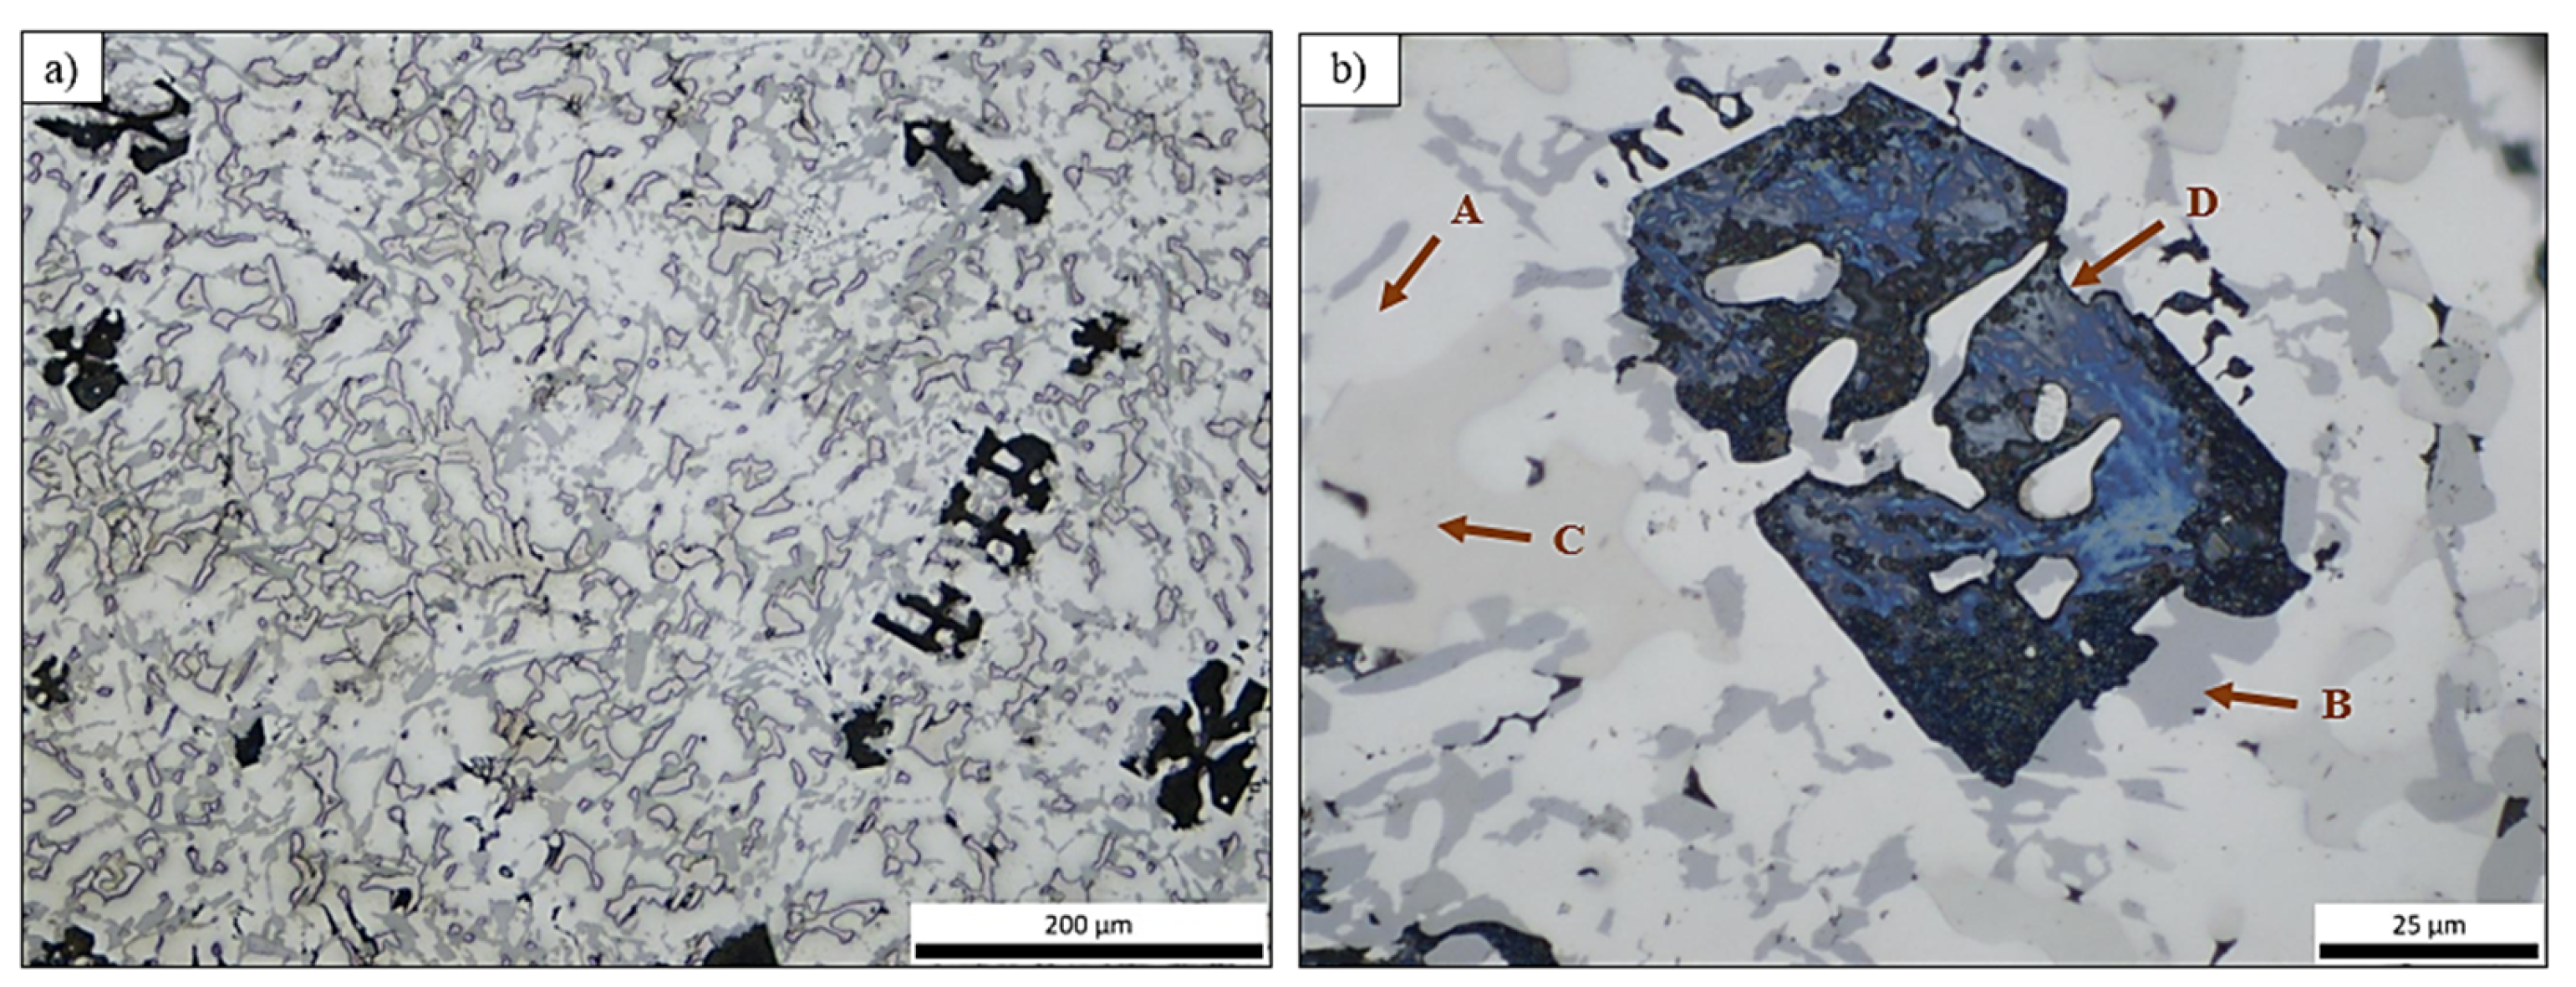
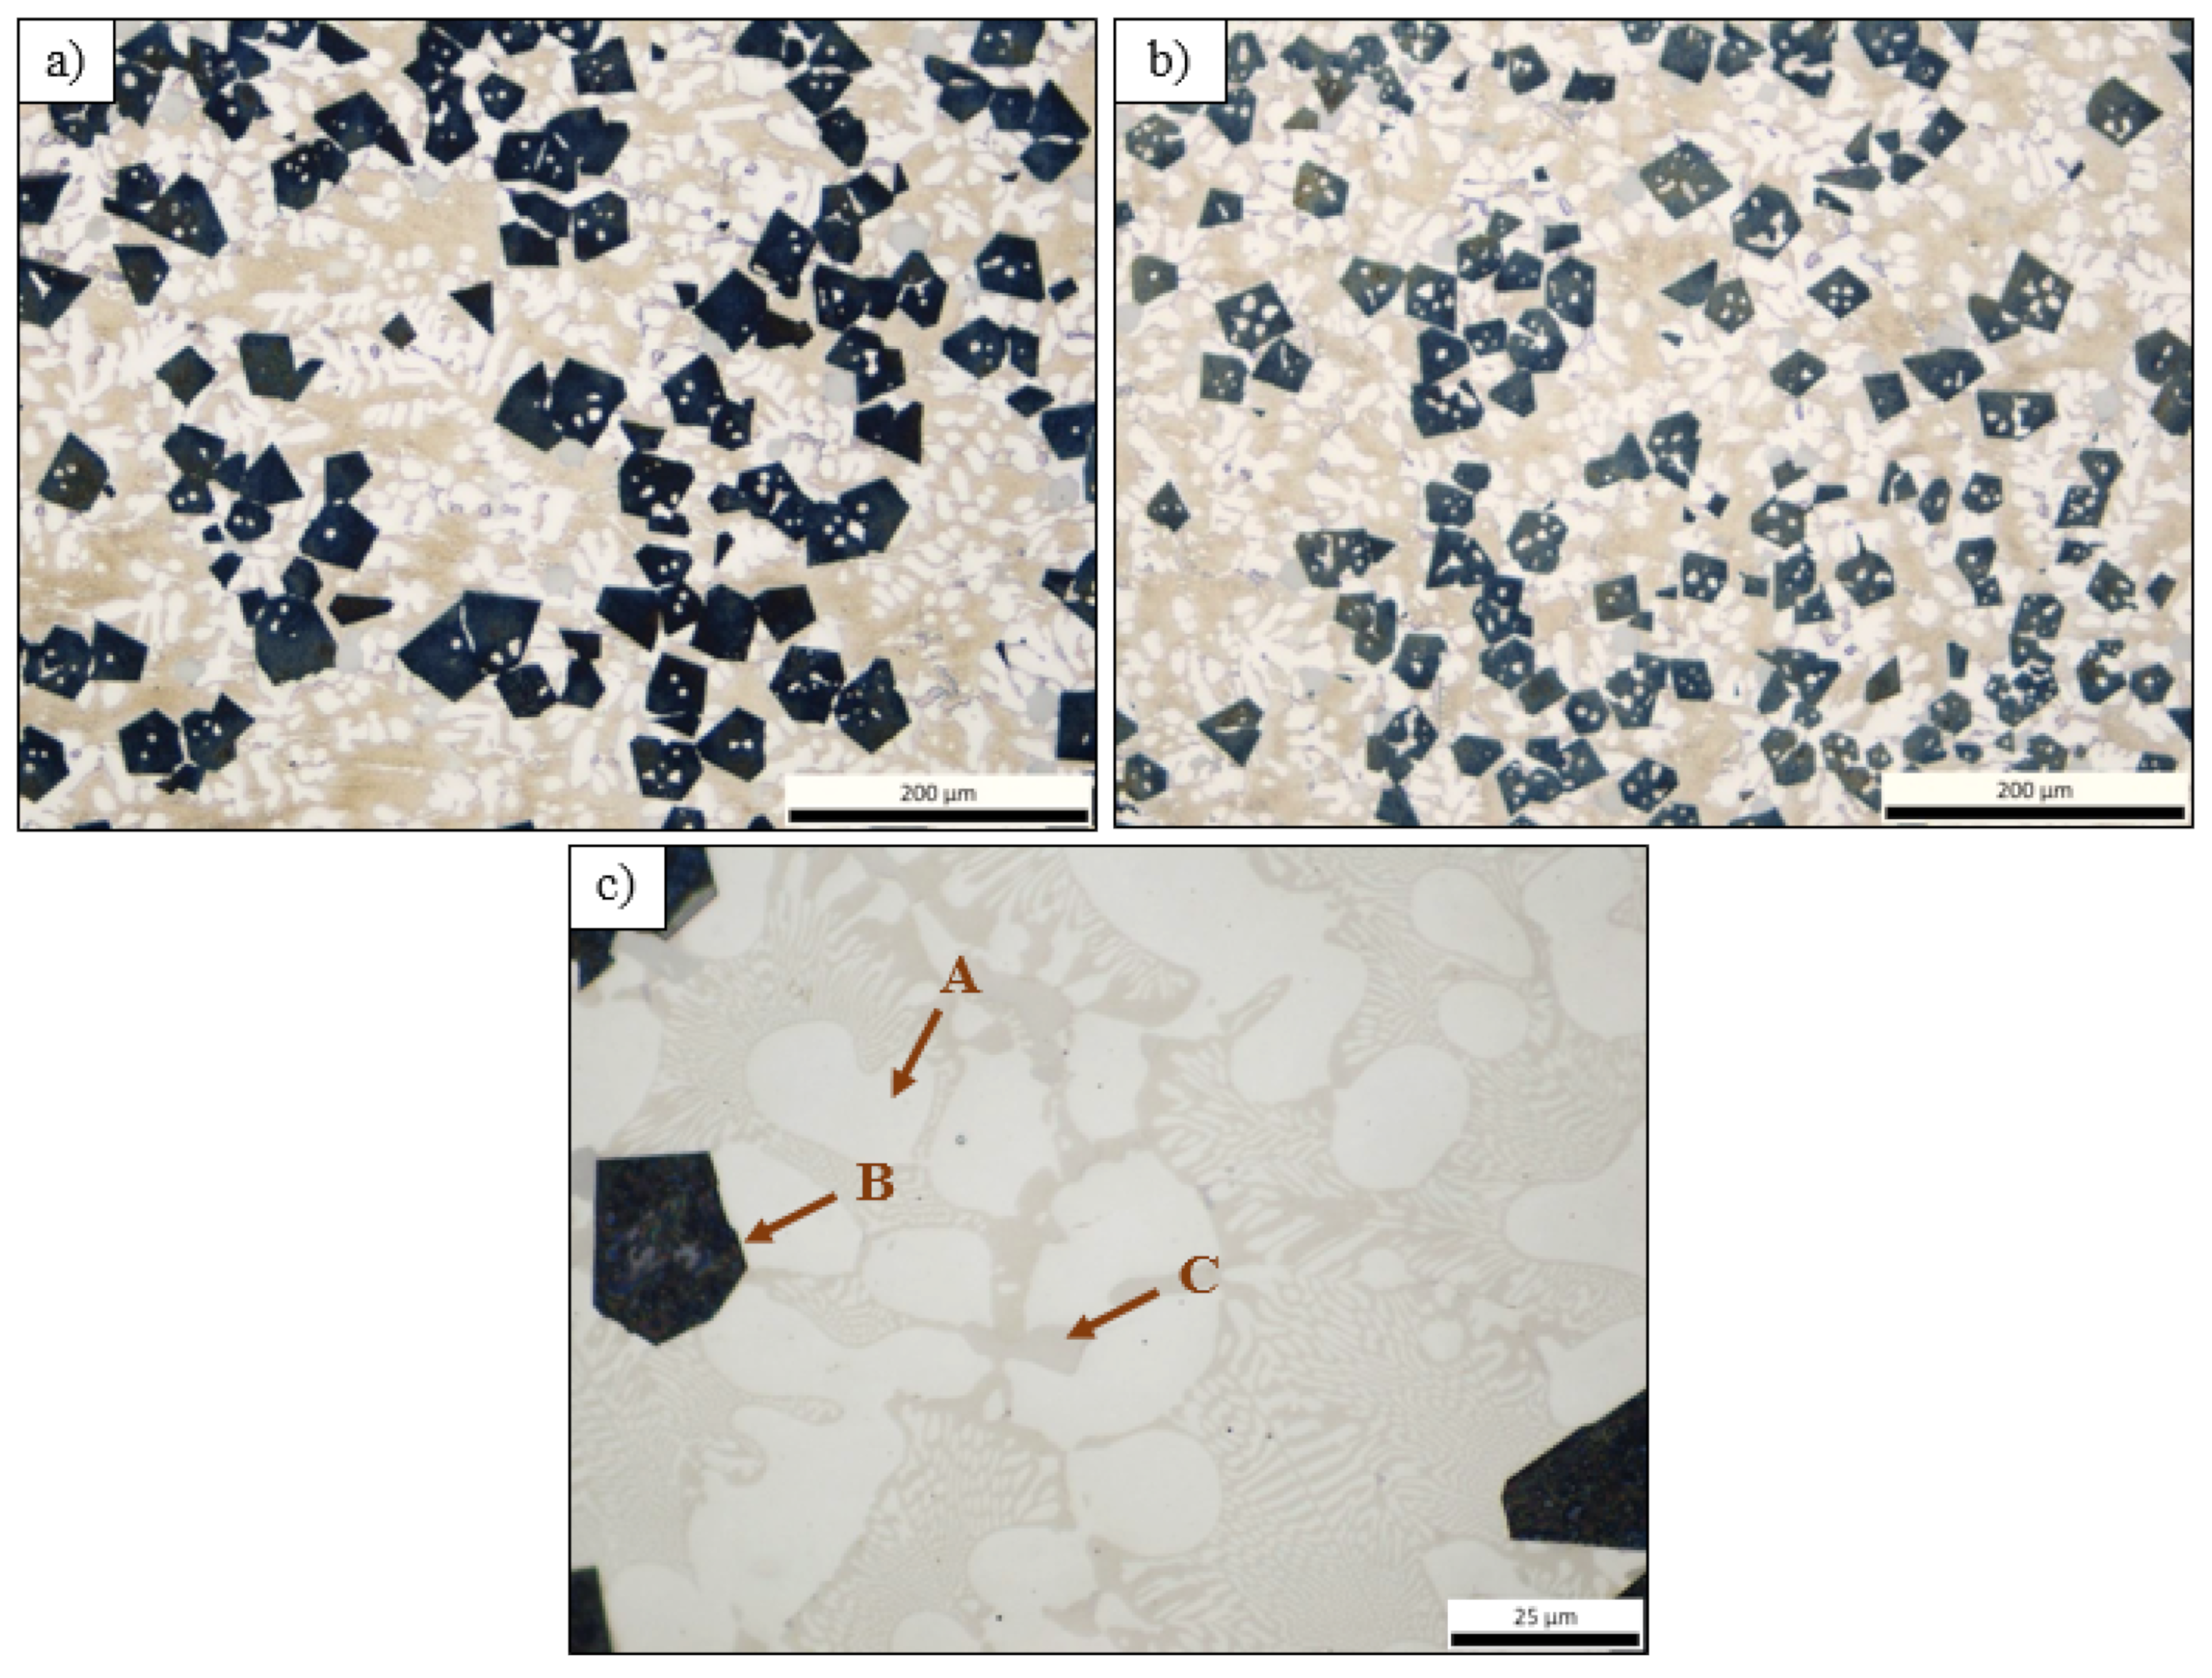
3.3.1. Microstructural Characterization of As-Cast Alloys
3.3.2. Microstructural Characterization of Heat-Treated Alloys
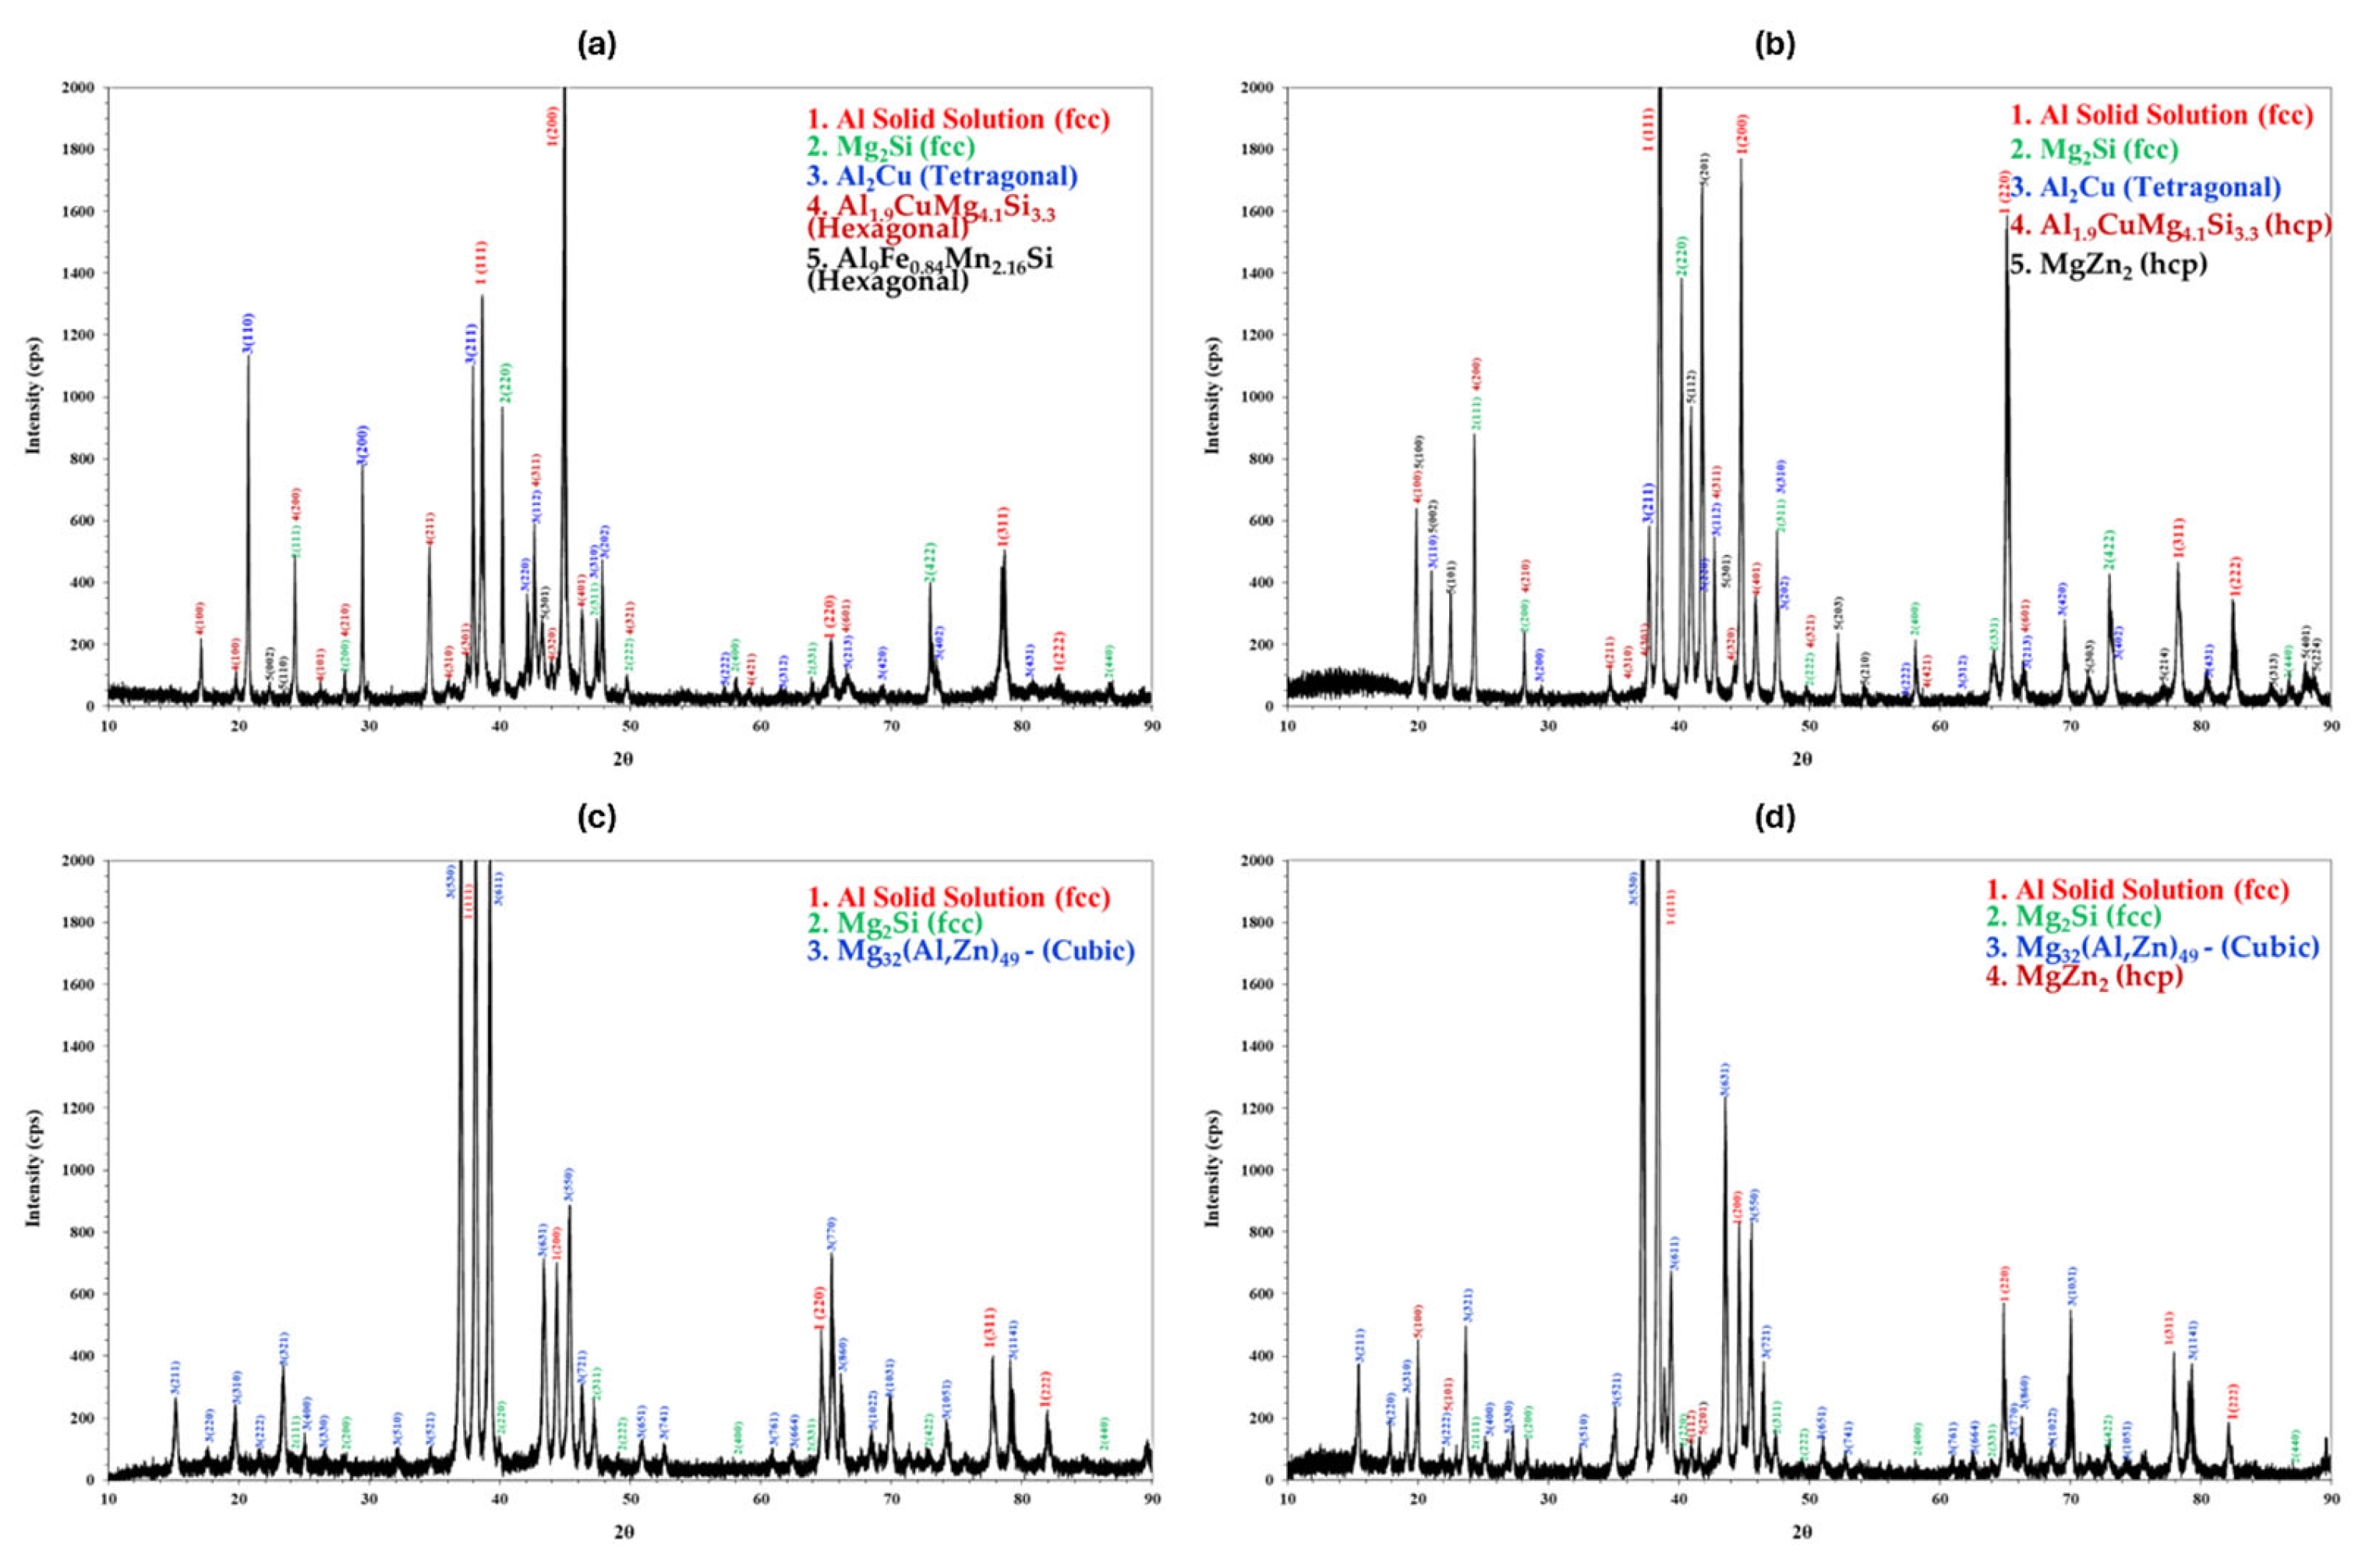
3.4. X-Ray Diffraction Analysis
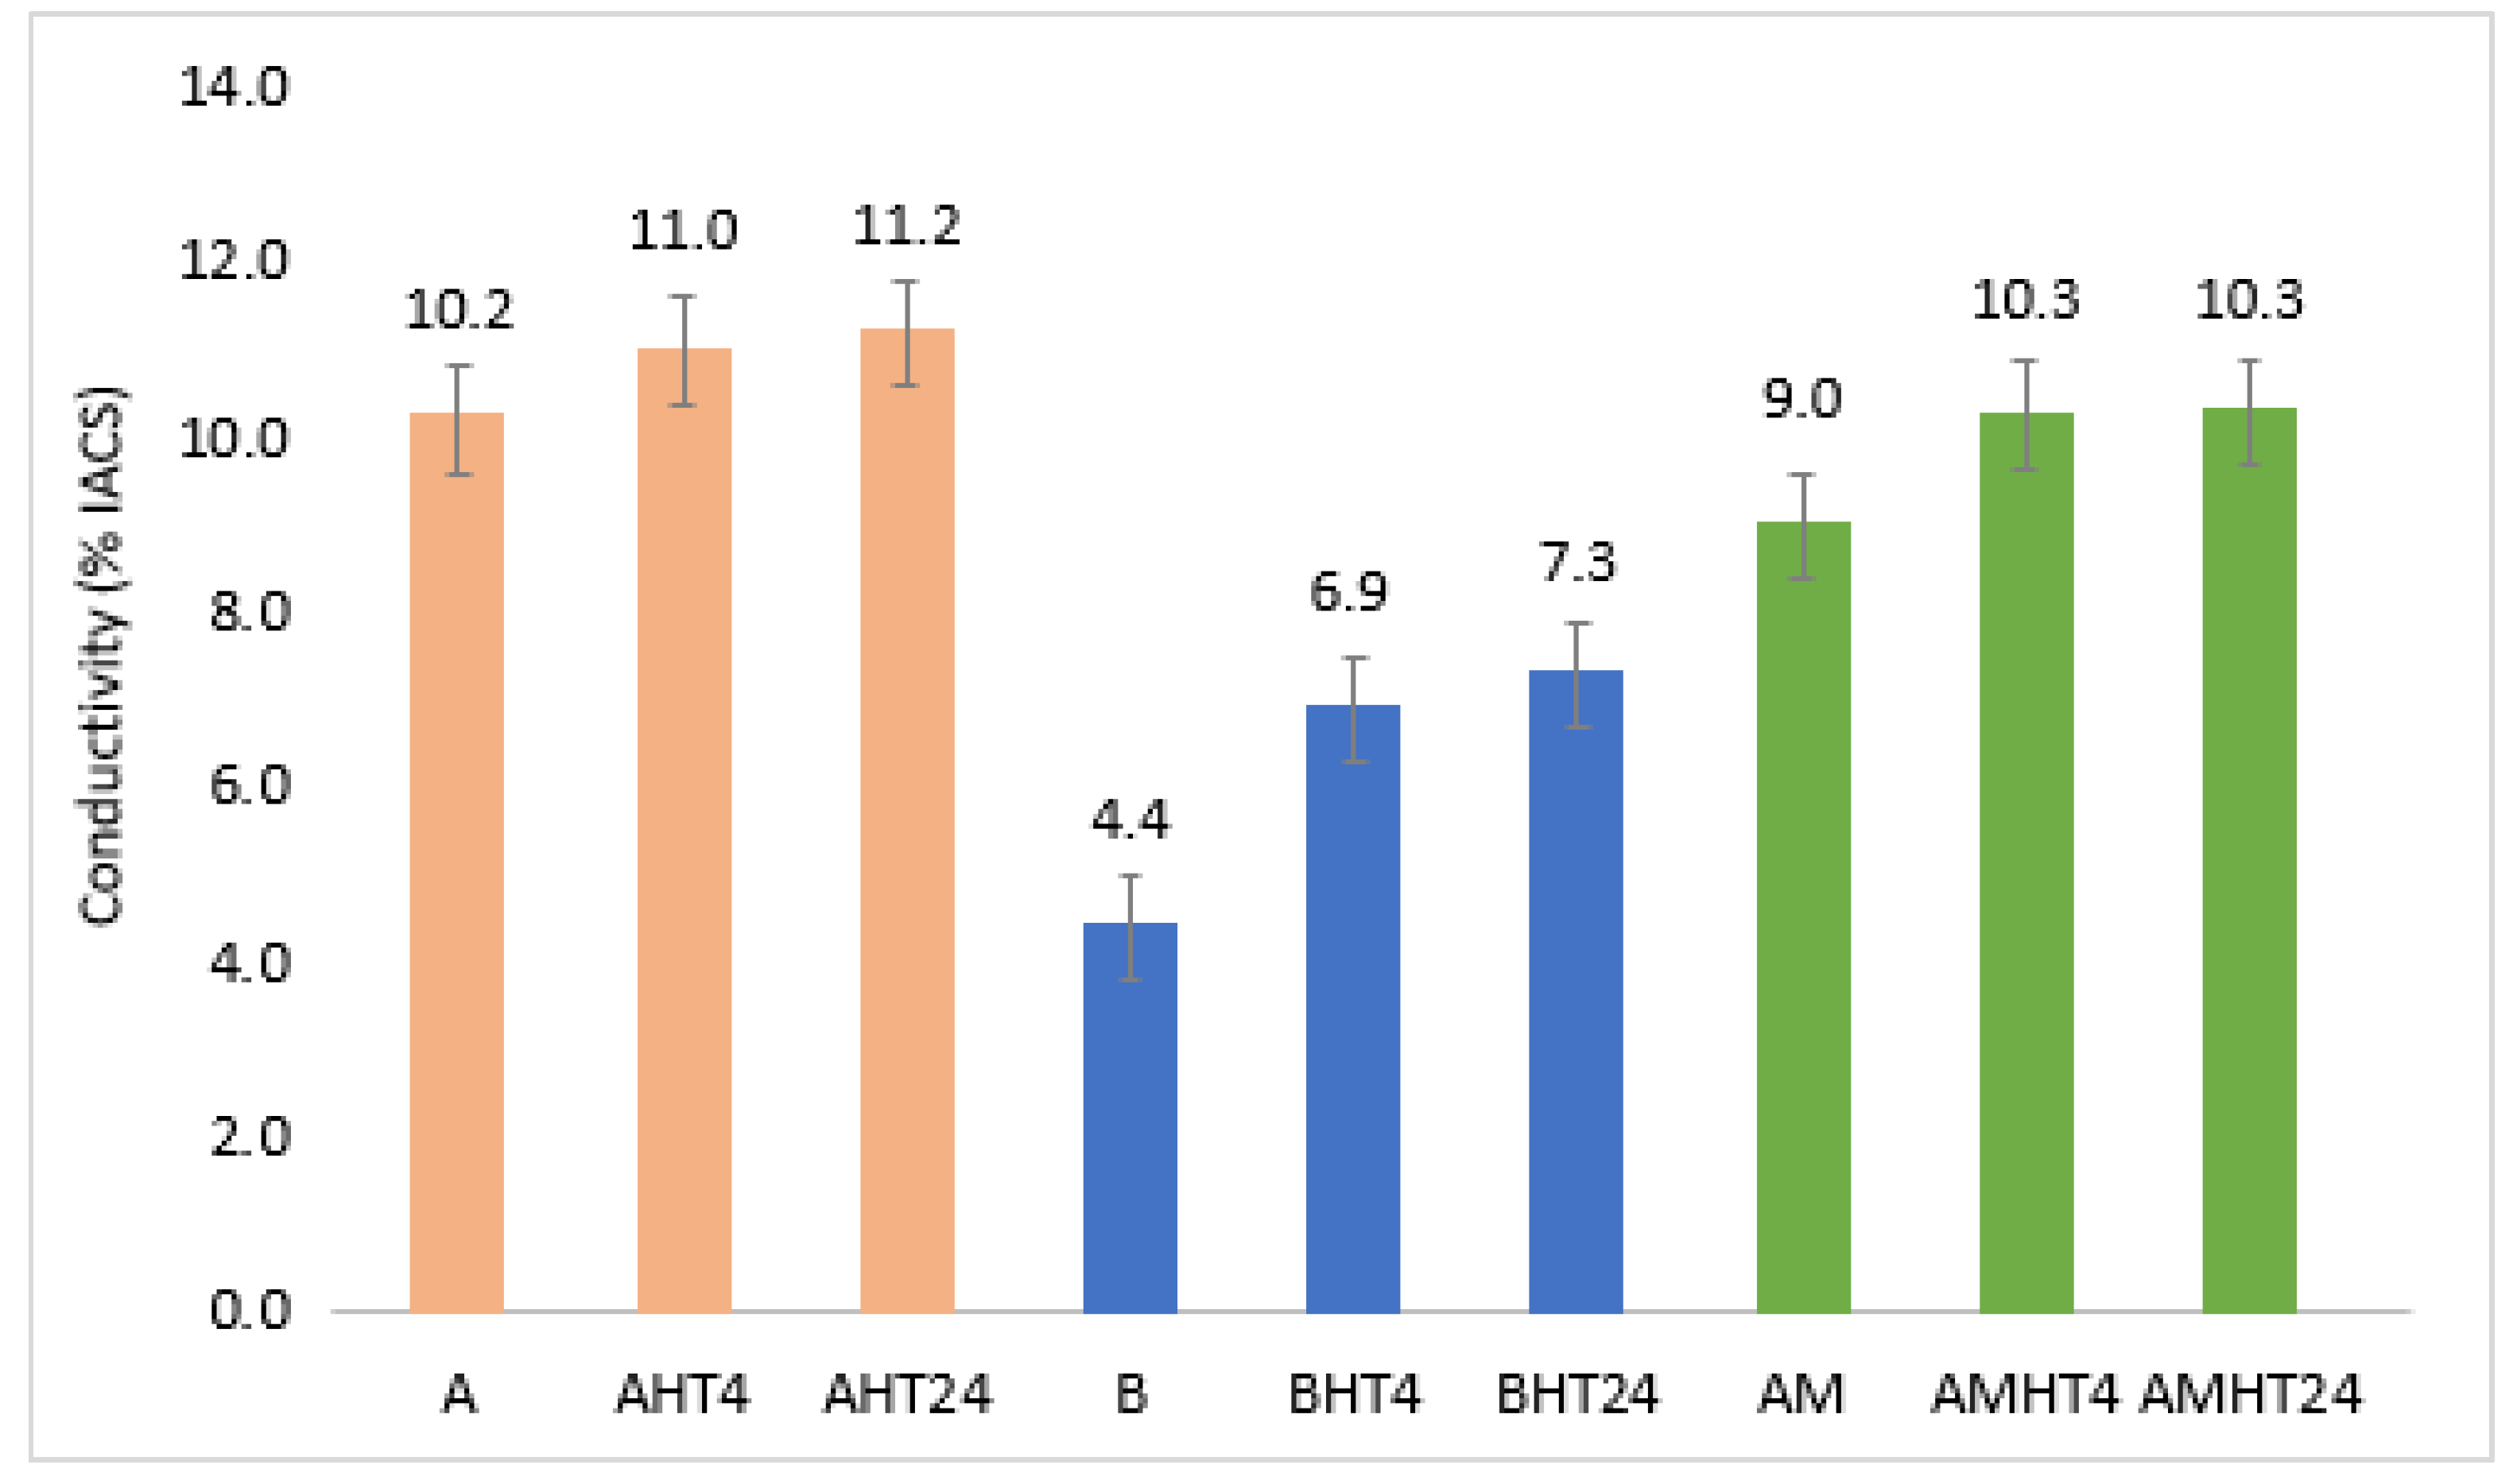
3.5. Mechanical and Physical Properties
4. Discussion
4.1. Better Understanding of Al-Based CCA Phase Diagrams Calculated by Thermocalc
4.2. Alloy Design Outcome
5. Conclusions
- The Thermocalc software predictions showed good agreement with the experimental results as it successfully predicted the majority of phases that appeared in the alloys. Therefore, Thermocalc can be a useful tool to guide alloy design.
- During the alloy design process, the presence of impurities in industrial-grade raw materials should be taken into consideration since it could lead to the formation of unforeseen phases, though such phases do not undermine the alloy’s properties.
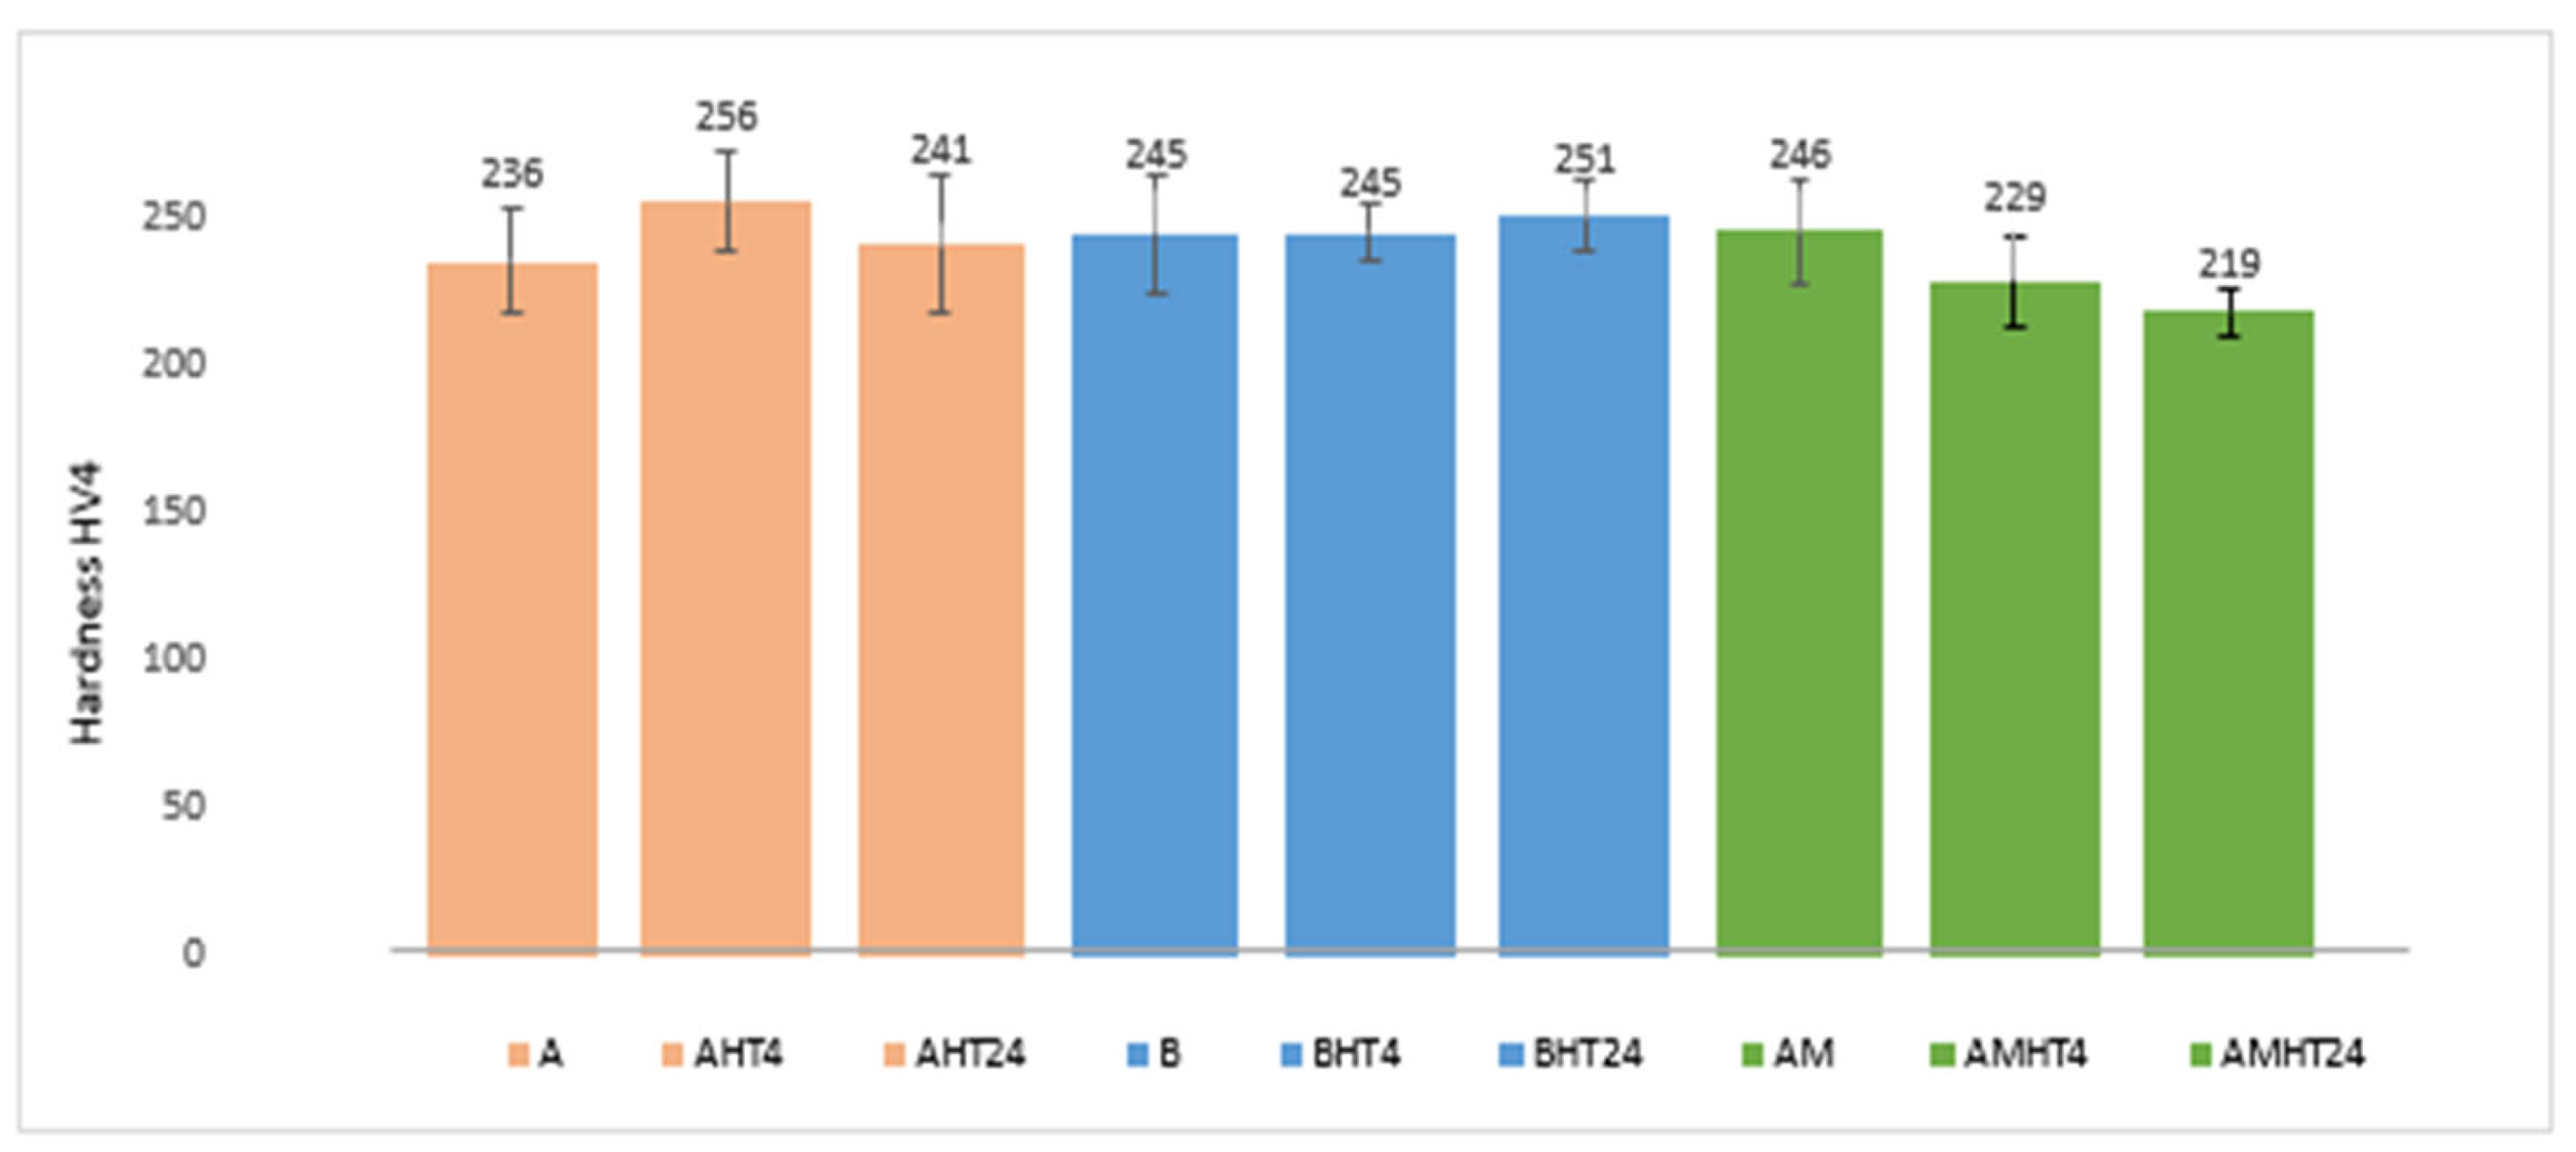
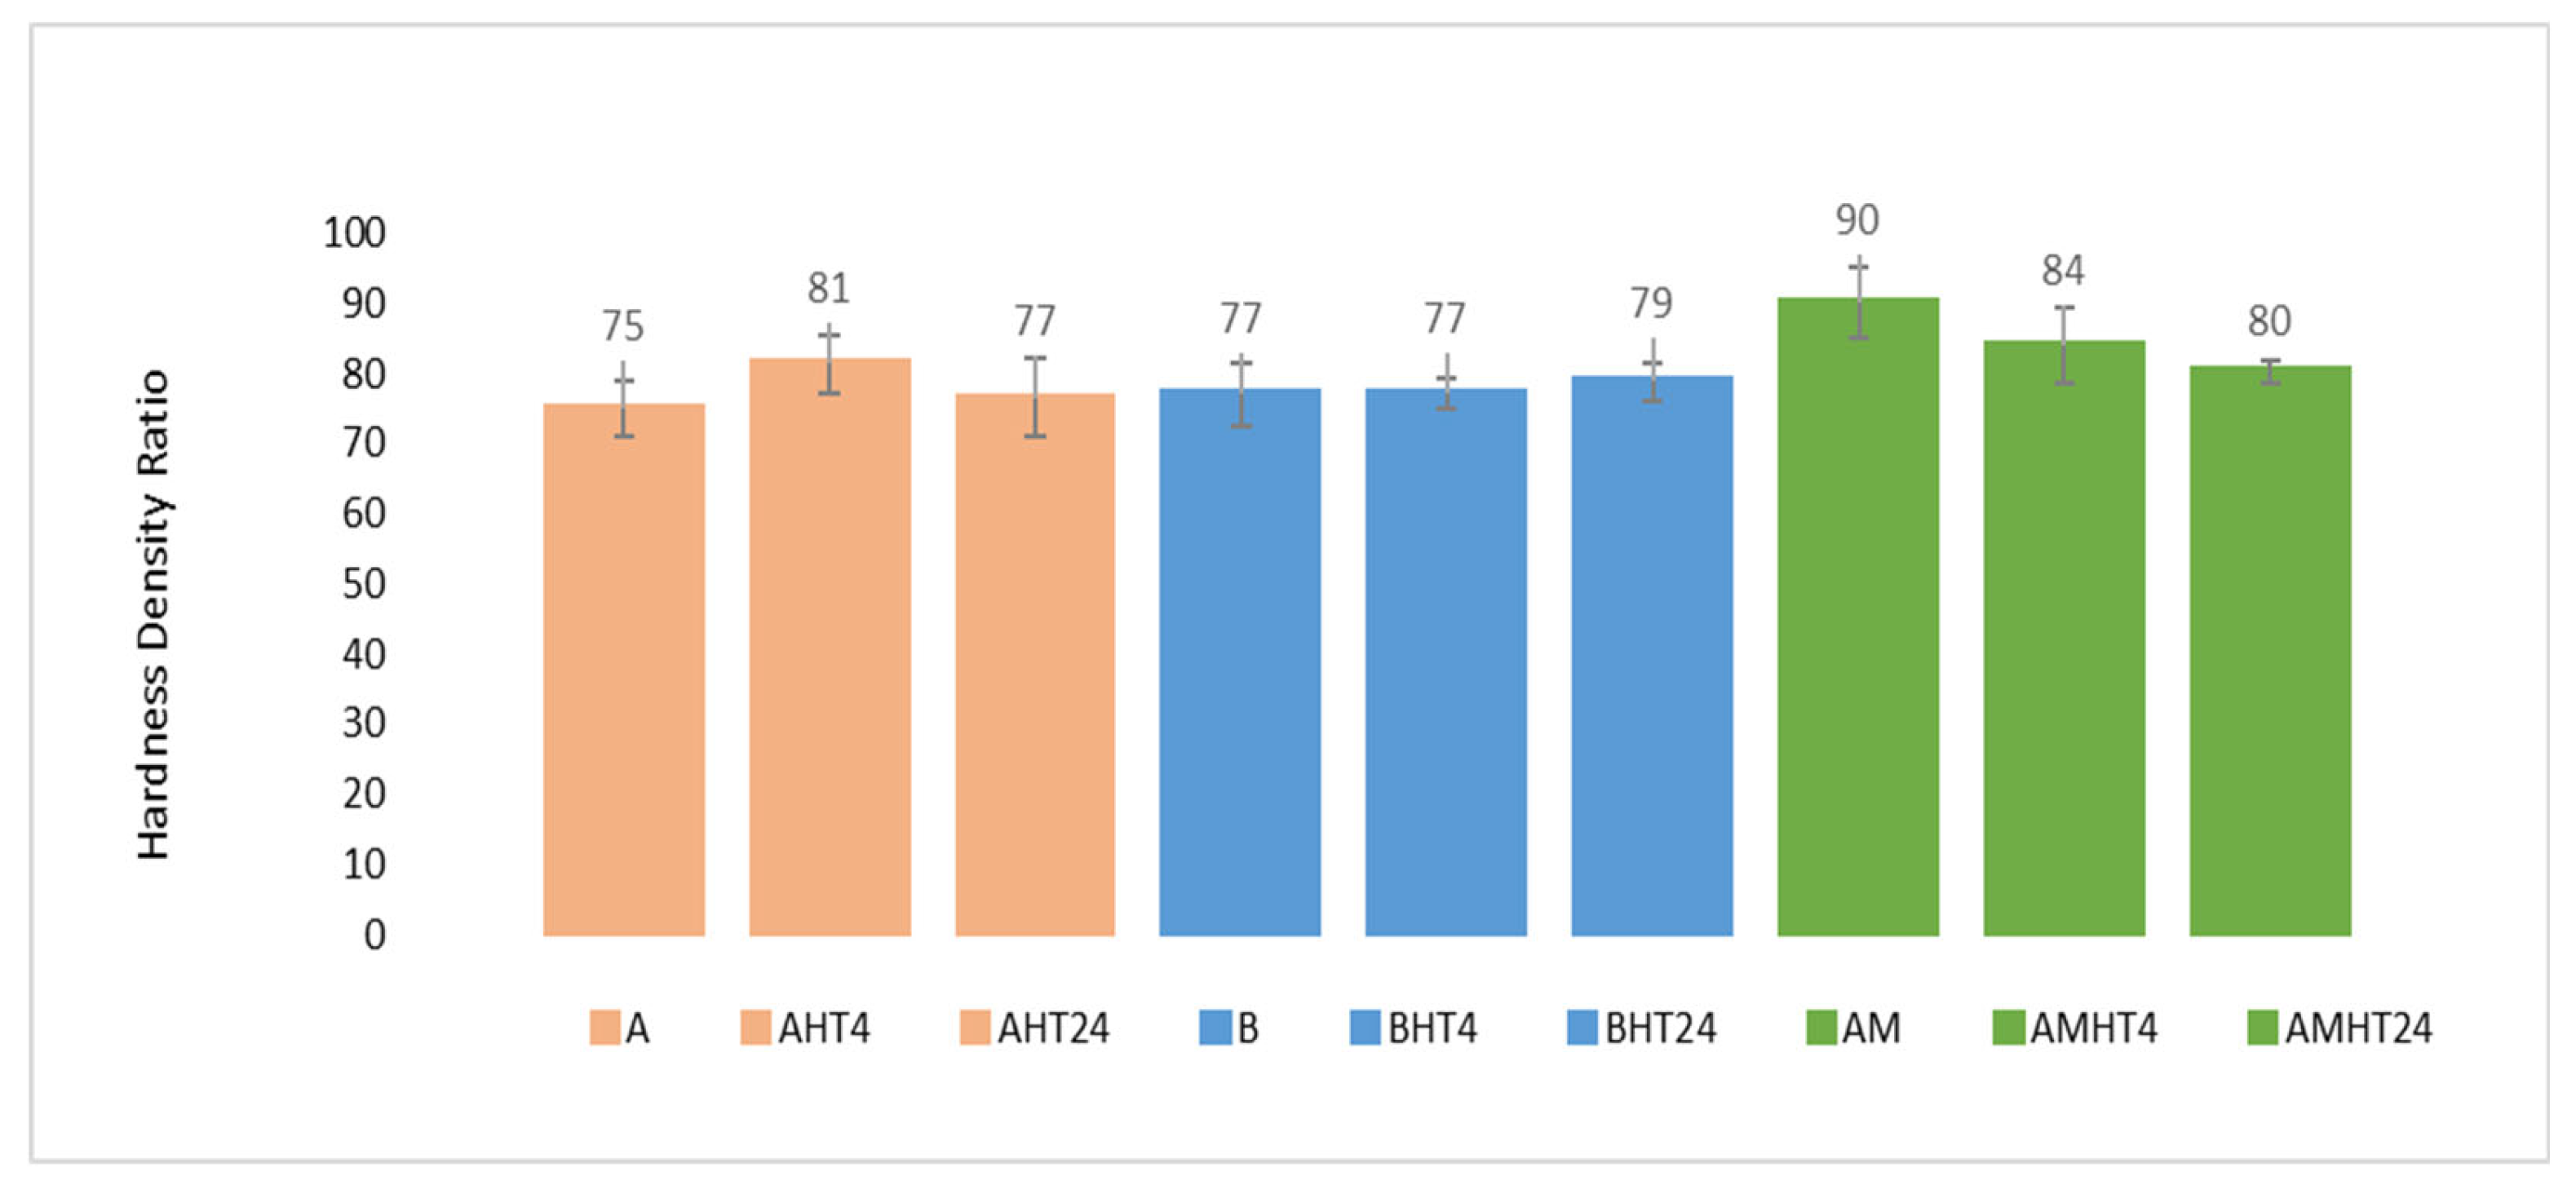
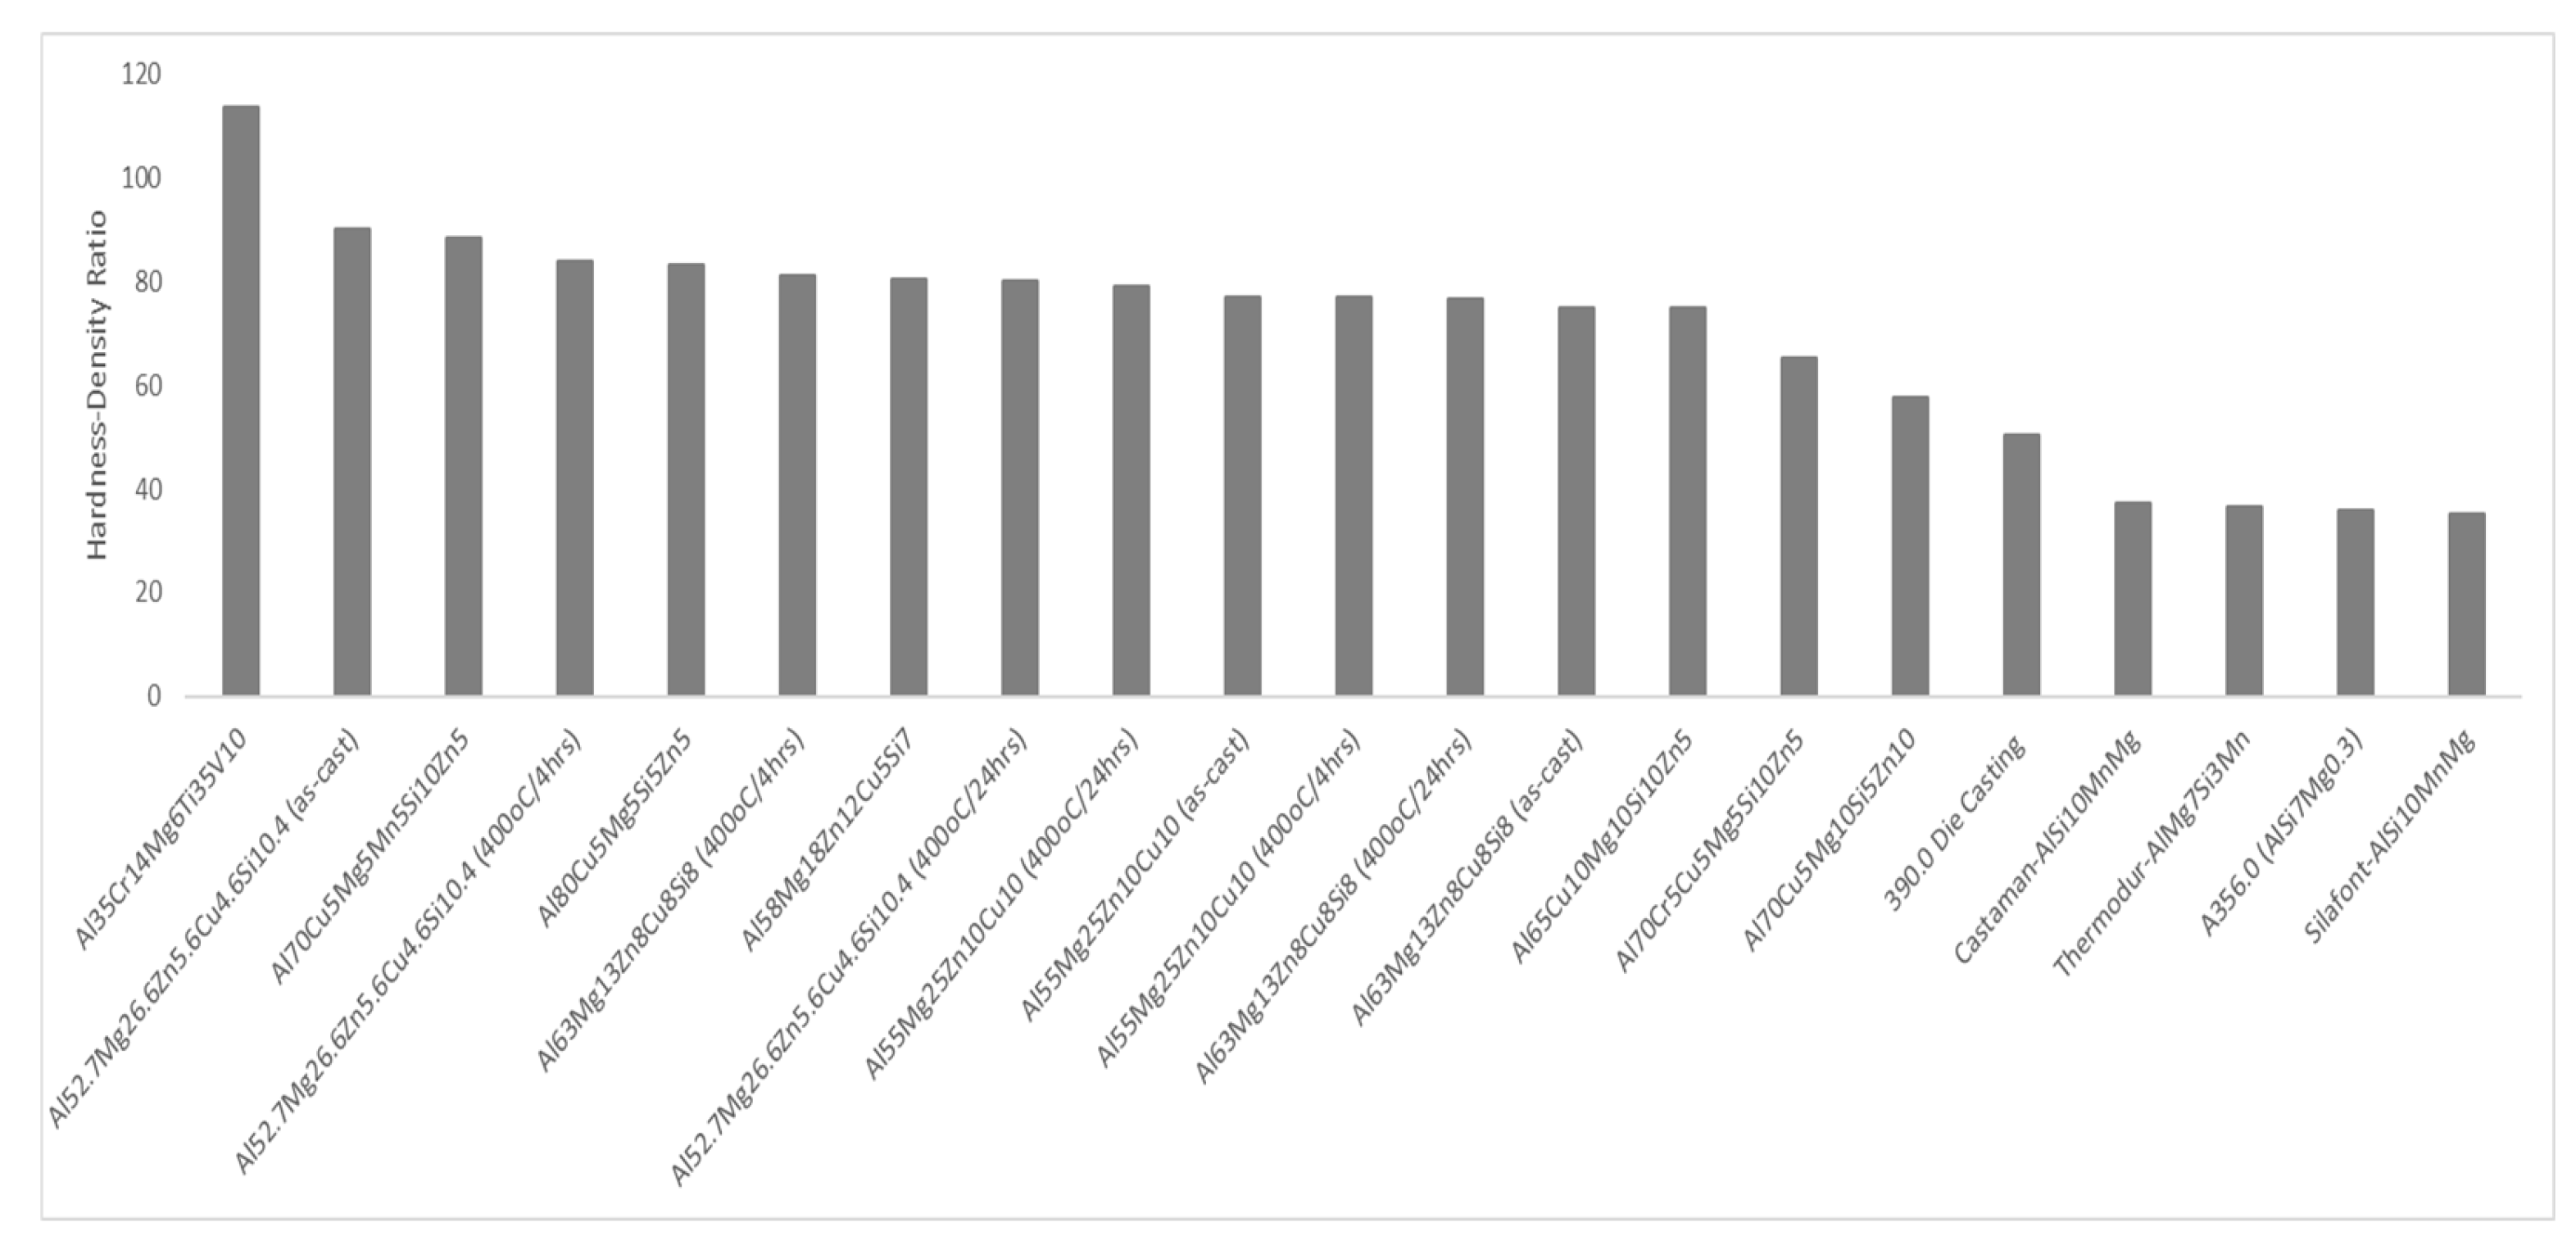
- Alloy AM had the highest hardness (246 HV4) from among the as-cast samples, while from the heat-treated ones, alloy A showed the highest value (256 HV4). By comparing the hardness/density ratios of the alloys of this work with other alloys in the HEA literature and commercial cast Al alloys that are used for automotive pistons, it was evident that they could offer alternatives with a high hardness strength for automotive Al cast pistons.
- Heat treatment was found to induce alterations in the elemental composition of the constitutional phases along with changes in hardness. It was found that natural aging can be used in these alloys to improve their hardness. Alloy A underwent an 8% increase in hardness.
Author Contributions
Funding
Data Availability Statement
Acknowledgments
Conflicts of Interest
References
- Poznak, A.; Freiberg, D.; Sanders, P. Automotive Wrought Aluminium Alloys. In Fundamentals of Aluminium Metallurgy; Woodhead Publishing: Sawston, UK, 2018; pp. 333–386. [Google Scholar] [CrossRef]
- Ducker Frontier. Aluminum Content In European Passenger Cars. Available online: www.duckerfrontier.com (accessed on 2 May 2022).
- European Aluminum. Aluminium Content in Cars Up 20% in the Last Three Years | EURACTIV PR. Available online: https://pr.euractiv.com/pr/aluminium-content-cars-20-last-three-years-195339 (accessed on 2 May 2022).
- Gondhaleka, A.A. Design and Development of Light Weight High Entropy Alloys. Master’s Thesis, JÖNKÖPING University, Jönköping, Sweden, 2019. [Google Scholar]
- Aluminium Automotive Manual—European Aluminium. Available online: https://european-aluminium.eu/blog/aluminium-automotive-manual/ (accessed on 5 June 2024).
- Koos, R. Correlation Between 3D Microstructure and Thermo-Mechanical Behavior of Near Eutectic Piston Alloys. Ph.D. Thesis, Technische Universität Wien, Vienna, Austria, 2015. [Google Scholar] [CrossRef]
- Raabe, D.; Ponge, D.; Uggowitzer, P.J.; Roscher, M.; Paolantonio, M.; Liu, C.; Antrekowitsch, H.; Kozeschnik, E.; Seidmann, D.; Gault, B.; et al. Making sustainable aluminum by recycling scrap: The science of “dirty” alloys. Prog. Mater. Sci. 2022, 128, 100947. [Google Scholar] [CrossRef]
- Sanchez, J.M.; Vicario, I.; Albizuri, J.; Guraya, T.; Garcia, J.C. Phase prediction, microstructure and high hardness of novel light-weight high entropy alloys. J. Mater. Res. Technol. 2018, 8, 795–803. [Google Scholar] [CrossRef]
- Maulik, O.; Kumar, D.; Kumar, S.; Dewangan, S.K.; Kumar, V. Structure and properties of lightweight high entropy alloys: A brief review. Mater. Res. Express 2018, 5, 052001. [Google Scholar] [CrossRef]
- Yeh, J.-W.; Chen, S.K.; Lin, S.-J.; Gan, J.-Y.; Chin, T.-S.; Shun, T.-T.; Tsau, C.-H.; Chang, S.-Y. Nanostructured High-Entropy Alloys with Multiple Principal Elements: Novel Alloy Design Concepts and Outcomes. Adv. Eng. Mater. 2004, 6, 299–303. [Google Scholar] [CrossRef]
- Pickering, E.J.; Jones, N.G. High-entropy alloys: A critical assessment of their founding principles and future prospects. Int. Mater. Rev. 2016, 61, 183–202. [Google Scholar] [CrossRef]
- Miracle, D.B.; Senkov, O.N. A critical review of high entropy alloys and related concepts. Acta Mater. 2017, 122, 448–511. [Google Scholar] [CrossRef]
- Sanchez, J.M.; Vicario, I.; Albizuri, J.; Guraya, T.; Acuña, E.M. Design, Microstructure and Mechanical Properties of Cast Medium Entropy Aluminium Alloys. Sci. Rep. 2019, 9, 6792. [Google Scholar] [CrossRef]
- Oh, H.S.; Odbadrakh, K.; Ikeda, Y.; Mu, S.; Körmann, F.; Sun, C.-J.; Ahn, H.S.; Yoon, K.N.; Ma, D.; Tasan, C.C.; et al. Element-resolved local lattice distortion in complex concentrated alloys: An observable signature of electronic effects. Acta Mater. 2021, 216, 117135. [Google Scholar] [CrossRef]
- Gao, M.C.; Liaw, P.K.; Yeh, J.W.; Zhang, Y. High-Entropy Alloys: Fundamentals and Applications, 1st ed.; Springer: Berlin/Heidelberg, Germany, 2016. [Google Scholar]
- Kumar, A.; Gupta, M. An Insight into Evolution of Light Weight High Entropy Alloys: A Review. Metals 2016, 6, 199. [Google Scholar] [CrossRef]
- Tsai, M.-H. Three Strategies for the Design of Advanced High-Entropy Alloys. Entropy 2016, 18, 252. [Google Scholar] [CrossRef]
- Barnett, M.; Senadeera, M.; Fabijanic, D.; Shamlaye, K.; Joseph, J.; Kada, S.; Rana, S.; Gupta, S.; Venkatesh, S. A scrap-tolerant alloying concept based on high entropy alloys. Acta Mater. 2020, 200, 735–744. [Google Scholar] [CrossRef]
- Mitrica, D.; Badea, I.C.; Serban, B.A.; Olaru, M.T.; Vonica, D.; Burada, M.; Piticescu, R.-R.; Popov, V.V. Complex Concentrated Alloys for Substitution of Critical Raw Materials in Applications for Extreme Conditions. Materials 2021, 14, 1197. [Google Scholar] [CrossRef] [PubMed]
- Chaskis, S.; Bouzouni, M.; Gavalas, E.; Loukadakis, V.; Papaefthymiou, S. Development of Complex Concentrated Alloys (CCAs) Utilizing Scrap to Preserve Critical Raw Materials. Mater. Proc. 2022, 5, 109. [Google Scholar] [CrossRef]
- Shao, L.; Zhang, T.; Li, L.; Zhao, Y.; Huang, J.; Liaw, P.K.; Zhang, Y. A Low-Cost Lightweight Entropic Alloy with High Strength. J. Mater. Eng. Perform. 2018, 27, 6648–6656. [Google Scholar] [CrossRef]
- Sanchez, J.M.; Vicario, I.; Albizuri, J.; Guraya, T.; Koval, N.E.; Garcia, J.C. Compound Formation and Microstructure of As-Cast High Entropy Aluminums. Metals 2018, 8, 167. [Google Scholar] [CrossRef]
- Sanchez, J.M.; Pascual, A.; Vicario, I.; Albizuri, J.; Guraya, T.; Galarraga, H. Microstructure and Phase Formation of Novel Al80Mg5Sn5Zn5X5 Light-Weight Complex Concentrated Aluminum Alloys. Metals 2021, 11, 1944. [Google Scholar] [CrossRef]
- Sanchez, J.M.; Galarraga, H.; Del Molino, E.; Albizuri, J.; Guraya, T.; Hudson, S.W. Microstructure and mechanical properties of two novel scrap tolerant Al65Cu10Mg10Si10Zn5 and Al80Cu5Mg5Si5Zn5 high entropy aluminum alloys. Intermetallics 2023, 162, 108023. [Google Scholar] [CrossRef]
- Tun, K.; Murugan, P.; Srivatsan, T.; Gupta, M. Synthesis and Characterization of aluminium based multicomponent alloys. Mater. Today Proc. 2021, 46, 1210–1214. [Google Scholar] [CrossRef]
- Sudha, P.; Tun, K.S.; Gupta, M.; Mourad, A.I.; Vincent, S. Electrochemical characterization of a novel multicomponent Al75Mg5Li10Zn5Cu5 low entropy alloy in different pH environments. Mater. Corros. 2022, 73, 2071–2083. [Google Scholar] [CrossRef]
- Cui, L.; Zhang, Z.; Chen, X.-G. Lightweight Al-based entropy alloys: Overview and future trend. Sci. China Mater. 2023, 67, 31–46. [Google Scholar] [CrossRef]
- Dong, H.; Xiang, S.; Lv, J.; Wang, Y.; Li, L.; Yu, W. Modification of Mg2Si Phase Morphology in Mg-4Si Alloy by Sb and Nd Additions. J. Mater. Eng. Perform. 2020, 29, 3678–3687. [Google Scholar] [CrossRef]
- Chaskis, S.; Stachouli, E.; Gavalas, E.; Bouzouni, M.; Papaefthymiou, S. Microstructure, Phase Formation and Heat-Treating of Novel Cast Al-Mg-Zn-Cu-Si Lightweight Complex Concentrated Aluminum Based Alloy. Materials 2022, 15, 3169. [Google Scholar] [CrossRef] [PubMed]
- Zolotorevsky, V.S.; Belov, N.A.; Glazoff, M.V. Casting Aluminum Alloys; Elsevier: Amsterdam, NX, The Netherlands, 2007; pp. 1–530. [Google Scholar] [CrossRef]
- Zhu, X.; Yang, H.; Dong, X.; Ji, S. The effects of varying Mg and Si levels on the microstructural inhomogeneity and eutectic Mg2Si morphology in die-cast Al–Mg–Si alloys. J. Mater. Sci. 2018, 54, 5773–5787. [Google Scholar] [CrossRef]
- Srivatsan, T.S.; Gupta, M. (Eds.) High Entropy Alloys: Innovations, Advances, and Applications; CRC Press: Boca Raton, FL, USA, 2020. [Google Scholar]
- Subedi, U.; Kunwar, A.; Coutinho, Y.A.; Gyanwali, K. pyMPEALab Toolkit for Accelerating Phase Design in Multi-principal Element Alloys. Met. Mater. Int. 2021, 28, 269–281. [Google Scholar] [CrossRef]
- Thermo-Calc Software. TCS Al-Based Alloy Database (TCAL7); Thermo-Calc Software, Inc.: McMurray, PA, USA, 2020; Available online: www.thermocalc.com (accessed on 14 June 2022).
- Computational Materials Engineering—Thermo-Calc Software. Available online: https://thermocalc.com/ (accessed on 11 October 2022).
- Kuryntsev, S. A Review: Laser Welding of Dissimilar Materials (Al/Fe, Al/Ti, Al/Cu)—Methods and Techniques, Microstructure and Properties. Materials 2021, 15, 122. [Google Scholar] [CrossRef]
- Electronegativity | Periodic Table of Elements—PubChem. Available online: https://pubchem.ncbi.nlm.nih.gov/ptable/electronegativity/ (accessed on 7 January 2025).
- WebElements Periodic Table ‘Magnesium’ Electronegativity. Available online: https://www.webelements.com/magnesium/electronegativity.html (accessed on 7 January 2025).
- Magnesium—Crystal Structure. Available online: https://www.periodic-table.org/magnesium-crystal-structure/?utm_content=cmp-true (accessed on 7 January 2025).
- Magnesium—Atomic Radius—Mg. Available online: https://www.periodic-table.org/magnesium-atomic-radius/ (accessed on 7 January 2025).
- Lattice Constants for All the Elements in the Periodic Table. Available online: https://periodictable.com/Properties/A/LatticeConstants.html (accessed on 7 January 2025).
- Zinc—Periodic Table and Atomic Properties. Available online: https://material-properties.org/zinc-periodic-table-atomic-number-mass-radius-density/ (accessed on 7 January 2025).
- Zinc (Zn). Available online: https://periodictable.chemicalaid.com/element.php/Zn?lang=en (accessed on 7 January 2025).
- Silicon—Atomic Radius—Si. Available online: https://www.periodic-table.org/silicon-atomic-radius/ (accessed on 7 January 2025).
- Silicon—Crystal Structure. Available online: https://www.periodic-table.org/Silicon-crystal-structure/ (accessed on 7 January 2025).
- Biran, A.; López-Pulido, R. Basic Ship Hydrostatics. Sh. Hydrostatics Stab. 2014, 23–75. [Google Scholar] [CrossRef]
- Heydari, H.; Tajally, M.; Habibolahzadeh, A. Calculations to introduce some light high entropy alloys based on phase formation rules. J. Alloys Compd. 2022, 912, 165222. [Google Scholar] [CrossRef]
- Yang, X.; Chen, S.Y.; Cotton, J.D.; Zhang, Y. Phase Stability of Low-Density, Multiprincipal Component Alloys Containing Aluminum, Magnesium, and Lithium. JOM 2014, 66, 2009–2020. [Google Scholar] [CrossRef]
- Mitrica, D.; Badea, I.C.; Olaru, M.T.; Serban, B.A.; Vonica, D.; Burada, M.; Geanta, V.; Rotariu, A.N.; Stoiciu, F.; Badilita, V.; et al. Modeling and Experimental Results of Selected Lightweight Complex Concentrated Alloys, before and after Heat Treatment. Materials 2020, 13, 4330. [Google Scholar] [CrossRef]
- Sahin, H.; Zengin, H. Microstructure, Mechanical and Wear Properties of Low-Density Cast Medium and High Entropy Aluminium Alloys. Int. J. Met. 2022, 16, 1976–1984. [Google Scholar] [CrossRef]
- Tsai, M.-H.; Yeh, J.-W. High-Entropy Alloys: A Critical Review. Mater. Res. Let. 2014, 2, 107–123. [Google Scholar] [CrossRef]
- Gao, M.; Zhang, C.; Gao, P.; Zhang, F.; Ouyang, L.; Widom, M.; Hawk, J. Thermodynamics of concentrated solid solution alloys. Curr. Opin. Solid State Mater. Sci. 2017, 21, 238–251. [Google Scholar] [CrossRef]
- Cui, L.; Zhang, Z.; Chen, X.-G. Development of lightweight Al-based entropy alloys for elevated temperature applications. J. Alloys Compd. 2023, 938, 168619. [Google Scholar] [CrossRef]
- Zhang, Y.; Li, R.; Chen, P.; Li, X.; Liu, Z. Microstructural evolution of Al2Cu phase and mechanical properties of the large-scale Al alloy components under different consecutive manufacturing processes. J. Alloys Compd. 2019, 808, 151634. [Google Scholar] [CrossRef]
- Kim, K.; Bobel, A.; Baik, S.-I.; Walker, M.; Voorhees, P.; Olson, G. Enhanced Coarsening Resistance of Q-phase in Aluminum alloys by the addition of Slow Diffusing Solutes. Mater. Sci. Eng. A 2018, 735, 318–323. [Google Scholar] [CrossRef]
- Tsai, M.-H.; Tsai, R.-C.; Chang, T.; Huang, W.-F. Intermetallic Phases in High-Entropy Alloys: Statistical Analysis of their Prevalence and Structural Inheritance. Metals 2019, 9, 247. [Google Scholar] [CrossRef]
- Lervik, A.; Marioara, C.; Kadanik, M.; Walmsley, J.; Milkereit, B.; Holmestad, R. Precipitation in an extruded AA7003 aluminium alloy: Observations of 6xxx-type hardening phases. Mater. Des. 2019, 186, 108204. [Google Scholar] [CrossRef]
- Ding, L.; Jia, Z.; Nie, J.-F.; Weng, Y.; Cao, L.; Chen, H.; Wu, X.; Liu, Q. The structural and compositional evolution of precipitates in Al-Mg-Si-Cu alloy. Acta Mater. 2018, 145, 437–450. [Google Scholar] [CrossRef]
- Mohamed, A.; Samuel, F.; Al Kahtani, S. Microstructure, tensile properties and fracture behavior of high temperature Al–Si–Mg–Cu cast alloys. Mater. Sci. Eng. A 2013, 577, 64–72. [Google Scholar] [CrossRef]
- Li, C.; Wu, Y.; Li, H.; Liu, X. Morphological evolution and growth mechanism of primary Mg2Si phase in Al–Mg2Si alloys. Acta Mater. 2011, 59, 1058–1067. [Google Scholar] [CrossRef]
- Mondal, C.; Mukhopadhyay, A. On the nature of T(Al2Mg3Zn3) and S(Al2CuMg) phases present in as-cast and annealed 7055 aluminum alloy. Mater. Sci. Eng. A 2005, 391, 367–376. [Google Scholar] [CrossRef]
- Zhang, L.; Gao, J.; Damoah, L.N.W.; Robertson, D.G. Removal of Iron From Aluminum: A Review. Miner. Process. Extr. Met. Rev. 2012, 33, 99–157. [Google Scholar] [CrossRef]
- Huang, Y.; Wen, J.; Liu, Y.; Zhao, Y. Effects of electromagnetic frequency on the microstructure and mechanical properties of Al70Zn10Mg10Cu5Si5 medium entropy alloy. J. Mater. Res. Technol. 2022, 17, 3105–3117. [Google Scholar] [CrossRef]
- Chauhan, P.; Yebaji, S.; Nadakuduru, V.N.; Shanmugasundaram, T. Development of a novel light weight Al35Cr14Mg6Ti35V10 high entropy alloy using mechanical alloying and spark plasma sintering. J. Alloys Compd. 2020, 820, 153367. [Google Scholar] [CrossRef]
- Aluminum Alloys Wrought and Cast Property Data. Available online: https://www.matweb.com/reference/aluminum.aspx (accessed on 7 January 2025).


| Alloying Element | Melting Temperature (°C) | Boiling Temperature (°C) | Density (g/cm3) | Crystal Lattice Type/Lattice Constant (nm) | Atomic Radius (pm) | Electronegativity (Pauling Scale) |
|---|---|---|---|---|---|---|
| Al | 660.3 | 2450 | 2.70 | FCC/0.4 | 143 | 1.61 |
| Mg | 650.0 | 1005 | 1.74 | HCP/0.32 | 141 | 1.31 |
| Cu | 1085.0 | 2570 | 8.96 | FCC/0.36 | 128 | 1.90 |
| Zn | 419.5 | 907 | 7.13 | HCP/0.1 | 122 | 1.65 |
| Si | 1410.0 | 3280 | 2.33 | FCC/0.543 | 111 | 1.90 |
| Alloy | Al (w.t.%) | Cu (w.t.%) | Mg (w.t.%) | Si (w.t.%) | Zn (w.t.%) | Al (a.t.%) | Cu (a.t.%) | Mg (a.t.%) | Si (a.t.%) | Zn (a.t.%) |
|---|---|---|---|---|---|---|---|---|---|---|
| A | 52 | 15.5 | 9.6 | 6.9 | 16 | 63 | 8 | 13 | 8 | 8 |
| B | 44 | 19 | 18 | - | 19 | 55 | 10 | 25 | - | 10 |
| AM | 47 | 9.7 | 21.4 | 9.7 | 12 | 52.7 | 4.6 | 26.6 | 10.4 | 5.6 |
| Alloy | ΔHmix (kJ/mol) | δ (%) | ΔSmix (J/K/mol) | Ω | Δχ | VEC | Tm (K) | ρtheoretical (g/cm3) |
|---|---|---|---|---|---|---|---|---|
| A | −5.63 | 7.64 | 9.66 (1.16R) | 1.73 | 0.16 | 4.31 | 1006.5 | 3.15 |
| B | −1.76 | 6.57 | 9.44 (1.14R) | 5.09 | 0.17 | 4.45 | 948.8 | 3.18 |
| AM | −7.04 | 9.03 | 10.21 (1.22R) | 1.47 | 0.19 | 3.71 | 1014.4 | 2.73 |
| Alloy | FCC_A1 | Q_AlCuMgSi | Al2Cu_C16 | V | C14_Laves | Mg2Si | T | S |
|---|---|---|---|---|---|---|---|---|
| A | 45 | 30 | 14 | 6 | 5 | - | - | - |
| B | 22 | - | - | - | 17 | - | 61 | - |
| AM | 39 | - | 17 | - | 10 | 38 | 16 | - |
| Alloy | Al (w.t.%) | Cu (w.t.%) | Mg (w.t.%) | Si (w.t.%) | Zn (w.t.%) | Al (a.t.%) | Cu (a.t.%) | Mg (a.t.%) | Si (a.t.%) | Zn (a.t.%) |
|---|---|---|---|---|---|---|---|---|---|---|
| A | 51.2 | 11.8 | 12.4 | 10.6 | 13.4 | 59.8 | 5.8 | 16 | 11.9 | 6.4 |
| B | 49 | 15.5 | 16.4 | - | 18.6 | 60.2 | 8.1 | 22.4 | - | 9.4 |
| AM | 51.6 | 9.5 | 19.3 | 8.3 | 11.4 | 57.5 | 4.5 | 24.9 | 8.8 | 5.2 |
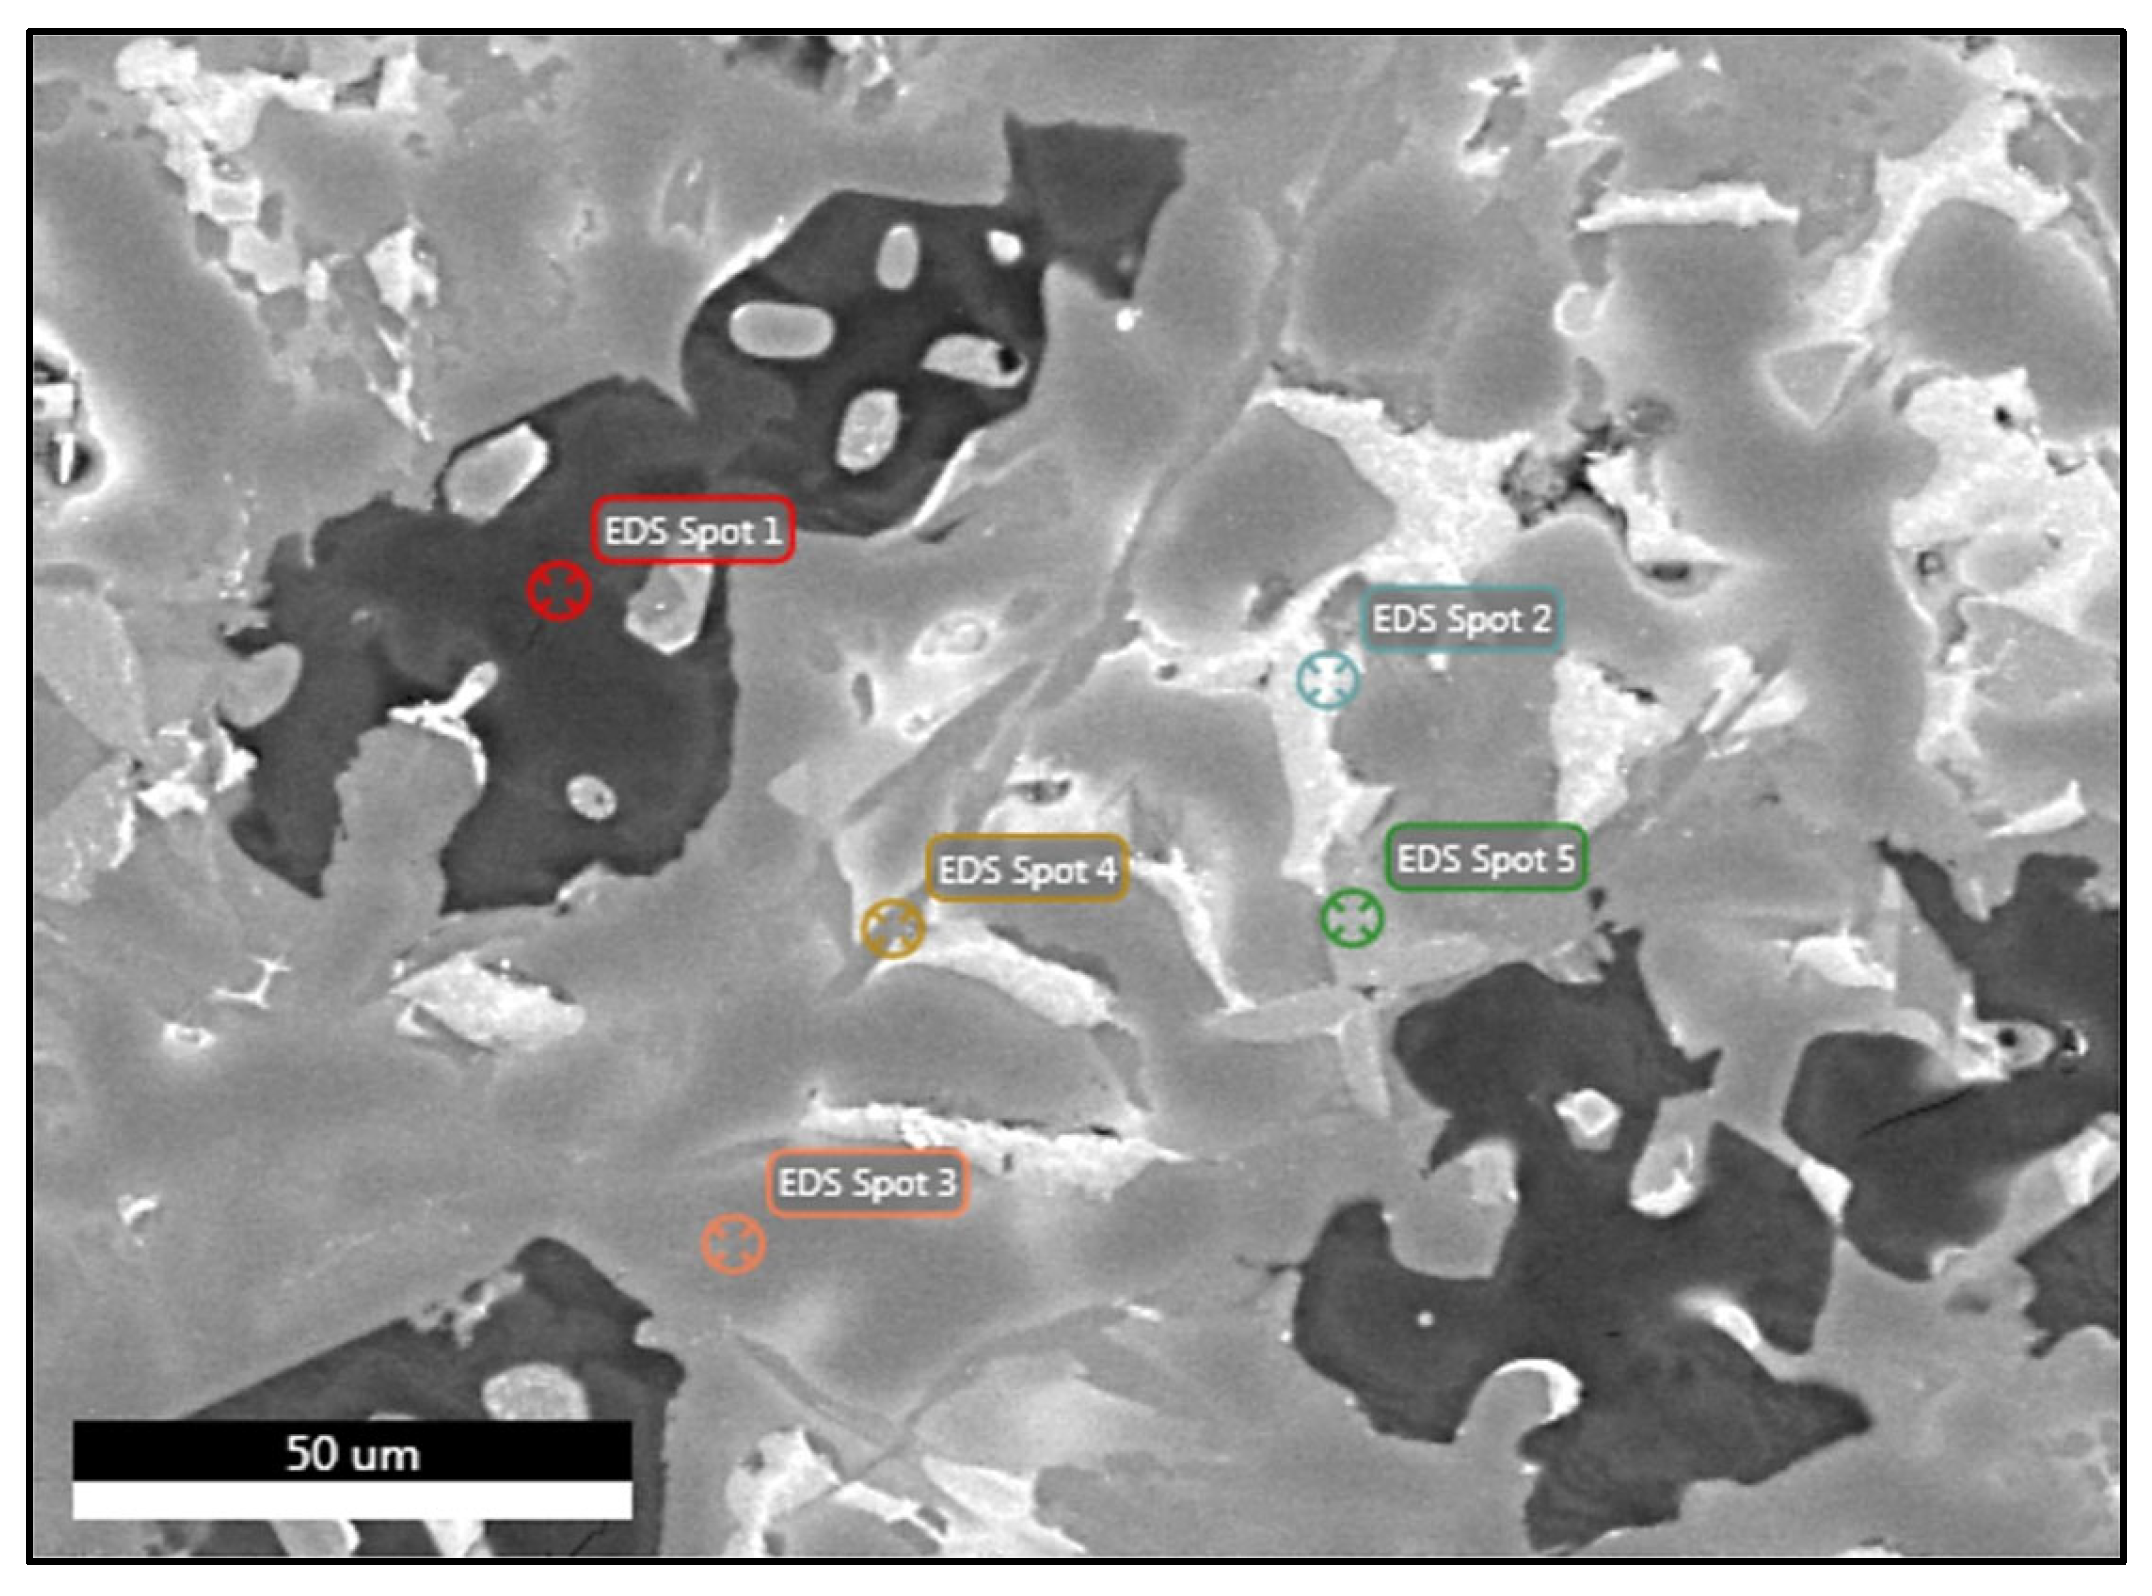
| Element | Spot 1 (w.t.%) | Spot 1 (a.t.%) | Spot 2 (w.t.%) | Spot 2 (a.t.%) | Spot 3 (w.t.%) | Spot 3 (a.t.%) | Spot 4 (w.t.%) | Spot 4 (a.t.%) | Spot 5 (w.t.%) | Spot 5 (a.t.%) |
|---|---|---|---|---|---|---|---|---|---|---|
| Al | 1.0 | 1.0 | 45.4 | 64.8 | 81.0 | 89.4 | 18.0 | 22.0 | 72.3 | 77.2 |
| Mg | 52.7 | 56.9 | 1.3 | 2.1 | 1.6 | 2.0 | 24.1 | 32.6 | 0.3 | 0.3 |
| Cu | 0.7 | 0.3 | 48.9 | 29.7 | 3.5 | 1.6 | 21.2 | 11.7 | 0 | 0 |
| Zn | 1.4 | 0.6 | 3.3 | 1.9 | 12.8 | 5.8 | 14.1 | 7.1 | 0 | 0 |
| Si | 44.2 | 41.3 | 1.1 | 1.5 | 1.1 | 1.2 | 22.7 | 26.6 | 16.2 | 16.7 |
| Fe | - | - | - | - | - | - | - | - | 11.1 | 5.7 |
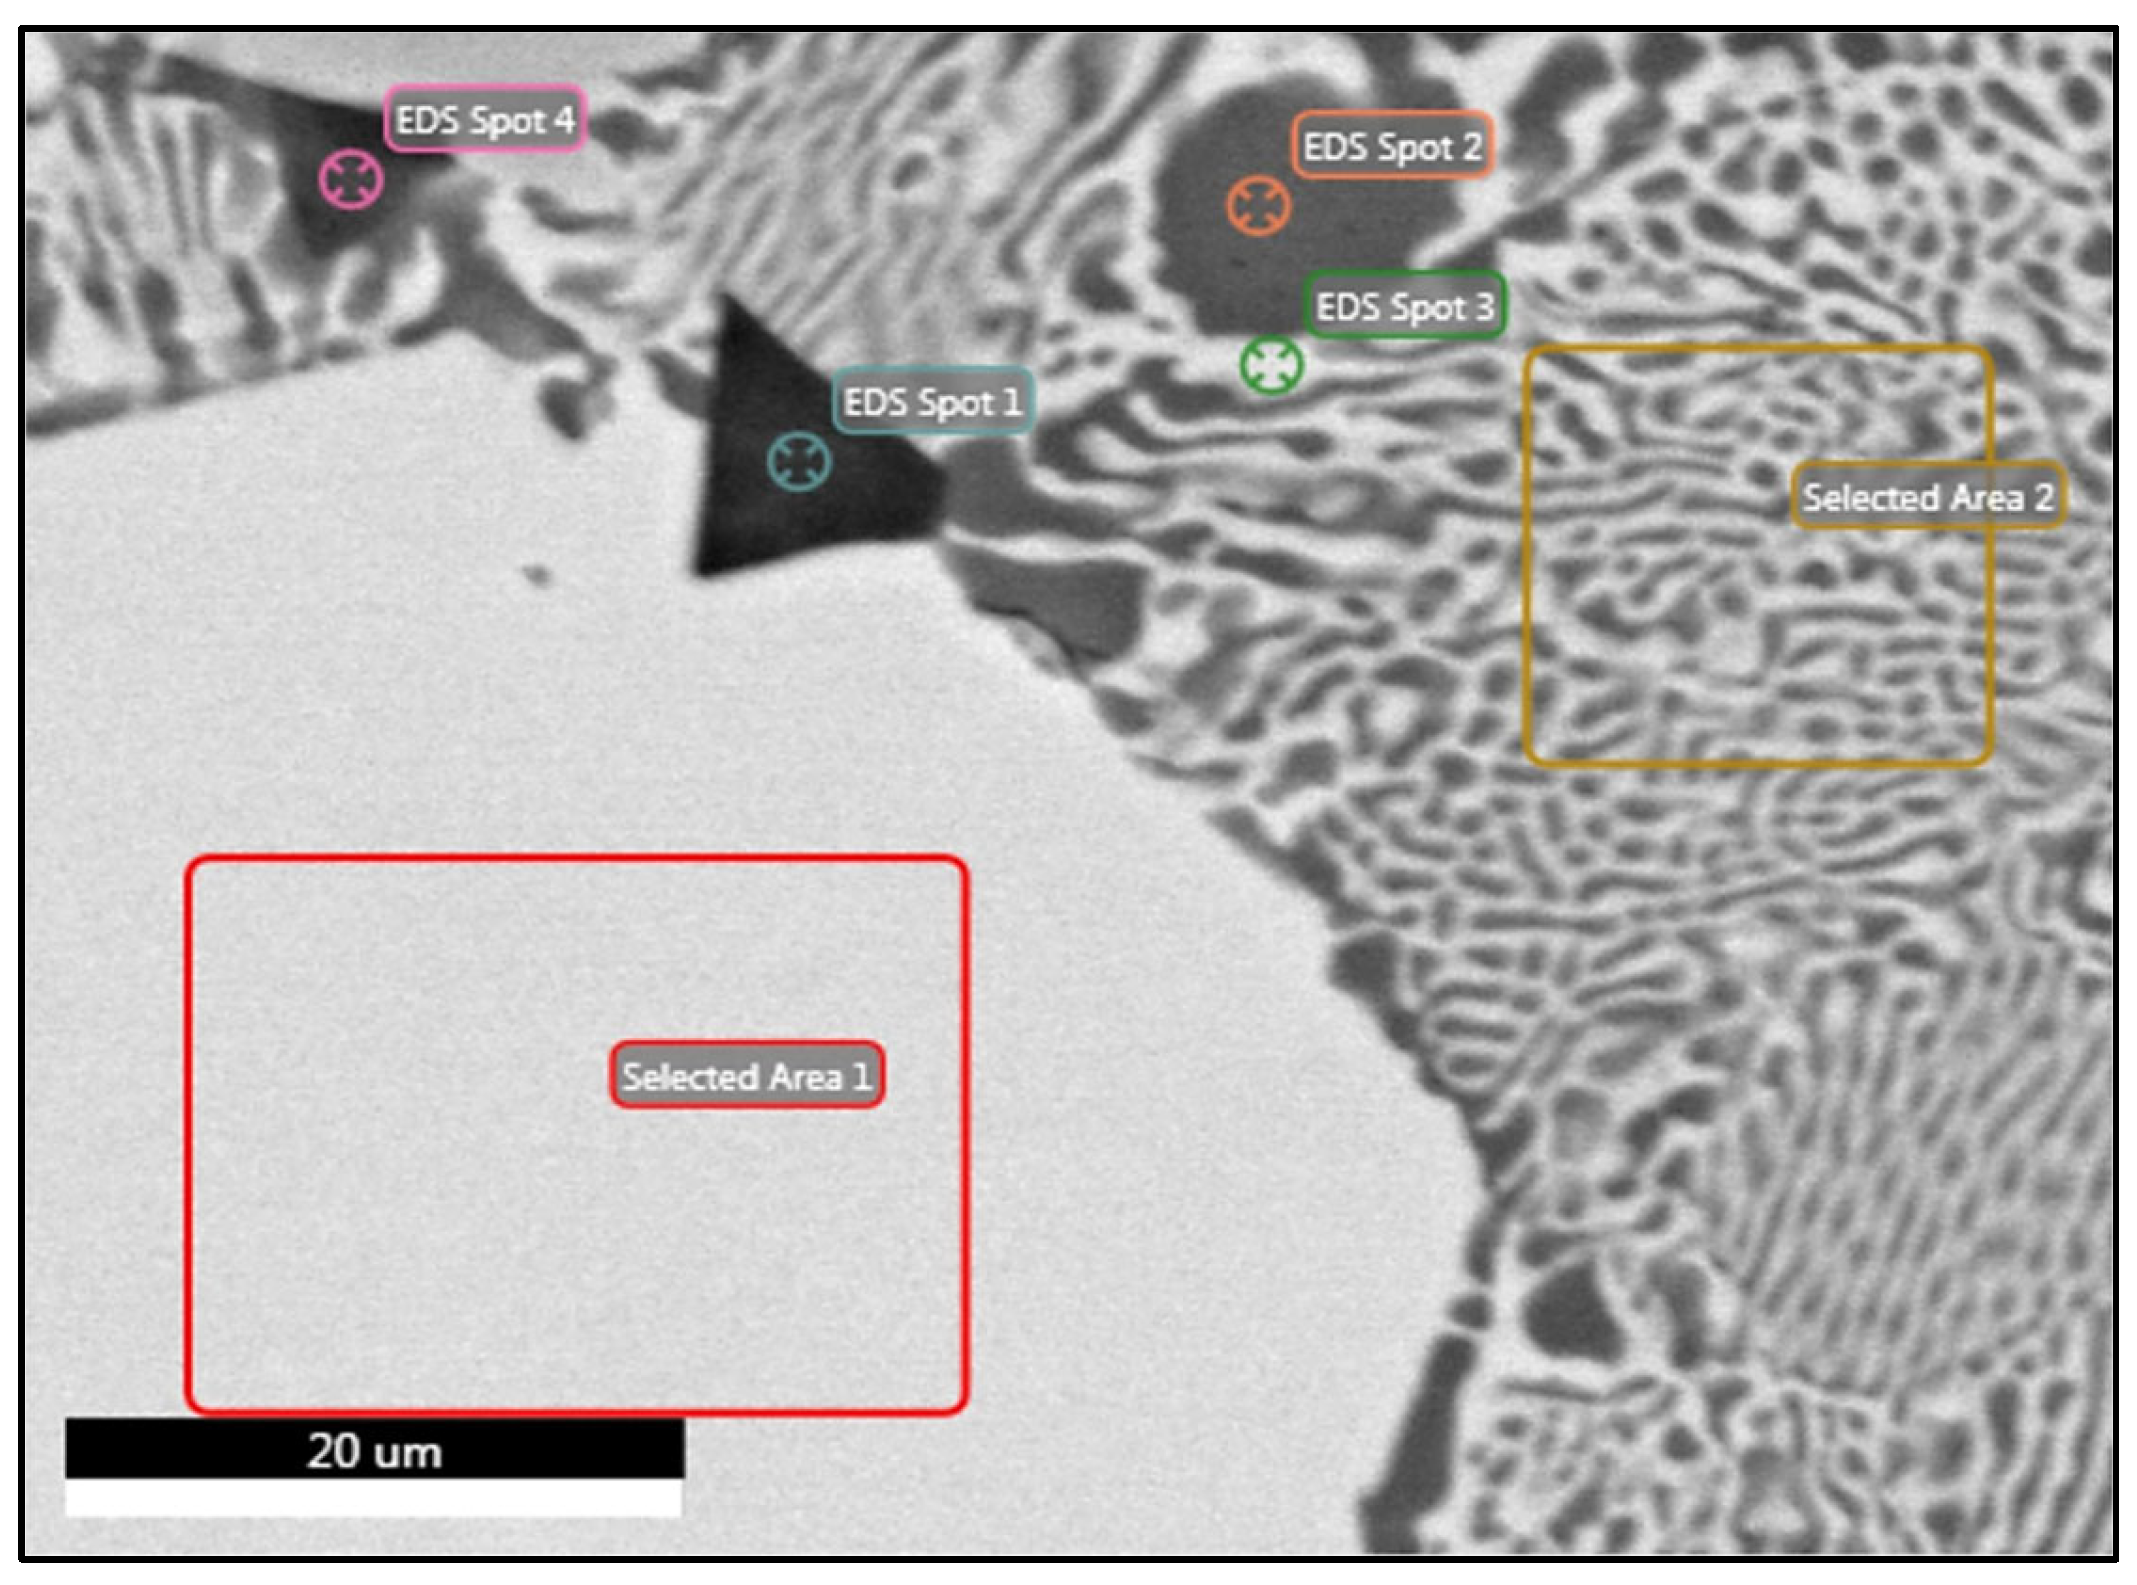
| Element | Area 1 (w.t.%) | Area 1 (a.t.%) | Spot 1 (w.t.%) | Spot 1 (a.t.%) | Spot 2 (w.t.%) | Spot 2 (a.t.%) | Area 2 (w.t.%) | Area 2 (a.t.%) | Spot 3 (w.t.%) | Spot 3 (a.t.%) |
|---|---|---|---|---|---|---|---|---|---|---|
| Al | 30.3 | 40.4 | 2.0 | 2.0 | 87.3 | 90.4 | 54.4 | 64.7 | 36.4 | 46.4 |
| Mg | 22.3 | 33.0 | 43.4 | 47.7 | 5.8 | 6.7 | 15.3 | 20.2 | 22.4 | 31.7 |
| Cu | 23.4 | 13.3 | 1.4 | 0.6 | 2.0 | 0.9 | 12.9 | 6.5 | 14.8 | 8.0 |
| Zn | 24.0 | 13.3 | 1.8 | 0.8 | 4.9 | 2.1 | 17.5 | 8.6 | 26.4 | 13.9 |
| Si | - | 51.4 | 49.0 | - | - | - | - | - | - |
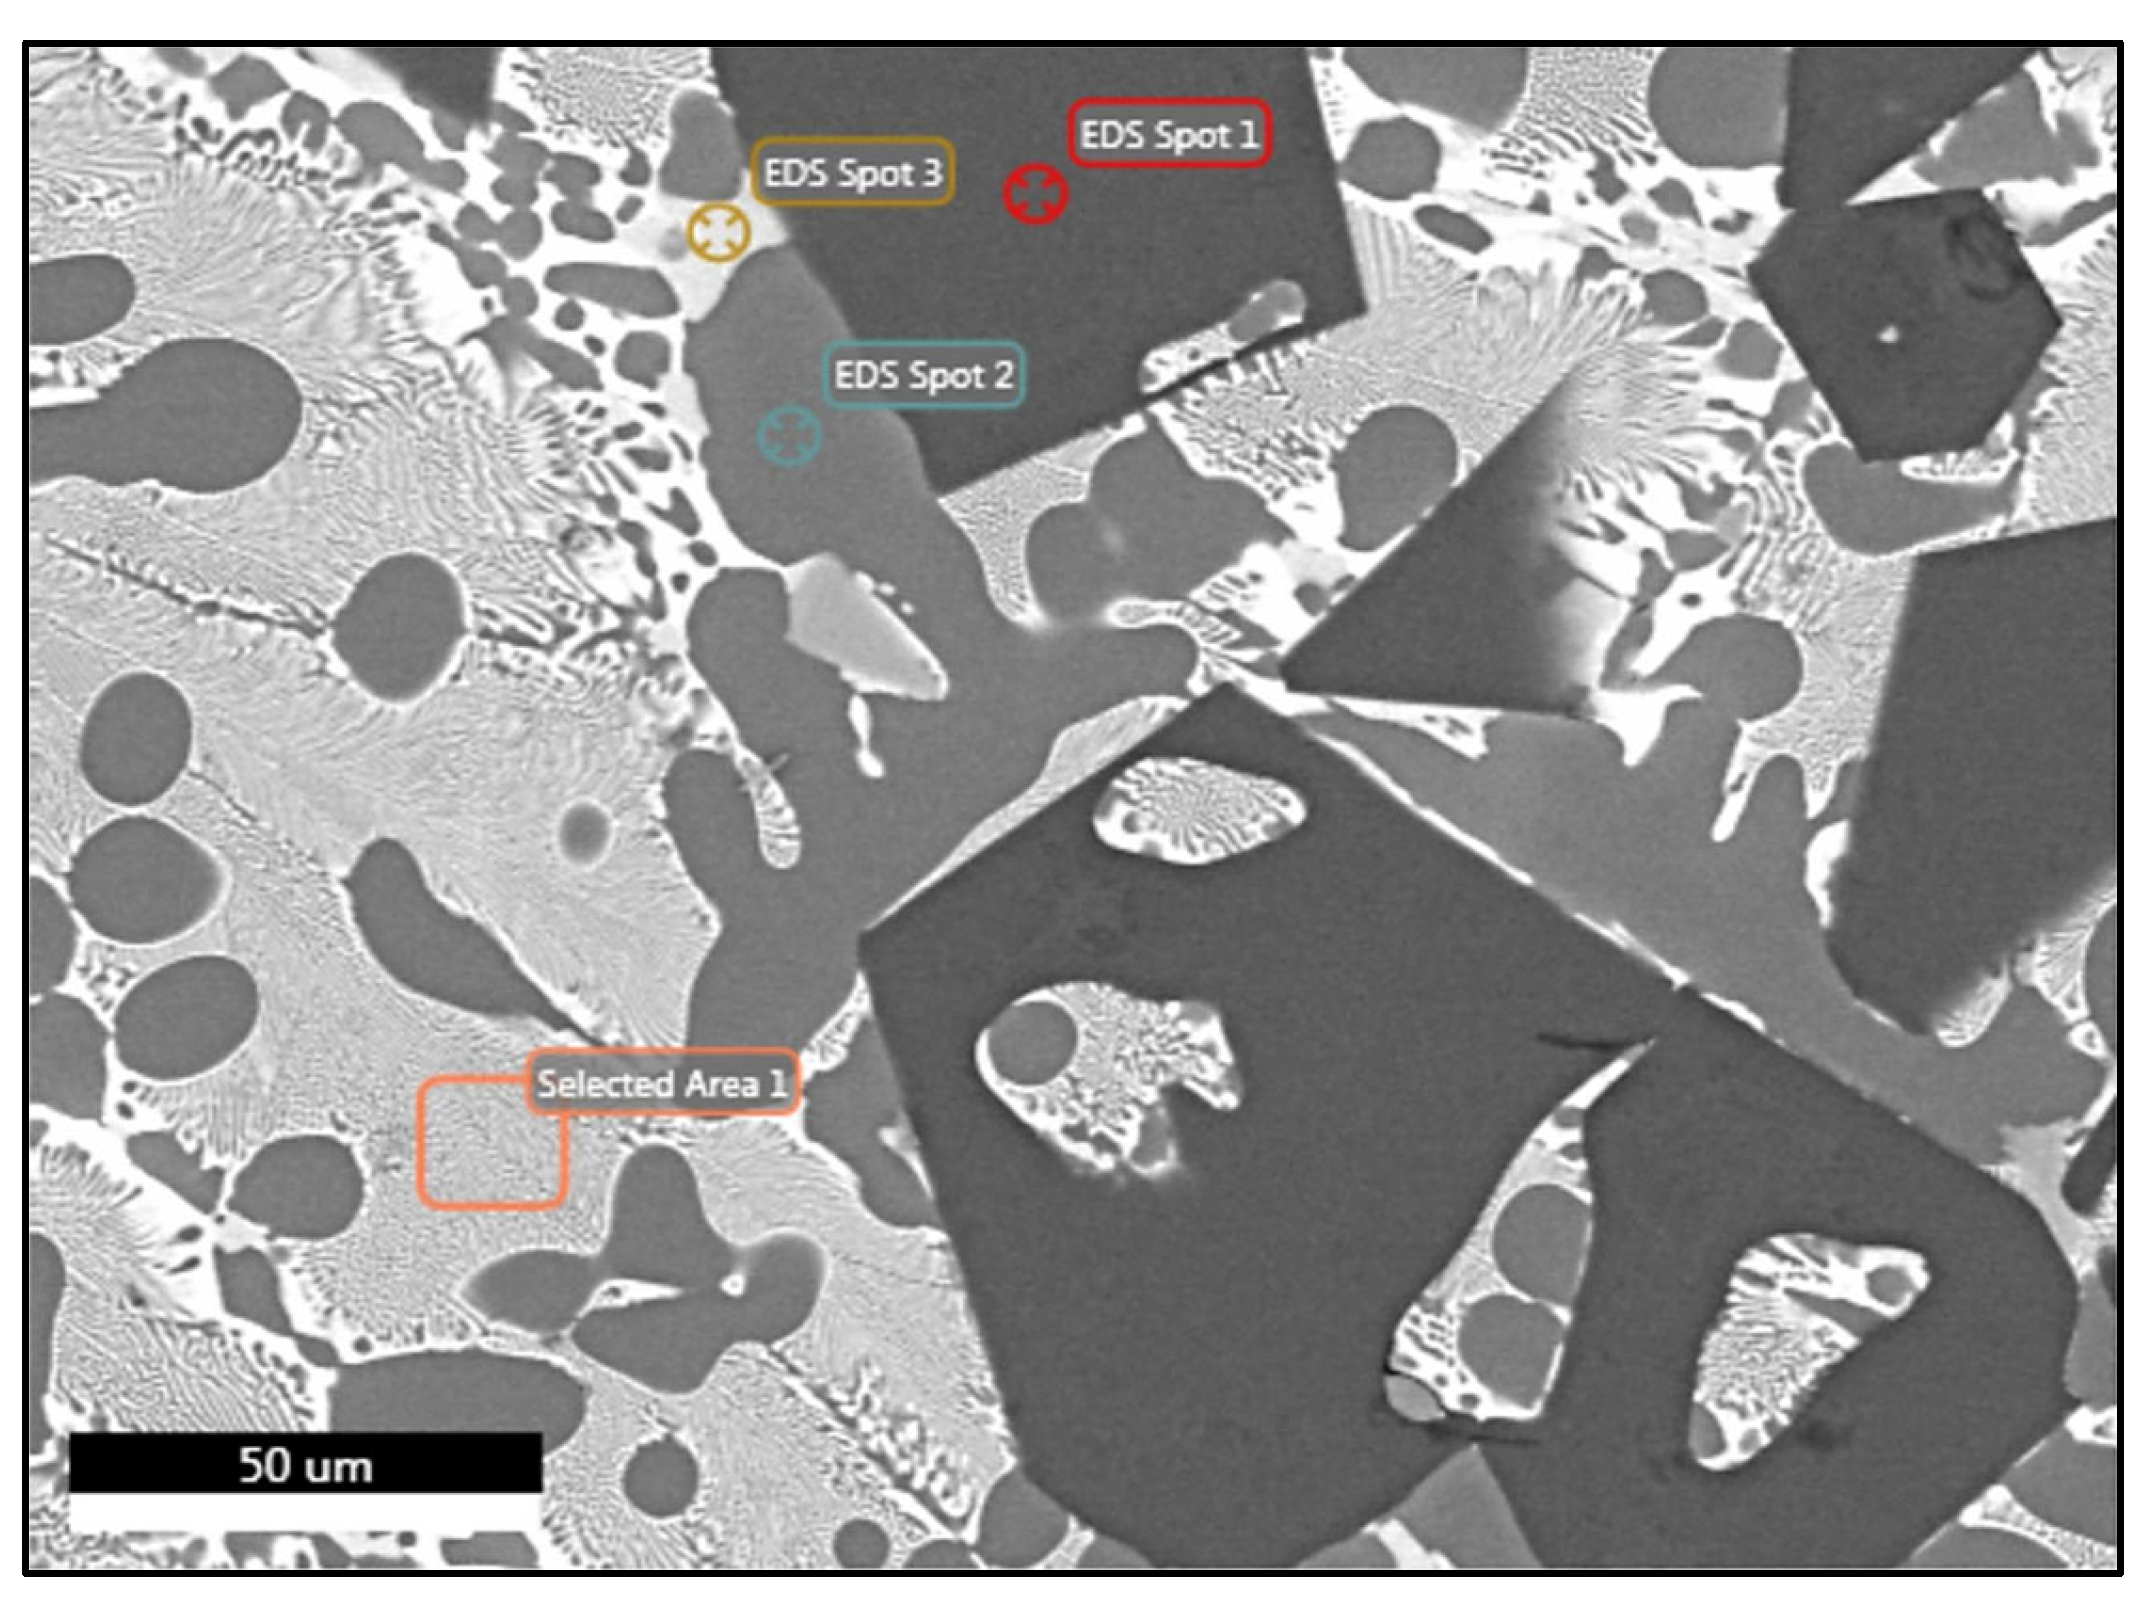
| Element | Area 1 (w.t.%) | Area 1 (a.t.%) | Spot 1 (w.t.%) | Spot 1 (a.t.%) | Spot 2 (w.t.%) | Spot 2 (a.t.%) | Spot 3 (w.t.%) | Spot 3 (a.t.%) |
|---|---|---|---|---|---|---|---|---|
| Al | 50.0 | 63.7 | 0.9 | 0.9 | 86.2 | 91.0 | 47.2 | 2.5 |
| Mg | 10.5 | 14.9 | 61.0 | 64.9 | 3.6 | 4.3 | 1.6 | 66.4 |
| Cu | 18.0 | 9.8 | 0.5 | 0.2 | 2.3 | 1.1 | 47.5 | 28.4 |
| Zn | 20.9 | 11.0 | 0.9 | 0.3 | 7.3 | 3.2 | 3.1 | 1.8 |
| Si | 0.6 | 0.7 | 36.7 | 32.7 | 0.5 | 0.5 | 0.7 | 0.9 |
| Element | Spot 1 (w.t.%) | Spot 1 (a.t.%) | Spot 2 (w.t.%) | Spot 2 (a.t.%) | Spot 3 (w.t.%) | Spot 3 (a.t.%) | Spot 4 (w.t.%) | Spot 4 (a.t.%) |
|---|---|---|---|---|---|---|---|---|
| Al | 0.9 | 0.8 | 16.0 | 17.7 | 47.7 | 67.3 | 69.5 | 83.6 |
| Mg | 50.5 | 54.6 | 32.7 | 40.1 | 0.8 | 1.3 | 1.0 | 1.4 |
| Cu | 0.6 | 0.2 | 17.7 | 8.3 | 47.6 | 28.5 | 3.3 | 1.7 |
| Zn | 1.3 | 0.5 | 3.1 | 1.4 | 2.9 | 1.7 | 25.5 | 12.6 |
| Si | 46.8 | 43.8 | 30.5 | 32.4 | 0.9 | 1.2 | 0.6 | 0.8 |
| Specimen | Hardness (HV4) | Density (g/cm3) | Specific Hardness |
| A | 236 | 3.15 | 74.9 |
| A4 | 256 | 3.15 | 81.3 |
| A24 | 241 | 3.15 | 76.5 |
| B | 245 | 3.18 | 77 |
| B4 | 245 | 3.18 | 77 |
| B24 | 251 | 3.18 | 78.9 |
| AM | 246 | 2.73 | 90.1 |
| AM4 | 229 | 2.73 | 83.9 |
| AM24 | 219 | 2.73 | 80.2 |
Disclaimer/Publisher’s Note: The statements, opinions and data contained in all publications are solely those of the individual author(s) and contributor(s) and not of MDPI and/or the editor(s). MDPI and/or the editor(s) disclaim responsibility for any injury to people or property resulting from any ideas, methods, instructions or products referred to in the content. |
© 2025 by the authors. Licensee MDPI, Basel, Switzerland. This article is an open access article distributed under the terms and conditions of the Creative Commons Attribution (CC BY) license (https://creativecommons.org/licenses/by/4.0/).
Share and Cite
Chaskis, S.; Tiktopoulos, C.; Gavalas, E.; Bouzouni, M.; Tsiolis, F.; Papaefthymiou, S. Compositional Design, Microstructure, and Thermal Processing of Aluminum-Based Complex Concentrated Alloys. Crystals 2025, 15, 88. https://doi.org/10.3390/cryst15010088
Chaskis S, Tiktopoulos C, Gavalas E, Bouzouni M, Tsiolis F, Papaefthymiou S. Compositional Design, Microstructure, and Thermal Processing of Aluminum-Based Complex Concentrated Alloys. Crystals. 2025; 15(1):88. https://doi.org/10.3390/cryst15010088
Chicago/Turabian StyleChaskis, Spyridon, Constantinos Tiktopoulos, Evangelos Gavalas, Marianthi Bouzouni, Fotis Tsiolis, and Spyros Papaefthymiou. 2025. "Compositional Design, Microstructure, and Thermal Processing of Aluminum-Based Complex Concentrated Alloys" Crystals 15, no. 1: 88. https://doi.org/10.3390/cryst15010088
APA StyleChaskis, S., Tiktopoulos, C., Gavalas, E., Bouzouni, M., Tsiolis, F., & Papaefthymiou, S. (2025). Compositional Design, Microstructure, and Thermal Processing of Aluminum-Based Complex Concentrated Alloys. Crystals, 15(1), 88. https://doi.org/10.3390/cryst15010088