Article

Interpretation of Copper Rolling Texture Components Development Based on Computer Modeling

by
Wiesław Łatas
1,
Mirosław Wróbel
1,
Krzysztof Wierzbanowski
2,* and
Dorota Byrska-Wójcik
1
1
Faculty of Metals Engineering and Industrial Computer Science, AGH University of Krakow, al. Mickiewicza 30, 30-059 Kraków, Poland
2
Faculty of Physics and Applied Computer Sciences, AGH University of Krakow, al. Mickiewicza 30, 30-059 Kraków, Poland
*
Author to whom correspondence should be addressed.
Crystals 2025, 15(12), 1011; https://doi.org/10.3390/cryst15121011
Submission received: 16 September 2025 / Revised: 17 November 2025 / Accepted: 20 November 2025 / Published: 24 November 2025

Abstract

Plastic deformation processes are widely used in metal forming. At the same time, they produce crystallographic textures that determine a material’s anisotropy—for example, its elastic, plastic, or magnetic anisotropy. Because these properties have significant practical implications and require precise control, understanding the mechanisms of texture formation is essential. Consequently, the evolution of texture during plastic forming remains an important topic for both scientific and engineering communities. The most important models describing crystallographic texture development during plastic deformation were briefly reviewed. Based on a comparison of experimental results with numerical simulations obtained using the authors’ original fluctuating stress state (FSS) model, the main texture components were identified. It was shown that their volume fractions are primarily related to deformation fields in grains of polycrystalline material constrained by extreme boundary conditions, as well as to anisotropy in slip system hardening (A). The influence of both parameters and rolling true strain (1.5 and 2) on the copper rolling texture was evaluated by quantifying the fractions of the texture components, including the strong ones (B, S, Cu) and the weaker ones (G, W, rW). This constitutes the main novelty of the present work.

1. Introduction

Plastic deformation processes are commonly used in metal forming. At the same time, they generate crystallographic texture (hereafter referred to simply as “texture”), which determines the material’s anisotropy—for example, elastic, plastic, or magnetic anisotropy. The practical significance of these properties and the need for precise control make it essential to understand the mechanisms of texture formation. This is also true for the rolling of copper (see Refs. [1,2,3,4,5]).
Texture evolution can be predicted using hybrid models that combine the Finite Element Method (FEM) with deformation models based on crystal plasticity, known as Crystal Plasticity Finite Element (CPFE) models (e.g., [6,7,8,9]). FEM enables the determination of strain and stress fields within the deformed material. Crystal plasticity models, which constitute the core of CPFE simulations, determine shear deformation in active slip systems (and sometimes twinning systems) and the resulting changes in crystal orientations.
Two types of crystallographic models exist. The first group is based on the physics of plastic deformation (i.e., dislocations and their movement) and requires significantly greater computational resources. The second group employs phenomenological descriptions, which are much simpler and less computationally demanding (e.g., [9]). The model used in this work belongs to the latter category. However, simplicity comes at a cost. During computer simulations, differences in the hardness of sample regions with various crystallographic orientations and microstructures are often neglected. These differences, however, may influence the strain and stress fields in neighboring regions, leading to imprecise predictions of the deformation texture in highly deformed polycrystals. Despite this strong simplification, the results obtained from deformation models are surprisingly consistent with experimental observations (e.g., [10,11]). Yet, such simplifications hinder the understanding of important details related to texture formation.
Nevertheless, modeling texture development in polycrystalline samples containing many grains with different crystallographic orientations remains the subject of ongoing research (e.g., [12,13,14]). However, with current computer architectures, computational power is still insufficient to simulate the deformation of industrial-scale polycrystalline products containing approximately 109 grains per cubic centimeter using CPFE procedures, regardless of the type of coupled crystallographic model employed.
Fortunately, gaining insight into texture formation does not require simulations of this magnitude. To a first approximation, analyzing the relationship between the symmetry of slip system shears for a given crystallographic orientation and the symmetry of the deformation process is sufficient to identify the main components of deformation texture [15,16]. Deeper insight has been obtained through simulations of lattice rotation in orientation space under approximate strain or stress fields. The selected phenomenological models applied for this purpose are briefly described in this work.
One of them—the fluctuating stress (FSS) model—is a simple and flexible approach [17]. It has been applied by the present authors to model rolling texture development in polycrystalline copper (a face-centered cubic metal characterized by such a high stacking-fault energy that plastic deformation occurs exclusively by crystallographic slip in {111}<110> systems). In these calculations, macroscopic constraints were imposed on the deformation field within groups of grains while simultaneously accounting for anisotropic slip system hardening effects. Imposing constraints on selected strain field components allows for examination of grain shape effects and rolled-sample geometry on the resulting texture. This approach correctly describes the deformation process and improves agreement between predicted and experimental textures.
A better understanding of the factors governing crystalline texture formation enables more precise control of it. This is of considerable practical importance, as texture-controlled plastic anisotropy determines a material’s deep-drawing performance (i.e., its influence on the normal and planar plastic anisotropy coefficients).

2. Crystallographic Models of Plastic Deformation—Short Review

The use of crystalline deformation models can significantly facilitate the production of materials with desired anisotropy. A comprehensive overview of models for polycrystalline plasticity and deformation texture prediction can be found elsewhere [18]. However, selected crystalline deformation models, discussed from the perspective of constraint relaxation, are briefly presented in this section.
The discussion focuses primarily on face-centered cubic (FCC) metals with medium or high stacking fault energy (SFE), where deformation occurs through dislocation slip with Burgers vector (a/2)⟨110⟩—with a being the unit cell parameter—on {111} planes (i.e., via {111}⟨110⟩ slip systems). This slip mechanism is characteristic of materials such as aluminum and copper.
Modeling deformation in other metals—those that undergo a combination of slip and twinning, or deformation by other slip modes (e.g., in hexagonal crystal structures)—is more challenging and lies beyond the scope of the present work, although occasional references to such cases are included.
The models presented below are arranged in order of decreasing constraints imposed on the grain deformation field.

2.1. Fully Constrained Deformation, Taylor–Bishop–Hill Approach

In the Taylor model [14,15,19,20], it is assumed that the microscopic plastic strain in each grain, e i j , is spatially uniform and identical to the macroscopic plastic strain of the polycrystalline aggregate, E i j (i.e., e i j = E i j ). Thus, the strain compatibility condition is satisfied. When elastic strains are neglected and e i j is produced through multiple slip, it can be expressed as:
e i j   = 1 2   s ( m i j s + m j i s )   γ s
where s indexes the FCC slip systems ( s = 1,2 , , 24 ); m i j s is the dyadic product of the unit slip direction vector b i s (i.e., parallel to the Burgers vector of the gliding dislocations) and the unit normal to the slip plane n j s for slip system s ; and γ s is the simple shear strain in that slip system.
The tensor e i j is symmetric, and its hydrostatic component is zero ( e i i = 0 ). Therefore, the plastic deformation of any grain can be uniquely described by five linearly independent components. Consequently, it may be accommodated by slip on five mutually independent slip systems (the von Mises condition [21]).
The active combination of slip systems can be determined using Taylor’s principle of minimum internal work [19,20]. Together with the Schmid law [22], this principle can be stated as follows: the combination of five independent slip systems is activated for which the internal work s τ c   s γ   s is minimized. The quantity τ c s is the critical resolved shear stress for slip in system s , which, according to the Schmid law, satisfies the relation:
m i j s   σ i j       τ c s
where σ i j is the local stress acting on a grain. The equality in this equation applies to the active slip systems (at least one). The selection of these systems can also be made based on the Bishop–Hill principle of maximum external work [23,24]. According to this principle, the combination of slip systems ( q ) corresponding to the stress state σ i j q in a grain maximizes the external work, σ i j q e i j .
Both principles—that is, the minimum internal work and the maximum external work—are equivalent for classical models [25] as well as for the relaxed models [26,27] described in Section 2.2. Therefore, they are often collectively referred to as the Taylor–Bishop–Hill (TBH) approach. For example, in a fully constrained model, the strain components in the interior of the rolled material can be expressed as:
e 23 = 0 ,     e 13 = 0 ,     e 12 = 0 ,     e 22 = 0 ,       e 33 < 0 .
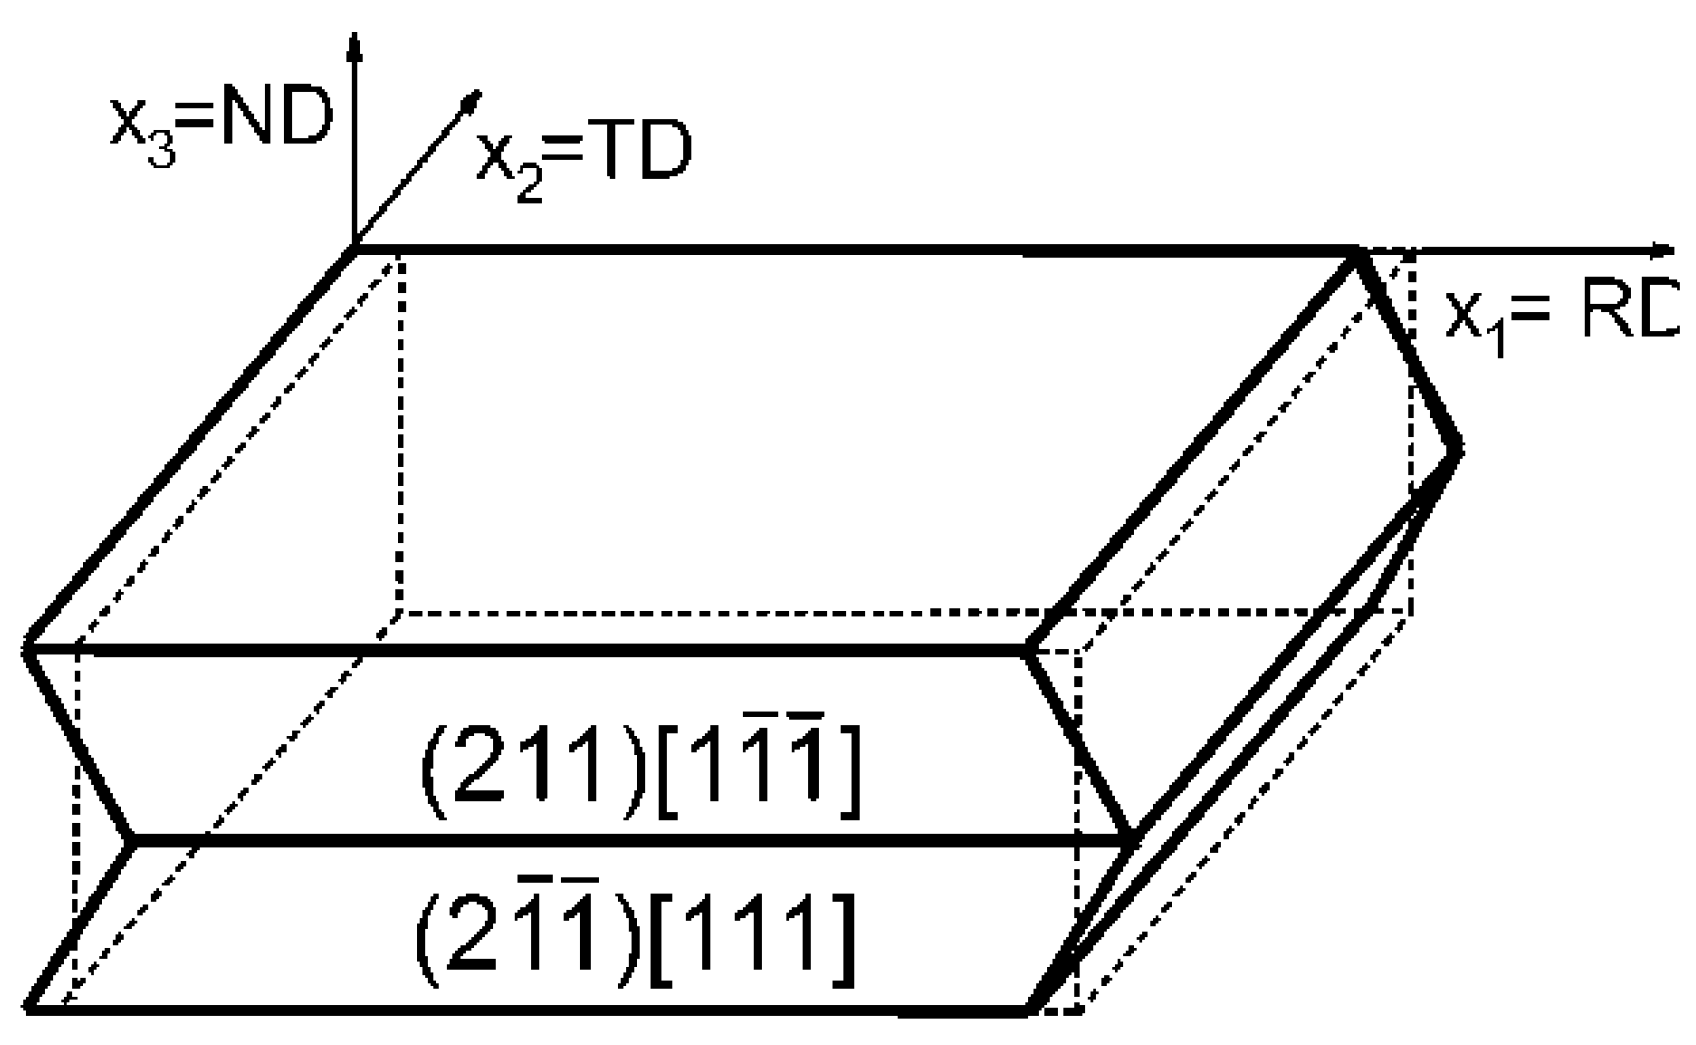
The reference frame of the rolling process is shown in Figure 1. It should be mentioned, however, that in TBH models, the stress equilibrium condition at grain boundaries is not verified.

2.2. Models with Relaxation of Selected Strain Components

The TBH approach, which assumes that all components of the plastic strain tensor in each grain are identical to those of the bulk sample, is generally not valid. In particular, some components may be free (i.e., relaxed), as was assumed in the Relaxed Constraints (RC) models [27,28,29,30,31,32,33,34,35]. The selection of relaxed strain components within a grain depends on its shape. In highly rolled polycrystalline metals, flat grains dominate, i.e., grains for which L 3 / L 1 1 and L 3 / L 2 1 , where L 1 , L 2 , and L 3 are the grain length, width, and thickness, respectively. Due to their shape, such grains are referred to as “pancake grains” (e.g., [34,36,37,38,39,40,41]). For these grains, the deformation boundary conditions can be written (e.g., [27,28,29,30,31]) as:
e 33 < 0 ,     e 22 = 0 ,     e 12 = 0 ,
Thus, the remaining ε 23 and ε 13 components are relaxed (Figure 2).
However, it cannot be excluded that a grain with macroscopically constrained shear may decompose into deformation bands exhibiting unconstrained and mutually compensating shear strains. Such behavior was observed in rolled copper single crystals with an initial { 100 } 011 orientation, which fragmented into deformation bands with mutually symmetric { 112 } 111 orientations [42,43], as shown in Figure 3. This possibility was taken into account in the Lame model [44,45].
The pancake grain assumption has often been used in the literature for rolling texture simulations (e.g., [34,46,47,48,49,50]). However, in a polycrystalline sample, certain elongated grains may dominate. For such grains, L 3 / L 1 1 and L 2 / L 1 < 1 ; therefore, they are also referred to as lath grains (e.g., [34,37,38,39,40,41]). In this case, the deformation boundary conditions can be written as:
e 33 < 0       e 22 = 0       e 23 = 0         e 12 = 0 ,
so that only the e 13 shear component remains unconstrained.
The transition from flat to elongated grains can be described as a gradual increase in constraint on e 23 , correlated with increasing L 1 / L 2 . This approach was subsequently adopted in the literature (e.g., [8,49,51]). In RC models, it is assumed that free strain components e i j do not influence the internal stress state in a grain, and the corresponding stress components are equal to zero [31].
With the exception of grains with symmetric orientations, the number of active slip systems predicted by RC models is equal to the number of constrained components of e i j . Thus, three or two mutually/linearly independent slip systems are activated within a flat grain, and four within an elongated grain. This is because slip in p mutually independent systems allows the p deformation constraints to be satisfied (see Equation (1)). Experimental observations of slip lines confirm the possibility of activating fewer slip systems in the grain interior than predicted by the TBH model [52,53]. This demonstrates the advantage of RC models, which allow the formation of a non-uniform deformation field within grains of highly deformed polycrystalline materials.
According to these models, plastic accommodation of deformation mismatch between adjacent grains occurs primarily in small regions near short grain boundaries approximately perpendicular to the rolling plane. It should be noted that RC models are often interpreted as deformation models allowing relaxation of any combination of shear strain components and grain widening [54]. Various equivalent mathematical procedures for selecting active slip systems in RC models have been proposed [26,27,28,31,33,35]. However, in each of these approaches, only those combinations of slip system shears that satisfy the imposed strain boundary conditions are activated.

2.3. Sachs-Type Models

The Sachs model [55] is historically the first modern model describing the physics of plastic deformation. In the original Sachs formulation, it was assumed that the deformation of a grain is identical to that of a freely deforming single crystal with the same crystallographic orientation. Accordingly, the stress σ i j within each grain is assumed to be equal to the applied (external) stress σ i j e x . However, to reach the yield point of a grain with a specific lattice orientation, its local stress state must be scaled by a factor α :
σ i j = α   σ i j e x
In the case of rolling (particularly for the dominant portion of the material, located near the mid-width of the sample), the external stress state can be approximated by the biaxial plane stress condition, represented by the Tucker tensor—commonly used in technological practice [9,56,57]:
T σ 33 = T σ 11   and   T σ 22 = T σ 23 = T σ 13 = T σ 12 = 0 .
In this model, the selection of active slip systems follows Schmid’s law. Thus, according to Equation (2), plastic deformation in a grain occurs only in the slip system (or systems, for grains with symmetric orientations) for which σ i j generates a shear stress reaching the critical value. Because this stress depends on the grain orientation, it varies from grain to grain. As a result, the stress equilibrium condition cannot be satisfied at every point in the polycrystalline sample. Moreover, the deformation of neighboring grains—dominated by single-slip activity predicted by the Sachs model—produces different shape changes, so strain compatibility across grain boundaries is not fulfilled.
Modifications to the classical Sachs model [58,59,60,61] addressed these shortcomings. In the modified versions, plastic deformation begins with activation of the slip system identified via Schmid’s law under the external stress σ i j e x , and is carried out by dislocation avalanches on discrete slip planes. These avalanches form pile-ups at grain boundaries, thereby changing the local stress state. This altered stress field activates secondary slip systems that can reduce strain and stress incompatibilities between adjacent grains. The effect of these secondary slip systems may also be significant within the grains themselves [62]. As a result, each grain undergoes multiple slip, the activity of which depends on its crystallographic orientation and the deformation of its surroundings. It has been shown that the long-range stress level is significantly lower than that predicted by the TBH model, due to the action of these secondary slip systems. Leffers estimated the lower limit of these stresses to be approximately 0.05 of the applied external stress [62].

2.4. Self-Consistent Approach

The adjective self-consistent means that all parts, principles, facts, ideas, or actions are in mutual agreement (cf. the definition in the Oxford English Dictionary [63]). The earliest recorded use of the term in this sense appears in a theological text by John Goodwin from 1651. The self-coherence of natural laws (e.g., [64,65]) provides the foundation for the pursuit of self-consistent models of polycrystalline deformation that ensure both continuity of the strain field and stress equilibrium at every point within the body. Models of this type, based on mean field approximation—originally introduced to describe magnetism by P. Curie [66] and P. Weiss [67]—have also been used to account for the influence of a grain’s surroundings on its deformation.
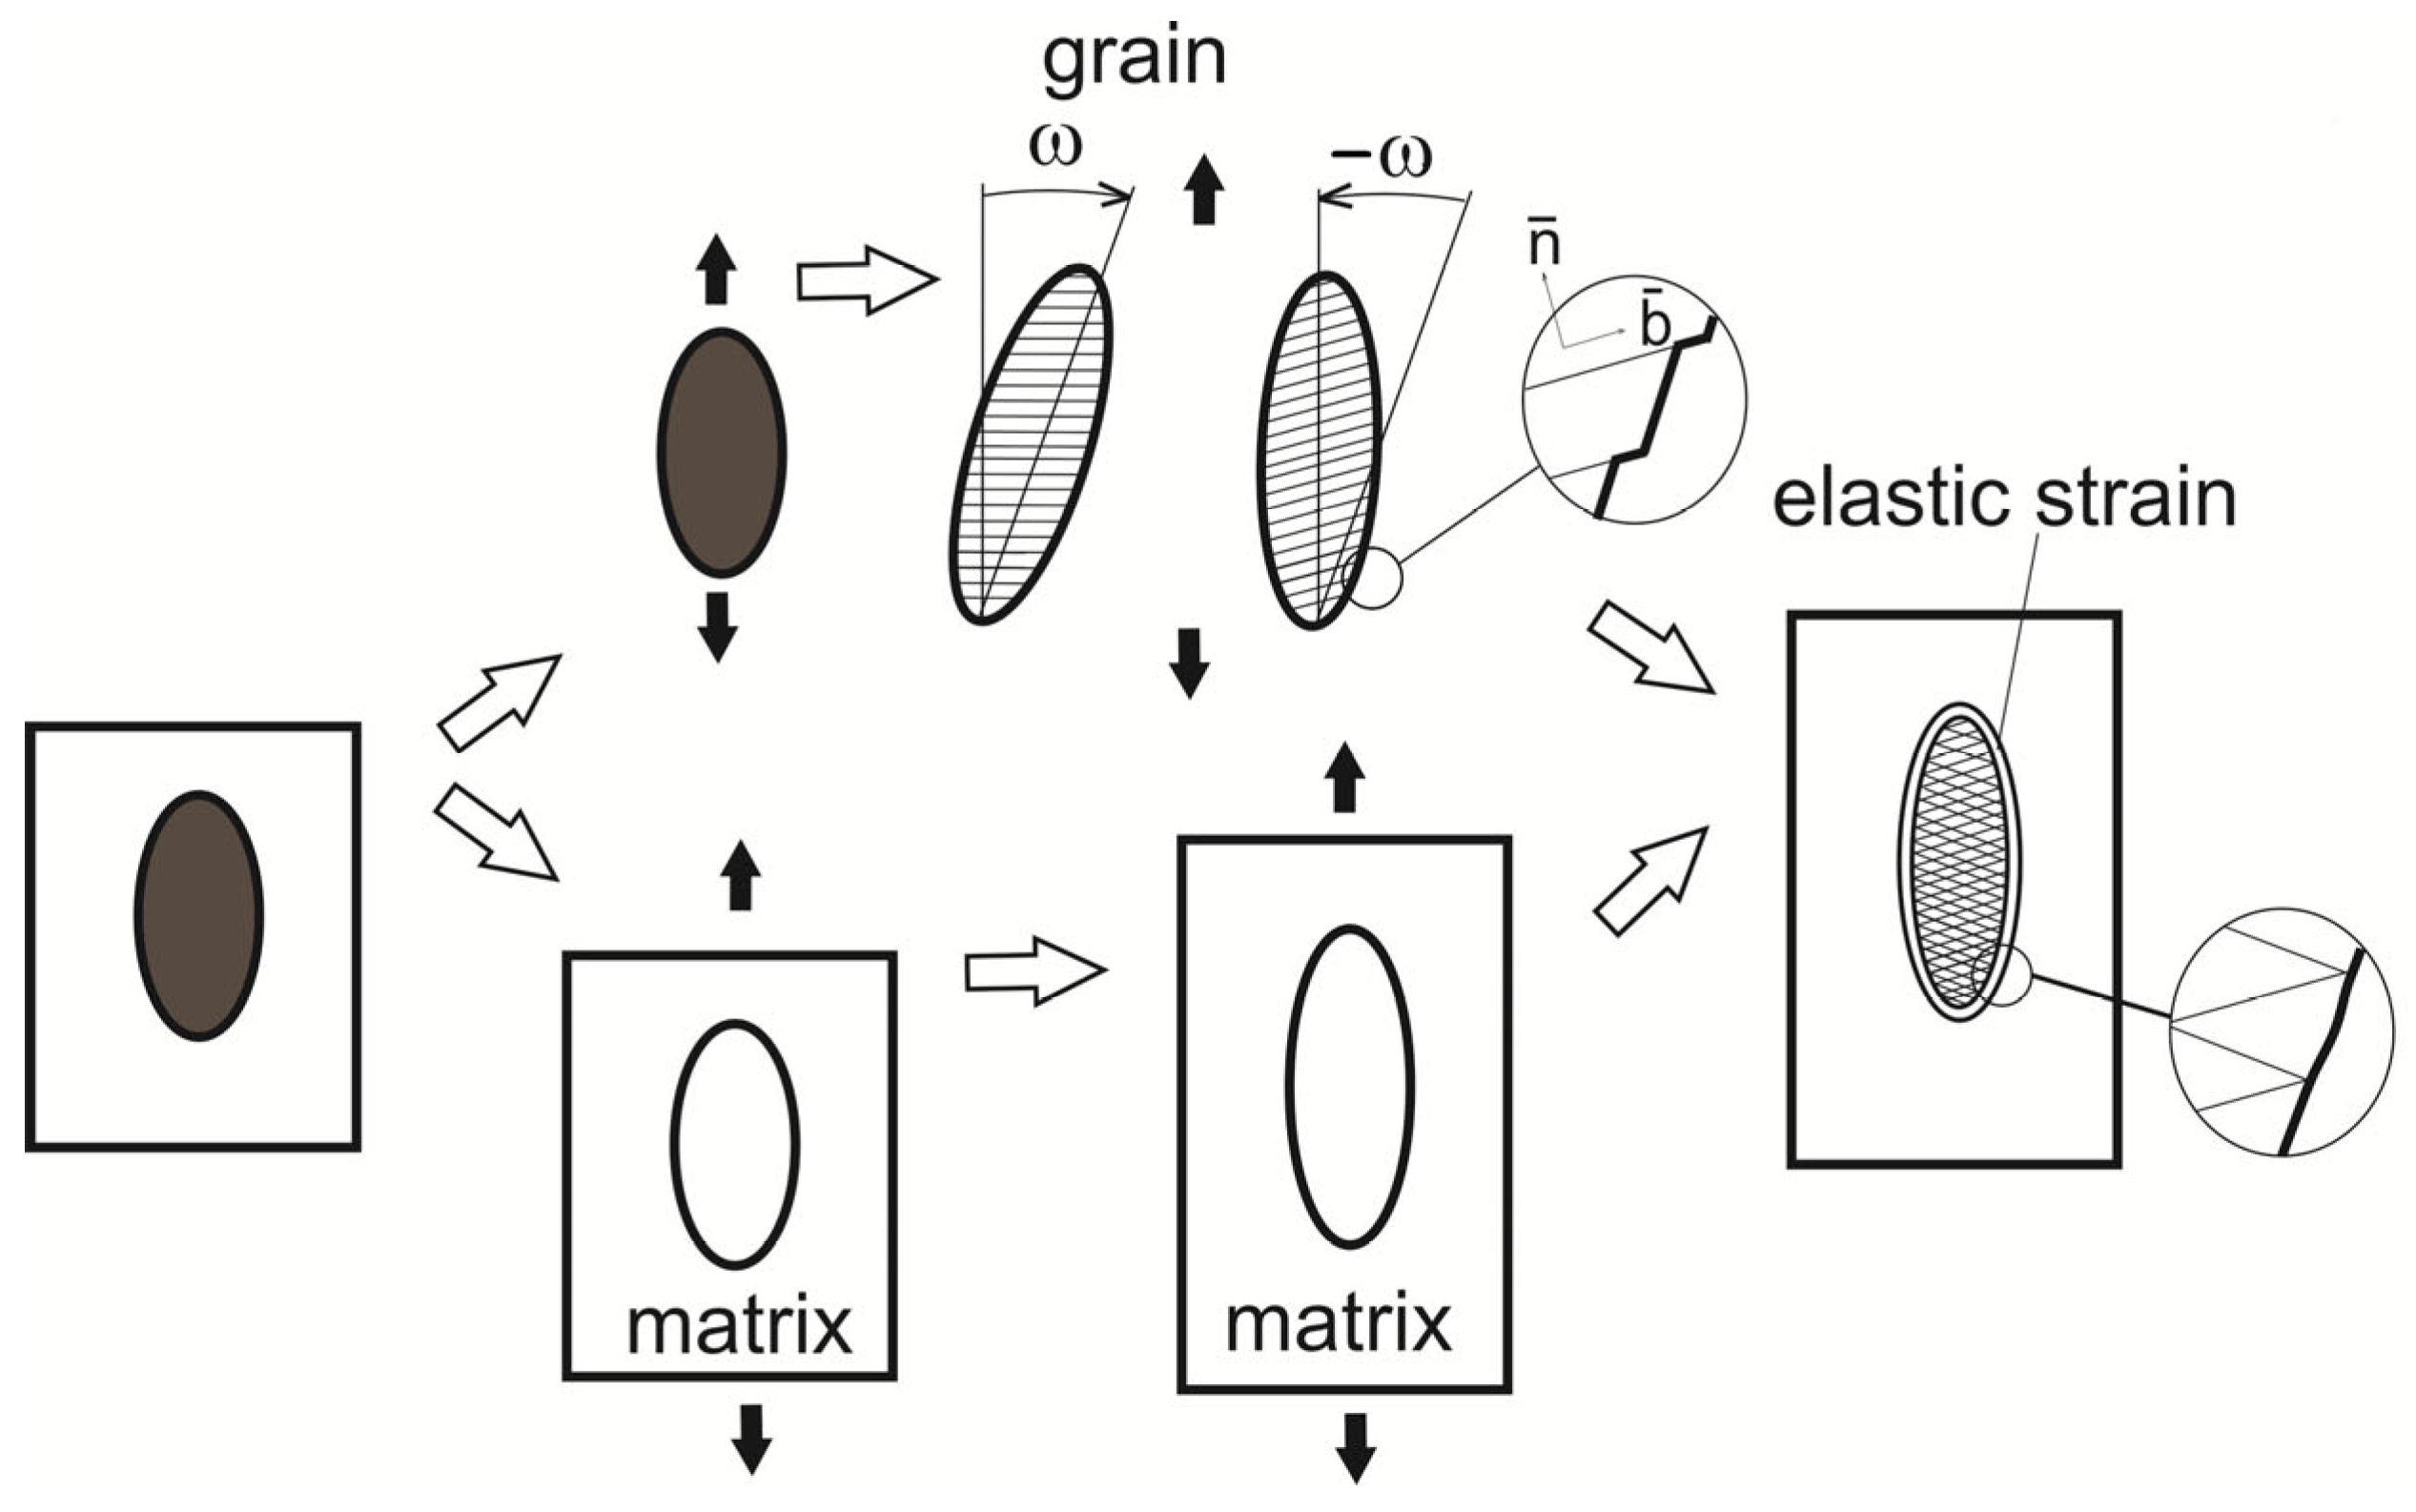
The idea of the self-consistent approach is very straightforward. Imagine removing a grain from the continuous and homogeneous medium surrounding it (the matrix). Both the isolated grain and the matrix containing a cavity are subjected to the same external stress. Due to strain incompatibility, reinserting the grain into the matrix cavity generates additional stresses, which in turn induce additional strains that compensate for this mismatch (Figure 4).
The problem of determining the stress and strain fields for such a case was the subject of extensive research during the second half of the previous century. Readers wishing to familiarize themselves with these studies are referred to the original publications (e.g., [68,69,70,71]). This line of research led to the development of computational algorithms for self-consistent modeling of plastic deformation and texture evolution during large strains (e.g., [72,73,74]). In these models, strain compatibility at grain boundaries is maintained through elastic–plastic accommodation between the grain and the surrounding matrix. Approximations of matrix properties—and their evolution during deformation—may differ between models. Importantly, their flexibility enables simulations under any level of strain constraint, ranging from fully constrained to fully relaxed conditions.Thus, following Ernest Nagel’s principle of reduction [75,76], the TBH and RC models can be regarded as approximate reductions in the self-consistent formulation. Consequently, self-consistent models are capable of predicting textures very similar to those obtained using the other approaches discussed in the present work. The application of self-consistent models to plastic deformation remains widely reported in contemporary literature (e.g., [77,78,79]).

2.5. The Fluctuating Stress State (FSS) Model

The fluctuating stress state (FSS) model proposed in [17] and used in the present study is based on the concept described in the previous section. A brief overview of the model is provided below. The FSS approach is a modified version of the Leffers–Wierzbanowski statistical model [59,80]. The selection criterion for the active slip system follows the Schmid law (Equation (2)), which incorporates slip system strain hardening described by a linear strain function, as proposed by Franciosi and Berveiller [81,82]:
τ c s ( γ h )   =   τ 0 +   h = 1 12 H s h γ h ,
where the matrix H s h describes the strain hardening of system s as a result of shears γ h occurring in systems h , and τ 0 is the initial critical resolved shear stress (identical for all potential slip systems in the undeformed crystal).
To a first approximation, the terms of the H s h matrix may be divided into two groups. For mutually coplanar systems and non-coplanar systems whose dislocations do not strongly impede the motion of other dislocations, their value is h 1 . For systems whose dislocations create strong obstacles, their value is h 2 > h 1 [81,82]. The strain-hardening anisotropy can therefore be expressed as A = h 2 / h 1 . Based on experimental results for copper, it may be assumed that A     1.5 and h 1 / τ 0 = 200 [81,82]. The value τ 0 = 5   M P a was used in calculations (after [83]).
An important element of the FSS model is the approximate satisfaction of the boundary conditions imposed on the deforming grain. This is consistent with experimental observations, since part of the strain incompatibility between neighboring grains can be accommodated by elasticity and the dislocation structure. Thus, grain deformation is treated as occurring within a hypothetical matrix that enforces deformation approximately consistent with the prescribed boundary conditions.
This matrix induces reaction stresses ( R σ i j ), proportional to the mismatch between the grain strain ( e i j ) and the boundary condition requirement ( E i j ) :
R σ i j = L   ( E i j e i j )
where L is about 0.02   μ and μ is the shear modulus [72].
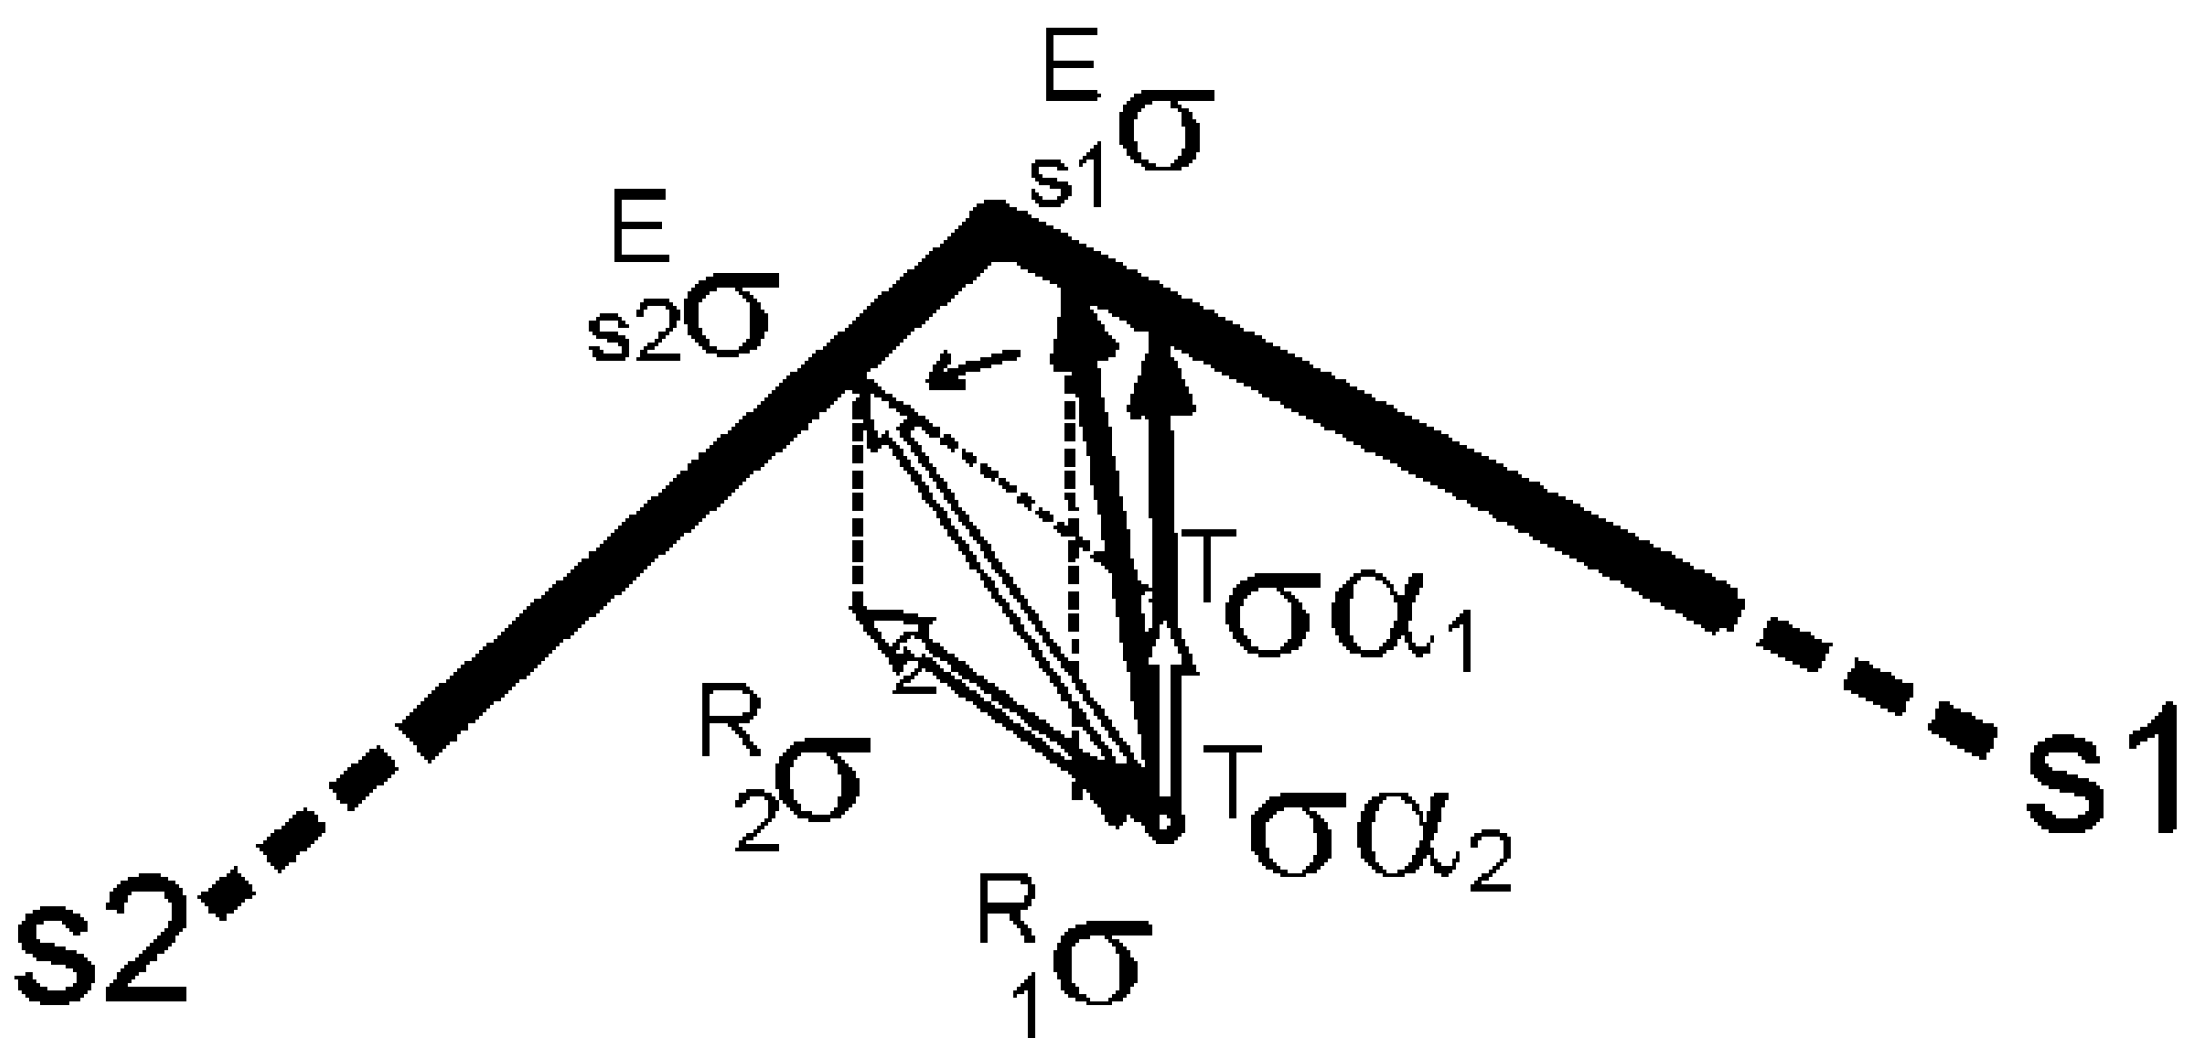
The effective stress within the grain ( E σ i j ) is therefore approximated as a superposition of the reaction stresses ( R σ i j ) and the external stress associated with rolling, assumed to follow the Tucker stress state ( T σ i j ). The amplitude of the externally applied stress, in Tucker form, is continuously incrementally increased (starting from the value of τ 0 ) to activate subsequent slip systems. This is necessary because the critical stress required for slip also increases as a result of hardening processes. In practice, during simulations the effective stress fluctuates around the stress state predicted by the TBH or RC models, which may be represented as a point on the yield surface in a five-dimensional stress space (Figure 5).
With fluctuations in the effective stress state, successive slip systems may become activated. This temporal sequence of slip-system activation appears to reflect physical reality. It should be emphasized, however, that the single-slip shear increment δ γ , assumed constant in the model, does not correspond to the shear produced by an actual avalanche of dislocations on a discrete slip plane. Its value was chosen arbitrarily, taking into account computational approximations and the stability of the numerical algorithm.
Nevertheless, the distribution of shear in individual slip systems can be estimated as the product of δ γ and the number of single-slip activation events in each system. In this manner, the microscopic (grain-level) strain tensor e i j can be calculated using the kinematic relations given in Equation (1).
In the FSS model, it is further assumed that lattice rotation during deformation results from the constraints imposed by the deformation process. In rolling, these constraints enforce constant spatial orientation of the material fibers and planes parallel to the rolling direction (RD) and the rolling plane (RP), respectively [58,86].

2.6. Boundary Conditions

The deformation of each grain in the rolled sample is governed by specific boundary conditions. However, the deformation field of heavily rolled copper can be approximated using one of the five limiting boundary conditions listed in Table 1.
They correspond either to fully constrained deformation or to deformation with partial relaxation of selected strain components. Alternatively, the boundary conditions may be defined using functions ε i j that describe the gradual change in the shape of a chosen volume element of the deforming material due to successive slip events (e.g., see Refs. [12,17]). However, our analysis shows that the specific method used to define the boundary conditions has almost no effect on the resulting texture. In practice, deformation constraints are often intermediate between those listed in Table 1 or may even approximate other combinations of constraints [54,87]. The conditions summarized in Table 1 have been applied in texture development simulations for polycrystalline metals (e.g., [49,88,89,90], and are typically assumed to be strictly satisfied. In reality, they can only be partially fulfilled. Partial relaxation, driven by deformation energy reduction and dependent on grain orientation, was incorporated in the model proposed by Schmitter (according to D. Raabe [91]). The flexibility of the FSS model also allows simulations under such conditions. In particular cases, the FSS approach enables simulations that closely resemble the TBH or RC models, and it can even be reduced to the classical Sachs model.
It can be expected that the intensity of relaxation processes and the differences in hardness among individual grains influence the forces constraining the strain components. Grains that are significantly harder than their surroundings are relatively weakly constrained (e.g., group 5 in Table 1, with deformation approximated using the Sachs-type model). However, grain hardness can decrease due to relaxation processes accompanying plastic deformation. Additionally, the dislocation structures formed during plastic deformation locally shield external forces, further affecting the magnitude of these constraints.
According to the Saint-Venant principle [92,93], the condition of fully constrained deformation (as for group 1 grains in Table 1) is applicable to equiaxed soft grains. For flat grains, the range of constrained deformation is generally limited to a volume near the grain boundaries (Figure 6). The imposed strain components for flat and elongated grains are described in Section 4. Notably, the Saint-Venant principle suggests that the constraint on lath-shaped grains is primarily determined by their shape, whereas for flat grains, it is more strongly influenced by their surroundings. The fulfillment of strain compatibility conditions for the individual cases in Table 1 has been discussed elsewhere [29,35,58,59,60,61,62].
Although the conditions in Table 1 are strict, their approximate fulfillment allows for a description of rolling texture development across the five groups of grains deforming under these constraints. This concept forms the central focus of the present study. We anticipate that the results will enable more detailed texture analysis and provide insights into the evolution of deformation microstructures. Moreover, the methodology developed and presented here has the potential to enhance CPFE phenomenological models, improving their utility for selecting technological parameters in industrial plastic forming processes.

3. Calculation Procedure

The FSS model was used to simulate rolling textures under the assumption of partial fulfillment of the deformation boundary conditions listed in Table 1. A random initial orientation distribution—approximated by a set of discrete orientations—was assumed. The orientations in this set were selected as the centers of 2197 (i.e., 133) equal-volume cells tightly covering the Euler orientation subspace (Euler angles φ1, Φ, φ2 in the range 0–π/2). This procedure ensures a statistically uniform distribution of orientations, as opposed to simply performing Monte Carlo sampling within the nonlinear Euler orientation space.
Plastic deformation and the corresponding orientation changes in each grain were simulated. The single-slip shear increment δγ was set to 0.0005, the strain-hardening anisotropy parameter A was assigned values of 1, 1.2, or 1.5, and the parameter h10 was taken as 200. For aluminum, slip system hardening is almost isotropic; therefore, A is very close to 1. In polycrystalline copper, hardening is anisotropic, with A typically between 1 and approximately 1.2. In this work, the range 1–1.2 was examined in detail and supplemented with A = 1.5. This upper value has proven suitable for simulating deformation in single crystals of copper [43] and was therefore included for comparison.
At these parameter values, the fluctuations of microscopic stress tensor components do not exceed a few hundredths of the average critical slip stress, and the strain-mismatch tensor components remain below 0.01; moreover, no significant discrepancies in texture development were observed. The latter can be treated as a measure of how accurately the boundary conditions are satisfied.
The model deliberately omitted random stress components. This leads to notable sharpening of the calculated textures. The objective of the present work, however, was not to reproduce the intensity of specific components of the experimental texture, but rather to gain a deeper understanding of how these components form. The sharpening of texture components facilitates this analysis.
Orientation distribution functions (ODFs) in the Euler orientation space were reconstructed from the sets of individual orientations obtained for rolling true strains ε = 1.5 and 2.0. The Euler angles were defined according to the Bunge convention [94]. For texture characterization, the typical skeleton lines of the ODF as a function of the φ2 angle were selected. For each ODF, the individual components of maximum intensity were described using Miller indices.
The positions and intensities of these components were determined from the continuous ODF reconstructed from the discrete orientation sets using a series expansion (lmax = 34). Each orientation point was replaced by a Gaussian component with a half-width of 5°. The volume fraction of each texture component was calculated directly from the discrete orientations, assuming a maximum misorientation of 10°. The examined relaxed constraints were evaluated using 2197 model grains for each type of constraint.
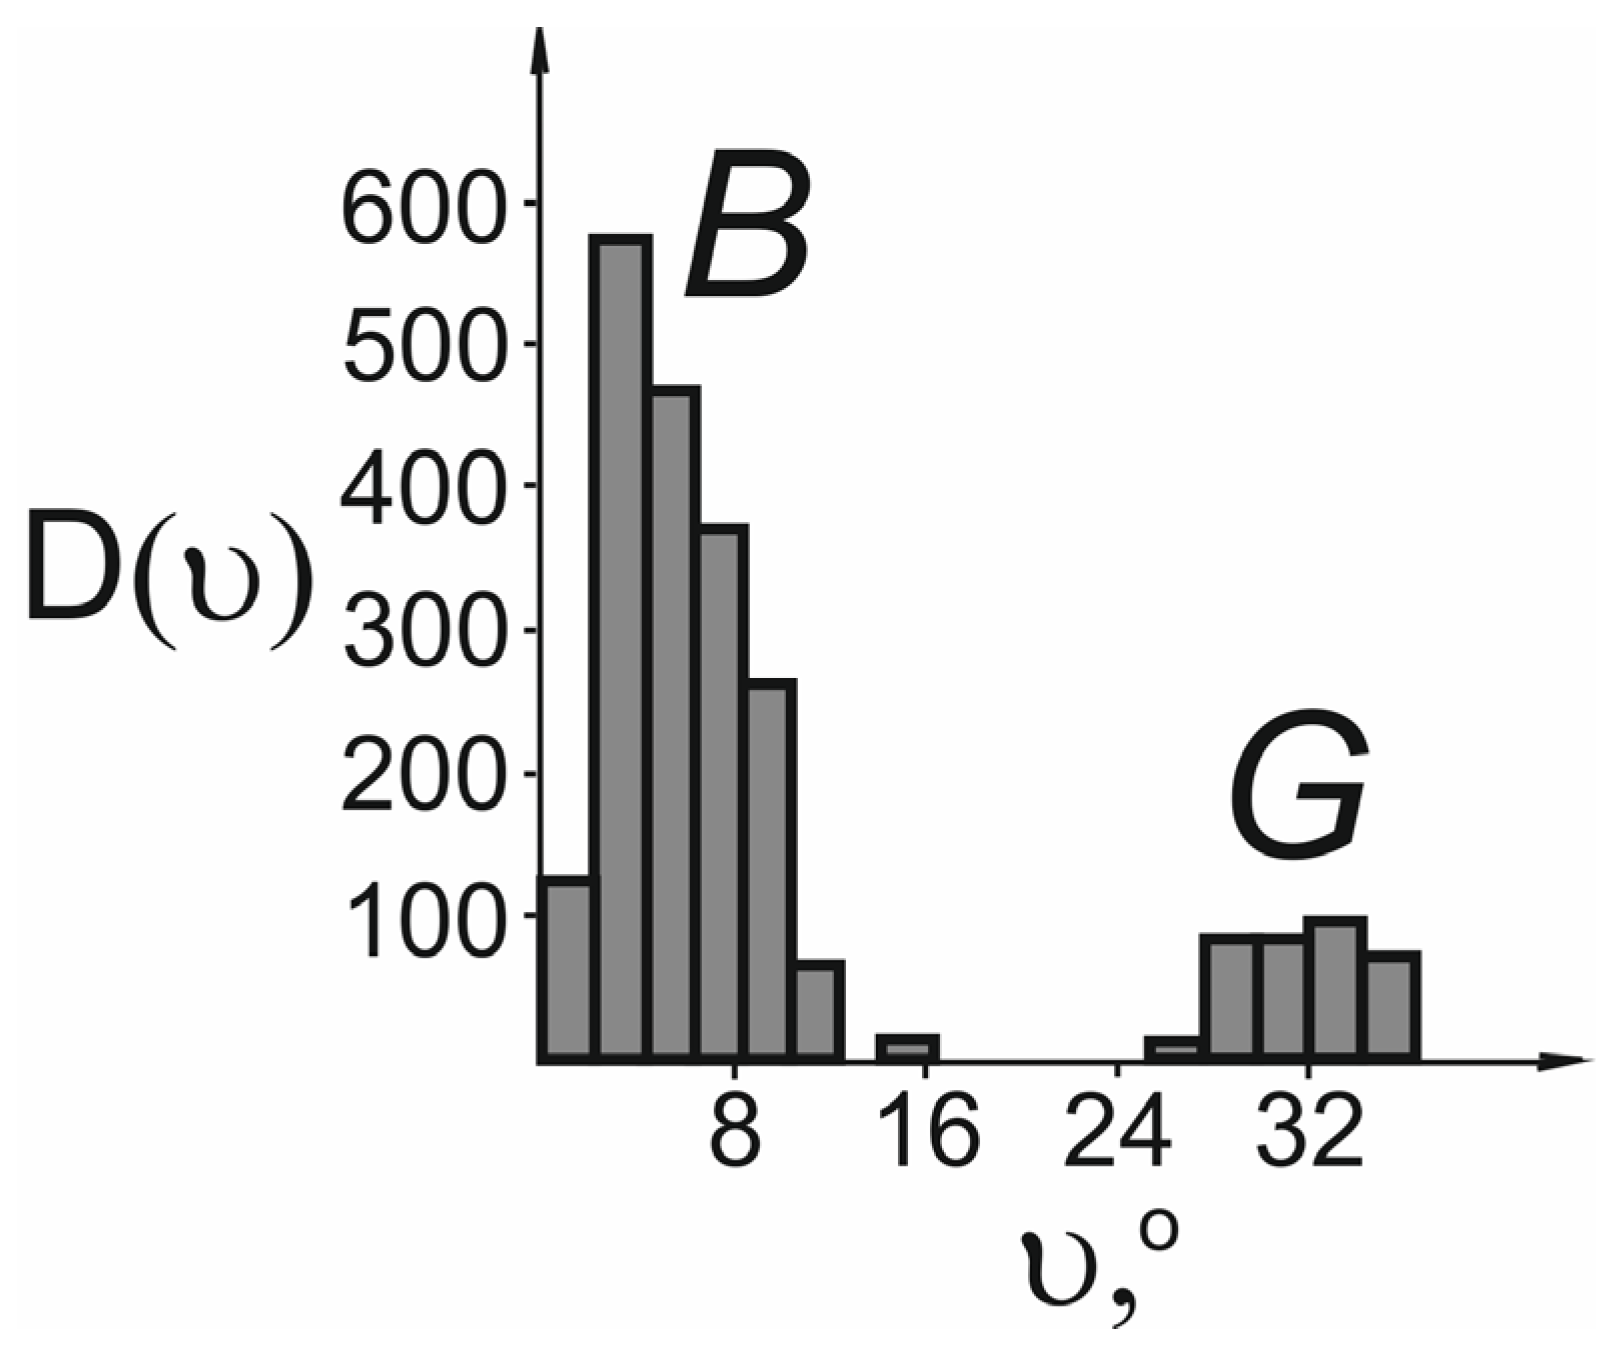
Sharp texture components generally tended to separate clearly from one another. This was observed, for example, for grains belonging to group no. 5 (Figure 7). In this case, the positions and shapes of the component maxima were determined directly from the set of individual orientations, using axial misorientation vectors as described in [95]. The misorientation distributions around these maxima were then used to determine the component volume fractions (Figure 7).

4. Results

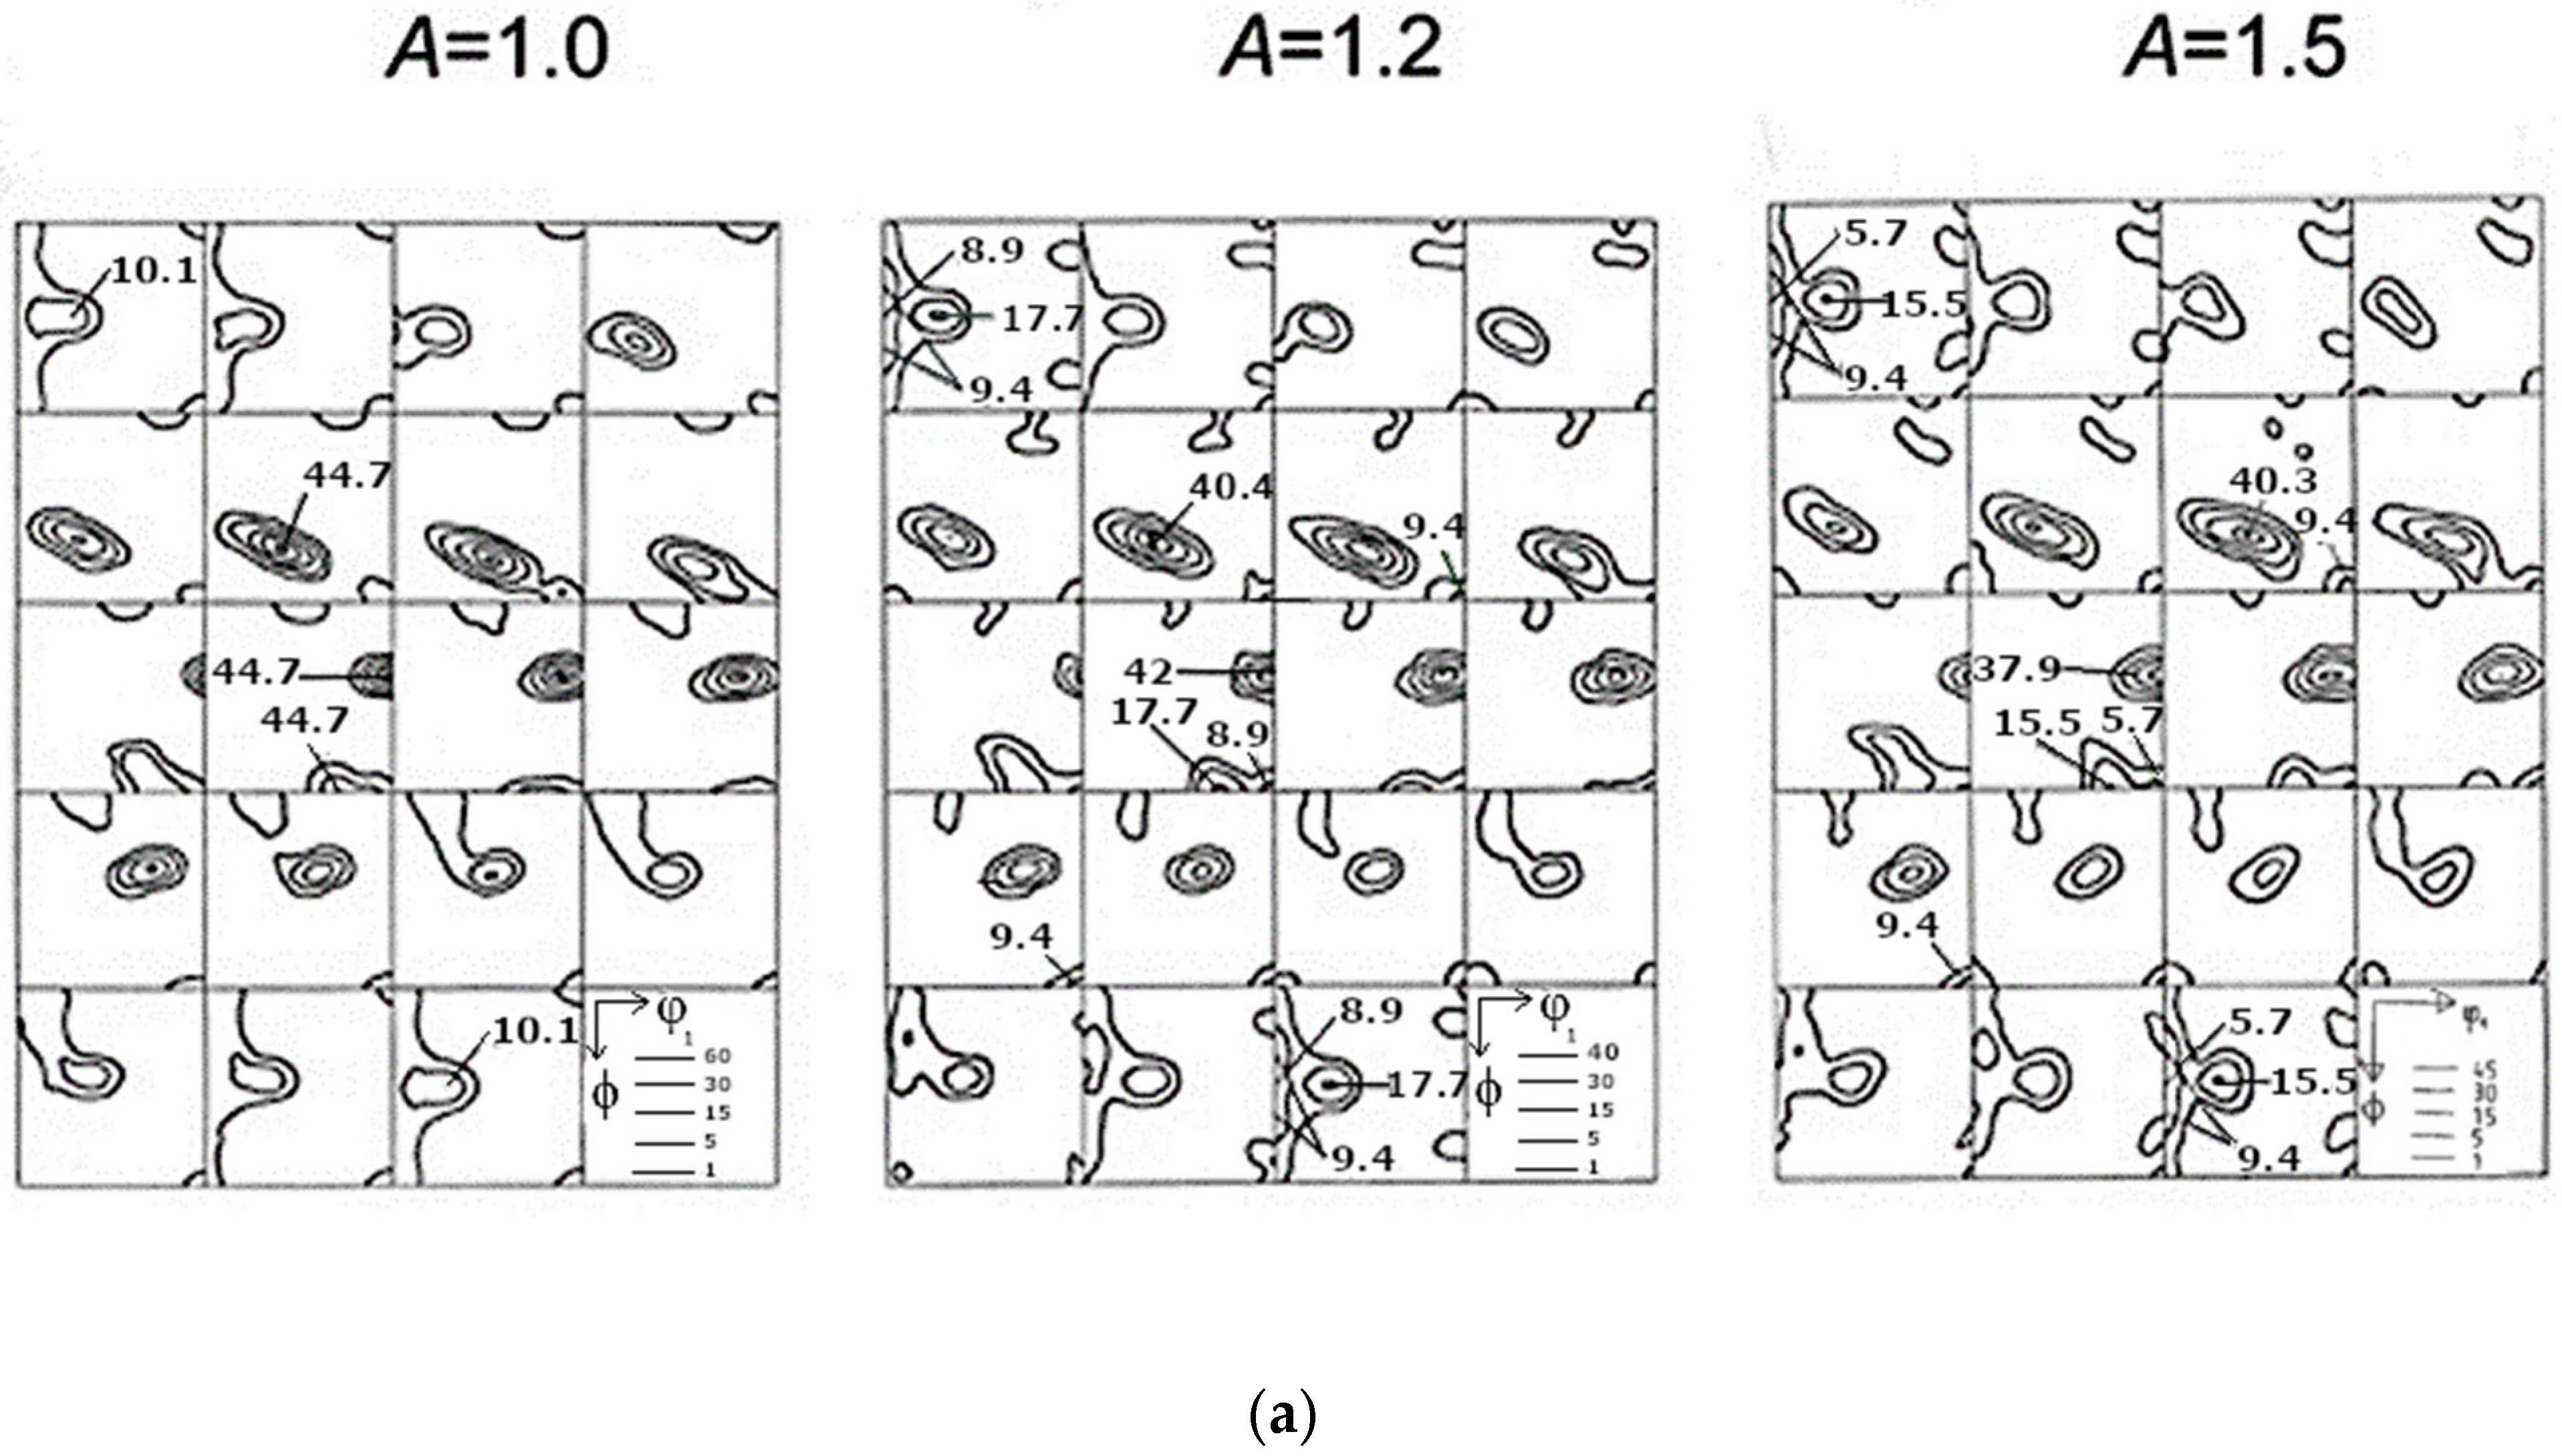
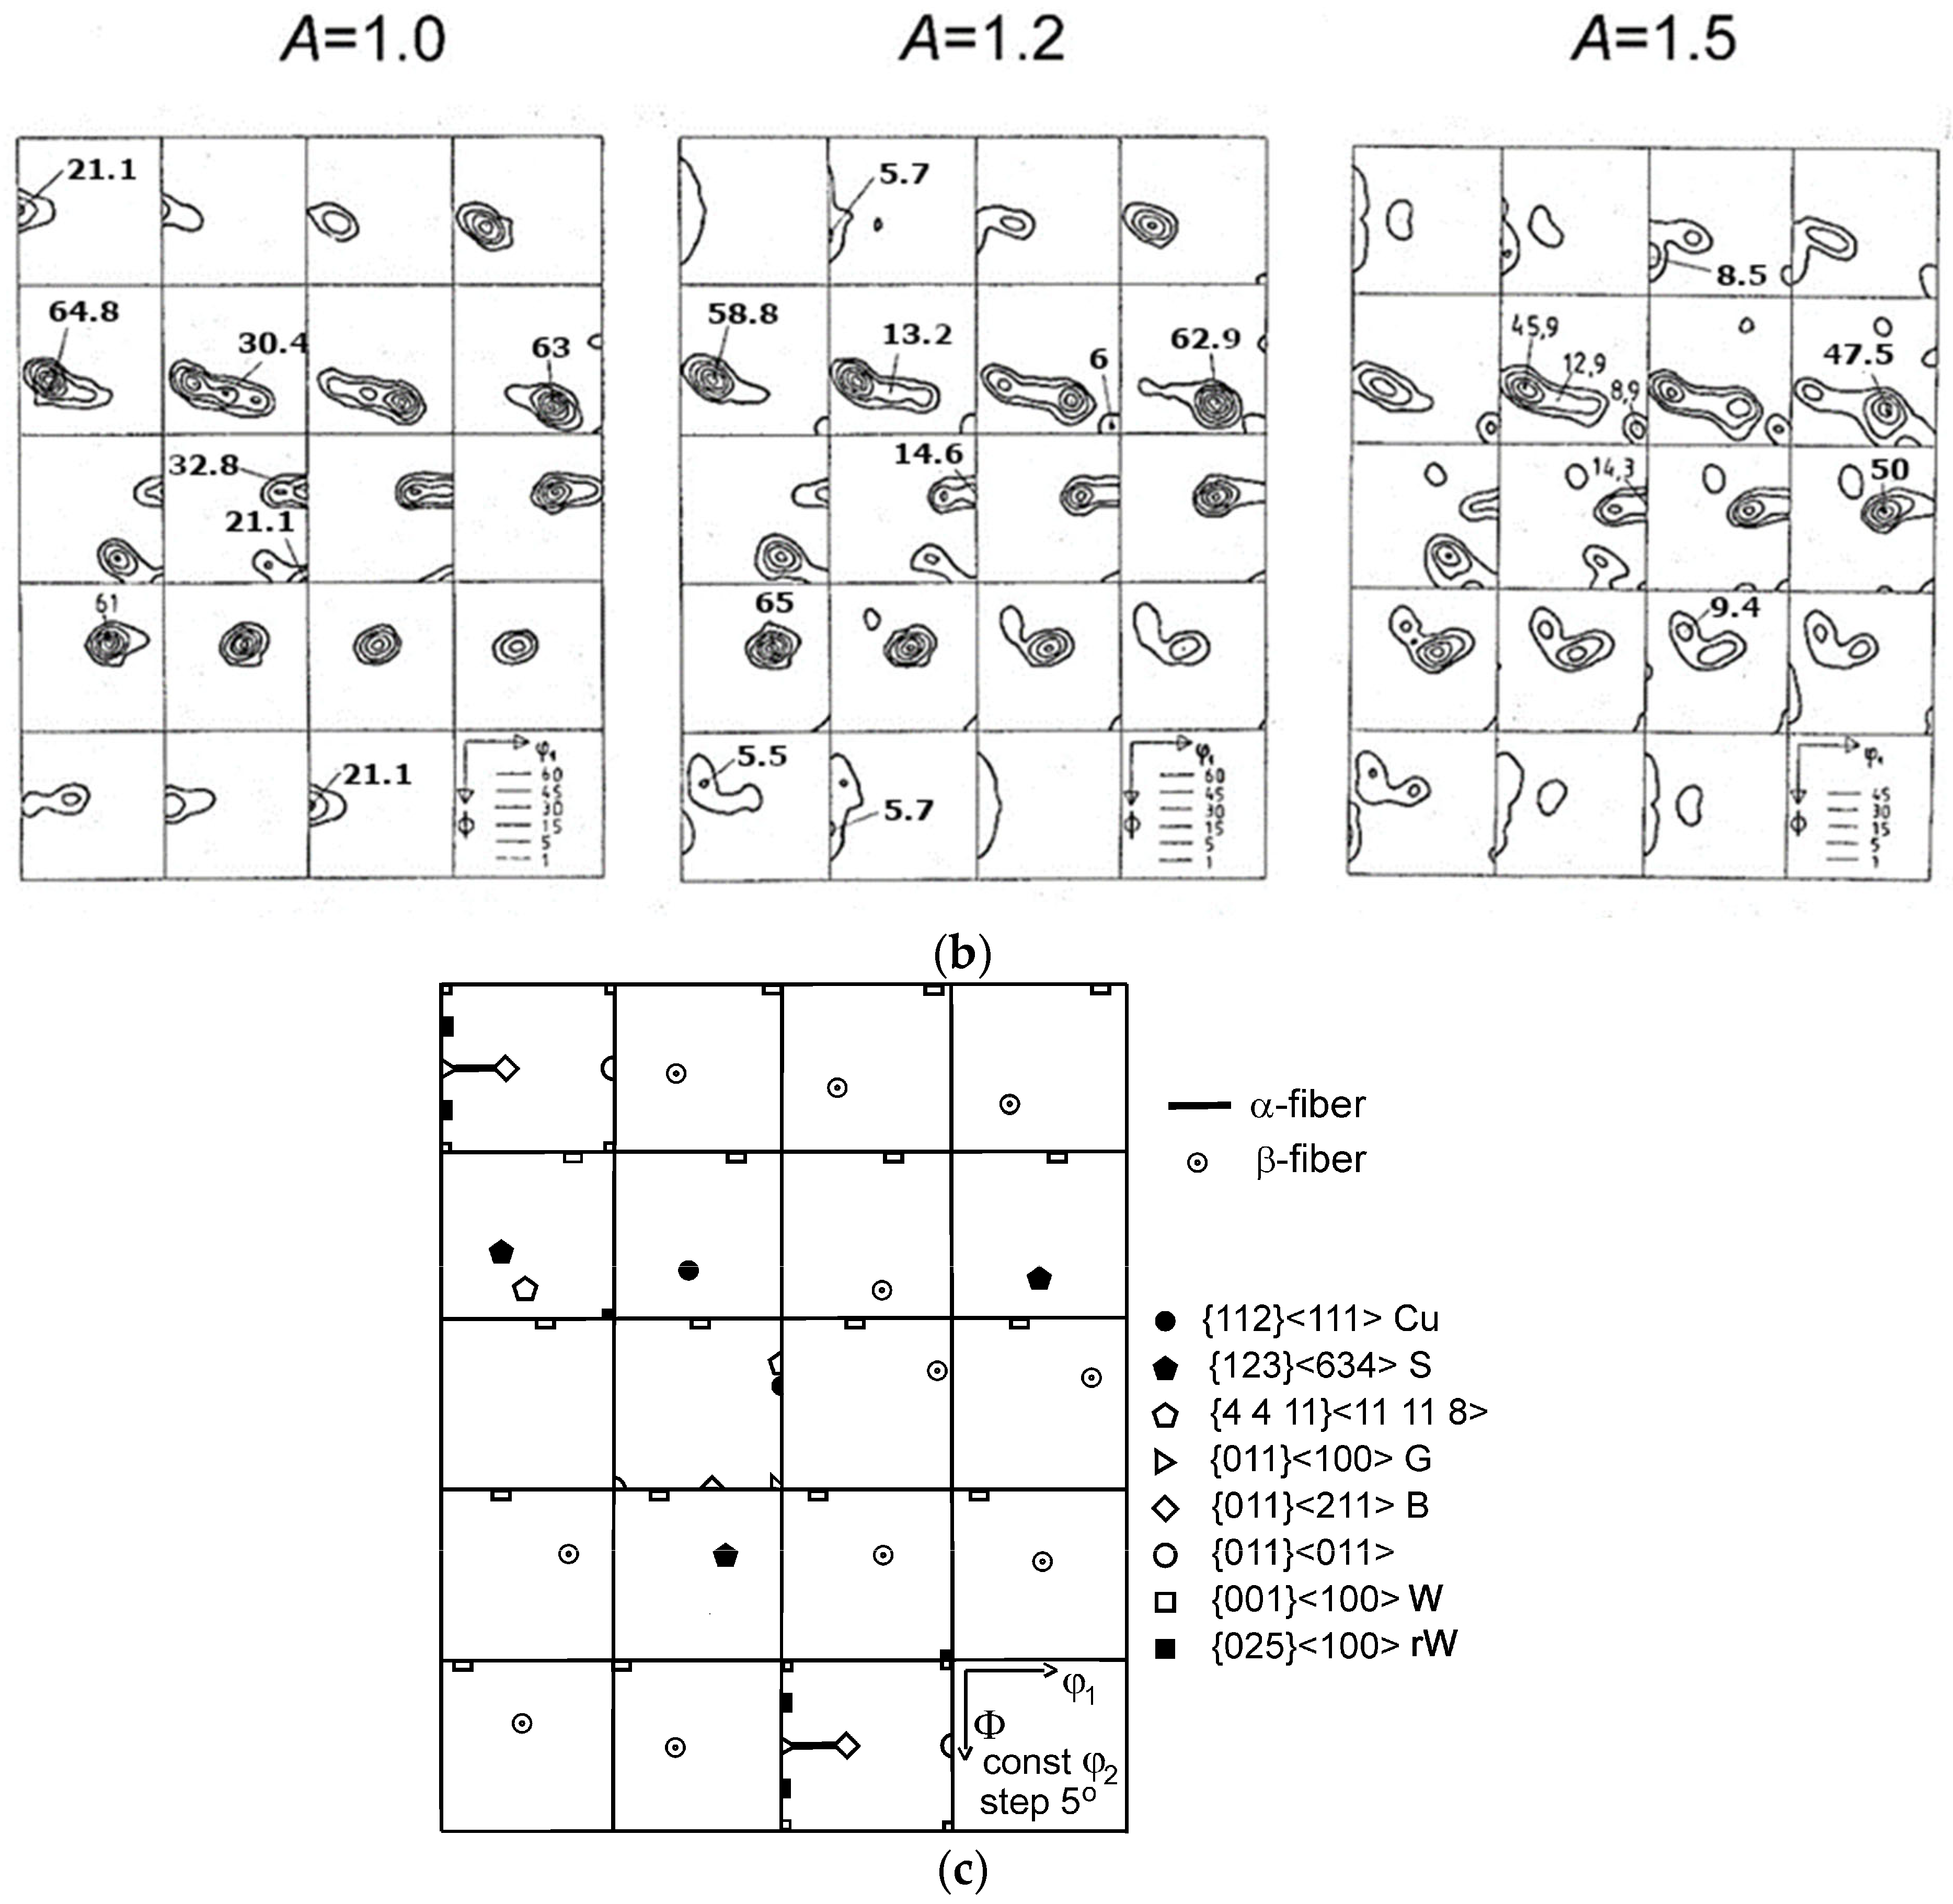
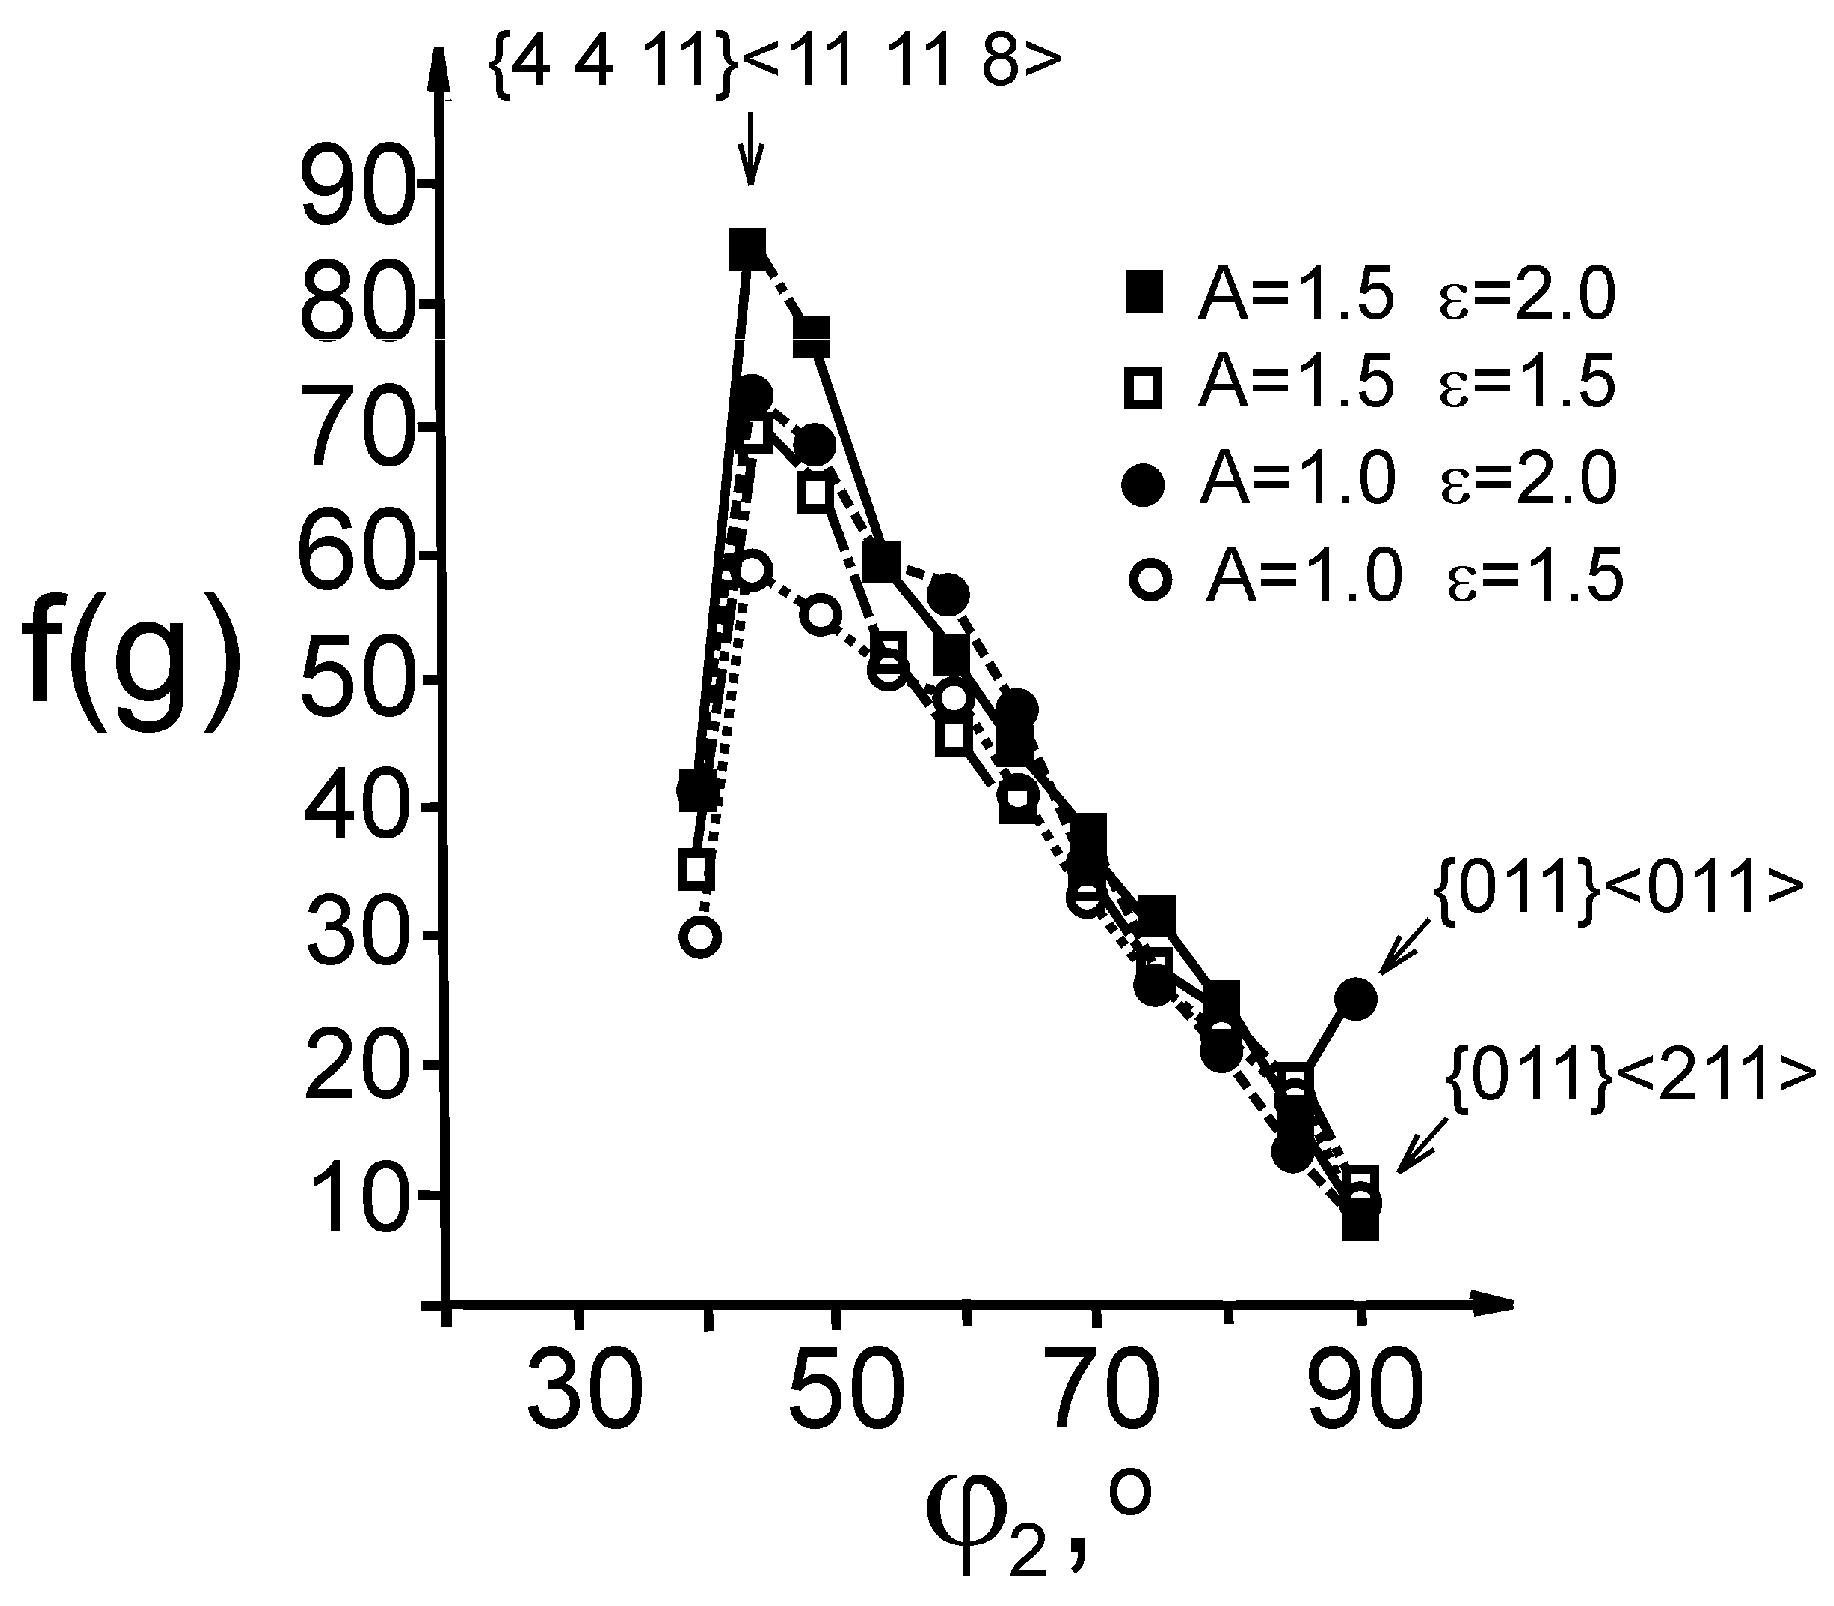
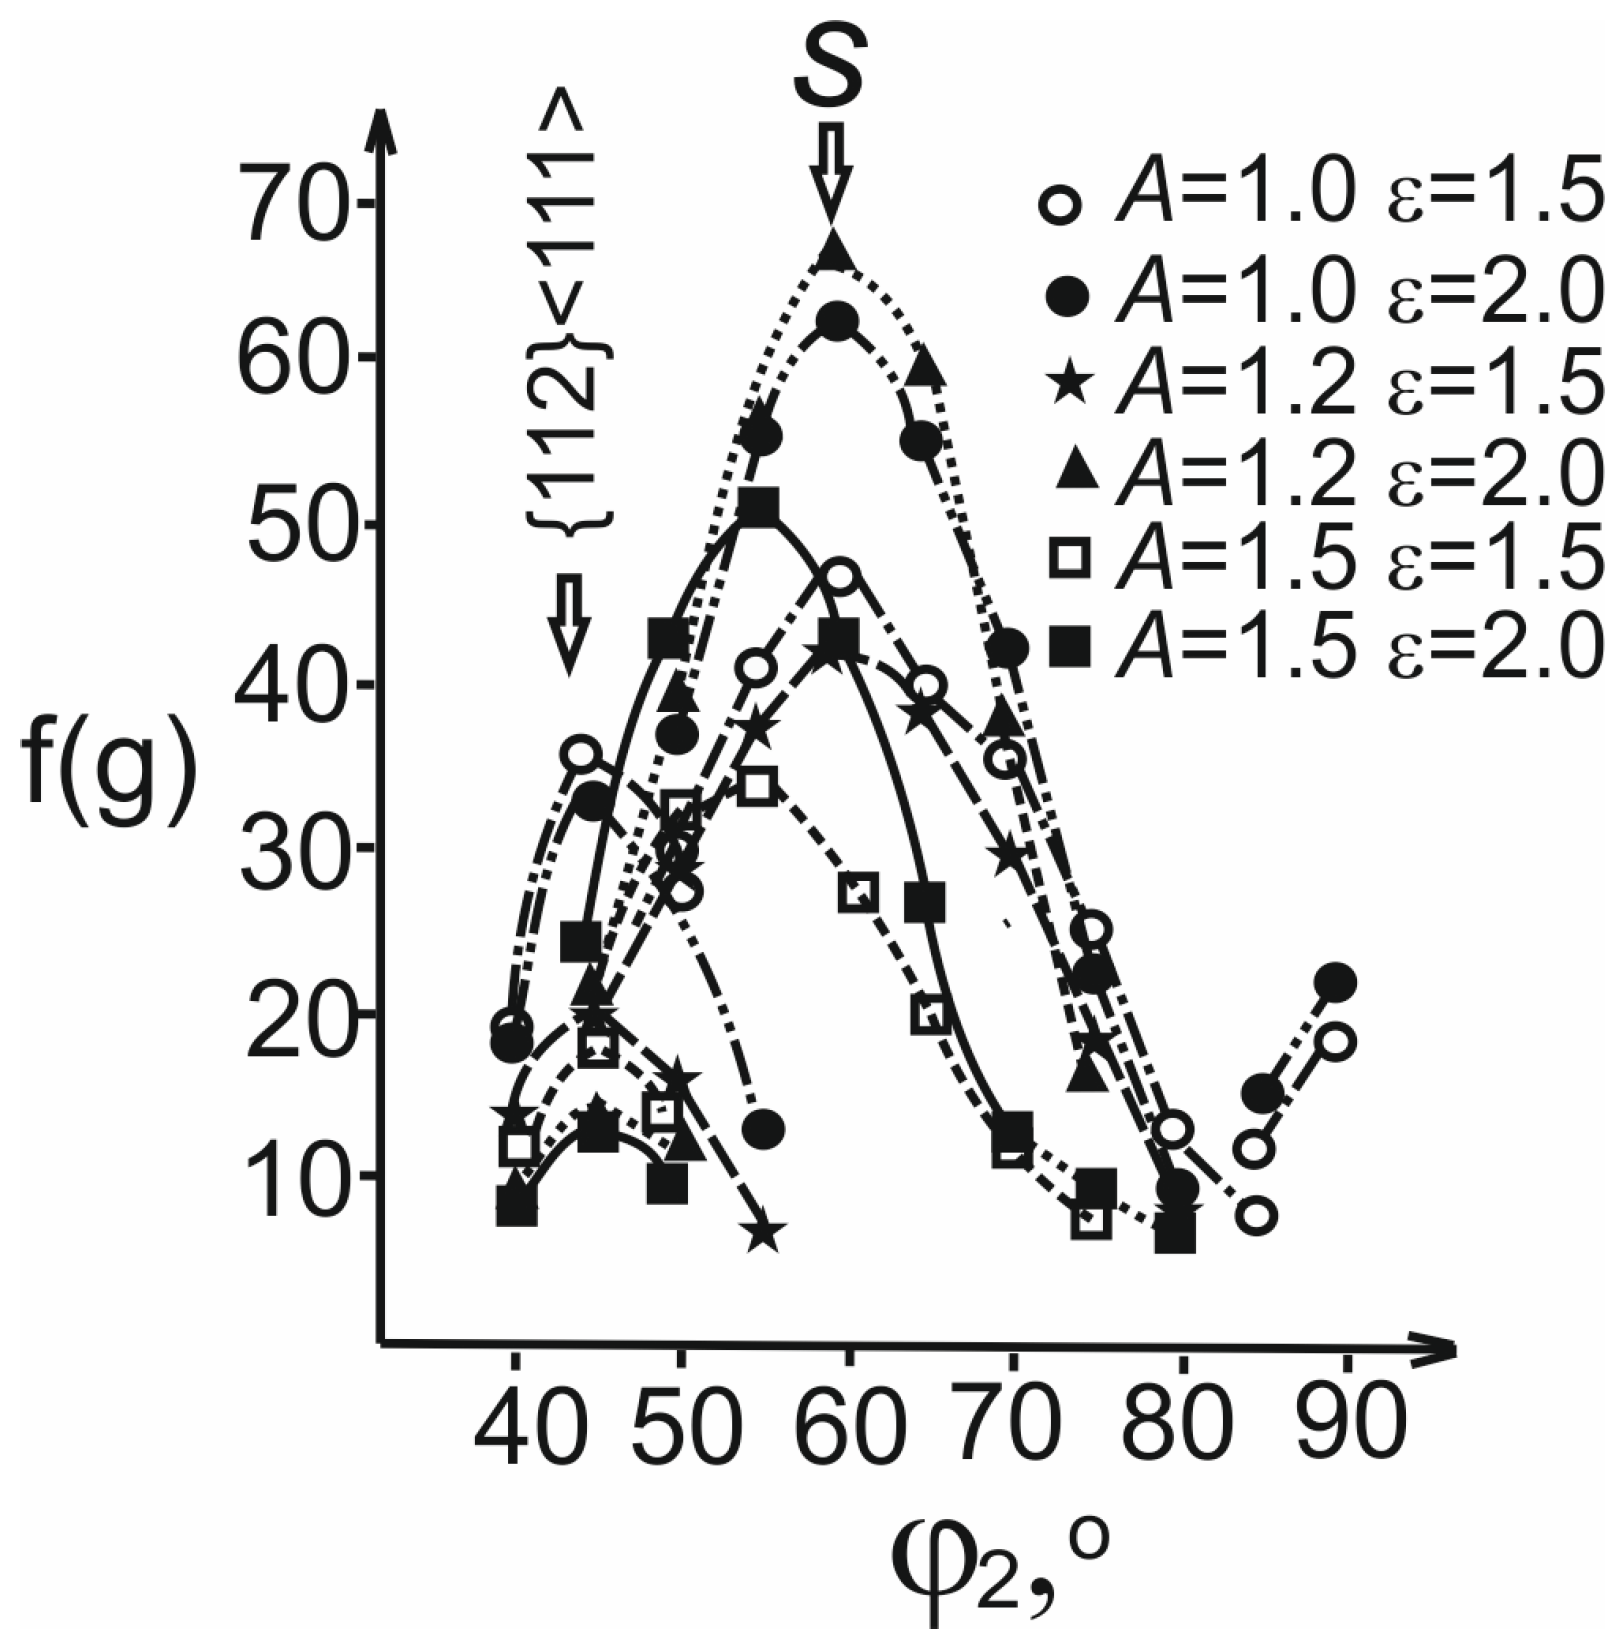
Example ODFs predicted by the computer simulation are shown in Figure 82 cross-sections with a 5° step). The calculated ODF skeleton lines for the examined textures, over the extended φ2 range of 40–90°, are presented in Figure 9, Figure 10, Figure 11 and Figure 12. The identified texture components and their intensities are summarized in Table 2; they are calculated for the true strain ε = 2. The effect of the strain hardening anisotropy parameter A on the volume fraction of the main texture components is reported in Table 3, Table 4, Table 5, Table 6 and Table 7.
The obtained results are discussed in detail below, where the development of the rolling texture components is analyzed for grain groups deforming according to the boundary conditions listed in Table 1.

4.1. Rolling Textures Developed for Fully Constrained Deformation (Grains Group No. 1)

A well-developed orientation fiber with a maximum at the {4 4 11}<11 11 8> position (Figure 9) is characteristic of the tested values of parameters A and ε , and of rolling deformation conditions close to boundary condition no. 1. This fiber extends toward orientations close to {011}<211>, although the orientation density in that region is very low.
For anisotropic slip system hardening ( A > 1 ), the volume fraction of the {4 4 11}<11 11 8> component is higher than for isotropic hardening ( A = 1 ). It increases rapidly as A rises to approximately 1.05 and then decreases gradually; however, the differences within the tested anisotropy range remain relatively small. This component also becomes more pronounced as the rolling strain increases from ε = 1.5 to 2.0 (Table 3).
For A = 1 , a weak {011}<011> component appears, but it is progressively suppressed as A increases to 1.5.

4.2. Rolling Textures Developed for Partially Constrained Deformation (Grains Group No. 2)

The Copper component (Cu) dominates in the rolling textures of grains from group no. 2, for which the e 13 is relaxed (Figure 8a and Figure 10), and its intensity increases with strain. For A = 1 and A = 1.2 , this component corresponds to the {112}<111> orientation. When A = 1.5 , the Cu component is rotated by approximately 5° around the transverse direction (TD) and may be described as {447}<778>.
An increase in parameter A also leads to a weakening of the copper-type skeleton line in the range ϕ 2 = 45 –70°. This trend is also reflected in the data in Table 4; however, the differences in the corresponding volume fractions are small.
The {011}<311> orientation, along with several weaker components (i.e., those with maximum intensities below 10), can also be identified in the discussed texture (see Table 2). For A = 1 , the intensity of the {011}<311> orientation is slightly above 10; it gradually increases with A to approximately 18 at A = 1.2 , and then decreases to about 15.5 for A = 1.5 .

4.3. Rolling Textures Developed for Partially Constrained Deformation (Grains Group No. 3)

The texture obtained from the relaxation of components e 13 and e 23   (group no. 3 from Table 1, Figure 8b and Figure 11) is dominated by a strong S component and a weaker Cu component, with the intensity maximum located at the {112}<111> orientation. Across the examined range of A-values, increasing strain enhances both the intensity and the volume fraction of the S component while reducing that of the Cu component (Figure 11; Table 5 and Table 6). The Goss orientation {011}<100} (labeled G) emerges as a third distinct component in the texture for A = 1; however, its volume fraction is less than 4% and it diminishes rapidly as A increases to approximately 1.05.
The maximum position of the S component shifts from {539}<3 10 5> to {537}<132> and then to {324}<275> for A values of 1, 1.2, and 1.5, respectively (see Table 2). A significantly higher fraction of this component is observed for A in the range of 1.05–1.2; however, the differences in volume fraction within this range are comparable to the calculation uncertainty (see Table 5).
The position of the Cu component in orientation space remains unchanged, but its volume fraction is relatively small and decreases noticeably with increasing hardening anisotropy parameter (A) (see Table 6).

4.4. Rolling Textures Developed for Partially Constrained Deformation (Grains Group No. 4)

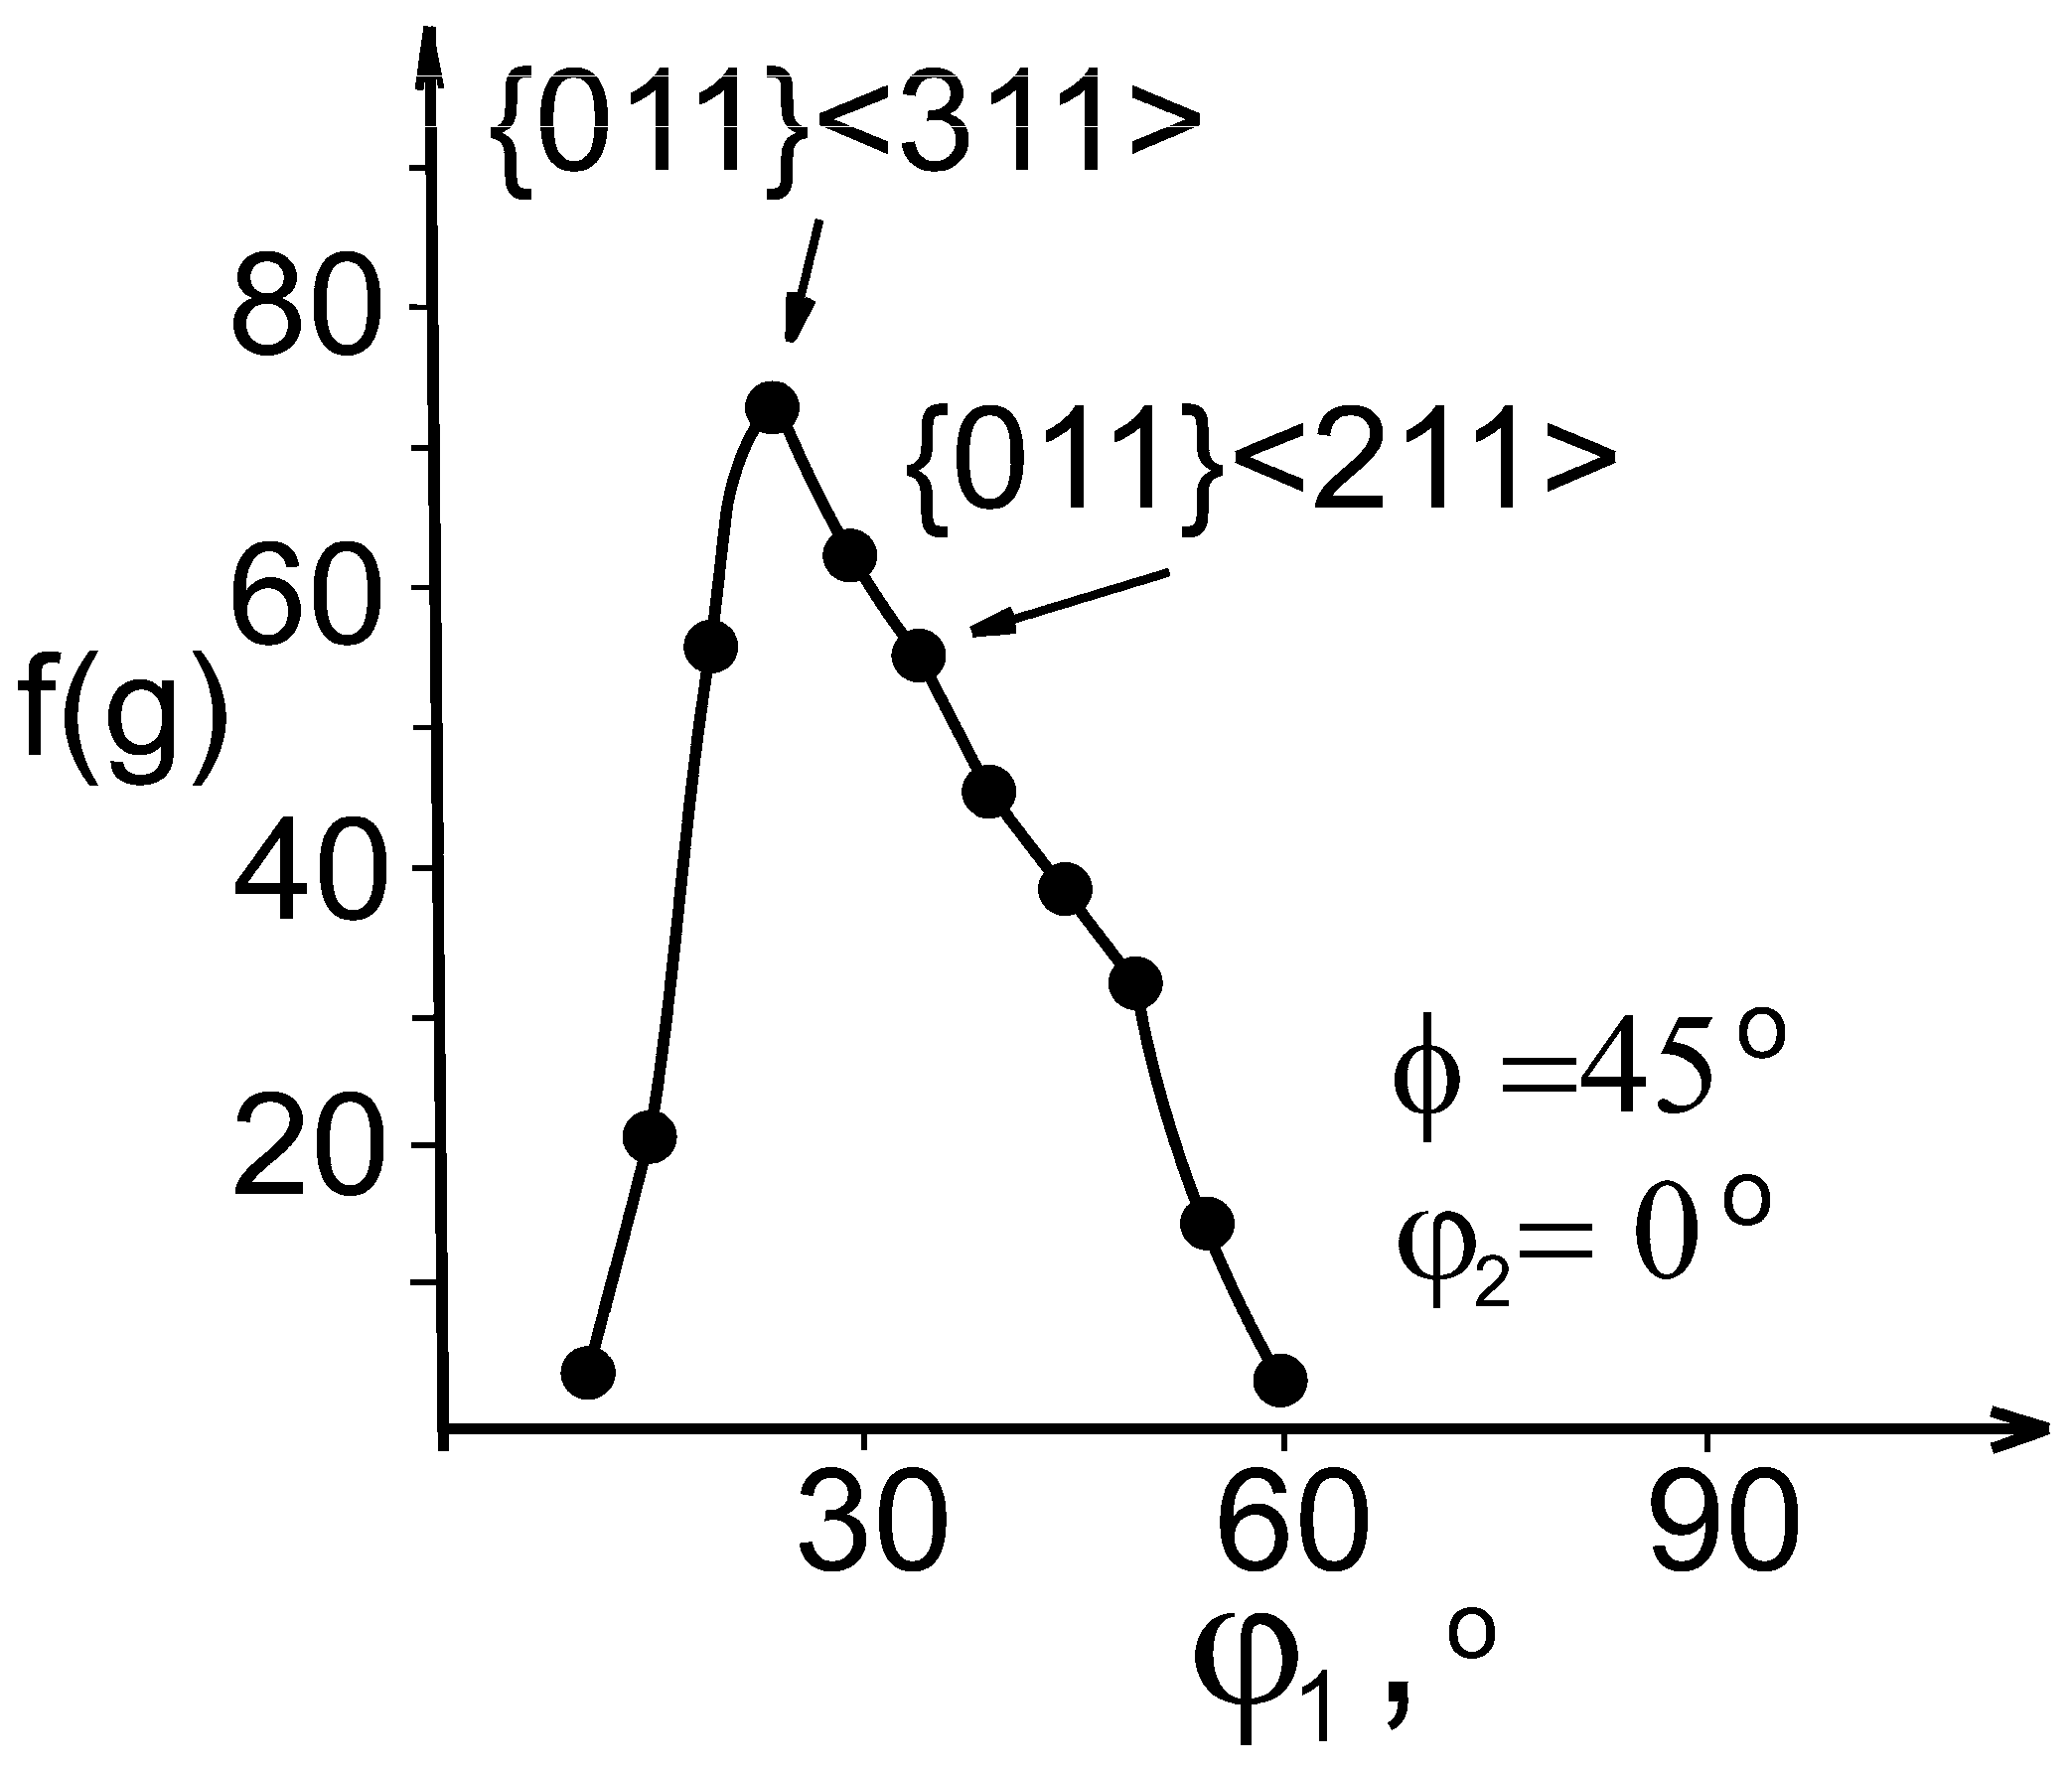
The {011}<311> component dominates the rolling textures formed for A = 1 and ε = 2 in the case of grains from group 4, for which the shear strains e 12 , e 13 and e 23 are relaxed (Figure 12). A pronounced anisotropic spread of this component along the {011}<111> orientation was observed. This spread includes the {011}<211> orientation, rotated by 10° around the normal direction (ND) relative to the {011}<311> orientation (Figure 13). Increasing the anisotropy of slip system hardening (A) shifts the {011}<311> component toward smaller φ2 angles and larger φ1 angles (see Table 2). This component also sharpens with increasing deformation. Furthermore, higher A values result in a significant reduction in the volume fraction of grains from group 4 whose orientations deviate by no more than 10° from the {011}<211> position (Table 7).

4.5. Rolling Textures Developed for Grains from Group No. 5

Two well-defined and sharply resolved components, Brass (labeled B) and G, characterize the texture of freely deformed grains from group no. 5, up to ε = 2. Component B is the dominant texture component, although its relative contribution decreases as the hardening anisotropy parameter A increases (Figure 14). Its orientation also varies with A. Specifically, for A ≤ 1.3, B corresponds to {011}<211>, while for A > 1.4, it is slightly rotated from this orientation by up to 2°. The reduction in the volume fraction of component B with increasing A is accompanied by a corresponding increase in the weaker component G (see Figure 14).

5. Discussion

At the outset, we would like to emphasize that the results presented in this work concern room-temperature rolling, as this is the primary process used for producing copper sheets intended for deep drawing, where crystallographic texture plays a key role. At strain rates currently applied in industry, dynamic recrystallization does not occur and is therefore neglected.
From a formal point of view, each of the conditions listed in Table 1 does not necessarily have to apply to the entire volume of the deformed grains, as assumed in the advanced Lame model [44,45]. In the following discussion, however, this is omitted for simplicity. Our simulation results obtained for A = 1 agree closely with those predicted for A = 1 by Hirsch and Lücke [54]. Thus, all texture components predicted by the TBH and RC models also appear in the analogous textures predicted by our model. In particular, both texture simulation methods associated with fully constrained deformation and relaxation of the e 13 strain revealed significant orientation spreading along the so-called β-fiber (i.e., from orientations {4 4 11}<11 11 8> or {112}<111> toward the S and B orientations, respectively). The only major differences were that textures predicted by the FSS model with A = 1 exhibited additional weak components—{011}<011> for fully constrained deformation and {011}<100> when e 13 and e 23 were relaxed. These discrepancies may be attributed to fluctuations in the microscopic deformation state and the resulting deviations from the deformation boundary conditions permitted in the FSS model, unlike in the compared models. Such fluctuations are very likely to occur in real materials. Therefore, the model we used may provide deeper insight into rolling texture formation. It is worth noting that the {011}<011> component has not yet been confirmed experimentally, nor is it visible in simulations for A > 1.
Pospiech and Lücke [97] demonstrated that the measured texture of copper rolled to a deformation of ε = 3 can be expressed as the superposition of three strong and several weaker components, represented as Gaussian distributions. The dominant components are: B, Cu, and S (i.e., orientations near {011}<211>, {112}<111>, and {123}<634>, respectively). Crystallographic orientations corresponding to these components remain stable or rotate only slowly during deformation, while surrounding orientations tend to evolve toward them. This behavior results from the symmetry of the strain distribution among the active slip systems, consistent with the symmetry of the deformation process (e.g., rolling). Therefore, crystal-orientation stability is not solely an inherent characteristic of a given orientation but is also related to the symmetry of the deformation process, as suggested elsewhere [95]. In the above-cited work, mathematical criteria for orientation stability were established, showing that in rolling, stability depends on constraints imposed on the deformation (i.e., relaxation or constraint of relevant strain components) and on the value of parameter A. In particular, it was shown that under fully unconstrained deformation, the volume fraction of the G component increases with increasing A at the expense of the B component (Figure 14). This can be attributed to the symmetry of deformation in the active slip systems. For the {011}<100> orientation, two different <110> slip directions are active in each of two {111} planes, forming a highly symmetric arrangement.
Crystallographic orientation stability during rolling of FCC metals with high stacking fault energy was also investigated in earlier studies (e.g., by Hirsch and Lücke [88] and by the Wierzbanowski group [98,99], notably using the rotation field approach proposed by Wierzbanowski [92]. These studies were generally limited to A = 1 and yielded results very similar to ours.
All experimentally observed rolling texture components were identified in the FSS-predicted texture (see Table 2). Their formation will be discussed below under two main assumptions. The first concerns the constant value of the strain hardening anisotropy parameter A used in simulations. Although this is a restrictive assumption, there is insufficient experimental evidence to propose a more realistic dependence of this parameter on rolling deformation. The second assumption is that, at least within the deformation range governing texture development, grains corresponding to the groups listed in Table 1 can be distinguished in the deformed material; this forms the basis for further analysis. This assumption is reasonable because the deformation field in individual grains with different orientations and/or microstructures—and thus different hardness—differs from the macroscopic average determined from finite element simulations of industrial-scale samples. Under these assumptions, the simulation results can be used to obtain deeper insight into the development of copper rolling texture.
For copper, the anisotropy parameter of slip system hardening (A) ranges from 1 to 1.2. Therefore, the discussion below regarding the formation of individual texture components is limited to this range of A values. The following analysis refers to the experimental results reported in reference [88]. In this chapter, changes in the volume fractions of texture components are given as absolute values, while changes in the intensity of component maxima are given as relative ones.

5.1. B Component

Experimental results show that the maximum intensity of the B component lies between the orientations {011}<112> and {011}<113>. For ε = 3, its deviation from the former is approximately 1.5°, and the width of its spread is about 6.7° [88]. The results of the present study indicate that the dominant contribution to the formation of this component originates from grains belonging to groups 4 and 5. For these grains, the sharpening of the {011}<311>-211> orientations (Figure 12, Figure 13 and Figure 14) results from relaxation of the deformation component e 12 . The volume fraction of the {011}<112> orientation in the texture of grains from group 5 was predicted to be approximately 93%. Thus, this group makes the major contribution to the formation of the B texture component. In contrast, for grains from group 4, the B component comprises about 46% of the volume fraction, and its maximum is shifted toward the {011}<311> orientation (Table 7). Therefore, the contribution of this group to the development of the B component should not be neglected.
The anisotropy of slip system hardening leads to a rotation of the {011}<112>-type texture component by less than 10°, accompanied by a reduction in its volume fraction to below 10%. The relatively high sensitivity of the B component to slip system hardening anisotropy arises from the fact that grains in groups 4 and 5 deform by slip in only one or two systems. In such cases, anisotropy differentiates the critical resolved shear stresses more strongly than when a larger number of slip systems (e.g., four or five) is activated. As a result, the crystallographic orientations of components formed for A > 1 deviate more from {011}<112> than those obtained for A = 1.

5.2. S Component

Experimental results demonstrate that the S component is clearly dominant in the rolling texture of copper [88]. Our modeling indicates that this component is primarily associated with grains belonging to group 3, for which the deformation components e 13   and e 23 are relaxed (Figure 8b and Figure 11). This is consistent with the calculations reported in [49]. Thus, the formation of the S component can be linked to the change in grain shape during deformation, from equiaxed to flattened.
It is noteworthy that the model predicts the position of the maximum intensity of the S component at the {539}<3 10 5> orientation, which differs only slightly from the experimentally observed orientation near {123}<634>. Simulations also show that anisotropy in slip system hardening results in an increase in the maximum intensity (below approximately 6%) and in the volume fraction (less than 13%—Table 5) as well as in a shift in the Euler space toward higher ϕ and φ1 angles (Table 2). The relatively strong S component observed experimentally in copper deformed beyond ε > 3 (95% reduction)—see [88]—suggests a dominant contribution from grains belonging to group 3 in Table 1.

5.3. Cu Component

Model predictions show that a strong Cu component develops for the first three grain groups listed in Table 1 (i.e., groups 1, 2, and 3) (Figure 8a,b, Figure 9, Figure 10 and Figure 11). It is the dominant texture component for grains in groups 1 and 2, and the second strongest for grains in group 3, where its maximum intensity reaches approximately 50% of that of the dominant S component. For groups 2 and 3, the Cu component can be assigned to the {112}<111> orientation, while for group 1 it corresponds to {4 4 11}<11 11 8>. These orientations differ by approximately 8°, with TD as the rotation axis.
Experimental findings indicate that within the rolling deformation range ε = 1.2–4.7, the texture maximum gradually shifts from an orientation close to {4 4 11}<11 11 8> toward one close to {112}<111>. However, even at ε = 4.7, the latter orientation remains offset by about 2° [88,100]. The modeling suggests that this behavior may result from progressive relaxation of the e 13 strain caused by the transition of grains from equiaxed to elongated and flattened shape (corresponding to grain groups 2 and 3, respectively). This interpretation agrees with the results reported in [54].
Furthermore, our calculations show that the volume fraction of the Cu component decreases with increasing values of the slip system hardening anisotropy parameter A. This effect is most pronounced for grains in group 3, where the maximum intensity reduction reaches up to about 55% (Figure 11, Table 2); simultaneously the volume fraction may decrease by no more than 6% (Table 6). For grains in group 2, the reduction in maximum intensity and volume fraction is much smaller—approximately 6% and 2%, respectively (Table 2 and Table 4). In contrast, considering slip system hardening anisotropy for grains in group 1 slightly increases the intensity of the {4 4 11}<11 11 8> maximum (Figure 9), but does not affect the corresponding volume fraction (Table 3).

5.4. Weak Components

Weaker components have also been identified in the copper rolling texture, namely the G component, the cube component (W), and the rotated cube component (rW) [88] Their volume fractions in the final texture for rolling deformation ε in the range of 2–3 are approximately 2% and 3%, respectively. However, these components were also observed in the results predicted by the FSS model.

5.5. G Component

For all tested values of parameter A, the G component was detected in the texture of grains from group no. 5 (Figure 14). When A = 1, this component was also present in the texture of grains from group no. 3, but it disappears when A increases to 1.2 (Figure 8b). The opposite trend was observed for grains from group no. 2: in this case, the component is absent at A = 1 but becomes visible at A = 1.2 (Figure 8a, Table 2).

5.6. Cube Components

Both the cube (W) component and the {025}<100> component rotated by 22° about the rolling direction (rW) were identified in the texture of grains from group no. 2. The simulations further showed that for A > 1, the latter component shifts toward the {047}<100> orientation and its intensity increases (Table 2, Figure 8a).

5.7. False Components

It can be noted that Table 2 also includes components that were not identified experimentally, such as the {317}<1 11 2> and {519}<091> components revealed for grain group no. 3 when the parameter A equals 1.5 and 1.2, respectively. This may result from inaccuracies in fulfilling the boundary conditions, as well as from the overly simplistic assumption of a constant value of A. Such discrepancies may also arise from the assumption of linear strain hardening. In reality, linear hardening occurs only in the initial stage of plastic deformation; at higher deformation levels, hardening follows a parabolic trend due to dynamic recovery. Consequently, the value of A should decrease with increasing deformation, approaching a value close to 1.
This tendency is supported by the observation that the false components do not appear in this grain group when A = 1. However, defining the precise variation in A for grains in polycrystalline materials is challenging. Hardening behavior depends on microstructural evolution and changes in crystallographic orientation, which in turn are influenced by the initial orientation, the configuration of surrounding grains, and the deformation mode. Given the currently available computational capabilities, the simplification adopted here seems reasonable. Calculations performed with constant A values across the studied range allow for estimating the general trend of orientation changes, although they may also introduce artifacts such as false orientations.
Nevertheless, this grain group is included because it accurately represents the presence of a strong S component and demonstrates that its intensity depends only weakly on A values within the range of 1–1.2. In contrast, for grain group no. 1, the false {011}<011> component was observed only for A = 1. Hence, it can be inferred that the appearance of false components results from an excessively high A value, which should instead lie within the range of 1.0–1.2. It should be noted, however, that the relative fraction of such components is small and can therefore be neglected.
It is also noteworthy that for A values of 1.2 and 1.5, the dominant strong texture component of the fourth grain group shifts away from the experimental position toward smaller φ2 angles (Table 2, Figure 12).
In Table 1, the case of unconstrained shears e 12 + e 13 was omitted. This situation may correspond to elongated grains split into deformation bands in which the e 12 component is relaxed. In such a case, the {011}<877> component should dominate the texture, as demonstrated in our analysis. However, this component was not observed experimentally, suggesting that the volume fraction of such grains in the deformed material is negligibly small.

5.8. Strain Effect

A comparison of the volume fractions of the individual texture components for the analyzed grain groups in the deformation range between 1.5 and 2 clearly shows the direction of texture development. With the exception of grain group no. 5, which maintains a stable texture above a strain of 1.5, an increase in the fractions of the main texture components was observed for the remaining grain groups. This result is expected for stable orientations and for the slowly rotating S component, as they “attract” neighboring orientations during increasing deformation.
The unusual decrease in the volume fraction of the Cu component in the analyzed strain range for grain group no. 3 may seem surprising. However, it should be noted that this decrease occurs for a small overall fraction of this orientation (less than 10%). In grain group no. 2, the volume fraction of this component is twice as high as in group no. 3; therefore, this decrease should not have a noticeable effect on the resulting rolling texture. At most, the influence of strain on the increase in the volume fraction of this component will be reduced.
For A between 1.0 and 1.2, within the strain range of 1.5–2, the largest increases in volume fraction are observed for the B component (grain group no. 4) and the S component (grain group no. 3). The increases in the volume fractions of the Cu component (grain group no. 2) and the {4 4 11}<11 11 8> component (grain group no. 1) are similar and are approximately half that of the B component.
This analysis demonstrates the potential of monitoring changes in the proportions of texture components during deformation to provide an in-depth characterization of the sheet-metal production process.

6. Conclusions

In this paper, it is assumed that the grain deformation field in the center of a rolled polycrystalline copper flat bar can be approximated by one of five boundary conditions imposed on the deformation field. These correspond to (i) fully constrained deformation; (ii) partial relaxation in the strain components e 13 ; e 13 + e 23 ; and e 13 + e 23 + e 12 (where 1—rolling direction, 2—transverse direction, 3—normal direction); and (iii) fully unconstrained deformation. Based on this assumption, the effect of slip system hardening anisotropy on the development of crystallographic texture components was investigated. This anisotropy is described by parameter A , and it was found that for copper its value should lie between 1 and 1.2.
However, the type of deformation constraint proved to have a much stronger influence on texture evolution than the value of parameter A . These aspects were incorporated into a simple computational model that enables implementation of additional modules for warm and hot rolling (i.e., dynamic recovery affecting parameter A , and dynamic recrystallization affecting texture formation). The model also allows calculation of plastic anisotropy coefficients based on the simulated texture. This, in particular, offers an additional means of experimental verification of the resulting textures and is of significant industrial relevance. These issues can be addressed in future research.
The results obtained lead to the following conclusions regarding the components of rolling texture:
-
Development of the B component is associated with relaxation of the shear strain e 12 occurring in the rolling plane.
-
Development of the S component is associated with flat grains in which the shear strains e 13 (in the plane perpendicular to the transverse direction) and e 23 (in the plane perpendicular to the rolling direction) are relaxed.
-
Development of the Cu component is associated with relaxation of the shear strain e 13 , characteristic for elongated grains, and for flat grains in which e 23 is additionally relaxed.
-
The effect of slip system strain hardening anisotropy on the shares of individual components depends on the deformation constraints applied to the rolled bar. The slip systems hardening anisotropy significantly affects the volume fraction of the S and Cu components under relaxation of e 13 and e 23 shears, and of the B component under the relaxation of (at least) e 13 ,     e 23 and e 12 shears. Under the relaxation of e 13 only, its effect on the Cu component is insignificant.
This work is dedicated to the memory of Professor Jan Pospiech (1936–2020), our friend and expert in the field of the crystallographic texture.

Author Contributions

Methodology, Software, W.Ł.; Writing—original draft, Investigation, M.W.; Writing—review & editing, K.W.; Validation, D.B.-W. All authors have read and agreed to the published version of the manuscript.

Funding

This research was funded by the National Science Centre, Poland (NCN), under grant numbers: DEC-2025/09/X/ST11/00674 and UMO-2023/49/B/ST11/00774.

Data Availability Statement

The original contributions presented in this study are included in the article. Further inquiries can be directed to the corresponding author.

Conflicts of Interest

The authors declare no conflicts of interest.

Nomenclature

Glossary of abbreviations and symbols
CPFECrystal Plasticity Finite Element
FCCface centered cubic
FEMfinite element method
FSSFluctuating Stress State
ODForientation distribution function
RCRelaxed Constrains
RDRolling Direction
NDNormal Direction
TDTransverse Direction
RPRolling Plane
SFEstacking fault energy
SO(3)name of the Lie group
TBHTaylor-Bishop-Hill
D(υ)misorientaton distribution number
f(g)ODF intensity for a given orientation g
hfinal thickness of the rolled strip
h0initial thickness of the rolled strip
L1length of the grain; i.e., its size along RD
L2width of the grain; i.e., its size along TD
L3thickness of the grain; its size along ND
A = h 2 / h 1 the strain hardening anisotropy parameter
Dthe distance of a grain boundary strong influence on the deformation of its interior
b i s unit slip direction vector (i.e., parallel to the Burgers vector of the slipping dislocations), for the slip system s
e i j ij component of microscopic plastic deformation of grain
E i j component of macroscopic plastic deformation of the polycrystalline sample
f i maximum intensity of the texture components (calculated value)
H s h strain hardening matrix describing hardening of the system s as a result of a strain in the system h
H 1 subspace of the Euler space, defined in the Ref. [90]
h 1 elements of the strain hardening matrix related to the group of mutually coplanar systems and those non-coplanar systems, whose dislocations do not create strong obstacles to the dislocations movement,
h 2 elements of the strain hardening matrix related to the group of mutually non-coplanar systems, whose dislocations do create strong obstacles to the dislocations movement,
m i j s dyadic product of the unit slip direction vector and the unit vector normal to the slip plane, for the slip system s
n j s unit vector normal to the slip plane calculated for the slip system s
αthe stress scale factor
γ s simple shear deformation in this slip system s
δ γ assumed strain increase in each slip system for single step of the computer model used
εrolling true strain (in thickness)
pnumber of mutually independent slip systems
σ i j local stress acting on a grain
σ i j e x external stress imposed on a grain
τ c s critical shear stress for slip system s
τ 0 initial value of τ c s , assumed to be the same for each slip system s
υmisorientation
φ 1 ,   ϕ ,   φ 2   Euler angles (here in the Bunge convention)
Superscripts
right
qnumber of the slip systems combination
left
TTucker (stress) tensor
Rreaction (stress)
Eeffective value (of stress)
Subscripts
left
s1, s2(stress) activated slip system no. 1, 2
1, 2(stress) acting in slip system no. 1, 2 but not activated them
Texture components
B{011}<211>
S~{123}<634>
Cu{112}<111>, {4 4 11}<11 11 8>
G{011}<100>
W{001}<100>
rW{025}<100>
α-fibertexture fiber
β-fibertexture fiber

References

  1. de Souza, C.R.; de Monlevade, E.F. Effect of Cold Rolling Path on the Deformation Textures of C10300 Copper. Mater. Res. 2021, 24, e20200332. [Google Scholar] [CrossRef]
  2. Long, D.; Liu, S.; Zhu, J.; Zhang, J.; Yuan, X. Texture and Microstructure Evolution of Ultra-High Purity Cu-0.1al Alloy under Different Rolling Methods. Crystals 2021, 11, 1113. [Google Scholar] [CrossRef]
  3. Lee, J.; Jeong, H.; Lee, G.; Jung, T. Mechanical Properties, Microstructure, and Texture Evolution of Copper Sheets Subjected to Differential Speed Rolling Process. Mater. Res. Express 2022, 9, 106503. [Google Scholar] [CrossRef]
  4. Gao, Y.; Guo, T.; Feng, R.; Qian, D.; Huang, D.; Zhang, G.; Ling, D.; Ding, Y. High Strength High Conductivity Copper Prepared by C-ECAP and Cryo-Rolling. Mater. Charact. 2024, 208, 113665. [Google Scholar] [CrossRef]
  5. Qin, J.; Li, X.; Wang, D.; Zhou, C.; Hu, T.; Wang, J.; Wang, Y.; Hu, Y. Microstructure and Texture Evolution in Cold-Rolled and Annealed Oxygen-Free Copper Sheets. Materials 2024, 17, 2202. [Google Scholar] [CrossRef] [PubMed]
  6. Roters, F.; Eisenlohr, P.; Bieler, T.R.; Raabe, D. Crystal Plasticity Finite Element Methods. In Materials Science and Engineering; Wiley-Vch: Weinheim, Germany, 2010. [Google Scholar]
  7. Roters, F.; Eisenlohr, P.; Hantcherli, L.; Tjahjanto, D.D.; Bieler, T.R.; Raabe, D. Overview of Constitutive Laws, Kinematics, Homogenization and Multiscale Methods in Crystal Plasticity Finite-Element Modeling: Theory, Experiments, Applications. Acta Mater. 2010, 58, 1152–1211. [Google Scholar] [CrossRef]
  8. Chen, Y.; Chen, R.; Yao, Y.; Min, N.; Li, W.; Diao, A. The Effect of Multi-Step Tempering and Partition Heat Treatment on 25Cr2Ni3MoV Steel’s Cryogenic Strength Properties. Materials 2024, 17, 518. [Google Scholar] [CrossRef]
  9. Byrska-Wójcik, D.; Ostachowska, M.; Gibek, J.; Wierzbanowski, K.; Wróbel, M.; Błoniarz, R.; Baczmański, A. Texture Homogenization in Aluminium during Multi-Pass Asymmetric and Symmetric Rolling with Tilted and Flat Material Entry. J. Mater. Process. Technol. 2025, 338, 118796. [Google Scholar] [CrossRef]
  10. Uniwersał, A.; Wróbel, M.; Wierzbanowski, K.; Wroński, S.; Baczmański, A. Mechanical and Microstructural Characteristics of Polycrystalline Copper Rolled Asymmetrically to a High Deformation Level. Mater. Charact. 2019, 148, 214–223. [Google Scholar] [CrossRef]
  11. Wroński, S.; Wierzbanowski, K.; Bacroix, B.; Chauveau, T.; Wróbel, M. Effect of Asymmetric Rolling on Mechanical Characteristics, Texture and Misorientations in Ferritic Steel. J. Cent. South Univ. 2013, 20, 1443–1455. [Google Scholar] [CrossRef]
  12. Crumbach, M.; Pomana, G.; Wagner, P.; Gottstein, G. A Taylor Type Deformation Texture Model Considering Grain Interaction and Material Properties. Part I—Fundamentals. In Recrystallization and Grain Growth; Springer: Berlin/Heidelberg, Germany, 2001; Volume 1 and 2. [Google Scholar]
  13. Gallardo-Basile, F.J.; Naunheim, Y.; Roters, F.; Diehl, M. Lath Martensite Microstructure Modeling: A High-Resolution Crystal Plasticity Simulation Study. Materials 2021, 14, 691. [Google Scholar] [CrossRef]
  14. Van Houtte, P.; Li, S.; Engler, O. Taylor-Type Homogenization Methods for Texture and Anisotropy. In Continuum Scale Simulation of Engineering Materials; Wiley-Vch: Weinheim, Germany, 2004. [Google Scholar]
  15. Hibbard, W.R., Jr.; Yen, M.K. Wire Textures of Copper and Its Binary Alpha Solid Solution Alloys with Aluminum, Nickel and Zinc. Trans. AIME 1948, 175, 126–141. [Google Scholar]
  16. Heye, W.; Wassermann, G. Die Entstehung der Walztexturen der Kubisch Flächenzentrierten Metalle Durch Gleiten, Mechanische Zwillingsbildung und die Bildung Beschränkter Fasertexturen. Int. J. Mater. Res. 1968, 59, 616–624. [Google Scholar] [CrossRef]
  17. Łatas, W.; Wróbel, M. Computer Simulation of the Rolling Texture Development for the High and Medium Stacking Fault Energy. Arch. Metall. 1995, 40, 263–281. [Google Scholar]
  18. Van Houtte, P.; Delannay, L.; Kalidindi, S.R. Comparison of Two Grain Interaction Models for Polycrystal Plasticity and Deformation Texture Prediction. Int. J. Plast. 2002, 18, 359–377. [Google Scholar] [CrossRef]
  19. Taylor, G.I. Plastic Strain in Metals. Twenty-Eighth May Lecture to the Institute of Metals 1938. J. Inst. Met. 1938, 62, 307–324. Available online: http://pajarito.materials.cmu.edu/documents/Taylor_1938.pdf (accessed on 1 August 2025).
  20. Taylor, G.I. Verformung Und Fliessen Des Festkörpers. In IUTAM Coloquium; Madrid, R.L., Grammel, S.V., Eds.; Springer: Berlin/Heidelberg, Germany, 1956; p. 3. [Google Scholar]
  21. Mises, R.V. Mechanik Der Plastischen Formänderung von Kristallen. ZAMM—J. Appl. Math. Mech./Z. Angew. Math. Mech. 1928, 8, 161–185. [Google Scholar] [CrossRef]
  22. Schmid, E. Yield Point of a Crystals: Critical Shear Stress Law. In Proceedings of the 14th International Congress of Theoretical and Applied Mechanics, Delft, The Netherlands, 30 August–4 September 1976; p. 342. [Google Scholar]
  23. Bishop, J.F.W.; Hill, R. XLVI. A Theory of the Plastic Distortion of a Polycrystalline Aggregate under Combined Stresses. Lond. Edinb. Dublin Philos. Mag. J. Sci. 1951, 42, 414–427. [Google Scholar] [CrossRef]
  24. Bishop, J.F.W.; Hill, R. CXXVIII. A Theoretical Derivation of the Plastic Properties of a Polycrystalline Face-Centred Metal. Lond. Edinb. Dublin Philos. Mag. J. Sci. 1951, 42, 1298–1307. [Google Scholar] [CrossRef]
  25. Chin, G.Y.; Mammel, W.L. Generalization and Equivalence of the Minimum Work (Taylor) and Maximum Work (Bishop-Hill) Principles for Crystal Plasticity. Trans. TMS-AIME 1969, 245, 1211–1214. [Google Scholar]
  26. Van Houtte, P. On the Equivalence of the Relaxed Taylor Theory and the Bishop-Hill Theory for Partially Constrained Plastic Deformation of Crystals. Mater. Sci. Eng. 1982, 55, 69–77. [Google Scholar] [CrossRef]
  27. Honneff, H. Berechnung der Orientierungsänderungen und Texturentwicklung Beim Walzen Kristalliner Festkörper Mit Hilfe Eines Modifizierten Taylor-Modells; Technische Hochschule: Aachen, Germany, 1980. [Google Scholar]
  28. Honneff, H.; Mecking, H. A Method for the Determination of the Active Slip Systems and Orientation Changes During Single Crystal Deformation. In Textures of Materials; Springer: Berlin/Heidelberg, Germany, 1978. [Google Scholar]
  29. Mecking, H. Computer Simulation of Texture Development. In Proceedings of the 6th International Conference on Textures of Materials (ICOTOM6), Tokyo, Japan, 28 September–3 October 1981; Nagashima, S., Ed.; Iron and Steel Institute: Tokyo, Japan, 1981; Volume 1, pp. 53–66. [Google Scholar]
  30. Kocks, U.F.; Canova, G.R. How Many Slip Systems, and Which? In Deformation of Polycrystals, Mechanisns and Microstructures; Hansen, N., Horsewell, A., Humphreys, F.J., Eds.; Riso National Laboratory: Roskilde, Denmark, 1981; pp. 35–44. [Google Scholar]
  31. Kocks, U.F.; Chandra, H. Slip Geometry in Partially Constrained Deformation. Acta Metall. 1982, 30, 695–709. [Google Scholar] [CrossRef]
  32. Rocks, U.F.; Canova, G.R.; Jonas, J.J. Yield Vectors in f.c.c. Crystals. Acta Metall. 1983, 31, 1243–1252. [Google Scholar] [CrossRef]
  33. van Houtte, P. Adaption of the Taylor Theory to the Typical Substructure of Some Cold-Rolled Fcc Metals. In Proceedings of the 6th International Conference on Textures of Materials (ICOTOM6), Tokyo, Japan, 28 September–3 October 1981; Nagashima, S., Ed.; Iron and Steel Institute: Tokyo, Japan, 1981; pp. 428–437. [Google Scholar]
  34. Van Houtte, P. Some Recent Developments in the Theories for Deformation Texture Prediction. In Proceedings of the 7th International Conference on Texture of Materials (ICOTOM7), Noordwijkerhout, The Netherlands, 17–21 September 1984; pp. 7–23. [Google Scholar]
  35. Mecking, H. Deformation of Polycrystals. In Proceedings of the 5th International Conference on the Strength of Metals and Alloys (ICSMA5), Achen, Germany, 27–31 August 1979; Haasen, P., Gerold, V., Kostorz, G., Eds.; Pergamon Press: Oxford, UK, 1979; Volume 3, pp. 1573–1594. [Google Scholar]
  36. Fortunier, R.; Driver, J.H. Grain Reorientations in Rolled Aluminium Sheet: Comparison with Predictions of Continuous Constraints Model. Acta Metall. 1987, 35, 1355–1366. [Google Scholar] [CrossRef]
  37. Daniel, D.; Jonas, J.J. Texture and Anisotropy of Plastic Properties in Deep Drawing Steels. Texture Stress Microstruct. 1991, 14, 1165–1171. [Google Scholar] [CrossRef]
  38. Gingell, A.D.B.; Fundenberger, J.J.; Verdu, C.; Maurice, C.; Driver, J.H. Microscopic Aspects of Heterogeneous Deformation in Aluminium-Magnesium Alloy 5182. Rev. Metall. Cah. D’Inf. Tech. 1997, 94, 1457–1465. [Google Scholar] [CrossRef]
  39. Duggan, B.J.; Quadir, M.Z.; Tse, Y.Y. Deformation Bands in Texture Formation in Cold and Warm Rolling Interstitial-Free Steel, in Advanced X-Ray Techniques in Research and Industry. In Advanced X-Ray Techniques in Research and Industry; Singh, A.K., Ed.; IOS Press: Amsterdam, Australia; Berlin/Heidelberg, Germany; Oxford, UK; Tokyo, Japan; Washington, DC, USA, 2005; pp. 66–68. [Google Scholar]
  40. Verlinden, B.; Driver, J.; Samajdar, I.; Doherty, R. Modelling. In Thermo-Mechanical Processing of Metallic Materials; Cahn, R.W., Ed.; Elsevier: New York, NY, USA, 2007. [Google Scholar]
  41. Suwas, S.; Gurao, N.P. Development of Microstructures and Textures by Cross Rolling. In Comprehensive Materials Processing: Thirteen Volume Set; Elsevier: New York, NY, USA, 2014; Volume 3. [Google Scholar]
  42. Wróbel, M.; Dymek, S.; Blicharski, M.; Gorczyca, S. The Development of Dislocation Structure and Texture in Rolled Copper (001)[110] Single Crystals. Texture Stress Microstruct. 1988, 10, 67–75. [Google Scholar] [CrossRef]
  43. Wrobel, M.; Dymek, S.; Blicharski, M.; Gorczyca, S. Dislocation Microstructure and Texture Development in Rolled Copper Single Crystals. Z. Fuer Met./Mater. Res. Adv. Tech. 1994, 85, 415–425. [Google Scholar] [CrossRef]
  44. Van Houtte, P.; Delannay, L.; Samajdar, I. Quantitative Prediction of Cold Rolling Textures in Low-CarbonSteel by Means of the Lamel Model. Texture Stress Microstruct. 1999, 31, 109–149. [Google Scholar] [CrossRef]
  45. Van Houtte, P.; Li, S.; Seefeldt, M.; Delannay, L. Deformation Texture Prediction: From the Taylor Model to the Advanced Lamel Model. Int. J. Plast. 2005, 21, 589–624. [Google Scholar] [CrossRef]
  46. Honneff, H.; Mecking, H. Analysis of the Deformation Texture at Different Rolling Conditions. In Proceedings of the 6th International Conference on Textures of Materials (ICOTOM 6), Tokyo, Japan, 28 September–3 October 1981; Nagashima, S., Ed.; Iron and Steel Institute: Tokyo, Japan, 1981; pp. 347–355. [Google Scholar]
  47. Hamada, J.I.; Ono, J.I.; Inoue, H. Effect of Texture on R-Value of Ferritic Stainless Steel Sheets. ISIJ Int. 2011, 51, 1740–1748. [Google Scholar] [CrossRef]
  48. Hamada, J.I.; Agata, K.; Inoue, H. Estimation of Planar Anisotropy of the R- Value in Ferritic Stainless Steel Sheets. Mater. Trans. 2009, 50, 752–758. [Google Scholar] [CrossRef]
  49. Liu, Y.S.; Van Houtte, P. Simulation of Deformation Textures in Cold-Rolled Molybdenum Sheets by the Taylor-Bishop-Hill Theory. Int. J. Refract. Met. Hard Mater. 2001, 19, 209–216. [Google Scholar] [CrossRef]
  50. Tóth, L.S.; Molinari, A.; Raabe, D. Modeling of Rolling Texture Development in a Ferritic Chromium Steel. Metall. Mater. Trans. A Phys. Metall. Mater. Sci. 1997, 28, 2343–2351. [Google Scholar] [CrossRef]
  51. Raphanel, J.L.; Van Houtte, P. Simulation of the Rolling Textures of b.c.c. Metals by Means of the Relaxed Taylor Theory. Acta Metall. 1985, 33, 1481–1488. [Google Scholar] [CrossRef]
  52. Zankl, G. Magnetische und Elektronenmikroskopische Untersuchungen Zum Plastischen Verhalten von Vielkristallinem Nickel. Z. Naturforschung—Sect. A J. Phys. Sci. 1963, 18, 795–809. [Google Scholar] [CrossRef]
  53. Schwink, C.H.; Vorbrugg, W. Experimentelle und Theoretische Untersuchungen Zum Plastischen Verhalten Kubisch-Flächenzentrierter Vielkristalle. Z. Naturforschung—Sect. A J. Phys. Sci. 1967, 22, 626–642. [Google Scholar] [CrossRef]
  54. Hirsch, J.; Lücke, K. Overview No. 76. Mechanism of Deformation and Development of Rolling Textures in Polycrystalline f.c.c. Metals-II. Simulation and Interpretation of Experiments on the Basis of Taylor-Type Theories. Acta Metall. 1988, 36, 2883–2904. [Google Scholar] [CrossRef]
  55. Sachs, G. Zur Ableitung Einer Fließbedingung. In Mitteilungen der Deutschen Materialprüfungsanstalten; Springer: Berlin/Heidelberg, Germany, 1929. [Google Scholar]
  56. Tucker, G.E.G. Discussion on Preferred Orientation. J. Inst. Metals 1953, 82, 655–656. [Google Scholar]
  57. Tucker, G.E.G. Comment on “Rolling Textures in f.c.c. and b.c.c. Metals”. Acta Metall. 1964, 12, 1093–1094. [Google Scholar] [CrossRef]
  58. Leffers, T. Computer Simulation of the Plastic Deformation in Face Centered Cubic Polycrystals and the Rolling Texture Derived. Phys. Status Solidi (B) 1968, 25, 337–344. [Google Scholar] [CrossRef]
  59. Leffers, T. A Kinematical Model for the Plastic Deformation of Face Centered Cubic Polycrystals. Ph.D. Thesis, Riso Report No. 302, Wiley-Vch: Riso, Denmark, 1975. [Google Scholar]
  60. Leffers, T. The Shortcomings of the Taylor Model in the Description of the Plastic Deformation of Real Polycrystals. In Textures of Materials; Springer: Berlin/Heidelberg, Germany, 1978. [Google Scholar]
  61. Leffers, T. Modified Sachs approach to the plastic deformation of polycrystals as a realistic alternative to the Taylor model. In Energy Technology Review; Elsevier: New York, NY, USA, 1980. [Google Scholar]
  62. Hansen, N.; Horsewell, A.; Leffers; Lilholt, H. Deformation of Polycrystals: Mechanisms and Microstructures. In Deformation of Polycrystals: Mechanisms and Microstructures; Risø National Laboratory: Roskilde, Denmark, 1981; pp. 55–71. [Google Scholar]
  63. English Oxford Dictionary. Available online: https://www.oed.com/search/dictionary/?scope=Entries&q=self-consistent (accessed on 2 November 2024).
  64. Bordoloi, R.B.; Bordoloi, R.; Konwer, R.; Konwer, M.; Dubey, R.K.; Saikia, J.; Baruah, D.; Konwaar, H.; Baruah, G.D. Self Consistency of Universal Laws Appearing in Different Contexts. Asian J. Phys. 2015, 24, 181–187. [Google Scholar]
  65. Tarpey, T.; Flury, B. Self-Consistency: A Fundamental Concept in Statistics. Stat. Sci. 1996, 11, 229–243. [Google Scholar] [CrossRef]
  66. Curie, P. Propriétés Magnétiques Des Corps à Diverses Températures. Ann. Chim. Phys. 1895, 5, 289–405. [Google Scholar]
  67. Weiss, P. L’hypothèse Du Champ Moléculaire et La Propriété Ferromagnétique. J. Phys. Theor. Appl. 1907, 6, 661–690. [Google Scholar] [CrossRef]
  68. Eshelby, J.D. The Determination of the Elastic Field of an Ellipsoidal Inclusion, and Related Problems. In Collected Works of J. D. Eshelby; Springer: Berlin/Heidelberg, Germany, 2007. [Google Scholar]
  69. Kröner, E. Zur Plastischen Verformung des Vielkristalls. Acta Metall. 1961, 9, 155–161. [Google Scholar] [CrossRef]
  70. Hill, R. Continuum Micro-Mechanics of Elastoplastic Polycrystals. J. Mech. Phys. Solids 1965, 13, 89–101. [Google Scholar] [CrossRef]
  71. Hutchinson, J.W. Elastic-Plastic Behavior of Polycrystalline Metals and Composites. Proc. R. Soc. Ser. A Math. Phys. Sci. 1970, 319, 247–272. [Google Scholar] [CrossRef]
  72. Berveiller, M.; Zaoui, A. Some Applications of the Self-Consistent Scheme in the Field of Plasticity and Texture of Metallic Polycrystals. In Large Deformations of Solids: Physical Basis and Mathematical Modelling; Springer: Berlin/Heidelberg, Germany, 1986. [Google Scholar]
  73. Molinari, A.; Canova, G.R.; Ahzi, S. A Self Consistent Approach of the Large Deformation Polycrystal Viscoplasticity. Acta Metall. 1987, 35, 2983–2994. [Google Scholar] [CrossRef]
  74. Lebensohn, R.A.; Tomé, C.N. A Self-Consistent Anisotropic Approach for the Simulation of Plastic Deformation and Texture Development of Polycrystals: Application to Zirconium Alloys. Acta Metall. Mater. 1993, 41, 2611–2624. [Google Scholar] [CrossRef]
  75. Nagel, E. The Reduction of Theories. In The Structure of Science. Problems in the Logic of Scientific Explanation; Harcourt, Brace & World: New York, NY, USA, 1961; pp. 336–397. [Google Scholar]
  76. Batterman, R.W. Reduction. In Encyclopedia of Philosophy; Macmillan: Detroit, MI, USA, 2006; Volume 8, pp. 282–287. [Google Scholar]
  77. Clausen, B.; Lorentzen, T.; Leffers, T. Self-Consistent Modelling of the Plastic Deformation of F.C.C. Polycrystals and Its Implications for Diffraction Measurements of Internal Stresses. Acta Mater. 1998, 46, 3087–3098. [Google Scholar] [CrossRef]
  78. Zattarin, P.; Baczmański, A.; Lipiński, P.; Wierzbanowski, K. Modified Self Consistent Model for Time Independent Plasticity of Polycrystalline Material. Arch. Metall. 2000, 45, 163–184. [Google Scholar]
  79. Kot, P.; Baczmański, A.; Gadalińska, E.; Wroński, S.; Wroński, M.; Wróbel, M.; Bokuchava, G.; Scheffzük, C.; Wierzbanowski, K. Evolution of Phase Stresses in Al/SiCp Composite during Thermal Cycling and Compression Test Studied Using Diffraction and Self-Consistent Models. J. Mater. Sci. Technol. 2020, 36, 176–189. [Google Scholar] [CrossRef]
  80. Wierzbanowski, K.; Wroński, M.; Leffers, T. FCC Rolling Textures Reviewed in the Light of Quantitative Comparisons between Simulated and Experimental Textures. Crit. Rev. Solid State Mater. Sci. 2014, 39, 391–422. [Google Scholar] [CrossRef]
  81. Franciosi, P.; Berveiller, M.; Zaoui, A. Latent Hardening in Copper and Aluminium Single Crystals. Acta Metall. 1980, 28, 273–283. [Google Scholar] [CrossRef]
  82. Franciosi, P. Etude Théorique et Expérimentale du Comportement Élastoplastique des Monocristaux Métalliques se Déformant Par Glissement: Modélisation Pour un Chargement Complexe Quasi Statique; Universite Paris-Nord: Paris, France, 1984. [Google Scholar]
  83. Stupkiewicz, S.; Petryk, H. A Minimal Gradient-Enhancement of the Classical Continuum Theory of Crystal Plasticity. Part II: Size Effects. Arch. Mech. 2016, 68, 487–513. [Google Scholar]
  84. Kocks, U.F. The Relation between Polycrystal Deformation and Single-Crystal Deformation. Metall. Mater. Trans. 1970, 1, 1121–1143. [Google Scholar] [CrossRef]
  85. Backofen, W.A. Deformation Processing; Addison-Wesley: Reading, MA, USA, 1972. [Google Scholar]
  86. Leffers, T. Computer Simulation of the Plastic Deformation in Face Centered Cubic Polycrystals and the Rolling Texture Derived; Riso Report No 184; Danish Atomic Energy Commission: Riso, Denmark, 1968. [Google Scholar]
  87. Tome, C.; Canova, G.R.; Kocks, U.F.; Christodoulou, N.; Jonas, J.J. The Relation between Macroscopic and Microscopic Strain Hardening in F.C.C. Polycrystals. Acta Metall. 1984, 32, 1637–1653. [Google Scholar] [CrossRef]
  88. Hirsch, J.; Lücke, K. Overview No. 76. Mechanism of Deformation and Development of Rolling Textures in Polycrystalline f.c.c. Metals-I. Description of Rolling Texture Development in Homogeneous CuZn Alloys. Acta Metall. 1988, 36, 2863–2882. [Google Scholar] [CrossRef]
  89. Hirsch, J.; Aryshesnkij, E.; Konovalov, S. Slip System Selection and Taylor Factor Evolution in FCC Metals. SSRN Electron. J. 2020, 3618715. [Google Scholar] [CrossRef]
  90. Daniel, D.; Jonas, J.J. Measurement and Prediction of Plastic Anisotropy in Deep-Drawing Steels. Metall. Trans. A 1990, 21, 331–343. [Google Scholar] [CrossRef]
  91. Raabe, D. Computational Materials Science, The Simulation of Materials Microstructures and Properties; Wiley-Vch: Weinheim, Germany, 1998. [Google Scholar]
  92. Saint-Venant, A.J.C.B. Memoire Sur La Torsion Des Prismes. Mem. Divers. Savants 1855, 14, 233–560. [Google Scholar]
  93. Love, A.E.H. Treatise on Mathematical Theory of Elasticity, 4th ed.; Dover Publications Inc.: New York, NY, USA, 1944. [Google Scholar]
  94. Bunge, H.J. Texture Analysis in Material Science; Butterworths: London, UK, 1982. [Google Scholar]
  95. Wróbel, M.; Łatas, W. Computer Simulation of the Rolling Texture Development for the High and Medium Stacking Fault Energy FCC Metals, Part 2, Theoretical Analysis of Orientation Stability. Arch. Metall. 1995, 40, 333–344. [Google Scholar]
  96. Hansen, J.; Pospiech, J.; Lücke, K. Tables for Texture Analysis of Cubic Crystals; Springer: Berlin/Heidelberg, Germany, 1978. [Google Scholar]
  97. Pospiech, J.; Lücke, K. The Rolling Textures of Copper and α-Brasses Discussed in Terms of the Orientation Distribution Function. Acta Metall. 1975, 23, 997–1007. [Google Scholar] [CrossRef]
  98. Wierzbanowski, K.; Clement, A. Rotation Field and Continuity Equation for Texture Evolution. Cryst. Res. Technol. 1984, 19, 201–212. [Google Scholar] [CrossRef]
  99. Uniwersał, A.; Wroński, M.; Wróbel, M.; Wierzbanowski, K.; Baczmański, A. Texture Effects Due to Asymmetric Rolling of Polycrystalline Copper. Acta Mater. 2017, 139, 30–38. [Google Scholar] [CrossRef]
  100. Marin, M.; Ellahi, R.; Vlase, S.; Bhatti, M.M. On the Decay of Exponential Type for the Solutions in a Dipolar Elastic Body. J. Taibah Univ. Sci. 2020, 14, 534–540. [Google Scholar] [CrossRef]
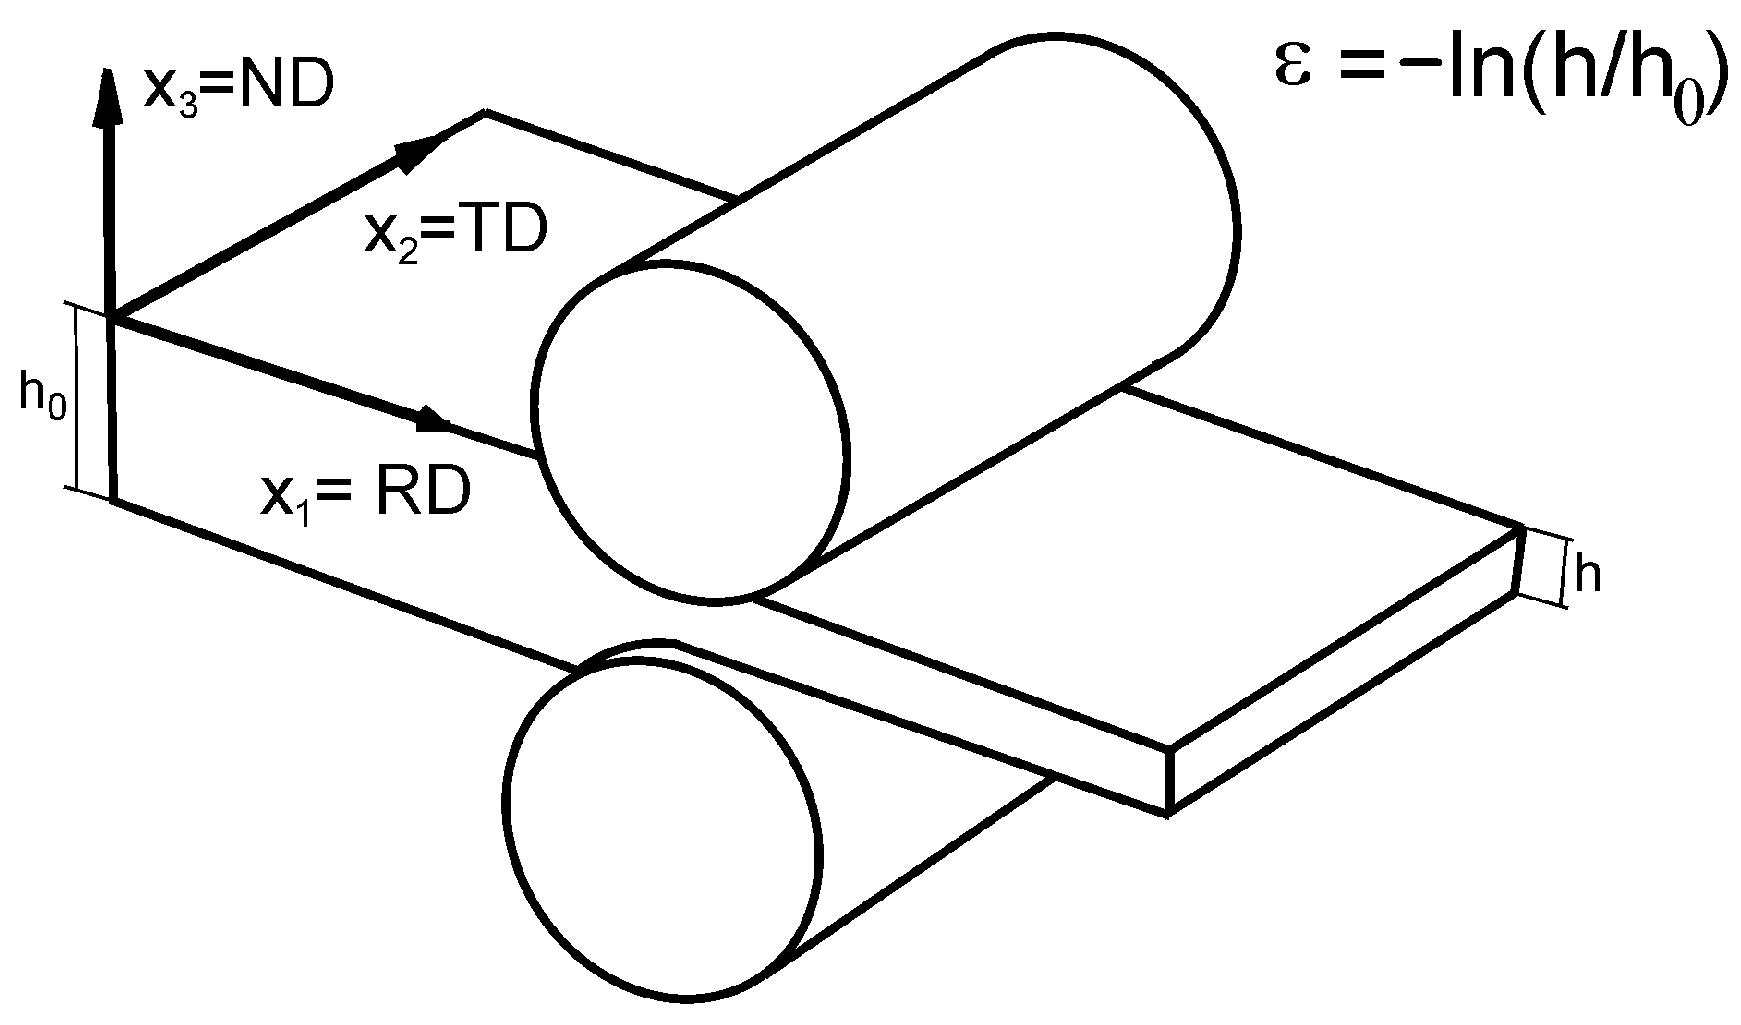
Figure 1. Reference frame of the rolling process.
Crystals 15 01011 g001
Figure 2. Scheme of fully constrained ( e 12 = e 13 = e 23 = 0 ) and unconstrained shears.
Crystals 15 01011 g002
Figure 3. Mutually symmetrical orientations compensating the shears e 13 .
Crystals 15 01011 g003
Figure 4. The idea of the self-consistent approach.
Crystals 15 01011 g004
Figure 5. Two-dimensional cross-section of the single grain yield surface. The effective stress ( σ i j s E ) being the superposition of the external Tucker type stress ( σ T ) and the reaction stress ( σ R ), activates slip system s (i.e., m i j s σ s E i j = τ c s ). The deformation in the system s1, activated by the effective stress σ s 1 E i j , results in the generation of reaction stress σ 2 R rotating the effective stress state with respect to the flow surface. The rotated effective stress σ s 2 E i j activates the system s2. α is the Tucker’s stress state amplitude. The yield surface adaptation for the single crystall plasticity can also be found elsewhere (c.f., [84,85]).
Crystals 15 01011 g005
Figure 6. Schematic range of constraints imposed on a flat grain boundaries. The constraint is important at a distance (D) from the boundary of hypothetical cuboid grain, approx. equal to the grain thickness (L3).
Crystals 15 01011 g006
Figure 7. Distribution of misorientation D(υ) relative to the reference position of {011}<112>, grains of group no. 5, A = 1.2 and ε = 2. The distribution presents numbers of orientations with ϑ misorientation relative to the reference position.
Crystals 15 01011 g007
Figure 8. Orientation distribution functions (ODFs), presented in φ 2 cross-section with step of 5°, for ε =2: ODF for grains group no. 2 (a), ODF for grain group no. 3 (b), and selected ideal orientation positions in the Euler space (c); approximated position of the β-fiber is also marked.
Crystals 15 01011 g008aCrystals 15 01011 g008b
Figure 9. The extended β skeleton lines for grains from group no. 1, φ 2 range of 40–90°.
Crystals 15 01011 g009
Figure 10. The extended β skeleton lines for grains from group no. 2.
Crystals 15 01011 g010
Figure 11. The extended β skeleton lines for grains from group no. 3.
Crystals 15 01011 g011
Figure 12. The extended β skeleton lines for grains group no. 4.
Crystals 15 01011 g012
Figure 13. Intensity of selected ODF range, grains group no. 4, A = 1, ε = 2.
Crystals 15 01011 g013
Figure 14. Effect of A value on the volume fraction of the B and G components, grains from group no. 5, ε 1.5.
Crystals 15 01011 g014
Table 1. Unconstrained shears e i j for five grain groups. The remaining shears are close to zero.
Grains Group No. Unconstrained   Shears   e i j
1---
2 e 13
3 e 13 + e 23
4 e 13 + e 23 + e 12
5 e 13 + e 23 + e 12 + e 22
Table 2. Texture components calculated for true strain ε = 2. The crystal orientations ( φ 1 , ϕ ,   φ 2 ) relate to the H 1 subspace of the Euler space. The subspace definition can be found elsewhere (c.f. [96]).
Grains Group No.Texture ComponentThe Maximum Position Intensity   Maximum   f i
φ 1 ϕ φ 2 A = 1A = 1.2A = 1.5
1{4 4 11}<11 11 8>90274570.280.381.4
{011}<011>90459022.9--
2{112}<111>90354544.742.0-
{447}<778>903945--37.9
{011}<311>25459010.117.715.5
{011}<100>04590-8.95.7
{025}<100>022904.2--
{047}<100>03090-9.49.4
{001}<100>00903.91.92.9
3{539}<3 10 5>53335961.0--
{537}<132>574059-65.0-
{324}<275>584256--50.0
{112}<111>90354532.814.614.3
{011}<100>0459021.1--
{519}<091>133079-5.5
{317}<1 11 2>262472--9.4
4{011}<311>25459072.4--
{516}<394>374079-53.5-
{313}<163>384772--46.7
{011}<655>504590--28.2
Table 3. The influence of A and ε values on the volume fractions of grains from group no. 1 with misorientations (υ) below 10° with respect to the orientation {4 4 11}<11 11 8>.
AVolume Fraction [%]
0 °   υ 10°
ε = 1.5ε = 2.0
1.0036.542.9
1.0538.443.9
1.1038.043.5
1.1538.143.1
1.2037.842.9
1.5037.242.3
Table 4. The influence of A and ε values on the volume fractions of grains from group no. 2 with misorientations (ϑ) below 10° with respect to the orientation {112}<1 1 1>.
AVolume Fraction [%]
0 °   υ 10°
ε = 1.5ε = 2.0
1.0022.0 26.4
1.0521.524.4
1.1021.524.4
1.1521.624.5
1.2021.2 24.4
1.5018.8 21.6
Table 5. The influence of A and ε values on the volume fractions of grains from group no. 3 with misorientations (ϑ) below 10° with respect to the orientation S.
AVolume Fraction [%]
0 °   υ 10°
ε = 1.5ε = 2.0
1.0052.162.7
1.0558.973.7
1.1061.276.3
1.1561.875.9
1.2059.974.5
1.5042.556.4
Table 6. The influence of A and ε values on the volume fractions of grains from group no. 3 with misorientations (ϑ) below 5° with respect to the orientation {112}<1 1 1>.
AVolume Fraction [%]
0 °   υ
ε = 1.5ε = 2.0
1.009.08.5
1.055.44.6
1.104.63.4
1.154.02.8
1.203.62.4
1.503.42.6
Table 7. The influence of A and ε values on the volume fractions of grains from group no. 4 with misorientations (ϑ) below 10° with respect to the orientation {011}<2 1 1>.
AVolume Fraction [%]
0 °   ϑ 10°
ε = 1.5ε = 2.0
1.0027.746.4
1.0526.245.1
1.1024.642.8
1.1522.739.9
1.2020.4 36.0
1.5010.1 15.9
Disclaimer/Publisher’s Note: The statements, opinions and data contained in all publications are solely those of the individual author(s) and contributor(s) and not of MDPI and/or the editor(s). MDPI and/or the editor(s) disclaim responsibility for any injury to people or property resulting from any ideas, methods, instructions or products referred to in the content.