Article

Fabrication and Parameter Optimization of High-Melting-Point Pure Cr by Binder Jetting Additive Manufacturing

1
Zhejiang Provincial Engineering Center of Integrated Manufacturing Technology and Intelligent Equipment, Hangzhou City University, Hangzhou 310015, China
2
Department of Engineering Mechanics, Zhejiang University, Hangzhou 310027, China
3
Key Laboratory of Soft Machines and Smart Devices of Zhejiang Province, Zhejiang University, Hangzhou 310027, China
*
Author to whom correspondence should be addressed.
Crystals 2025, 15(12), 1012; https://doi.org/10.3390/cryst15121012
Submission received: 21 October 2025 / Revised: 10 November 2025 / Accepted: 11 November 2025 / Published: 24 November 2025

Abstract

BJ3DP has unique advantages compared to other energy-beam-based additive manufacturing technologies, such as lower residual stress, arising from the lack of heat during the printing process and the uniformity of the sintering process. However, attaining both high density and dimensional precision in metallic materials remains a challenge in BJ3DP. This study presents a systematic investigation into the fabrication of high-melting-point pure chromium (Cr) via binder jetting 3D printing (BJ3DP), with a focus on optimizing the printing parameters and sintering conditions. An orthogonal experiment identified the optimal printing parameters as a layer thickness of 75 μm and a binder saturation of 60%, which resulted in green parts with a relative density of 57.1%—a representative value for BJ3DP processes that demonstrates effective parameter optimization. Subsequently, the green parts were sintered at 1800 °C for 9 h, resulting in a maximum density of 97.35%. The hardness of the as-sintered BJ3DP Cr parts was superior to that of samples produced by conventional levitation melting (184.20 HV vs. 171.20 HV). This work demonstrates that the no-heat printing strategy of BJ3DP effectively mitigates issues related to residual stress and cracking, providing a viable method for producing high-melting-point metallic materials.

1. Introduction

Additive manufacturing (AM), often known as 3D printing, is a crucial method for creating components by adding materials layer by layer [1,2]. AM has been widely adopted in industries such as aerospace, healthcare, automotive, and energy, due to its ability to produce components in a range of desirable metal alloys with complex geometries that are difficult to achieve using conventional methods [1,3,4,5,6]. AM techniques can be divided into two main categories according to their operational principles: (1) fusion-based methods, which include directed energy deposition (DED), laser powder bed fusion (LPBF), and electron beam melting (EBM); (2) non-fusion-based methods, which encompass extrusion, binder jet 3D printing (BJ3DP), material jetting, and sheet lamination [7,8,9,10,11]. A significant challenge for fusion-based methods is their tendency to produce parts with high surface roughness and residual stress due to intense thermal gradients and rapid solidification, which can detrimentally affect the component’s performance [12].
In recent years, there has been an increased interest in BJ3DP, due to its ability to rapidly produce complex structures without the application of heat during the printing process [1]. The BJ3DP printing process operates at room temperature and under ambient conditions, in contrast to beam-based AM methods, which typically require controlled environments and elevated temperatures for material processing. The absence of a high-energy heat source during printing is the key factor that mitigates issues such as oxidation, elemental segregation, residual stress, and phase changes [1,13,14,15]. Without localized melting, BJ3DP avoids the rapid solidification and steep thermal gradients that cause elemental segregation, residual stress, and non-equilibrium phases in fusion-based methods. Furthermore, processing at room temperature significantly reduces the risk of in situ oxidation. In addition, BJ3DP printed parts could attain various densities by adjusting the porosity in terms of both shape and size. Therefore, the BJ3DP approach offers a distinct advantage for fabricating materials that are sensitive to thermal stress. Key comparative advantages of BJ3DP over fusion-based methods are quantified in Table 1. However, the BJ3DP technique is also subject to certain limitations. Notably, the green parts typically exhibit lower relative density compared to those produced by other additive manufacturing processes [1,16]. To achieve full density and outstanding mechanical properties, the green parts require post-treatment processes, such as hot isostatic pressing, sintering, or infiltration [17,18,19].
High-melting-point chromium (Cr) and its alloys are widely used in high-temperature applications, such as jet engines, due to their high softening resistance and high thermal conductivity [20,21,22]. In previous studies, many high temperature alloys have depended on the formation of Cr containing layers to protect against oxidation and corrosion [23,24,25]. Footner and Holmes described the oxidation of pure Cr and Fe-Cr systems in various environments, revealing that the oxidation rate increases as the temperature rises [25]. Pujilaksono found that Fe-10Cr, Fe-18Cr and Fe-25Cr form a thin protective (Fe, Cr)2O3 oxide, similar to the chromic oxide film formed by pure chromium in dry O2 [26]. Samuel investigated the high-temperature oxidation of Cr, revealing that the primary temperature-related factors affecting this process are the size of the oxide grains and the rates of thermally activated boundary diffusion [5]. However, these studies primarily focused on Cr produced through traditional methods such as casting, hot pressing (HP), and hot isostatic pressing (HIP). The oxidation behavior of pure Cr materials may differ depending on the manufacturing methods. In recent years, AM techniques have been developed to fabricate complex-structured components quickly and at a low cost [22,27]. Furthermore, to our knowledge, there have been no documented studies on the additive manufacturing of pure chromium, particularly using binder jet 3D printing. This study utilized BJ3DP, a technique regarded as highly promising in additive manufacturing, for the production of high-melting-point pure Cr materials.
The printing parameters, such as layer thickness and binder saturation, significantly influence the green density and dimensional accuracy of BJ3DP parts, as demonstrated in previous studies on metallic systems [1,2]. Similarly, sintering temperature and holding time are critical for achieving high final density and mechanical properties by promoting diffusion-driven densification and pore closure [28]. Based on the previous discussion, to effectively produce the high-melting-point Cr metal materials, the novel method of BJ3DP is introduced. This study presents the BJ3DP method for fabricating high-melting-point Cr metal materials, focusing on the investigation of experimental conditions such as printing parameters, sintering conditions. To optimize the key printing parameters, an orthogonal experiment has been designed. Using the optimized printing parameters, high-quality green parts were successfully produced. To achieve the highest density, the densification process of the Cr green parts was investigated, focusing on the sintering temperature and holding time. Subsequently, the effect of microstructure on the mechanical properties of the Cr samples sintered under various conditions was investigated. For comparison, Cr samples were also prepared using the conventional sublimation melting (LM) method under vacuum conditions [29].

2. Experiments and Characterization

2.1. Materials

The initial materials utilized in this study were spherical powders of Cr with a purity level of 99.95%. The powders were obtained from Foshan Chengfeng Material Technology Co., Ltd., located in Foshan, China, through the process of gas atomization. The microstructure and particle size distribution are presented in Figure 1a,b. Most of the powders are spherical in shape, and D10, D50, and D90 are 27.6, 40.5 and 57.9 μm, respectively. A few large particles (≥70 μm) can be observed among the powders, as indicated in Figure 1b. The chemical composition of the Cr powders is detailed in Table 2. In addition, the hall flowability of Cr powders, measured according to GB/T 1482-2022, was found to be 16 s/50 g under standard conditions, which is consistent with the cohesive nature of many fine, spherical metal powders. The apparent density, measured according to GB/T 1479.3-2017, was 4.25 g·cm−3.

2.2. Printing of Cr

The binder jetting printer from Shop System (SHP-PP0009, Desktop Metal, Burlington, MA, USA) was utilized to print the Cr samples. The schematic diagram of the printer is shown in Figure 2, which highlights the key components of the system. The printer primarily consists of two main platforms: the feed powders platform and the build parts platform. During the printing process, the printhead traverses the powder bed, depositing liquid binder onto the powder in specific patterns according to the design file. Once a layer is completed, the build platform is lowered by the set layer thickness to facilitate the application of the next layer of powder. This layering and binder jetting process is repeated, gradually building up multiple layers until the entire object is printed. It should be mentioned that the binder used in this study is an aqueous solution of Ethylene Glycol.
Cubic Cr parts with dimensions of 20 mm × 20 mm × 20 mm were printed to evaluate the green density and dimensional accuracy. Table 3 presents the designed experiments aimed at investigating the impact of printing parameters on the Cr parts. As shown in Table 3, the orthogonal experiments examined binder saturations of 60%, 50%, and 40%, as well as layer thicknesses of 100 μm, 75 μm, and 50 μm. The selection of these three-layer thickness values was based on the available options (50, 75, and 100 μm) of the binder jetting printer used in this study. It should be noted that the same roller traverse speed of 70 mm/s was used for printing all the cubic parts in this study. To ensure data accuracy, each set of process parameters was replicated five times. The Cr samples were dried in an oven at 165 °C for 4 h to enhance their strength after printing was finished. After drying, the Cr parts with enhanced strength were de-powdered using compressed air to remove the excess powder from the building plate.

2.3. Debinding and Sintering

After the curing stage, the Cr parts were subjected to debinding to eliminate the organic binder. The debinding process was conducted at 650 °C for 1 h in an argon (Ar) atmosphere. In order to obtain dense chromium parts, the sintering process was performed in a vacuum furnace (BJ-200MoH, Ningbo Hengpu, Ningbo, China) designed for additive manufacturing debinding and sintering, using the following conditions: (1) 1000 °C for 2 h, (2) 1350 °C for 2 h, and (3) 1800 °C for 9 h, followed by cooling in the furnace.

2.4. Microstructure Characterization and Mechanical Properties

A vernier caliper was utilized to assess the dimensional accuracy of the Cr parts, while a precision balance with an accuracy of 0.1 mg was employed to measure their weight. The density of the Cr green samples was assessed by measuring their weight and dimensions. According to Archimedes’ principle, the density of the sintered Cr parts was measured using pure water, and the relative density was subsequently calculated. A digital caliper was used to measure the shrinkage of the final parts. Microstructures of the final samples were analyzed by a GeminiSEM 360 scanning electron microscope (SEM, Zeiss, Oberkochen, Germany). The surface roughness and topography of the sintered Cr parts was evaluated using a Laser confocal microscope (Olympus OLS5100, Olympus, Japan).
According to the ASTM E384-2017 standard, Vickers microhardness was measured on polished sintered samples using a Microhardness Tester (Duramin-40 Ac1, Struers, Denmark), with a load of 50 g applied for 10 s. For each sample, testing was conducted at ten different sites, and the final hardness value is obtained by averaging the values after discarding the highest and lowest measurements.

3. Results and Discussion

3.1. Effect of Printing Parameters on the Density of Green Parts

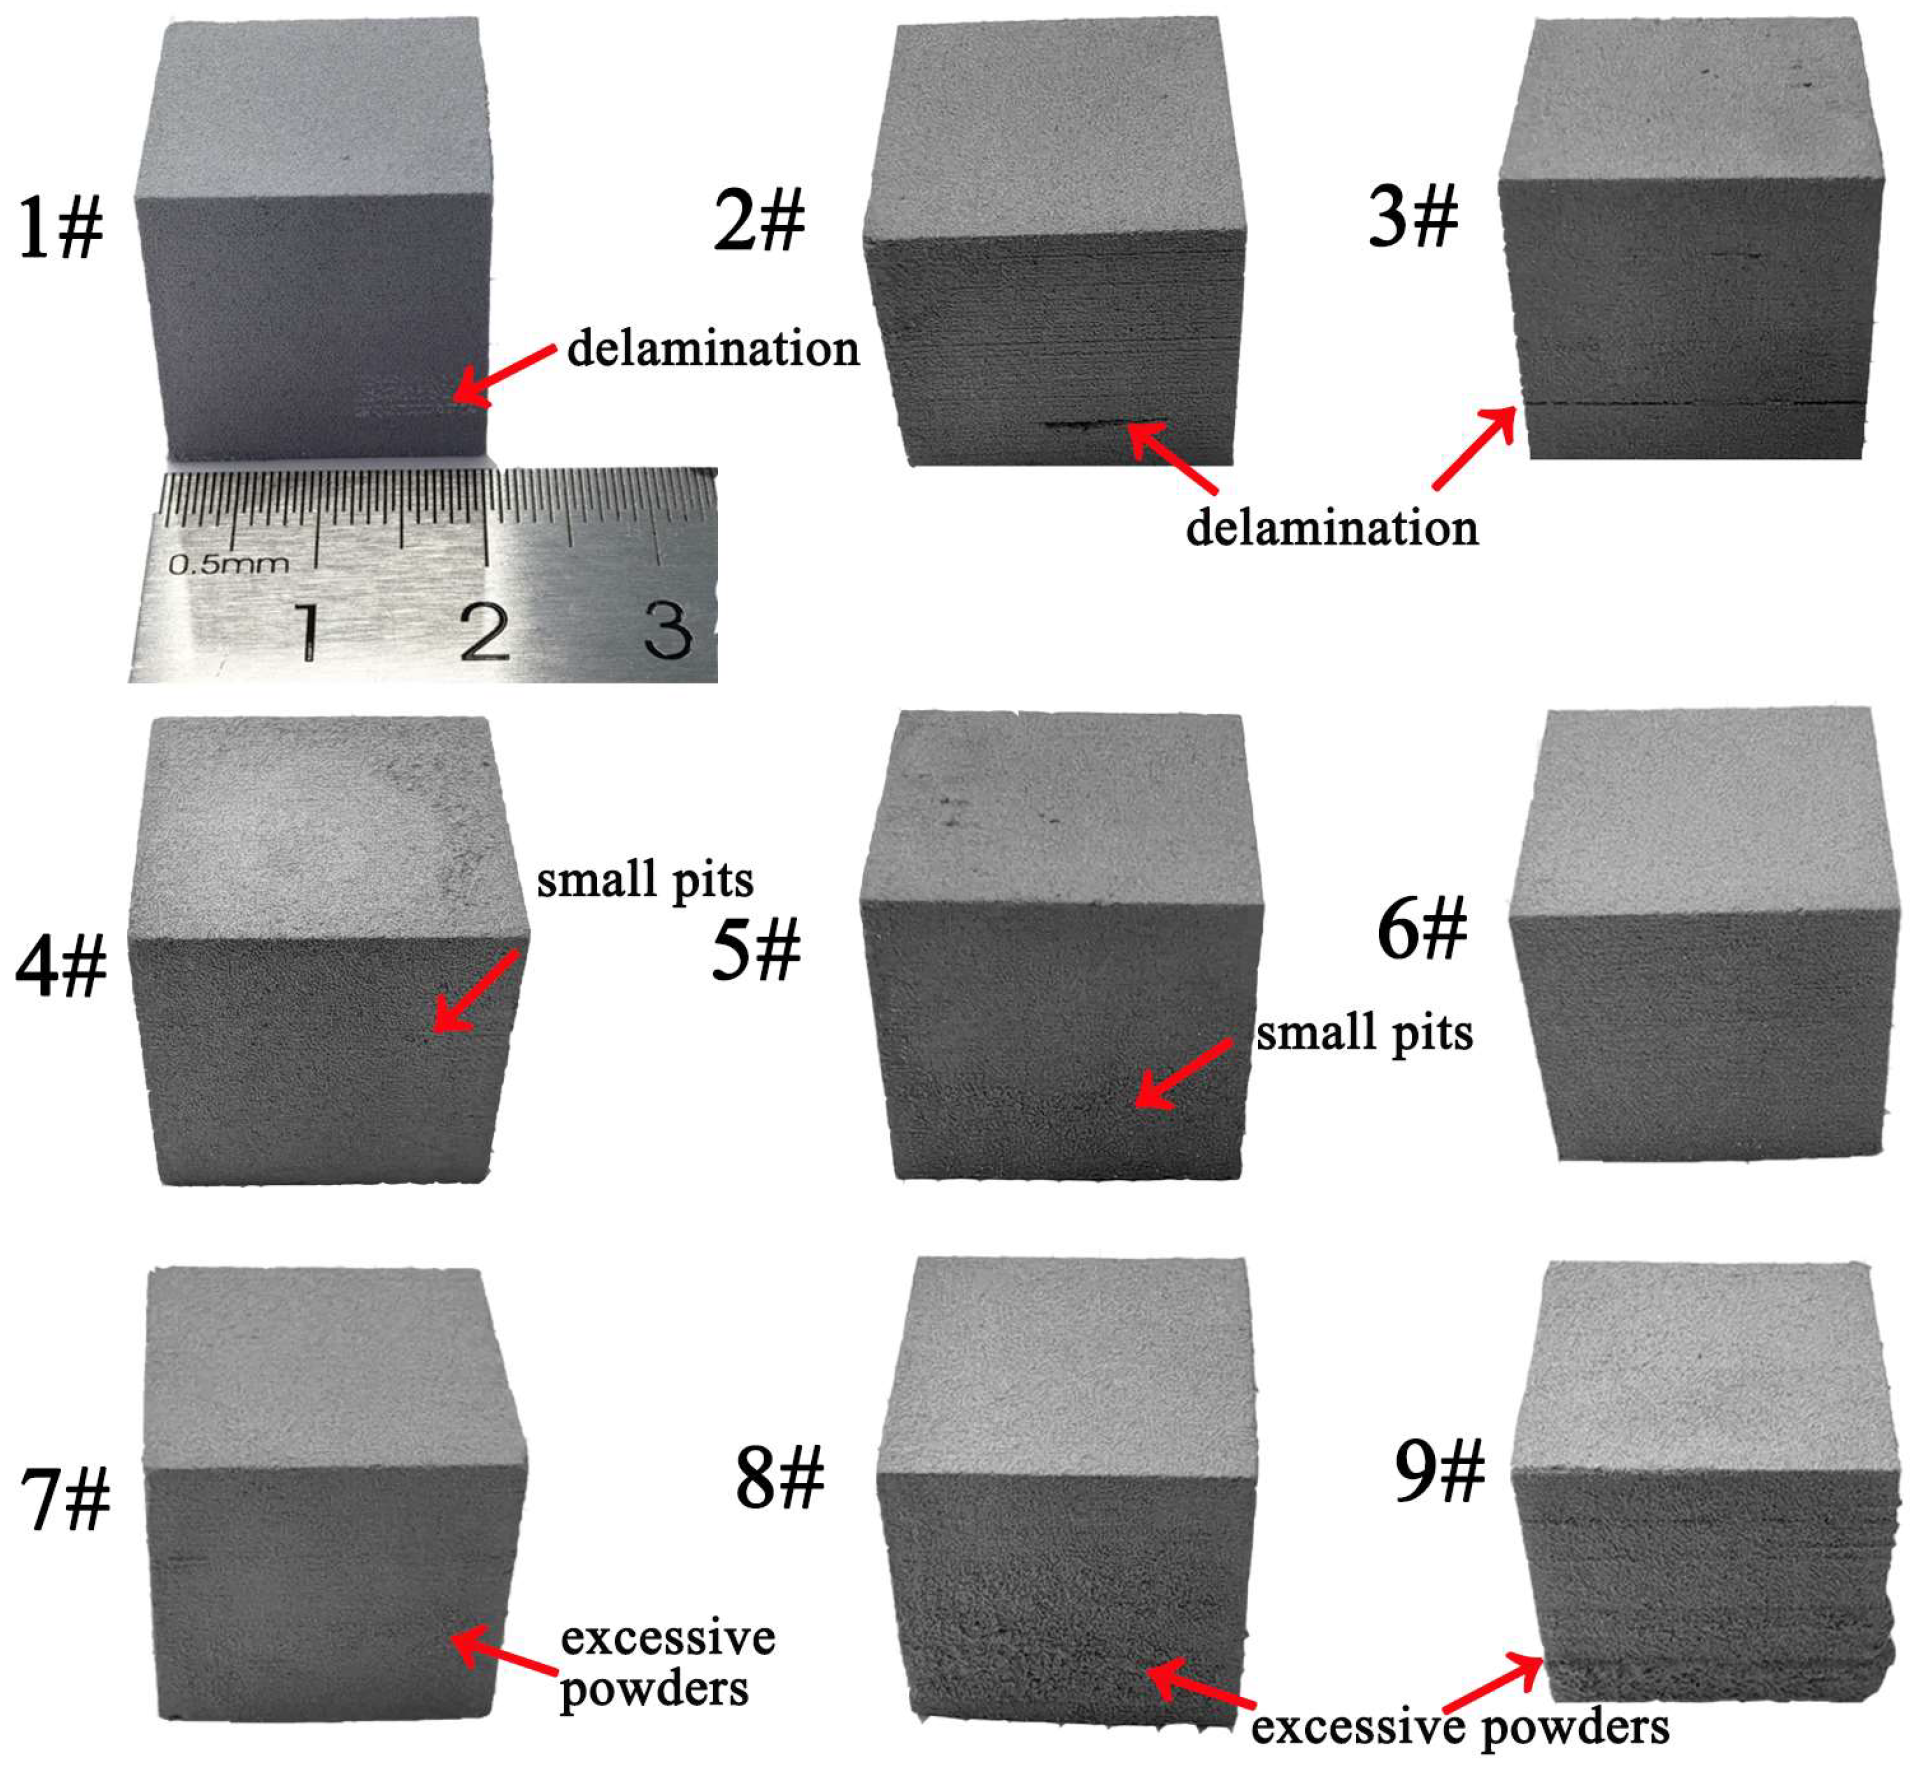
As illustrated in Figure 3, the Cr parts printed using BJ3DP correspond to the designed printing parameters detailed in Table 3. Samples 2, 4, and 5 exhibit a few visible pits on their surfaces. Additionally, delamination is observed on the surfaces of samples 1, 2, and 3. The delamination issue mainly arises from the use of insufficient binder saturation or thicker layers. A binder saturation of 40–60% is inadequate for firmly bonding the powder particles together or for completely filling the spaces between them. In other words, thicker layers can reduce resolution because of increased curvature, potentially leading to delamination during the layer-by-layer manufacturing process [30]. Both factors can weaken the adhesion between layers, resulting in separation and failure of materials or coatings. This observation is consistent with stainless materials manufactured with BJ techniques, suggesting that the surface defects are mainly caused by insufficient binder saturation [1,2]. Furthermore, the surfaces of samples 7, 8, and 9 exhibit greater roughness compared to the other samples, and pits are also evident. This result illustrates that high binder saturation can lead to an excessive accumulation of powders on the surface, resulting in increased surface roughness. Therefore, for Cr powders used in this study, the binder saturation should be kept below 40% when the layer thickness is 50 μm. Additionally, sample 6 demonstrates superior surface quality compared to the other eight samples.
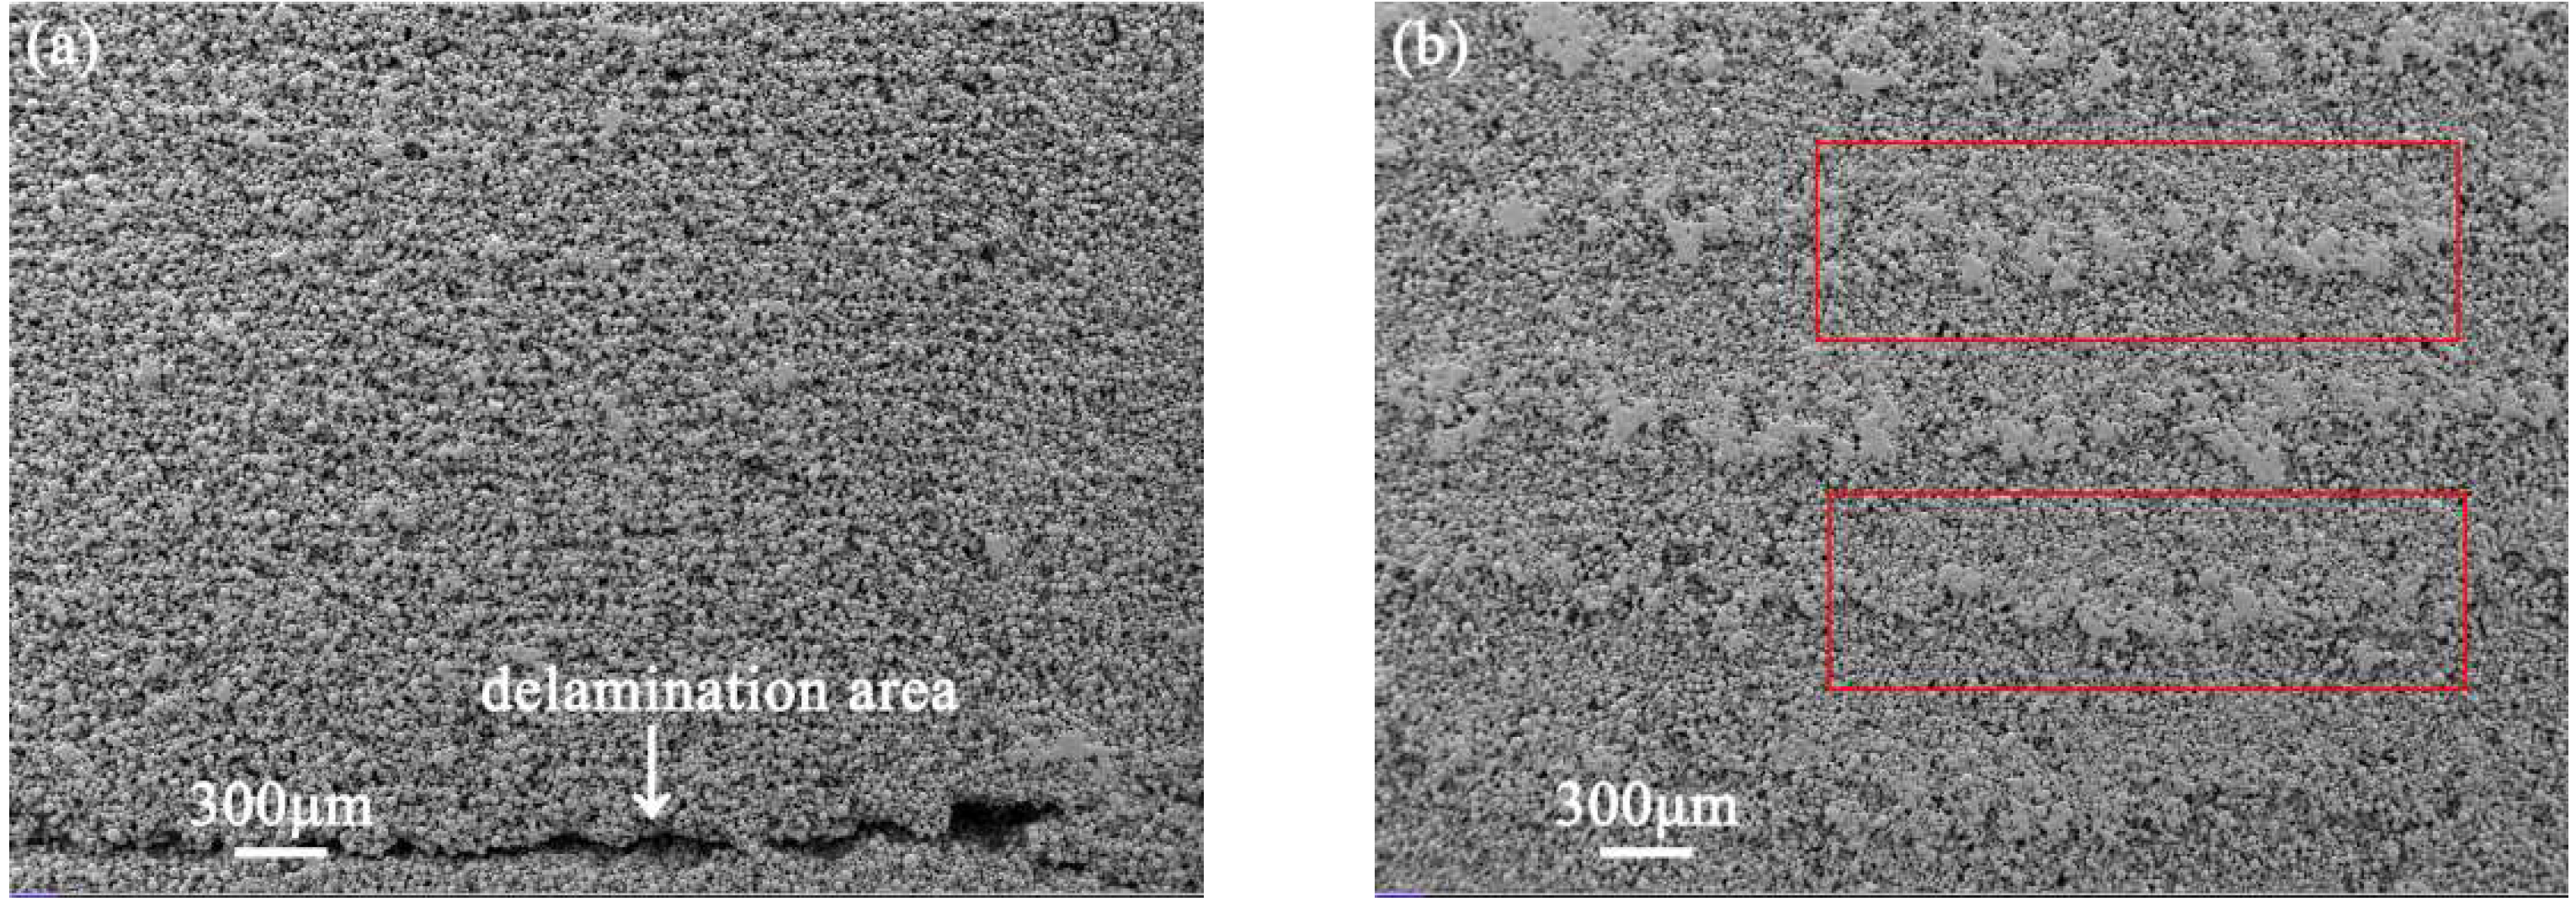
To determine the optimal parameters for printing Cr parts using the BJ3DP technique, the microstructure of the cubic parts in Figure 3 was analyzed using SEM equipment, as illustrated in Figure 4. As shown in Figure 4a, the delamination area is clearly visible on the side surface of sample 3. Figure 4b displays the surface of sample 9, where it can be observed that excess powders have adhered to the green part due to high binder saturation, leading to increased surface roughness. Figure 4c,d show the surface of sample 6 at different magnifications. Compared to the other green parts, the surface of sample 6 appears more uniform, as illustrated in Figure 4c. However, despite the overall smooth appearance, a few pits can be observed on the surface of sample 6, as indicated by the red arrows in Figure 4d. These pits may be eliminated by modifying the powder characteristics and increasing the green density. Additionally, the bonding necks between the Cr powders, highlighted by a blue circle in Figure 4d, indicate that the Cr powders were bonded with a small amount of binder to form the green parts.
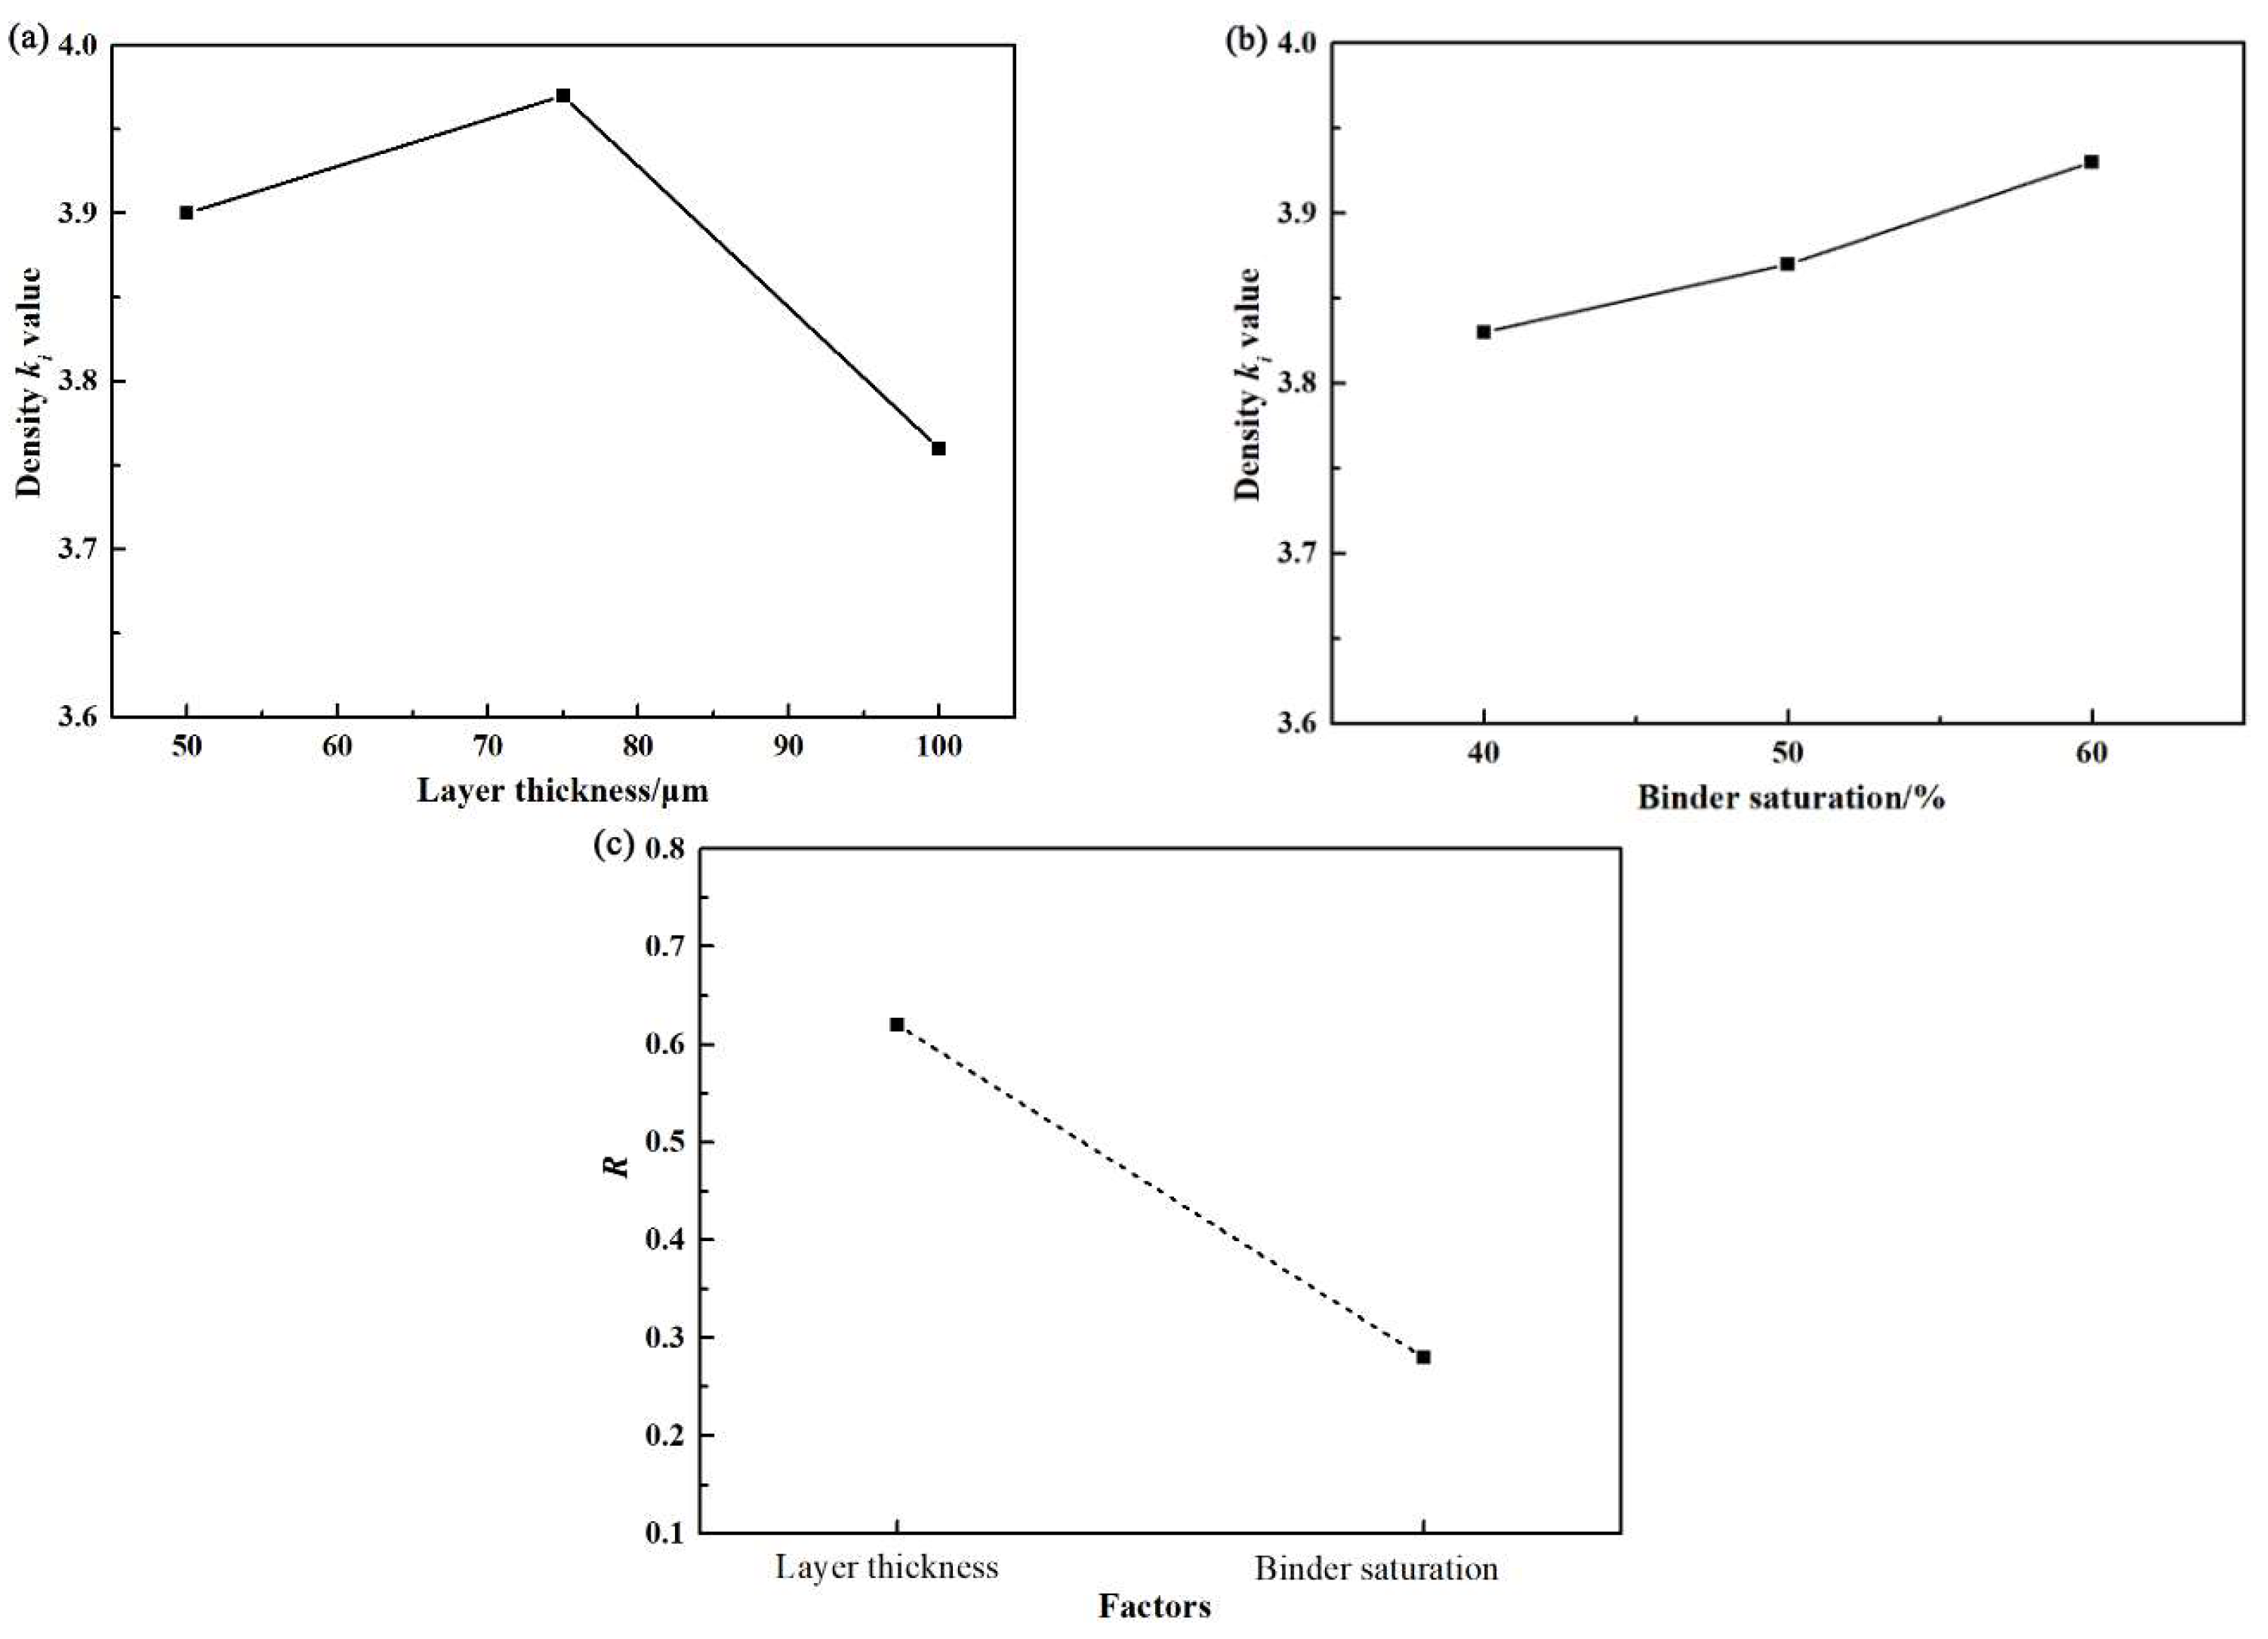
The changes in dimensions and the relative density of the Cr green parts are shown in Table 4. Obviously, a layer thickness of 75 μm and a binder saturation of 60% resulted in the highest relative density (55.9%) for the green parts. Consequently, these printing parameters were selected to fabricate green parts for the subsequent optimization of sintering parameters. This is crucial because the sintering behavior of the BJ3DP green parts can be significantly influenced by their relative density. During the printing process, the counter-rotating roller compresses the Cr powders, thereby increasing the density of the green parts. As the layer thickness increases, the compaction effect gradually diminishes, which may lead to delamination, consistent with the results shown in Figure 1. Additionally, Table 4 indicates that the dimensions vary depending on the printing direction. The dimensional deviations of all samples follow a pattern of X > Y > Z. Specifically, the dimensions along the X and Y axes have increased compared to the building specifications, while the dimension along the Z axis is smaller than the design dimension. This behavior can be attributed to the specific size of the binder droplets when they reach the powder bed. Upon interacting with the powders, these droplets spread horizontally along the X and Y axes of the green part, while simultaneously penetrating vertically along the Z axis, effectively permeating from the top of the printed layer down to the bottom. According to Wijshoff’s study [30], the expansion range of binder droplets in the horizontal direction (along the X and Y axes) exceeds their penetration depth in the vertical direction (Z axis), indicating a significant difference in how these droplets interact with the powder bed. This observation helps explain why the dimensions of the green part are consistently larger than the design specifications in the X and Y directions. In contrast, the dimensions in the Z direction are often smaller than the model size. This discrepancy may be attributed to the compaction effect of the powder roller and the inherent weight of the powder, which influences the vertical dimension more significantly [1,2,31]. The size deviation in the printing direction (X-axis) and the building direction (Z-axis) shows an average error of less than 0.17 mm. In contrast, the deviation in the roller moving direction (Y-axis) exhibits a significantly larger average error, exceeding 0.20 mm, as presented in Table 3. Regarding the density of Cr green parts, it initially increases with layer thickness; however, after a certain value is reached, it starts to decline as layer thickness continues to increase.
In this study, the optimal printing parameters were determined using the designed experiments designed in Table 3. The range (R) analyses utilized equations presented in the recent literature [2]. The R values indicate the influence of dimensional variation. In addition, the variable kn was introduced to study the influence of different printing parameters on performance indicators, and it can be expressed by the following Equation (1) [2]:
kn = Kn/N
Here, Kn represents the sum of all experimental results corresponding to a factor (such as layer thickness or binder saturation), while N denotes the frequency with which this level occurs throughout the experiments. Based on the Kn results, the R values can be defined as Equation (2) [2]:
R = max {K1, K2, K3} − min {K1, K2, K3}
The Ki (i = 1,2,3) and R values associated with the density of the Cr green parts are shown in Table 5 and illustrated in Figure 5. It should be noted that layer thickness and binder saturation are critical parameters that significantly influence the green parts’ density.
As indicated by the results in Table 5 and Figure 5, it is evident that layer thickness plays a crucial role in dimensional variation. An issue arises when the drying time, which is the duration necessary for the binder to thoroughly penetrate the powder layer, is not sufficient during the printing process. This insufficiency can prevent the binder from fully infiltrating the powder, leading to discrepancies in dimensional accuracy. The binder jetting machine used in this research has a drying time of about 20 s. Consequently, during the following compaction process with the counter-rotating roller, the Cr powders may exceed the desired layer profile because of the residual undried binder present in the compacted powders. According to the relative density data presented in Table 4 and Table 5, the relative density of the Cr green parts initially rises with increasing layer thickness. However, beyond a certain level, the density begins to decrease as the layer thickness continues to rise. This trend suggests that there is a specific layer thickness that optimizes relative density; however, increasing the thickness beyond this point may cause compaction issues or other challenges in processing.
To obtain green parts with the necessary mechanical strength and surface quality, optimizing the saturation level is critical. Figure 6 illustrates the surface defects caused by inappropriate binder saturation levels. Specifically, Figure 6a shows that low saturation can cause particle loss, whereas Figure 6b illustrates that high saturation leads to excessive particle adhesion to surfaces, ultimately compromising dimensional accuracy. It can be observed that insufficient binder saturation may result in layer delamination and a higher number of cavities that develop during sintering. In contrast, excessive binder saturation can cause more powder particles to stick to the surfaces of the 3D printed part, leading to greater surface roughness and dimensional discrepancies. These observations are consistent with the work of other researchers [1,2,31,32]. According to Mostafaei [1], another issue associated with over-saturation is the wetting of the powder bed, which can lead to particle adhesion to the roller and subsequently create inhomogeneous powder beds characterized by cracks, roughness, and shifts. When a higher saturation level is needed, extending the drying time may serve to mitigate this effect. Angular particles can demonstrate low flowability, which may lead to agglomeration in the powder bed and result in void defects during the powder spreading phase. While it is feasible to increase saturation levels beyond 100% by incorporating additional binder, this can also prolong printing times and detrimentally affect post-printing processes. Therefore, adjusting the saturation level is vital for optimizing build cycle times and reducing binder jetting expenses.
Consequently, after considering all factors and the experimental results, the printing parameters of sample 6 were selected for the BJ3DP manufacturing of Cr samples to optimize the sintering process. The printing parameters for sample 6, which include a layer thickness of 75 μm and a binder saturation of 60%, are anticipated to produce Cr green parts with the highest relative density and excellent surface quality. This will facilitate the attainment of high-density and high-quality Cr parts after sintering.

3.2. Effect of Sintering Parameters on Density and Microstructure

3.2.1. Sintering Temperature

Sintering is a crucial step in BJ3DP technology, as high-temperature diffusion enhances the density of the green part [1]. In this study, the maximum sintering temperature of 1800 °C is lower than the liquidus temperature of Cr powders. Table 6 presents the shrinkage, density, and grain size of the sintered Cr samples subjected to various sintering parameters. It can be found that the shrinkage in the building direction (Z-axis) is significantly greater than in both the printing direction (X-axis) and the roller spreading direction (Y-axis). Furthermore, the shrinkage in the roller spreading direction is slightly greater than that in the printing direction. This difference can be attributed to the directional force exerted by the roller during the spreading process, which affects the powder layer. This trend is consistent with the shrinkage rates recorded in other materials manufactured using BJ3DP technology [1]. It can be attributed to variations in particle consolidation across different layers, as well as the influence of gravity along the building direction (Z-axis) during the sintering process [1,2,3]. The variation in the volume of the sintered Cr samples at different temperatures indicates that as the sintering temperature increases, the amount of shrinkage also increases. Regarding the relative density after sintering, it is evident that as the sintering temperature increases, the relative density of the samples also increases. For instance, under sintering conditions of 1800 °C for 9 h, the densification of the Cr sample can reach 97.35%.
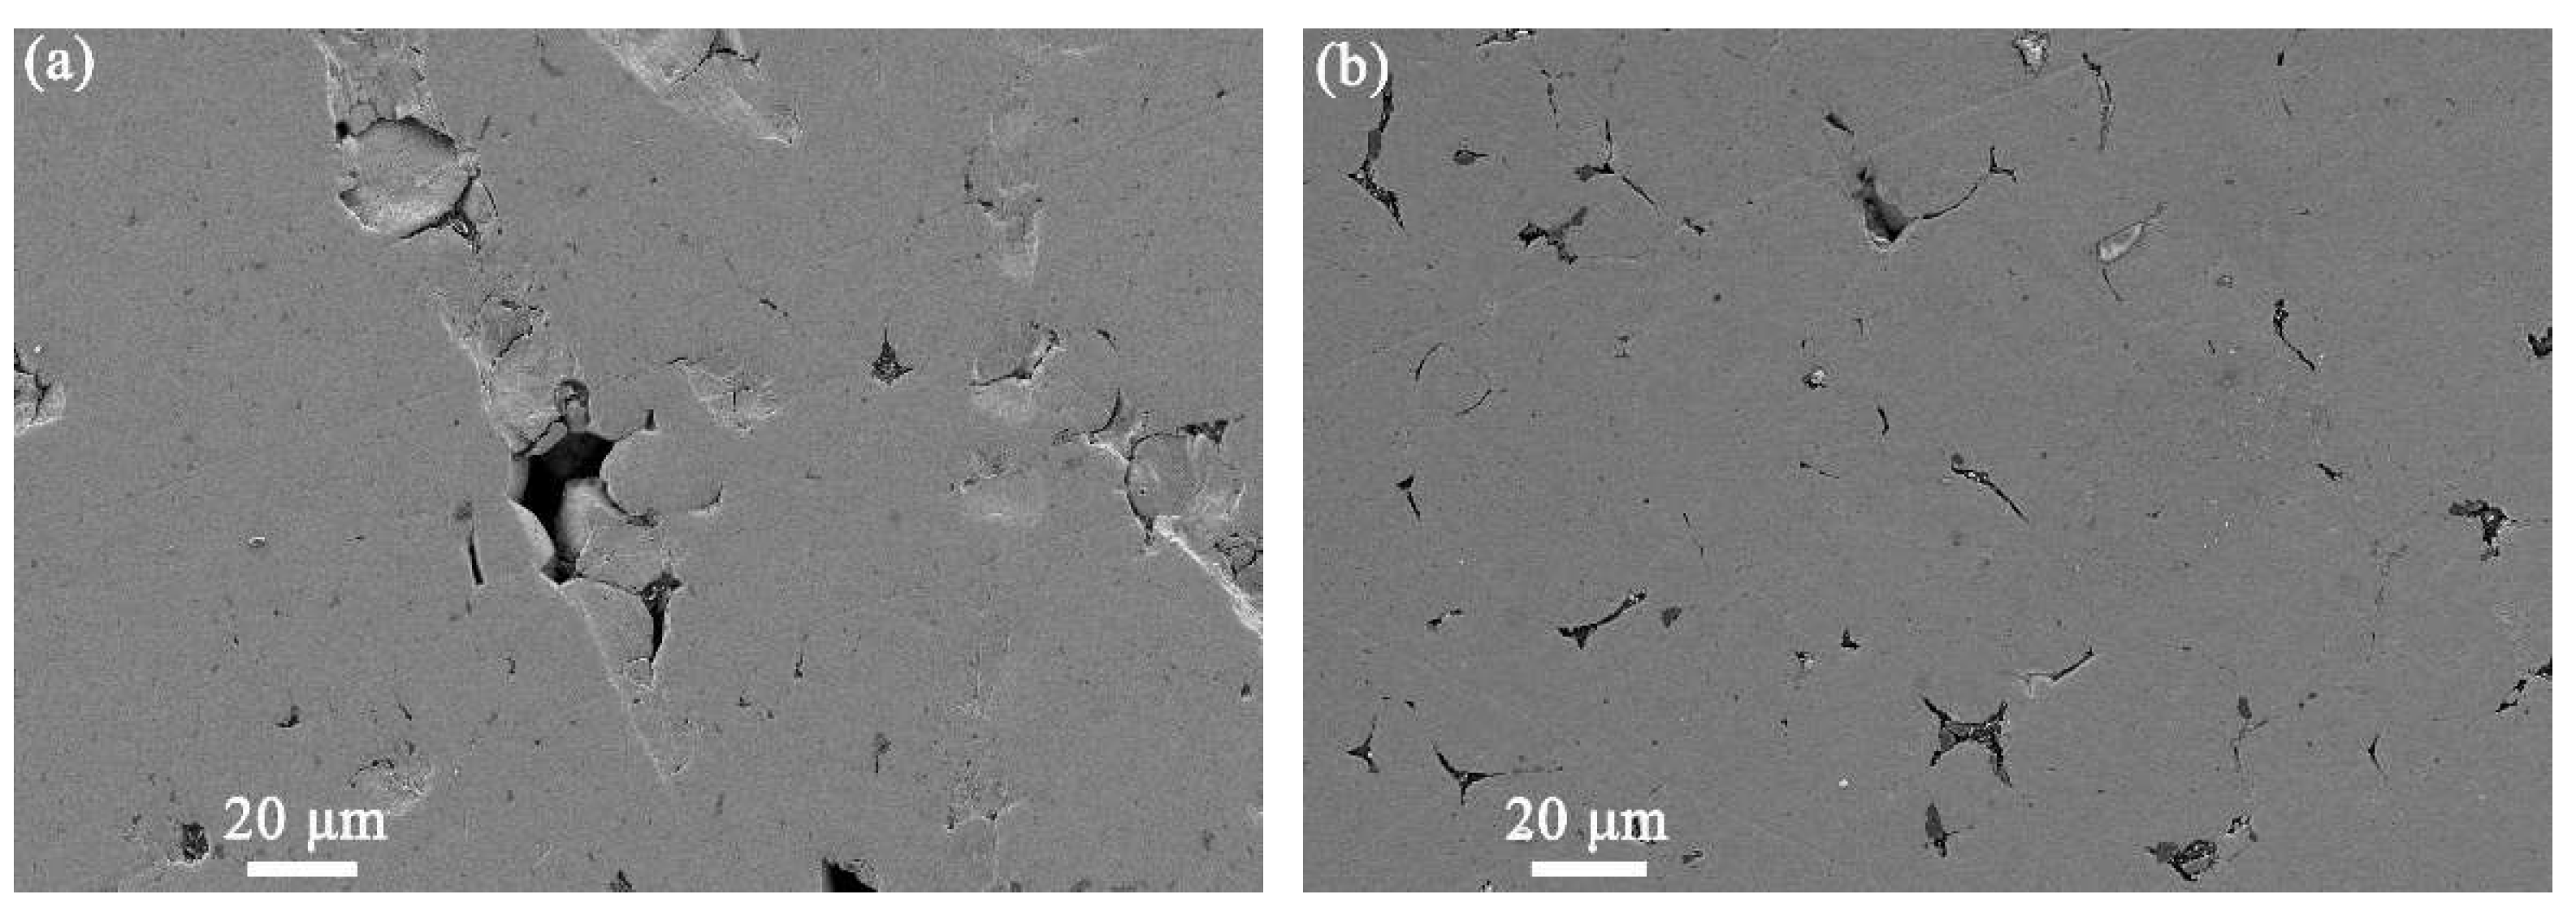
Figure 7 presents SEM images of Cr samples sintered at various temperatures (1500, 1650, and 1700 °C) for a duration of 3 h. To observe the internal microstructure, the Cr samples were cut. As shown in Figure 7, numerous pores and the outlines of the Cr powders are visible, indicating that the sintering temperature or duration may have been insufficient.
It is widely acknowledged that an appropriate sintering temperature and sufficient duration are crucial for achieving optimal mechanical properties. According to the mechanism of sintering, the primary driving force of the process is the reduction in surface energy in the BJ3DP printed sample. This reduction occurs through the rearrangement and diffusion of particles, promoting material densification and enhancing its mechanical properties [1,2]. Additionally, a significant mechanical force generated by surface tension acts perpendicularly on the curved surfaces of the sintering necks, further contributing to the sintering process. These results lead to the formation of larger sintering necks, facilitating the closure of pores. During the later stages of the sintering process, the gas trapped within the closed pores hinders further shrinkage of the pores and the growth of the sintering necks [2]. Thus, it is critical to control gas emissions and porosity variations throughout the sintering process to guarantee that the material attains its ideal properties. During sintering, the driving force primarily stems from the difference between the gas pressure within the pores and the surface tension, which can be represented by Equation (3) [1,2]:
Pt = Pgr/ρ
In the case of closed pores, the driving force can be represented by Equation (4) [1,2]:
Pt = Pg − 2γ/r
Here, Pt represents the tensile stress, Pg denotes the gas pressure within the pore, r is the pore radius, and −2γ/r indicates the tensile stress exerted on the pore surface, which acts to reduce the pore size. According to Equation (4), pores will continue to shrink only when the gas pressure exceeds the tensile stress. During the pore shrinkage process, if the internal gas cannot diffuse out quickly enough and the gas pressure surpasses the surface tensile stress, the closed pores will stop shrinking. Consequently, in the later stages of sintering, some isolated closed pores will inevitably remain within the grains of the sintered part, making complete elimination challenging, even at elevated temperatures.

3.2.2. Sintering Time

Sintering time is another crucial factor that significantly influences the properties of sintered Cr samples, as it affects the degree of densification, grain growth, and overall microstructure of the material. The microstructures of Cr samples sintered at 1800 °C for durations of 6 h and 9 h are illustrated in Figure 8. It is evident that the Cr samples sintered at 1800 °C for 9 h exhibited the highest density. As the holding time increases, both the shrinkage and grain sizes of the samples become more evident, while the relative density increases from 96.79% to 97.35%. According to the sintering mechanism, as the sintering time increases, the diffusion and capillary bonding between the contacting powder particles promote the transformation of irregular pores along the grain boundaries into spherical pores, which may facilitate pore closure [1,2]. However, even with the extended sintering duration of 9 h, a few isolated pores can still be observed in the Cr samples. This result suggests that increasing the holding time alone is insufficient to eliminate these isolated pores. The gas pressure within these pores likely exceeds the tensile stress from shrinkage, which hinders diffusion and prevents further pore reduction. Furthermore, it is important to note that grain coarsening naturally occurs as the holding time increases.
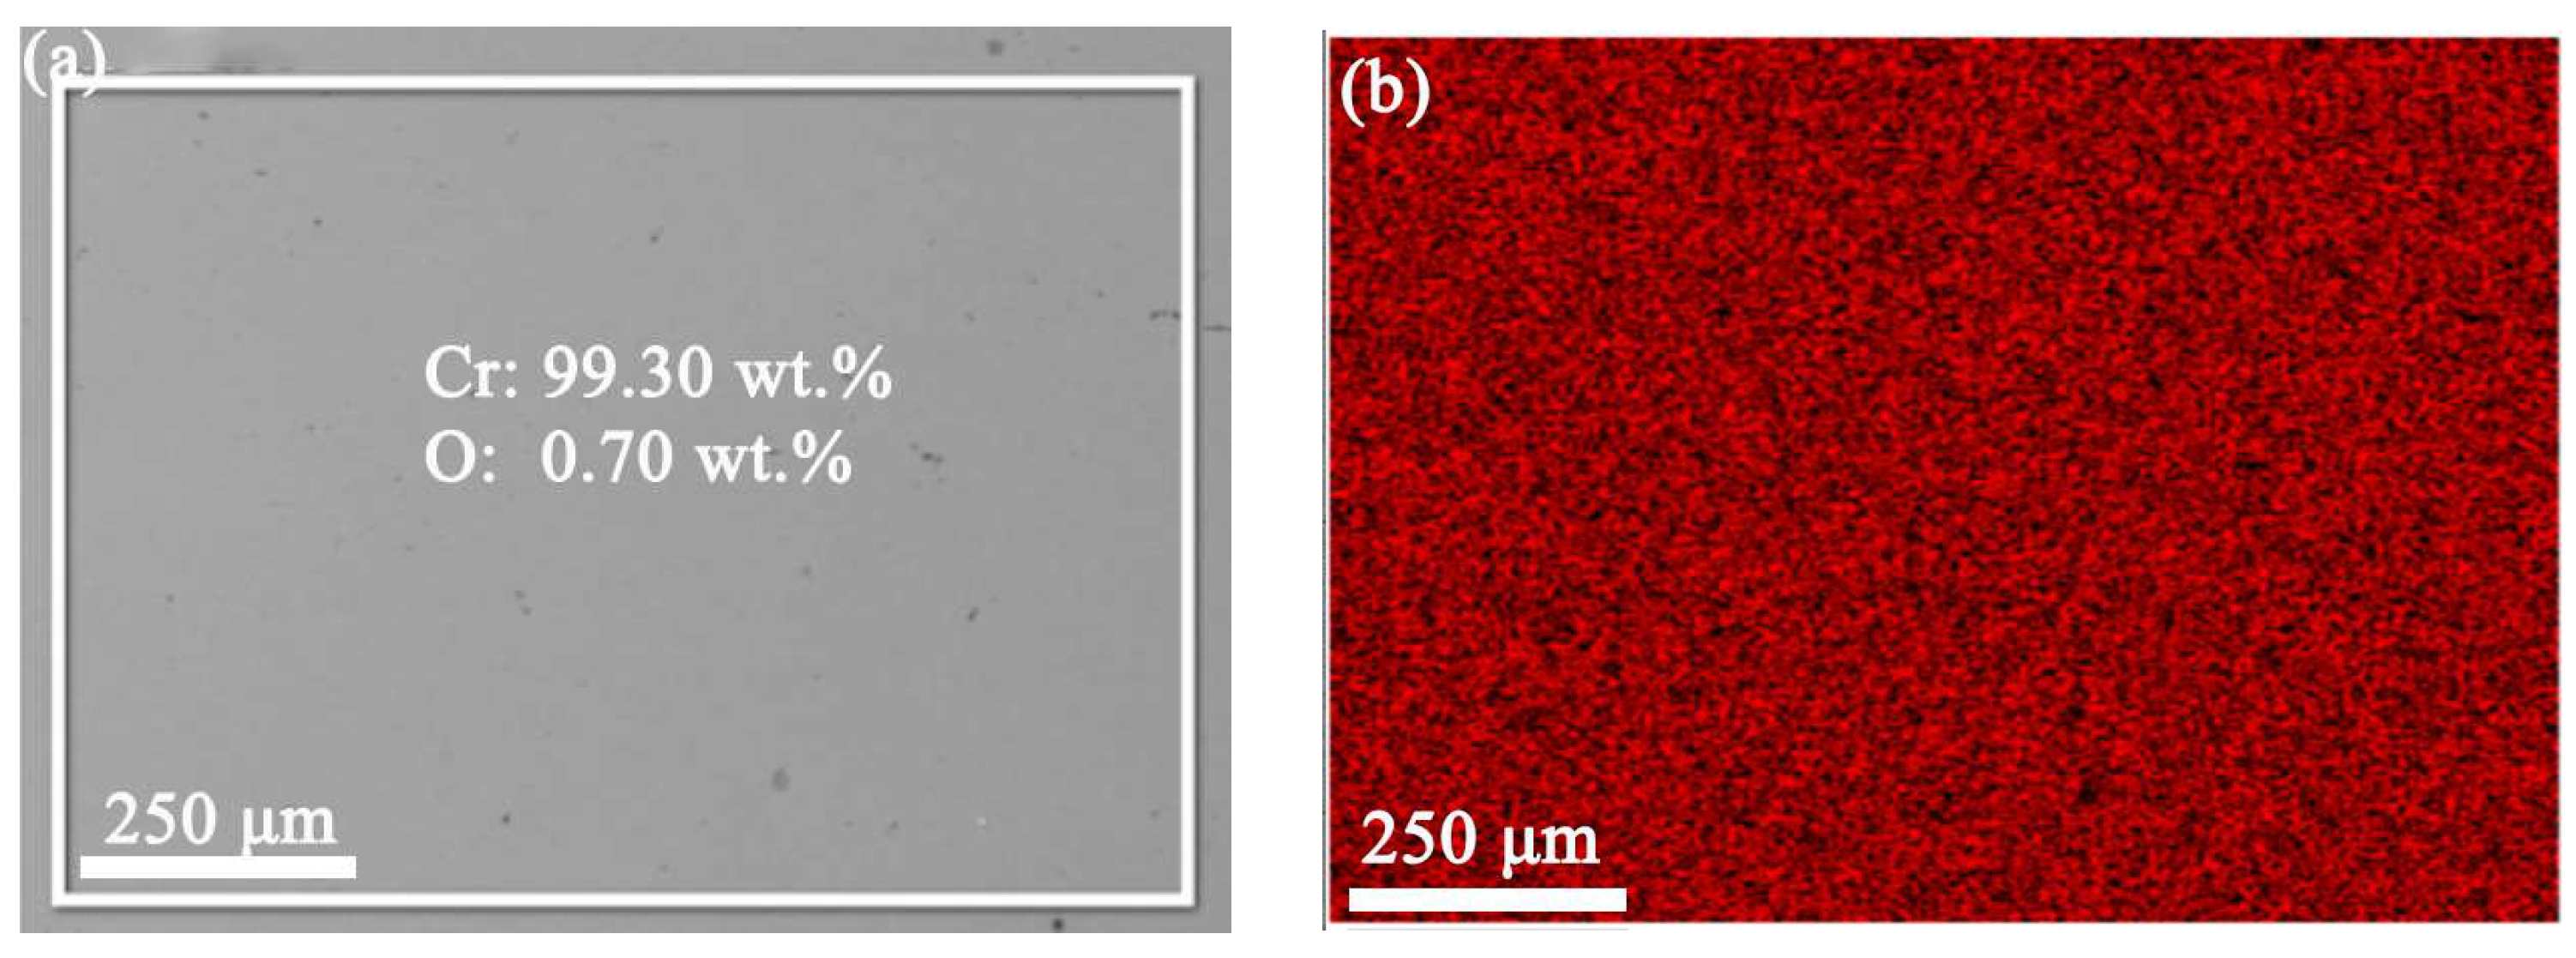
It is important to evaluate the chemical composition of the sintered components, as it is very prone to oxidation for Cr parts. The EDS results of Cr samples sintered at 1800 °C for 9 h are shown in Figure 9. According to EDS analysis, the oxygen content in the Cr material after sintering is only 0.7 wt.%, while the Cr content reaches as high as 99.3 wt.%, indicating that no significant oxidation occurred during the sintering process. The extremely low oxygen content suggests that the sintering atmosphere was well-controlled, effectively suppressing the oxidation of chromium and maintaining the purity of the metallic chromium, which meets the anti-oxidation requirements of the high-temperature sintering process. These results confirm that the Cr material prepared by binder jet 3D printing exhibits good chemical stability and oxidation resistance.

3.3. Surface Roughness and Mechanical Properties

3.3.1. Surface Roughness

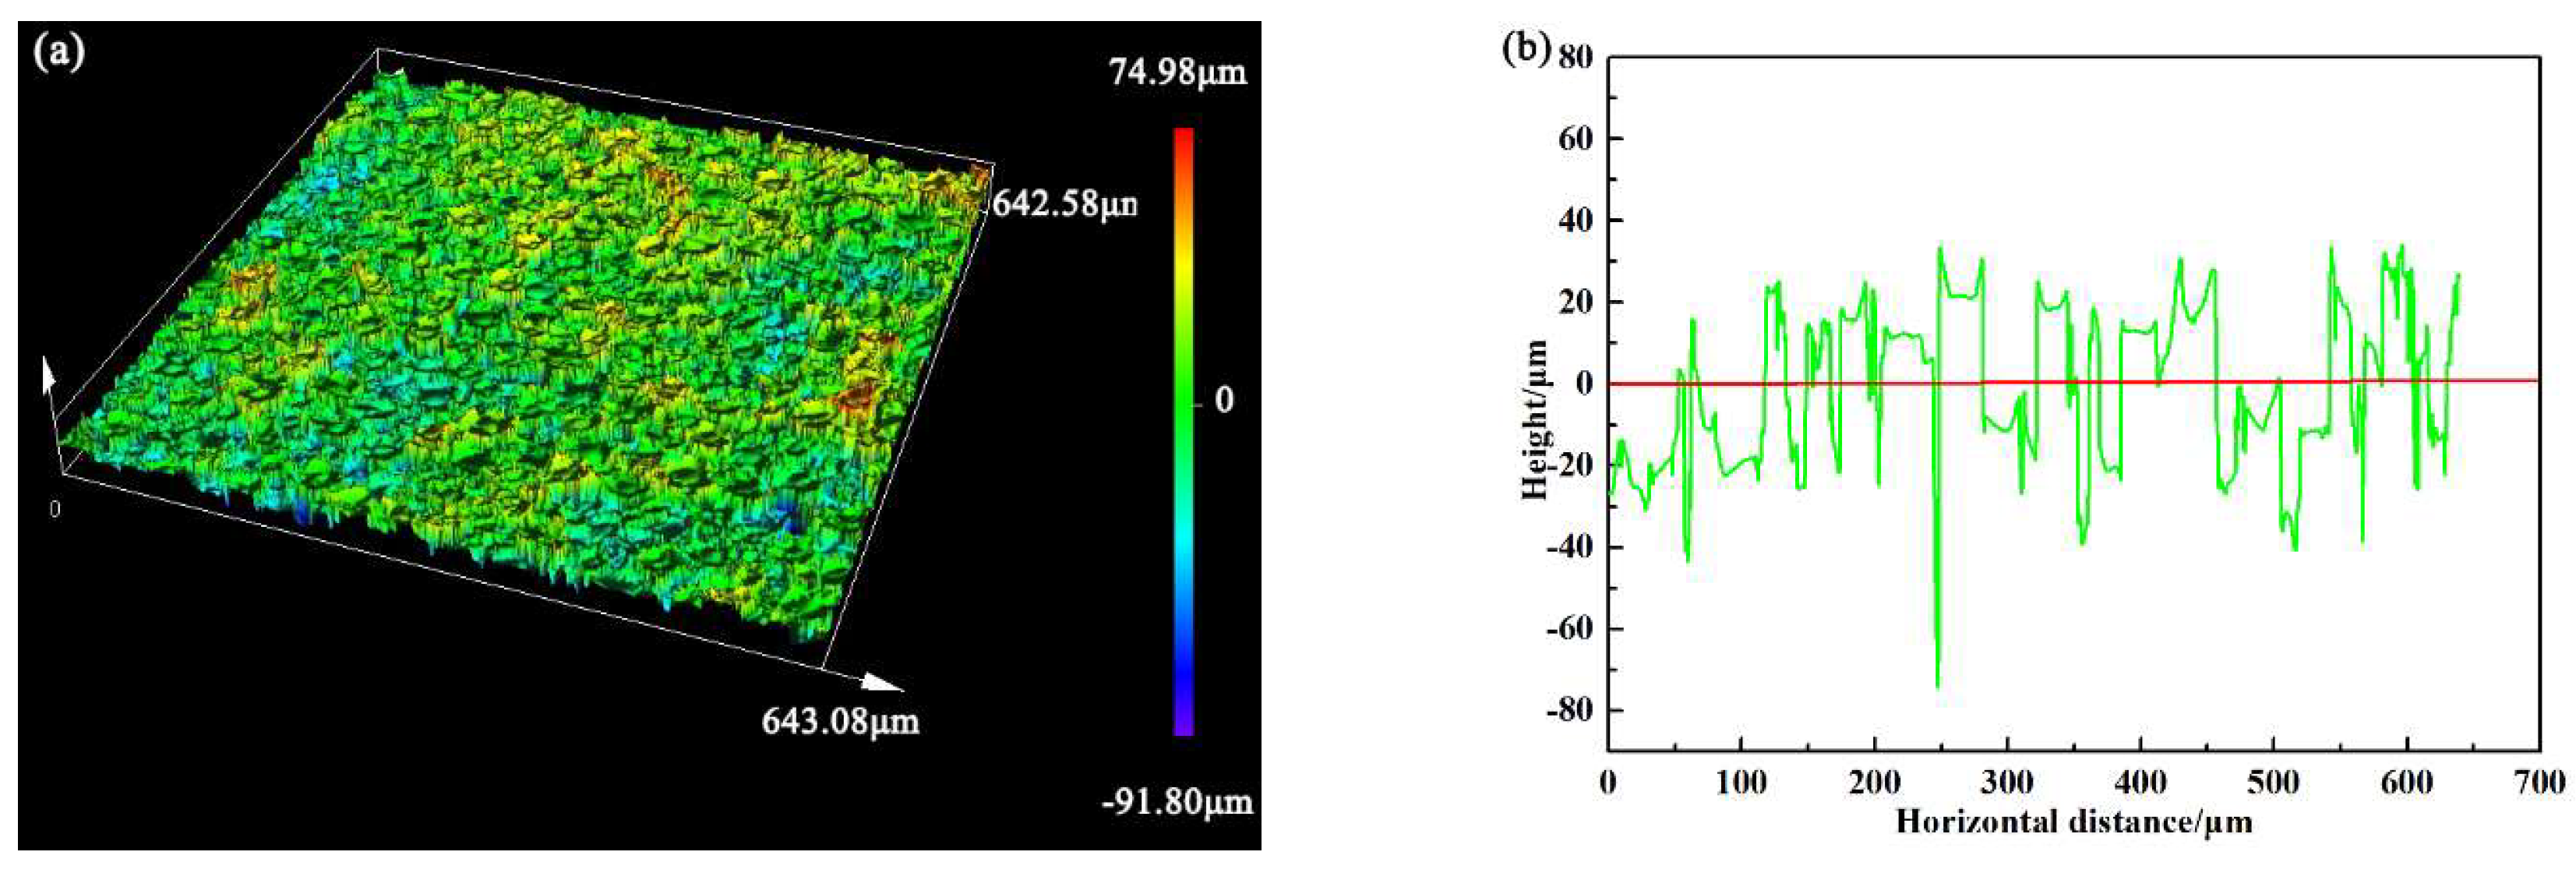
The surface roughness and topographical features of the sintered Cr samples, prepared with optimal printing and sintering parameters, were analyzed using laser confocal microscopy, and the results are illustrated in Figure 10. The parameters Rq and Ra were employed to quantify surface roughness. Rq refers to the root mean square roughness, while Ra denotes the average roughness. The values of Rq can be expressed by Equation (5) [33]:
R q =   1 L 0 L h ( x ) 2 d x
where h is the height measured at position x when the scan length is L. The measured values of Rq was 18.37 ± 0.29 μm, while Ra was 14.96 ± 0.24 μm. To minimize surface roughness, the as-sintered samples should undergo a mechanical grinding process. Indeed, the majority of researchers and scholars have also conducted surface polishing on samples printed with BJ3DP technology [1,33]. However, challenges such as surface roughness and residual porosity remain, and the cost-effectiveness and practicality of this method compared to conventional techniques warrant further investigation.
It should be noted that the surface roughness of the as-sintered components is intrinsically linked to the characteristics of the powder and the binder–powder interaction during printing. The spherical morphology and the particle size distribution (D50 = 40.5 μm) of the Cr powder, as shown in Figure 1, are optimized for the binder jetting process according to the printer manufacturer. This specific powder morphology promotes dense powder packing, but the presence of finer particles can lead to localized variations in binder absorption and capillary forces. These variations, combined with the layer-by-layer spreading process, result in micro-scale inhomogeneities on the green part surface. During sintering, these initial surface imperfections are preserved and can be amplified due to isotropic shrinkage, ultimately contributing to the final surface roughness measured in this study.

3.3.2. Mechanical Properties

The mechanical properties are characterized by hardness. Table 7 presents the hardness values of Cr samples sintered at different temperatures and holding time. Additionally, the hardness of Cr samples fabricated using the BJ3DP method is compared with that of samples produced by the conventional levitation melting (LM) method. The hardness of Cr samples exhibited a positive correlation with both the sintering temperature and the holding time. The BJ3DP Cr samples sintered at 1800 °C for 9 h displayed the highest hardness. This can be attributed to the fact that the as-sintered samples achieved the highest relative density of 97.35% after sintering at 1800 °C for 9 h. Specifically, the hardness of the Cr samples sintered at 1800 °C for 6 h and 9 h were measured at 177.50 HV and 184.20 HV, respectively. In comparison, the hardness of the samples produced by the LM method was recorded at 171.20 HV. The improvement in hardness is primarily attributed to variations in the raw materials used. In this study, Cr powders with an average particle size of 40.5 μm were utilized for 3D printing, whereas Cr powders with an average particle size of 75 μm were employed in the LM method. Therefore, the BJ3DP method can be effectively utilized to fabricate high-melting-point metals, including chromium Cr materials.

4. Conclusions

In this study, an orthogonal experiment was primarily conducted to optimize the key printing parameters—layer thickness and binder saturation—for high-melting-point Cr metals produced using the BJ3DP method. Subsequently, the sintering temperature and sintering time were optimized using the Cr green parts produced with the identified optimal printing parameters. Additionally, the microstructure evolution and hardness of the samples fabricated by the BJ3DP and LM methods were investigated. The results indicated that the optimal parameters were a layer thickness of 75 μm and a binder saturation of 60%. With these parameters, the highest relative density of approximately 57.1% was achieved in the Cr samples printed using the BJ3DP method. The Cr parts achieved the highest relative density of 97.35% after being sintered at 1800 °C for 9 h. The hardness of the Cr samples showed a positive correlation with both the sintering temperature and the holding time. Notably, the BJ3DP sample sintered at 1800 °C for 9 h exhibited the highest hardness of 184.20 HV, which is superior to that of Cr samples produced using conventional techniques. Therefore, this novel 3D printing method can be effectively utilized to manufacture metal materials with high melting points, such as pure Cr.
Future work will involve evaluating the tensile properties, fabricating components with more complex geometries, and investigating the high-temperature oxidation performance of the BJ3DP-fabricated Cr to further assess its potential for industrial applications.

Author Contributions

Funding acquisition, Methodology, Investigation and Writing—original draft, L.S.; Resources, Methodology and Investigation, Y.S., W.L. and X.S.; Formal analysis, C.L. All authors have read and agreed to the published version of the manuscript.

Funding

This research was funded by the National Natural Science Foundation of China [52401065], and the Postdoctoral Research Foundation of China [2023TQ0292].

Data Availability Statement

The original contributions presented in this study are included in the article. Further inquiries can be directed to the corresponding author.

Conflicts of Interest

The authors declare no conflicts of interest.

Abbreviations

The following abbreviations are used in this manuscript:
BJ3DPBinder jet 3D printing method

References

  1. Mostafaei, A.; Elliott, A.M.; Barnes, J.E.; Li, F.Z.; Tan, W.D.; Cramer, C.L.; Nandwana, P.; Chmielus, M. Binder jet 3D printing-Process parameters, materials, properties, modeling, and challenges. Prog. Mater. Sci. 2021, 119, 100707. [Google Scholar] [CrossRef]
  2. Chen, L.; Chen, W.P.; Fu, Z.Q.; Ding, G.X.; Chen, Z.P.; Zhu, D.Z. Binder jet 3D printing of 316L stainless steel: Orthogonal printing and sintering process optimization. Adv. Eng. Mater. 2023, 25, 2200641. [Google Scholar] [CrossRef]
  3. Mohanavel, V.; Ashraff Ali, K.S.; Ranganathan, K.; Allen Jeffrey, J.; Ravikumar, M.M.; Rajkumar, S. The roles and applications of additive manufacturing in the aerospace and automobile sector. Mater. Today Proc. 2021, 47, 405–409. [Google Scholar] [CrossRef]
  4. Dawood, A.; Marti, B.M.; Sauret-Jackson, V.; Darwood, A. 3D printing in dentistry. Brit. Dent. J. 2015, 219, 521–529. [Google Scholar] [CrossRef] [PubMed]
  5. Guo, N.; Leu, M.C. Additive manufacturing: Technology, applications and research needs. Front. Mech. Eng. 2013, 8, 215–243. [Google Scholar] [CrossRef]
  6. Buswell, R.A.; Leal de Silva, W.R.; Jones, S.Z.; Dirrenberger, J. 3D printing using concrete extrusion: A roadmap for research. Cem. Concr. Res. 2018, 112, 37–49. [Google Scholar] [CrossRef]
  7. Sames, W.J.; List, F.A.; Pannala, S.; Dehoff, R.R.; Babu, S.S. The metallurgy and processing science of metal additive manufacturing. Int. Mater. Rev. 2016, 61, 315–360. [Google Scholar] [CrossRef]
  8. Lima, P.; Zocca, A.; Acchar, W.; Günster, J. 3D printing of porcelain by layerwise slurry deposition. J. Eur. Ceram. Soc. 2018, 38, 3395–3400. [Google Scholar] [CrossRef]
  9. Zhang, B.; Pei, X.; Song, P.; Sun, H.; Li, H.; Fan, Y.; Qing, J.; Zhou, X.D. Porous bioceramics produced by inkjet 3D printing: Effect of printing ink formulation on the ceramic macro and micro porous architectures control. Compos. Part B Eng. 2018, 155, 112–121. [Google Scholar] [CrossRef]
  10. Ford, S.; Despeisse, M. Additive manufacturing and sustainability: An exploratory study of the advantages and challenges. J. Clean. Prod. 2016, 137, 1573–1587. [Google Scholar] [CrossRef]
  11. Stavropoulos, P.; Foteinopoulos, P. Modelling of additive manufacturing processes: A review and classification. Manuf. Rev. 2018, 5, 2. [Google Scholar] [CrossRef]
  12. Farideh, D.; Sadegh, V.; Masoud, A.; Luca, I.; Abdollah, S. In vitro corrosion and bio-tribocorrosion performance of electron beam powder bed fusion Ti6Al4V specimens with lapping and superfinishing treatments. Prog. Addit. Manuf. 2025, 10, 9117–9132. [Google Scholar] [CrossRef]
  13. Mostafaei, A.; Stevens, E.L.; Ference, J.J.; Schmidt, D.E.; Chmielus, M. Binder jet printing of partial denture metal framework from metal powder. Mater. Sci. Technol. 2018, 21, 63–68. [Google Scholar] [CrossRef]
  14. Azhari, A.; Marzbanrad, E.; Yilman, D.; Toyserkani, E.; Pope, M.A. Binder-jet powder-bed additive manufacturing (3D printing) of thick graphene-based electrodes. Carbon 2017, 119, 257–266. [Google Scholar] [CrossRef]
  15. Shrestha, S.; Manogharan, G. Optimization of binder jetting using Taguchi method. JOM 2017, 69, 491–497. [Google Scholar] [CrossRef]
  16. Atapour, M.; Wang, X.; Persson, M.; Odnevall Wallinder, I.; Hedberg, Y.S. Corrosion and metal release investigations of selective laser melted 316L stainless steel in a synthetic physiological fluid containing proteins and in diluted hydrochloric acid. Electrochim. Acta 2020, 354, 136748. [Google Scholar] [CrossRef]
  17. Al-Mamun, N.S.; Mairaj Deen, K.; Haider, W.; Asselin, E.; Shabib, I. Corrosion behavior and biocompatibility of additively manufactured 316L stainless steel in a physiological environment: The effect of citrate ions. Addit. Manuf. 2020, 34, 101237. [Google Scholar] [CrossRef]
  18. Rodrigues, T.A.; Escobar, J.D.; Shen, J.; Duarte, V.R.; Ribamar, G.G.; Avila, J.A.; Maawad, E.; Schell, N.; Santos, T.G.; Oliveira, J.P. Effect of heat treatments on 316 stainless steel parts fabricated by wire and arc additive manufacturing: Microstructure and synchrotron X-ray diffraction analysis. Addit. Manuf. 2021, 48, 102428. [Google Scholar] [CrossRef]
  19. Gilbert, A. Metallurgy of chromium. Nature 1968, 220, 310. [Google Scholar] [CrossRef]
  20. Gu, Y.F.; Harada, H.; Ro, Y. Chromium and chromium-based alloys: Problems and possibilities for high-temperature service. JOM 2004, 56, 28–33. [Google Scholar] [CrossRef]
  21. Gokcekaya, O.; Hayashi, N.; Ishimoto, T.; Ueda, K.; Narushima, T.; Nakano, T. Crystallographic orientation control of pure chromium via laser powder bed fusion and improved high temperature oxidation resistance. Addit. Manuf. 2020, 36, 101624. [Google Scholar] [CrossRef]
  22. Kong, D.; Dong, C.; Ni, X.; Li, X. Corrosion of metallic materials fabricated by selective laser melting. npj Mater. Degrad. 2019, 3, 24. [Google Scholar] [CrossRef]
  23. Jonsson, B.; Westerlund, A. Oxidation comparison of alumina-forming and chromia-forming commercial alloys at 1100 and 1200 °C. Oxid. Met. 2017, 88, 315–326. [Google Scholar] [CrossRef]
  24. Footner, P.K.; Holmes, D.R.; Mortimer, D. Oxidation of iron-chromium binary alloys. Nature 1967, 216, 54–56. [Google Scholar] [CrossRef]
  25. Johansson, G. Oxidation of binary FeCr alloys (Fe-2.25Cr, Fe-10Cr, Fe-18Cr and Fe-25Cr) in O2 and in O2 + H2O environment at 600 °C. Oxid. Met. 2011, 75, 183–207. [Google Scholar] [CrossRef]
  26. Hallstrom, S.; Halvarsson, M.; Hoglund, L.; Jonsson, T.; Agren, J. High temperature oxidation of chromium: Kinetic modeling and microstructural investigation. Solid State Ion. 2013, 240, 41–50. [Google Scholar] [CrossRef]
  27. Madhavadas, V.; Srivastava, D.; Chadha, U.; Raj, S.A.; Sultan, M.T.H.; Mohamed, F.S.; Shah, A.U.M. A review on metal additive manufacturing for intricately shaped aerospace components. CIRP J. Manuf. Sci. Technol. 2022, 39, 18–36. [Google Scholar] [CrossRef]
  28. Li, M.; Du, W.; Elwany, A.; Pei, Z.; Ma, C. Metal binder jetting additive manufacturing: A literature review. ASME J. Manuf. Sci. Eng. 2020, 142, 090801. [Google Scholar] [CrossRef]
  29. Shan, L.Y.; Wang, X.L.; Chang, Y.L.; Wang, Y.P. Improving the mechanical performance of Cu-Cr alloy by dissolving Cu in the Cr second phase. Mater. Charact. 2021, 176, 111104. [Google Scholar] [CrossRef]
  30. Wijshoff, H. Drop dynamics in the inkjet printing process. Curr. Opin. Colloid Interface Sci. 2018, 36, 20–27. [Google Scholar] [CrossRef]
  31. Chen, H.; Chen, H.; Zhao, Y.F. Process parameters optimization for improving surface quality and manufacturing accuracy of binder jetting additive manufacturing process. Rapid Prototyp. J. 2016, 22, 527–538. [Google Scholar] [CrossRef]
  32. Fayazfar, H.; Salarian, M.; Rogalsky, A.; Sarker, D.; Russo, P.; Paserin, V. A critical review of powder-based additive manufacturing of ferrous alloys: Process parameters, microstructure and mechanical properties. Mater. Des. 2018, 144, 98–128. [Google Scholar] [CrossRef]
  33. Amir, M.S.; Harsha, V.R.; Neelapu, C.K.; Lauren, M.N.; Tevis, D.B.J.; Markus, C. Characterizing surface finish and fatigue behavior in binder-jet 3D-printed nickel-based superalloy 625. Addit. Manuf. 2018, 24, 200–209. [Google Scholar] [CrossRef]
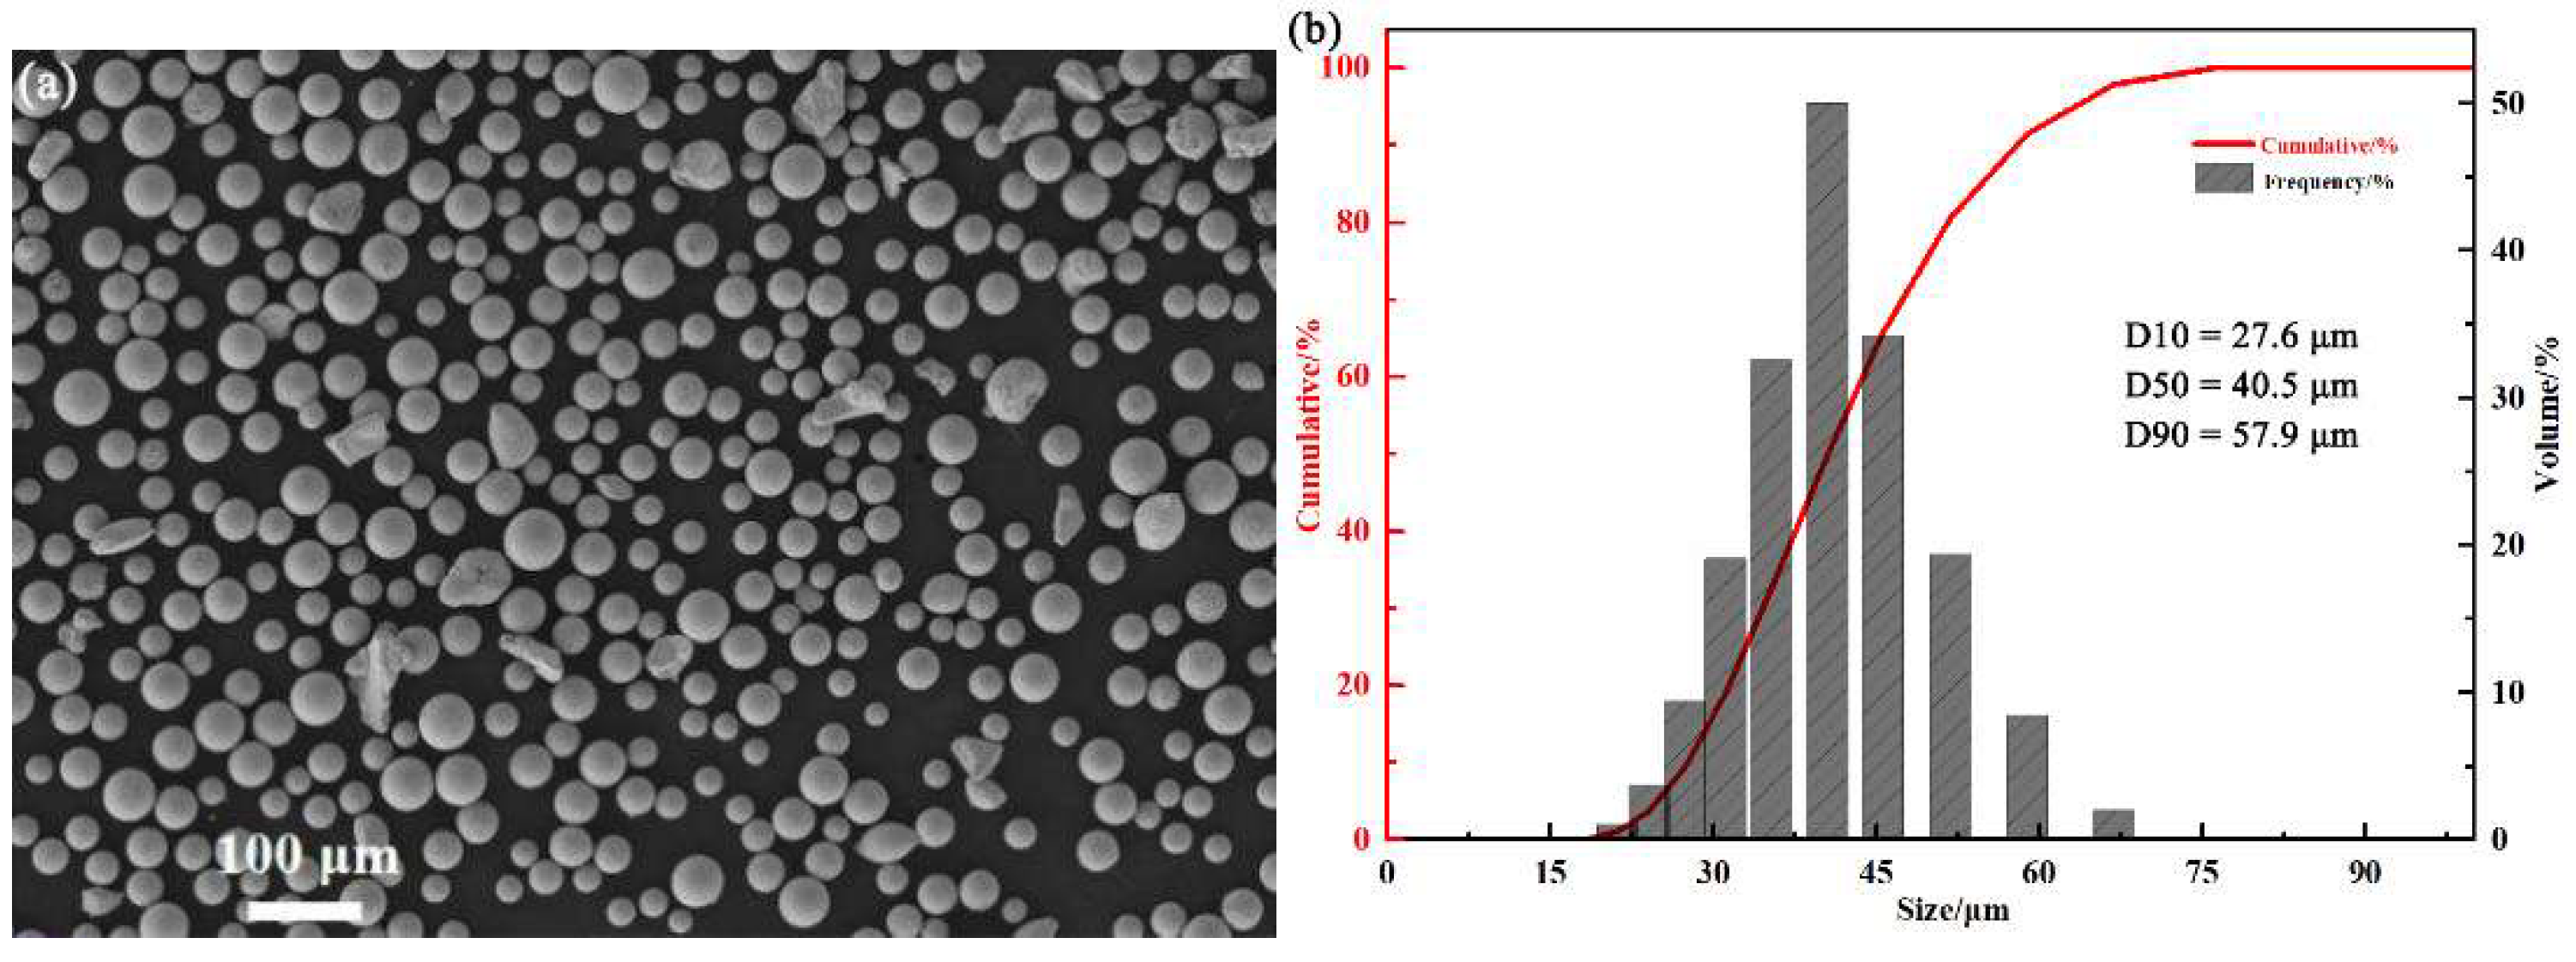
Figure 1. The microstructure and particle size distribution of Cr raw material. (a) Microstructure of Cr powders; (b) particle size distribution of Cr powders.
Crystals 15 01012 g001
Figure 2. Schematic illustration of the binder jetting printer from Shop System.
Crystals 15 01012 g002
Figure 3. The images of Cr cubic parts after sintering process.
Crystals 15 01012 g003
Figure 4. SEM surface images of Cr green parts: (a) sample 3; (b) sample 9; (c) and (d) sample 6.
Crystals 15 01012 g004aCrystals 15 01012 g004b
Figure 5. Effect of printing parameters on the density of Cr green parts. (a) Layer thickness; (b) binder saturation; (c) effect of layer thickness and binder saturation levels.
Crystals 15 01012 g005
Figure 6. Printing process defects: a schematic diagram. (a) Low saturation; (b) High saturation.
Crystals 15 01012 g006
Figure 7. SEM images of Cr samples sintered at different temperatures for 3 h: (a) 1500 °C; (b) 1650 °C; (c) 1700 °C.
Crystals 15 01012 g007
Figure 8. SEM images of Cr samples sintered at 1800 °C for different times: (a) 6 h; (b) 9 h.
Crystals 15 01012 g008
Figure 9. EDS results of Cr samples sintered at 1800 °C for 9 h. (a) The content of element Cr and O; (b) distribution of the Cr element.
Crystals 15 01012 g009
Figure 10. The surface scans of as-sintered Cr sample. (a) Topography of surface scans; (b) Horizontal distance scans of topography.
Crystals 15 01012 g010
Table 1. Quantitative comparison between binder jetting and laser powder bed fusion (LPBF) for metal AM [1].
PropertyBJ3DPLPBF
As-Printed Density~50–60% (Green part)>99%
Post-Densified Density>99% (After sintering/infiltration)
Tensile Strength (Inconel 625)~612 MPa (as-sintered), ~700 MPa (aged)~900–1100 MPa
Elongation (Inconel 625)~41% (as-sintered), ~30% (aged)~20–30%
Surface Roughness (as-built)~6 µm Ra (after sintering)5–15 µm Ra
Support StructuresNo Support Required
Typical Build VolumeUp to 2200 × 1200 × 600 mmTypically < 500 × 500 × 500 mm
Material CompatibilityMetals, ceramics, compositesLimited by weldability and reflectivity
Table 2. Chemical composition (wt.%) of pure Cr powders.
ElementNiSiFeMnMgCr
Weight percent (wt.%)0.0250.0020.0020.0010.003999.95
Nominal composition (wt.%)<0.01<0.01<0.01<0.01<0.01≥99.9
Table 3. Binder saturation and layer thickness of Cr parts.
Experiments NumberPrinting Parameters
Binder Saturation (%)Layer Thickness (μm)
140100
250100
360100
44075
55075
66075
74050
85050
96050
Table 4. Dimension changes and density for the Cr green samples printed by BJ3DP.
Experiments NumberX-Axis (mm)Y-Axis (mm)Z-Axis (mm)Average Density
(g·cm−3)
Average
Relative Density (%)
Average Dimensional Deviation (mm)
120.07 ± 0.0520.14 ± 0.0919.99 ± 0.103.6851.2%±0.22
220.08 ± 0.0720.17 ± 0.1219.98 ± 0.083.7652.3%±0.27
320.10 ± 0.0920.18 ± 0.1319.95 ± 0.113.8453.4%±0.33
420.09 ± 0.0620.20 ± 0.1120.01 ± 0.153.9254.5%±0.30
520.06 ± 0.1020.19 ± 0.1320.03 ± 0.173.9655.1%±0.28
620.04 ± 0.0520.21 ± 0.1720.06 ± 0.064.0255.9%±0.31
720.07 ± 0.0620.22 ± 0.1520.09 ± 0.133.9054.3%±0.38
820.08 ± 0.1020.23 ± 0.1920.05 ± 0.083.8853.9%±0.36
920.08 ± 0.1120.20 ± 0.2020.08 ± 0.143.9254.5%±0.36
Table 5. K and R values of density for Cr green parts printed by BJ3DP.
Experiments NumberFactorsDensity (g·cm−3)
Binder Saturation (%)Layer Thickness (μm)
1401003.68
2501003.76
3601003.84
440753.92
550753.96
660754.02
740503.90
850503.88
960503.92
K111.5011.28
K211.6011.90
K311.7811.70
k13.833.76
k23.873.97
k33.933.90
R0.280.62
Table 6. Effect of sintering parameters on shrinkage, density, and grain size of Cr samples.
Sintering
Parameters
Linear Shrinkage (%)Volumetric
Shrinkage (%)
Density
(g·cm−3)
Relative Density (%)Average Grain Size (μm)
X-AxisY-AxisZ-Axis
1500 °C/2.0 h4.24.54.612.725.5978.1321
1600 °C/3.0 h4.34.74.713.085.8381.5923
1650 °C/3.0 h4.54.84.913.546.1485.8226
1700 °C/3.0 h4.95.05.214.396.3989.4031
1800 °C/6.0 h5.25.15.514.986.6893.4234
1800 °C/9.0 h5.65.56.116.236.9697.3536
Table 7. The hardness of Cr samples with different sintering parameters.
MethodSintering ParametersHardness (HV)Reference
LM/171.20 ± 5.6[27]
BJ3DP1500 °C/2.0 h149.92 ± 6.1This work
BJ3DP1600 °C/3.0 h156.25 ± 5.9This work
BJ3DP1650 °C/3.0 h166.85± 1.8This work
BJ3DP1700 °C/3.0 h169.22 ± 2.3This work
BJ3DP1800 °C/6.0 h177.50 ± 2.3This work
BJ3DP1800 °C/9.0 h184.20 ± 2.0This work
Disclaimer/Publisher’s Note: The statements, opinions and data contained in all publications are solely those of the individual author(s) and contributor(s) and not of MDPI and/or the editor(s). MDPI and/or the editor(s) disclaim responsibility for any injury to people or property resulting from any ideas, methods, instructions or products referred to in the content.