Our benchmark results validate our functional choice for extended Al
xN
x structures by confirming previous findings on the Al
4N
4 prototype, where CAM-B3LYP closely reproduces both first and second singlet excitation energies and oscillator strengths compared to EOM-CCSD, with deviations of less than 0.1 eV [
36]. This is clear from the collected results in
Table 1 where the first two calculated resonances using several different well-known functionals are presented. This pattern aligns with previous benchmarking investigations on III–V nitride clusters, including ScN NPs [
33]. In addition, the use of Al
xN
x NPs in high-power applications is supported by the excellent dielectric properties and high thermal stability of bulk AlN ceramics, which have been well documented in the literature [
34]. These results are consistent with those of Moustris et al. [
35] on exotic and defective calcium nanoclusters. AlN NPs have also shown biocompatibility and anticancer activity in experiments [
12]. Recent magnesium-based nanostructures have also been studied for these properties using surface-mode analysis and vibrational fingerprinting [
36]. It should also be mentioned that among the latest DFT studies on AlN-based clusters, sol–gel mechanisms for AlN formation and IR-based drug delivery modeling on tetragonal AlN, complement the present work, where size-dependent and shape-dependent analysis of optical and vibrational properties are provided [
37,
38]. As already mentioned, the agreement between our CAM-B3LYP TD-DFT results and the reference EOM-CCSD data reinforces our computational approach [
15], while the vibrational tunability of these systems is confirmed by the growing density of IR-active modes across 1D, 2D, and 3D geometries [
34,
35]. IR intensities (in km/mol) are reported as obtained from the TD-DFT calculations.
3.1. AlxNx Nanoparticles
This work expands on the current knowledge of AlN nanoclusters and offers theoretical justification for their use in optoelectronics, sensing, and possibly biomedical applications by combining geometric variation, optical absorption, and infrared signatures. As can be seen from
Figure 1, the initial cubic building block of the form Al
4N
4 served as the basis for all the nanostructures under study. The geometry optimization for the Al
4N
4 nanocluster, as presented in
Figure 1, showed that it exhibits a quasi-cubic arrangement with near-ideal angular geometry. Most internal angles approach the ideal 90°, with only slight deviations where an angle of ∼82° was measured, reflecting the structural stability and low strain in the optimized configuration. By elongating this building block, new stable structures with intriguing optical characteristics could be produced. As a result, the formed Al
xN
x nanostructures can be divided into three categories. The first category includes elongated nanoparticles along one direction (1D). The second includes nanoparticles of the general form Al
16N
16 which were created after elongation of the initial cubic unit along two and three directions and thus forming a group of exotic nanostructures composed of nanostructures with several familiar shapes. The third category of the studied NPs includes the Al
32N
32 nanostructures. The nanostructures of this group were formed by the elongation of the initial cubic unit along one, two, and three perpendicular directions. An exotic NP was also examined for this case. This exotic nanostructure was created by the extraction of one cubic unit from the center of the two-dimensional Al
36N
36 case. In addition, larger Al
xN
x NPs were also examined, where x = 36 and x = 40. The examination of the computed optical characteristics of the suggested NPs revealed some intriguing results which trigger potential uses of the suggested nanostructures.
Figure 1.
The initial cubic-like building block Al4N4 after its geometry optimization. Gray color corresponds to the Al atom while blue to the N atom. (a) Side view of the cube and (b) a 45-degree perspective of the cubic unit.
Figure 1.
The initial cubic-like building block Al4N4 after its geometry optimization. Gray color corresponds to the Al atom while blue to the N atom. (a) Side view of the cube and (b) a 45-degree perspective of the cubic unit.
3.1.1. One-Directional AlxNx NPs
As already mentioned, the AlN NPs were divided into four categories where the first category of nanostructures was created by elongation of the initial cubic-like building block, Al
4N
4, along one direction. The general form of the created NPs is Al
xN
x, where x = 8, 16 for this case. As can be seen from
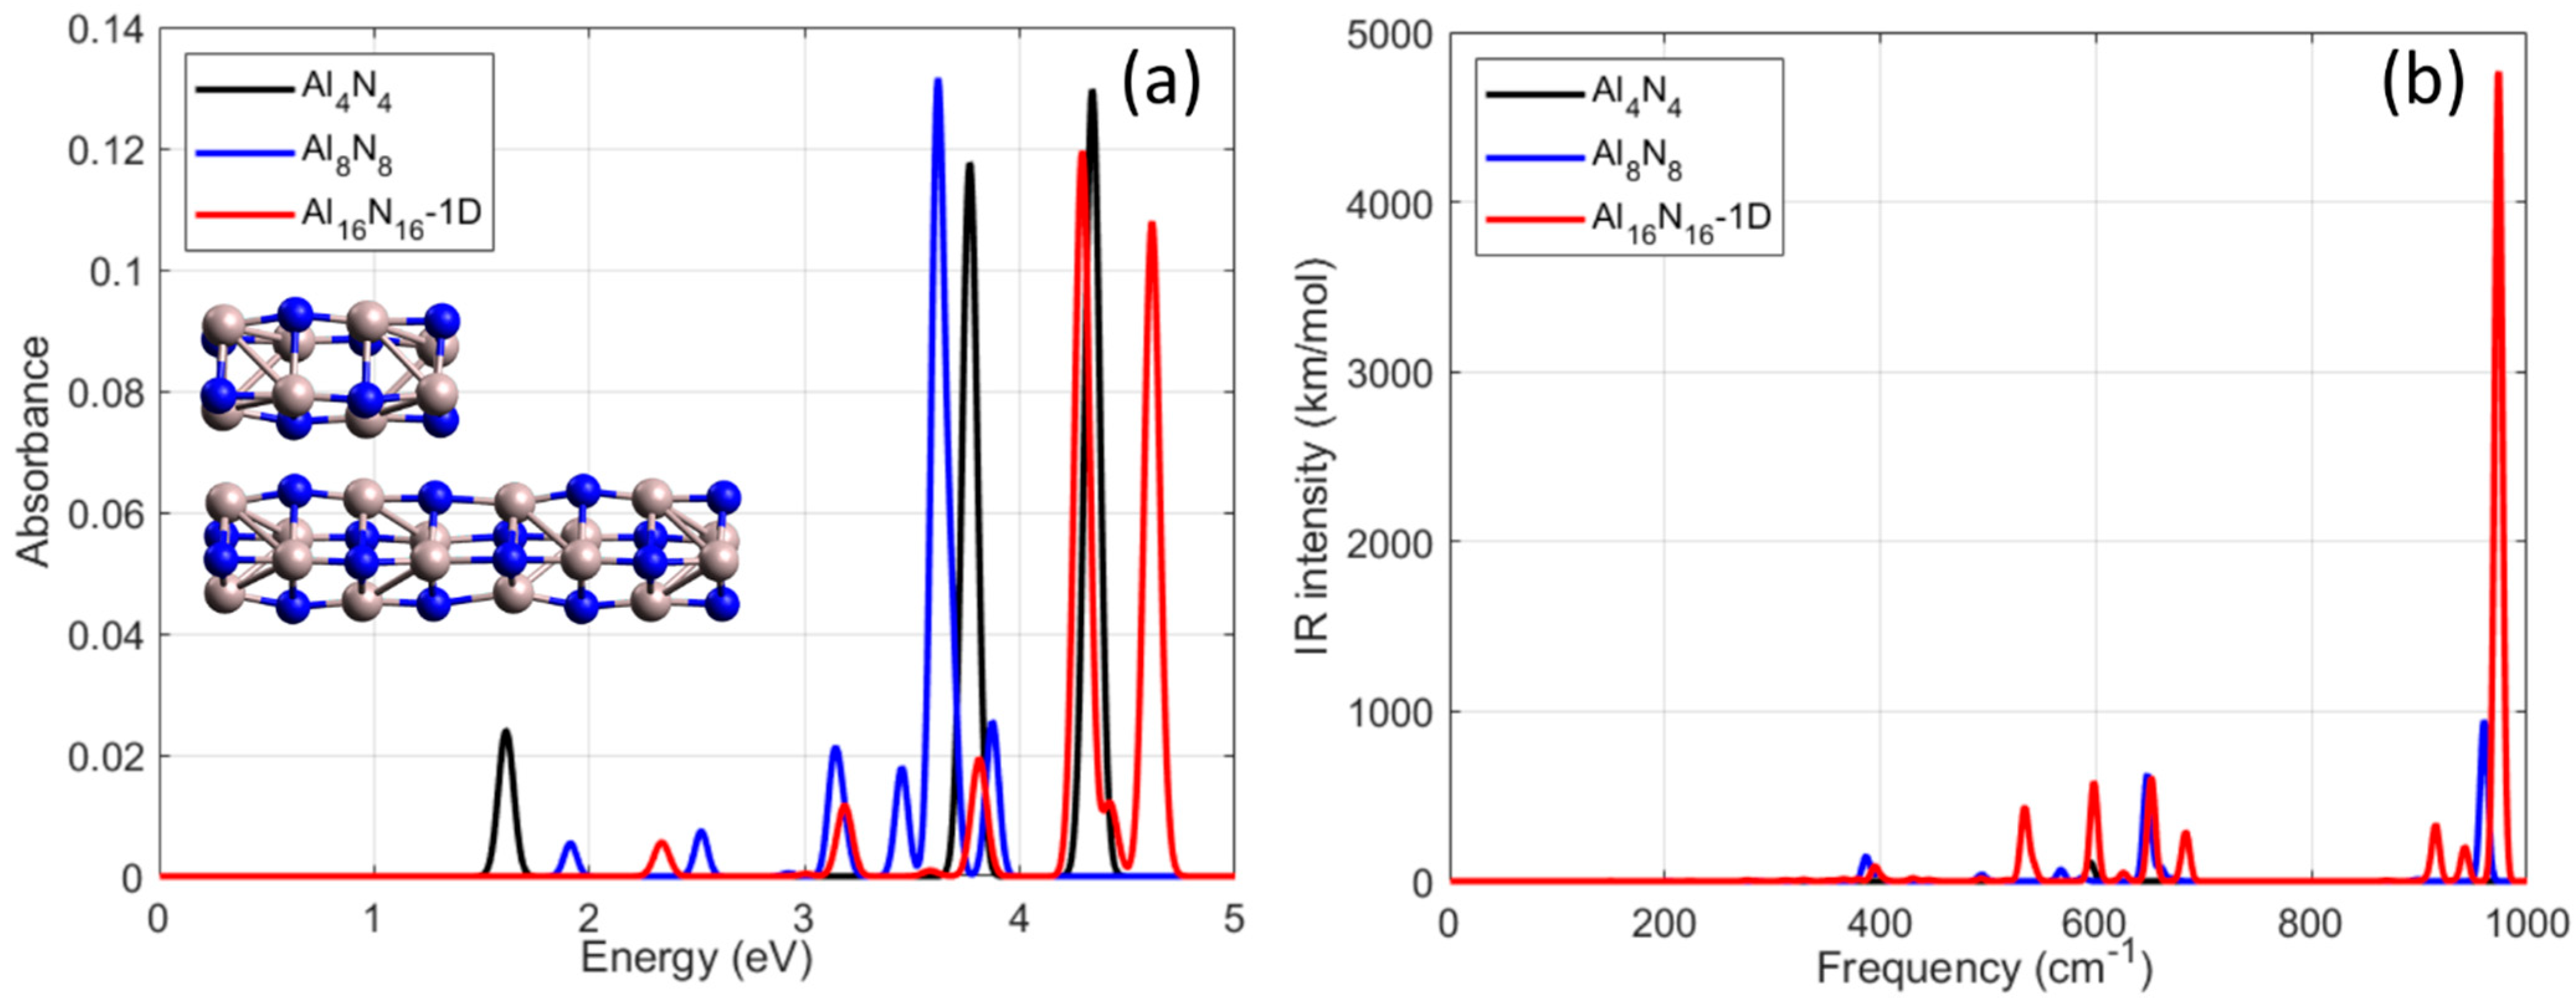
Figure 2, the structure with x = 8 consists of two cubic-like building blocks, and the structure with x = 16 consists of four corresponding cubes. These structures can be considered stable as there were not any imaginary frequencies due to geometry optimization. The computational results for Al
4N
4, Al
8N
8, and Al
16N
16-1D, showed that each NP exhibits distinct optical and vibrational behavior as a function of its size and composition.
The computed UV–Vis absorption spectra for Al
4N
4, Al
8N
8, and Al
16N
16-1D are shown in
Figure 2a. The smallest cluster, Al
4N
4, exhibits a strong and narrow absorption maximum at 4.48 eV, together with weaker features at 1.34 eV and 3.14 eV. Al
8N
8 presents its most intense peak at 3.62 eV, while the elongated Al
16N
16-1D nanostructure displays a broader spectral profile with multiple overlapping transitions spanning the 3.18–4.62 eV region. As the geometry becomes more extended and less symmetric, the number and distribution of allowed excitations increase, reflecting enhanced orbital mixing and a higher density of accessible excited states. Importantly, the evolution of the main absorption features across these three clusters is not monotonic: although Al
8N
8 shows a lower-energy peak relative to Al
4N
4, the dominant transition in Al
16N
16-1D shifts back toward higher energies (~4.5 eV). This behavior indicates that the optical response is governed primarily by geometry-induced symmetry breaking and orbital redistribution rather than by particle size alone. All spectra are normalized to their maximum intensity for consistent comparison.
Figure 2.
(a) The UV–visible spectra for the AlxNx NPs, where x = 4, 8, 16 when considered after elongation along one direction. Figure legend indicates the color that represents each line of the plot. The inset in the plot presents the examined NPs for x = 8 and for x = 16. (b) The vibrational spectra for the AlxNx (x = 4, 8, 16) when considered after elongation along one direction. Figure legend indicates the color that represents each line of the plot.
The infrared (IR) spectra of Al
4N
4, Al
8N
8, and Al
16N
16-1D nanostructures were computed through harmonic frequency analysis and are depicted in
Figure 2b. All systems show well-defined IR-active modes within the low- to mid-frequency range, 300–700 cm
−1, corresponding primarily to Al–N stretching and bending vibrations. The smallest structure, Al
4N
4, exhibits its most intense vibrational mode at 595 cm
−1 with an IR-intensity value of 111 km/mol. The Al
8N
8 nanostructure shows increased IR activity, presenting strong peaks at 387 cm
−1 and 568 cm
−1 and a prominent maximum at 648 cm
−1. These shifts indicate structural reorganization and enhanced polarizability upon elongation. The Al
16N
16-1D NP demonstrates the most complex vibrational profile among the three. A series of strong IR peaks is observed at 394 cm
−1, 534 cm
−1, 598 cm
−1, and 651 cm
−1 which reaches an IR-intensity of nearly 610 km/mol, which closely matches the strongest peak observed in Al
8N
8, indicating comparable vibrational activity in the high-frequency Al–N stretching region. In addition, there is another resonance mode at 683 cm
−1 with an IR-intensity value of 290 km/mol. This enhancement is indicative of cooperative vibrational coupling across the extended chain structure, likely due to increased collective displacement of Al–N units. The gradual increase in both number and intensity of IR-active modes with the length of the nanoparticle reflects the increased vibrational complexity and the relevant decrease in symmetry in elongated configurations. Importantly, no imaginary frequencies were detected in any of the structures, confirming their dynamic stability. Extending the analysis to the higher-frequency range, that is 700–1000 cm
−1, distinct differences become evident among the three examined nanoparticles. The Al
4N
4 NP (black line) shows negligible activity in these regions. In contrast, the Al
8N
8 nanostructure, which is indicated by the blue line, exhibits a very intense vibrational mode at 960 cm
−1, reaching 947 km/mol. Similarly, the elongated towards one direction Al
16N
16-1D system (red line) presents a sharp peak at 974 cm
−1 with an intensity of about 4767 km/mol, which represents the strongest feature across the entire spectrum. This comparative analysis highlights a non-monotonic evolution of high-frequency IR activity according to which the smallest cluster Al
4N
4 shows suppressed activity, the intermediate Al
8N
8 demonstrates the most intense response, while the elongated Al
16N
16-1D regains equally strong IR activity near 1000 cm
−1. These results provide a comprehensive vibrational fingerprint for 1D Al
xN
x NPs and can serve as reference data for future experimental IR or Raman spectroscopic investigations aimed at identifying such nanostructures. These vibrational fingerprints provide valuable information for experimentalists aiming to detect or identify Al
xN
x nanostructures via IR or Raman spectroscopy. Furthermore, the correlation between structure length and peak positions suggests that vibrational analysis could serve as a sensitive probe of size and morphology at the nanoscale.
3.1.2. Elongated Al16N16 NPs Along Two or Three Directions
In all elongated and shape-modified Al
16N
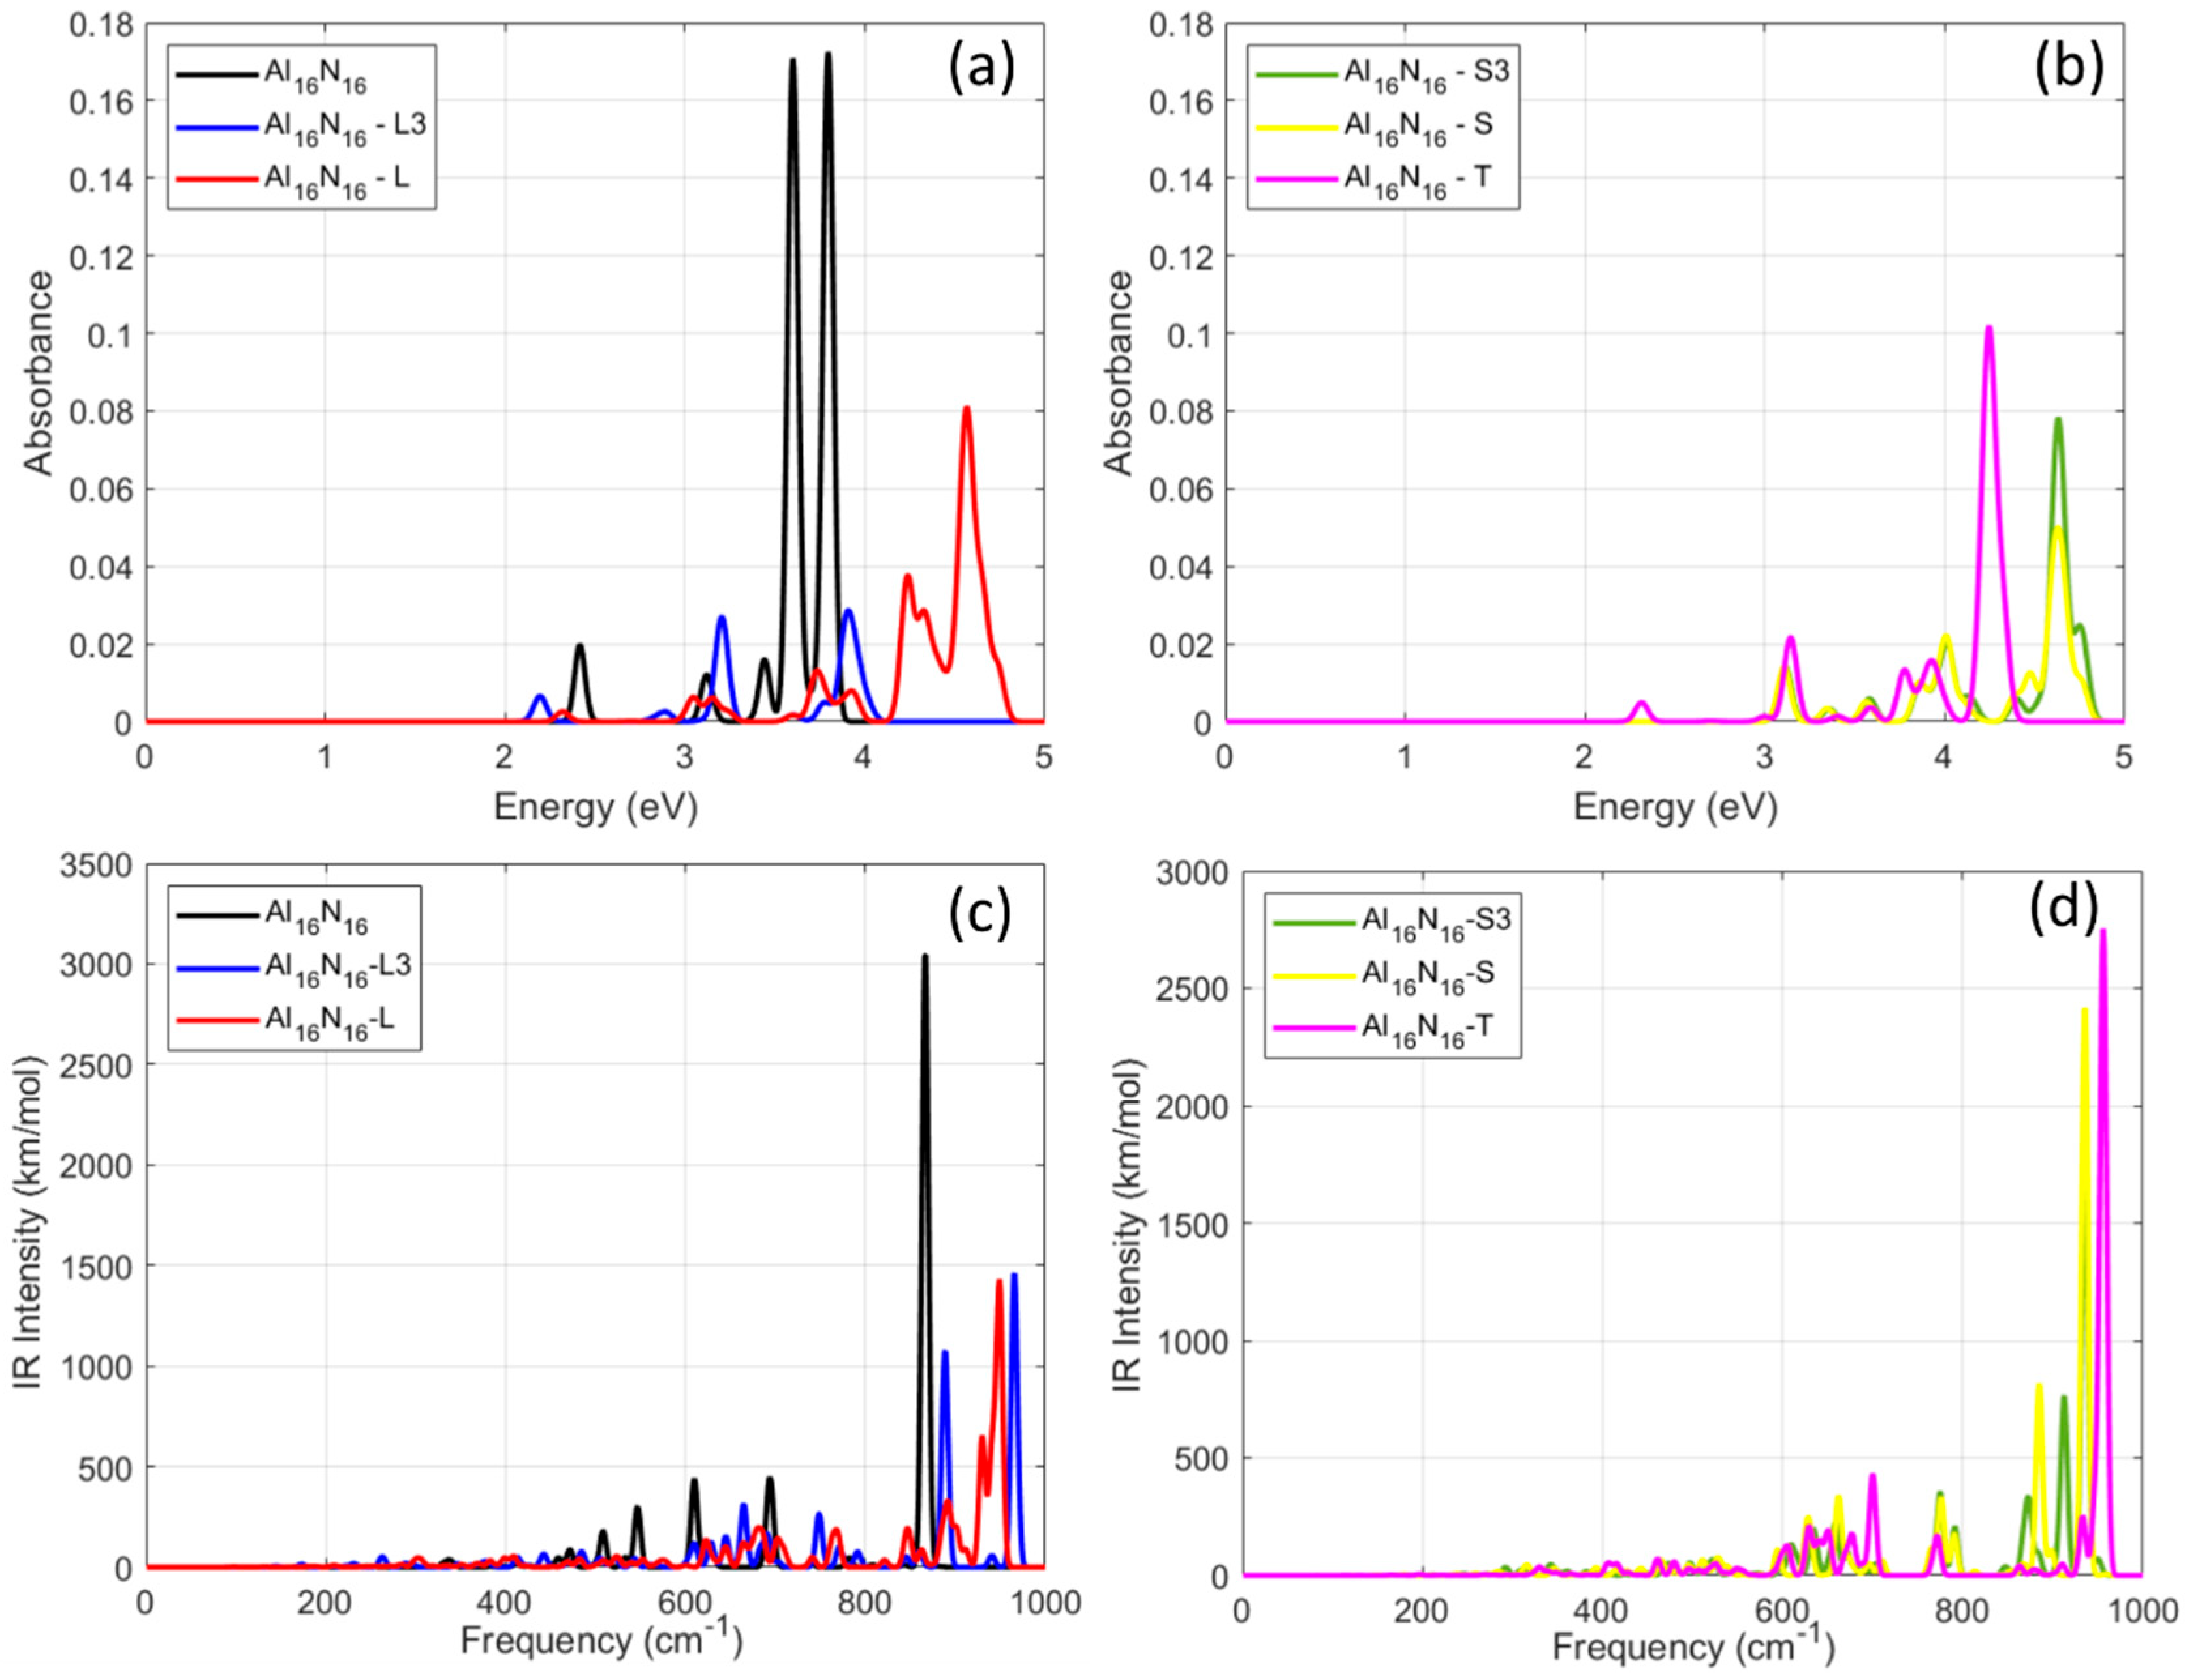
16 nanostructures, the spectra of which are presented in Figure 4a,b, similar red-shift behavior was observed, with the main absorption bands ranging from approximately 3.2 to 4.6 eV depending on geometry. The spectra were presented in normalized form for comparison of relative spectral profiles. The second category of the examined NPs consists of nanostructures which have the general form Al
16N
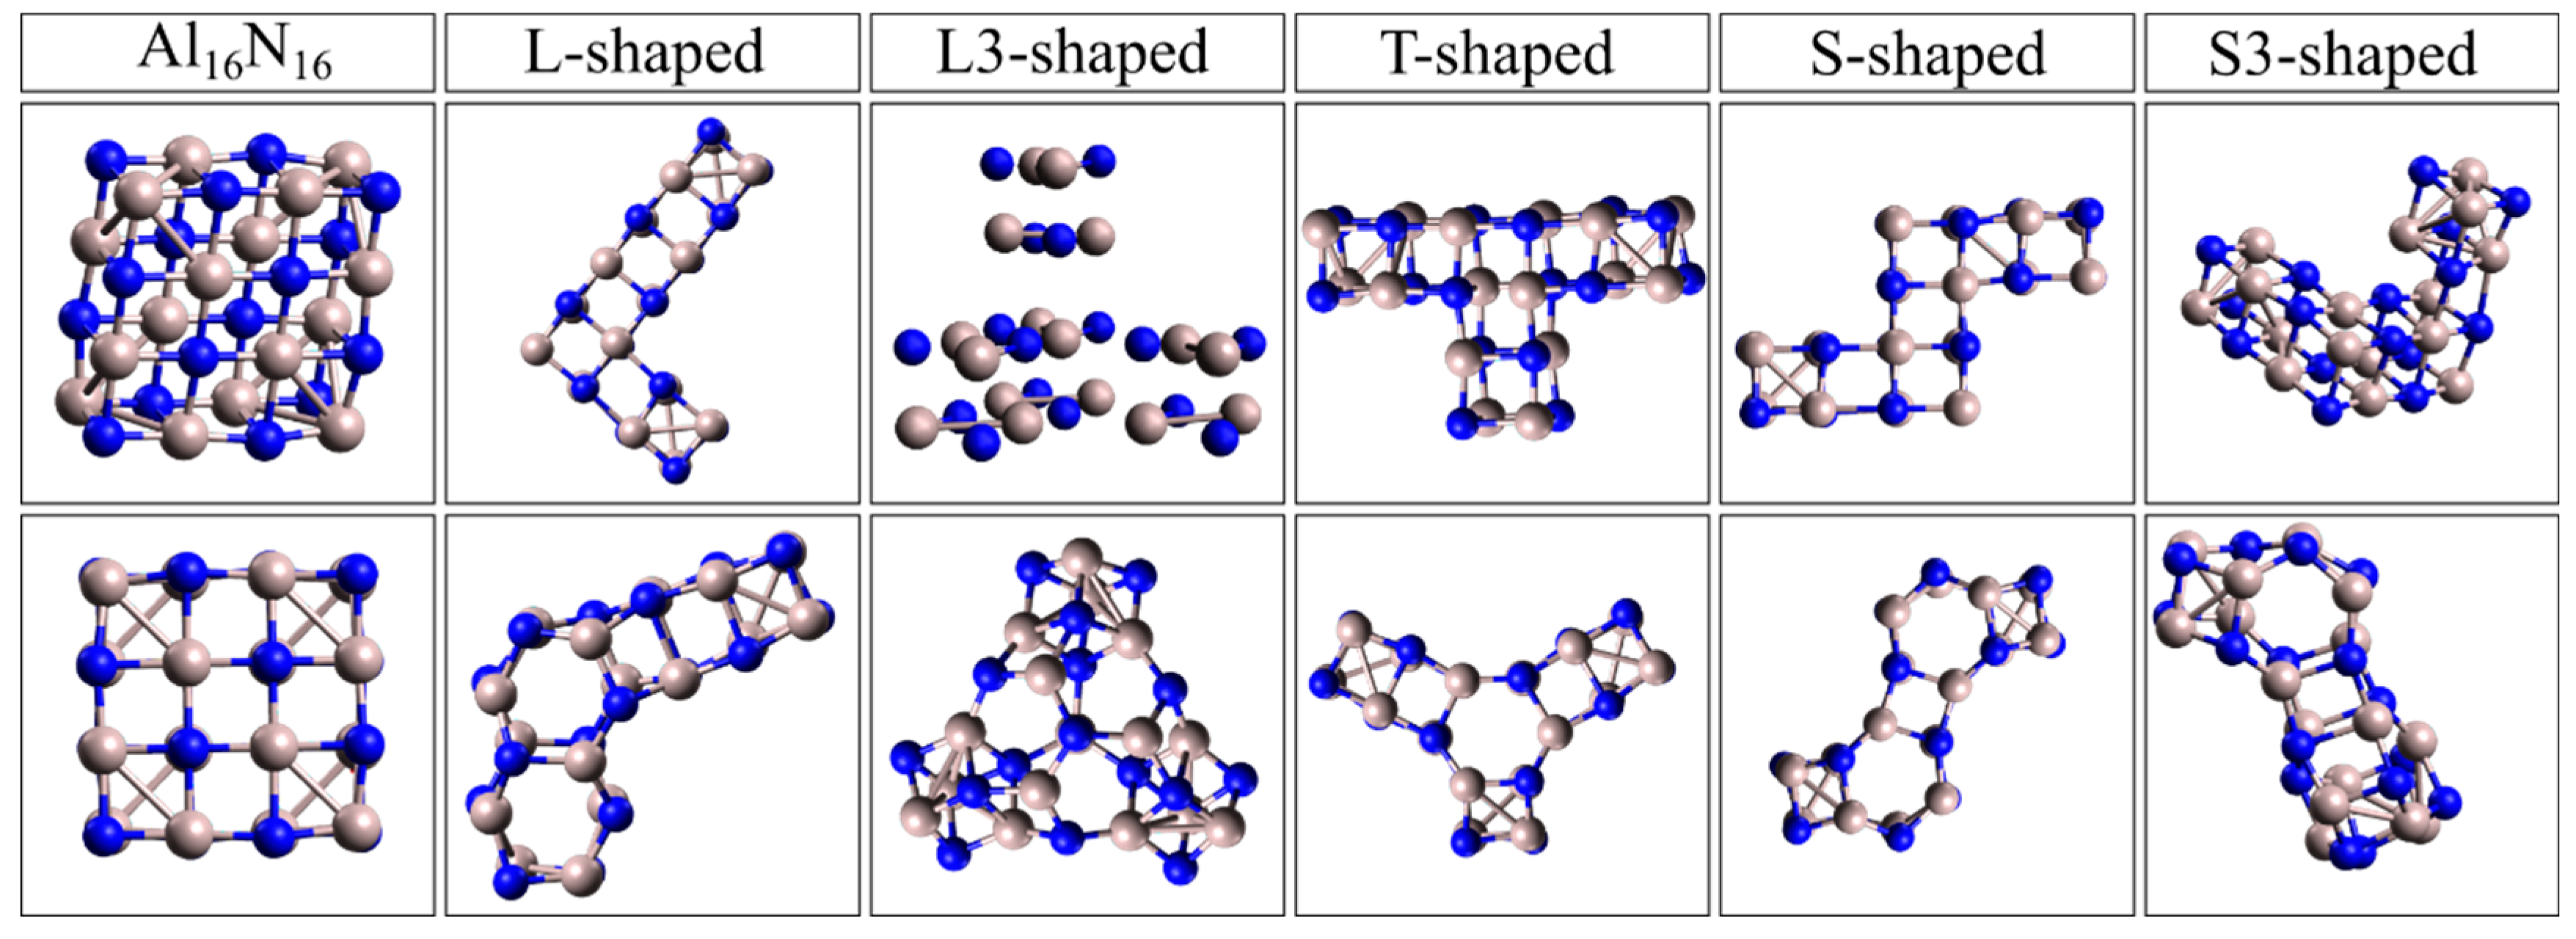
16 and were created from the initial cubic cell after its elongation along two and three directions. The first group of this category includes NPs which form some familiar two-dimensional shapes such as an S shape, an L shape, or a T shape. These geometries with their representative names are presented in
Figure 3. In the same figure the form of the nanostructure after the geometry optimization is also presented below the initial shape. This set of configurations includes optimized geometries extended along two perpendicular directions or formed into non-linear, asymmetric shapes, such as L-shaped, T-shaped, and cross-like motifs as shown in detail in
Figure 3. For the cases of L-shaped and S-shaped geometries a modification where the extension was along three perpendiculars directions was also examined. These cases were named L3 and S3, respectively. The UV–Vis absorption spectra of the examined elongated and shape-modified Al
16N
16 nanostructures were separated into two groups for better view and are presented in
Figure 4a,b.
The initial Al
16N
16 cluster exhibits two intense, narrow absorption peaks centered at 3.60 eV and 3.78 eV, corresponding to localized π–π* transitions [
39]. Upon geometric transformation, these sharp peaks broaden and shift. For example, the L-type shape displays a major absorption maximum at 4.57 eV, with reduced intensity and additional low-energy features appearing near 4.2–4.4 eV. Similarly, the T-shaped Al
16N
16–T geometry shows a strong peak at 4.24 eV, with multiple satellite transitions below 3.14 eV. The Al
16N
16–S3 configuration exhibits the most spectrally complex profile, with absorbance widely distributed between 3.15 and 4.63 eV, suggesting a high density of permitted transitions and enhanced electronic delocalization. On the other hand, the Al
16N
16-L3 and Al
16N
16-S variants show intermediate optical activity and moderate peak splitting. Interestingly, the number and spread of absorption bands increase while the intensity of the main peaks decreases in comparison to the symmetric reference (initial) structure. This underscores the influence of asymmetric geometry and anisotropy on the electronic excitation landscape. These findings imply that precise control over the UV absorption properties of Al
16N
16 nanoclusters can be achieved by adjusting their geometry. Designing nanoscale optoelectronic components that need particular spectral signatures could make use of this tunability.
Figure 3.
The second group of NPs created after elongation of the initial cubic-like building block Al4Ν4 along two or three perpendicular directions forming well-known shapes. Gray color corresponds to the Al atom while blue to the N atom. The top row consists of the initial nanostructures, and the bottom row includes the nanostructures after geometry optimization. On the top of each column the relevant name of the nanostructure appears.
Figure 4.
(a,b) The UV–vis spectra for the second group of nanostructures, with familiar shapes, when considered after elongation along two or three perpendicular directions. (c,d) The vibrational spectra for the second group of nanostructures, with familiar shapes, when considered after elongation along two perpendicular directions. Figure legend in each plot indicates the color that represents each examined case.
The vibrational spectra of the Al
16N
16-based nanostructures with two-dimensional and three-dimensional exotic geometries are presented in
Figure 4c,d. As in the case of the absorption spectra, the plots were separated into two groups for better view. All configurations exhibit IR-active modes mainly in the 250–1000 cm
−1 region, consistent with Al–N stretching and bending vibrations, as has been previously reported for AlN-based clusters and ceramics. The reference structure Al
16N
16 shows four strong resonance frequencies. These resonances were calculated at 510 cm
−1 with an IR-intensity of 162 km/mol, at 547 cm
−1 with IR-intensity of 300 km/mol, at 609 cm
−1 with IR-intensity 428 km/mol, and at 695 cm
−1 with IR-intensity 430 km/mol. The strongest covariance frequency, however, occurred at 867 cm
−1 with an IR-intensity value of 3042 km/mol, which marks the highest intensity observed over the whole series. These correspond to collective vibrations of the Al–N bond associated with symmetric displacement patterns. The Al
16N
16-L geometry exhibits a broader and denser vibrational profile, with multiple moderate intensity peaks spanning a range of 625–950 cm
−1, including strong resonance frequencies at 681, 891, 929, and 949 cm
−1 with corresponding IR-intensity values of 197, 330, 654, and 1431 km/mol. This reflects the increased vibrational degrees of freedom introduced by the angular deformation of the cluster. For the case of Al
16N
16-T, a characteristic IR maximum appears at 956 cm
−1 with a corresponding IR-intensity value of 2754 km/mol and a secondary resonance at 700 cm
−1 with IR-intensity value of 433 km/mol, which closely resembles the profile of the Al
16N
16-S structure. However, an increased number of medium intensity modes is also evident between 605 and 680 cm
−1.
For the Al
16N
16-L3 case, as shown by the blue line in
Figure 4c, a dominant resonance peak is observed at 966 cm
−1 with an intensity of 1462 km/mol, accompanied by two additional resonances at 888 cm
−1 (1069 km/mol) and 665 cm
−1 (314 km/mol). At lower frequencies, further excitations appear at 645 cm
−1 and 609 cm
−1, with intensities of 154 and 119 km/mol, respectively. Significant frequency variations are also observed for the nanostructures with S-type geometries, Al
16N
16–S3 and Al
16N
16–S. For the S3-shaped nanostructure, the strongest resonance was calculated at 936 cm
−1 with an IR-intensity value of 1823 km/mol. Furthermore, another two strong resonances were located at 913 cm
−1 and 774 cm
−1, with intensities of 766 and 346 km/mol, respectively. Additional notable features include peaks at 871 cm
−1 (315 km/mol) and 634 cm
−1 (199 km/mol). For the case of the S-shaped nanostructure, the strongest resonance occurs at 936 cm
−1 with a high intensity of 2415 km/mol. Another two strong modes appeared at 885 cm
−1 (817 km/mol) and 777 cm
−1 (317 km/mol). Moreover, several smaller but distinct modes were observed in the range 595–710 cm
−1. Across all configurations, the number of IR-active modes systematically increases with geometric complexity, while the intensity distribution broadens. This trend reflects the increasing structural anisotropy and reduced symmetry. Importantly, no imaginary frequencies were detected in any of the cases, confirming the vibrational stability of the optimized nanostructures.
3.1.3. Geometries of Al32N32 Along One, Two, and Three Directions
The third category of the examined AlN NPs includes various geometries of the general form Al
32N
32. In particular, the examined nanostructures were formed after elongation of the initial cubic-like building block Al
4N
4 along one, two, and three directions, named as Al
32N
32-1D, Al
32N
32-2D, and Al
32N
32-3D, respectively. Also, the defective with a hole exotic NP of the same form, Al
32N
32, named as Al
32N
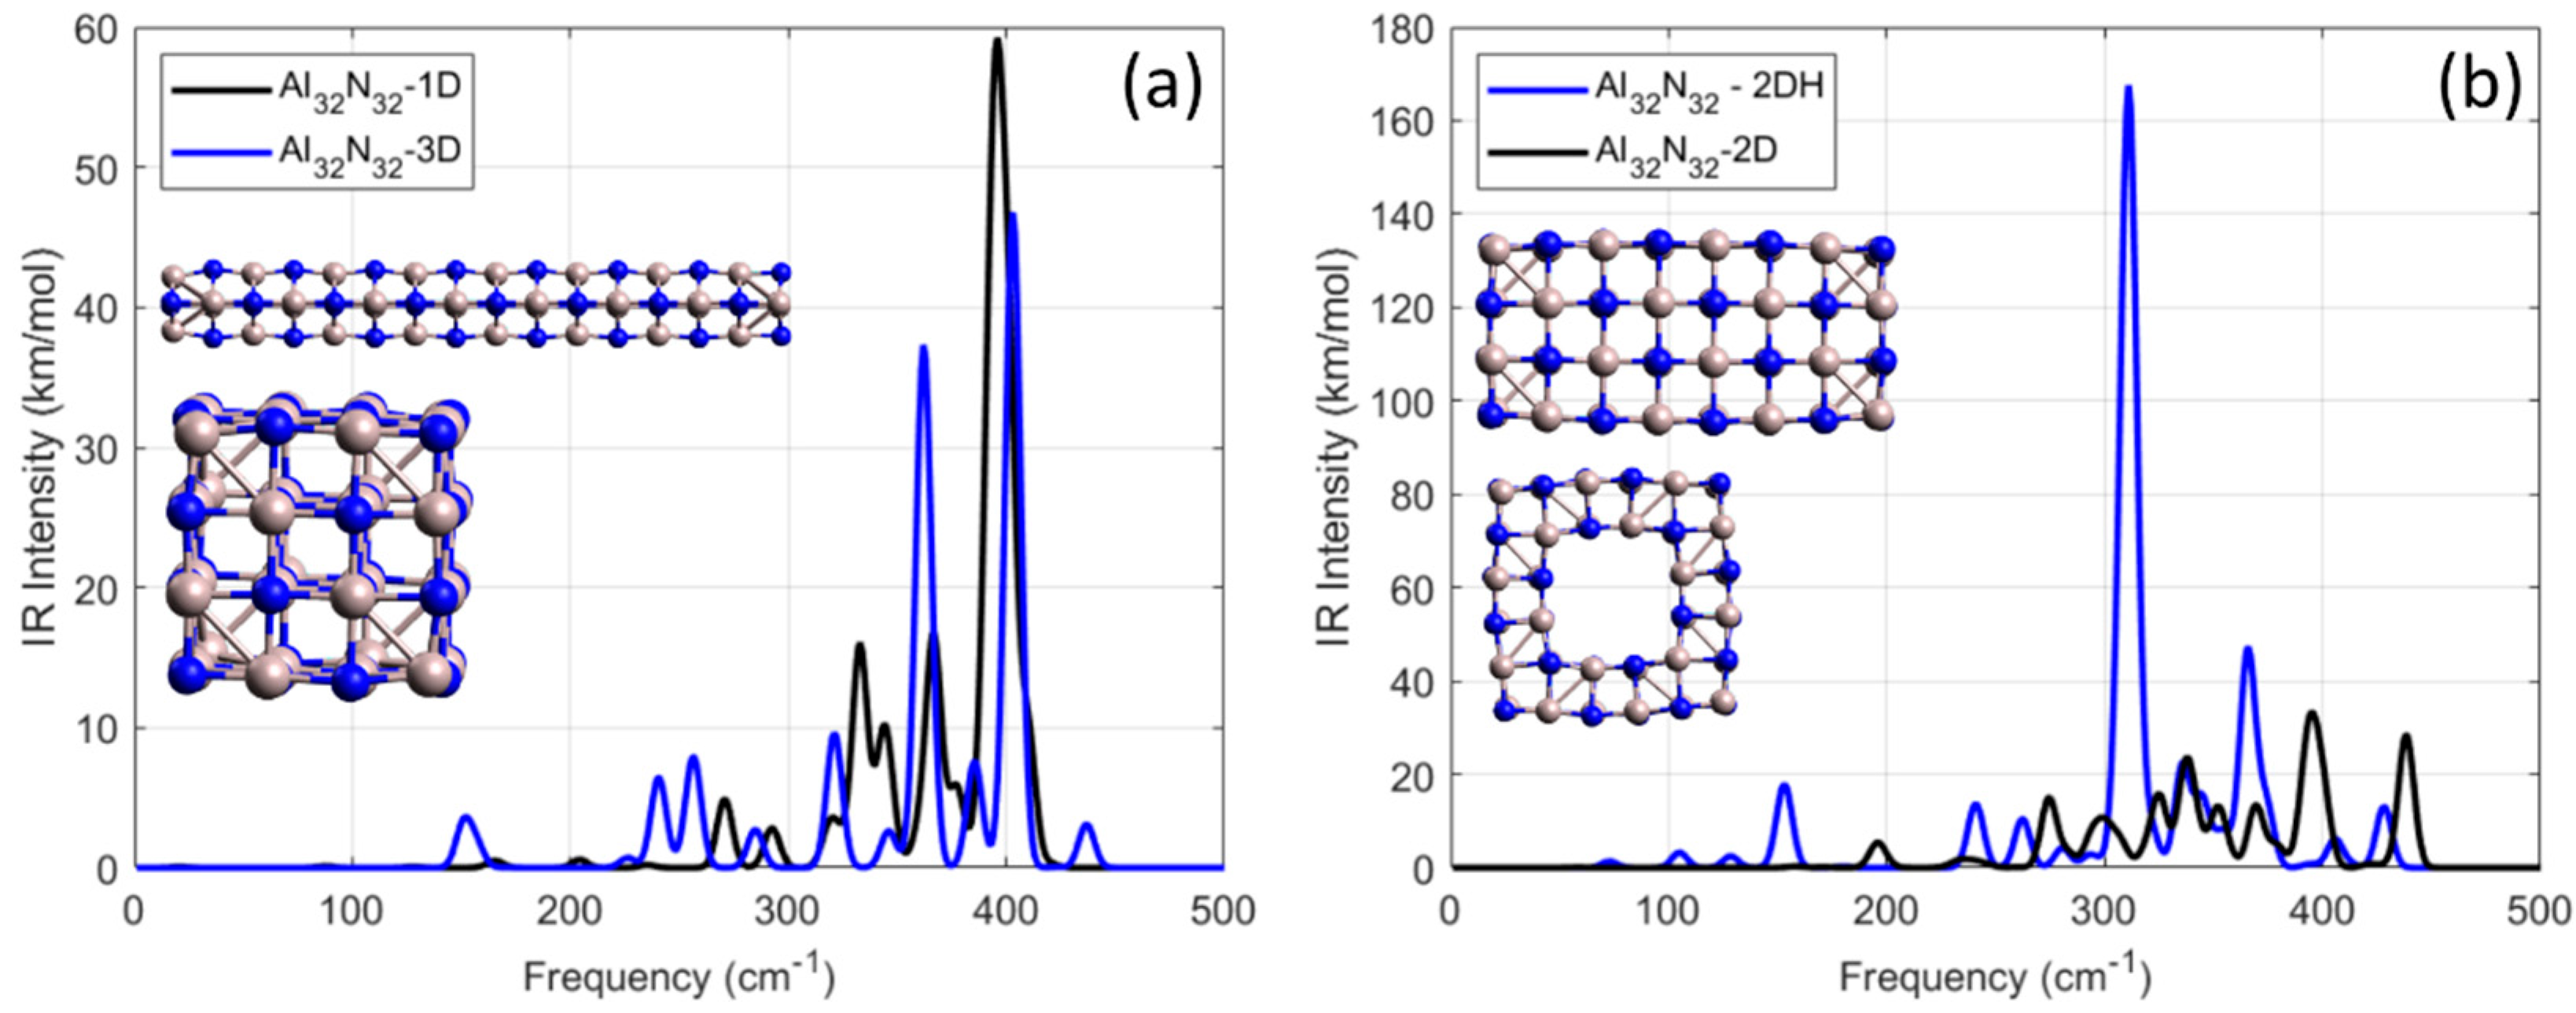
32-2DH was also examined. The vibrational spectra of these nanoparticles which were separated into two groups for better clearance are shown in
Figure 5, and their optimized geometries are shown as inset in each plot.
For the case of Al32N32, which was created after elongation of the original cubic Al4N4 building block along two vertical directions, the four strongest resonance frequencies were calculated at 394, 438, 337, and 325 cm−1 with corresponding IR-intensity values of 34, 28, 23, and 15 km/mol. For the case of Al32N32-1D, the strongest resonance was calculated at 396 cm−1 with an IR-intensity value of 59 km/mol, almost three times smaller than the strongest frequency resonance of defected Al32N32-2DH, which was calculated at 311 cm−1 with an IR-intensity value of 168 km/mol. In addition, the frequencies at which the resonance peaks from the defected Al32N32–2DH occur were within a range between 152 and 428 cm−1. In conclusion, as structural dimensionality increases, the number of IR-active modes grows, but the maximum IR-intensity peaks were calculated for the 2D system, suggesting an optimal balance between symmetry and vibrational delocalization. All structures were dynamically stable, with no imaginary frequencies observed.
3.1.4. Geometries of Al36N36 and Al40N40
The fourth category of AlN NPs which was examined in this work included geometries of Al
xN
x, where x = 36 and x = 40. The IR spectra of these studied nanostructures, named as Al
36N
36 and Al
40N
40, respectively, are shown in
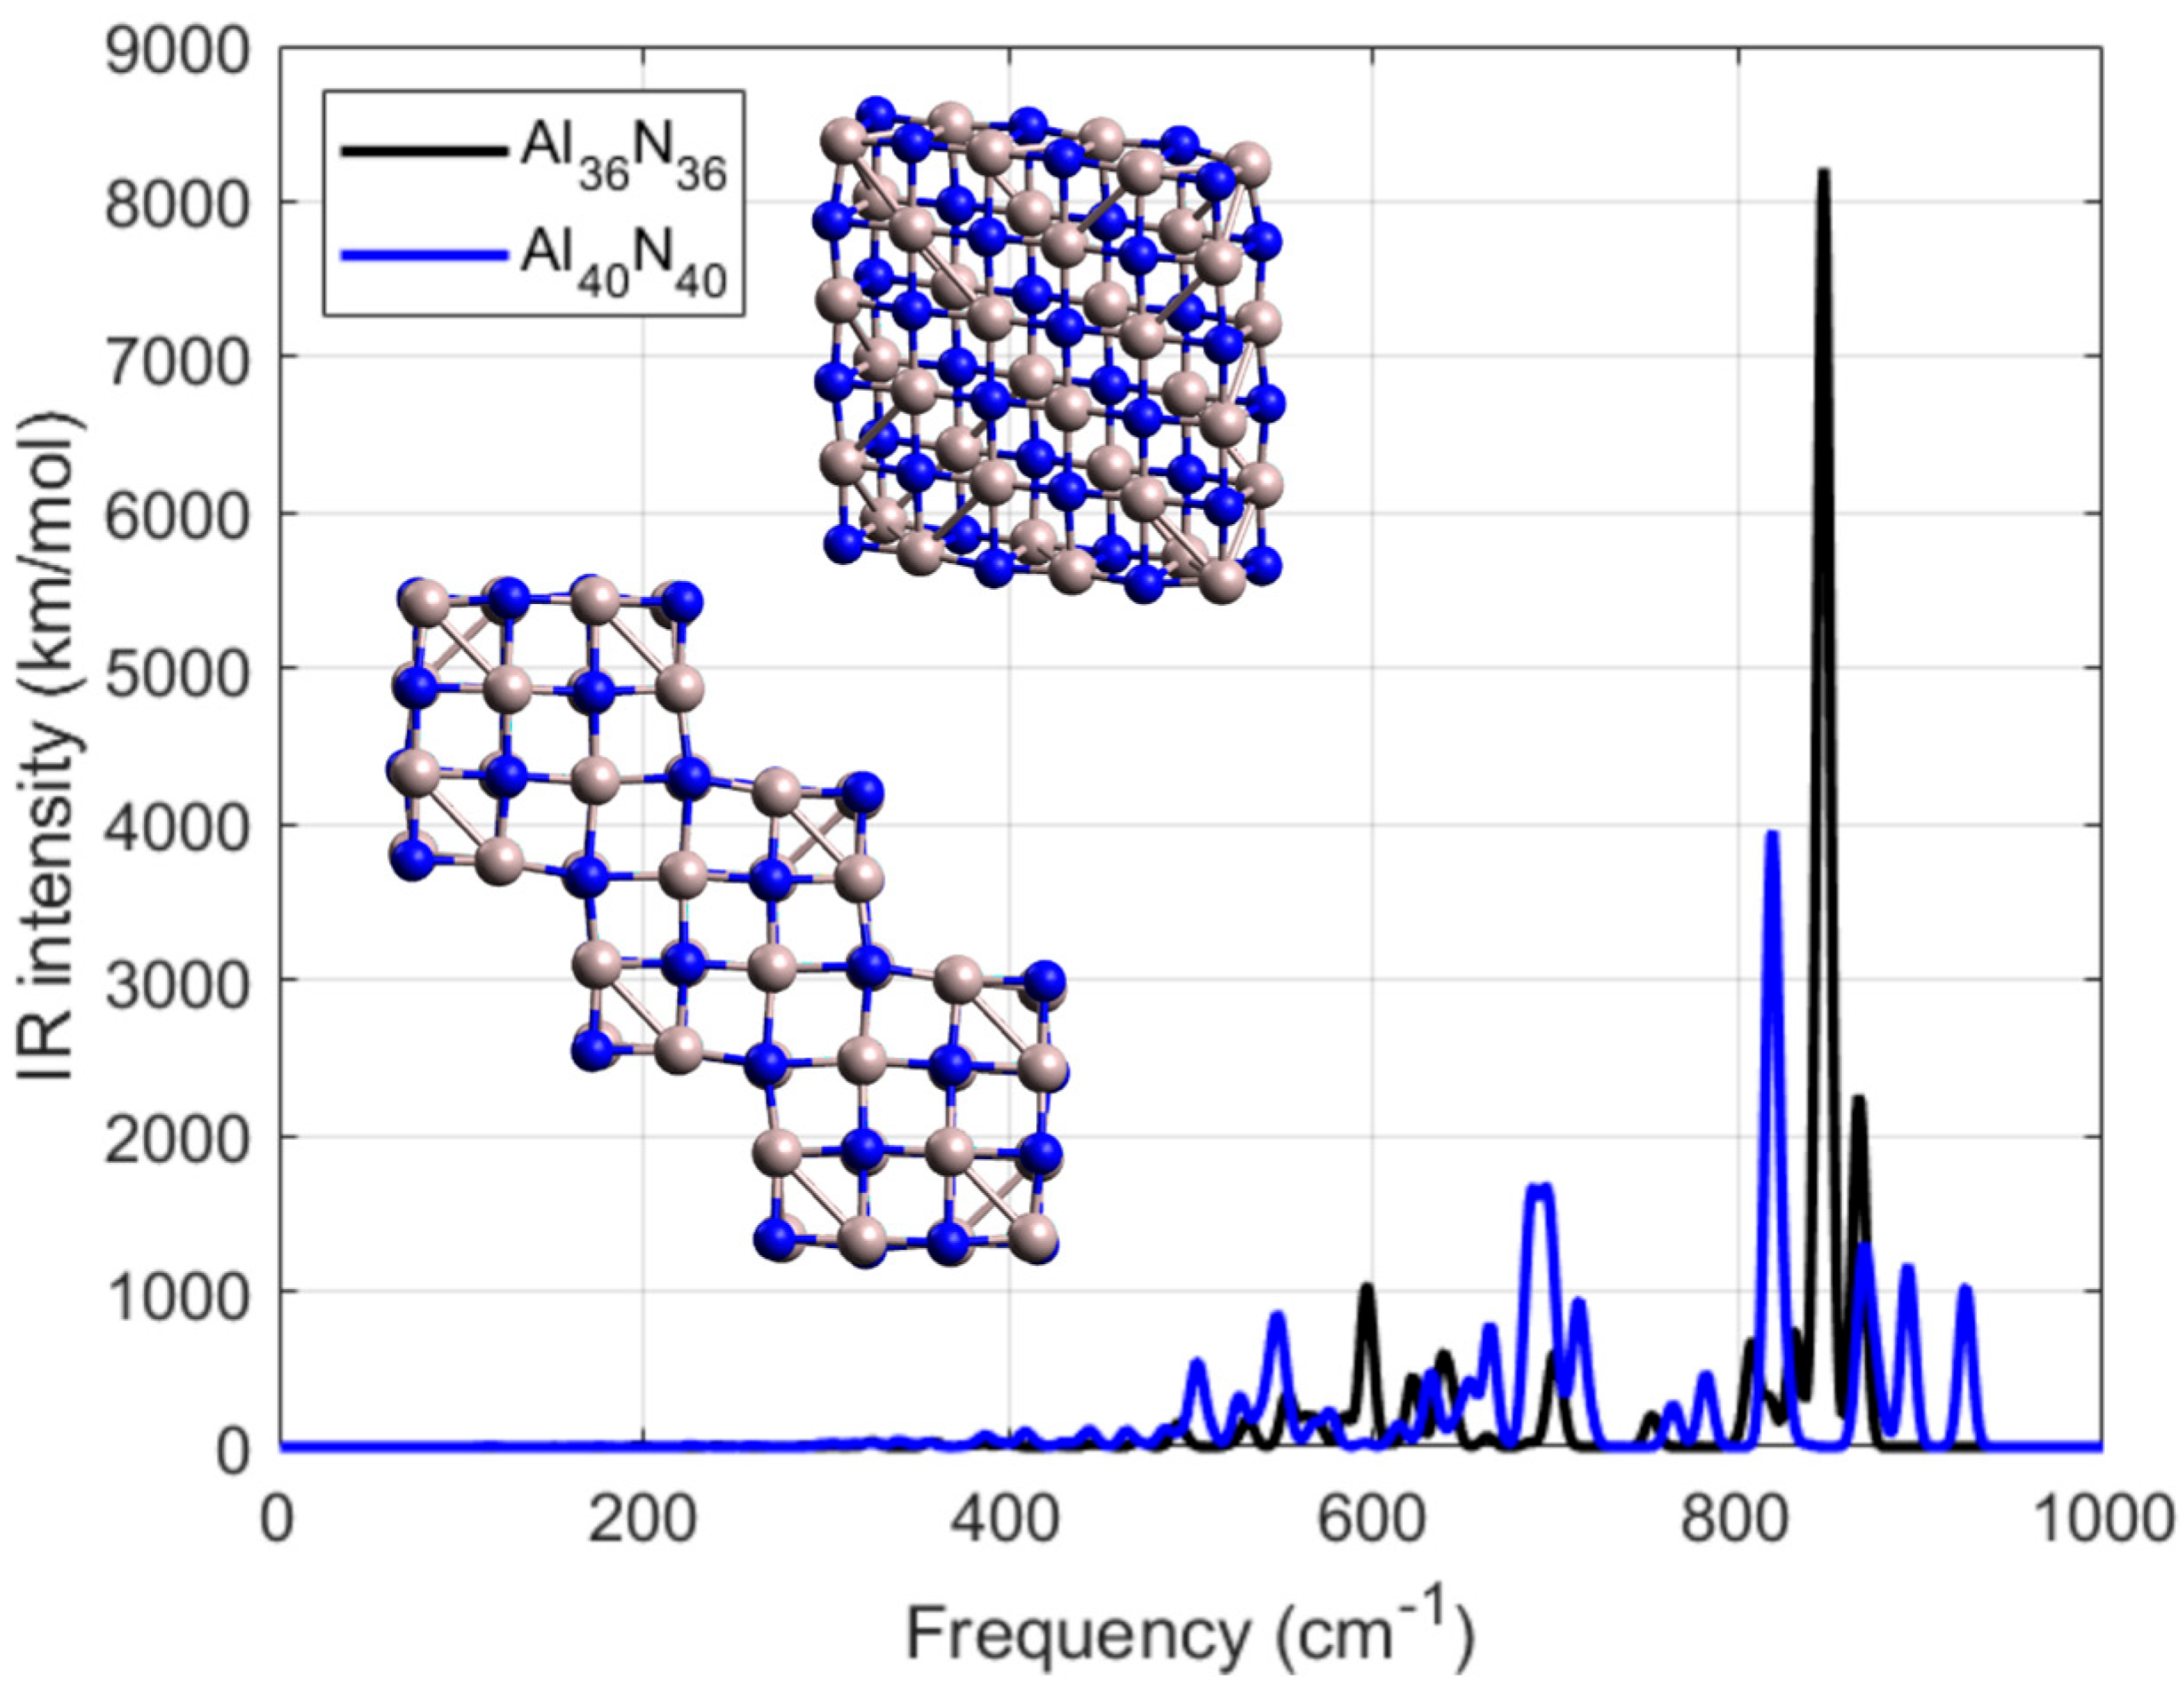
Figure 6. In the same figure their geometries are also presented as inset. Both NPs were created from the same initial cubic-like building block Al
4N
4 and were extended along two perpendicular directions. It must be noted that the absorbance spectrum was not calculated due to its high computational time and relevantly high computational resources. Our study regarding the absorbance spectrum was limited according to the affordable computational resources to the previous category of examined structures where x = 16.
The Al
36N
36 NP, which is presented with the black line in
Figure 6, shows a strong vibrational mode for frequency 596 cm
−1 with 1029 km/mol. Close to this mode, there was another one with frequency 638 cm
−1 with 596 km/mol. Another couple of resonances were found for frequencies 622 cm
−1 and 552 cm
−1 with relevant IR-intensity values 442 km/mol and 328 km/mol, respectively. In contrast, Al
40N
40 shows significantly stronger and sharper IR features, with a dominant peak at 694 cm
−1 reaching an intensity of 1671 km/mol—about 0.5 times stronger than the highest peak of Al
36N
36. Furthermore, Al
40N
40 displayed strong resonances at 503 cm
−1 with 541 km/mol, at 547 cm
−1 with 850 km/mol, and 664 cm
−1 with 753 km/mol. In the higher-frequency region between 700 and 1000 cm
−1, both nanostructures display pronounced IR-active resonances. For Al
36N
36, a dominant sharp mode appears at 847 cm
−1 with an intensity of 8212 km/mol, clearly exceeding the intensity of its lower-frequency features. In contrast, Al
40N
40 shows a broader distribution of resonances in the same spectral window, with characteristic peaks at 695 cm
−1 (1167 km/mol) and 819 cm
−1 (3957 km/mol). These high-frequency modes are mainly attributed to Al–N stretching vibrations and their stronger manifestation in Al
36N
36 highlights the dependence of vibrational sharpness on cluster geometry. When compared with the lower-frequency domain, the spectral evolution in this region confirms that increasing nanoparticle size enhances the number of active modes while modulating the intensity profile, leading to a richer and more complex vibrational response. These findings indicate that increasing the size of the nanoparticle not only enhances the number of vibrational modes but also amplifies the IR activity, which could be advantageous for applications requiring high IR responsiveness, such as sensing or optothermal modulation. Overall, the comparative analysis highlights the structural and spectroscopic evolution from Al
36N
36 to Al
40N
40 and confirms the correlation between atomic complexity and vibrational spectrum.
3.2. Stability and Binding Energy
To quantitatively evaluate the energetic stability of the optimized Al
xN
x NPs, the binding energy (BE) per formula unit (f.u.) was calculated using both self-consistent field (SCF) energies and zero-point vibrational energy (ZPE)-corrected values. It should be noted that the binding energies reported here are referenced to isolated Al and N atoms to ensure internal consistency among different cluster geometries. While this convention may overestimate absolute cohesive values, it accurately reflects relative stability trends across the studied Al
xN
x nanoparticles. A comparison with molecular Al–N references was also performed and yielded smaller absolute magnitudes but similar formation energy trends, confirming that stability increases with cluster size and dimensionality before reaching a near-saturation regime beyond Al
16N
16. The binding energy was calculated using the following formula:
where the index x indicates each examined formula of the structure (formula unit), E(Al) is the energy of isolated atoms of Al, E(N) is the energy of isolated atoms of N, and E(Al
xN
x) is the total energy of the NP. The BE per f.u., (E
b), is thus given by the following relation:
As shown in
Table 2, the binding energy per formula unit (BE/f.u.) and the ZPE-corrected BE/f.u. exhibit consistent trends across the entire set of Al
xN
x nanostructures. The BE/f.u. increases significantly from 7.38 eV for the smallest system, Al
4N
4, to values ranging between 9.39 eV and 9.89 eV for mid- to large-sized systems. In more detail, 9.39 eV for Al
16N
16, 9.89 eV for Al
32N
32–2D, and 9.86 eV for Al
36N
36 NPs. This sharp initial rise highlights the thermodynamic advantage of assembling larger clusters, where more Al–N bonds per formula unit contribute to the overall stability. After Al
16N
16, the BE/f.u. values plateau, with only subtle variations across different geometric arrangements and dimensionalities. Among the exotic Al
16N
16 NPs, the nanostructures with more compact or symmetric geometries (e.g., Al
16N
16-S3, Al
16N
16-S) tend to exhibit slightly higher BE/f.u., suggesting more favorable local bonding environments. Similarly, in the Al
32N
32 series, the 2D structure yields the highest BE/f.u., reinforcing the energetic preference for planar growth in this size regime. While the BE/f.u. for Al
40N
40 appears slightly reduced compared to Al
36N
36, this deviation is likely due to surface relaxation effects and geometric strain in the extended framework. ZPE corrections uniformly reduce the BE/f.u. values by approximately 0.14–0.20 eV per formula unit, with the largest relative impact observed for smaller systems such as Al
4N
4 and Al
8N
8. Despite this reduction, the ordering of structural stability remains consistent, confirming the robustness of the energetic landscape. The proximity of the corrected and uncorrected values supports the validity of using BE/f.u. without ZPE in large-scale screenings where computational efficiency is critical.
Τhe evolution of the HOMO–LUMO gap across the studied nanoparticles depends not only on particle size but also strongly on dimensionality and geometry. While an overall stabilization trend is observed with increasing cluster size, specific configurations such as the 1D Al32N32 nanorod exhibit a slight gap reduction (1.23 → 1.15 eV) due to enhanced orbital delocalization and reduced quantum confinement along the elongated axis. This indicates that electronic structure modulation in AlxNx clusters arises from a combination of size and symmetry effects. Ιt should be noted that the HOMO–LUMO gaps reported here represent a molecular-level electronic separations characteristic of finite AlxNx clusters rather than bulk semiconductor band gaps. Their smaller values compared to the ~6 eV band gap of bulk AlN originate from quantum confinement and surface-state effects, where unsaturated Al–N bonds and surface polarization introduce localized states that narrow the effective gap. A more quantitative description would require quasiparticle corrections (e.g., ΔSCF- Delta-Self-Consistent-Field or GW methods), which are beyond the present scope but planned for future benchmarking studies. Specifically, HL gaps of 0.63 eV, 1.11 eV, and 1.23 eV were calculated for Al4N4, Al8N8, and Al16N16-1D, respectively. Two-dimensional structures exhibit systematically higher HL gaps than their 1D, 3D, or exotic counterparts. For instance, the Al32N32-2D NP exhibits a HL gap of 1.85 eV, while the 3D variant of the same size shows a significantly lower value of 1.35 eV. Notably, the largest HL gaps were found in Al16N16-S3, Al16N16-S, and Al36N36, further confirming the stabilizing effects of optimized bonding and dimensionality. Overall, this combined analysis of BE/f.u. and HL gap elucidates the interplay between thermodynamic and electronic stability across different AlxNx nanostructures, providing valuable insights for their future application in optoelectronic and energy-related technologies.
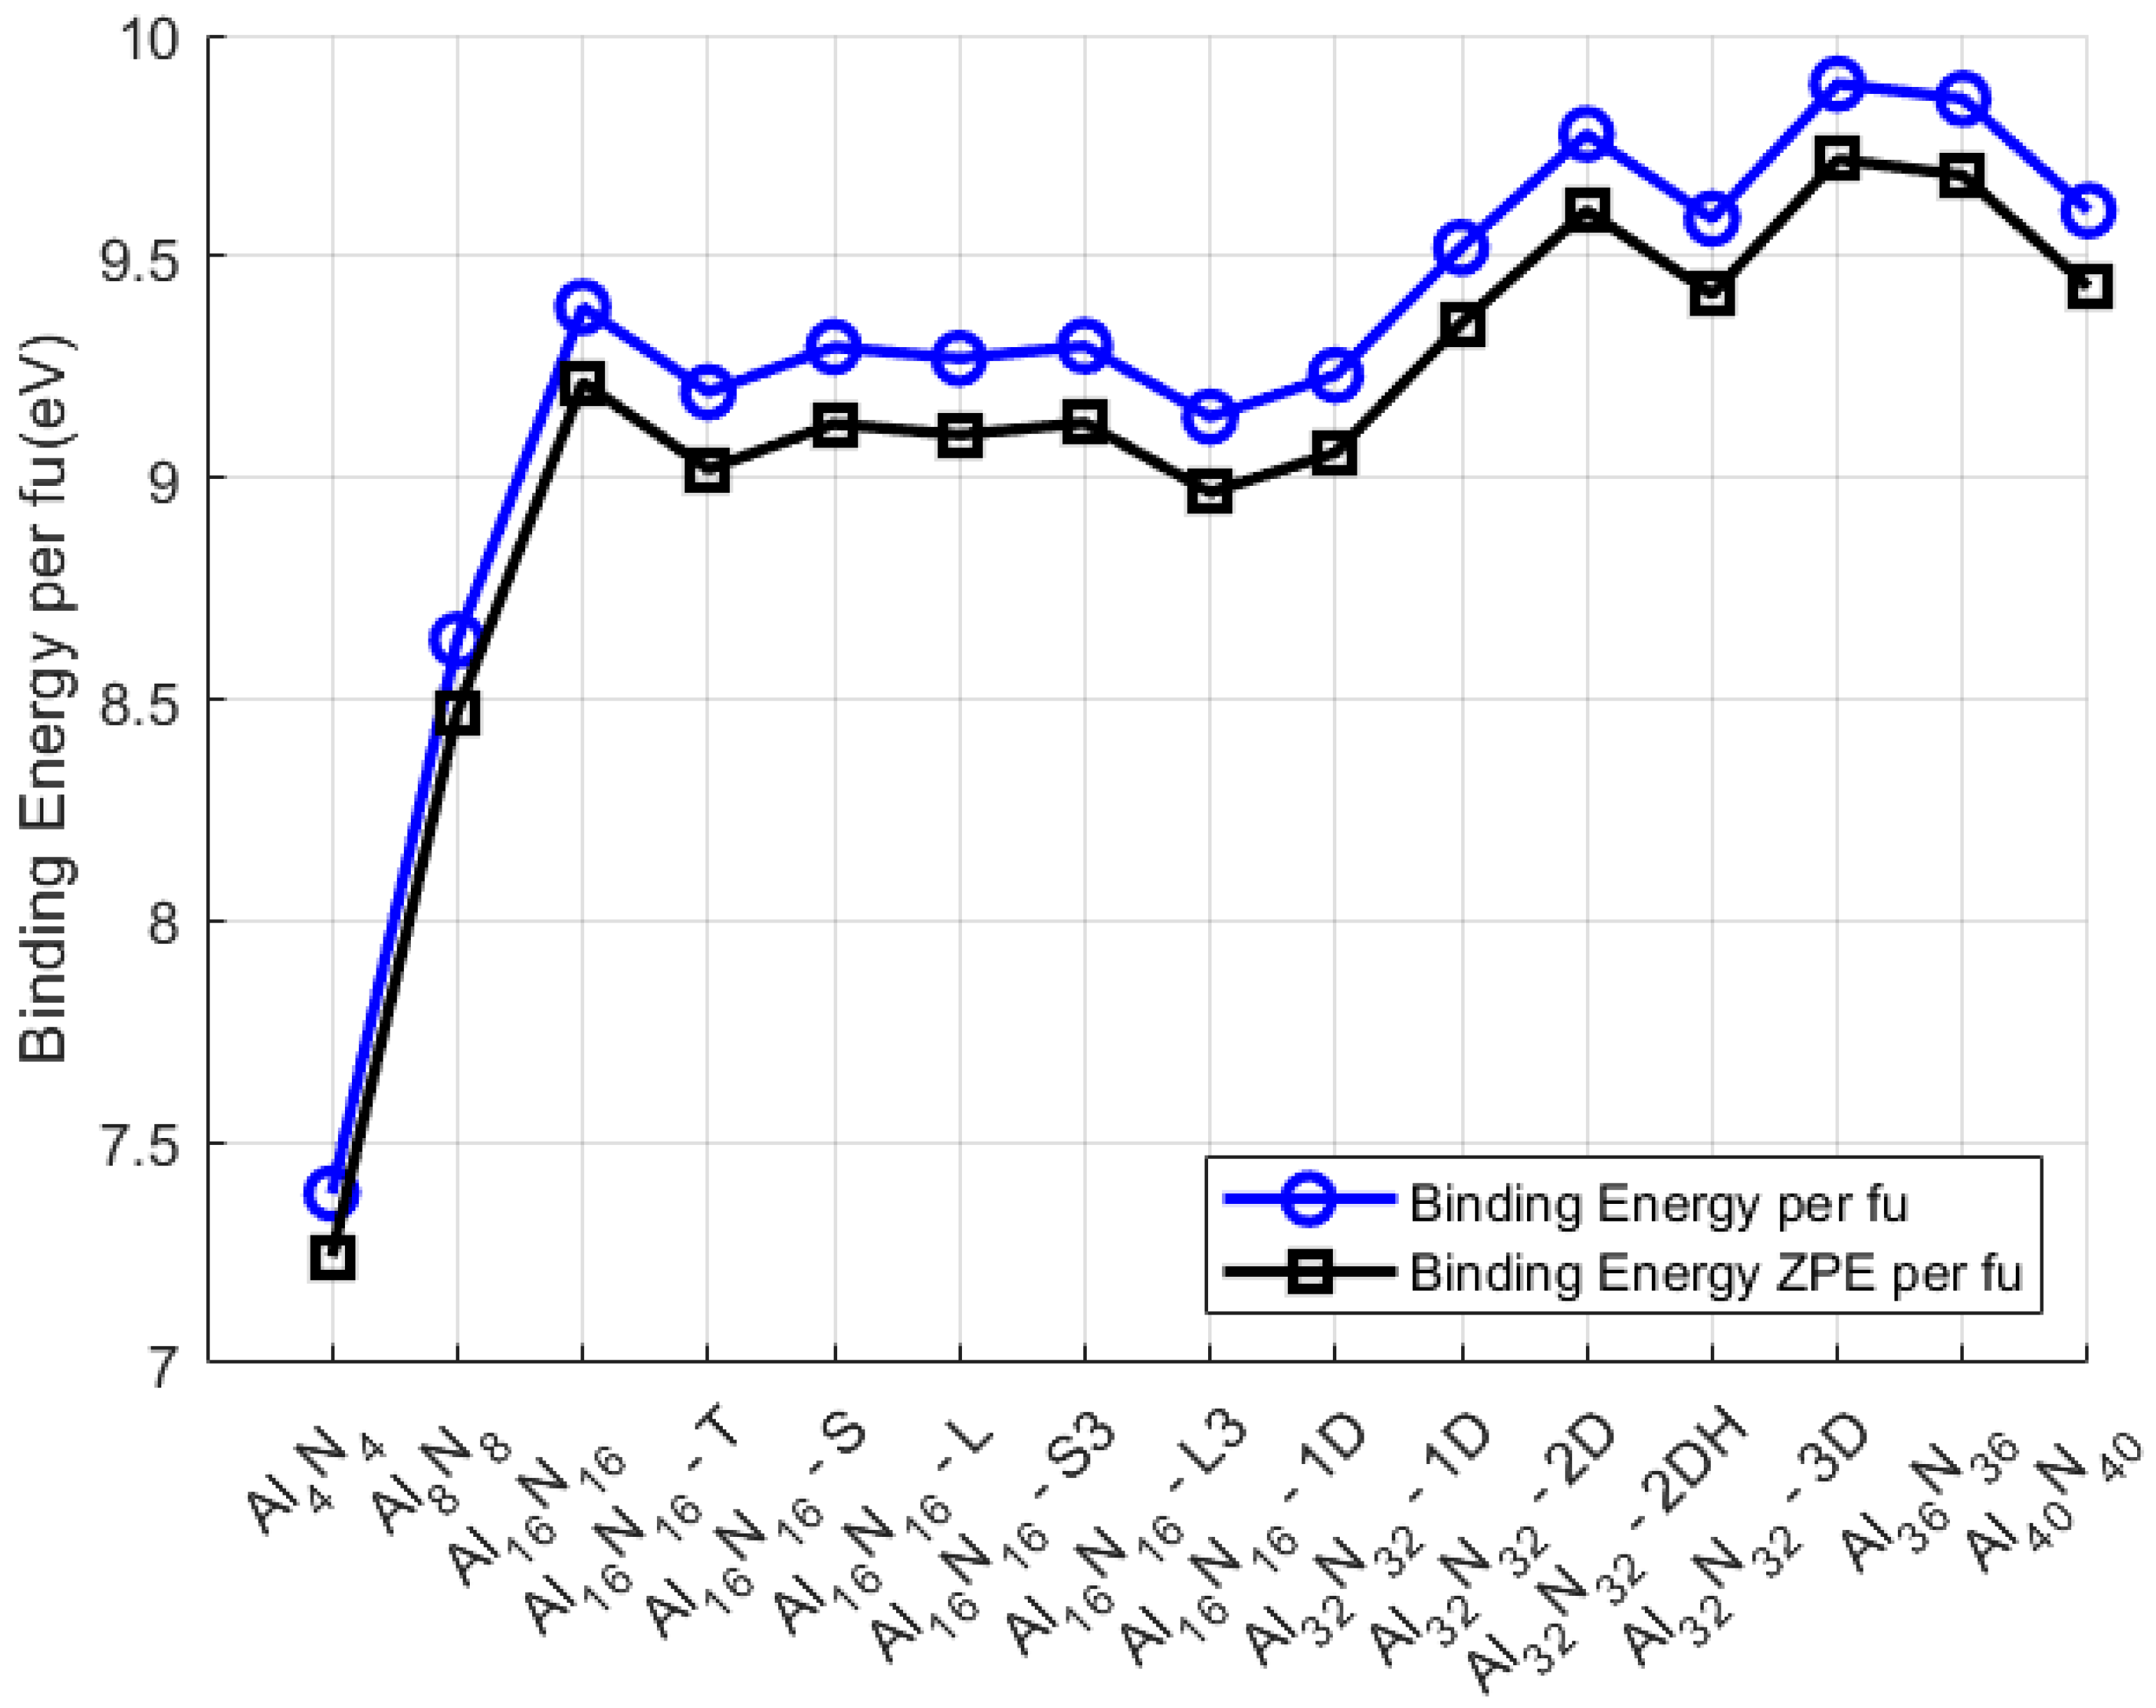
Figure 7 displays the binding energy per formula unit (BE/f.u.) for all examined Al
xN
x nanostructures, both with and without zero-point vibrational energy (ZPE) correction. A notable trend is observed: as the nanoparticle size increases, the BE/f.u. generally rises, with a plateau-like behavior forming beyond Al
16N
16, followed by a secondary upward shift around the Al
32N
32 series. This pattern reflects the increasing local bonding efficiency and stabilization as the systems grow in dimensional complexity and atom number. The steep initial increase in BE/f.u., from 7.38 eV for Al
4N
4 to 9.38 eV for Al
16N
16, suggests that the early growth stages significantly enhance thermodynamic stability. Beyond this point, the BE/f.u. values stabilize, indicating a saturation in the bonding contribution per formula unit—particularly evident in exotic Al
16N
16 NPs where dimensional elongation or shape changes do not drastically affect average bond energetics.
Nanostructures with 32 atoms per element show a second stability enhancement, peaking at 9.78 eV/f.u. for Al
32N
32-2D, which likely benefits from extended delocalization and optimized coordination environments. Interestingly, the BE/f.u. slightly decreases in the largest systems (Al
36N
36 and Al
40N
40), suggesting a minor energetic cost associated with further structural complexity or less efficient packing. For comparison, the optical properties of Sc
4N
4 nanoparticle [
33] exhibited a significantly higher binding energy per formula unit (10.45 eV) than the Al
4N
4 prototype examined here (7.38 eV), indicating stronger cohesive interactions in the Sc-based system. This difference of over 3 eV/f.u. reflects the more ionic character and robust Sc–N bonding, which also translated to higher excitation energies and blue-shifted absorption peaks. Such comparisons underscore the distinct bonding nature and optical response between early transition metal nitrides and main group III–V nanoclusters.
As expected, incorporating ZPE corrections results in a systematic downward shift of 0.14–0.20 eV/f.u., consistent across all nanostructures. While small in absolute magnitude, this correction is particularly relevant for low-mass systems, where vibrational contributions are proportionally more significant. Crucially, the parallel behavior between the SCF-derived and ZPE-corrected BE/f.u. trends validates the robustness of the energetic ordering and supports the use of uncorrected BE/f.u. values as reliable, fast stability indicators—especially in high-throughput or large-scale screenings. Overall, the per-formula-unit normalization offers a clearer comparison across different sized systems, highlighting how structural elongation and dimensionality influence intrinsic stability independently of total atom count.

