1. Introduction
The reactor safety protection system is a core facility in nuclear power plants, designed to ensure the safe operation of the reactor by preventing the release of radioactive substances and protecting personnel and the environment under abnormal conditions or accident scenarios [
1]. As the first physical barrier, the containment structure encloses the reactor core and critical systems, ensuring structural integrity and airtightness in the event of an accident [
2]. The pressure relief device regulates internal containment pressure and prevents structural damage due to overpressure [
3,
4]. Within this device, thermosensitive locking components play a crucial role.
The primary function of the thermosensitive locking device is achieved through brazed elements. Each brazed element consists of two brass plates joined by soft brazing using a Bi-based filler metal. Soft brazing refers to a joining method that employs filler metals with a melting point not exceeding a specified temperature [
5]. The joint is formed by heating to a temperature lower than the melting point of the base material but higher than that of the filler metal, allowing the filler to spread over tightly fitted joint surfaces through capillary action or over the workpiece surface via wetting, with moderate mechanical strength [
6,
7]. When the temperature exceeds the filler’s melting point, the brazed joint fails in a controlled manner, opening a passage between the interior and exterior of the device. Under normal operating conditions, the brazed joint is subjected to tensile loading, and the temperature remains below the melting point of the filler. However, local over-temperature inside the containment can induce creep deformation in the joint, eventually leading to failure.
Localized over-temperature can impose multiple adverse effects on critical components of nuclear safety systems [
8]. First, thermally sensitive electromechanical devices—such as sensors, control rod drive mechanisms, and valves—may experience reduced performance or slowed response under localized high-temperature conditions, and may even fail, thereby diminishing the system’s control capability during abnormal operating scenarios. Second, critical shielding and cooling structures such as the containment and piping may undergo local expansion or stress concentration under over-temperature, increasing the risk of structural damage. In addition, elevated local temperatures may accelerate hydrogen generation or lead to catalyst degradation, thereby increasing the likelihood of hazardous chemical reactions. Yang et al. investigated the causes of over-temperature in wind power converters, identifying high ambient temperatures, insufficient ventilation, and increased thermal resistance as the main contributing factors, and proposed corresponding mitigation strategies [
9]. Meng et al. designed an alarm system to address over-temperature issues during cold-chain transportation [
10]. Zhang et al. analyzed the failure of the TP347H superheater section and found that staged over-temperature facilitated the formation of creep cracks on the heating surfaces of boilers, leading to damage [
11]. Gao et al. proposed a high-performance computing approach—based on theories, methods, and technologies utilizing supercomputers for parallel computation—to address over-temperature in high-temperature heating surfaces of large coal-fired power plant boilers, enabling intelligent over-temperature monitoring and structural optimization [
12].
Numerous studies have focused on data-driven approaches for creep life prediction. Yang et al. proposed a novel Uncertainty Prediction Model (UPM) incorporating formal uncertainty quantification. Validation results demonstrated that the model not only achieves high predictive accuracy but also explicitly captures uncertainties arising from both model formulation and experimental measurements [
13]. Ding et al. developed creep models for high-modulus polyethylene using machine-learning techniques in parallel with traditional empirical formulations, and reported that the machine-learning-based model provides a markedly improved representation of the material’s creep behavior [
14]. Andre et al. established a microstructure-sensitive constitutive framework to characterize the mechanical response of P91 steel subjected to extreme thermomechanical conditions, and implemented the model within a finite-element setting to enable simulations at engineering scales [
15].
For metallic structural components and welded or brazed joints, elevated temperatures accelerate creep and fatigue damage, leading to reduced yield strength and diminished ductility, which may result in permanent deformation or fracture [
16,
17,
18]. However, existing research lacks analyses of creep damage behavior in lap-type structures such as brazed elements, and there is a shortage of systematic management approaches addressing the effects of staged over-temperature on internal structures in nuclear safety systems. In this work, a systematic management framework is proposed for brazed elements in nuclear power systems subjected to intermittent over-temperature. A comprehensive management system for brazed components is developed, integrating screening, monitoring, analysis, and regulation. After acquiring temperature monitoring data, the system combines information from material databases, structural parameters of the brazed elements, and their preset installation force to accurately predict the creep life of each component. Elements approaching the end of their remaining creep life are identified and flagged for early replacement, thereby safeguarding the internal structures of the containment system.
2. System Setup
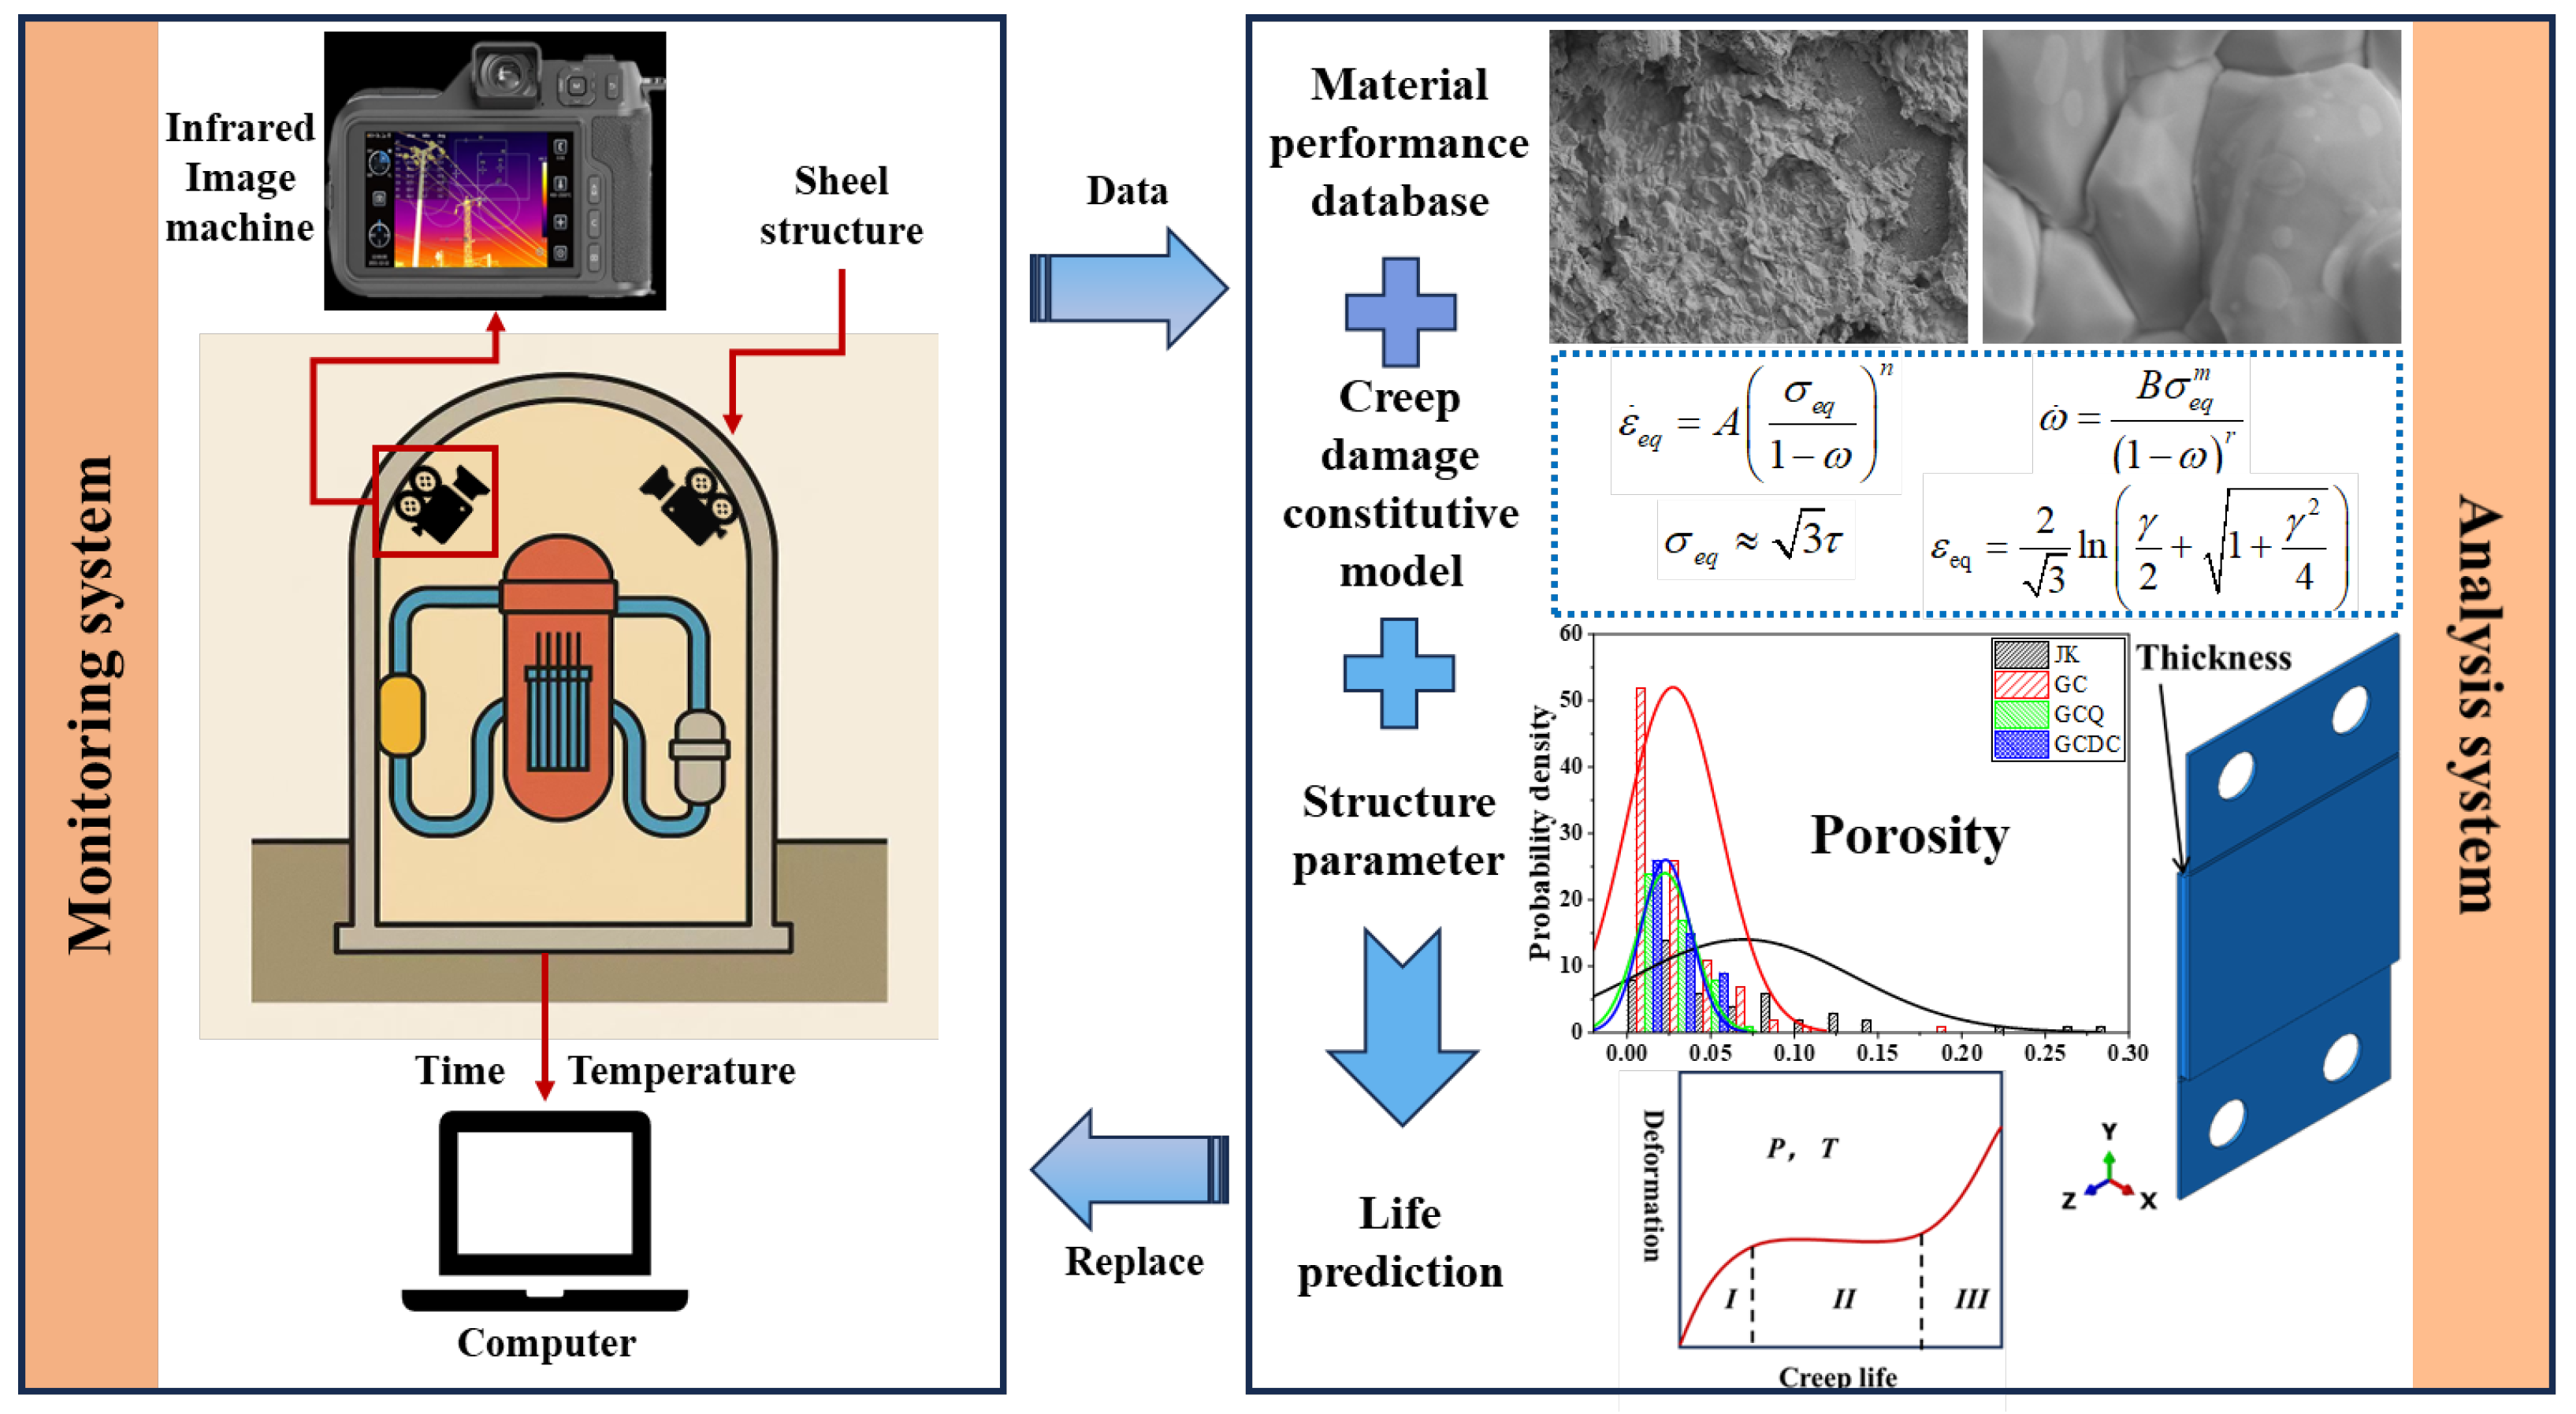
The system shown in
Figure 1 is a quality assessment and life prediction tool designed for internal components of containment structures, particularly those within large enclosed systems such as nuclear power plants. Its operating mechanism consists of two subsystems: a monitoring subsystem and an analysis subsystem. The monitoring subsystem uses fixed or mobile infrared thermography to continuously collect temperature–time series data of internal structural components, generating thermal field information for each monitoring point and extracting temporal features such as hotspot evolution and temperature variation rates. These data are transmitted via computer to the analysis subsystem. The analysis subsystem comprises a materials database, damage constitutive models, creep models, and a structural parameter sensitivity analysis module. Based on real-time monitoring data and physical modeling, it can automatically determine the health status, remaining service life, and failure risk level of the components. By integrating advanced algorithms and material libraries, and combining microstructural evidence with macroscopic mechanical properties, the system establishes an adaptive analytical framework that ensures the accuracy and reliability of the prediction results. For long-term service, the system continuously monitors the real-time temperature of the components and is equipped with two independent power-supply units to prevent unexpected power outages. Two sets of infrared cameras are deployed to monitor the same region, eliminating the influence of accidental factors. In addition, the infrared optical components are gradually replaced before reaching the end of their service life.
Within the analysis system, the core modules first utilize the materials database to calibrate the temperature and stress–strain states of the components, thereby deriving the evolution of thermal stresses and damage. By integrating creep damage constitutive equations, the system can compute the progression of damage in service in real time and subsequently provide predictions of the remaining service life. Through comparison of geometric parameters and operating conditions for each component, the system evaluates the impact of different structural optimization schemes on service life, assisting users in making timely decisions regarding component replacement and maintenance within limited overhaul windows. In addition, the system features a reliability analysis function. Using population-based statistical methods, it performs distributed evaluations of component lifetimes and outputs expected service life, risk levels, and detailed replacement recommendations. This fully automated process of analysis and decision support ensures high efficiency and safety in component management.
3. Methodologies
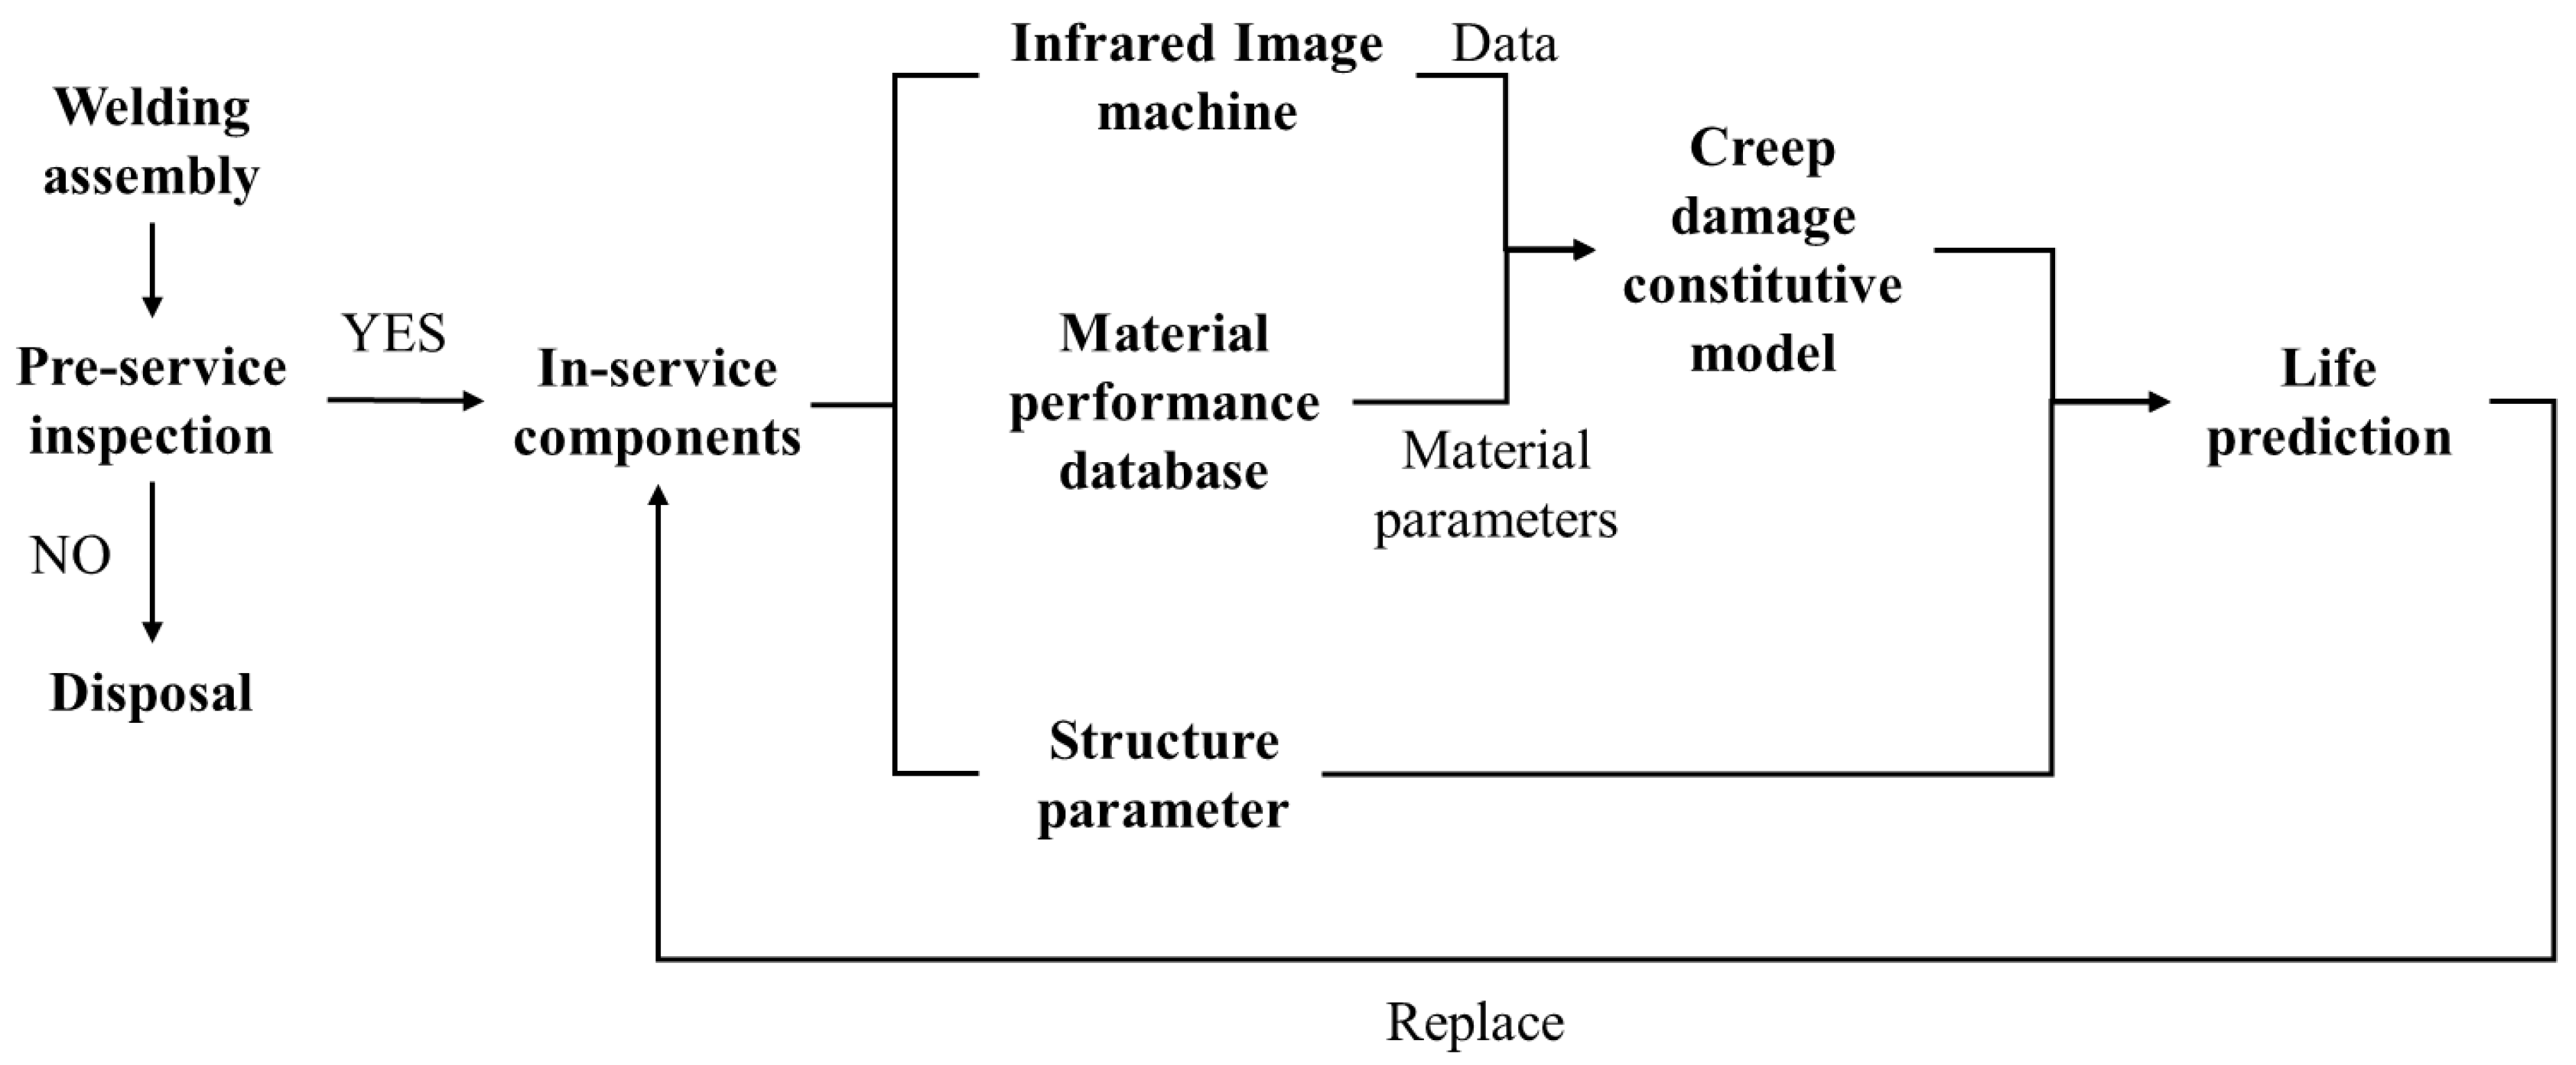
Frequent failures of the brazed structures within the shell severely compromise the structural safety. To address this challenge, we propose a monitoring and management system that integrates screening, monitoring, analysis, and management functions. This system is of great significance for the safety management of internal shell structures. The research framework of this system is illustrated in
Figure 2. First, starting from material properties, appropriate research methods are designed and implemented. This includes specimen preparation, the establishment of experimental protocols and testing procedures, as well as the standardization of data processing and analysis workflows. Through these steps, relevant material parameters are obtained to support subsequent specimen analysis. Next, an infrared camera is used to collect the linear relationship between operating temperature and time for components under actual service conditions. The operating duration of components across different temperature ranges is then statistically evaluated and incorporated into constitutive models for calculation. Considering the influence of structural parameters on creep life, the pore fraction and brazing-layer thickness of the structure are treated using confidence intervals to predict the creep life of the components. Finally, based on the derived service life of the structure, continuous monitoring or timely replacement strategies are implemented accordingly.
3.1. Material Performance Database
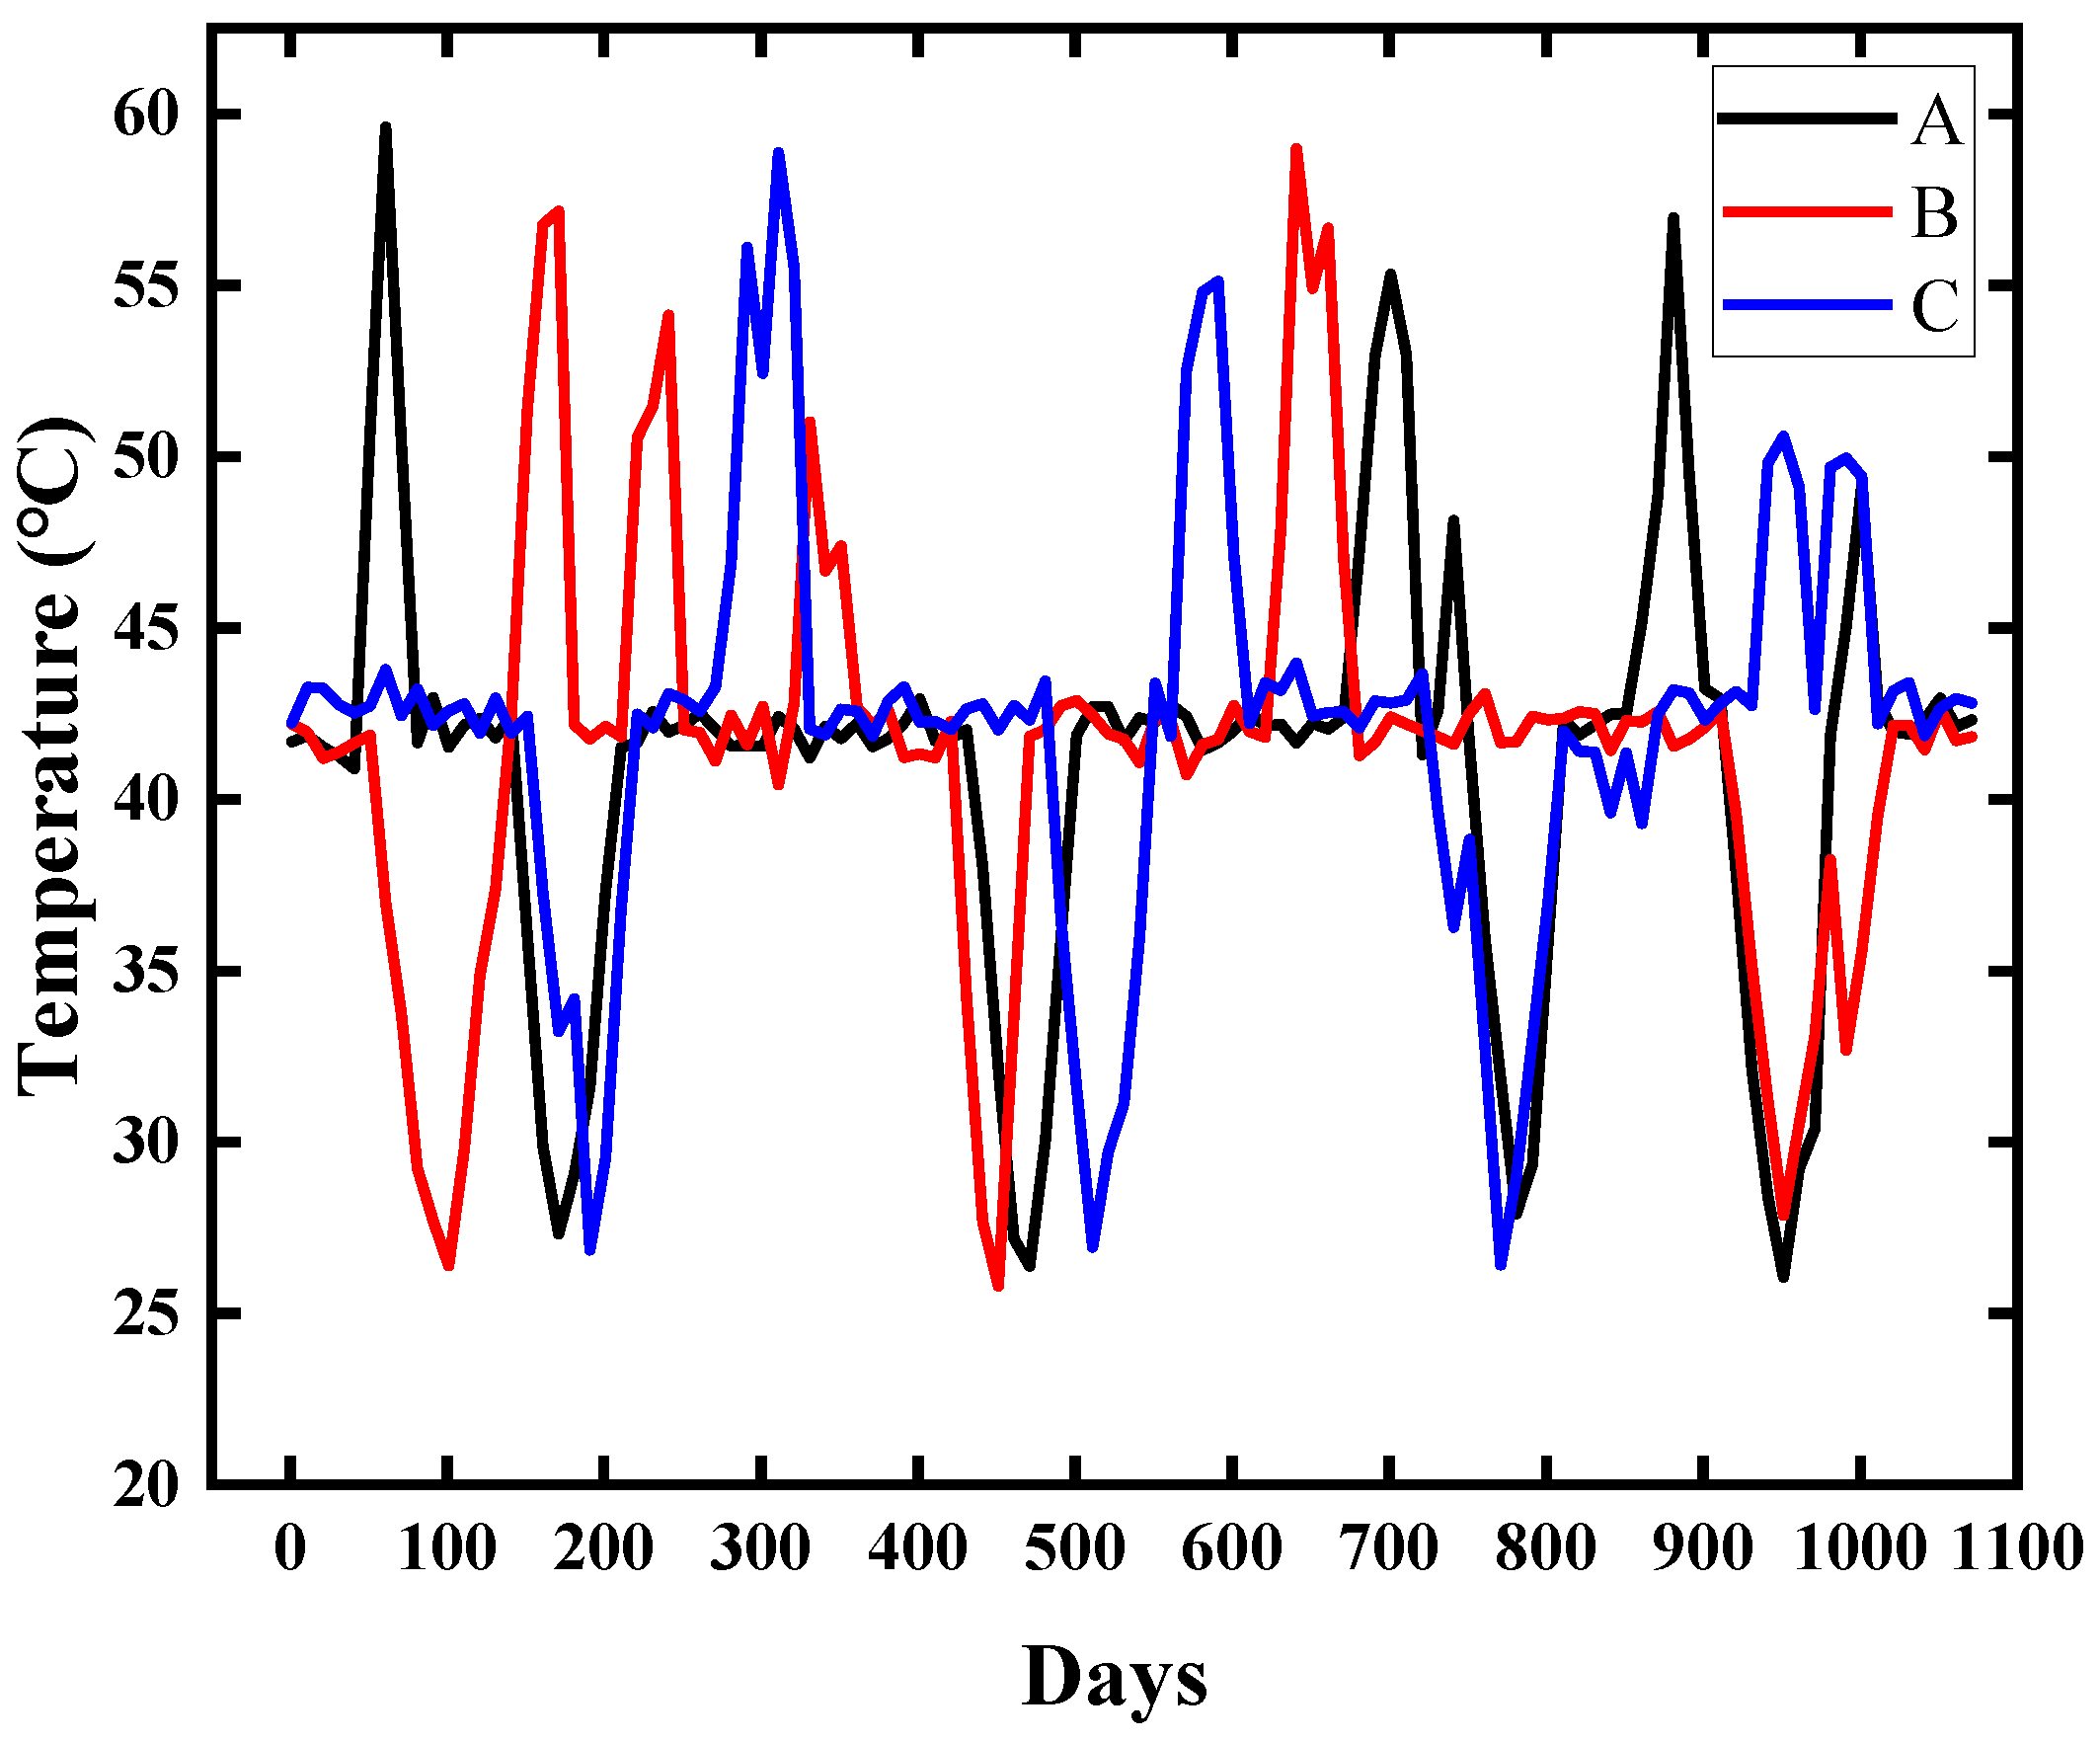
The internal environmental temperatures of different regions within the containment were recorded using infrared cameras installed inside the structure.
Figure 3 presents monitoring data of the ambient temperatures corresponding to components located in three distinct regions. The data indicate that the temperature is predominantly and stably distributed within the range of 40–45 °C, demonstrating a high degree of thermal stability. This aligns with the characteristic operational state of nuclear power units, in which the coolant and surrounding structures maintain a steady thermal condition over long-term operation. Daily temperature fluctuations are mainly confined within ±1 °C, suggesting that random disturbances have a limited impact on the overall thermal equilibrium and that no significant seasonal variations are present. Meanwhile, several gradual cooling and reheating processes are observed in the data, with the lowest temperatures reaching approximately 25 °C and typically lasting for 1–2 weeks. These events are presumed to be associated with scheduled shutdowns for maintenance. In addition, short-term temperature peaks were recorded during operation, with maximum values approaching 60 °C. Such events are of brief duration and are likely caused by load increases or operational adjustments. Overall, the operating temperature of the components remains within a relatively high working range for extended periods, with limited amplitude of random fluctuations. Only during maintenance or load regulation does the temperature exhibit gradual decline or rise. These data provide rational boundary conditions for the development of subsequent experimental protocols, as well as for service life prediction and structural reliability assessment.
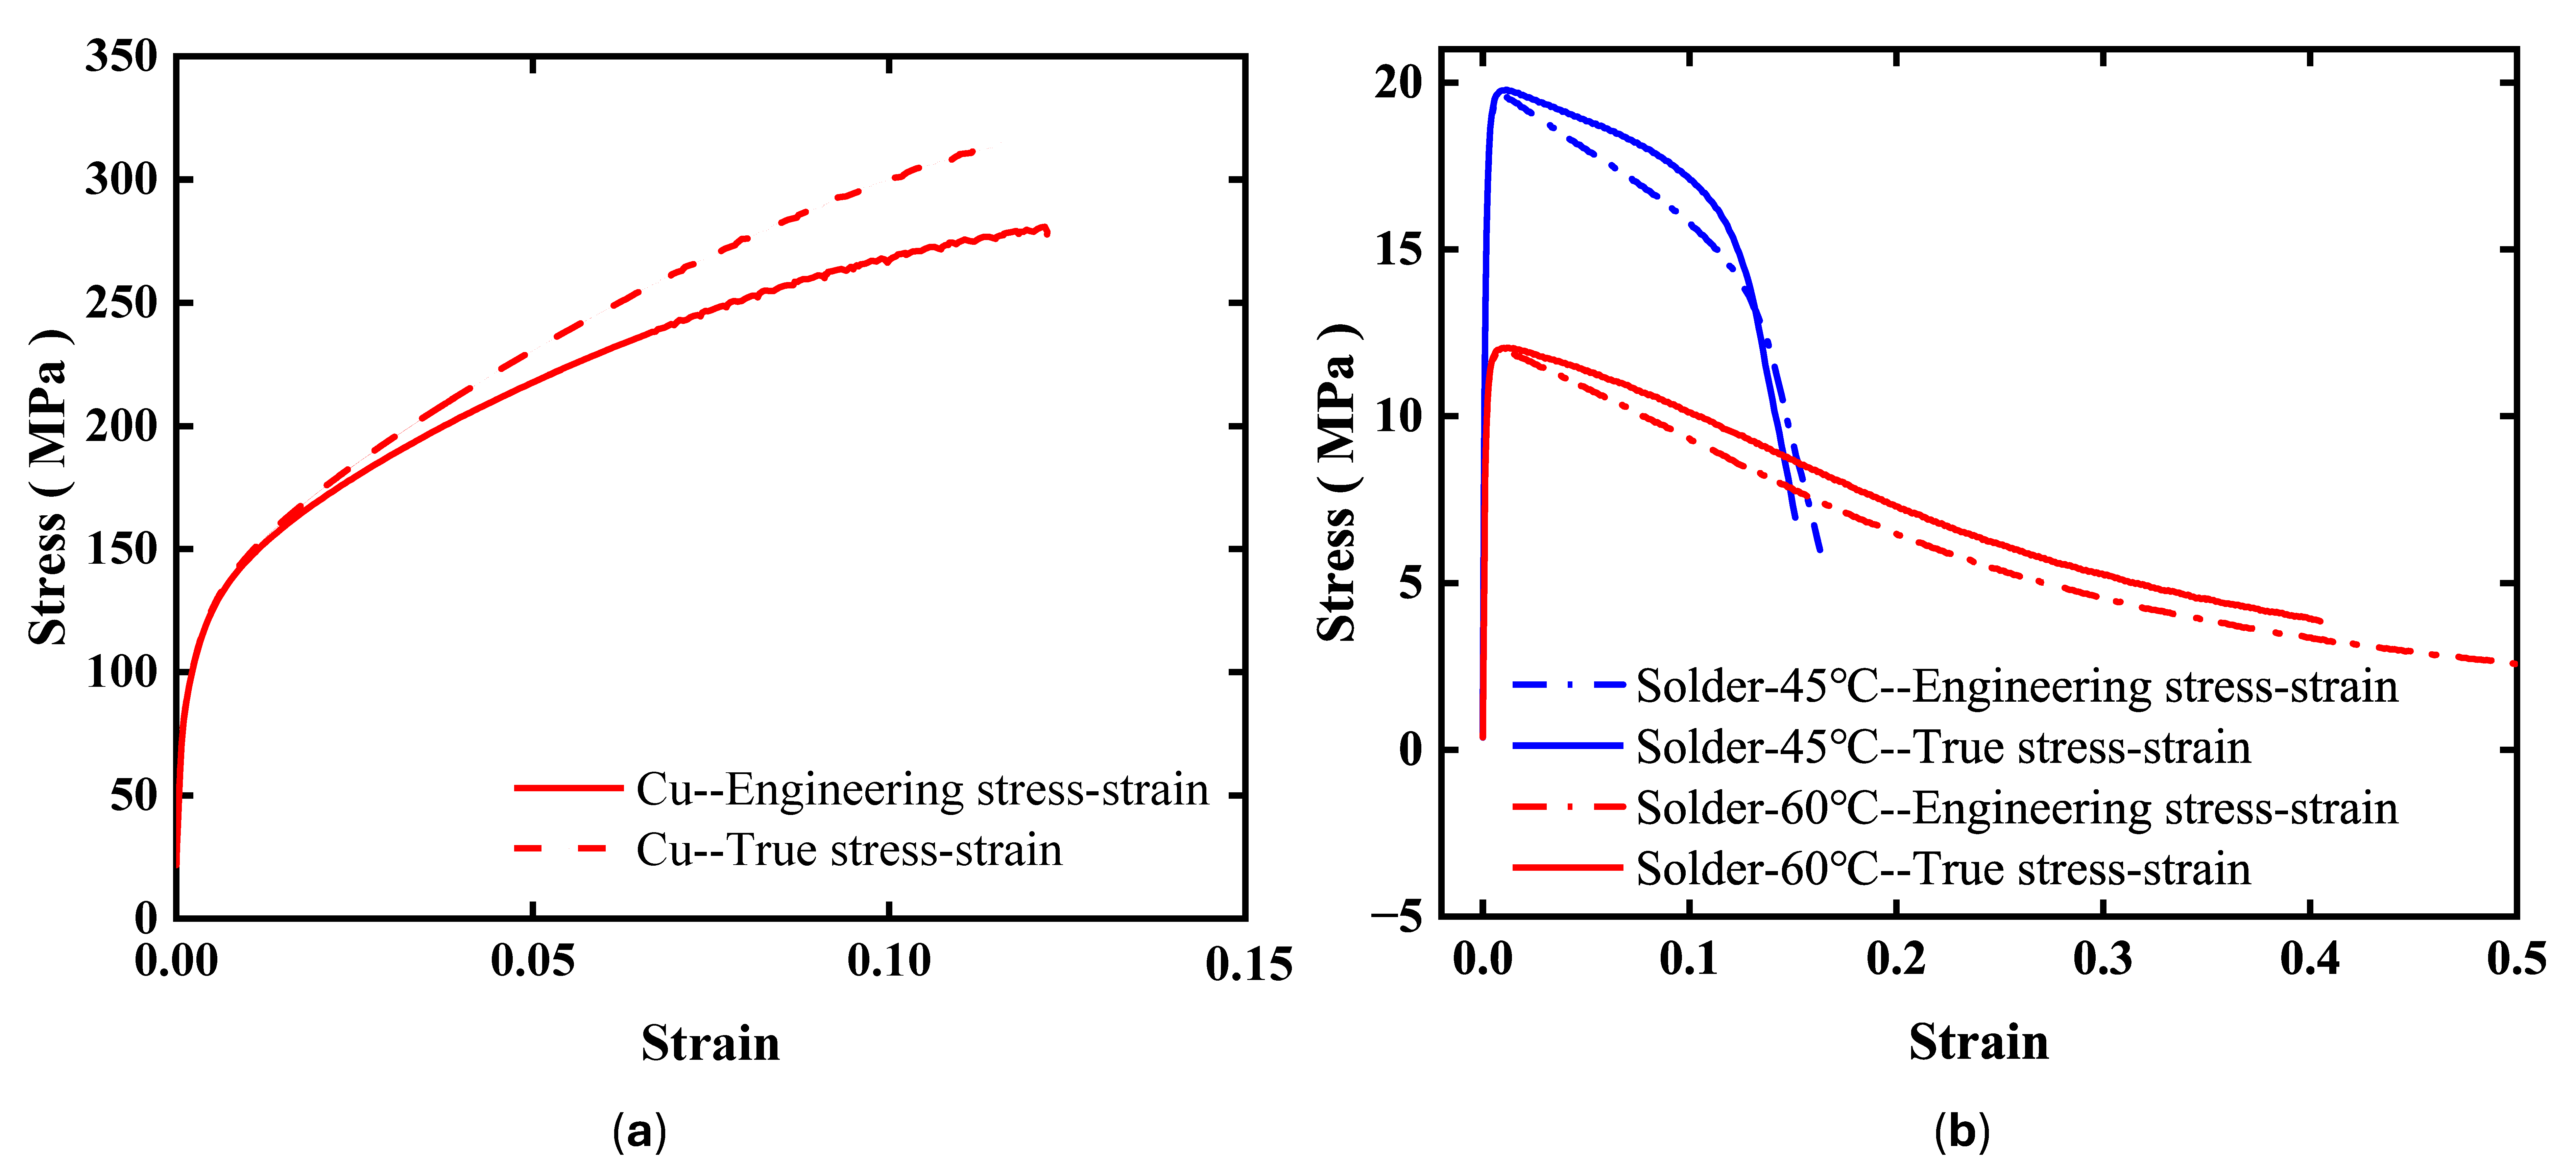
Based on the recorded in-service temperatures of the components, corresponding experiments were designed, with test temperatures set at 45 °C and 60 °C. Prior to the creep tests, tensile tests were conducted to obtain fundamental mechanical properties of the materials, including yield strength, ultimate tensile strength, and elastic modulus. These parameters serve as references during the creep tests and facilitate the assessment of material deformation behavior under creep conditions. The relevant mechanical properties can subsequently be incorporated into finite element models for simulation analyses. The specimens, as shown in
Figure 4, have a gauge length of 35 mm and a diameter of 6 mm. Temperature-insensitive base materials were tested at room temperature with a tensile strain rate of 10
−4 s
−1. For temperature-sensitive brazing materials, high-temperature tensile tests were conducted at the maximum in-service temperature of the components, 60 °C, since specimens tended to fail prematurely under 45 °C conditions. The tensile strain rate for these tests was also set at 10
−4 s
−1.
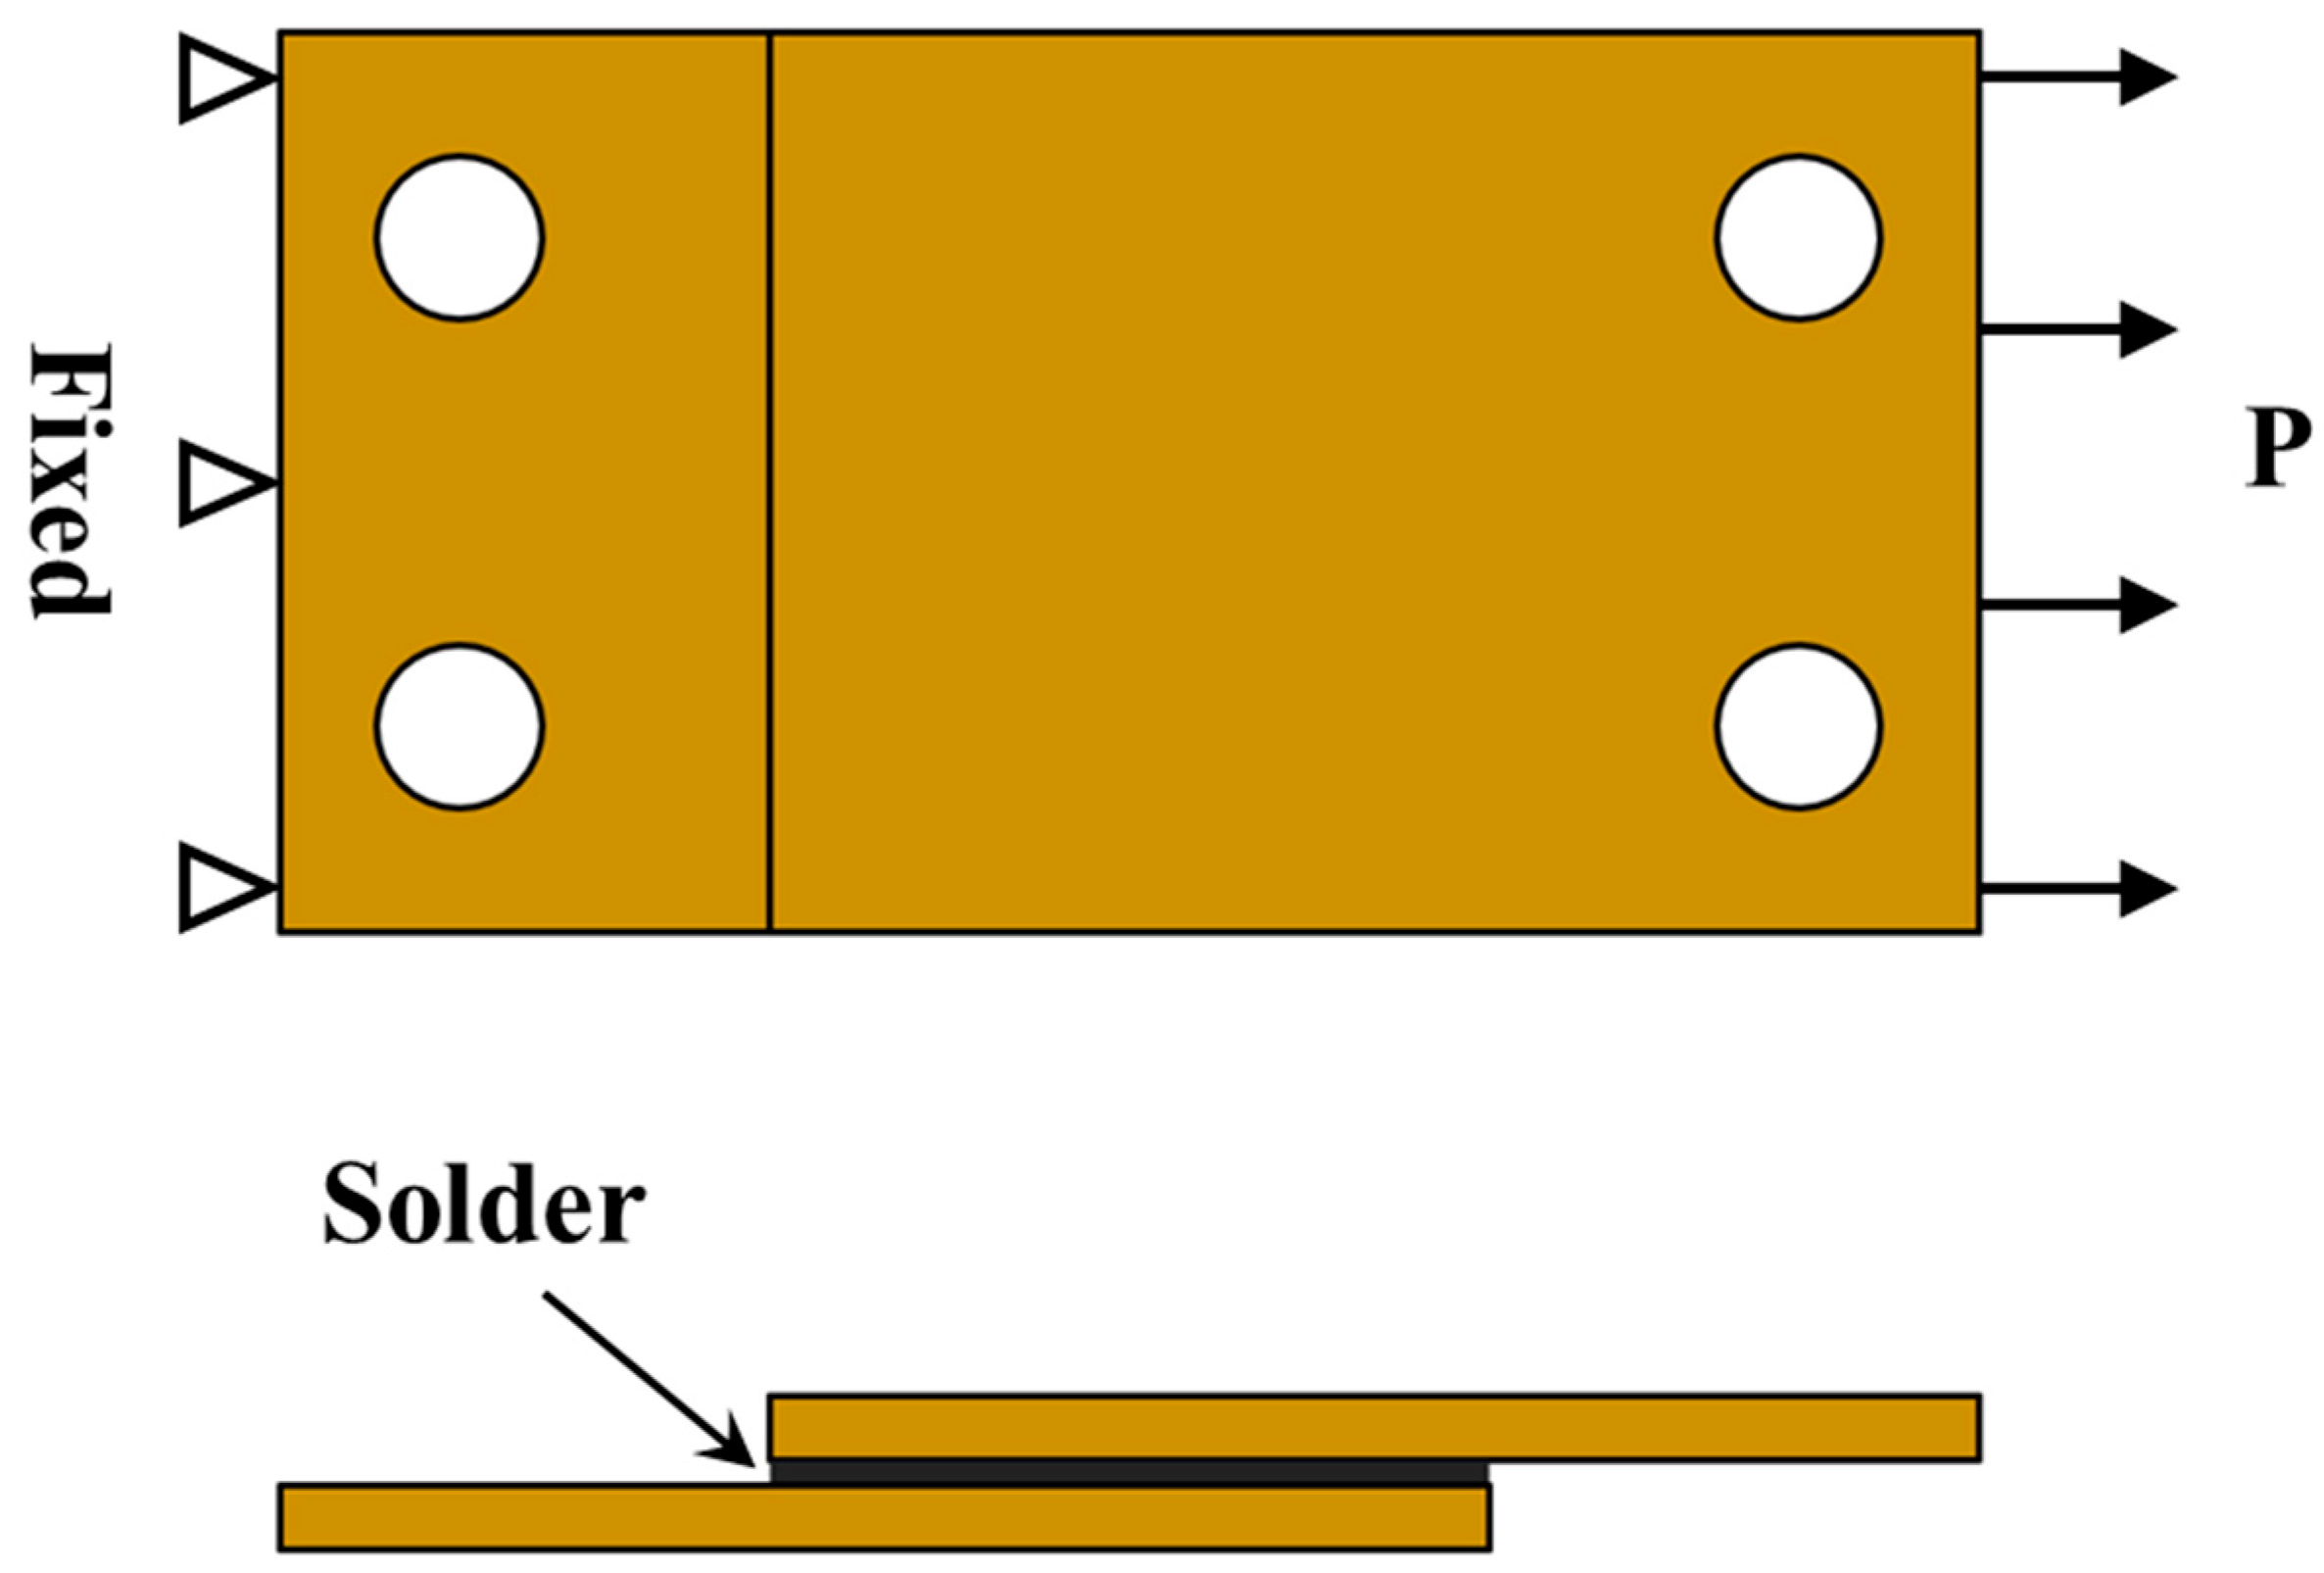
The brazed element, as shown in
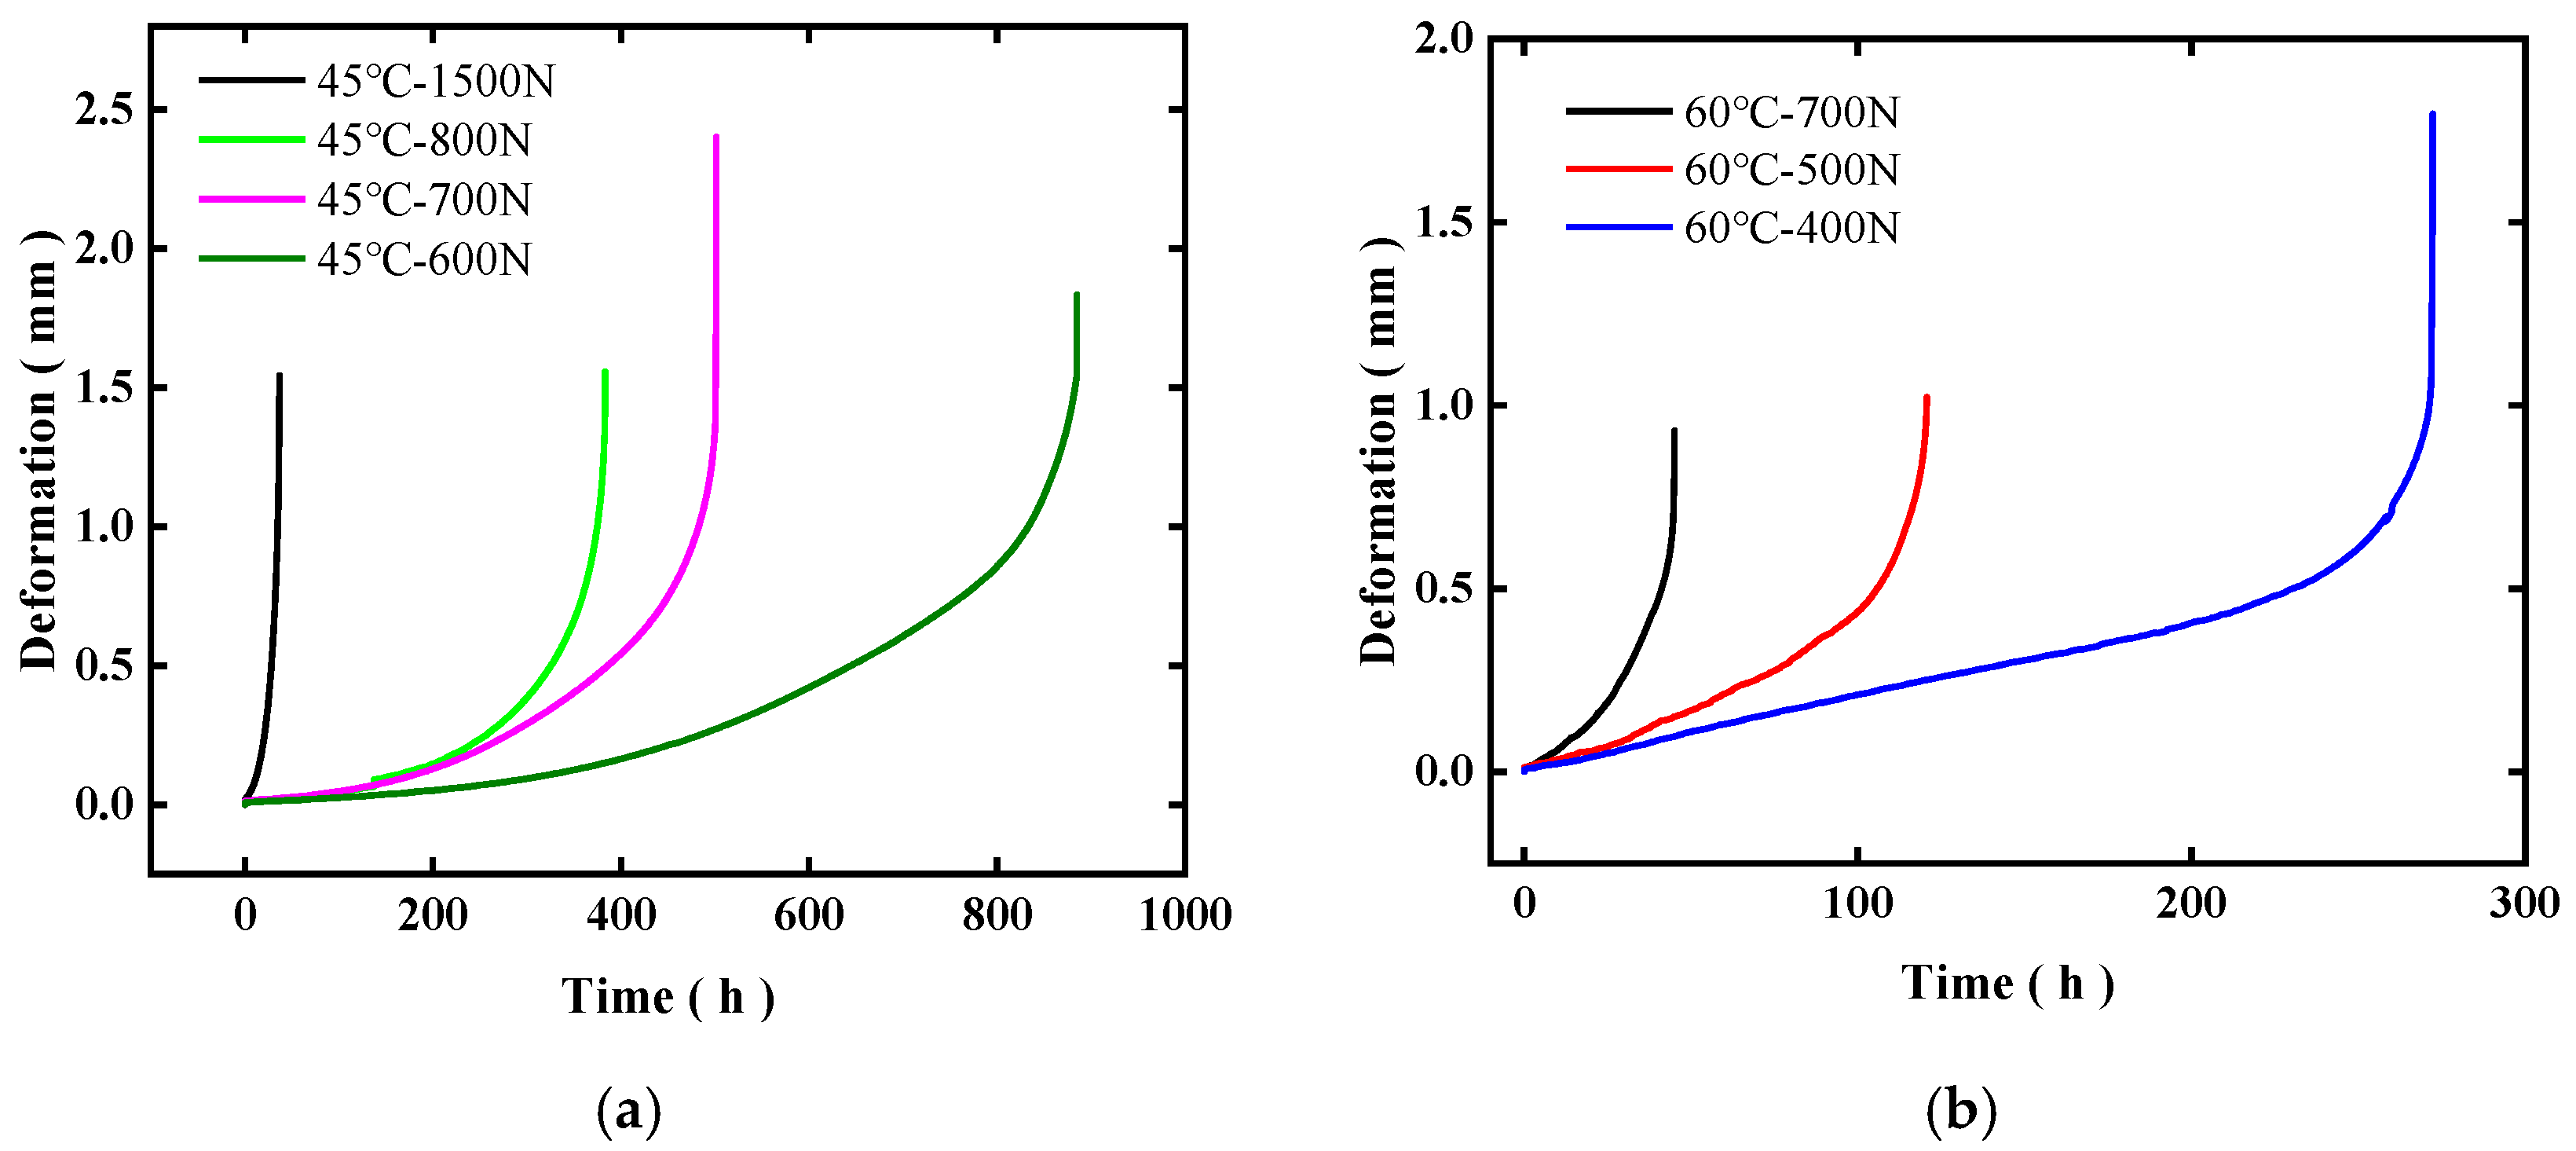
Figure 5, consists of two brass plates joined by a filler metal through brazing. Its operating principle is to act as a locking component that bears tensile load and actively opens when the temperature exceeds the melting point of the filler metal. Accordingly, a tensile test was designed to replicate its working environment. One end of the specimen was fixed, while the other end was subjected to tensile force applied by a motor. The test temperature was set at 60 °C, consistent with the high-temperature tensile test for the filler metal. (Testing at 45 °C was impractically long; the 60 °C tensile test results were subsequently used to design the 60 °C creep test, which then informed the design of the 45 °C creep test.) The tensile strain rate was set to 10
−4 s
−1, and the deformation at the brazed joint was measured. The brazed region primarily experiences simple shear, so the measured deformation corresponds to the shear deformation in the brazed area. Based on the tensile test results, creep tests were designed in which one end of the specimen was clamped and fixed, while a constant load-smaller than the tensile yield limit—was applied at the other end by the testing machine. During the creep test, the applied load was maintained constant, with a deviation not exceeding ±0.5 N. Tests were conducted at 45 °C and 60 °C. The deformation in the brazed region was measured using a clip-on extensometer, which continuously recorded the deformation at the brazed joint until specimen failure, thereby obtaining the time-dependent creep deformation data. Subsequently, creep performance data for brazed joints at 50 °C and 55 °C can be added to enhance the accuracy of equipment life management.
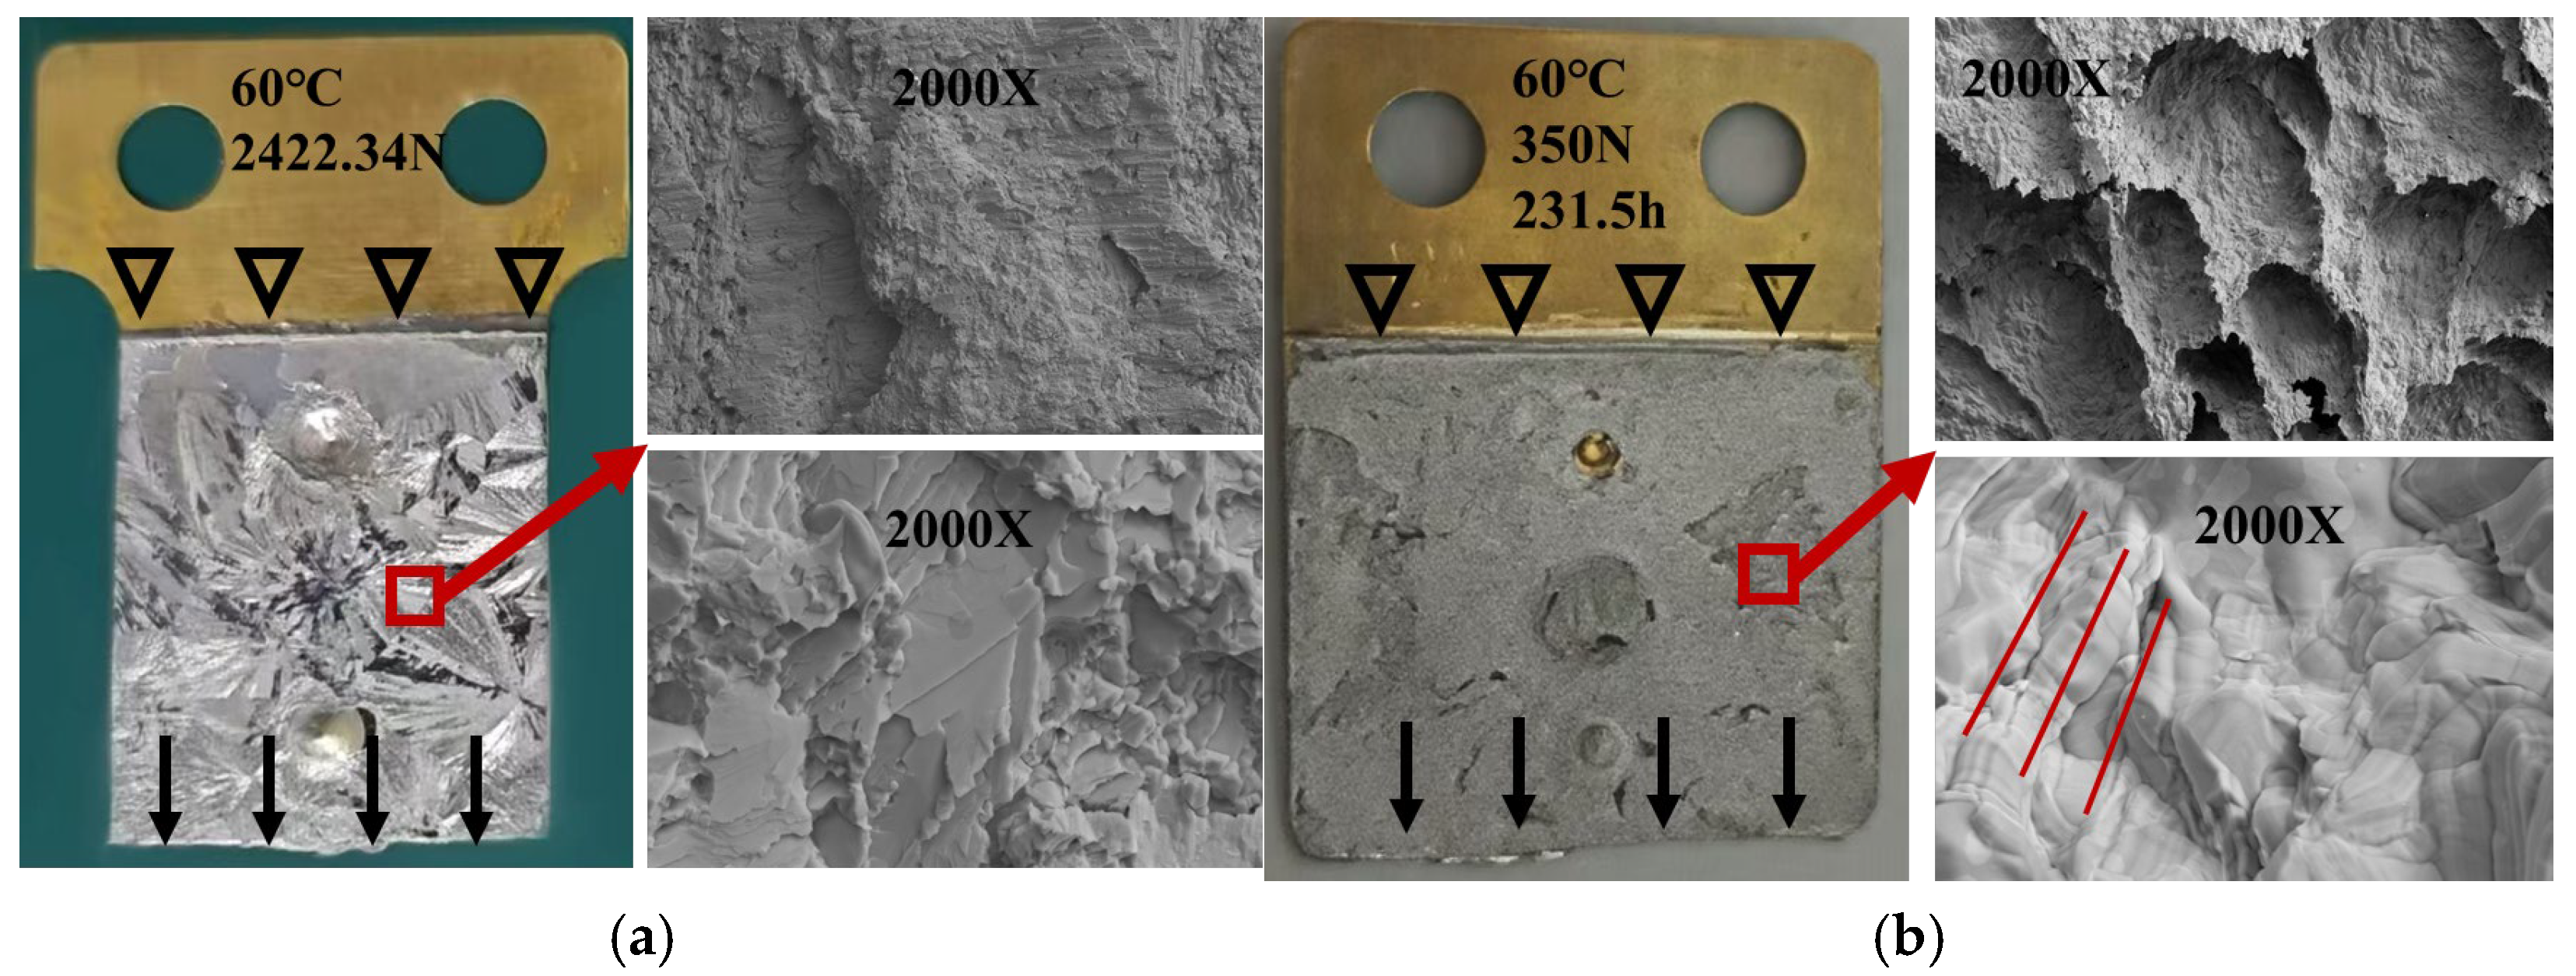
Fracture surfaces of tensile and creep specimens were examined using electron microscopy. Electron microscopy provides high-resolution images of the microstructure, enabling detailed observation of grain morphology, microcracks, and other microscopic features within the brazed joints. Compared with optical metallography, it allows more precise identification of defects such as pores, cracks, and inclusions. In addition, energy-dispersive X-ray spectroscopy (EDS) can be used to detect elemental distributions, revealing possible element segregation or loss of alloying elements. After cleaning the surfaces of the tensile and creep-fractured brazed elements and drying them with cold air, the specimens were placed into a scanning electron microscope (SEM). The electron beam scanned the specimen surfaces to generate high-resolution images. The surface morphology, microstructure, and defects of the brazed joints were observed, allowing the identification of microcracks, voids, and other microscopic imperfections.
3.2. Creep Damage Constitutive Model
Based on the tensile performance data of copper and the filler metal, a finite element analysis (FEA) model of the soft brazed joint was established. One end of the specimen was fixed, while the other end was subjected to a constant load
P. The brazing layer had a thickness
t and a brazed area
S, and the deformation measured at the joint was Δ
l. For small shear deformations, the shear stress and shear strain of the specimen can be expressed as [
19]
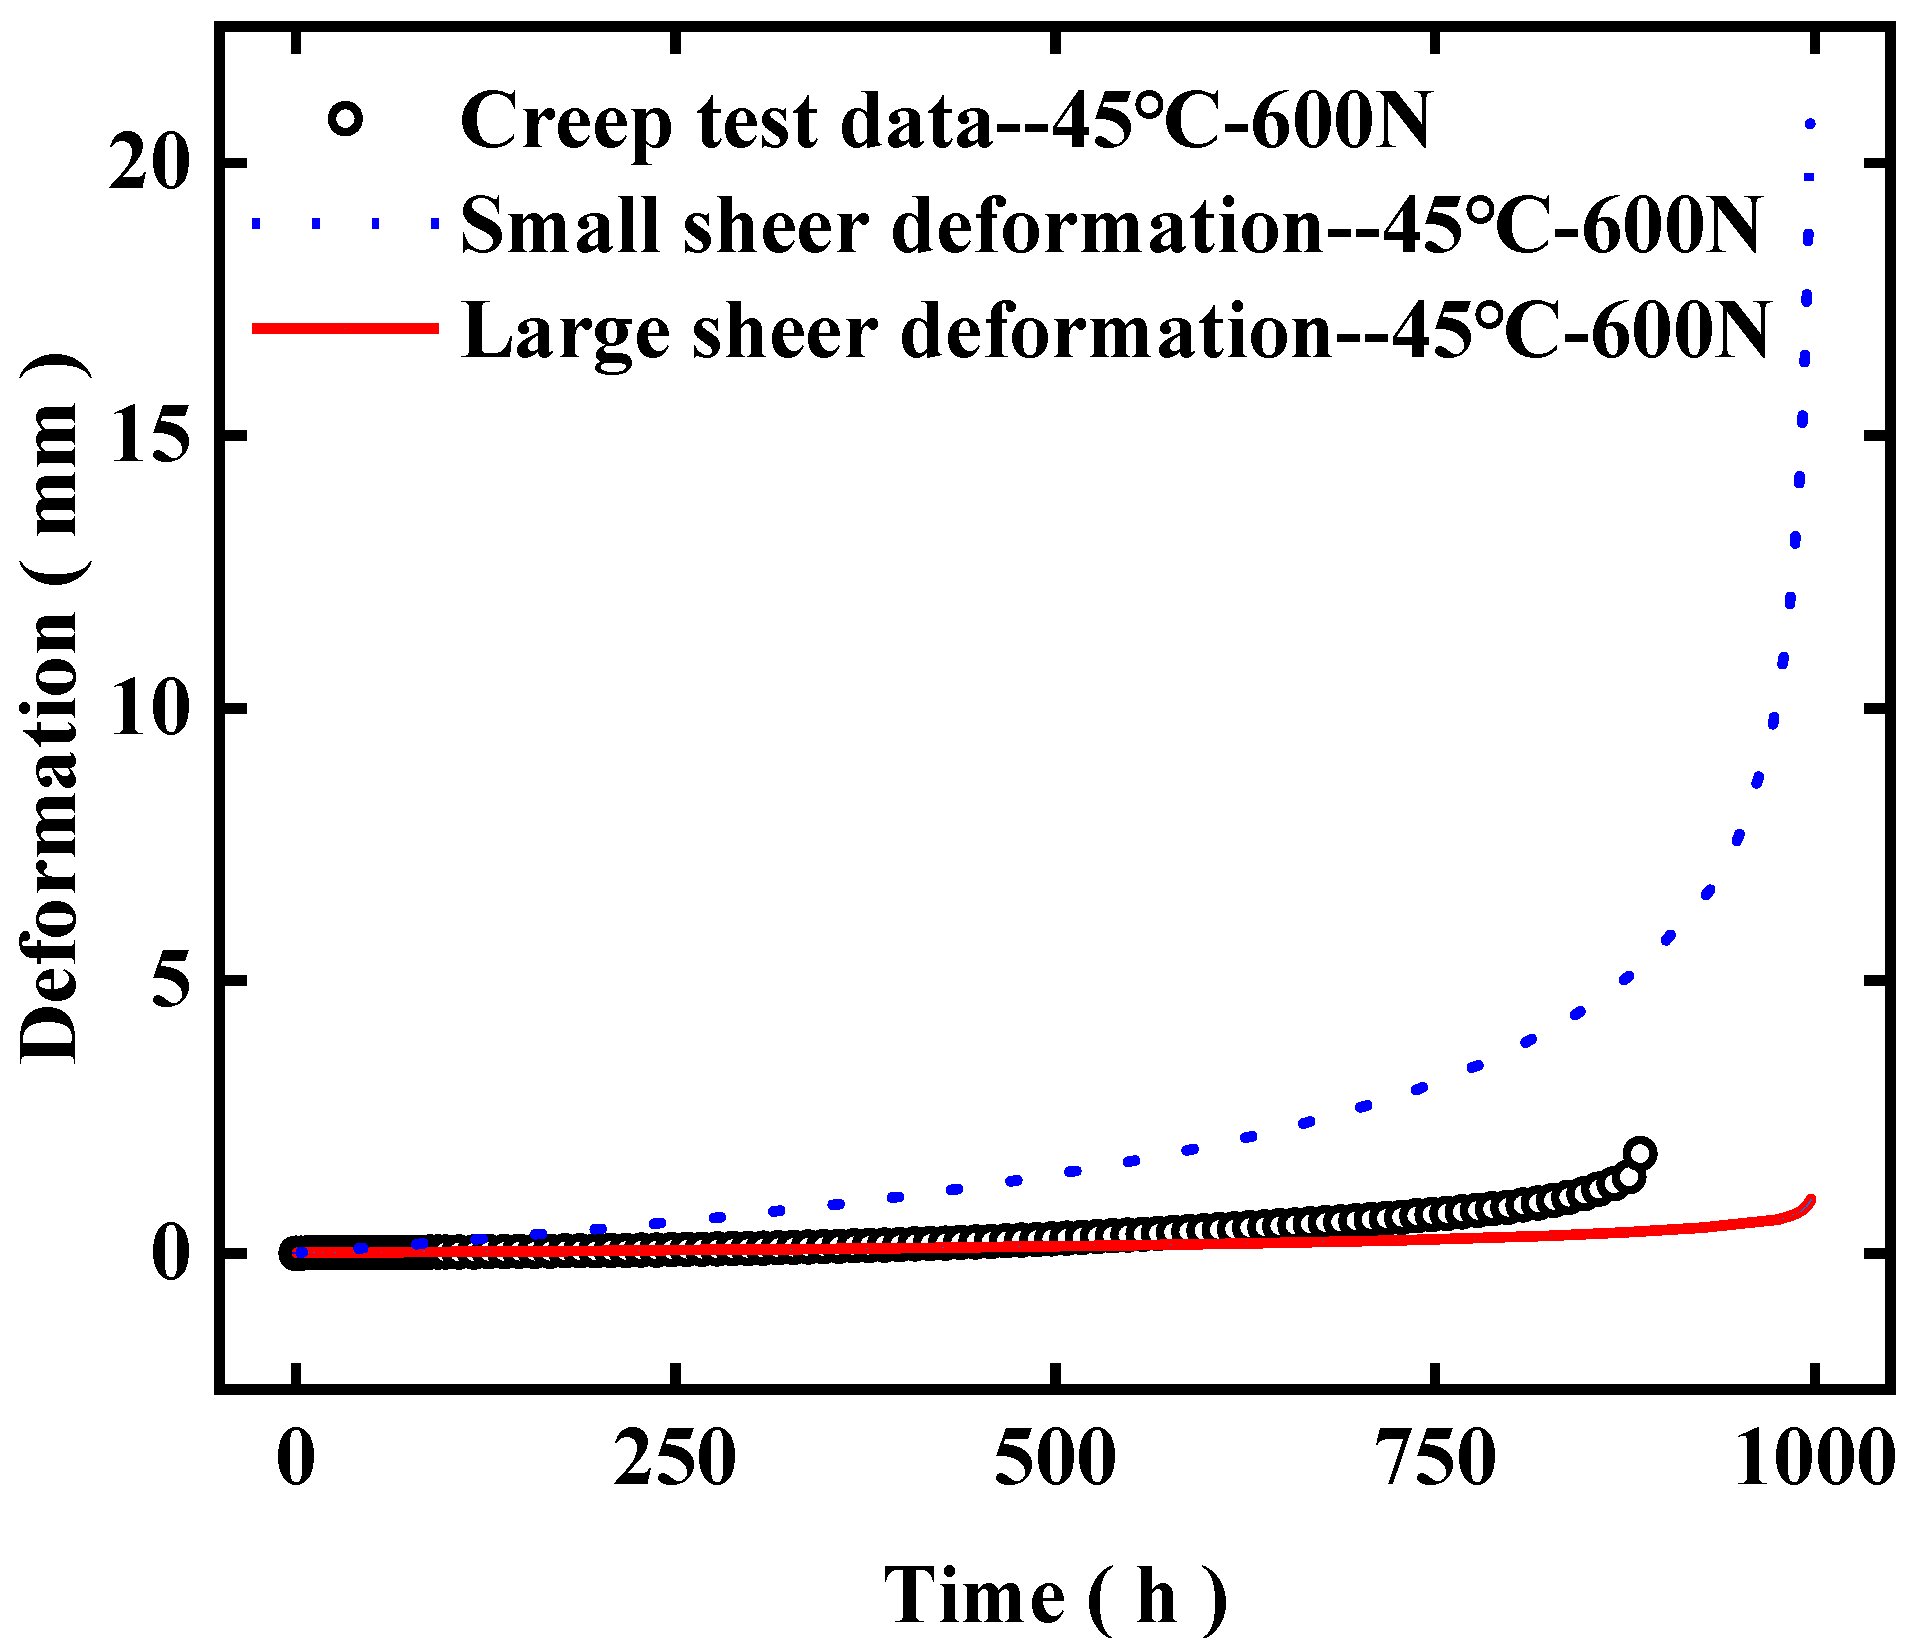
However, actual measurements revealed that the deformation Δ
l at the brazed joint was approximately five times the brazing layer thickness
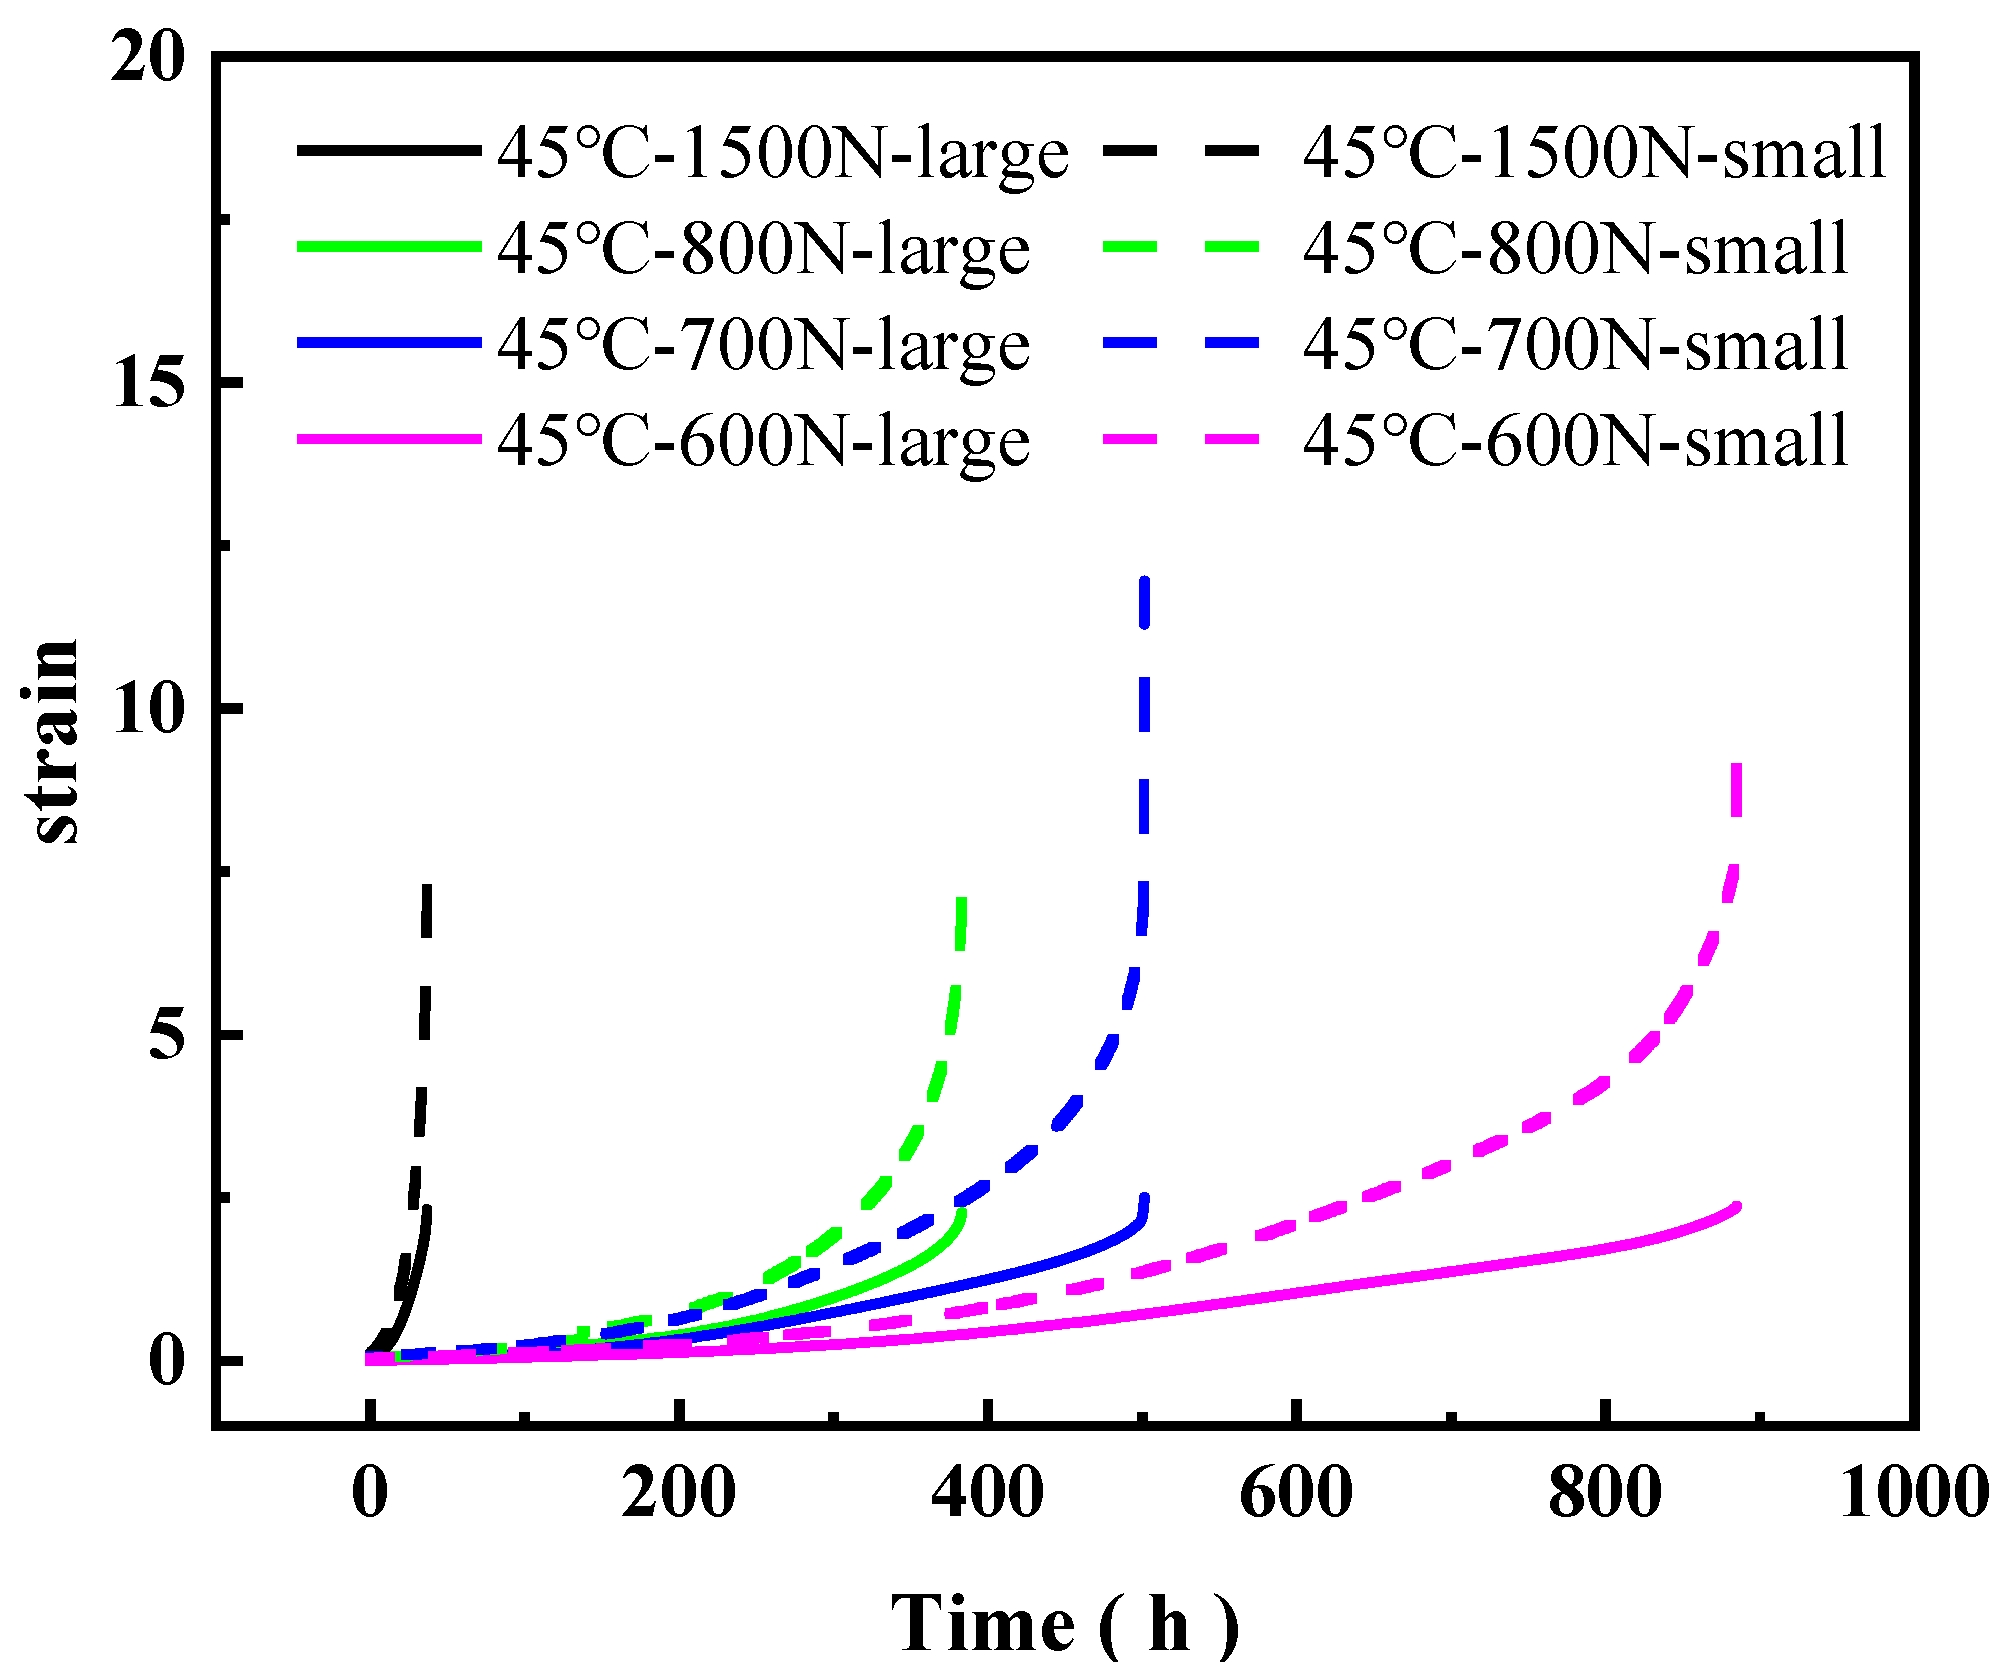
t, indicating large shear deformation. For such large shear deformations, conventional definitions of stress and strain are no longer sufficient, and equivalent stress and equivalent strain are employed instead [
20,
21,
22]:
Therefore, the modified Kachanov–Rabotnov model can be expressed as [
23,
24]:
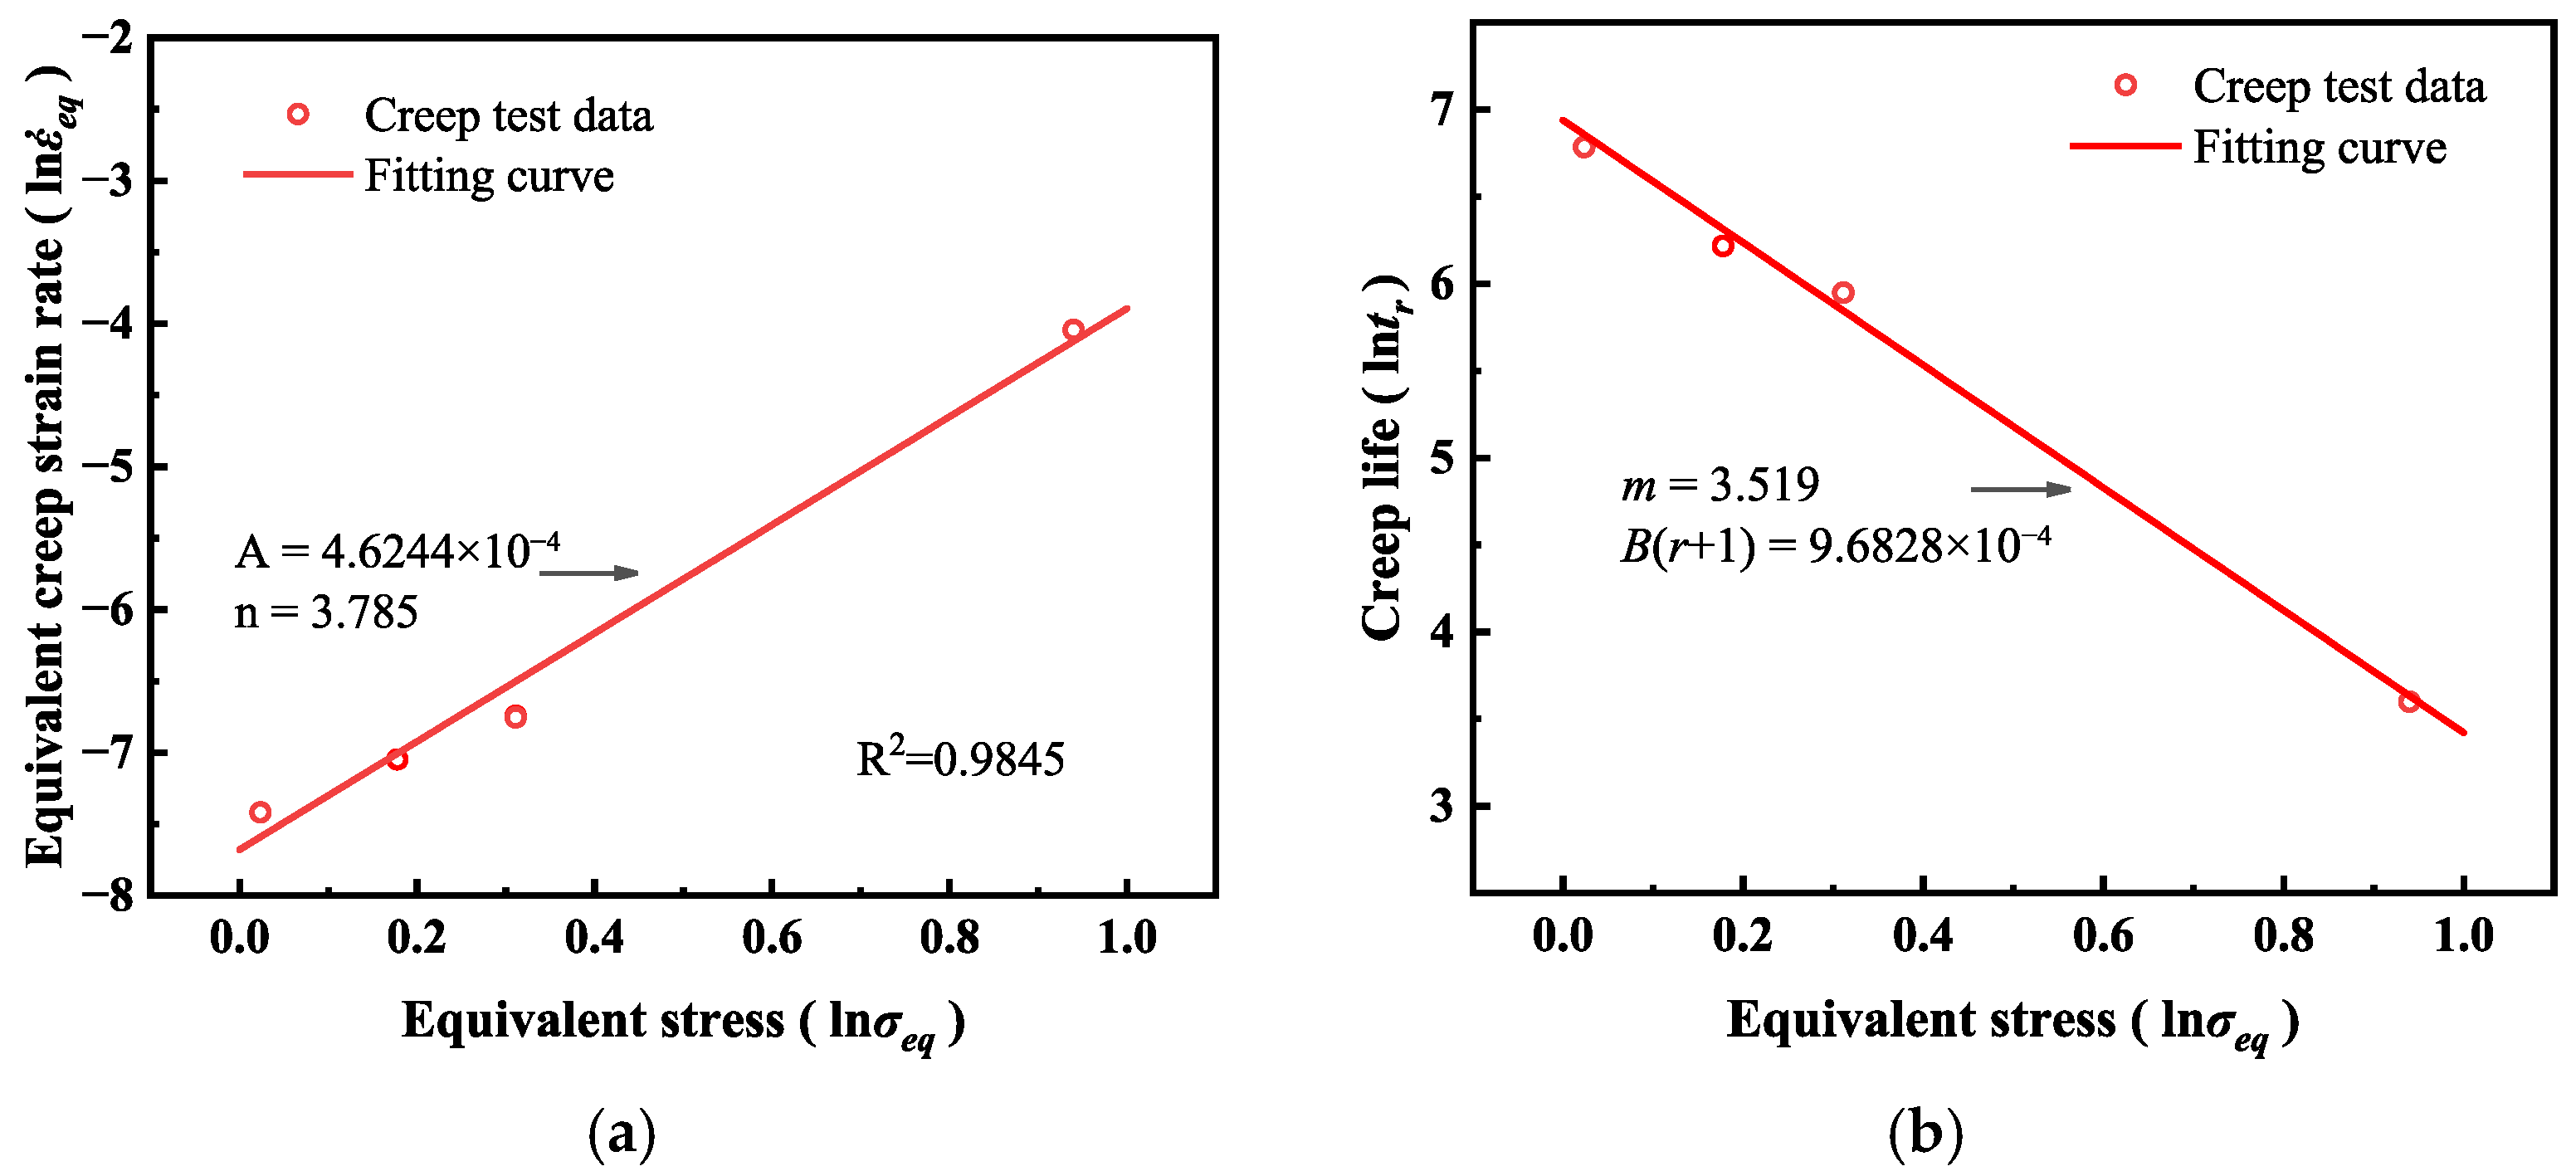
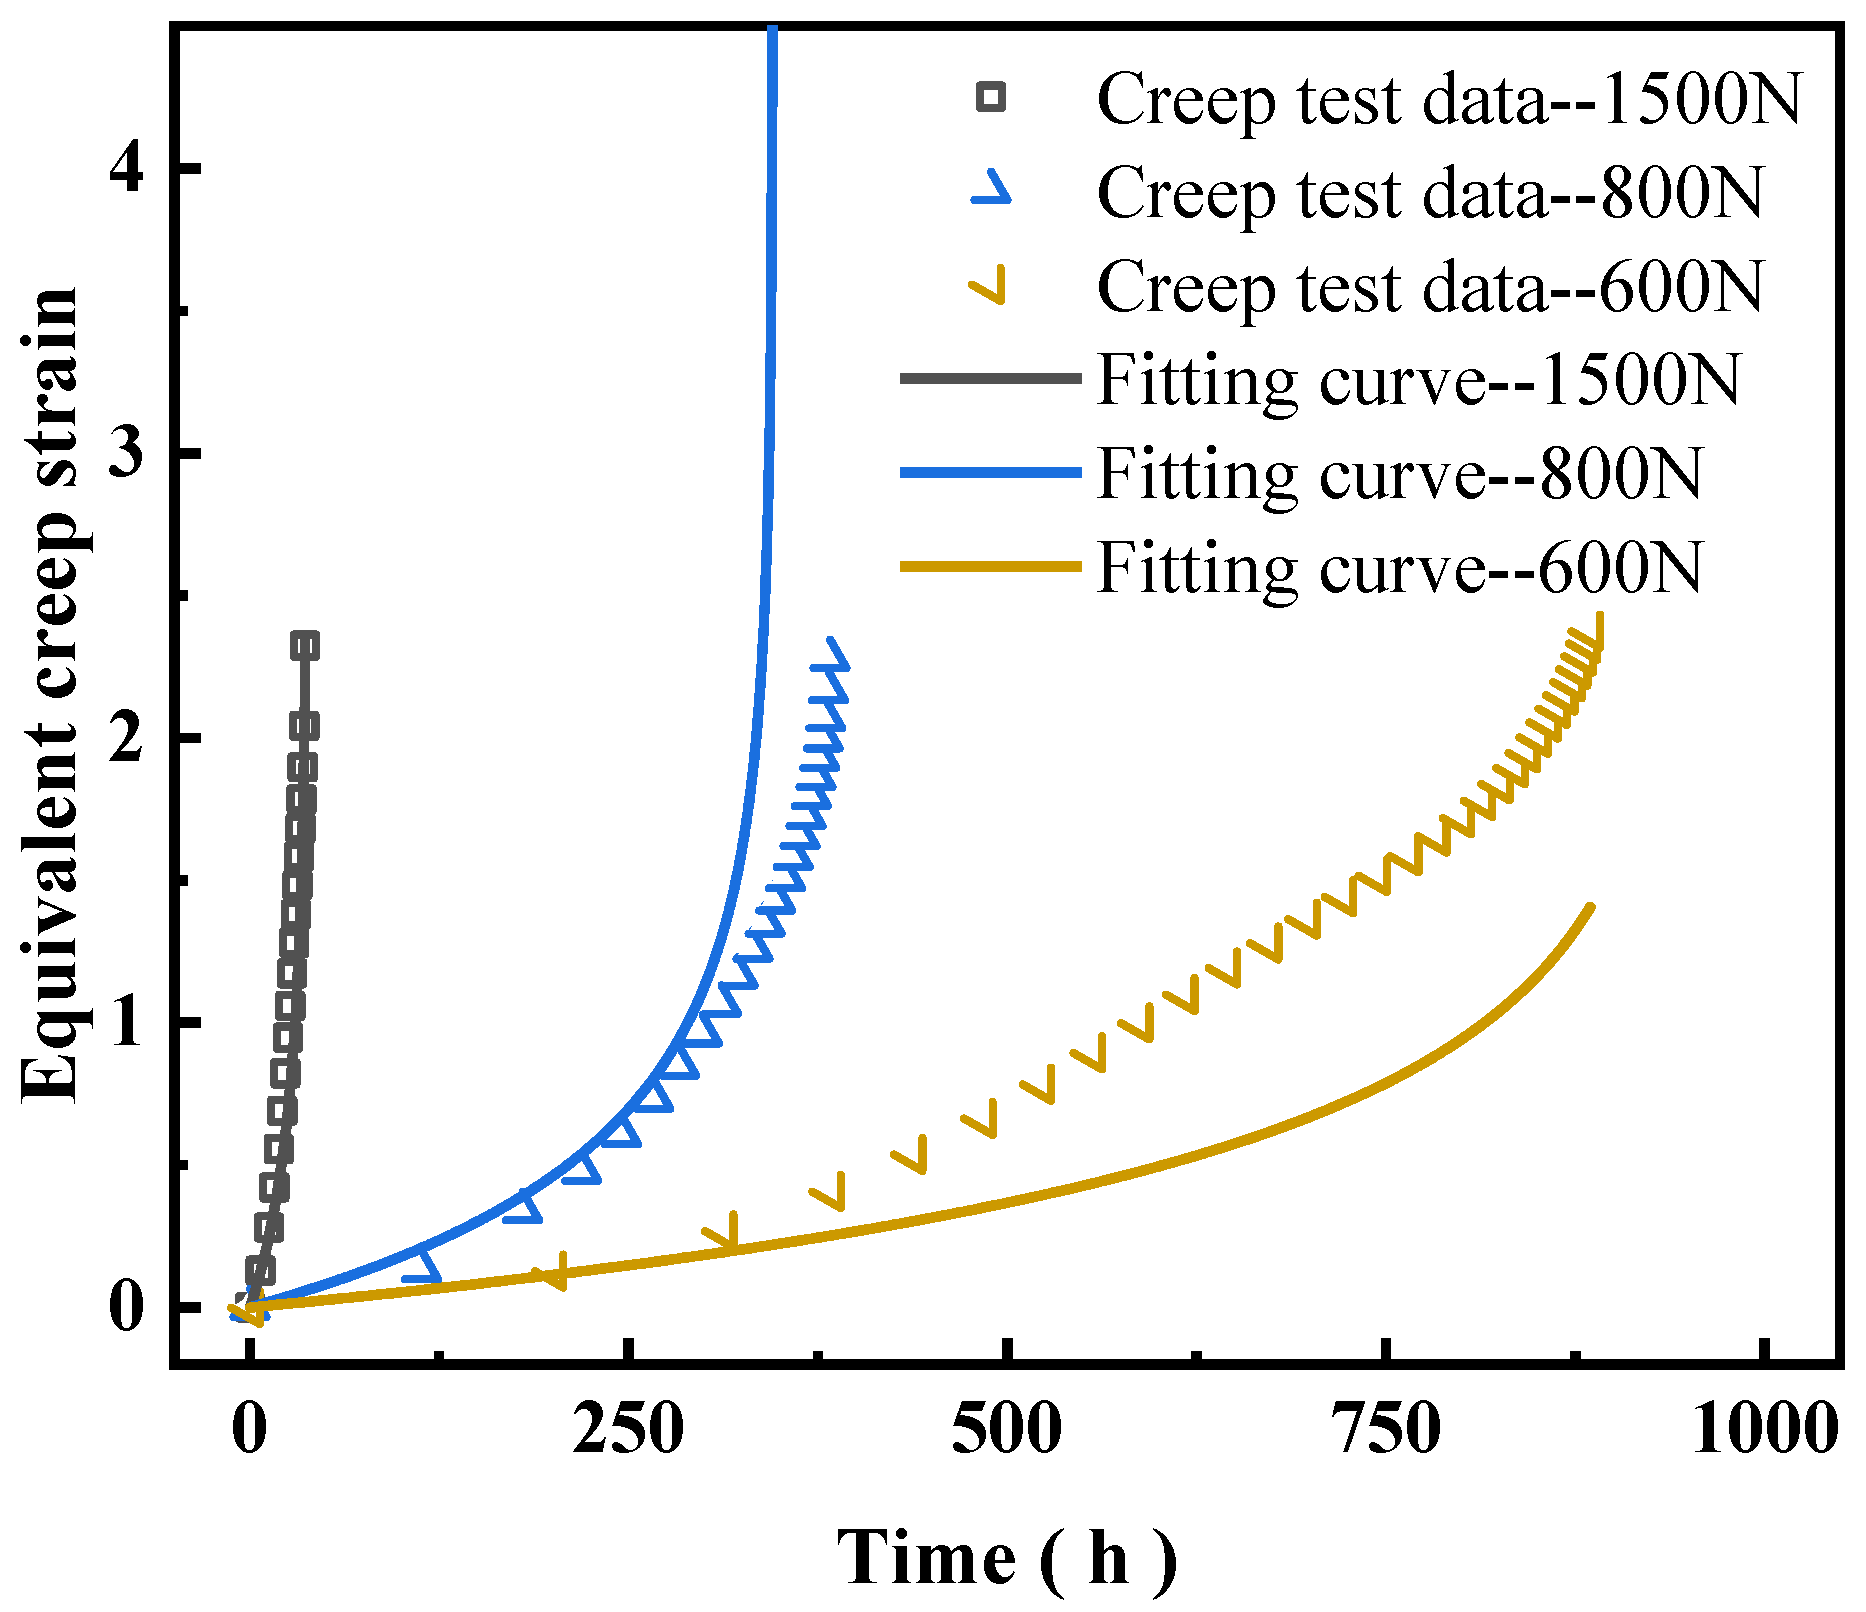
In the equation, A and n are Norton constants related to the material properties and stress. is the equivalent creep strain rate obtained from the equivalent strain, ω is the damage variable, and is the damage rate. B is a material parameter, and r and m are creep-damage constants. Based on the experimental data obtained from the previous creep tests, the model can be fitted to determine the five parameters (A, n, B, r, m). Substituting them into the constitutive equation yields the creep-damage constitutive model applicable to the brazed components.
By integrating Equation (6) over the time and damage domains, we obtain:
When the specimen fails due to damage, the damage parameter
ω equals 1. Substituting (
ω = 1) into Equation (7) yields the relationship between creep life
tr and applied stress
σeq:
Using Equation (8), the creep life of the structure can be predicted by substituting the fitted parameters and the calculated equivalent stress.
3.3. Structure Parameter
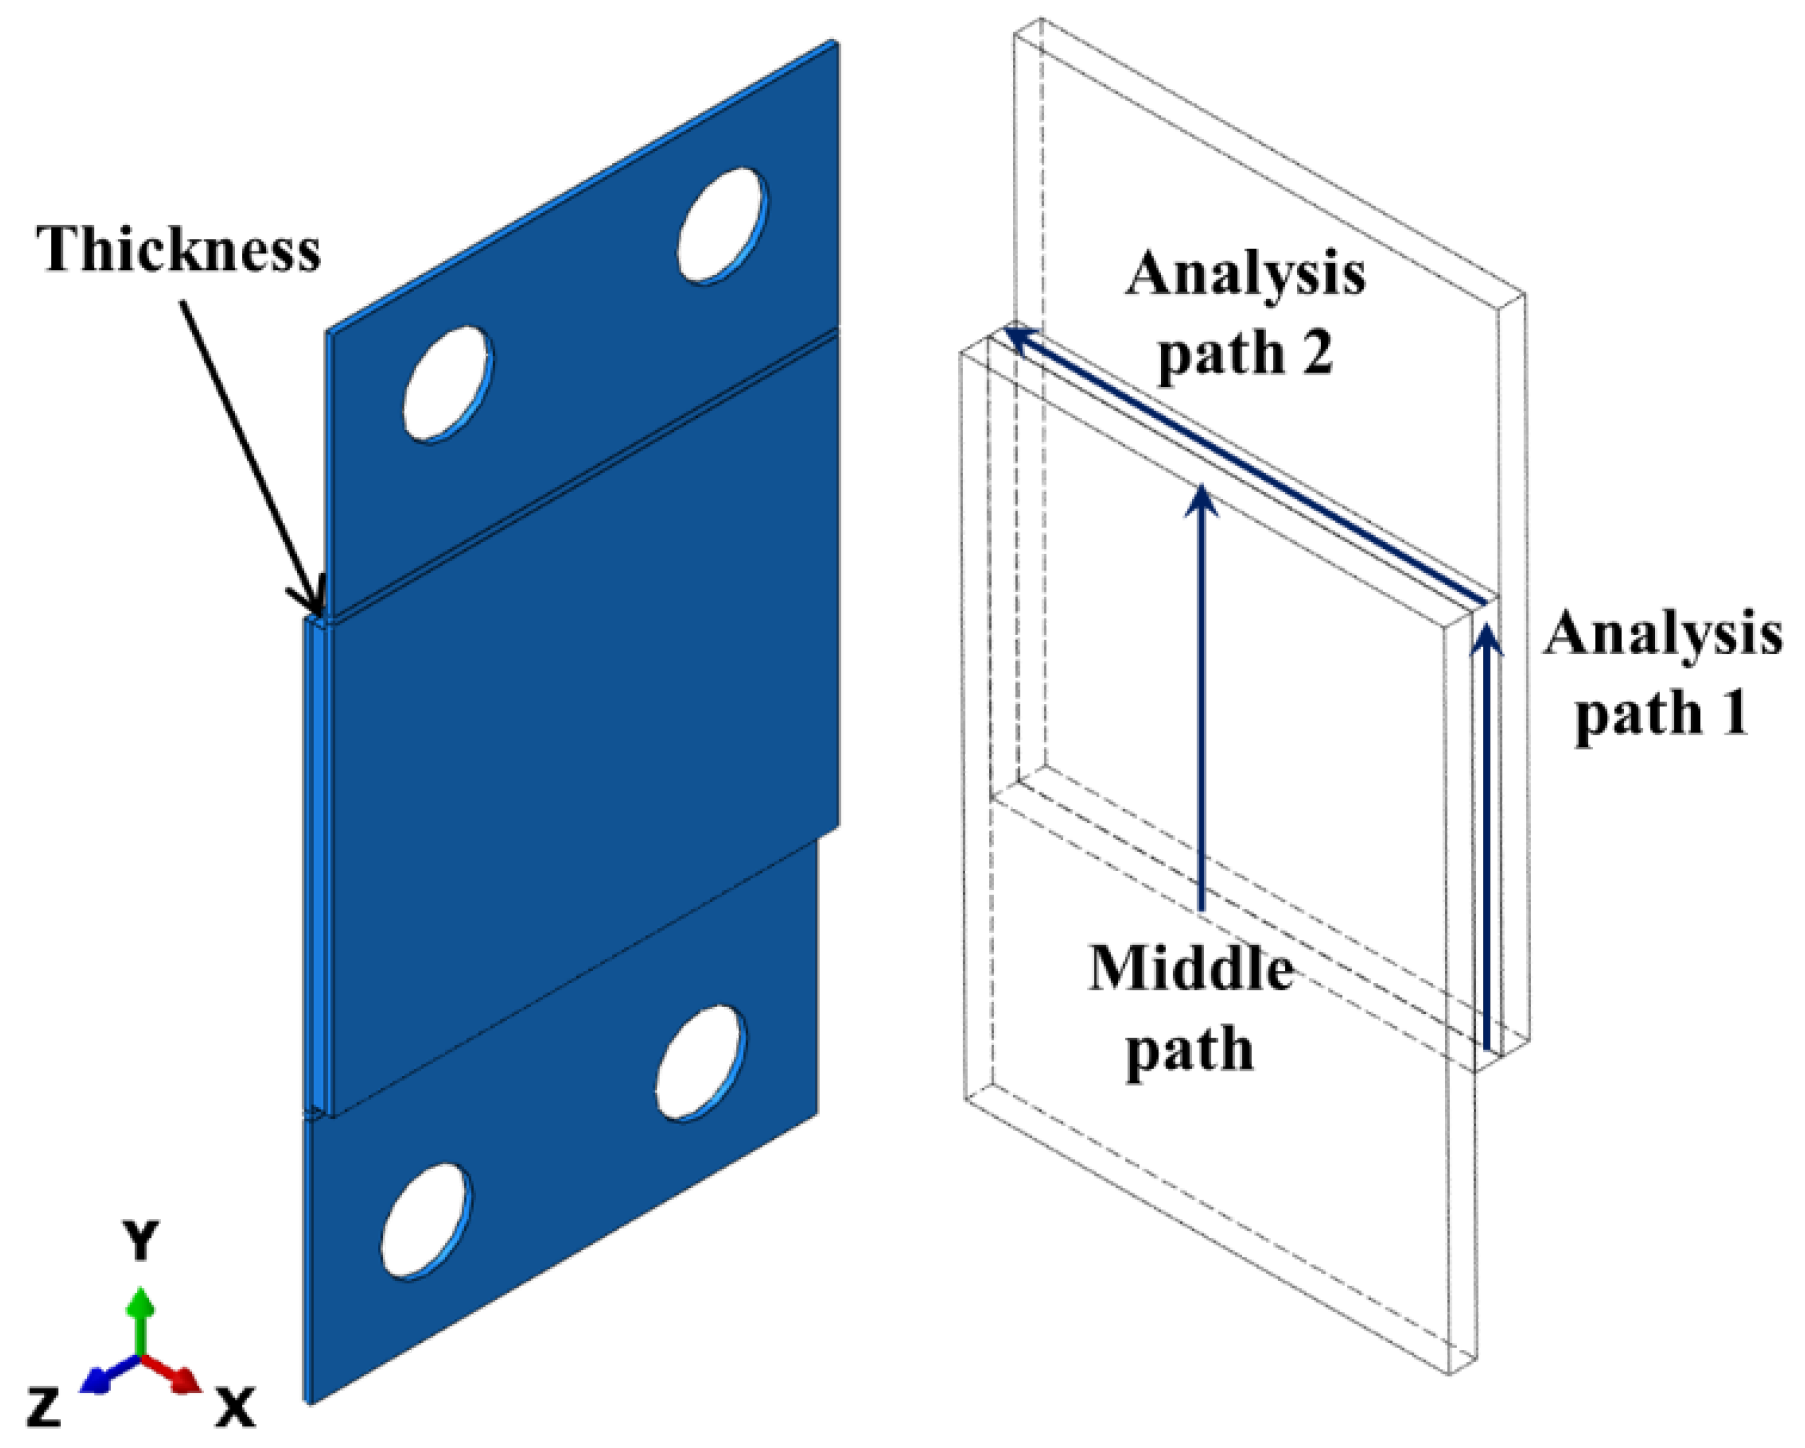
The thickness of the brazing layer in the structure significantly affects the magnitude of the equivalent strain, which in turn has a substantial impact on the creep life of the component. Based on the experimental conditions, a finite element model of the brazed element was established, as shown in
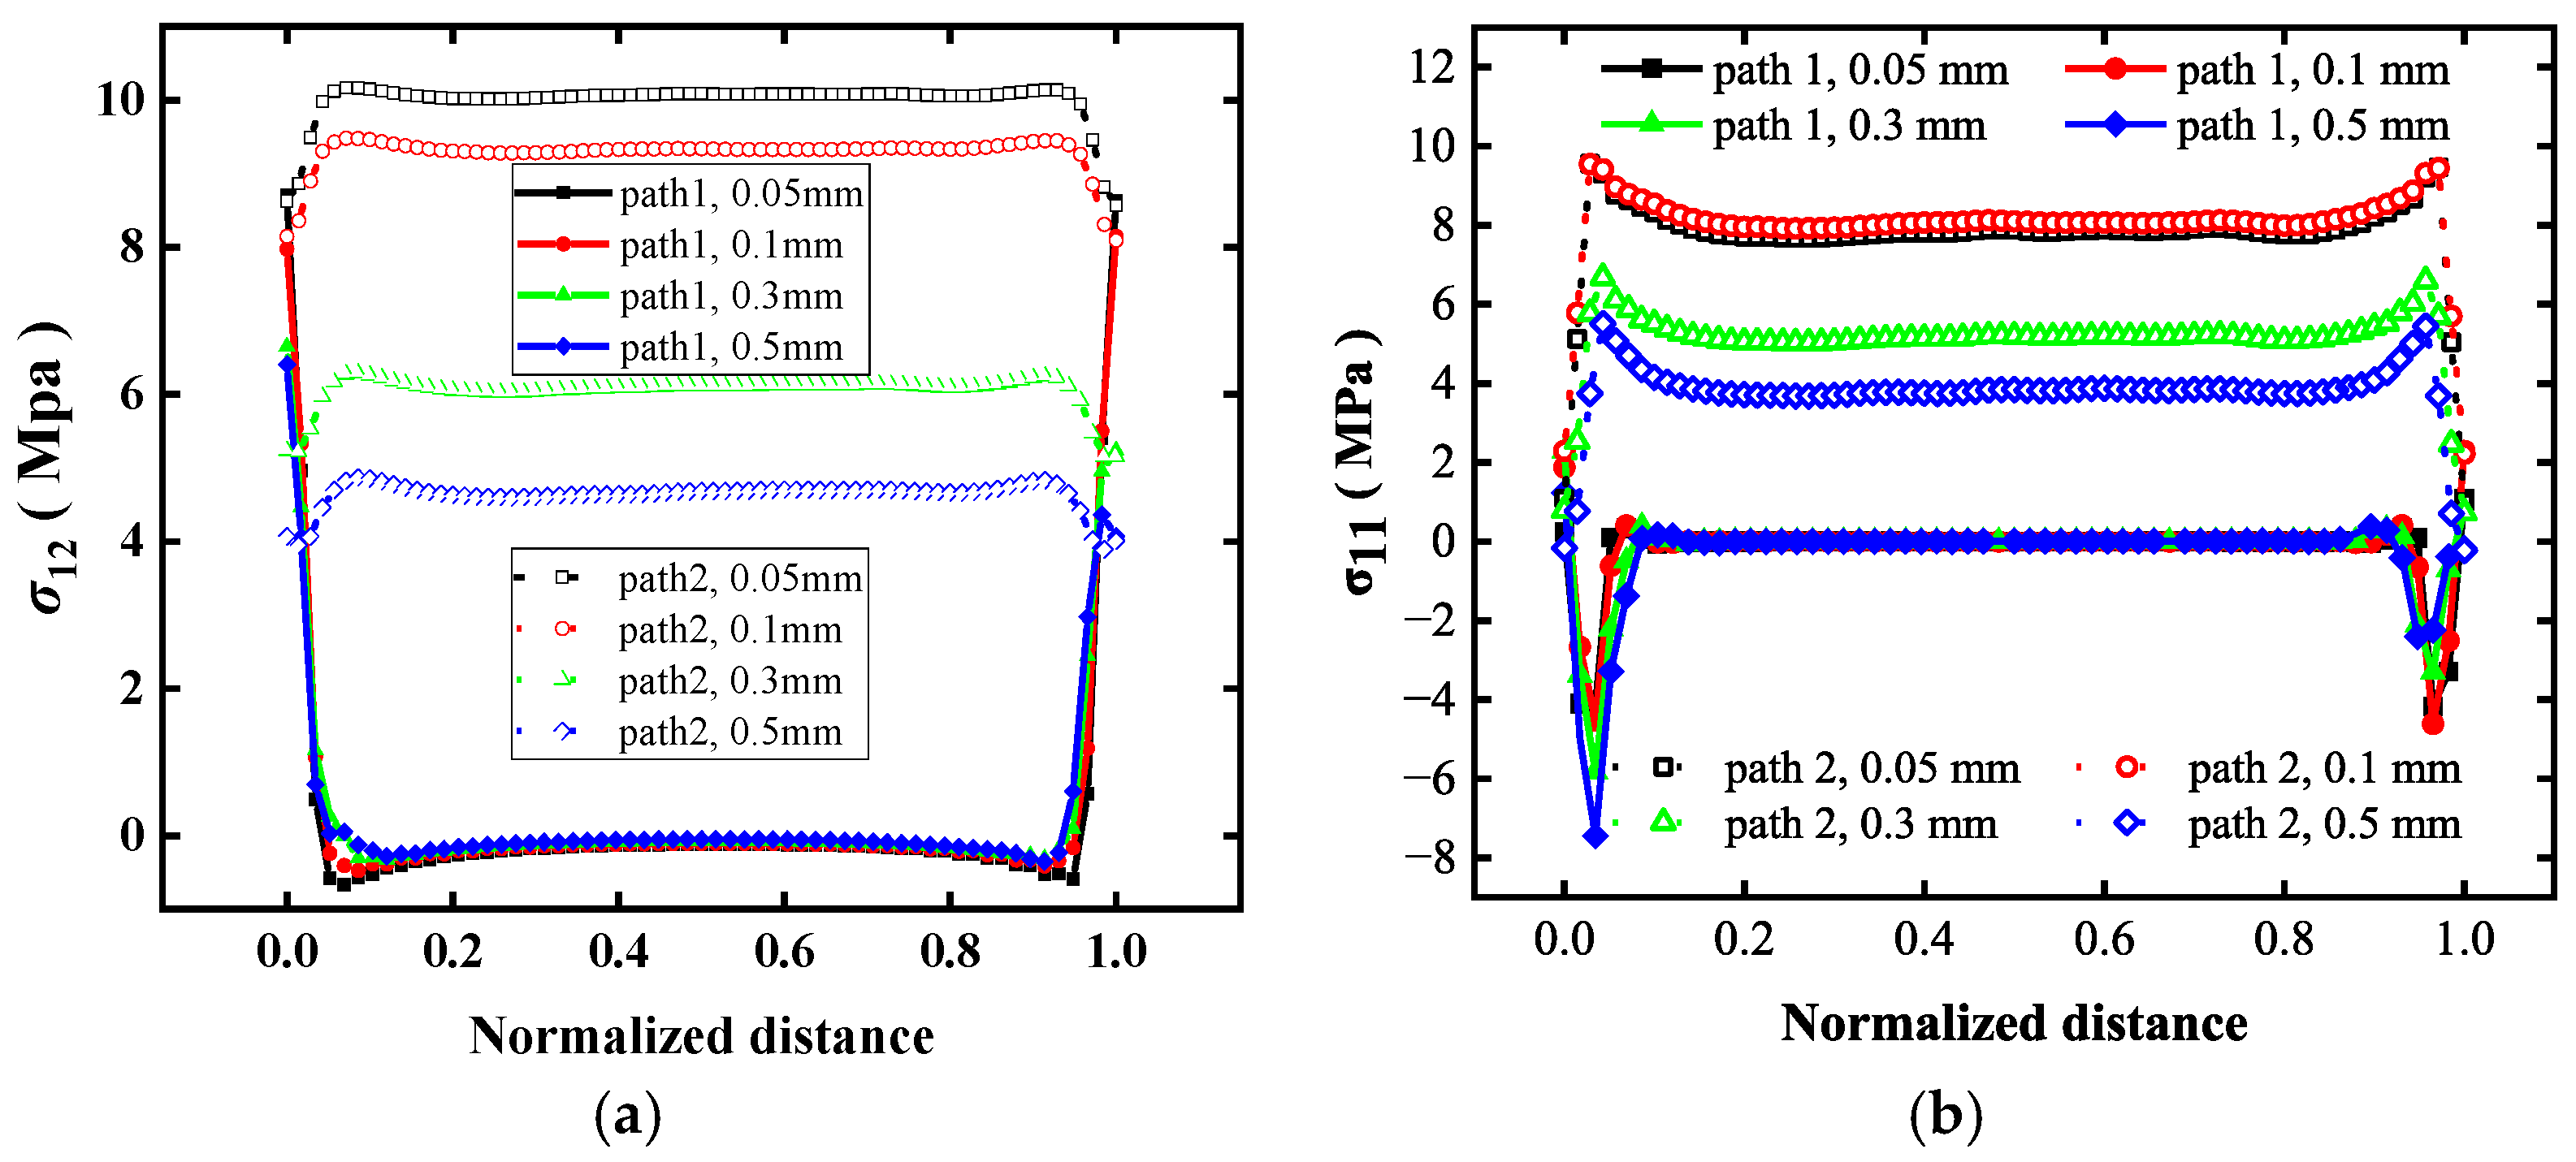
Figure 6. Comparing only the stress state at the edge regions may lead to misinterpretation of the overall stress distribution; therefore, it is necessary to examine the differences in stress characterization along different paths. Considering the structural symmetry, Analysis Path 1 at the edge and the Middle Path were selected for comparison. The brazed structure was modeled using C3D8R solid elements. To ensure accuracy, both the base material and the brazed layer were meshed with at least six elements through the thickness. The total number of elements in the model was 287,356, with a global element size of less than 1 mm and a brazed region element size of less than 0.05 mm.
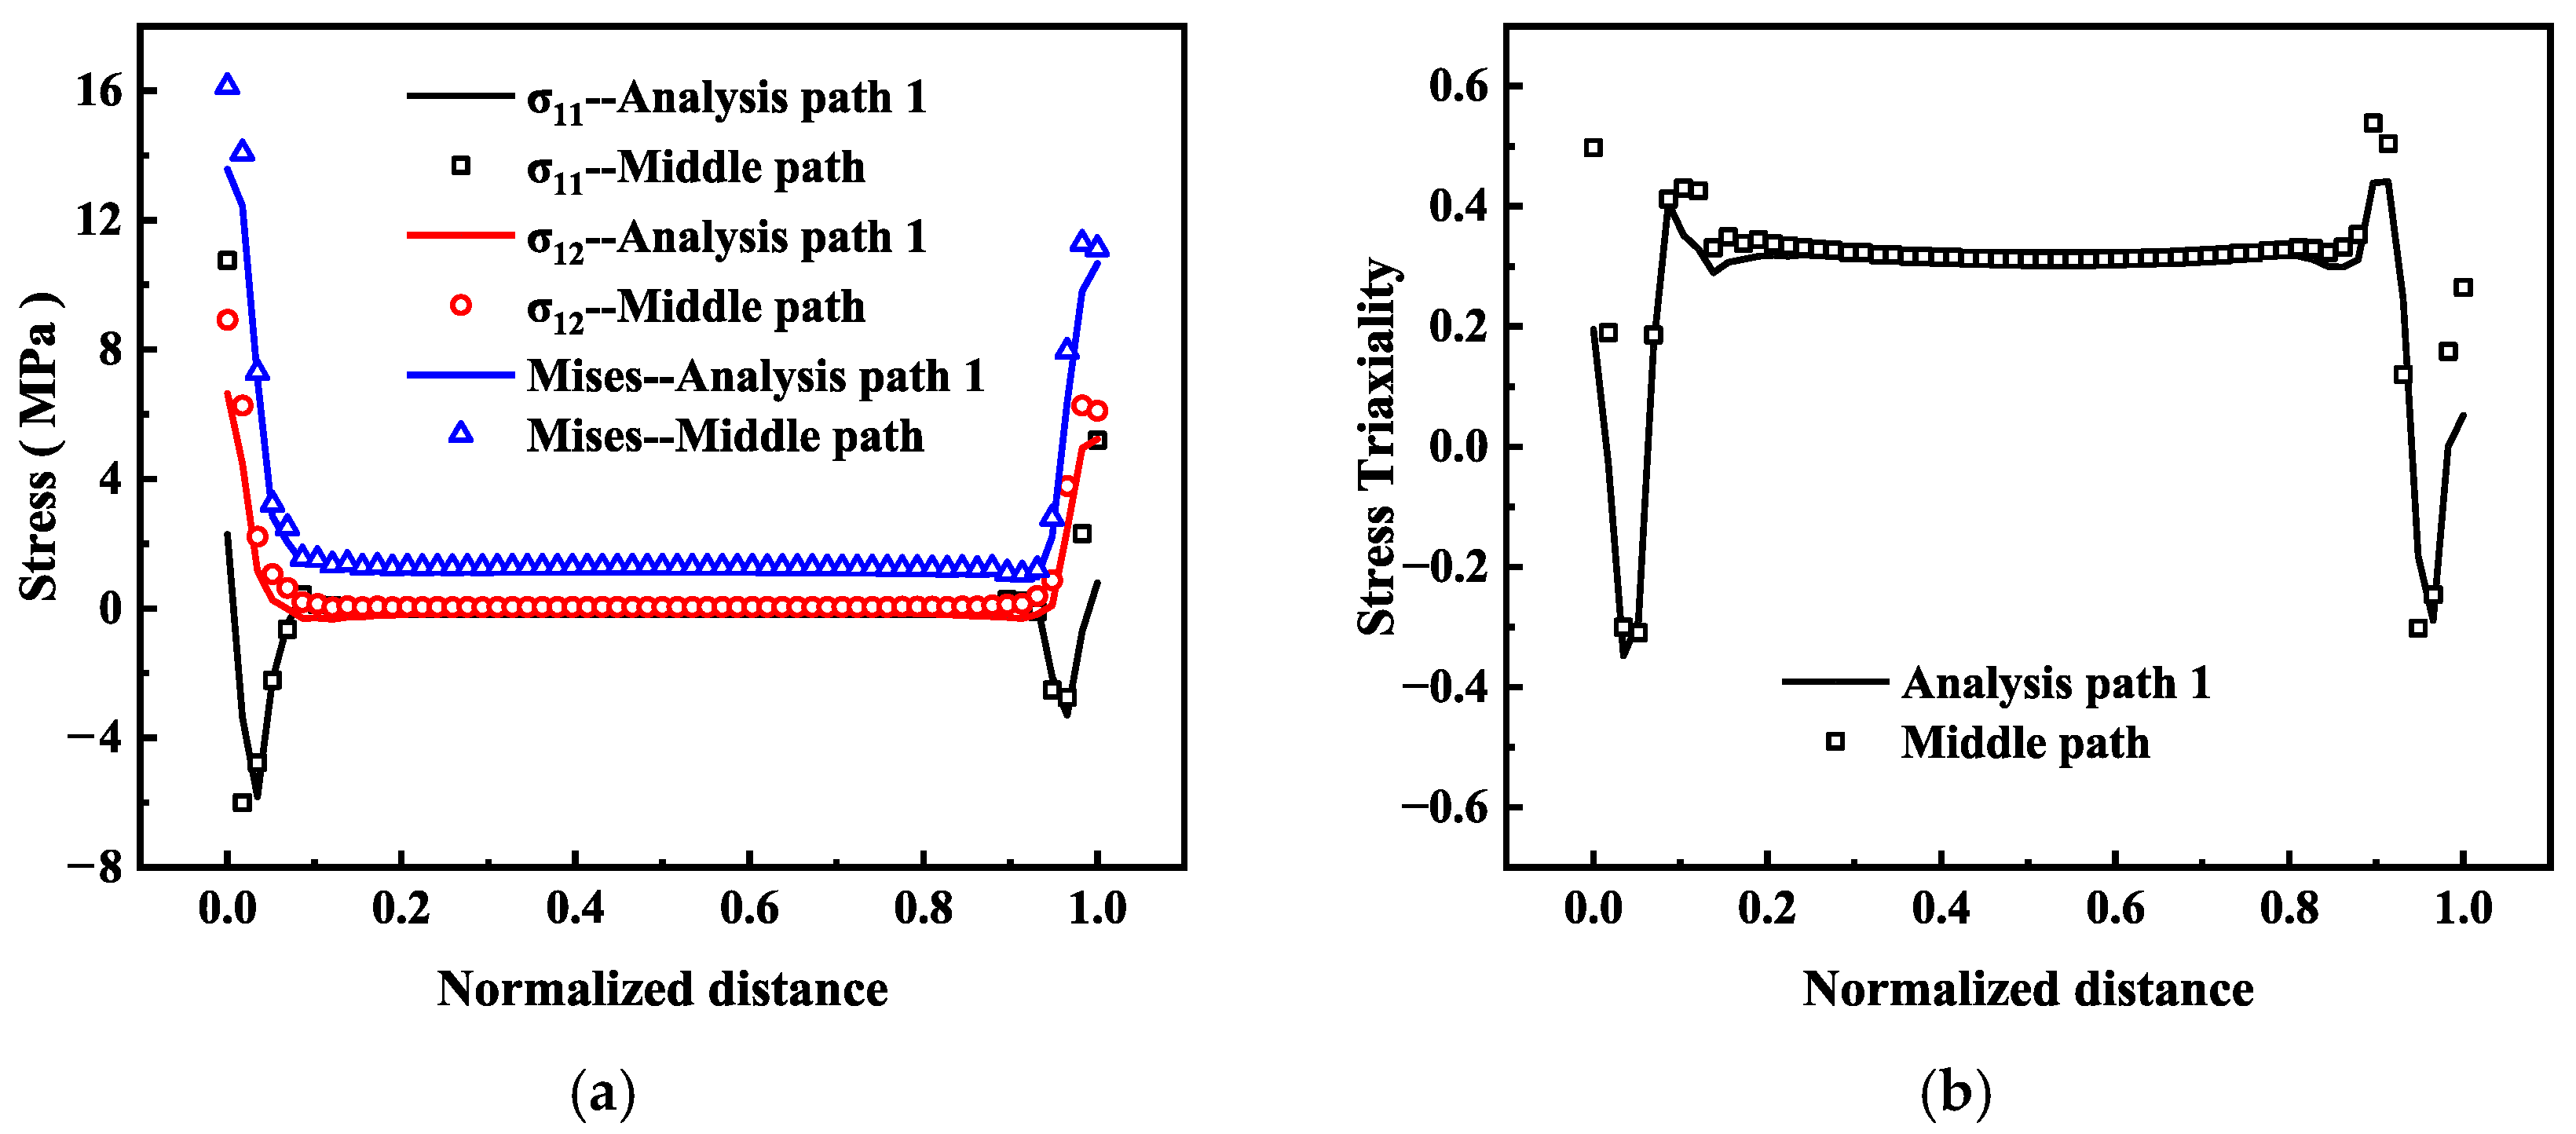
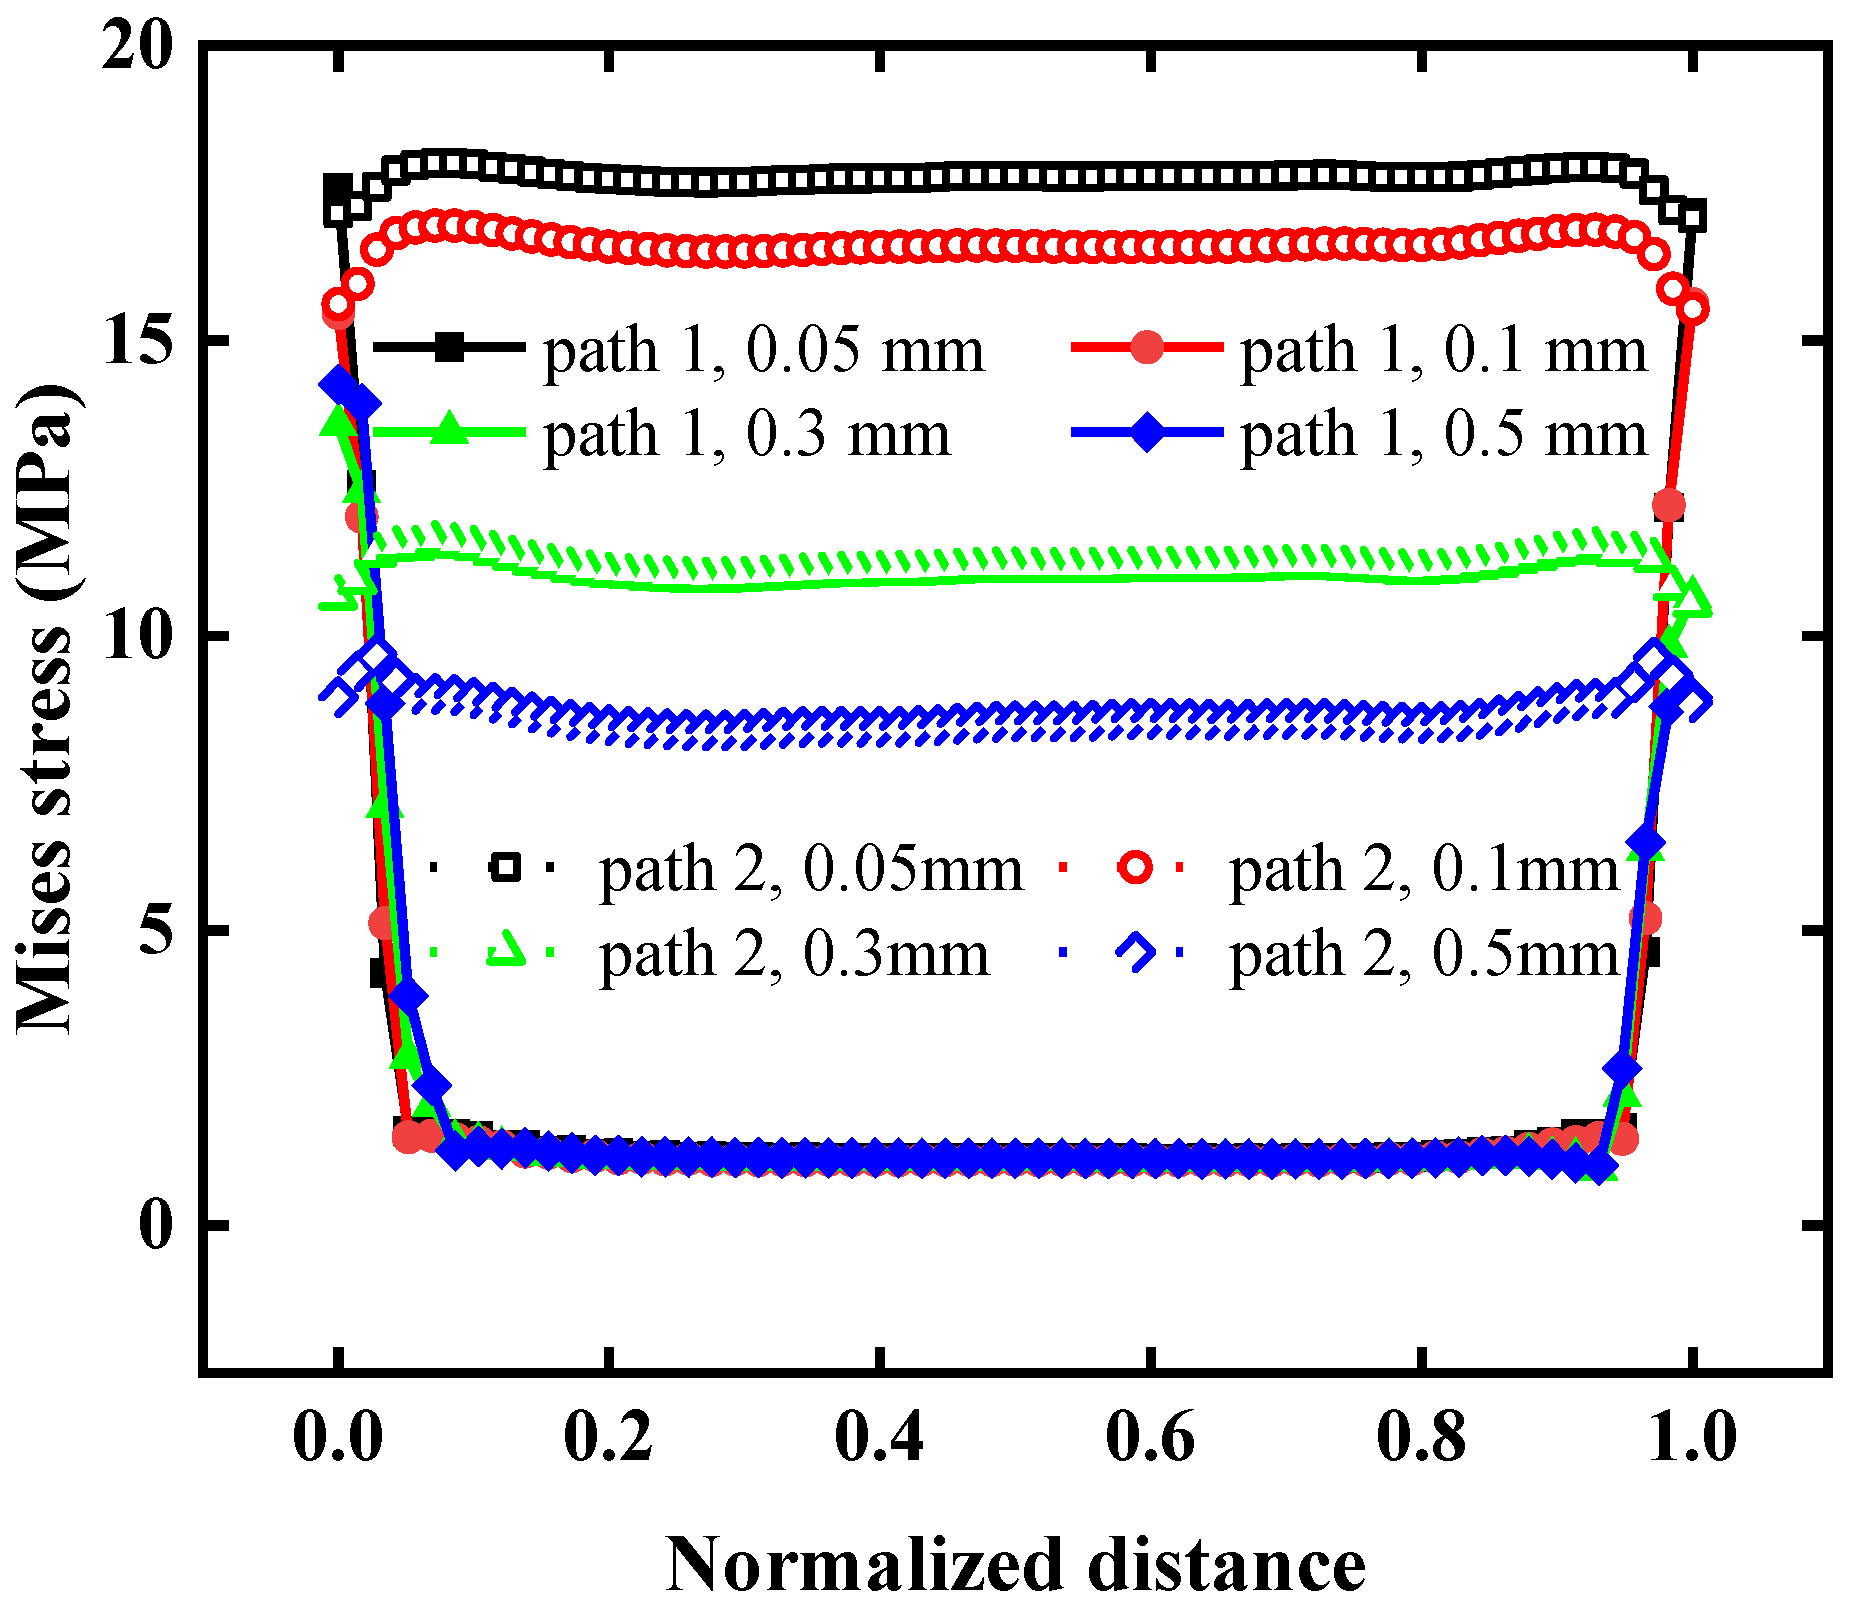
Figure 6 presents the stress distribution along different analysis paths, showing the detailed stress variations under a constant load. As shown in
Figure 7, the stress variations along different paths within the brazed region were compared. Stress triaxiality is defined as the ratio of hydrostatic stress to Mises stress. For plastic materials, plastic deformation is dependent on the hydrostatic stress, and both the yield criterion and the hardening/softening behavior must be expressed in terms of stress triaxiality. Stress triaxiality is also an important stress state parameter for ductile materials, used to characterize the plasticity and damage evolution of materials under complex stress conditions. The curves for the Middle Path and the Analysis Path 1 are essentially coincident, indicating that using the edge path alone is feasible and can substitute for the central path in analysis. Differences are mainly concentrated at the upper and lower edges of the brazed region, where stress fluctuations are more pronounced and sensitive to various factors. Therefore, an additional edge Analysis Path 2 was introduced for further evaluation.
Porosity is unavoidable in brazed elements during the welding process [
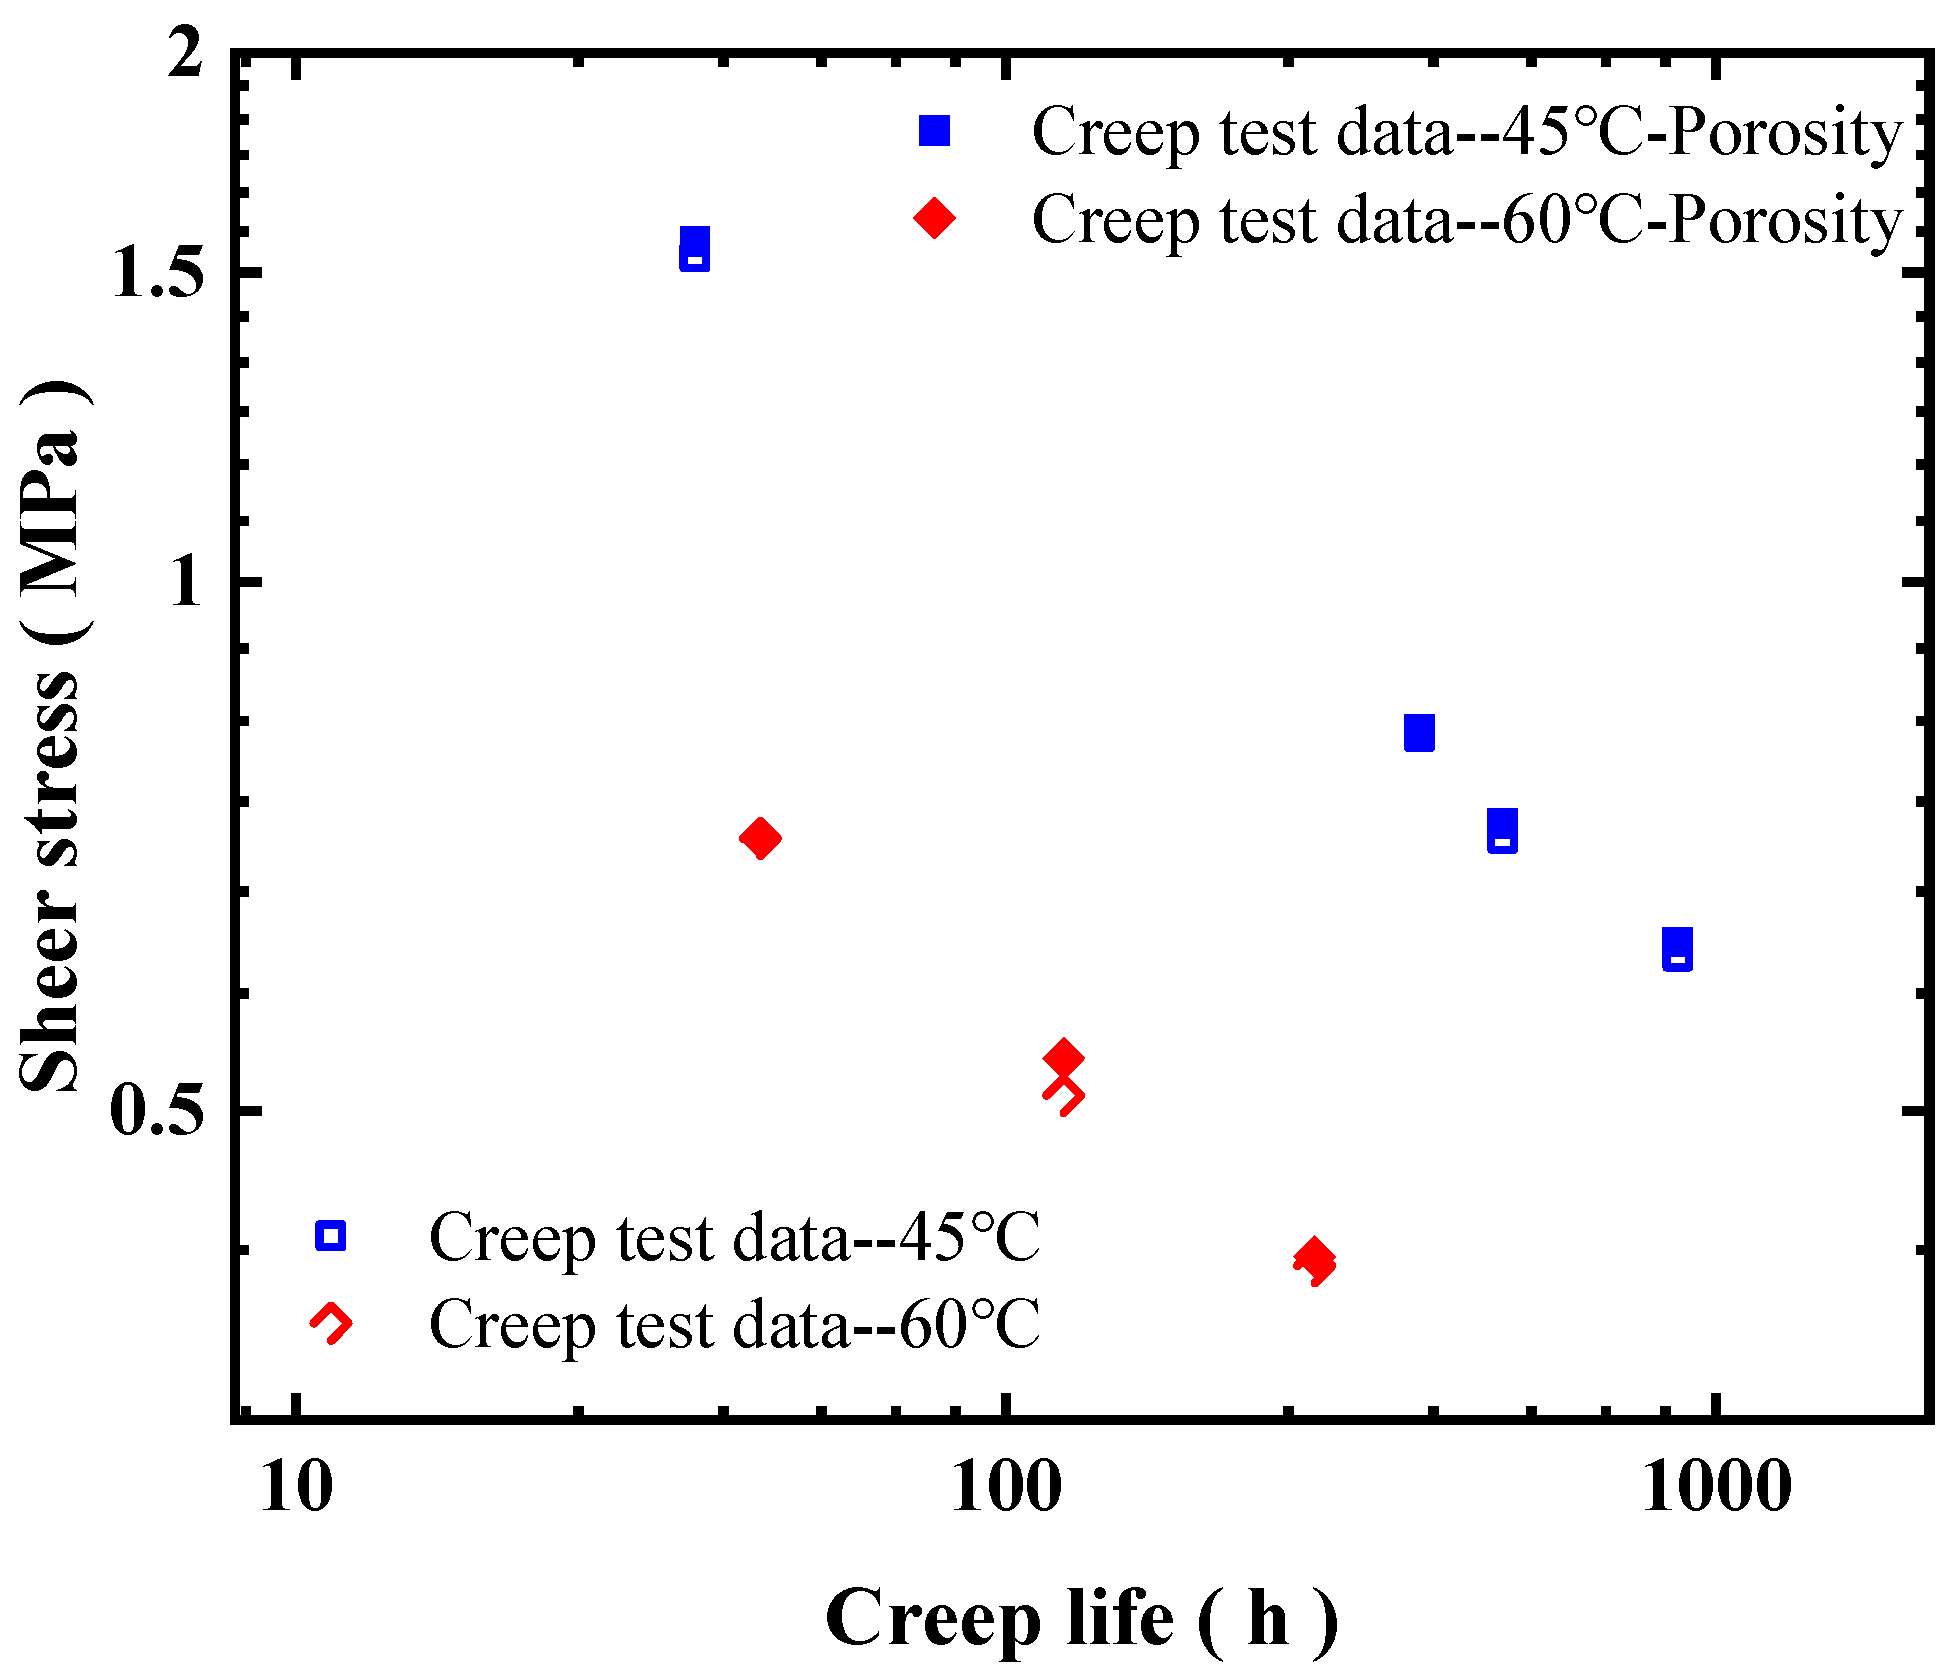
25]. Using the previously described treatment method, the presence of pores within the brazing layer is taken into account. Consequently, the actual load-bearing area is not the nominal cross-sectional area
S, but should consider the effect of the porosity
A0. Therefore, the actual load-bearing area
S1 can be expressed as:
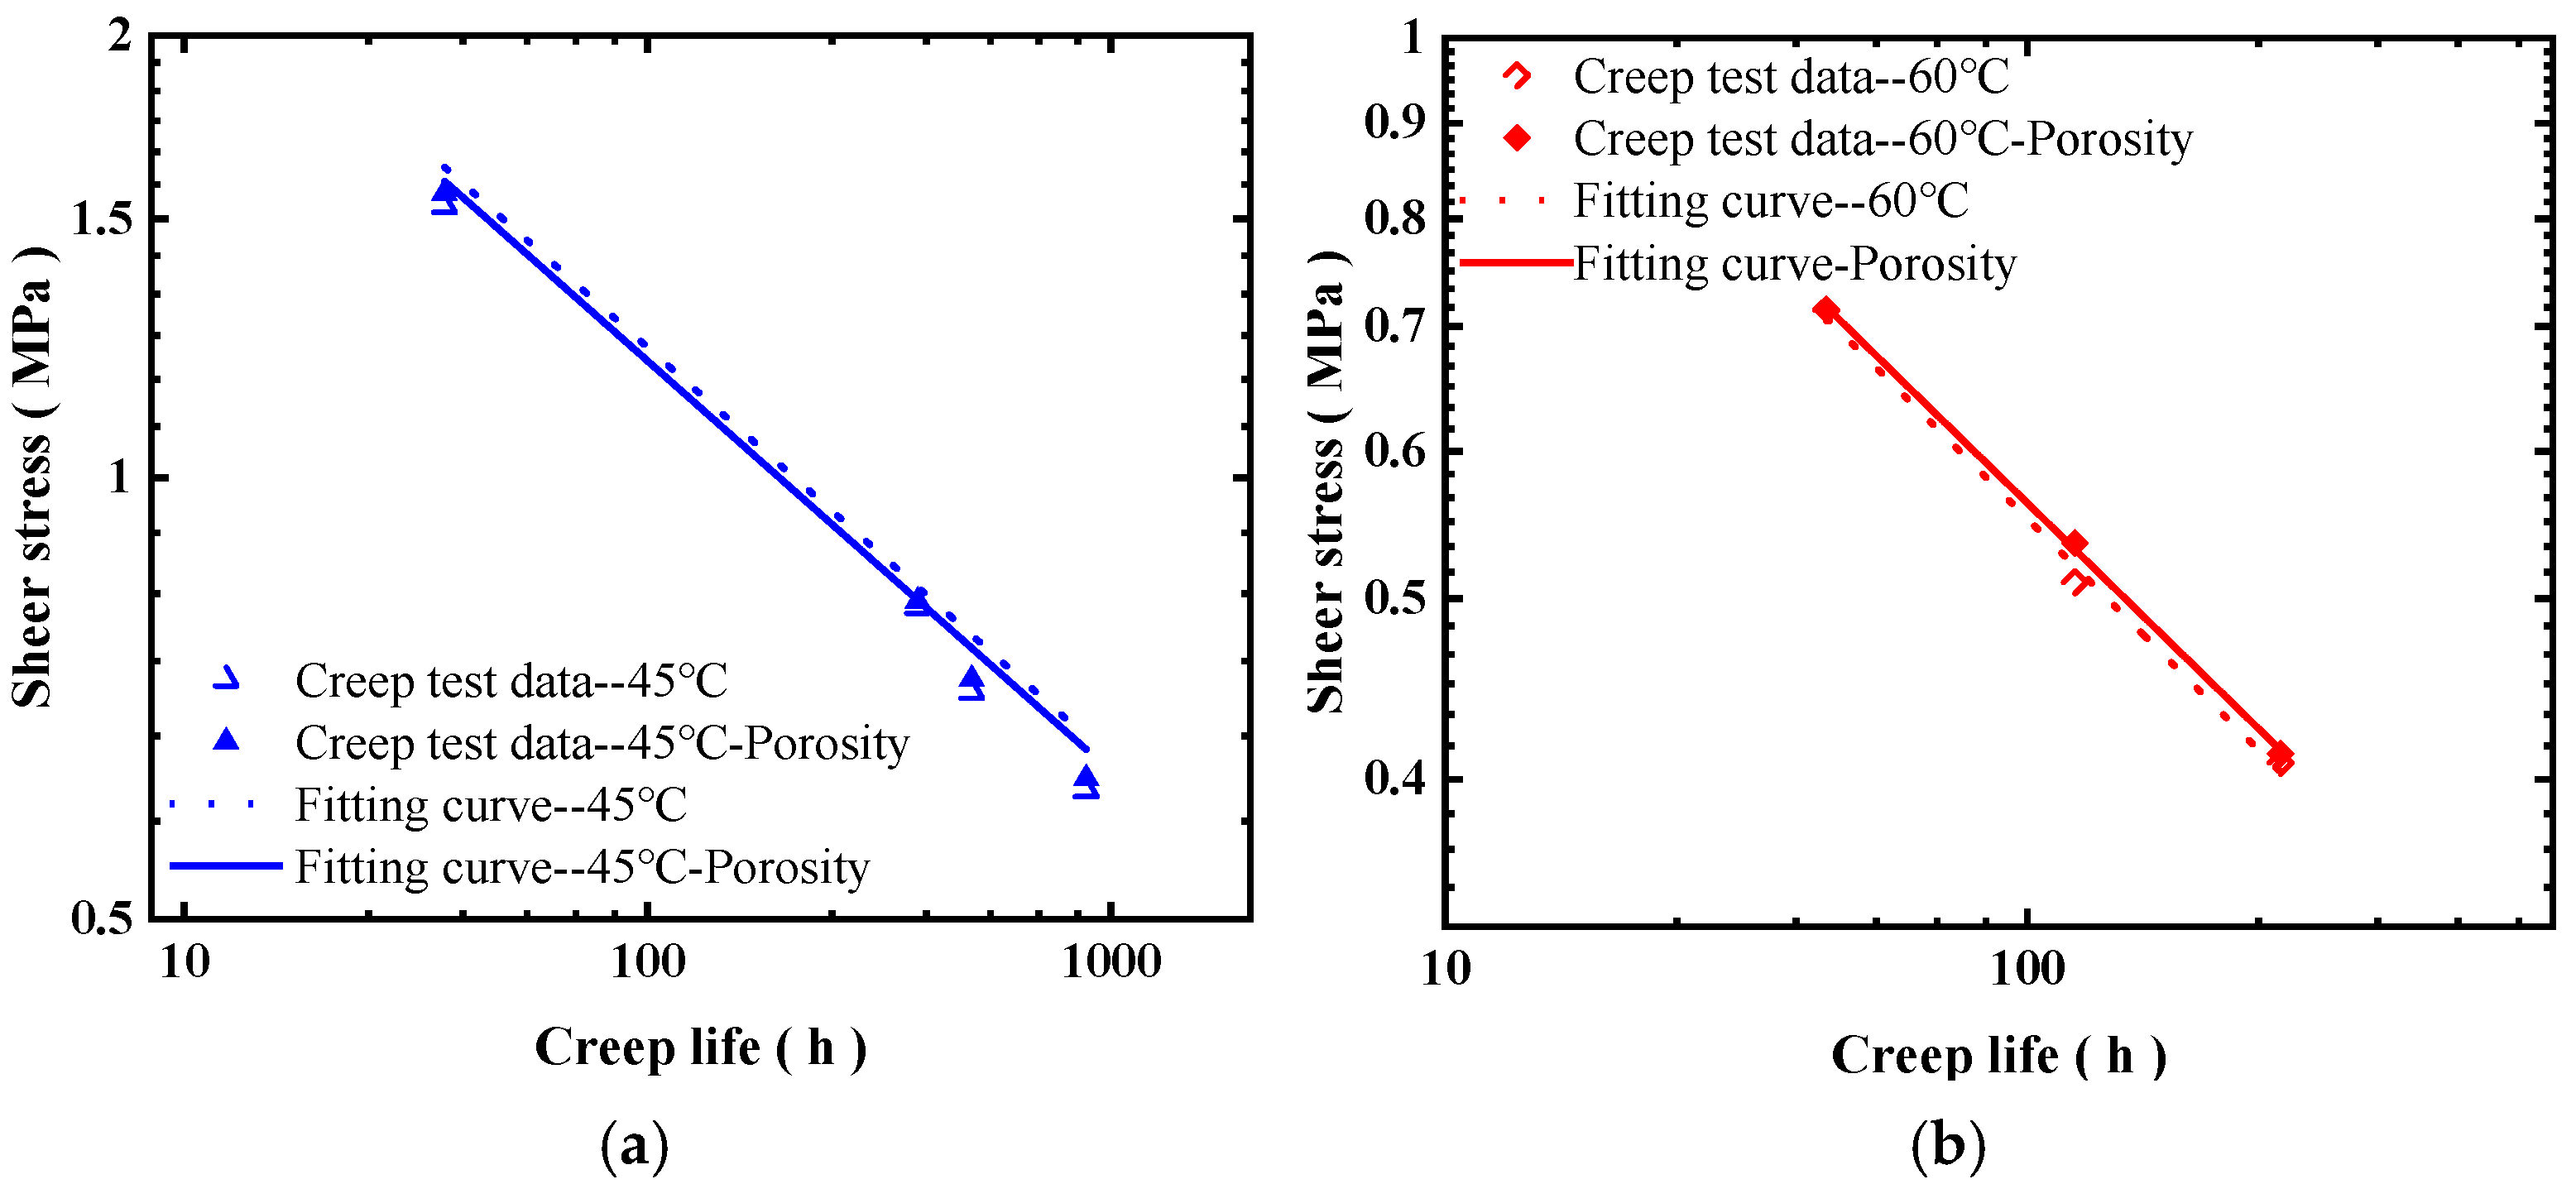
The actual equivalent stress increases compared with the case where porosity is neglected, which can have a significant effect on the prediction of creep life [
26,
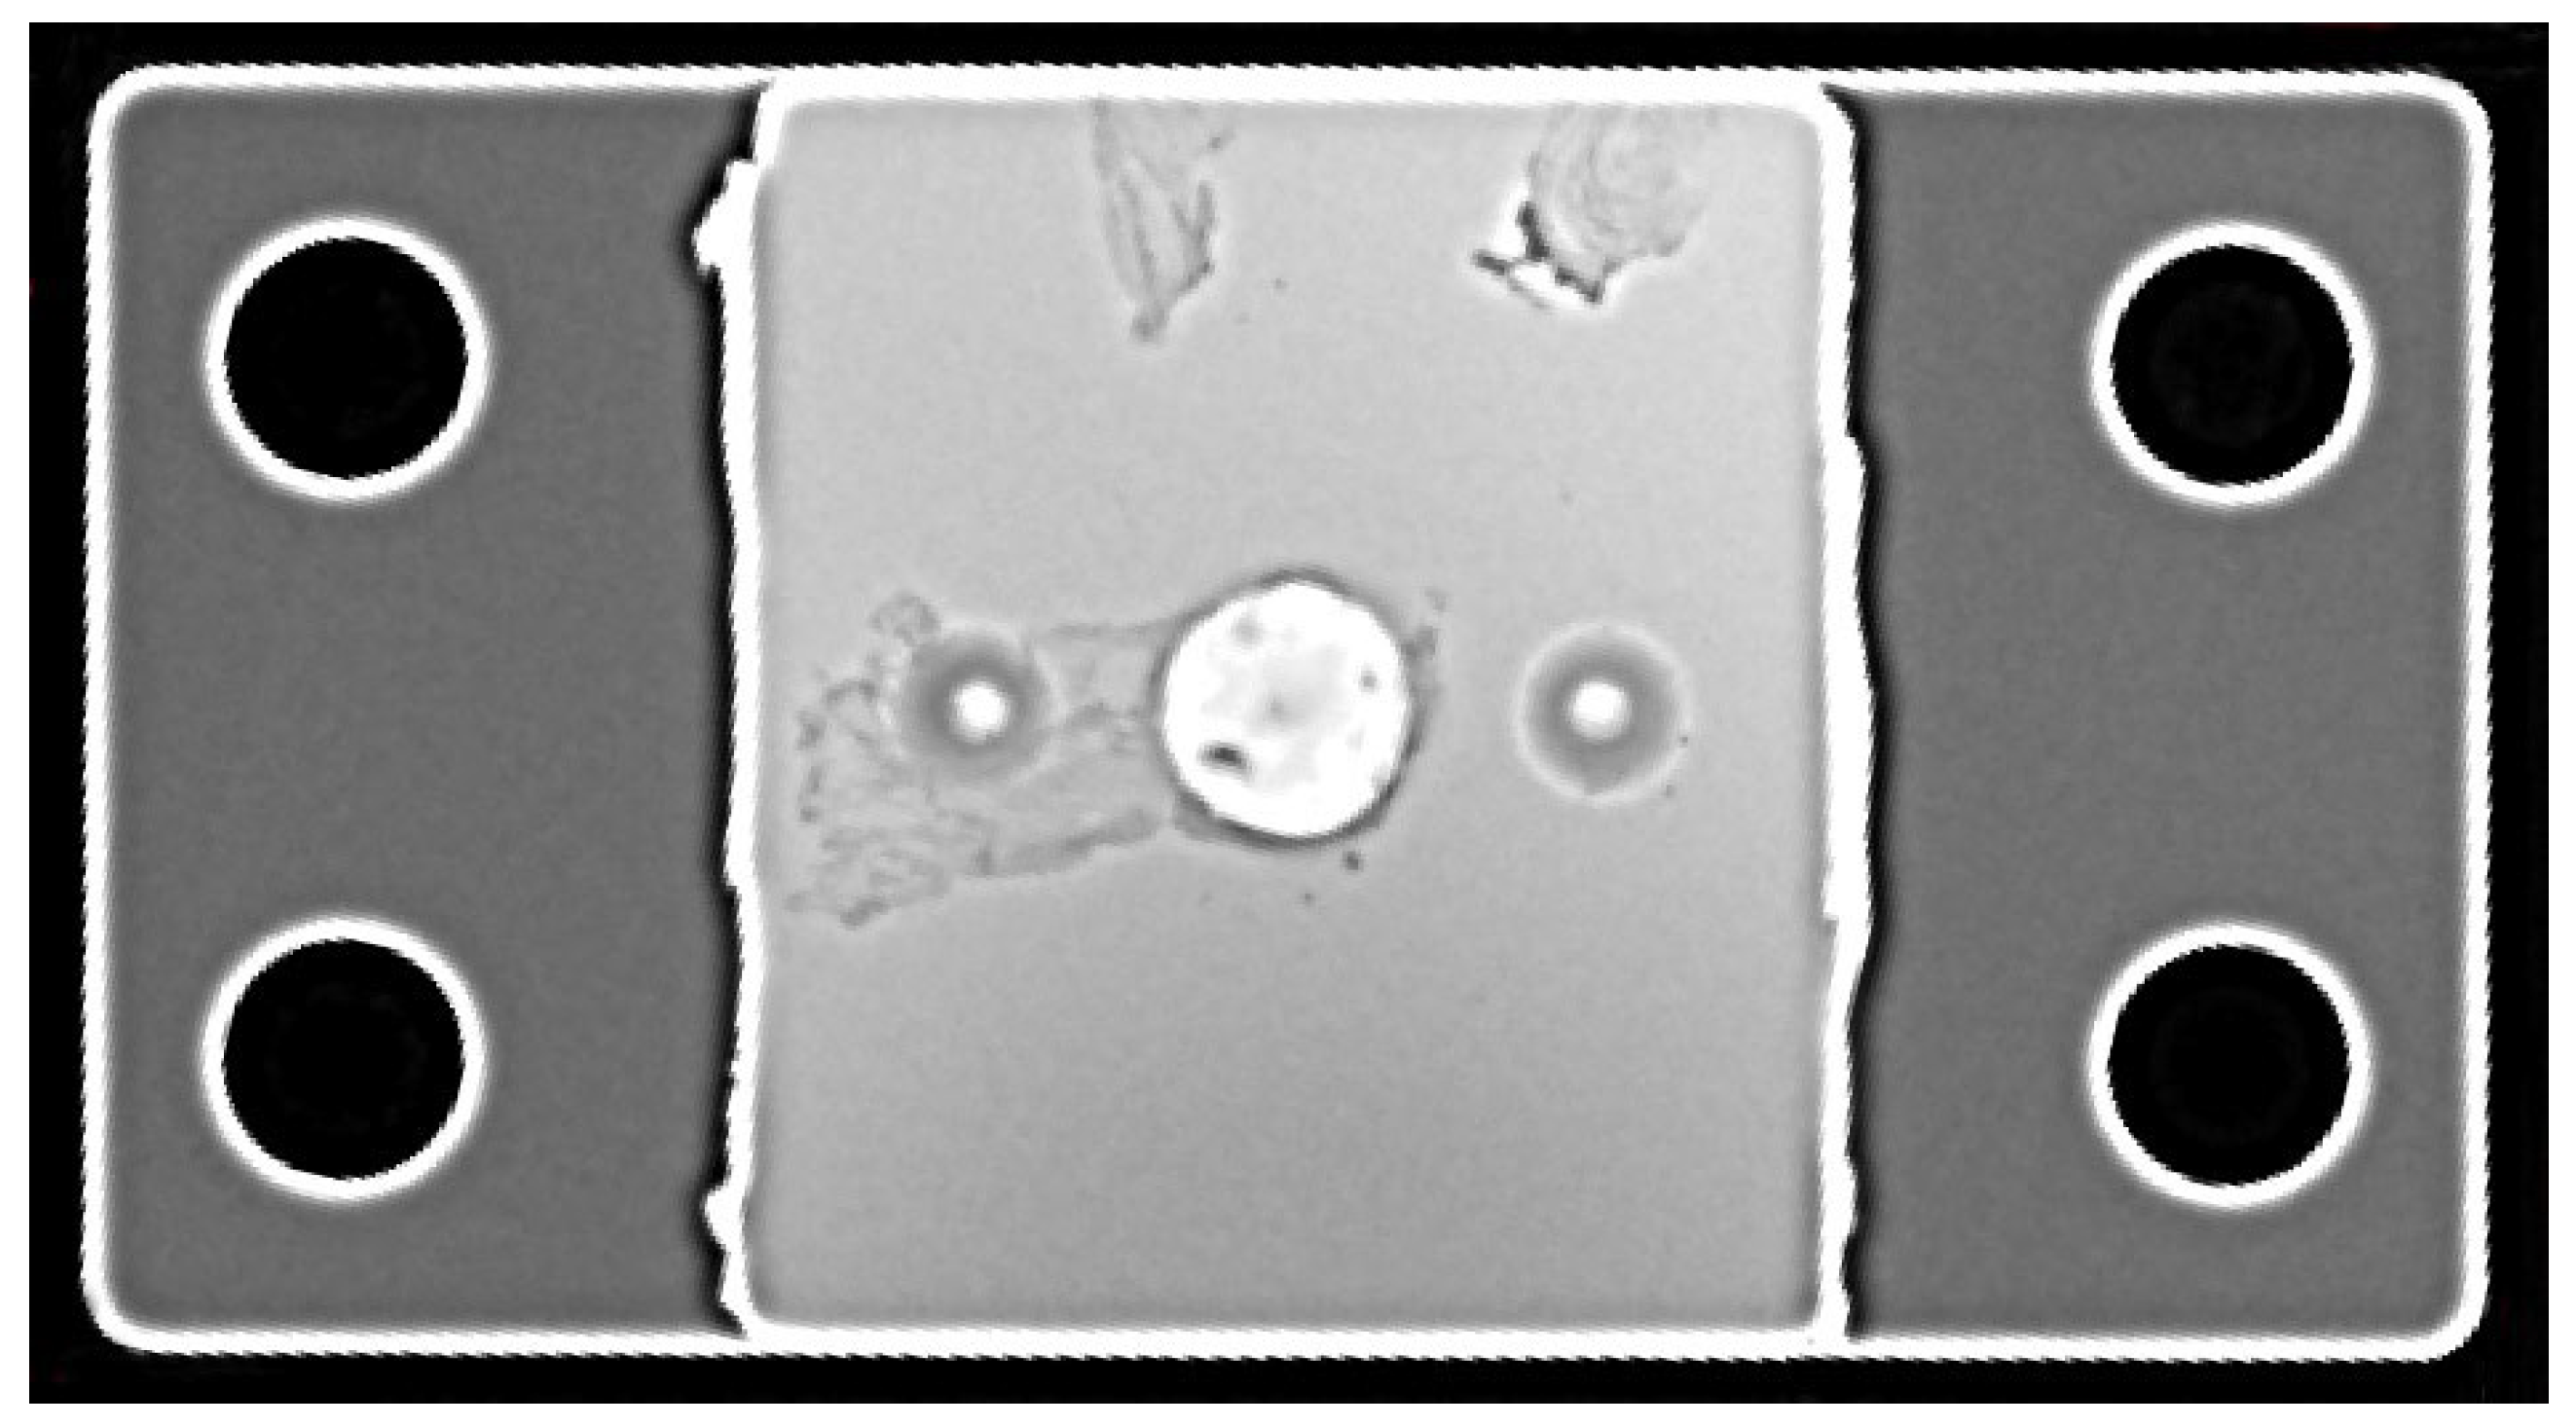
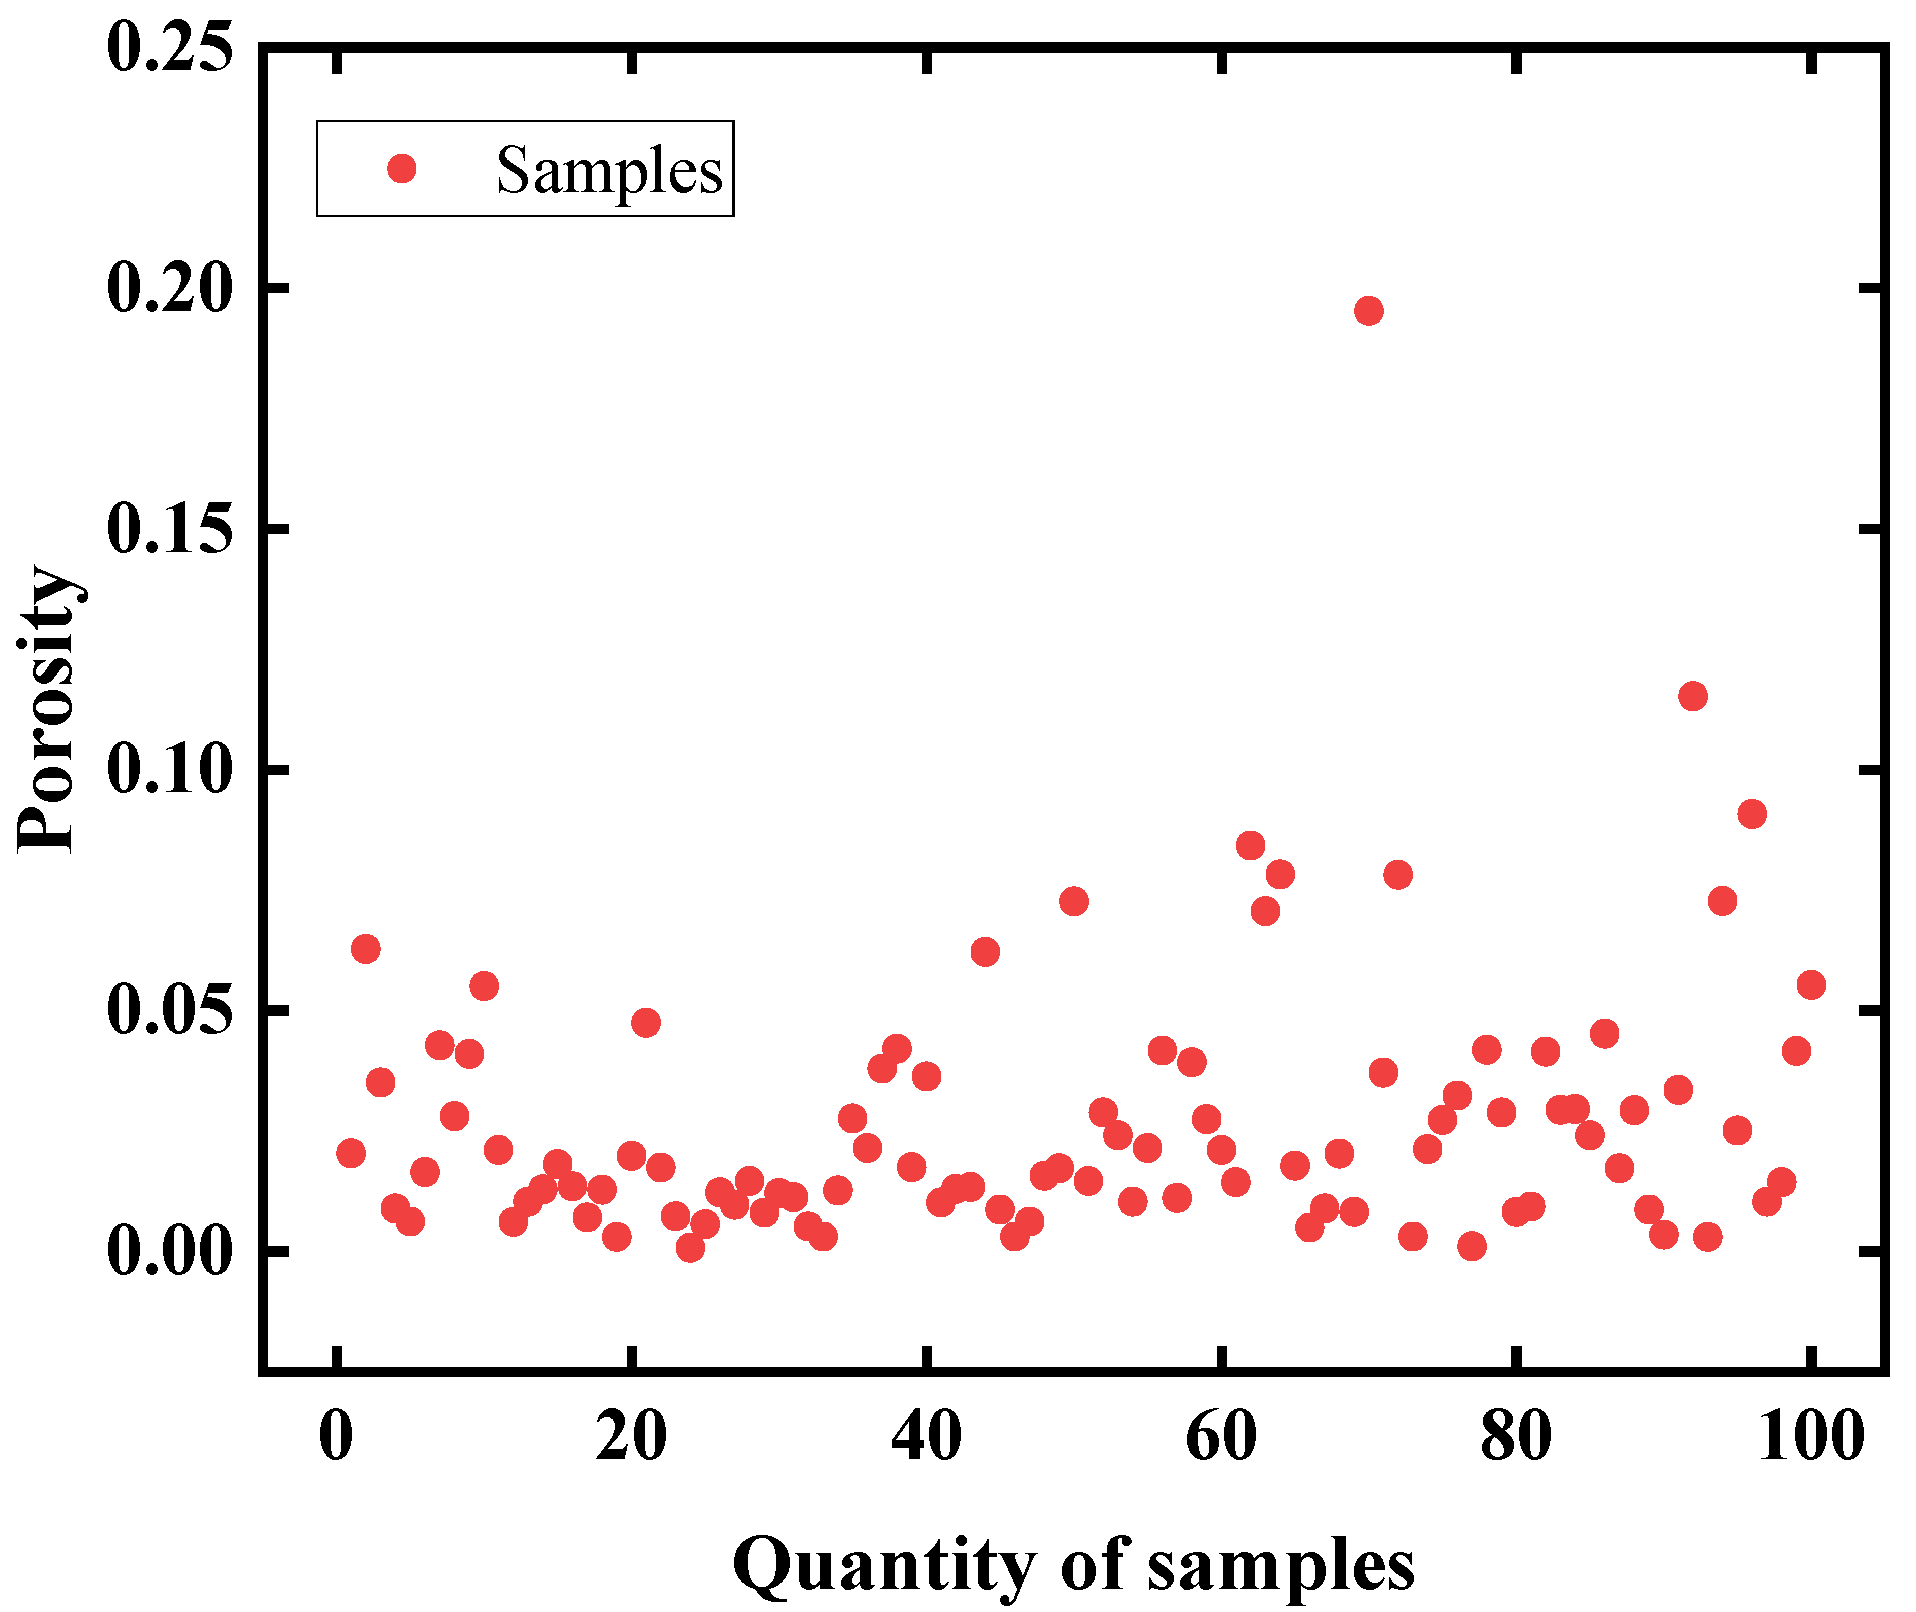
27]. X-ray digital scanning was employed to perform penetration imaging of the brazed elements, generating radiographic images as shown in
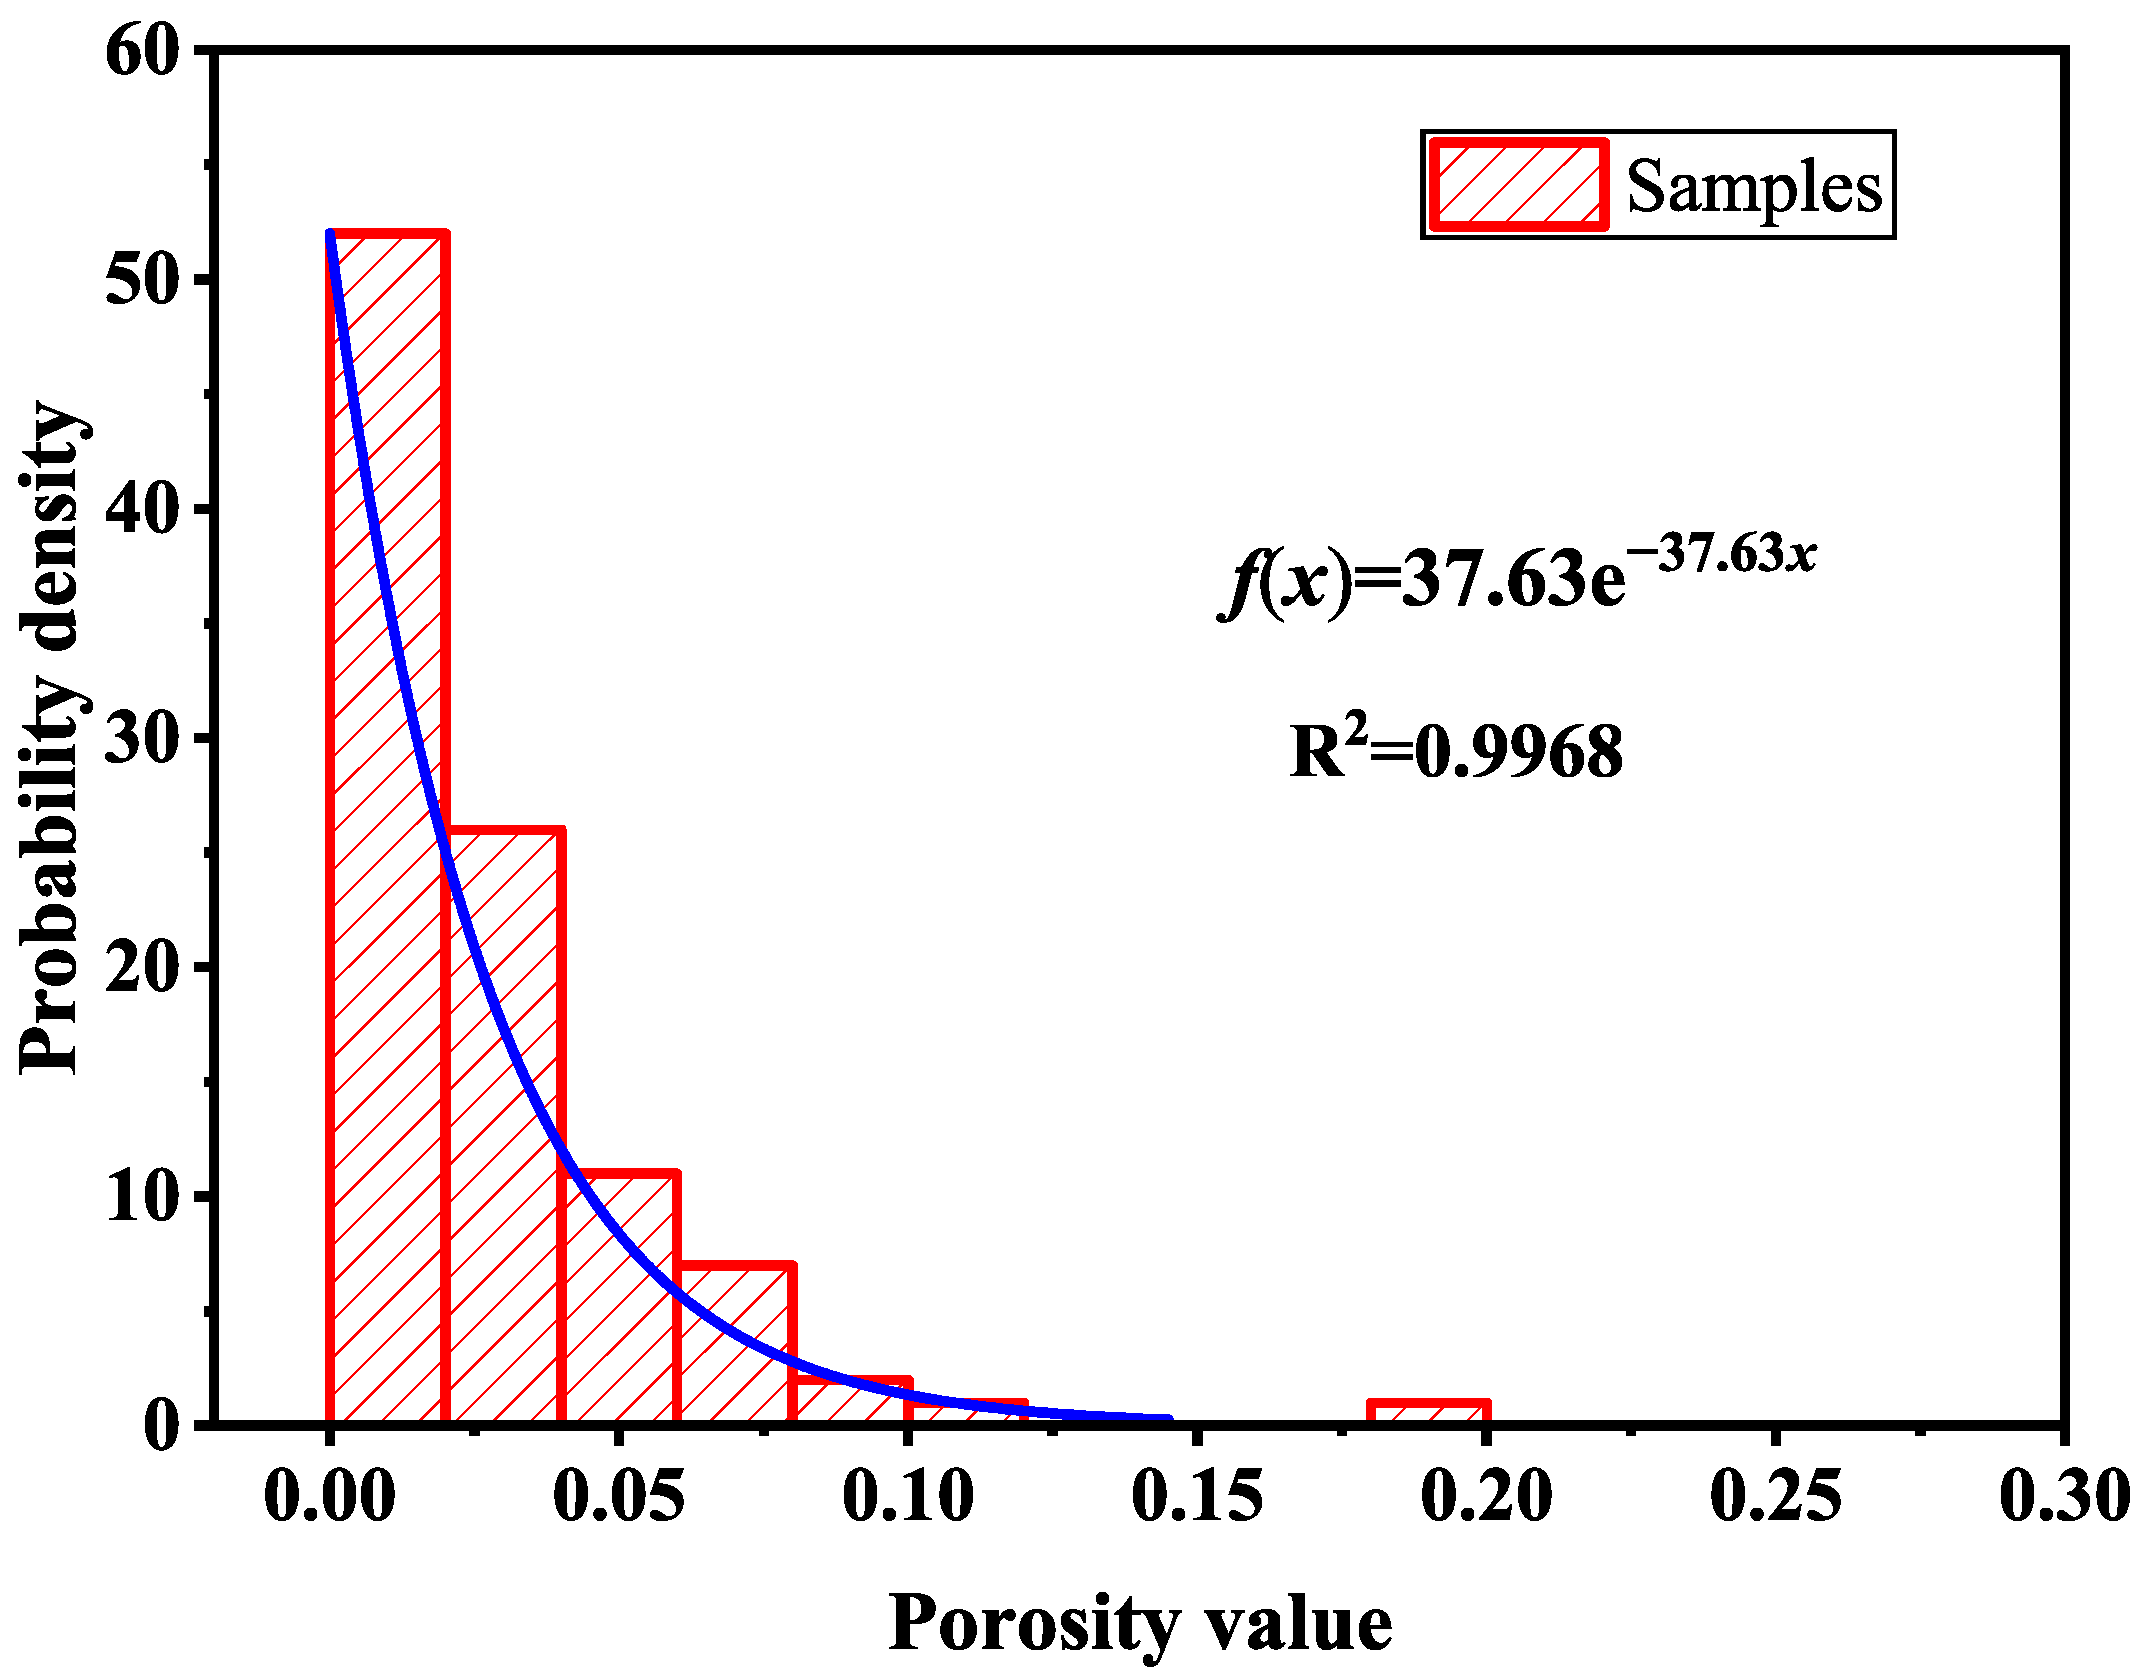
Figure 8. The porosity of the brazed elements was determined by calculating the ratio of pixels corresponding to pores to the total area of the brazed region in the images.
5. Conclusions
This study focused on the creep damage behavior and life prediction of Bi-based brazed elements under intermittent over-temperature service conditions. A comprehensive system was established, integrating material property testing, damage constitutive modeling, structural parameter sensitivity analysis, and life extrapolation. The main conclusions are summarized as follows:
- (1)
The temperature–time series obtained from infrared monitoring indicate that the components remain in a steady-state operating range of 45–55 °C for extended periods, with short-term temperature spikes approaching 60 °C occurring during operational fluctuations, maintenance, or load adjustments. This provides a realistic basis for setting the conditions and boundary parameters of the creep tests and models. Tensile and creep test results show that the brazed base material is insensitive to stress and temperature, whereas the filler metal exhibits a significant decrease in yield strength with increasing temperature, making it the primary fracture-critical region. The tensile fracture surfaces exhibit transgranular features, while the creep fracture surfaces display a typical intergranular failure mechanism, validating the differences in damage evolution under different loading modes.
- (2)
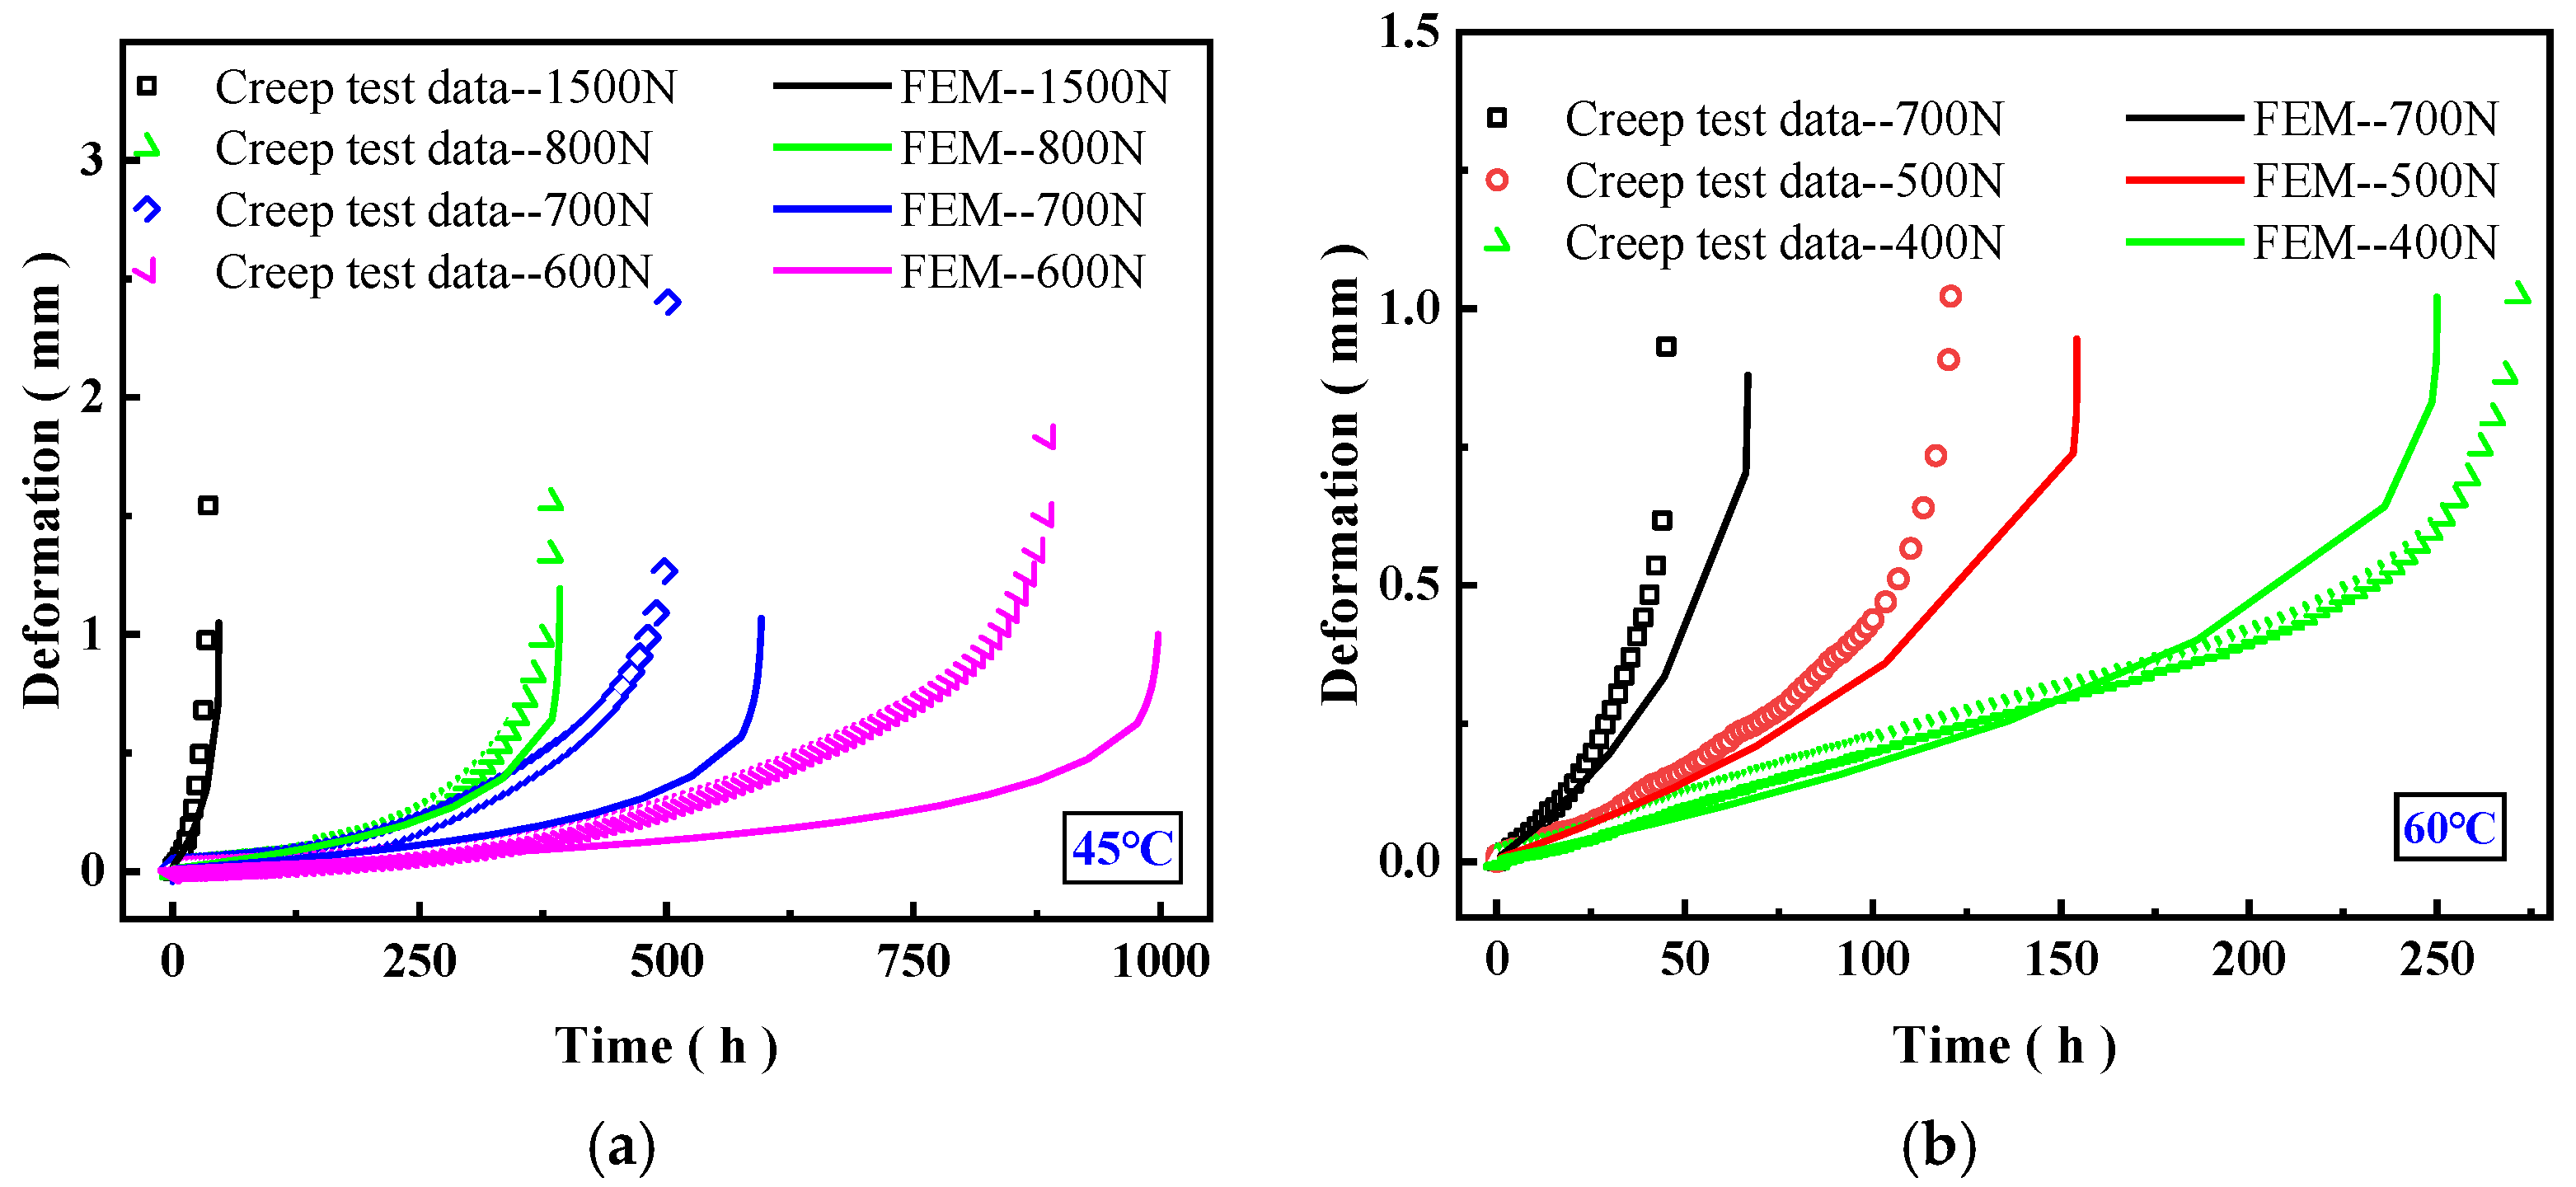
Within the equivalent stress–strain framework, large shear deformations were accounted for, and an improved Kachanov–Rabotnov creep damage constitutive model was introduced. Model parameters were fitted using creep experimental data, achieving good agreement and demonstrating that the model can accurately capture the damage evolution of soft brazed joints. Finite element validation results indicate that employing the equivalent stress–strain formulation for large deformations provides a more realistic representation of creep strain rates and life behavior. The model predictions exhibit high consistency with experimental curves on the lifetime scale, with the majority of errors controlled within 30%, confirming the validity and applicability of this approach.
- (3)
The structural parameter analysis indicates that the thickness of the brazing layer has a significant impact on the stress distribution in the edge regions. As the thickness increases, the von Mises stress, principal stress, and shear stress along the edge paths rise substantially, increasing the risk of failure. Porosity is another critical factor affecting creep life; digital radiography analysis shows that the specimen porosity follows an exponential distribution, and the creep life fitting curves accounting for porosity differ markedly from those that neglect it. Creep life follows a log-normal distribution, and the extrapolation model achieves good linear fitting at both 45 °C and 60 °C. By considering the combined effects of temperature conditions, brazing layer dimensions, and porosity, a method for predicting the remaining life of soft brazed elements was established. This approach enables the evaluation of structural health, life estimation, and failure risk classification, providing theoretical support and practical guidance for the safe operation and maintenance decision-making of enclosed structures such as those in nuclear power plants.
In summary, the integrated monitoring–modeling–prediction framework proposed in this study not only elucidates the creep damage mechanism of Bi-based brazed elements under intermittent over-temperature conditions, but also validates the applicability of the improved constitutive model coupled with structural parameter analysis for life prediction. This work provides a solid foundation for subsequent engineering applications.
