Abstract
In this paper, samples of nanocrystalline iron nitride γ’-Fe4N, doped with small amounts of hardly reducible promoter oxides (Al2O3, CaO, and K2O), were subjected to electron magnetic resonance (EMR) measurements. The samples differed in the average nanocrystallite size of iron nitride (23–54 nm). The EMR analysis was performed to probe the magnetic characteristics of the nanoparticles. The spectra, fitted with a Voigt function, were deconvoluted into contributions from the γ’-Fe4N phase in the nanoparticle core and from surface-associated iron ions. The resulting magnetic responses were quantitatively correlated with nanoparticle size, elucidating finite-size effects governing the system’s magnetic behavior.
1. Introduction
The chemical and physical properties of materials are strongly influenced by their particle size [1]. When the size of a material is below 100 nm in at least one dimension, it is classified as a nanomaterial. At this scale, the principles of classical physics lose significance, while quantum effects become increasingly important [2]. As a result, nanomaterials often exhibit unique properties not observed in their bulk counterparts [3,4,5,6]. However, merely identifying a material as nanocrystalline is not sufficient to fully characterize its properties. It is also essential to determine the nanocrystallite size and whether the size distribution is narrow or broad [7,8]. It plays a critical role, affecting melting and evaporation temperatures [9,10,11], dielectric and magnetic behavior [12,13,14], and mechanical strength [15,16].
The size of the nanocrystallites also affects reactivity of the material [17,18,19,20,21]. For example, in the nanocrystalline Fe-NH3-H2 system, the Gibbs free energy required for phase transformations, supplied by the nitriding potential of the ammonia–hydrogen mixture, depends on the active surface-to-volume ratio (Sact/V) and is lowest for the largest nanocrystallites. Consequently, processes such as nitriding of nanocrystalline iron, the transformation of α-Fe into γ’-Fe4N, and the reduction of nitride back to metallic iron occur in order from the largest nanocrystallites to the smallest. Moreover, the difference in phase transformation enthalpy between the smallest and largest nanocrystallites is greater for nitriding than for reduction, leading to the appearance of a hysteresis loop in which two phases can coexist in a stationary state [18].
Therefore, it is important to develop methods for obtaining nanoparticles with specific properties. Currently there are many methods for the synthesis of nanomaterials, such as chemical vapor deposition, epitaxial growth, colloidal dispersion, sol–gel, mechanical grinding, and many others [22,23,24]. However, synthesis of nanoparticles with specified nanocrystallite size is still a challenge [25]. In addition, the production of useful products from nanomaterials often requires consolidation at high temperatures. During this process relatively rapid diffusion is observed. As its result, the size of the grains increases, and the properties of the material are more like their coarse-grained substitutes. Obtaining nanocrystallites of metals with a defined average size of nanocrystallites is possible by separating them from the material that contains many fractions of nanocrystallites of different sizes [26]. It uses the presumptions of the chemical reaction model in the adsorption area, which was developed for nanocrystalline materials [27]. In this model, the rate of the entire process is limited by the rate of dissociative gas adsorption of the substrate on the surface of the nanocrystalline solid. Part of the surface reaction products dissolve in the volume of nanocrystallite, and after exceeding the critical concentration, its phase transformation takes place in the entire volume. The rate of reaching the critical concentration depends on the ratio of the surface of a given nanocrystallite to its volume: smaller nanocrystallites reach saturation more quickly, triggering earlier phase transitions. Based on this mechanism, the synthesis of γ’-Fe4N iron nitrides investigated in this work was carried out.
Iron nitrides are of particular interest due to their magnetic properties, which make them suitable for applications in medicine, abrasive materials, environmental remediation, and data storage devices, among others [28,29,30,31,32,33]. They are also being investigated as promising alternatives to rare-earth-based magnets, which are expensive, environmentally challenging to extract, and geographically concentrated in limited regions. Developing efficient iron nitride-based magnetic materials could, therefore, reduce dependence on scarce rare-earth resources, contributing to more sustainable and economically viable magnetic technologies [34,35]. Their properties depend on factors such as the Fe:N ratio and crystallinity. Studies have shown that coercivity, remanent magnetization, and saturation magnetization increase with crystallinity in FexN compounds, while the magnetic moment increases with the Fe:N ratio [36,37]. Furthermore, nanocrystallite size can significantly affect magnetic properties. For instance, the size of iron oxide nanocrystallites has been shown to influence their magnetism, and investigations of nanocrystalline iron nitriding kinetics suggest that crystallite size impacts not only reaction rates but also magnetic permeability [38,39,40].
In the context of potential applications for these materials, magnetic susceptibility and electron magnetic resonance (EMR) studies provide key information. These studies reveal the soft ferromagnetic nature of the materials under investigation and a clear dependence of magnetic properties on nanoparticle size. For small dimensions, both the nanoparticle core and its surface make significant contributions, and variations in particle size can markedly alter the overall magnetic response of the material. The analysis was conducted within the framework of finite-size effects.
In the current publication, we intend to demonstrate how to separate a set of nanocrystallites into individual fractions of different sizes and study their magnetic properties. This time, nanocrystalline iron nitrides are synthesized in phase γ’-Fe4N. Thus, taking into account the above prospects for the application of iron nitrides, the main goal of the present work is to prepare the series of nanocrystalline iron nitride samples (S1–S4) containing nanocrystallites of a particular size—firstly, to confirm the efficiency of the chemical method used for a different chemical system (iron nitrides), and secondly, to investigate their magnetic properties in the context of the tremendously important and prospective magnetic properties of such nanomaterials as a function of their nanocrystallites size. Therefore, one of the most sensitive research methods for such interactions, which is magnetic resonance, was used.
2. Materials and Methods
A starting material for preparation of the tested samples was obtained by fusing magnetite with small amounts of promoters such as Al2O3, CaO, and K2O (in a total amount of max. 10% by mass to stabilize the nanocrystalline structure of iron even at very high temperatures and for periods counted in years; without these promoters, such a structure is stable only at temperatures no higher than room temperature and for periods of weeks) [38]. After cooling, the alloy (named as precursor) was crushed and sieved, and grains of size 1.0–1.2 mm were selected for further research. The oxidized form of iron was reduced in the mixture of hydrogen–nitrogen (3/1) at a temperature of 500 °C under atmospheric pressure, and then cooled down in the stream of nitrogen and passivated to avoid autoignition of the active bed. In this way, nanocrystalline iron covered by the passivating oxide film was obtained (named as the pre-reduced form of nanomaterial). An average nanocrystallite size of iron determined by the X-ray diffraction (XRD) method using the Rietveld equation was 23 nm (X’Pert Empyrean Philips, Malvern Panalytical Ltd., Malvern, UK): a copper lamp—the source of the radiation (λ = 0.1540 nm, accelerating voltage 35 kV, current 30 mA); angle in the range 10–110° [2Ө]; step 0.05°; and count equal to 400 s per step were applied. Nanocrystallite size distribution standard deviation σ = 15 nm (determined by Pielaszek’s method [41,42]). Phase analysis of the prepared samples was also performed using the Rietveld method. All the calculations related to phase analysis were performed using the Philips X’Pert HighScore 3.0 software based on crystallographic data from the identification card database ICDD PDF-4+. The following cards of indices were used: 04-003-3884 (Fe), 04-007-1060 (Fe3O4), and 04-004-9107 (γ’-Fe4N).
Specific surface area of the solid sample after reduction of the precursor and passivation (pre-reduced form of nanocomposite studied), determined by means of the volumetric method (using the Brunnauer–Emmet–Teller (BET) equation and apparatus AutoChem II 2920, Micromeritrics, Norcross, GA, USA), equaled 8.77 m2/g. The porosity was 0.5.
Chemical composition of the precursor, in wt%: 2.85 Al2O3, 3.43 CaO, 0.75 K2O (the rest was magnetite), was determined using Inductively Coupled Plasma Optical Emission Spectrometry (ICP-OES; Perkin Elmer Optima 5300 DV, Waltham, MA, USA).
Morphological properties of the obtained nanocrystalline iron samples were determined using transmission electron microscopy (TEM, Tecnai F30 with a field emission gun operating at 200 kV, Thermo Fisher Scientific, Waltham, MA, USA).
Chemical reactions such as reduction of the passive layer of the prepared samples nanomaterial (with hydrogen), oxidizing (with water vapor), and nitriding (with ammonia) were carried out in a tubular differential reactor equipped with a measuring system to perform thermogravimetric studies (accuracy of 5·10−5 g) simultaneously with the katharometric analysis of a gas chemical composition (hydrogen concentration in a gaseous mixture of reactants: accuracy of 0.02 vol. %). This apparatus was designed and manufactured by means of our own supplies and certified by appropriate external authorities [40,43,44,45]. Solid nanocrystalline samples (1 g) were placed in the form of a single layer of grains in a platinum sample holder (small basket) hanging on the arm of a thermobalance. Gas samples were taken from the immediate surroundings of the nanomaterial sample. Gaseous reactant (hydrogen, ammonia, and nitrogen with water vapor) gas flow rates were regulated by electronic mass flow controllers (Brooks Instrument, Hatfield, PA, USA).
Reference sample, S0, was prepared by the following steps: I. A total of 1 g of passivated nanocrystalline iron was placed in the platinum basket inside the tubular differential reactor described above. The passive layer was reduced polythermally with hydrogen (12 dm3 H2/(h g)), increasing the process temperature from room temperature (RT) to 500 °C with a rate of 10 °C/min. During the reduction, the bridges of structural promoters (Al2O3, CaO) between iron nanocrystallites were formed, and the surface of nanocrystallites was wetted with a K2O layer [43,46]. II. After reduction, the temperature inside the reactor was reduced to 350 °C and the sample was nitrided isothermally at this temperature under atmospheric pressure, in a stream of ammonia–hydrogen mixture (NH3 purity—99.98%, H2 purity—99.999%; total flow rate 12 dm3/(h g)). The nitriding potential, P, of the NH3-H2 mixture is expressed by the following equation:
where pNH3—partial pressure of ammonia [Pa]; pH2—partial pressure of hydrogen [Pa].
The process of nitriding was carried out with the value of lnP = −3.5 until the weight of the solid sample was stabilized. These conditions are known from [47]. Then the solid sample was cooled down in the stream of nitriding mixture and passivated. In such a way, iron nitride γ’-Fe4N with a wide nanocrystallite size distribution ( = 23 nm, σ = 15 nm) was synthesized. To see what happens when a gas stream containing 100% ammonia is introduced into the reactor, an S0 sample was nitrided at the same temperature, also in an ammonia stream with a flow rate of 12 dm3/h.
The pre-reduced form of nanomaterial was subjected to a series of processes in order to obtain samples (S1–S4) of iron nitride γ’-Fe4N with narrower nanocrystallite size distributions compared to the reference sample. The procedure was as follows [38]: I. A total of 1 g of passivated nanomaterial was reduced in a tubular differential reactor under the same conditions as sample S0. II. Then, the oxidation process of nanocrystalline iron was performed: reduced and thus activated samples were oxidized at a temperature of 500 °C in a stream of nitrogen (15 dm3/(h g)) saturated with water vapor (0.02 bar H2O) until the different oxidation degrees (related to magnetite) were obtained. The magnetite content in the samples expressed by the mass fraction was 0.05 (S1), 0.14 (S2), 0.18 (S3), and 0.21 (S4)—measured by the thermogravimetric method in a tubular differential reactor mentioned above. III. After the oxidation process, the gas atmosphere inside the reactor was changed from oxidizing to an inert (pure N2), and the samples were cooled down and passivated. During oxidation, only a part of the iron nanocrystallites underwent a phase transition to magnetite, and the rest of the iron remained in the unoxidized metallic form [40]. At this stage, the samples were characterized by the XRD method (tests confirmed the existence of mixtures of only two phases at this stage: metallic iron and magnetite in various amounts). IV. Next, the samples were subjected to careful etching in order to remove metallic iron from the samples and save magnetite. Each sample in the form of grains was triturated in an agate mortar and then placed in a 100 mL beaker with 50 mL of 0.1 mol/dm3 nitric acid, etched for 4 h, rinsed with distilled water, filtered under reduced pressure, and dried at 105 °C for 6 h. At this stage, the samples were also characterized by the XRD and BET methods. V. The next step of sample preparation was the reduction of the magnetite remaining in the samples after etching (approx. 100% of this phase according to the XRD method). For this purpose, powdered sample of a weight of ca. 0.2 g (the amount remaining after etching of a sample of initial 1 g) was placed in a quartz vessel suspended on the arm of a thermobalance. Magnetite was reduced polythermally with hydrogen (12 dm3/(h g)), increasing the process temperature from RT to 500 °C with a rate of 10 °C/min. At this stage, the samples were characterized by the XRD method. VI. The reduction was carried out until the mass of the sample was stabilized, and then the sample was nitrided under the same conditions as the S0 sample (including nitriding in a stream of 100% ammonia). In this way four samples S1–S4 of γ’-Fe4N were obtained, which were then characterized by the XRD, ICP-OES, and BET methods.
Electron Paramagnetic Resonance (EMR) spectra were recorded at room temperature (T = 295 K) using a conventional Bruker X-band ELEXSYS E500 CW spectrometer (Bruker, Billerica, MA, USA) operating at 9.46 GHz with a microwave power of 1.006(3) mW. The magnetic induction was up to 1.4 T. The first derivative of the absorption spectrum was recorded as a function of the applied magnetic induction.
Magnetic measurements were performed using a vibrating sample magnetometer (VSM) option of Physical Properties Measurement System, PPMS-9T (Quantum Design, San Diego, CA, USA). Magnetization measurements as a function of the external magnetic field were performed for all the samples at a constant temperature of 5 K and 300 K in a magnetic field ranging from −1T to +1T. Magnetization measurements as a function of temperature were measured between 2 K and 380 K under a magnetic field of 0.1 T in zero field cooling (ZFC) mode and field cooling (FC) mode.
3. Results and Discussion
Oxidation to prepare samples S1–S4 was carried out under conditions where the rate of chemical process was limited by the surface chemical reaction rate. It means that iron nanocrystallites underwent phase transition in their whole volume to magnetite in the order of their sizes from the smallest to the largest, as demonstrated in previous works [38,40]. The oxidation process for each subsequent batch of nanomaterial was extended over time, yielding samples with different, increasing content of magnetite—in terms of mass fractions of magnetite wFe3O4 = 0.05 to 0.21. The diffraction patterns of samples S1–S4 after the oxidation process show reflections identifying both phases: substrate—iron and product—magnetite (Figure 1), with the intensities of the product reflections gradually increasing as the oxidation degree of the tested solid samples increases.
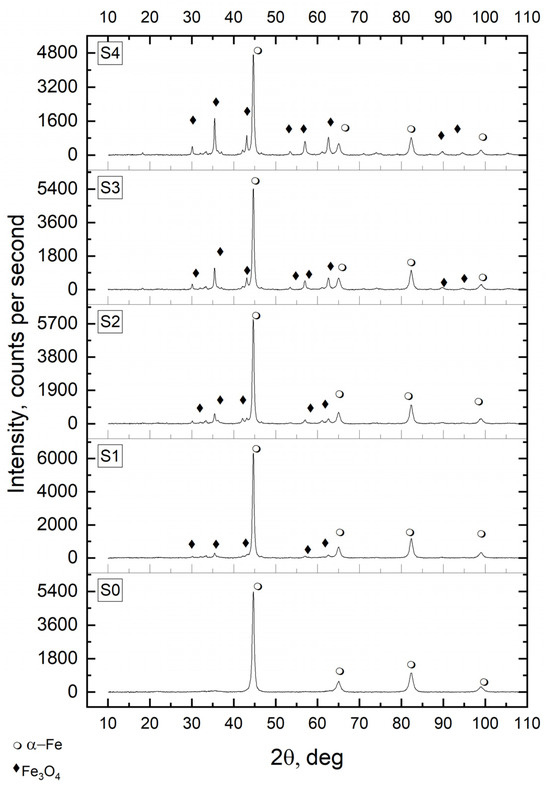
Figure 1.
X-ray diffraction patterns of nanocrystalline iron samples oxidized (S1–S4) to obtain the degree of transformation to magnetite: α = 0.05, 0.14, 0.18, and 0.21, and of the reference unoxidized sample S0; 2θ—the angle between the transmitted X-ray beam and the reflected beam; α-Fe—metallic iron phase; Fe3O4—magnetite phase.
Due to the probability of a large error in the calculations related to the determination of the average size of nanocrystallites with a low share of the oxide phase in the sample mass, data are presented only for the samples with the highest oxidation states (samples S3 and S4). However, based on the results of research on the oxidation processes of nanocrystalline iron described in earlier works [38,48,49], it was found that with the increase in the oxide phase content in the mass of the sample, the average nanocrystallite size of the generated magnetite increased in the whole examined range (Figure 2).
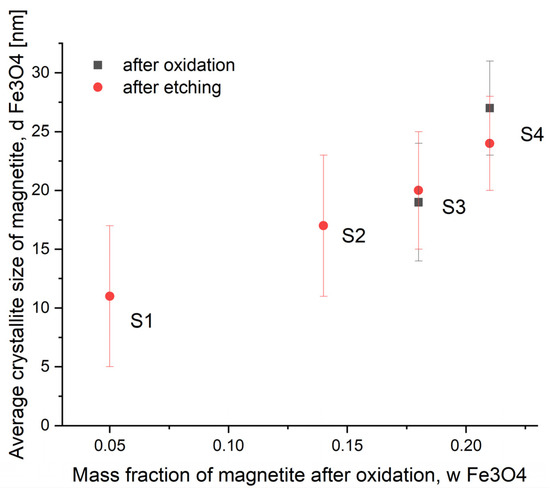
Figure 2.
Dependence of the average nanocrystallite size of magnetite phase on the magnetite content in samples S1–S4 after the oxidation and etching process during the synthesis of nanomaterials with different sizes of nanocrystallites.
Due to the process of etching with acid, the unreacted metallic iron present in samples S1–S4 after the oxidation step was almost completely removed (this is the idea behind the oxidation process to obtain a two-phase system from which one of the phases, this time the metallic one, will then be etched with an inorganic acid). The oxide (magnetite) phase content increased almost 20-fold in sample S1 and 6.4-, 4.7-, and 4.1-fold in samples S2, S3, and S4, respectively. By carefully etching metallic iron with small amounts of acid, two unfavorable effects were avoided. First, complete dissolution of the synthesized samples was prevented. Secondly, the average size of the magnetite phase nanocrystallites obtained during the oxidation step was not changed, as demonstrated in Figure 2 after measuring the average size after these two steps (oxidation and etching) by XRD. The size distributions of the magnetite nanocrystallites were determined using Pielraszek’s method. It was found that the standard deviations of these distributions were reduced compared to sample S0 (15 nm) and were in the range 4–6 nm for samples S1–S4. More detailed data obtained at this stage of the research using the XRD and BET methods are presented in Table 1.

Table 1.
Characteristics of samples S1–S4 after oxidation to Fe3O4 and etching (together with sample S0).
Following the oxidation and selective etching, some amounts of the S1–S4 samples were reduced with hydrogen, passivated, and examined by XRD (Figure 3). All the tested samples were found to consist of metallic iron (promoters, as present in small amounts and possibly in the form of a glassy, non-crystalline phase, are, therefore, invisible to XRD; similarly, the passivation layer was also not visible in this method).
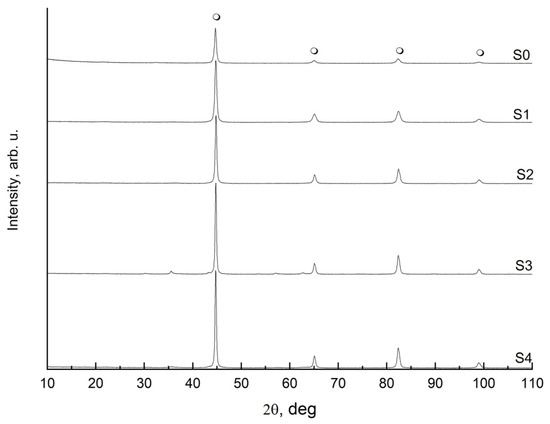
Figure 3.
X-ray diffraction patterns for the reference sample S0 and the oxidized and etched samples S1–S4 after the reduction and passivation process;  —metallic α-iron.
 —metallic α-iron.
After reducing the passive layer, samples S1–S4 were then nitrided in a gas containing 100% ammonia at the reactor inlet. Exemplary results for sample S1 (i.e., with a narrow nanocrystallite size distribution) compared with those for sample S0 (i.e., the unetched sample with a broad nanocrystallite size distribution) are shown in Figure 4.
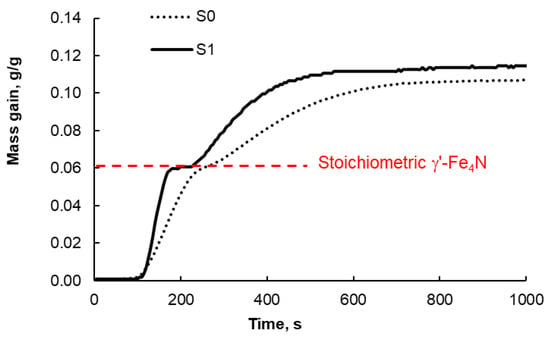
Figure 4.
Exemplary results of mass change measurements (expressed in grams of incorporated nitrogen per gram of metallic iron in the solid sample) during the nitriding process of samples S0 and S1 with a stream containing 100% gaseous ammonia introduced at the reactor inlet (total flow rate 12 dm3/(h g); 350 °C). The red dashed line indicates the stoichiometric level of γ’-Fe4N nitride (this level of nitriding was obtained at nitriding potential ln p = −3.5).
In the case of sample S1, it is characteristic that the phase transitions from α-iron to γ’-nitride and γ’-nitride to ε-nitride are more clearly defined at a nitriding degree of approximately 0.06 g of nitrogen attached to the sample per g of metallic iron in the solid sample. There is even a short but evident period of sample mass stabilization after the phase transformation to γ’ is completed and before the further transformation to ε begins. For comparison, in the case of sample S0, these transformations are slightly ‘blurred’ (the line only gently ‘waves’ and is not as clearly divided into segments as in sample S1). This is a clear (chemical) proof, without any doubt, that the tested samples with a narrow nanocrystallite size distribution were indeed so (the clear segments on line S1 in Figure 4 are the result of the narrow nanocrystallite size distribution). In the case of the S0 sample, this distribution is broad, and therefore, as the reaction progresses, the mass increases in the solid sample related to the phase transformations of the individual fractions of nanocrystallites of different sizes overlap, and only minor inflections are observed at the place where the phase transformations occur (around 0.06 g/g). Another very important thing is that the S1 sample nitrides faster than the S0 sample (the slope of the mass increase line of the S1 sample is greater than that of the S0 sample), i.e., the segregated smaller iron nanocrystallites are more active (this may be the effect of their larger surface area to volume ratio). This is, however, further proof of the effectiveness of the nanocrystallite segregation method.
Samples S1–S4 for magnetic testing were, after reducing the passive layer, nitrided at a potential of lnP = −3.5 and 350 °C to ensure that they would consist exclusively of the nitride phase γ‘-Fe4N. These conditions are known from [47]. After nitriding and passivation, their phase composition was determined by XRD, and the exemplary results for sample S1 are shown in Figure 5.
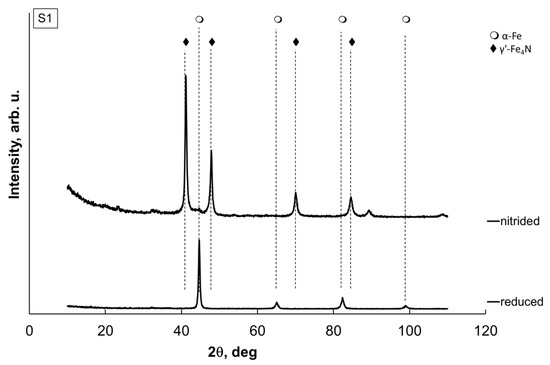
Figure 5.
Exemplary X-ray diffraction patterns of a sample of nanocrystalline iron S1 (oxidized, etched, nitrided, and, of course, passivated) finally reduced and passivated.
It is clearly visible that after nitriding, the sample contained only the γ’-Fe4N phase. After reduction, however, the sample again contained only metallic iron. The results for the remaining samples were identical.
The results of the XRD tests of average sizes of the iron nitride γ’-Fe4N nanocrystallites after the nitriding process for samples S1–S4 are presented in Figure 6. It was observed that the standard deviations did not change (compared to the samples after oxidation and etching).
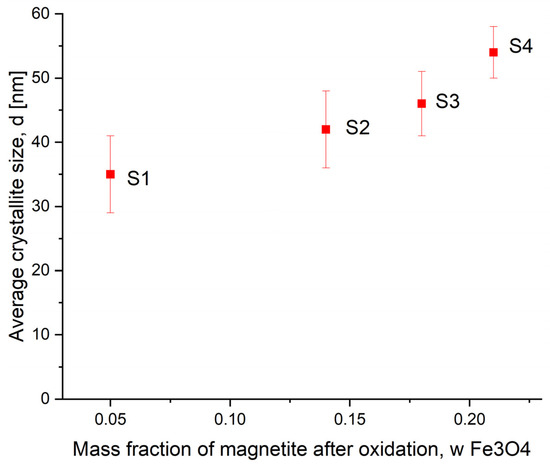
Figure 6.
Dependence of the average nanocrystallite size of γ’-Fe4N on the magnetite content in samples S1–S4 after the reduction and nitriding process during the synthesis of nanomaterials with different sizes of nanocrystallites.
The increase in the average size of γ’-Fe4N iron nitride nanocrystallites may be caused by the high temperature of the reduction process and the recrystallization of nanocrystallites [43]. However, they are still stable in the nanometer range, and the trend from Figure 2 is preserved. This allows us to study individual fractions of nanocrystallites of different sizes instead of determining the average properties of only a mixture of nanocrystallites with a broad size distribution.
Examples of microscopic examination results using the TEM method for sample S4 are shown in Figure 7. Figure 7a shows the porous nanostructure of the tested material. Figure 7b shows a single iron nitride nanocrystallite with a surface passive layer in which promoters wetting the nanocrystallite surface are also dissolved.
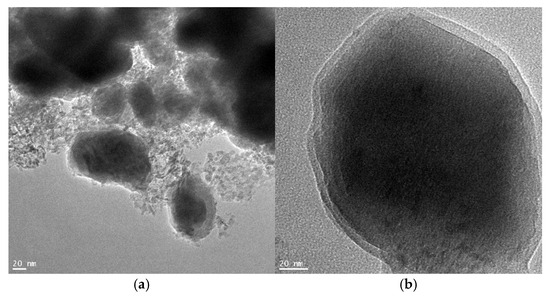
Figure 7.
Example results of microscopic examinations using the TEM method for sample S4: (a) porous nanostructure, (b) single iron nitride nanocrystallite with a visible passive layer on the surface.
More detailed data obtained at this stage of the research using XRD and BET methods are presented in Table 2.

Table 2.
Characteristics of samples S1–S4 after oxidation to Fe3O4, and etching and nitriding to Fe4N, together with sample S0.
The results regarding the average nanocrystallite size and specific surface area development from the table above lead to quite interesting conclusions. Namely, the average size of nanocrystallites of the reference sample S0 (unmodified) is 23 nm. The standard deviation is 15 nm (this means it is a fairly wide size distribution). It turns out that this sample, despite the relatively low mean nanocrystallite size (determined by XRD), has the least developed specific surface area (7.0 m2/g as determined by BET). This in turn may be the result of both a broad nanocrystallite size distribution and the presence of a larger number of nanocrystallite agglomerates (invisible for XRD; hence the relatively small value of the average nanocrystallite size and, at the same time, the small value of the specific surface area determined by BET) instead of truly single, separated nanocrystallites, as may be the case in modified samples S1–S4 (etched with acids) with a narrow nanocrystallite size distributions (standard deviation is 4–6 nm). For these samples, a typical relationship is observed between the average size of nanocrystallites and the specific surface area: the larger the average size of nanocrystallites, the less developed the surface area, which results from the geometry of the particles and their morphology—the greater the fragmentation, the greater the specific surface area [17,18,19,20,21,43]. Moreover, the ratio of the measured values of the average nanocrystallite size to the corresponding surface areas almost exactly matches the particle size-surface development geometric relation of the separated nanocrystallites, without agglomeration (assuming that the obtained nanoparticles are spherical). This may mean that there were actually fewer agglomerates in the modified samples than in the S0 sample. We can also draw identical conclusions based on the research results presented in Table 1.
Figure 8 shows the magnetic properties of the investigated γ’-Fe4N sample. The obtained magnetic measurements are characteristic of ferromagnetic materials. The temperature dependence of magnetization, M(T), exhibits a pronounced bifurcation between the ZFC and FC curves, visible up to the highest measurement temperature (T = 380 K). This bifurcation typically arises from the loss of thermodynamic equilibrium caused by slow spin relaxation or frozen magnetic disorder, meaning that the magnetic state of the system depends on its thermal history. Such behavior is commonly observed in spin glasses, cluster glasses, and superparamagnets [50]. Due to the limited temperature range of our measurements, the Curie temperature, TC, could not be determined directly; however, the literature reports it to be approximately 760–770 K [50]. The field dependence of magnetization, M(µ0H), demonstrates typical soft ferromagnetic behavior (see inset of Figure 8). The coercivity field, HC, is 21(1) mT and 41(2) mT at 300 K and 5 K, respectively. The maximum magnetization values in a 1 T field are 158(1) emu/g at 5 K and 139(1) emu/g at 300 K. These values are slightly lower than those reported for bulk γ’-Fe4N (209 emu/g [50]) but are comparable to those observed for nanocrystalline γ’-Fe4N [51,52]. Overall, the magnetic properties of our γ’-Fe4N sample are in good agreement with previously published data for similar systems [52,53].
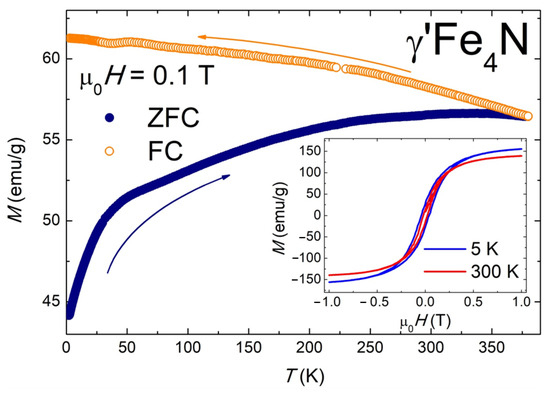
Figure 8.
Magnetic properties of γ’-Fe4N. Temperature variations in the magnetization measured for zero-field-cooled (ZFC) and field-cooled (FC) protocols in a magnetic field of 0.1 T. Insert: Magnetic field dependencies of the magnetization taken at T = 5 K and 300 K.
The electron magnetic resonance (EMR) technique is based on the resonance phenomenon between microwave radiation and the Zeeman splitting of the energy levels of unpaired electrons. It enables the analysis of the local environment of crystal lattice defects, ions with unpaired electrons, and magnetic agglomerates in materials at both micro- and nanoscales [54,55]. One of the analytical approaches in EMR is the finite-size effect, which involves measuring the EMR line intensity (expressed as the integrated area under the absorption curve) as a function of nanoparticle size [56,57,58]. In the case of grains with a core–shell structure, for larger nanoparticles, the dominant contribution to the EMR signal originates from the core, whereas in smaller nanoparticles, a significant signal contribution from the surface becomes apparent. If the magnetic ions inside and on the surface of the nanoparticle are of the same type, the signal may be indistinguishable. However, the surface typically contains different types of defects (e.g., broken bonds), which cause the local environment of the magnetic ions to differ from that of the core, allowing it to be detected by EMR. The contribution of individual EMR lines to the total EMR signal, therefore, depends on grain size.
In the currently studied nanomaterials, the dominant phase is γ-Fe4N, and thus the EMR signal can be attributed to iron ions. Figure 9 shows the EMR spectra recorded for the samples from S0 up to S4, in which the γ’-Fe4N crystallographic structure is the prevailing magnetic phase. The EMR spectra are characterized by a broad and intense resonance line observed across a wide magnetic induction range up to 1 T. It can be noted that some EMR line components change depending on nanoparticle size. Therefore, the EMR spectra were decomposed into individual resonance lines originating from magnetic centers using a low-symmetry Voigt function (Lorentz + Gauss shape) with the inclusion of negative magnetic fields (see Supplementary Materials). The best fits of the Voigt parameters to the experimental data were obtained for two magnetic centers (see Supplementary Materials), whose graphical representation is shown in selected Figure 10A–C.
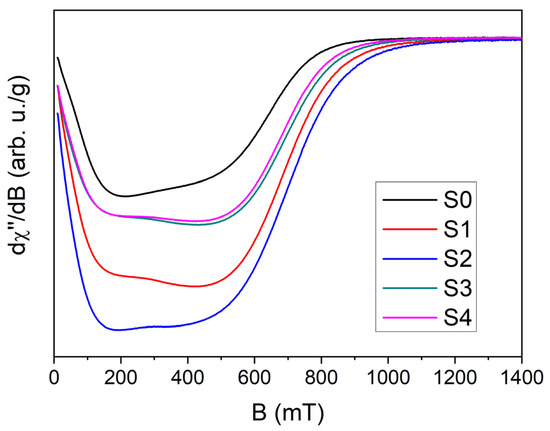
Figure 9.
EMR spectra for S0, S1, S2, S3, and S4 materials at room temperature.
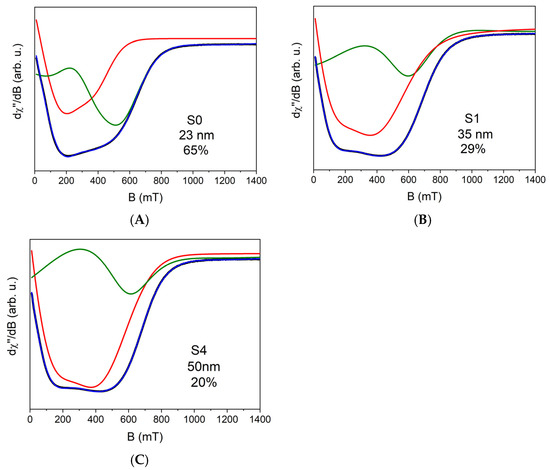
Figure 10.
Fitting of the Voigt equation to experimental data for (A) S0, (B) S1, (C) S4. Black curve: experimental data; red curve: centers originating from iron clusters; green curve: iron centers located on the surface; blue curve: total fit. The label indicates the name of the material, the size of the nanoparticle, and the contribution of individual iron ions on the surface relative to iron clusters inside the particle.
In all the investigated materials, the dominant EMR line (Figure 10, red curve) corresponds to signals originating from clusters of iron ions, which is typical for high concentrations of transition metal ions with ferromagnetic interactions [59,60]. The intensity of this signal increases with increasing nanoparticle size. Slight variations in the line shape and in the parameters of the Voigt function reveal the complex character of magnetic interactions and changes in the local environment of Fe ions, which may influence the physicochemical properties of these materials. The second EMR line (Figure 10, green curve) also originates from iron ions but is associated with ions located at the nanoparticle surface. The parameters and line shape, similar to a Dyson line, particularly in single-phase materials (S1, S2, S3, and S4), indicate the presence of individual Fe ions at the surface–matrix interface. The intensity of this signal depends on nanoparticle size, consistent with the finite-size effect. For the S0 sample with an average grain size of 23 nm, the surface-related signal accounts for 65% of the core-related signal (see Figure 10A) and 39% of the total EMR intensity. Thus, the intensity of the surface-related EMR signal may be used to characterize nanoparticle size and, in smaller particles, can significantly affect the physicochemical properties of the materials. The contribution of the surface-related EMR line is quantitatively shown in Figure 11.
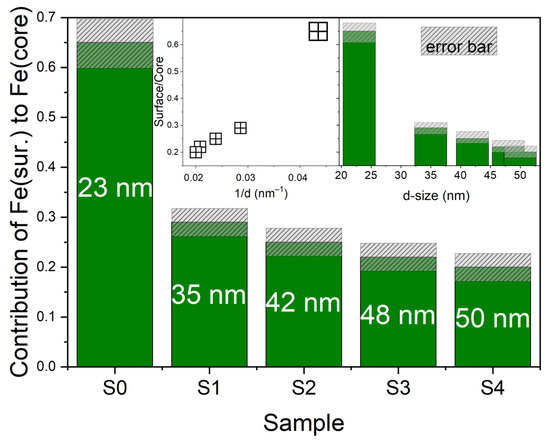
Figure 11.
Graphical representation of the contribution of individual iron ions on the surface in relation to iron clusters inside the grain for the tested samples. In the inset, the dependence of the proportion of individual iron ions on the surface of clusters inside the particle in relation to the size of the nanoparticle (right side) and the inverse of the size of the nanoparticle (left side).
To sum up, the spectra revealed changes in one component of the signal depending on the nanocrystal size; therefore, the finite-size effect method was applied for the analysis. Based on this, the nanostructure was determined, and it provided insights into how the nanocrystal size influences the overall magnetic properties of the material, affecting their potential industrial applications. Furthermore, controlled tuning of nanoparticle size allows for the tailoring of desired magnetic properties, which can improve device performance and open up new horizons for technological applications.
Thus, understanding how the magnetic properties of nanocrystals change depending on their sizes can impact the fields in which they are applied. Modern technologies such as data storage, medicine, and energy increasingly rely on magnetic materials with precisely controlled properties. A material with a specific size of nanocrystallites may exhibit optimal properties for a particular application, potentially leading to increased effectiveness in its performance.
4. Conclusions
The studies of magnetic susceptibility indicate the soft ferromagnetic character of the material in the investigated temperature range.
The EMR measurements revealed a clear dependence of the magnetic properties of the studied iron nitride nanoparticles on their size. The nanoparticles consist of two magnetically active regions: the γ’-Fe4N phase within the particle core, forming iron clusters, and individual iron ions located at the surface. For larger nanoparticles, the magnetic response is dominated by the γ’-Fe4N core phase, whereas in smaller nanoparticles, the surface contribution must also be taken into account due to the increasing ratio of the surface area of smaller and smaller nanocrystallites to their volume. Similar observations were reported by U. Nowosielecka et al. [48], who, based on magnetic susceptibility and FMR measurements, concluded that the material consists of two magnetic centers. In contrast, our results, interpreted within the framework of finite-size effects, indicate that these two centers are coupled within a single nanoparticle. Overall, both EMR and FMR measurements confirm comparable magnetic behavior of these nanomaterials.
It is worth noting that EMR studies revealed a significant influence of magnetite reduction processes on the magnetic properties of nanocrystalline iron composites. In the work of R. Pelka et al. [38], the magnetic properties of iron nanocomposites prior to reduction indicate a similar nanoparticle structure (two magnetic centers), yet their magnetic behavior differs. Specifically, for composites after reduction, iron clusters are observed in the core along with isolated surface iron ions, whereas before reduction, interacting iron ions are present within the particles alongside isolated surface ions. These differences result in distinct potential applications of the magnetic nanomaterials. It should also be emphasized that the magnetic properties are strongly dependent on nanoparticle size, which highlights the importance of precise control of particle dimensions and the tuning of magnetic properties by controlling the size of nanoparticles.
Supplementary Materials
The following supporting information can be downloaded at: https://www.mdpi.com/article/10.3390/cryst15110956/s1, Table S1. Principal values of Voigt equation parameters obtained from fitting to experimental data; Figure S1. Fitting curves to experimental data, taking into account negative magnetic fields (left panel) and without taking into account negative magnetic fields (right panel).
Author Contributions
Conceptualization, R.P. and N.G.; methodology, N.G. and R.P.; validation, R.P., K.K., G.L., K.S. and G.Ż.; formal analysis, R.P. and N.G.; investigation, G.L., G.Ż., U.N., K.S. and I.M.; data curation, N.G. and A.G.; writing—original draft preparation, R.P., N.G., U.N., G.Ż., I.M. and K.K.; writing—review and editing, R.P., K.K., G.L., K.S. and N.G.; visualization, R.P., K.K., G.Ż., A.G., K.S. and G.L.; supervision, R.P.; project administration, R.P.; funding acquisition, R.P. All authors have read and agreed to the published version of the manuscript.
Funding
This research was funded by The National Science Centre, Poland, under the program “Opus”, project No. 2017/27/B/ST8/02970, and by The National Centre for Research and Development under the program “Lider”, project No. LIDER/025/489/L-5/13/NCBR/2014.
Data Availability Statement
The original contributions presented in this study are included in the article/Supplementary Materials. Further inquiries can be directed to the corresponding author.
Acknowledgments
Special thanks to Urszula Nowosielecka for sample preparation and performing measurements using the thermogravimetric method.
Conflicts of Interest
The authors declare no conflicts of interest.
References
- Mekuye, B.; Abera, B. Nanomaterials: An overview of synthesis, classification, characterization, and applications. Nano Sel. 2023, 4, 486–501. [Google Scholar] [CrossRef]
- Quantum nanoscience. Nat. Nanotechnol. 2021, 16, 1293. [CrossRef]
- Jarman, J.C.; Robinson, K.N. Introduction. In Nanomaterial Characterization; Tantra, R., Ed.; Wiley: Hoboken, NJ, USA, 2016; pp. 1–24. [Google Scholar] [CrossRef][Green Version]
- Wang, X.; Liu, Q.; Wang, X. High-Entropy Materials: From Bulk to Sub-nano. Adv. Funct. Mater. 2025, 35, 2504275. [Google Scholar] [CrossRef]
- Lian, F.; Xing, B. From Bulk to Nano: Formation, Features, and Functions of Nano-Black Carbon in Biogeochemical Processes. Environ. Sci. Technol. 2024, 58, 15910–15925. [Google Scholar] [CrossRef]
- Roumiguier, L.; Jankowiak, A.; Pradeilles, N.; Antou, G.; Maître, A. Mechanical properties of submicronic and nanometric boron carbides obtained by Spark Plasma Sintering: Influence of B/C ratio and oxygen content. Ceram. Int. 2019, 45, 9912–9918. [Google Scholar] [CrossRef]
- Caputo, F.; Clogston, J.; Calzolai, L.; Rösslein, M.; Prina-Mello, A. Measuring particle size distribution of nanoparticle enabled medicinal products, the joint view of EUNCL and NCI-NCL. A step by step approach combining orthogonal measurements with increasing complexity. J. Control. Release 2019, 299, 31–43. [Google Scholar] [CrossRef]
- Pelka, R. A Method of Determining Nanoparticle Size Distribution in Iron Ammonia Synthesis Catalyst by Measuring Mass Changes During the Nitriding Process. Catal. Today 2016, 286, 118–123. [Google Scholar] [CrossRef]
- Li, P.; Yan, A.; Xue, Y. Size-dependence of melting thermodynamics of nano-Bi. J. Nanopart Res. 2025, 27, 250. [Google Scholar] [CrossRef]
- Schlexer, P.; Andersen, A.B.; Sebok, B.; Chorkendorff, I.; Schiøtz, J.; Hansen, T.W. Size-Dependence of the Melting Temperature of Individual Au Nanoparticles. Part. Part. Syst. Charact. 2019, 36, 1800480. [Google Scholar] [CrossRef]
- Acheche, A.; Nelayah, J.; Gatti, R.; Alloyeau, D.; Ricolleau, C.; Amara, H. Thermal stability of CoNiPtCuAu nanoalloys: From segregation to melting properties. Faraday Discuss. 2026; advance article. [Google Scholar] [CrossRef]
- Grigalaitis, R.; Banys, J.; Lapinskas, S.; Erdem, E.; Bottcher, R.; Glasel, H.-J.; Hartmann, E. Dielectric investigations and theoretical calculations of size effect in lead titanate nanocrystals. IEEE Trans. Ultrason. Ferroelectr. Freq. Control 2006, 53, 2270–2274. [Google Scholar] [CrossRef] [PubMed]
- Abou Taleb, M.F.; Ibrahim, M.M.; Rahman, A.U.; El-Bahy, Z.M. Magnetic response of Ho3+ doped Ni0.4Cu0.6HoyFe2-yO4 spinel ferrites and their correlation with crystallite size. Ceram. Int. 2024, 50, 37077–37084. [Google Scholar] [CrossRef]
- Meng, X.; Zhang, Z.; Lin, D.; Liu, W.; Zhou, S.; Ge, S.; Su, Y.; Peng, C.; Zhang, L. Effects of particle size of dielectric fillers on the output performance of piezoelectric and triboelectric nanogenerators. J. Adv. Ceram. 2021, 10, 991–1000. [Google Scholar] [CrossRef]
- Saba, F.; Zhang, F.; Liu, S.; Liu, T. Reinforcement size dependence of mechanical properties and strengthening mechanisms in diamond reinforced titanium metal matrix composites. Compos. B Eng. 2019, 167, 7–19. [Google Scholar] [CrossRef]
- Carvalho, A.P.; Figueiredo, R.B. An overview of the effect of grain size on mechanical properties of magnesium and its alloys. Mater. Trans. 2023, 64, 1272–1283. [Google Scholar] [CrossRef]
- Arabczyk, W.; Ekiert, E.; Pelka, R. Size-Dependent Transformation of α-Fe into γ′-Fe 4 N in Nanocrystalline the Fe–NH3–H2 System. J. Phys. Chem. C. 2016, 120, 17989–17995. [Google Scholar] [CrossRef]
- Arabczyk, W.; Ekiert, E.; Pelka, R. Hysteresis phenomenon in a reaction system of nanocrystalline iron and a mixture of ammonia and hydrogen. Phys. Chem. Chem. Phys. 2016, 18, 25796–25800. [Google Scholar] [CrossRef] [PubMed]
- Shekhawat, D.; Vauth, M.; Pezoldt, J. Size Dependent Properties of Reactive Materials. Inorganics 2022, 10, 56. [Google Scholar] [CrossRef]
- Muravev, V.; Parastaev, A.; van den Bosch, Y.; Ligt, B.; Claes, N.; Bals, S.; Kosinov, N.; Hensen, E.J.M. Size of cerium dioxide support nanocrystals dictates reactivity of highly dispersed palladium catalysts. Science 2023, 380, 1174–1179. [Google Scholar] [CrossRef]
- Arabczyk, W.; Pelka, R.; Wilk, B.; Lendzion-Bieluń, Z. Kinetics and Thermodynamics of the Phase Transformation in the Nanocrystalline Substance—Gas Phase System. Crystals 2024, 14, 129–150. [Google Scholar] [CrossRef]
- Tulinski, M.; Jurczyk, M. Nanomaterials Synthesis Methods. In Metrology and Standardization of Nanotechnology: Protocols and Industrial Innovations; Wiley: Hoboken, NJ, USA, 2017; pp. 75–98. [Google Scholar] [CrossRef]
- Bhattacharyya, S. Iron nitride family at reduced dimensions: A review of their synthesis protocols and structural and magnetic properties. J. Phys. Chem. C 2015, 119, 4, 1601–1622. [Google Scholar] [CrossRef]
- Wojciechowski, P.; Lewandowski, M. Iron Nitride Thin Films: Growth, Structure, and Properties. Cryst. Growth Des. 2022, 22, 4618–4639. [Google Scholar] [CrossRef]
- Gafner, Y.Y.; Gafner, S.L.; Nomoev, A.V.; Bardakhanov, S.P. Analysis of the Structure and Thermal Stability of Cu@Si Nanoparticles. J. Metastable Nanocryst. Mater. 2018, 30, 52–59. [Google Scholar] [CrossRef]
- Arabczyk, W.; Lendzion-Bieluń, Z.; Wróbel, R. Sposób Otrzymywania Nanomateriałów o Okreslonych Rozmiarach Krystalitów. Polish Patent PL361256A1, 24 January 2005. Available online: https://eprofil.pue.uprp.gov.pl/public/registry/view/Pat.206909?lng=pl (accessed on 31 October 2005).
- Wróbel, R.; Arabczyk, W. Solid−Gas Reaction with Adsorption as the Rate Limiting Step. J. Phys. Chem. A 2006, 110, 9219–9224. [Google Scholar] [CrossRef]
- Tan, X.; Wang, S.; Chen, Y.; Zhou, Y.; Li, Z. Design, preparation and characterization of iron nitride magnetic abrasives. J. Alloys Compd. 2019, 774, 443–450. [Google Scholar] [CrossRef]
- Feng, X.; Gu, X.; Xuan, G.; Wu, H.; Li, S. Efficient microplastic removal in aquatic environments using iron–nitrogen co-doped layered biocarbon materials. Chem. Eng. J. 2025, 506, 160095. [Google Scholar] [CrossRef]
- Mamatha, G.M.; Dixit, P.; Krishna, R.H.; Girish, K.S. Polymer based composites for electromagnetic interference (EMI) shielding: The role of magnetic fillers in effective attenuation of microwaves, a review. Hybrid. Adv. 2024, 6, 100200. [Google Scholar] [CrossRef]
- Wu, K.; Liu, J.; Saha, R.; Ma, B.; Su, D.; Peng, C.; Sun, J.; Wang, J.P. Irregularly Shaped Iron Nitride Nanoparticles as a Potential Candidate for Biomedical Applications: From Synthesis to Characterization. ACS Omega 2020, 5, 11756–11767. [Google Scholar] [CrossRef] [PubMed]
- Carvalho, R.; Amorim, L.; Díez, A.G.; Ribeiro, C.; Lanceros-Mendez, S.; Martins, P. Energy-efficient electric control of magnetization in polymer-based magnetoelectrics for spintronic applications. Commun. Mater. 2025, 6, 44. [Google Scholar] [CrossRef]
- Yang, W.; Rehman, S.; Chu, X.; Hou, Y.; Gao, S. Transition Metal (Fe, Co and Ni) Carbide and Nitride Nanomaterials: Structure, Chemical Synthesis and Applications. ChemNanoMat 2015, 1, 376–398. [Google Scholar] [CrossRef]
- Saito, T.; Yamamoto, H.; Nishio-Hamane, D. Production of Rare-Earth-Free Iron Nitride Magnets (α″-Fe16N2). Metals 2024, 14, 734. [Google Scholar] [CrossRef]
- Lee, O.M.; Abbasian, M. Reducing Rare-Earth Magnet Reliance in Modern Traction Electric Machines. Energies 2025, 18, 2274. [Google Scholar] [CrossRef]
- Kartsev, A.; Feya, O.D.; Bondarenko, N.; Kvashnin, A.G. Stability and magnetism of FeN high-pressure phases. Phys. Chem. Chem. Phys. 2019, 21, 5262–5273. [Google Scholar] [CrossRef]
- Tao, Z.; Liu, S.; Fang, H.; Chen, L.; Chen, J.; Xiu, X.; Zhang, R. Magnetic and transport properties of single-phase N-rich iron nitrides. Mater. Lett. 2019, 239, 140–142. [Google Scholar] [CrossRef]
- Barba-Juan, A.; Vicente, N.; Mormeneo-Segarra, A.; Clausell-Terol, C. Microstructure-dependent magnetic permeability in ferrites from nanoparticles. Ceram. Int. 2023, 49, 21530–21537. [Google Scholar] [CrossRef]
- Upadhyay, S.; Parekh, K.; Pandey, B. Influence of crystallite size on the magnetic properties of Fe3O4 nanoparticles. J. Alloys Compd. 2016, 678, 478–485. [Google Scholar] [CrossRef]
- Arabczyk, W.; Pelka, R.; Brzoza-Kos, A.; Kocemba, I.; Rokicka-Konieczna, P.; Skulmowska-Polok, K.; Klimza, K.; Lendzion-Bieluń, Z. Studies of Phase Transformation Kinetics in the System of Nanocrystalline Iron/Ammonia/Hydrogen at the Temperature of 350 °C by Means of Magnetic Permeability In Situ Measurement. Appl. Sci. 2024, 14, 8452. [Google Scholar] [CrossRef]
- Pielaszek, R. FW15/45M method for determination of the grain size distribution from powder diffraction line profile. J. Alloys Compd. 2004, 382, 128–132. [Google Scholar] [CrossRef]
- Pielaszek, R. Analytical expression for diffraction line profile for polydispersive powders. In Applied Crystallography, Proceedings of the XIX Conference, Kraków, Poland, 1–4 September 2003; World Scientific Publishing: Singapore, 2004; pp. 43–50. [Google Scholar]
- Arabczyk, W.; Pelka, R.; Jasińska, I.; Lendzion-Bieluń, Z. Thermodynamics of Iron Ammonia Synthesis Catalyst Sintering. Crystals 2024, 14, 188. [Google Scholar] [CrossRef]
- Arabczyk, W.; Pelka, R. Studies of the Kinetics of Two Parallel Reactions: Ammonia Decomposition and Nitriding of Iron Catalyst. J. Phys. Chem. A 2009, 113, 411–416. [Google Scholar] [CrossRef] [PubMed]
- Arabczyk, W.; Pelka, R.; Kocemba, I.; Brzoza-Kos, A.; Wyszkowski, A.; Lendzion-Bieluń, Z. Study of Phase Transformation Processes Occurring in the Nanocrystalline Iron/Ammonia/Hydrogen System by the Magnetic Permeability Measurement Method. J. Phys. Chem. C 2022, 126, 7704–7710. [Google Scholar] [CrossRef]
- Arabczyk, W.; Narkiewicz, U.; Moszyński, D. Double-Layer Model of the Fused Iron Catalyst for Ammonia Synthesis. Langmuir 1999, 15, 5785–5789. [Google Scholar] [CrossRef]
- Wilk, B.; Arabczyk, W. Investigation of nitriding and reduction processes in the nanocrystalline iron-ammonia-hydrogen system at 350 °C. Phys. Chem. Chem. Phys. 2015, 17, 20185–20193. [Google Scholar] [CrossRef]
- Lubkowski, K.; Arabczyk, W.; Grzmil, B.; Michalkiewicz, B.; Pattek-Janczyk, A. Passivation and oxidation of an ammonia iron catalyst. Appl. Catal. A Gen. 2007, 329, 137. [Google Scholar] [CrossRef]
- Nowosielecka, U.; Pelka, R.; Moszyńska, I.; Guskos, N.; Typek, J.; Żołnierkiewicz, G. Studies of magnetic properties of nanocrystalline iron of different sizes of nanocrystallites. J. Magn. Magn. Mater. 2017, 443, 324–333. [Google Scholar] [CrossRef]
- Coey, J.M.D. Magnetism and Magnetic Materials; Cambridge University Press: Cambridge, UK, 2010. [Google Scholar]
- Muñoz Medina, G.A.; Mudarra Navarro, A.M.; Deluque Toro, C.E.; Gil Rebaza, A.V. Structural, Thermophysical, and Magnetic Properties of the γ′-Fe4N System: Density Functional Theory and Experimental Study. Processes 2025, 13, 2402. [Google Scholar] [CrossRef]
- Liu, Y.; Yang, Z.; Yang, H. Magnetic and Electrochemical Properties of γ′-Fe4N Nanoparticles with Cuboidal and Rodlike Morphologies. J. Phys. Chem. C 2023, 127, 728–735. [Google Scholar] [CrossRef]
- Li, W.; Li, W.; Chen, J.; Ying, Y.; Yu, J.; Zheng, J.; Qiao, L.; Li, J.; Che, S. Migration of N element and evolution of microstructure in spark plasma sintered bulk γ′-Fe4N. J. Alloys Compd. 2022, 928, 167201. [Google Scholar] [CrossRef]
- Abragam, A.; Bleaney, B. Electron Paramagnetic Resonance of Transition Ions; Oxford University Press: Oxford, UK, 1970; ISBN 978-0199651528. [Google Scholar]
- Gubin, S.P. Magnetic Nanoparticles; Wiley-VCH Verlag GmbH & Co. KGaA: Weinheim, Germany, 2009. [Google Scholar]
- Jakes, P.; Erdem, E. Finite size effects in ZnO nanoparticles: An electron paramagnetic resonance (EPR) analysis. Phys. Status Solidi RRL 2011, 5, 56–58. [Google Scholar] [CrossRef]
- Leniec, G.; Kaczmarek, S.M.; Macalik, L.; Ropuszyńska-Robak, P.; Hanuza, J. Magnetic properties of KY0.93Er0.05Tm0.02(WO4)2 and NaY0.97Er0.02Tm0.01(WO4)2 nanocrystals obtained using Pechini and hydrothermal methods. J. Phys. Chem. Solids 2020, 138, 109273. [Google Scholar] [CrossRef]
- Leniec, G.; Kaczmarek, S.M.; Macalik, L.; Ropuszyńska-Robak, P.; Hanuza, J. Magnetic properties of NaY1−x−yHoxYby(WO4)2: X = 0.05, y = 0.02 and KY1−x−yHoxYby(WO4)2: X = 0.02, y = 0.01 nanopowders obtained by Pechini and hydrothermal methods. Chem. Phys. Lett. 2019, 715, 360–366. [Google Scholar] [CrossRef]
- Fuks, H.; Kaczmarek, S.M.; Leniec, G.; Michalski, J.; Kucharska, B. Magnetic Properties of Steel Ball Samples, Investigated before and after Nitriding. Arch. Metall. Mater. 2018, 63, 1235–1242. [Google Scholar] [CrossRef]
- Kaczmarek, S.M.; Michalski, J.; Frączek, T.; Dudek, A.; Fuks, H.; Leniec, G. Mechanical and Magnetic Investigations of Balls Made of AISI 1010 and AISI 1085 Steels after Nitriding and Annealing. Metals 2023, 13, 1060. [Google Scholar] [CrossRef]
Disclaimer/Publisher’s Note: The statements, opinions and data contained in all publications are solely those of the individual author(s) and contributor(s) and not of MDPI and/or the editor(s). MDPI and/or the editor(s) disclaim responsibility for any injury to people or property resulting from any ideas, methods, instructions or products referred to in the content. |
© 2025 by the authors. Licensee MDPI, Basel, Switzerland. This article is an open access article distributed under the terms and conditions of the Creative Commons Attribution (CC BY) license (https://creativecommons.org/licenses/by/4.0/).