1. Introduction
This paper investigates the magnetic properties of Fe-Nb-B-RE (RE = Tb, Tb/Y, Tb/Nd) melt-spun ribbons. It is well known that Fe-based amorphous and nanocrystalline alloys are widely used as excellent soft magnetic materials [
1,
2,
3,
4,
5,
6]. Among the many types of such alloys, the Fe-Nb-B family is particularly interesting due to its sensitivity to structural relaxation and nanocrystallization based on alloying additions and thermal treatment [
7,
8,
9,
10]. An appropriate Nb content helps slow down the crystallization rate, while boron influences the nucleation density of Fe nanograins. When RE additions are included, this type of material becomes a promising candidate for so-called bulk composites containing magnetically soft and hard phases [
11,
12,
13]. Such a composition can offer several advantages, provided these two phases are magnetically coupled. One can envision designing different magnetic characteristics that combine soft and hard magnetic properties, depending on the specific application.
The motivation for this study stems from our experience with ultra-high coercive crystalline alloys of the Fe-Nb-B-RE type, which were obtained by the mold vacuum suction casting technique [
14,
15,
16]. It was previously shown that the (Fe
80Nb
6B1
4)
0.88Tb
0.12 alloy has a coercive field higher than 7 T at room temperature and could potentially be used as a source of magnetic anisotropy in spring-exchange composites. The main challenge is achieving strong magnetic coupling between the ultra-high coercive and magnetically soft phases.
It is known that Tb is an element with strong spin–orbit coupling and therefore it is a source of magnetic anisotropy in many binary or ternary compounds [
17,
18,
19], while Y is widely used as a non-magnetic atomic equivalent of Tb (or heavy rare earth elements). In our case, the substitution of Tb by Y provides an opportunity to obtain magnetic composites with hard (Tb
2Fe
14B) and soft (Y
2Fe
14B) magnetic phases. Moreover, these phases can be effectively coupled due to their similar crystal structure [
16].
Amorphous Fe-Nb-B-RE alloys can serve as precursors in their as-cast state for the subsequent fabrication of crystalline magnets through thermal treatment [
20]. This provides a possibility to explore a comparable crystallization pathway, initiating the process from the solid state. This approach restricts atomic diffusion to a localized reorganization of the amorphous structure and can lead to the formation of specific phase compositions which influence the resulting magnetic properties.
The aim of the present paper is to study the magnetic properties of Fe-Nb-B-RE melt-spun ribbons in the as-cast state and after thermal treatment. Specifically, we focused on the influence of the selected RE additions on magnetic anisotropy, exchange interactions, and the magnetic coupling between Fe-Fe and Fe-RE atoms. It is of great interest to determine if such a relationship exists in the amorphous iron-base phase in the absence of a long-range crystal order. Moreover, crystallization from the solid phase (i.e., from amorphous state), unlike crystallization from the liquid phase (vacuum casting suction), may yield unexpected results and offer a possibility to control the phase structure, which is the main factor influencing the magnetic properties of these alloys.
2. Experimental Procedure
The samples of (Fe
80Nb
6B
14)
1−xRE
x (RE = Tb, Nd, Tb/Y; 0.04 < x < 0.12) were prepared using a typical melt-spinning technique. The ingot specimen of the alloy was crushed into pieces and placed into the quartz tube with one end in the form of a nozzle. The orifice of the nozzle had a circular shape with a diameter of 0.6 mm. The nozzle was positioned above the rotating copper roll at a distance of 0.6 mm. The ingot sample was induction-molten and injected onto the surface of the copper roll with a surface linear velocity of 25 m/s. The whole process was carried out in an argon atmosphere. The thermal treatment was carried out by annealing the samples at a defined temperature for one hour.
Table 1 lists all examined alloys and their shortcuts used in the text.
The X-ray diffraction technique (XRD) is a useful tool for obtaining information on crystal structures. XRD measurements were carried out using a high-resolution PANalytical Empyrean diffractometer with CuKα radiation (40 kV, 30 mA) equipped with a PIXcel detector. The diffraction patterns were collected using a 2θ scan from 10° to 90° with 0.0131° steps. Data analysis was carried out using HighScore Plus software (version 3.0d (3.0.4)) supplied by PANalytical. The software was used for both qualitative and quantitative analyses. The ICDD PDF-5 database was used to identify the phases.
Magnetic measurements were performed by means of the SQUID magnetometer (MPMS XL-7, Quantum Design) in the temperature range of 10 K to 300 K and magnetic field up to 7 T. Thermomagnetic curves at higher temperatures were obtained by the VSM system (EZ9, Microsense, MA, USA). Magnetic domain structures were determined by MOKE observations, utilizing a Zeiss optical microscope specially adapted for magneto-optical Kerr microscopy.
Magnetic exchange interactions were studied using the mean field theory (MFT) calculation procedure based on the experimental thermomagnetic curves.
3. Results
Figure 1 shows the XRD patterns for all studied alloys. Generally, the obtained results indicate a dominant amorphous state, i.e., the broad halo near the position of the main α-Fe reflex. In some cases, one can observe small traces of a crystal structure that reveal a relatively small contribution of crystalline phases attributed to α-Fe and RE
2Fe
14B.
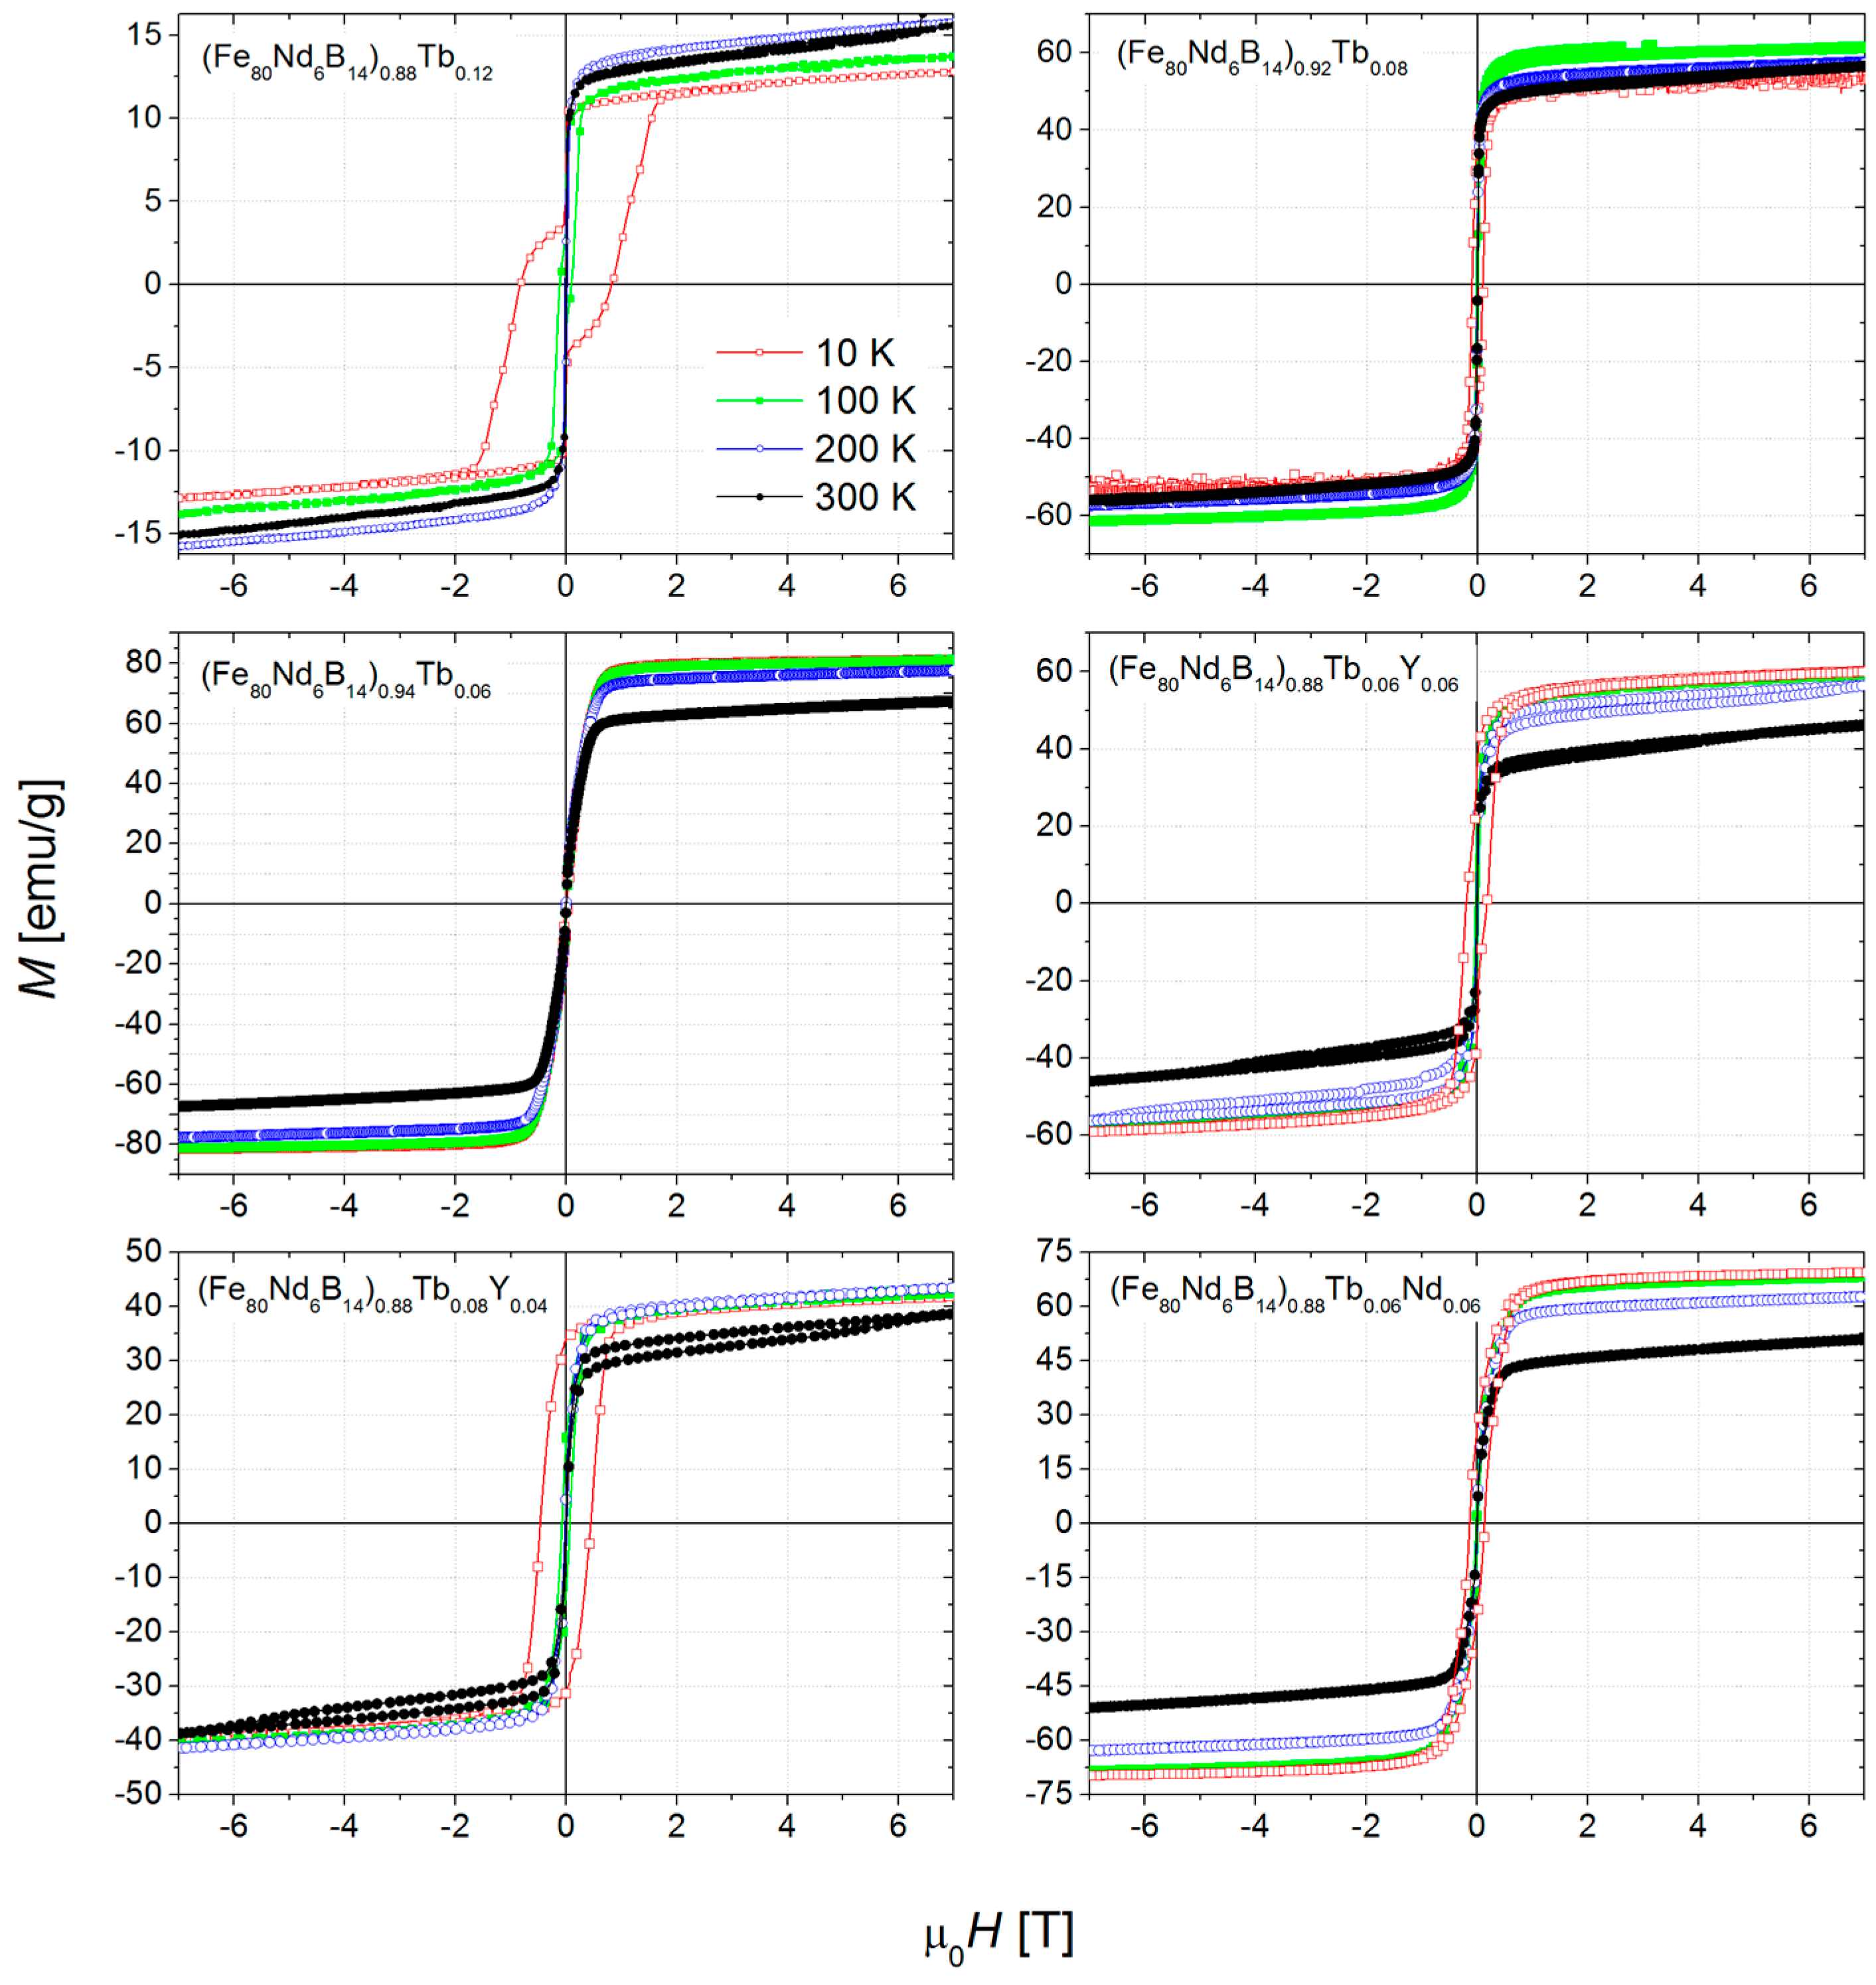
Figure 2 depicts magnetic hysteresis loops measured at 10 K, 100K, 200 K and 300 K for all alloys in question.
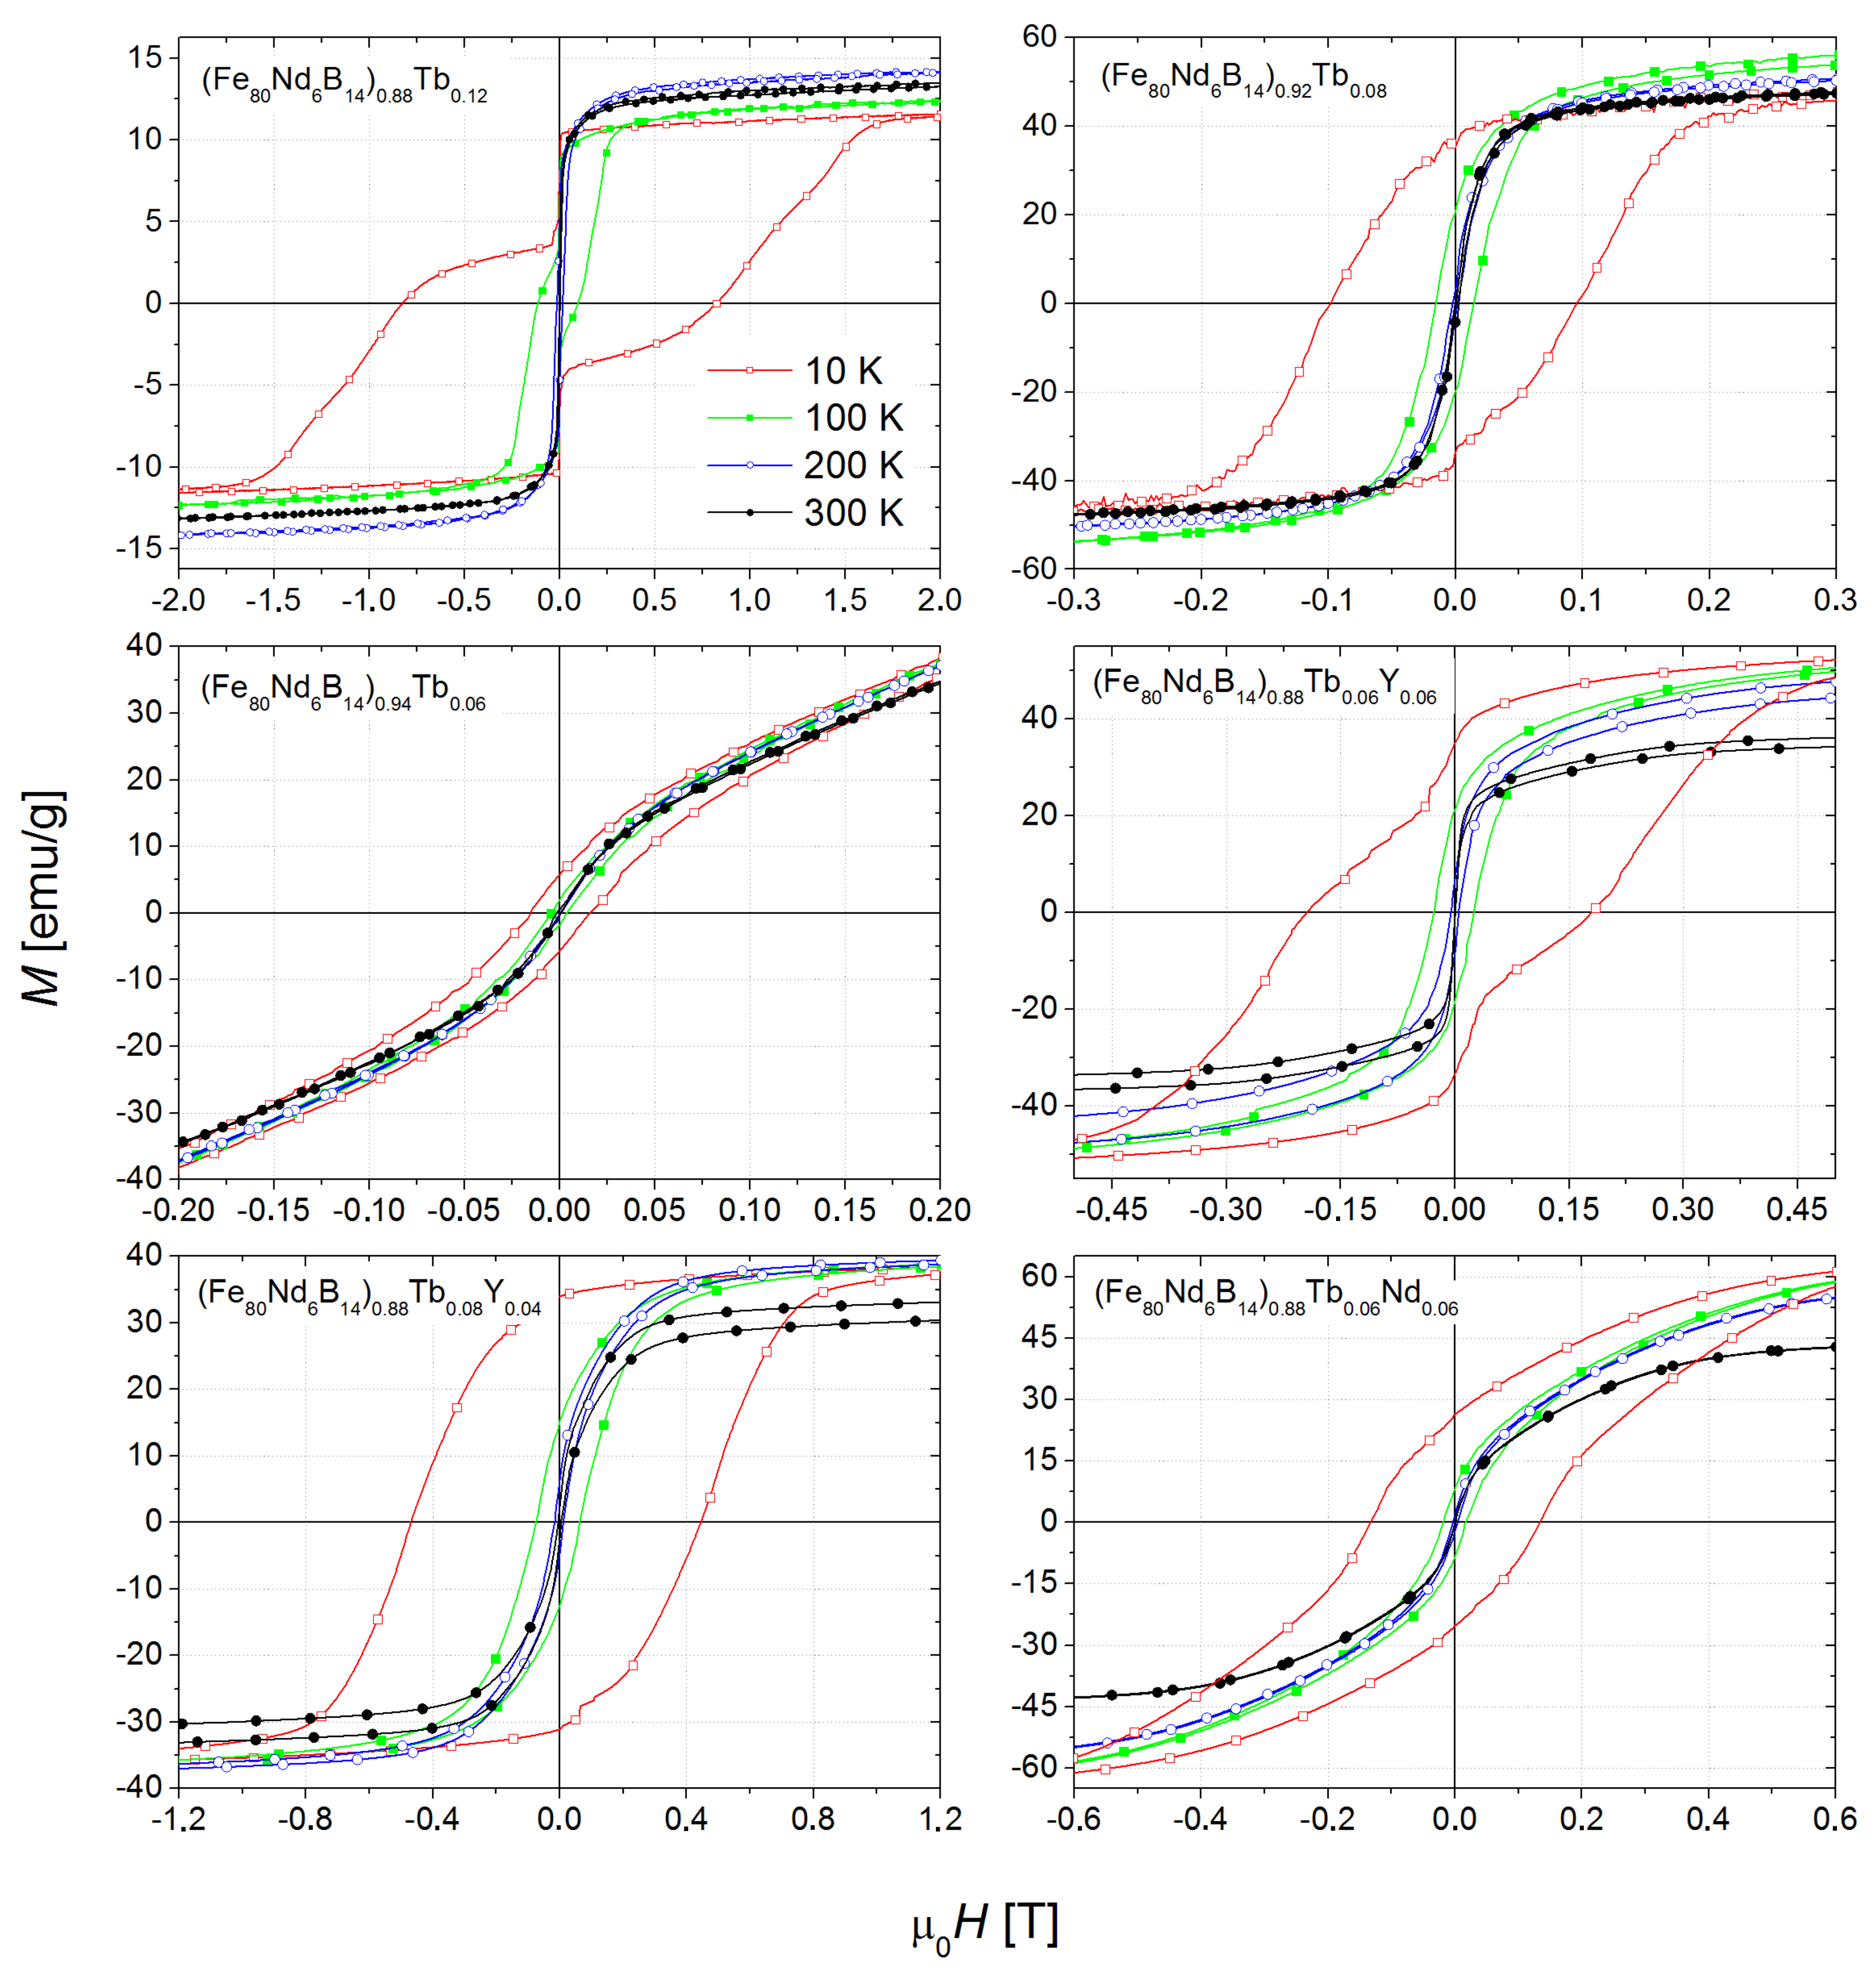
Figure 3 focuses on the low-field region to provide a clearer visualization of the coercivity.
It should be noted that in all cases, the alloys exhibit non-zero coercive fields and remanence, even at room temperature. At lower temperatures, these parameters increase significantly due to the reduction in thermal energy. For the Tb12 and Tb6/Y6 alloys, “two-step” hysteresis loops were observed. This effect clearly indicates the existence of two magnetic phases with different anisotropy fields. For further discussion, the collected values of the coercive fields are presented in
Figure 4.
It is interesting to compare the Tb12, Tb8, and Tb6 alloys, for which the coercive field remarkably increases with increasing Tb content. For this series, the decrease in Tb is correlated with a relatively higher Fe contribution, which in turn accelerates the strong coercivity changes. The same conclusion can be drawn by comparing the Tb6, Tb6/Y4, and Tb8/Y4 samples. The coercive field increases across this sequence, which can be attributed either to the decreasing amount of Fe (Tb6 to Tb6/Y4) or to the increasing Tb content (Tb6/Y6 to Tb8/Y4). Finally, the replacement of 6 at.% of Y with Nd did not cause any significant changes.
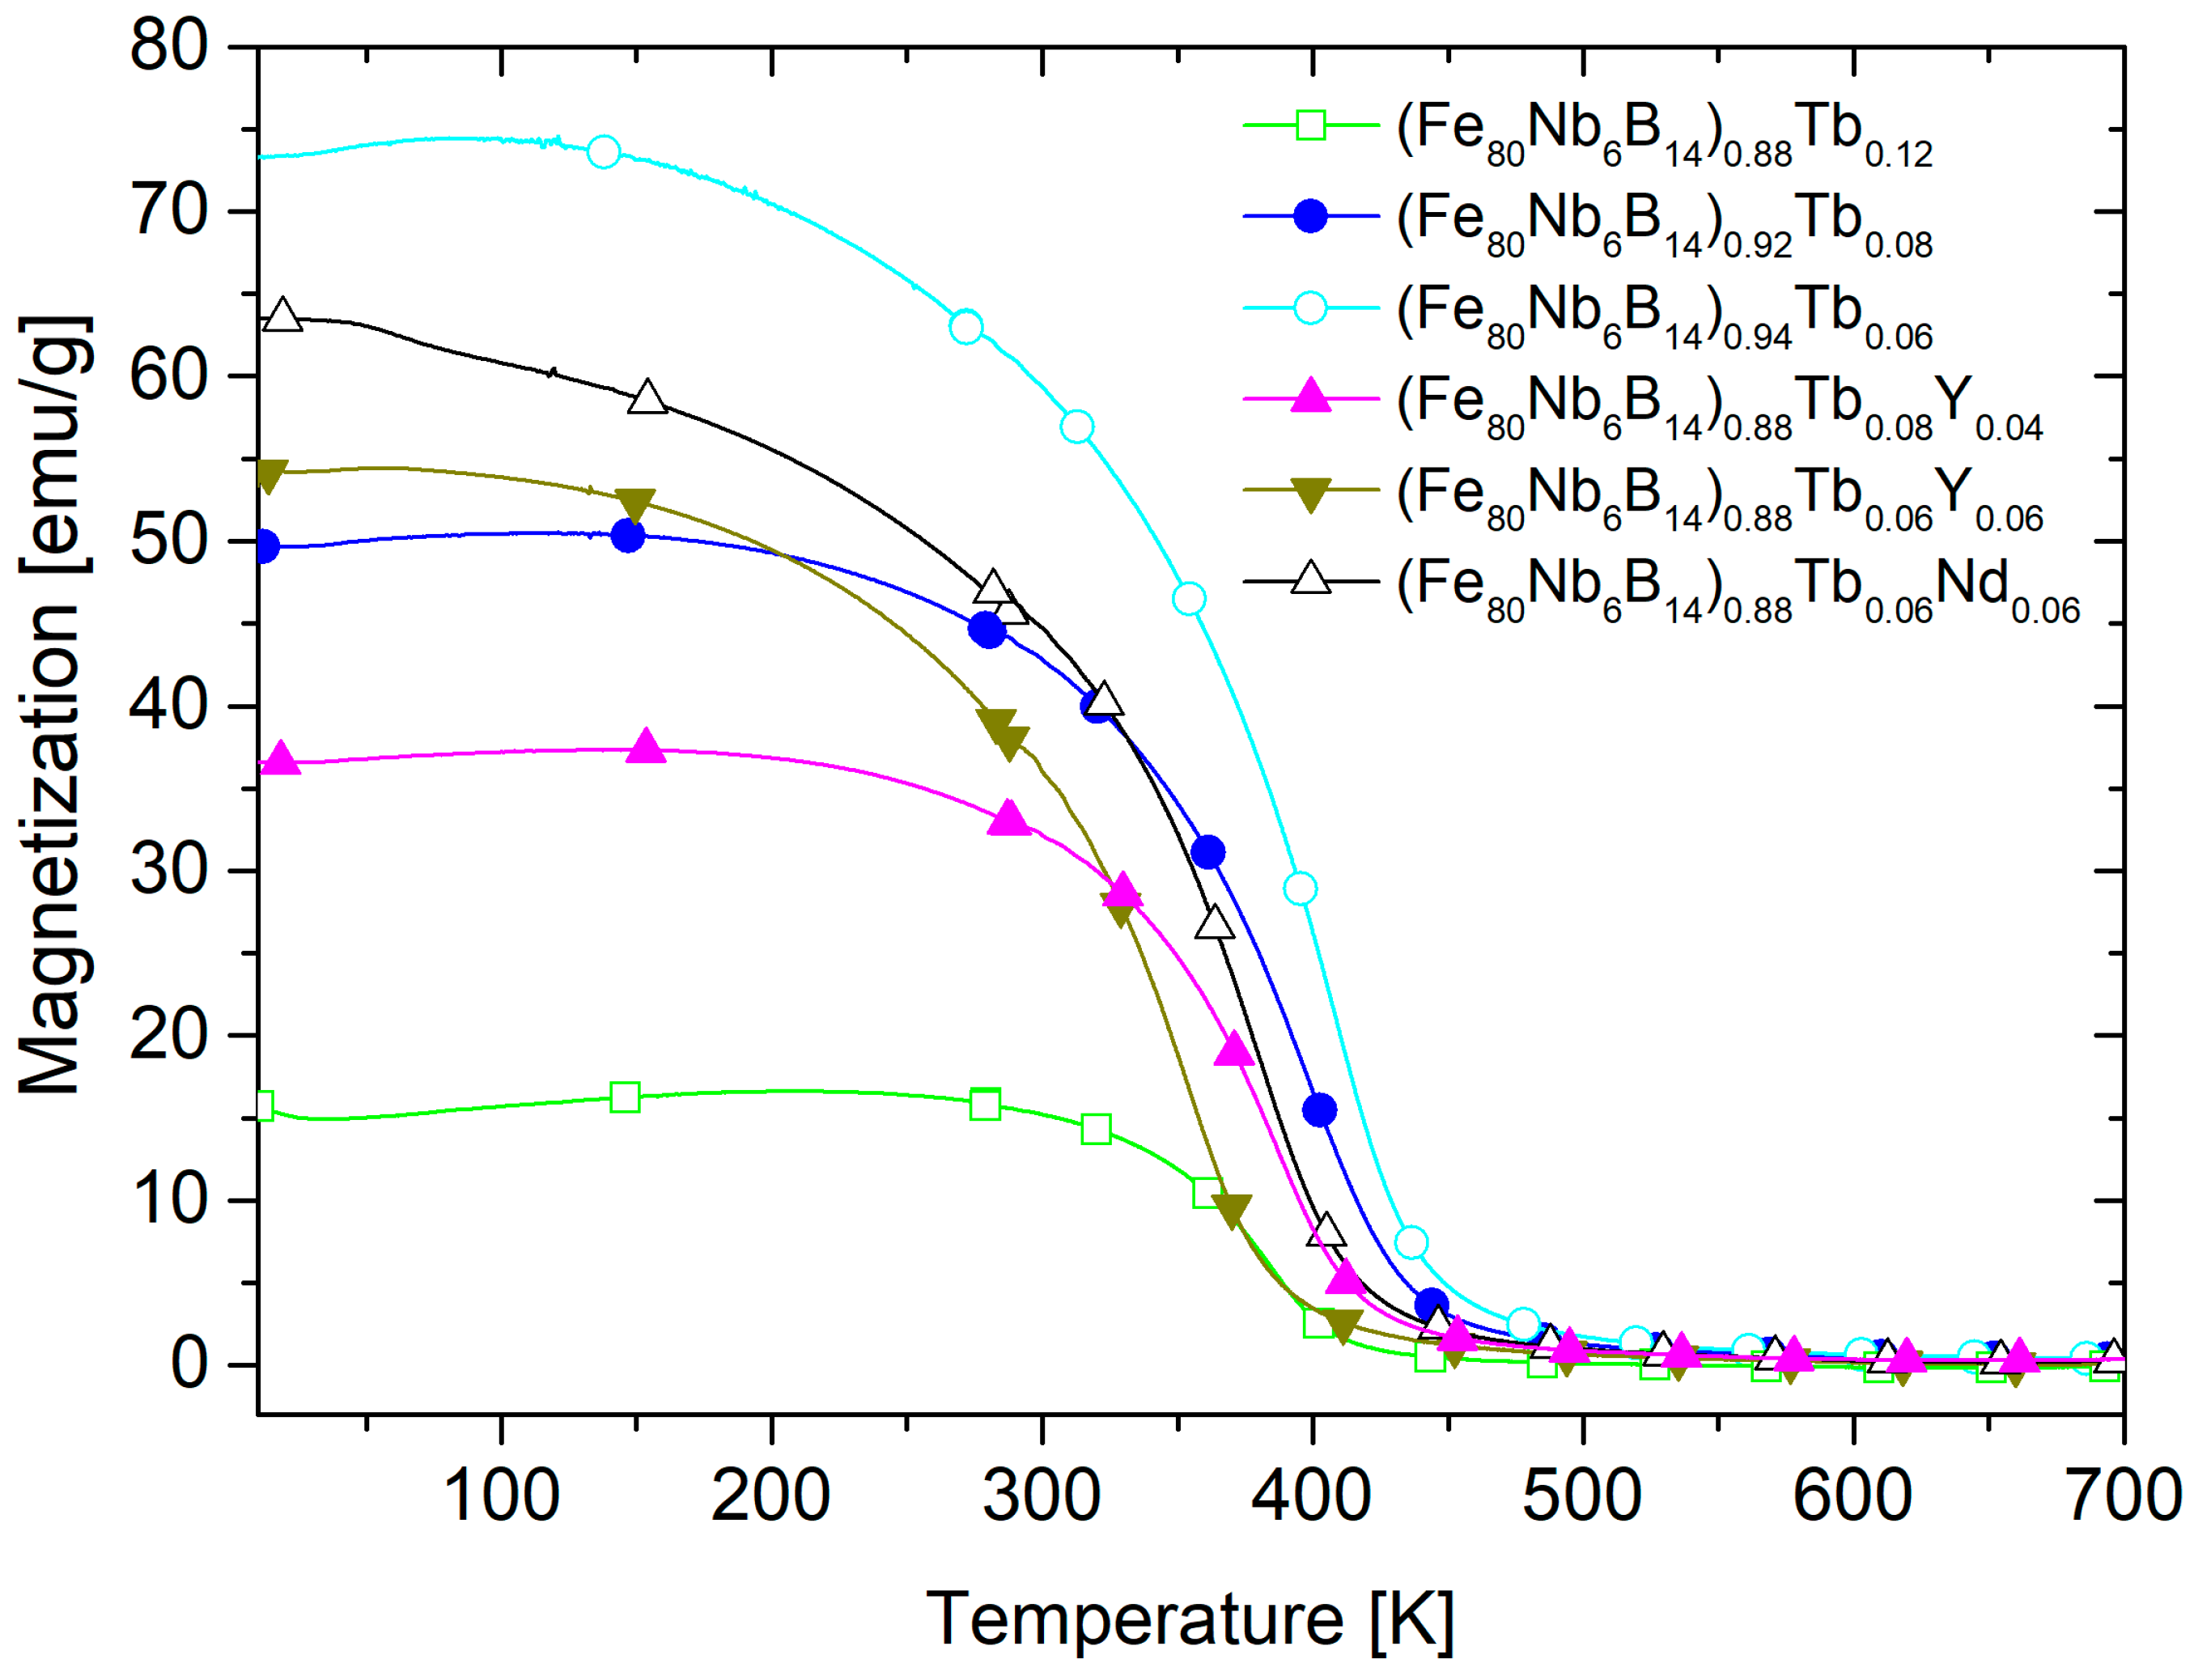
Figure 5 displays the thermomagnetic curves measured in a 1 T external magnetic field over a wide temperature range, from 10 K to 700 K. From these curves, the Curie temperatures (
TC) were determined and are collected in
Table 2 along with other selected magnetic parameters.
As shown, the highest Curie temperature of 406 K was observed for the Tb6 alloy, a result that is likely attributed to its highest Fe contribution. For the same reason, the saturation magnetization (Ms) is also highest for Tb6, given that the magnetic moments of Tb and Fe are antiferromagnetically coupled. The values of the magnetic remanence (Mr) are relatively low and decrease with increasing temperature.
It should be noted that for the Tb12 and Tb8 alloys, the saturation magnetization (measured at 7 T) is lower at 10 K than at the other temperatures tested. This behavior can be attributed to the ferrimagnetic Fe-Tb structure and spin reorientation related to the strong deterioration of the hard magnetic properties with increasing temperature. Furthermore, it should also be mentioned that in all cases, the magnetization drops to zero for temperatures above the Curie points. Simultaneously, the relatively low TC values indicate the dominant role of the amorphous state.
Figure 6 presents the MOKE (Magneto-Optical Kerr Effect) images determined at room temperature for the (Fe
80Nb
6B
14)
0.88Tb
0.12, (Fe
80Nb
6B
14)
0.88Tb
0.0, and (Fe
80Nb
6B
14)
0.88Tb
0.06 alloys, alongside the RE-free Fe
80Nb
6B
14 amorphous alloy for comparison. The observed magnetic domains in the Tb-containing samples exhibit a characteristic “fingerprint” structure, particularly noticeable in Tb12 and Tb8. In contrast, the Fe
80Nb
6B
14 sample displays a simple domain structure, which is typical of soft magnetic materials.
As a supplement to the measurements presented above, the thermomagnetic curves were used to calculate the exchange integral parameters based on the mean field theory (MFT) [
21,
22,
23]. The application of MFT to amorphous materials required certain simplifications and assumptions. The first difficulty arose from the necessary coordination numbers (
Z). The adequate
Z values were estimated based on the alloy composition and the Fe-to-Tb ratio. Furthermore, we neglected exchange interactions between Tb magnetic moments, retaining only the coupling between Fe-Fe (
JTT) and Fe-Tb (
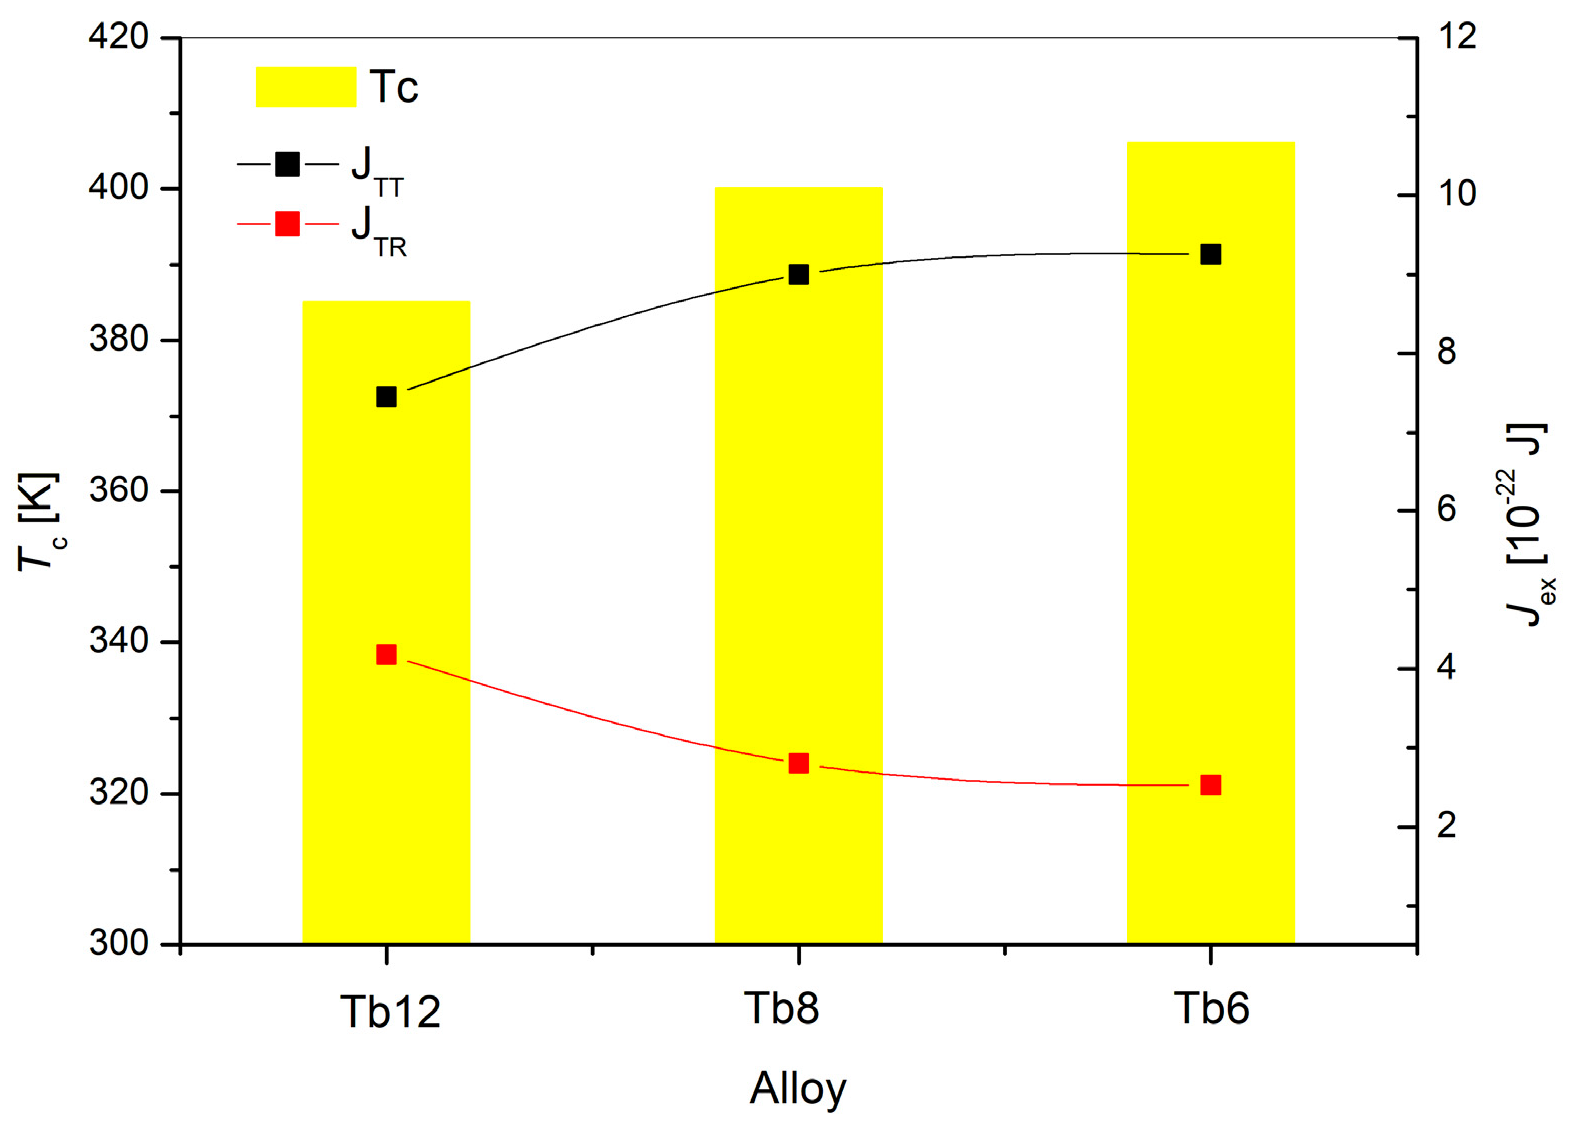
JTR). The obtained results are presented in
Figure 7. Additionally, the values of the Curie points are included as an experimental reference, thereby revealing the resulting exchange interactions.
Table 3 presents the values determined for the best fit of the calculated MFT curves to the experimental
M(
T) dependencies (The obtained
JTT values are typical for different iron-based amorphous alloys [
18,
19,
20], confirming the correctness of the initial assumptions. Moreover, the
JTT parameters correlate well with the Curie temperatures. The strongest Fe-Fe interactions occur for the Tb6 alloy, which has the highest Fe content. Increasing the Tb addition reduces the exchange interaction between the Fe-Fe magnetic moments. Simultaneously, the Fe-Tb exchange coupling becomes stronger as the amount of Tb increases.
The Tb12 and Tb8Y4 alloys were selected as candidates for further thermal treatment, consisting of isothermal annealing for one hour at temperatures (TA) ranging from 600 K to 1050 K. It was determined that partial crystallization and corresponding changes in magnetic properties occurred above an annealing temperature of 950 K. Therefore, the presented analysis focuses on this temperature region.
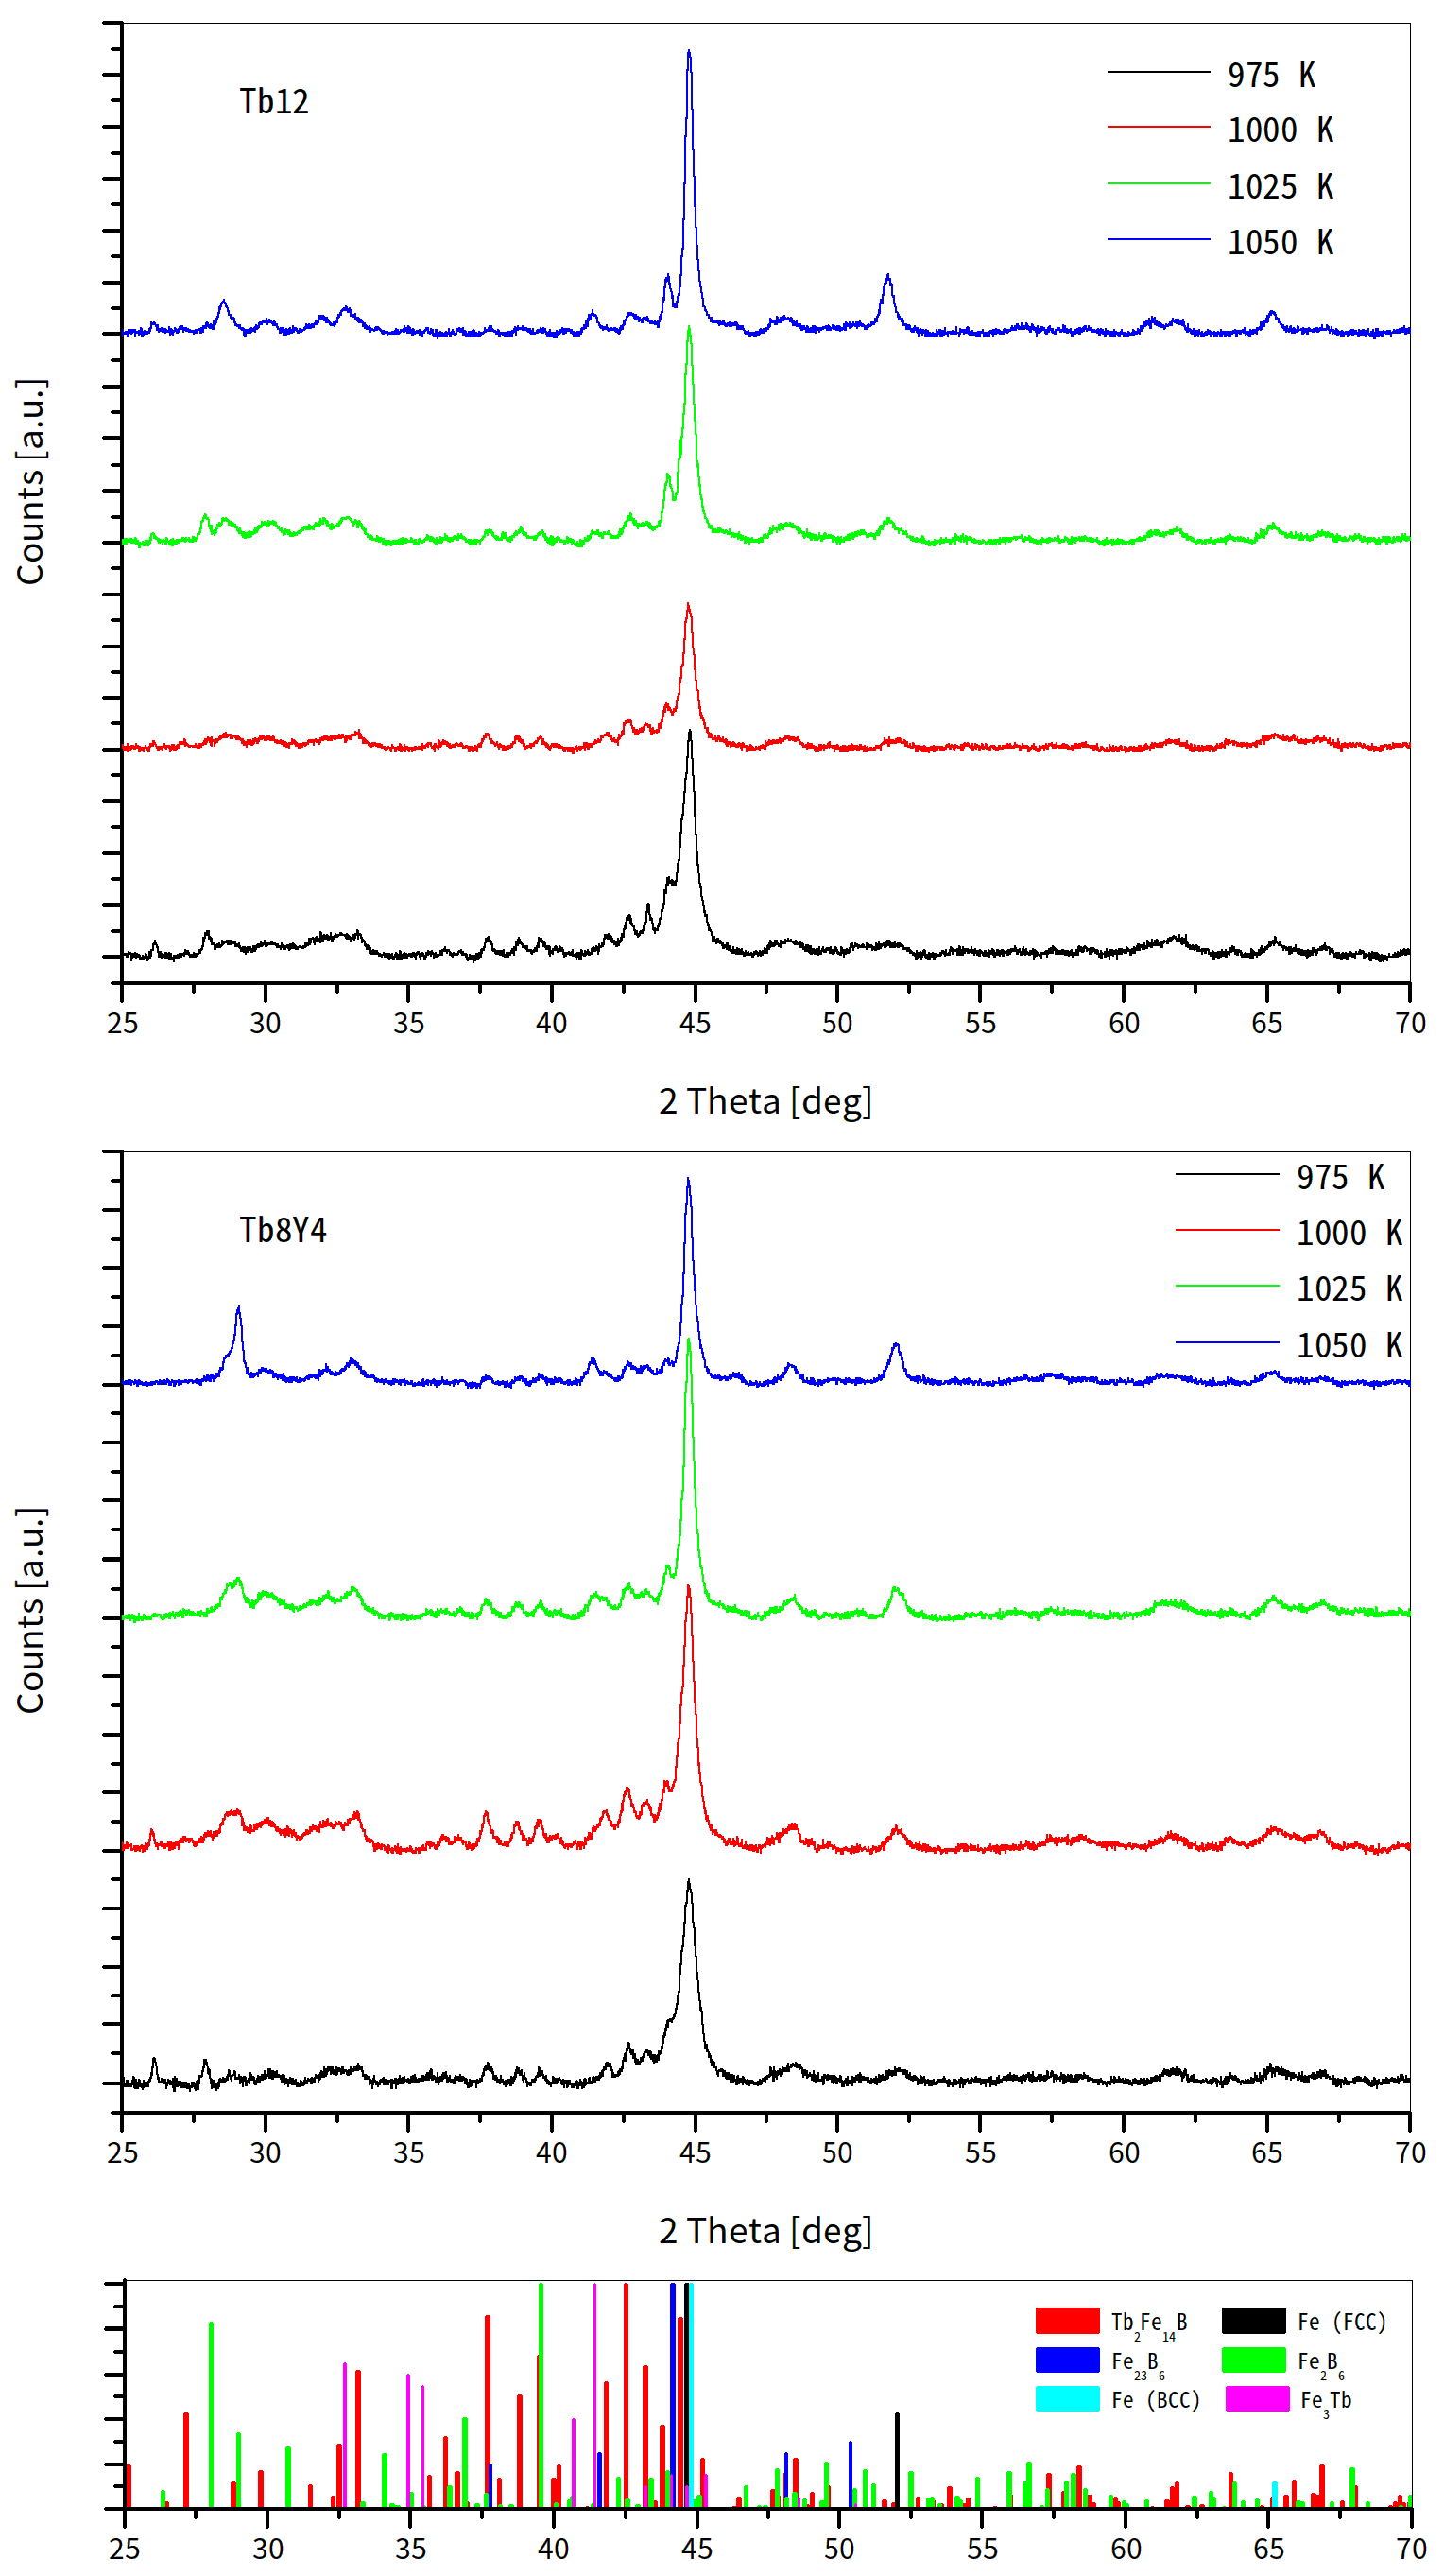
Figure 8 depicts the XRD patterns for all annealed alloys. Several distinct phases were detected, including (i) the hard magnetic phase Tb
2Fe
14B; (ii) the soft magnetic phase Fe (BCC); (iii) Fe (FCC), which may exhibit ferromagnetic or antiferromagnetic properties; and (iv) various iron borides (Fe
3B, Fe
23B
6, Fe
2B
6).
Table 4 presents the quantitative analysis of the phase composition for the magnetically relevant phases (Tb
2Fe
14B, Fe (BCC), and Fe (FCC)). In the case of the Tb8Y4 alloy, a formation of Y
2Fe
14B is expected but cannot be distinguished from the Tb
2Fe
14B compound. A common trend is observed: the content of the hard magnetic phase Tb
2Fe
14B increases up to an annealing temperature (
TA) of 1000 K and then gradually decreases. Simultaneously, the concentration of the Fe phase increases with increasing annealing temperature.
Figure 9 and
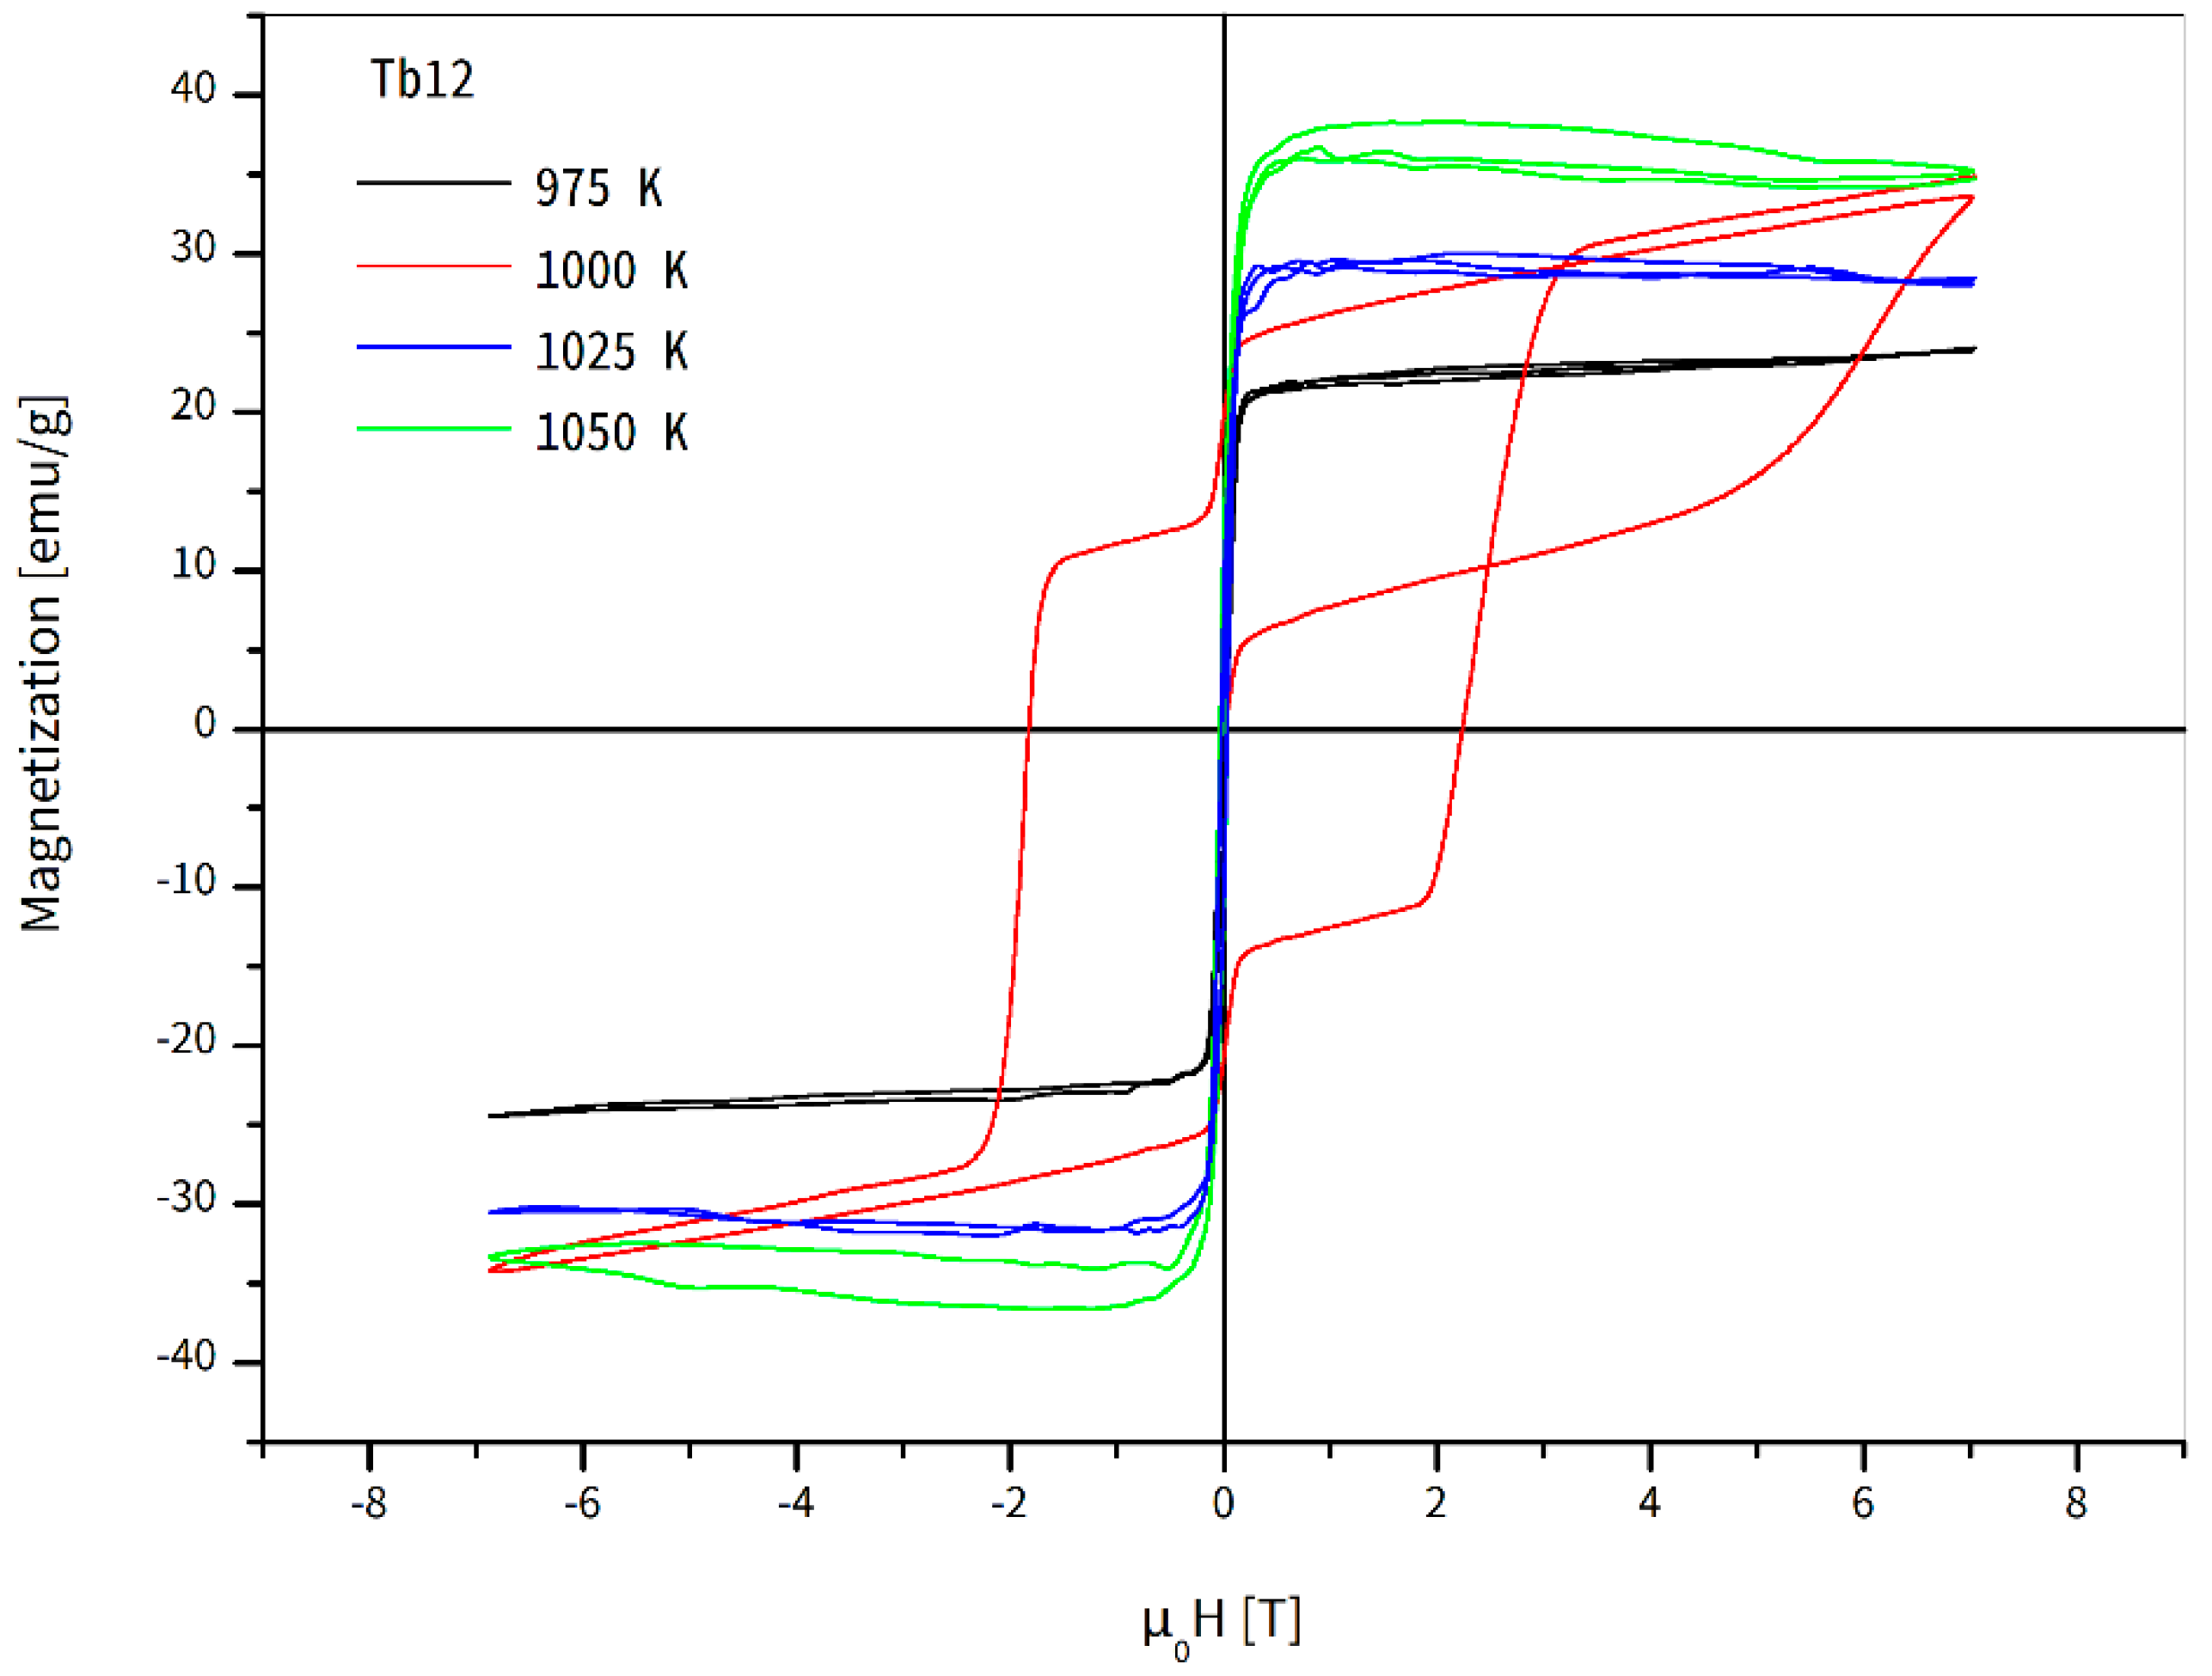
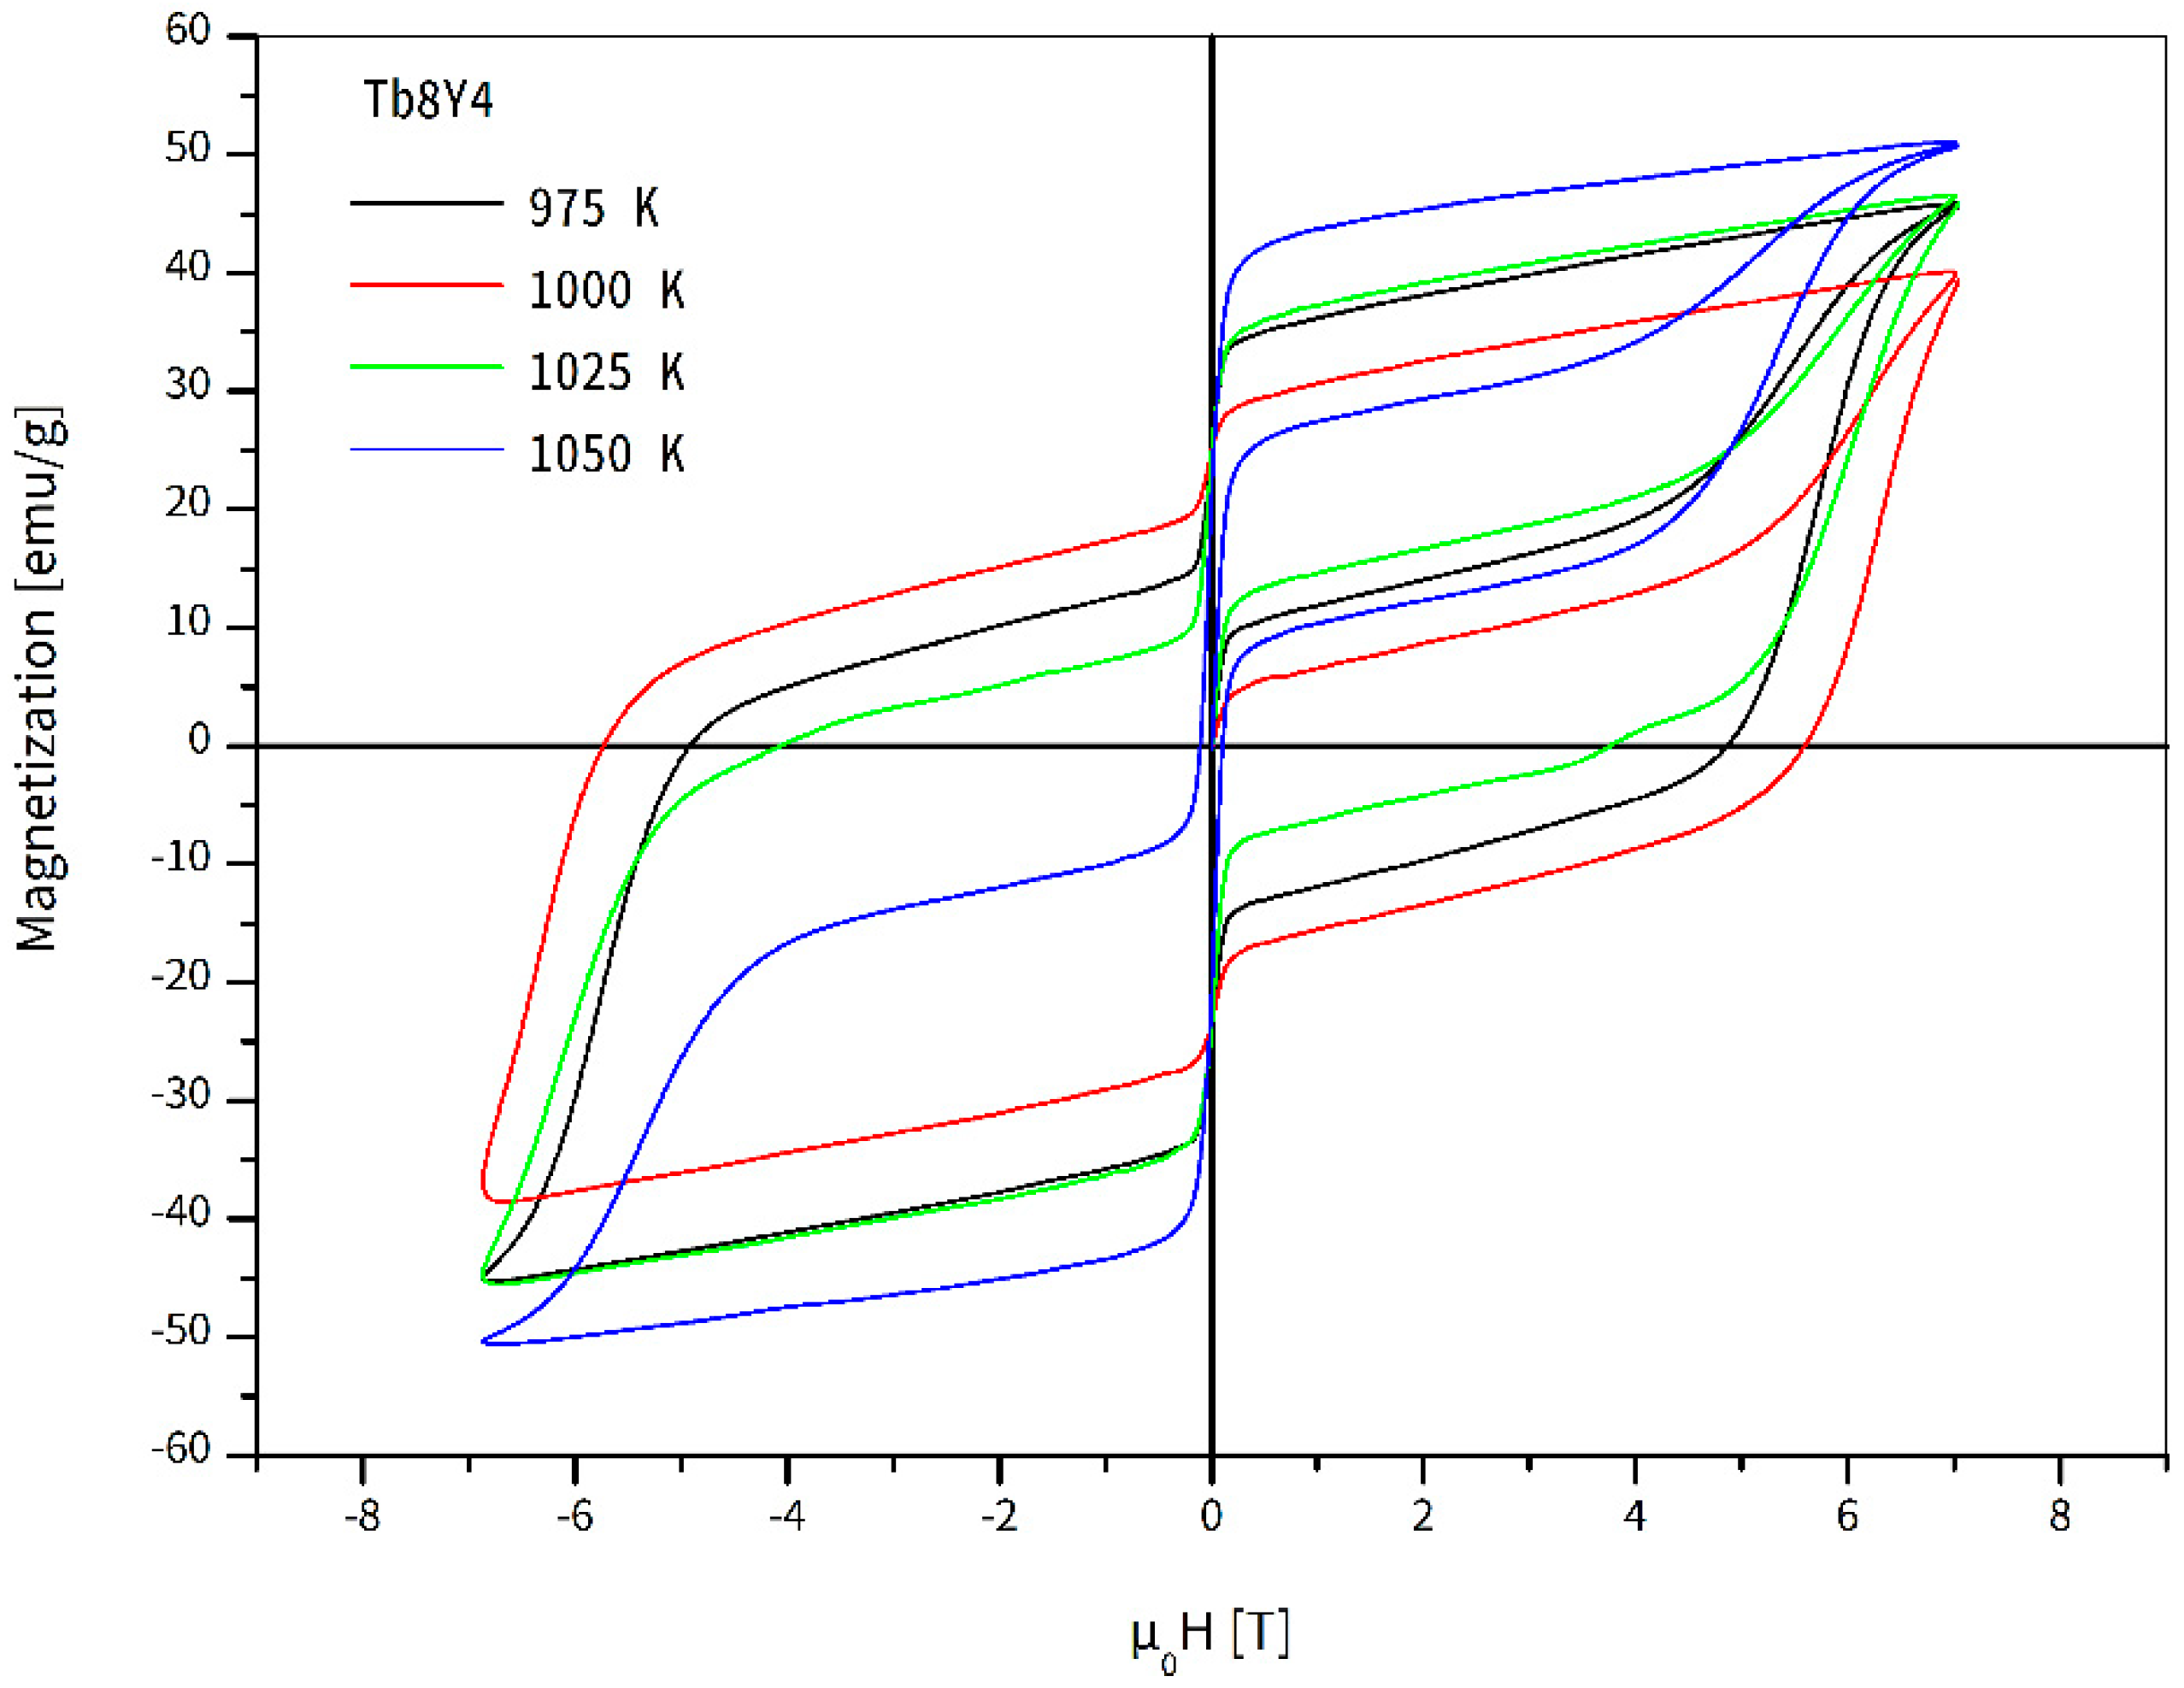
Figure 10 depict the magnetic hysteresis loops (measured at room temperature) for the annealed Tb12 and Tb8Y4 samples, respectively. As shown, the applied annealing caused significant changes in the magnetic characteristics. In the case of the Tb12 alloy, the formation of a hard magnetic component was observed only for an annealing temperature (
TA) of 1000 K. The coercive field reached a value of 1.8 T. It should be noted that the 7 T external magnetic field applied was insufficient to achieve full magnetic saturation. This hard magnetic component coexists with a soft one, which is responsible for the rapid decrease in magnetization near zero magnetic field.
A different situation was observed for the Tb8Y4 sample. In this case, the appearance of the hard magnetic component was detected at all the presented annealing temperatures. One can see increasing magnetic hardness up to TA = 1000 K, followed by its gradual deterioration at higher annealing temperatures. The highest coercivity value, 5.77 T (TA = 1000 K), was recorded, and, similar to the previous case, the resulting hysteresis loop remained unsaturated.
4. Discussion
The alloys in the as-cast state are mainly amorphous with small traces of crystalline Fe (Tb6Y6, Tb6Nd6) and Tb2Fe14B (Tb8Y4) phases. The presence of the hard magnetic phase correlates with the room-temperature coercivity; the Tb8Y4 sample, for instance, exhibits the highest coercive field (μ0Hc = 40 G at T = 300 K). The thermomagnetic curves show a typical magnetic phase transition with one well-defined Curie point. This suggests that the magnetic response is due to a single magnetic phase or that any possible different magnetic phases are coupled. Based on the low-temperature hysteresis loops, it is clear that the Tb addition introduces magnetic anisotropy. Moreover, for the Tb12 alloy, the reverse magnetization process occurs in two steps, which reveals the existence of two distinct magnetic phases: one magnetically hard and one soft.
Irrespective of the alloy compositions, the coercive fields are strongly temperature-sensitive. For instance, the coercive field of the Tb12 sample decreases by a factor of approximately 55 in the 10 K to 200 K range (
Hc10K/
Hc200K). This is significantly higher than the factor of 2 observed for the (Fe
80Nb
6B
14)
0.88Tb
0.12 crystalline alloy [
13] or the factor of 1.3 for the (Fe
80Nb
6B
14)
0.88Tb
0.06Y
0.06 crystalline alloy [
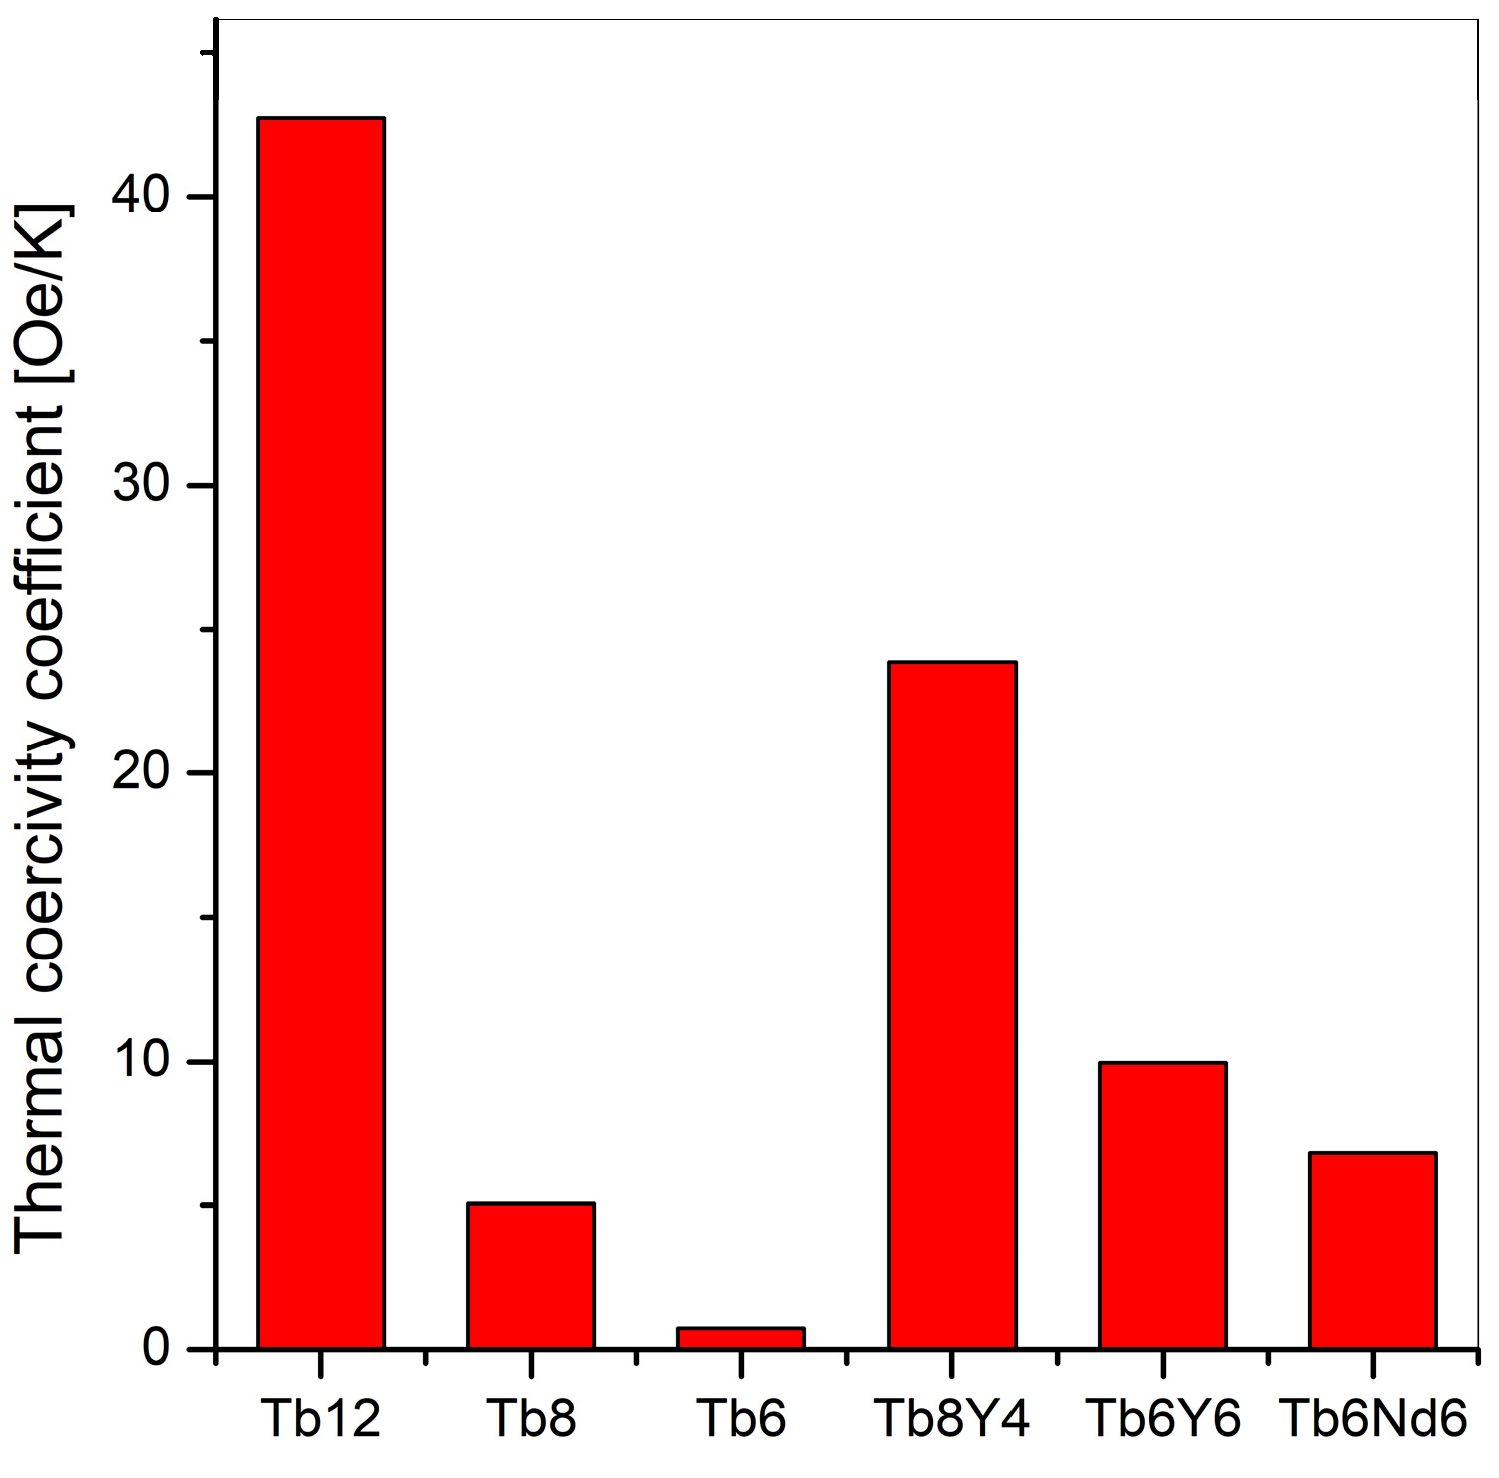
11]. Therefore, this extreme sensitivity can be considered a unique feature of the amorphous state and its relatively low exchange interaction (amorphous alloys generally have lower Curie temperatures than their crystalline counterparts). A thermal coefficient of coercivity decay can be determined, defined as [
Hc(
T1) −
Hc(
T2)]/(
T2 −
T1), where
T1 = 10 K and
T2 = 200 K. As shown in
Figure 11, this parameter can be controlled by alloying additions. The highest value (42.7 Oe/K) was observed for Tb12 alloys. Decreasing the Tb content while simultaneously increasing the Fe content (Tb12 → Tb8 → Tb6) causes the coercivity decay effect to almost disappear.
One can conclude that the RE additions introduce the so-called hard magnetic properties. Furthermore, similar to crystalline equivalent alloys, the strong spin–orbit coupling of Tb atoms is responsible for the observed magnetic anisotropy. This suggests that the environment surrounding Tb atoms in our alloys is asymmetric, a condition necessary for the distortion of the Tb orbitals to occur. The magnetic anisotropy is also visible in the MOKE pictures obtained at room temperature, as shown in
Figure 6.
The carried out measurements, in conjunction with the MFT analysis, clearly revealed the presence of magnetic anisotropy in the non-crystalline iron-based alloys tested. It was determined that rare earth alloying additions are responsible for this effect, primarily due to the strong spin–orbit coupling of the Tb element. The alloys with a high concentration of Tb exhibited relatively high coercive fields, reaching the value of 0.827 T at 10 K for the Tb12 alloy. Furthermore, the thermomagnetic curves rule out the possible influence of small crystalline traces on the magnetic properties. Supporting this, the amorphous nature of the examined alloys is confirmed by the observed low Curie temperatures and the strong deterioration of coercivity caused by thermal energy. These conclusions are consistent with the calculated values of the exchange integral parameter, JTT, which are about one order of magnitude lower than those in crystalline iron, a finding expected for its amorphous state.
The influence of annealing on the phase composition is particularly interesting. The XRD measurements confirm the formation of the hard magnetic phase Tb2Fe14B and the crystallization of iron into two structures: Body-Centered Cubic (BCC) and Face-Centered Cubic (FCC). The maximum content of Tb2Fe14B observed, reaching approximately 28 wt.%, is characteristic of an annealing temperature of 1000 K. At this optimal temperature, the soft magnetic Fe (BCC) content is around 27 wt.%. For higher annealing temperatures, a gradual decrease in Tb2Fe14B (down to 10 wt.%) was observed, concurrent with an increase in the Fe content. These significant changes in phase composition are expected to strongly influence the magnetic properties of the tested alloys.
Indeed, the magnetic hysteresis loops of the annealed alloys exhibit hard magnetic properties in several cases. Surprisingly, despite the similar phase compositions of the Tb12 and Tb8Y4 alloys, the Tb12 alloy only shows a high coercivity of 1.8 T at
TA = 1000 K. Higher coercive field values were consistently observed for all annealed Tb8Y4 alloys. The coercivity correlates with the Tb
2Fe
14B content, peaking at
TA = 1000 K (5.7 T). It should be stressed that all hysteresis loops (those exhibiting coercivity) are unsaturated. This suggests the existence of magnetic moments or domains with an anisotropy field exceeding 7 T. Consequently, an analysis of the magnetic moments attributed specifically to the Fe and Tb atoms is currently impossible. Nevertheless, one can analyze the properties of the hard magnetic objects. The derivative d
M/d
H reflects reverse magnetization intensity and its maximum reveals the mean anisotropy field (
HA) of these objects.
Figure 12 presents such curves for the annealed alloys. The highest value of
HA = 6.5 T was observed for the Tb8Y4 sample annealed at 1000 K. For higher values of
TA, the anisotropy fields gradually decrease, reaching 5.4 T, which still can be qualified as an ultra-high value.
Another key feature of the studied alloys is the coexistence of two magnetic phases: one hard and one soft. Let us compare the saturation magnetization of Fe and Tb2Fe14B, which are approximately 200 emu/g and 40 emu/g, respectively. Based on this, 30 wt.% of uncoupled Fe should cause a higher than 50% drop in magnetization around the zero magnetic field. However, the observed “first step” of the hysteresis loop does not exceed 20% for the Tb8Y4 sample annealed at 1000 K. This discrepancy indicates that a portion of the soft phase is magnetically coupled with the hard magnetic component, operating as a spring-exchange system.
The presented results indicate that the crystallization path from the solid state yields significant differences when compared with crystallization from the liquid state (e.g., in vacuum suction rods [
14,
15,
16]). Specifically, the annealing process promotes the preferential formation of Fe and Fe-B phases. The phase structure at the optimal
TA contains approximately 30 wt.% of the hard magnetic (Tb/Y)
2Fe
14B compound (compared to about 90 wt.% for vacuum suction rods), a proportion that appears quite low for permanent magnet materials. Despite this low content, the coercive fields exceed 5 T at room temperature. This suggests that the co-crystallization of hard and soft magnetic phases from the solid state results in more effective exchange coupling than observed for rods crystallized from the liquid state.
Considering applications for permanent magnets, the appearance of an uncoupled soft magnetic phase is undesirable, and further investigations should focus on mitigating this problem. Nevertheless, the controlled crystallization from the solid state demonstrated the possibility of forming a magnetic bulk composite that contains partially coupled hard and soft phases. Therefore, the studied alloys show significant potential for designing new hard magnetic materials.

