Article

Crystal Plasticity Modeling of Mechanical Anisotropy for TiAl Alloy Under Uniaxial and Biaxial Loading

1
AECC Hunan Aviation Powerplant Research Institute, Zhuzhou 412002, China
2
School of Civil Aviation, Northwestern Polytechnical University, Xi’an 710072, China
*
Author to whom correspondence should be addressed.
Crystals 2025, 15(11), 943; https://doi.org/10.3390/cryst15110943
Submission received: 13 September 2025 / Revised: 9 October 2025 / Accepted: 12 October 2025 / Published: 31 October 2025

Abstract

TiAl alloys are widely used in aerospace applications due to their low density and good mechanical properties. However, their pronounced mechanical anisotropy resulting from the preferred orientations of lamellar crystals remains an important issue. This study investigates the plastic anisotropy of TiAl alloys under various stress states using full-field crystal plasticity modeling based on electron backscatter diffraction data. The crystal plasticity simulations successfully reproduce the experimental mechanical anisotropy in uniaxial and biaxial tests. The research combines crystal plasticity simulations with Yld2004-18p anisotropic yield function to develop a predictive model that accurately characterizes the anisotropic yielding behavior of the TiAl alloys under various stress states. The findings demonstrate that the Yld2004-18p anisotropic yield function effectively describes the macroscopic anisotropic response obtained from crystal plasticity simulations, providing an important theoretical foundation for predicting the anisotropic behavior of TiAl alloys in engineering structures.

1. Introduction

As an emerging structural material, TiAl alloys exhibit superior properties, including low density coupled with high specific strength and stiffness [1,2,3,4,5]. These characteristics confer distinct advantages over conventional nickel-based superalloys [6,7,8]. Particularly, TiAl alloys have emerged as the primary candidate material for next-generation critical aerospace components [9,10]. The limited room-temperature ductility of TiAl alloys is predominantly governed by their microstructure. Enhancing this property typically involves optimizing the alignment of lamellae and acquiring a refined, homogeneous lamellar structure [11,12].
However, the distinctive crystallographic structure of TiAl alloys results in pronounced mechanical anisotropy [13]. Recently, the machine learning method is used to investigate the correlation between the microstructure and mechanical properties of γ-TiAl alloys [14]. The γ-phase possesses an L10-ordered face-centered tetragonal (FCT) superlattice structure with a c / a ratio typically approximating 1.02 [15,16]. This low-symmetry lattice fundamentally dictates severely restricted dislocation slip in TiAl. Research demonstrates that the primary slip systems governing plastic deformation in TiAl are the 101 { 111 } ordinary slip and 1 2 110 { 111 } superdislocation slip [17,18,19]. These slip systems exhibit high Peierls stresses, low mobility, and substantial differences in critical resolved shear stress (CRSS) across different slip systems [20]. Furthermore, CRSS displays crystallographic orientation dependence [21]. Consequently, macroscopic mechanical properties of TiAl alloys include yield strength, flow stress, work hardening rate, and ductility: the dominant deformation mechanisms themselves manifest extreme orientation dependence. This inherent, microstructure-driven anisotropy poses a significant hurdle for the reliable design and deployment of TiAl components subjected to the complex multiaxial stress states inherent in service [22,23,24].
The operational loading on components like turbine blades arises from centrifugal forces and aerodynamic pressures, creating a state of biaxial stress, far removed from the simplicity of uniaxial tension or compression [25,26]. Extensive research has characterized the uniaxial behavior of TiAl alloys, revealing valuable insights into orientation-dependent yield strengths, creep rates, and fatigue thresholds [27,28]. However, a critical knowledge gap persists: mechanical data on the biaxial mechanical response of TiAl is exceedingly scarce. This gap is particularly problematic given the material’s strong anisotropy [29].
In this study, an EBSD data-based full-field crystal plasticity modeling is conducted to predict the mechanical anisotropy of TiAl alloys, which take accounts of the realistic crystalline morphology and orientation. Experimental uniaxial tests with orientations of 0°, 45°, and 90°, along with biaxial tests, are subjected to quasi-static loading to obtain the yield stresses under uniaxial and biaxial loading conditions. This experimental data is used to verify the CP modeling. The CP modeling-predicted mechanical anisotropy is used to calibrate the anisotropic Yld2004-18p yield function [30], which enables the accurate prediction of anisotropic mechanical behavior of TiAl at macroscale simulations of engineering structure.

2. Constitutive Model

2.1. Finite Strain Crystal Plasticity Theory

In the framework of finite strain crystal plasticity theory, the plastic shear rate γ ˙ α on each slip system is governed by a constitutive power law.
γ ˙ α = γ ˙ 0 τ a g α 1 / m s g n ( τ a )
The reference deformation rate γ ˙ 0 and the rate sensitivity exponent m characterize the kinetic law of crystalline slip, setting the scale and rate dependence of plastic flow. The slip resistance g α evolves from its initial value g 0 toward a saturation value g as deformation proceeds. The rate form of a hardening law defines the evolutionary response of g α during plastic straining.
g ˙ α = β N h α β γ ˙ β
With the initial condition g α ( 0 ) = g 0 , the current rate of slip resistance evolution is defined through the hardening matrix h α β :
h α β = h 0 q + ( 1 q ) δ α β 1 g β g a s g n 1 g β g
The latent hardening parameter q = 1 or 1.4 governs the interaction strength between different slip systems. The hardening evolution is further defined by constants h 0 , a, and g , obtained via numerical optimization.

2.2. Linear Transformation-Based Anisotropic Yield Criterion

To describe the strain hardening response of TiAl alloys, a yield criterion is defined as follows:
σ ¯ Y ( ε ¯ p ) = 0
where σ ¯ and ε ¯ p are the effective stress and effective plastic strain, respectively. Y ( ε ¯ p ) is the yield stress and its non-linear mechanical behavior is governed by Swift hardening law:
Y ( ε ¯ p ) = K 0 ( ε 0 + ε ¯ p ) n
where K 0 , ε 0 , n are the materials parameters determined by the fitting process using the uniaxial tensile stress–strain curves in 0 ° of TiAl alloys. To accurately capture the anisotropic behavior of TiAl alloys under various stress states, the Yld2004-18p yield function based on the linear transformations is employed. The effective stress σ ¯ is defined as the function of the principal values of linear transformation of the stress component, and is expressed as [30]
Ψ S ˜ , S ˜ = S ˜ 1 S ˜ 1 a + S ˜ 1 S ˜ 2 a + S ˜ 1 S ˜ 3 a + S ˜ 2 S ˜ 1 a + S ˜ 2 S ˜ 2 a + S ˜ 2 S ˜ 3 a + S ˜ 3 S ˜ 1 a + S ˜ 3 S ˜ 2 a + S ˜ 3 S ˜ 3 a = 4 σ ¯ a
where the exponent a = 12 is used in this work to define the flexibility of the yield surface of TiAl alloys. The principal values S ˜ i and S ˜ i (i = 1, 2, 3) are obtained from the linear transformed matrices s ˜ and s ˜ , which are calculated by adopting the two linear transformations on Cauchy stress deviators.
Here, the linear transformation parameters α i , i = 1∼18 are calibrated by uniaxial and biaxial yield stresses and plastic potentials in different stress states. In this work, the EBSD map-based full-field crystal plasticity modeling is utilized to obtain plastic anisotropy data for calibration of the yield function.

3. Microstructure of TiAl Alloy

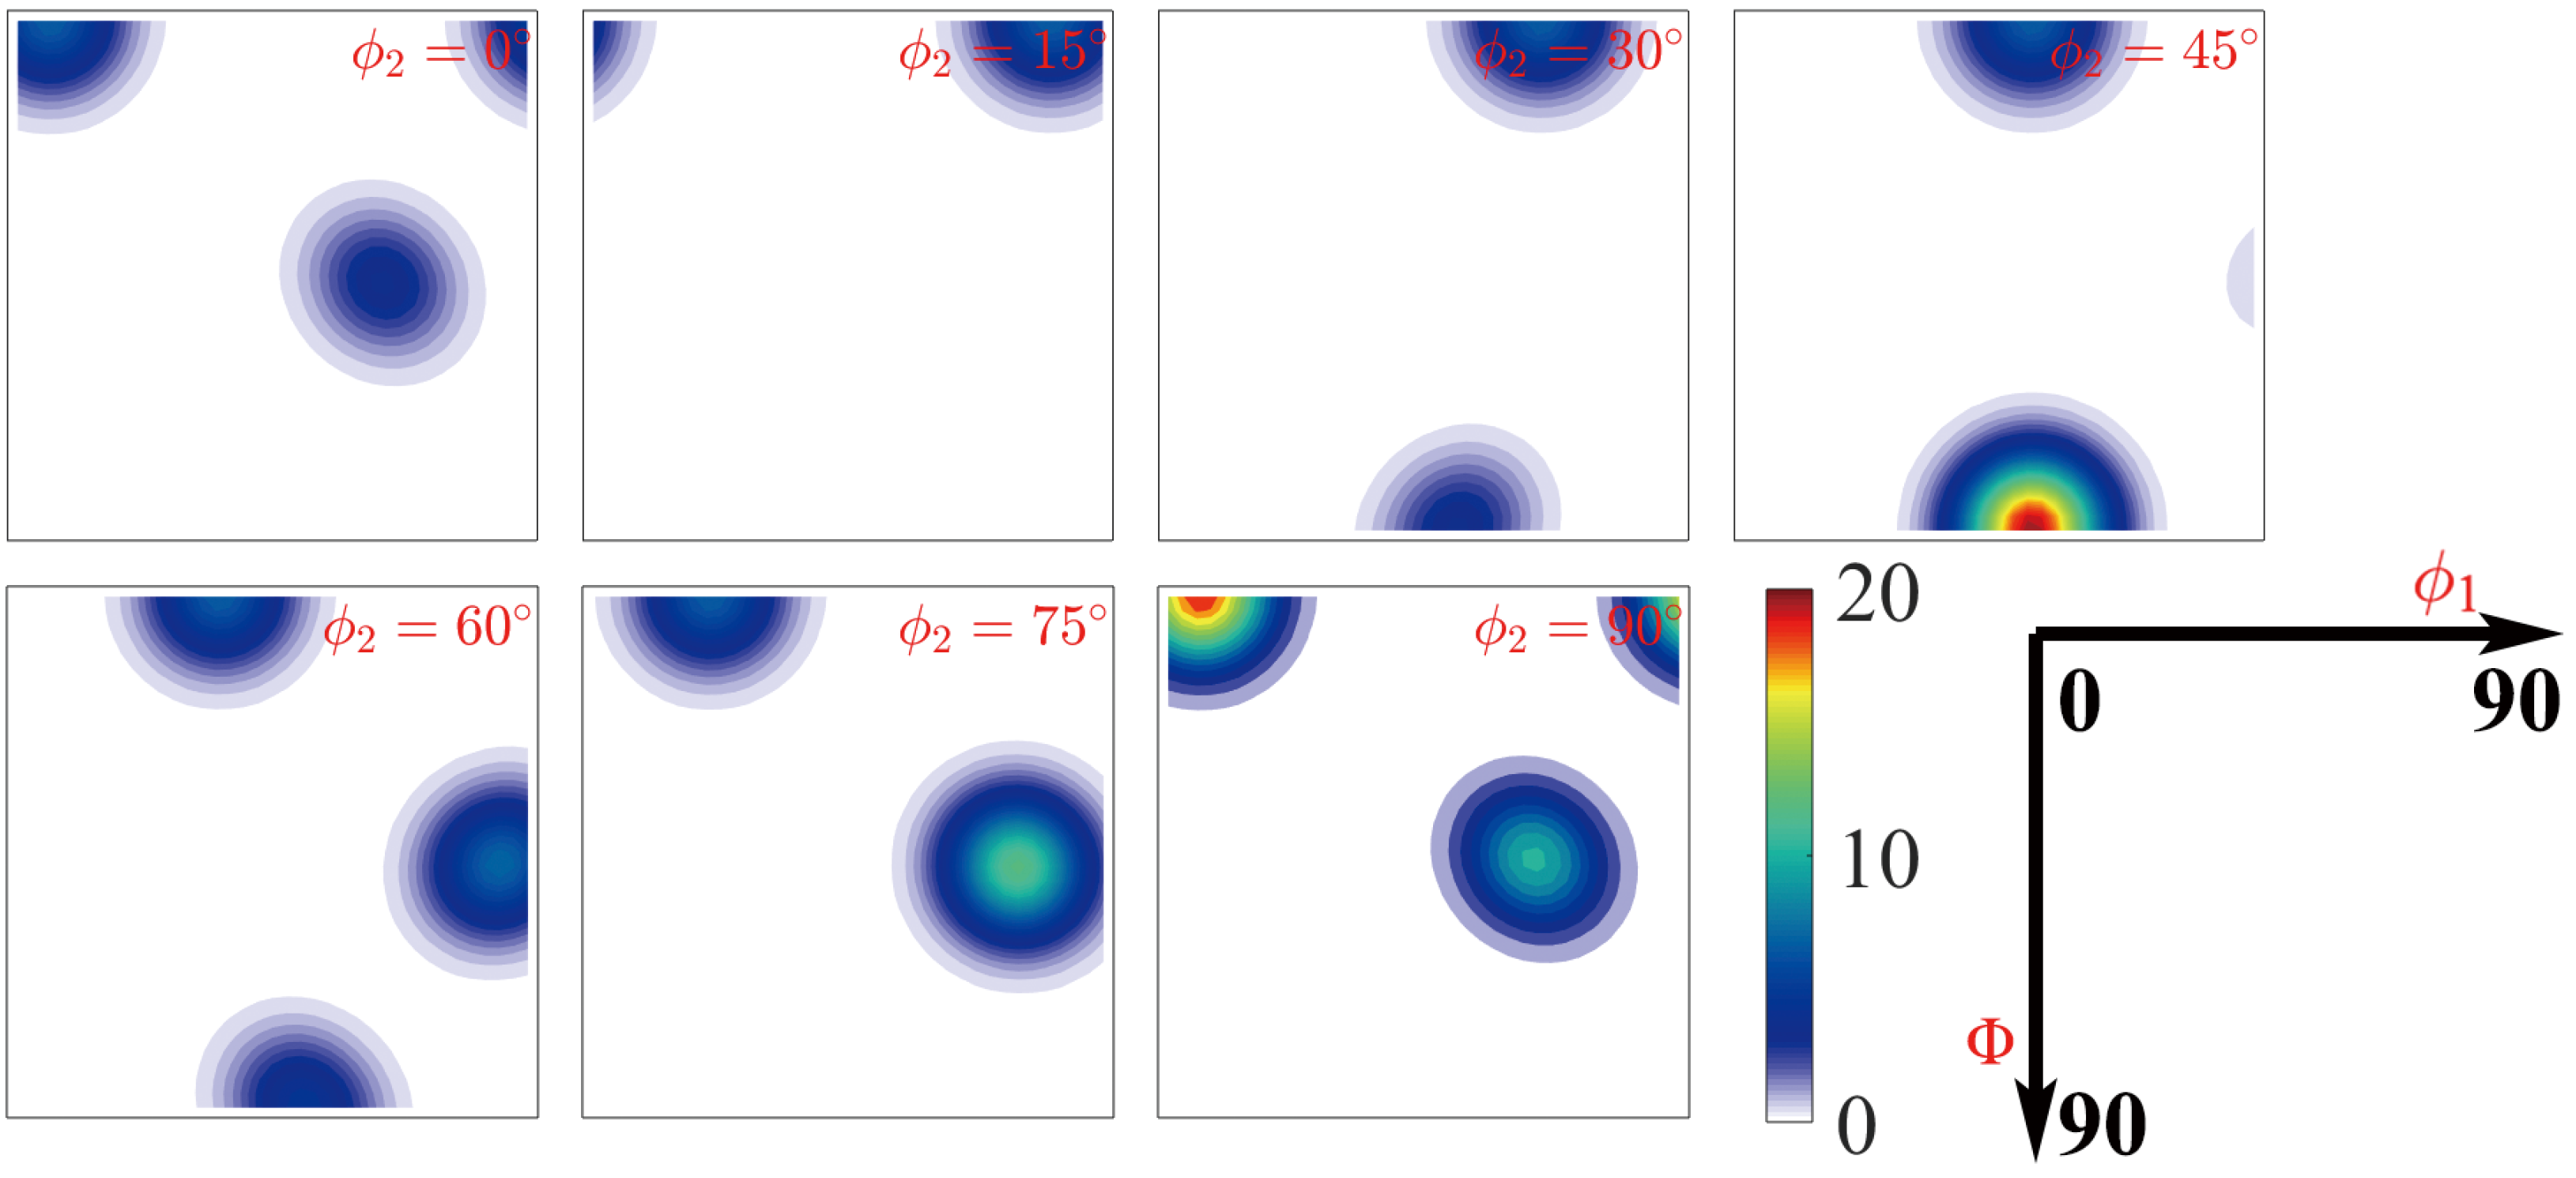
The composition of the as-received TiAl alloy is Ti–45Al–8Nb. The employed SEM-EBSD system is a ZEISS® GeminiSEM 460 (Oberkochen, Germany) field emission SEM equipped with an Oxford Symmetry S2 EBSD detector (Oxford Instruments, Oxford, UK). The dimension of the scanning region is 100 μ m × 80 μ m and the scanning resolution is 0.2 μ m , and hence, collected 200,000 data index points in total. The open-source EBSD data post-processing toolbox MTEX in MATLAB (R2025b) is used to generate EBSD inverse pole figures (IPF), pole figures (PF) and orientation distribution function (ODF) map. Figure 1 shows the EBSD IPF color map of TiAl alloys. The controlled unidirectional lamellar crystal is observed in the EBSD map of TiAl alloys. Here, the material orientation 0 ° is defined as the orientation of lamellar crystal and 90 ° is the transverse direction, as shown in Figure 1. The pole figures 100 , 110 , and 110 obtained from the EBSD data are illustrated in Figure 2. In addition, the ODF map is shown in Figure 3. These figures show the shape Cube texture { 001 } 100 on Euler angle (0°, 90°, 90°) and strong texture on Euler angle (75°, 45°, 90°) observed in the TiAl alloy. Therefore, only two main orientations exist on the lamellar crystals, which attribute to a strong mechanical anisotropy of TiAl alloys.
For the implementation of crystal plasticity (CP) simulations based on EBSD images, an in-house MATLAB code utilizing IPF processing was developed to construct a CP model that accurately captures realistic grain morphology and crystallographic orientations [31]. Initial processing of the raw EBSD data was carried out using the MTEX toolbox to reduce noise and interpolate non-indexed points based on the orientations of adjacent pixels. The resulting smoothed EBSD map was then discretized into a set of material points with a resolution of 600 × 600 FOURIER points in the in-plane CP model. Each material point within an individual grain was assigned a uniform orientation, corresponding to the value obtained from the EBSD measurements. Here, the solver of the CP model is the DAMASK [32] spectral method using fast Fourier transformation (CPFFT).

4. Experimental Uniaxial and Biaxial Test of TiAl Alloy

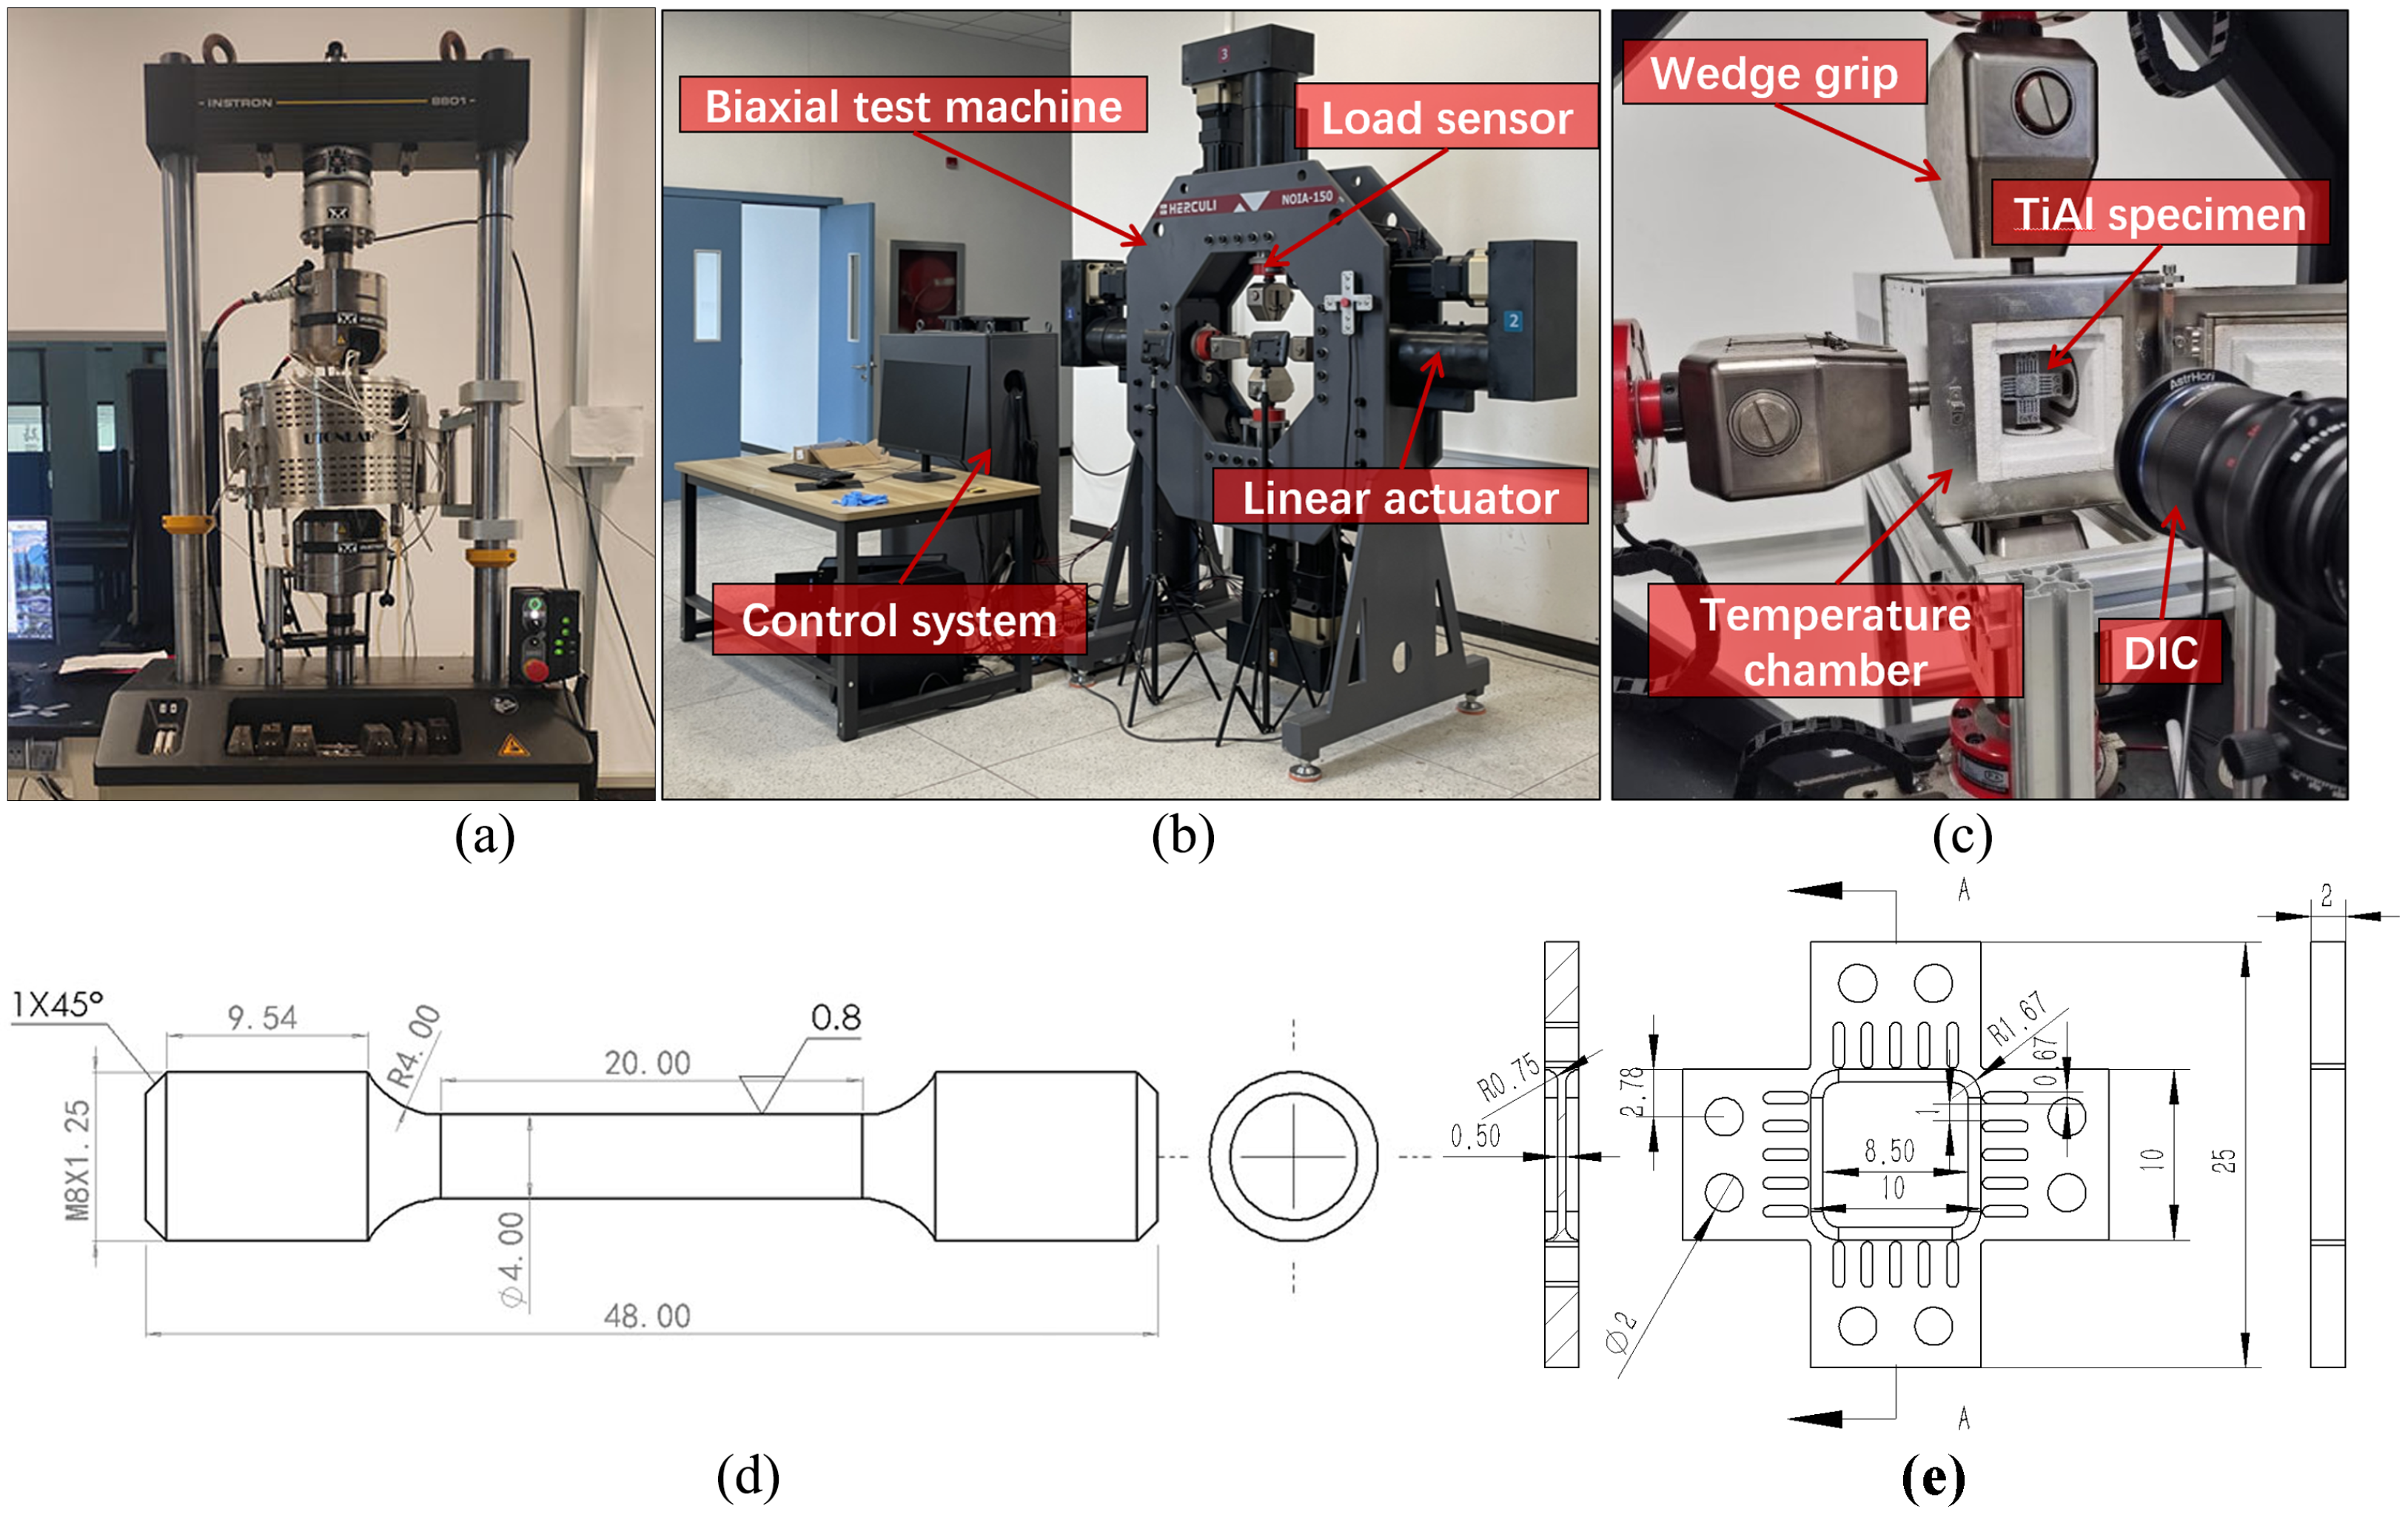
The uniaxial and biaxial tensile tests are used to obtain the experimental yield stress of TiAl alloys in various material orientations and stress states. This experimental data is used to verify the full-field crystal plasticity modeling. The uniaxial tensile tests are conducted in a uniaxial testing system, as shown in Figure 4a. The dimension of the uniaxial tensile specimens is shown in Figure 4d. The biaxial tensile tests with loading proportion of 0°:90° = 1:1 are conducted in a biaxial testing system, as illustrated in Figure 4b,c. The biaxial testing system has four independent linear actuators with a maximum loading capability of 150 kN. Figure 4b shows the dimension of the cruciform specimens used in the biaxial tensile tests.

5. Results and Discussion

5.1. Full-Field CP Modeling in Various Stress States

For the boundary of CP model in uniaxial tension, the deformation rate 1 × 10 2 s 1 is set in the F ¯ ˙ 11 direction and the deformation rate of F ¯ ˙ 22 and F ¯ ˙ 33 would be adjusted to a value, which results in a zero Piola–Kirchhoff stress P ¯ in these directions:
F ¯ ˙ 10 2 s 1 = 1 0 0 0 * 0 0 0 * and P ¯ P a = * * * * 0 * * * 0
For the uniaxial tensile simulation along the angle θ from RD in CP model, an equivalent approach is used instead of rotating the BCs (Equation (7)), in which the Euler angle of the orientations in CP model is rotated as { ϕ 1 θ , Φ , ϕ 2 } . For the case of virtual biaxial tensile tests, the different ratio of the deformation rate is applied in the direction of σ 11 and σ 22 , while deformation rate in σ 33 would be adjusted to a value, which results in a Piola-Kirchhoff stress P ¯ of zero in this direction. For instance, the BCs of the equibiaxial tension are defined as
F ¯ ˙ 10 2 s 1 = 1 0 0 0 1 0 0 0 * and P ¯ P a = * * * * * * * * 0
In the current study, the investigated TiAl alloy consists of over 95% γ -TiAl lamellar grains. Therefore, only the γ -TiAl phase is taken accounted into the CP models. The prime- γ phase is not taken account into the CP model, which has the effect on plastic yielding and stress redistribution among γ and prime- γ phase. However, the plastic anisotropy is mainly determined by the crystalline texture and morphology, which is carefully considered in the CP model.
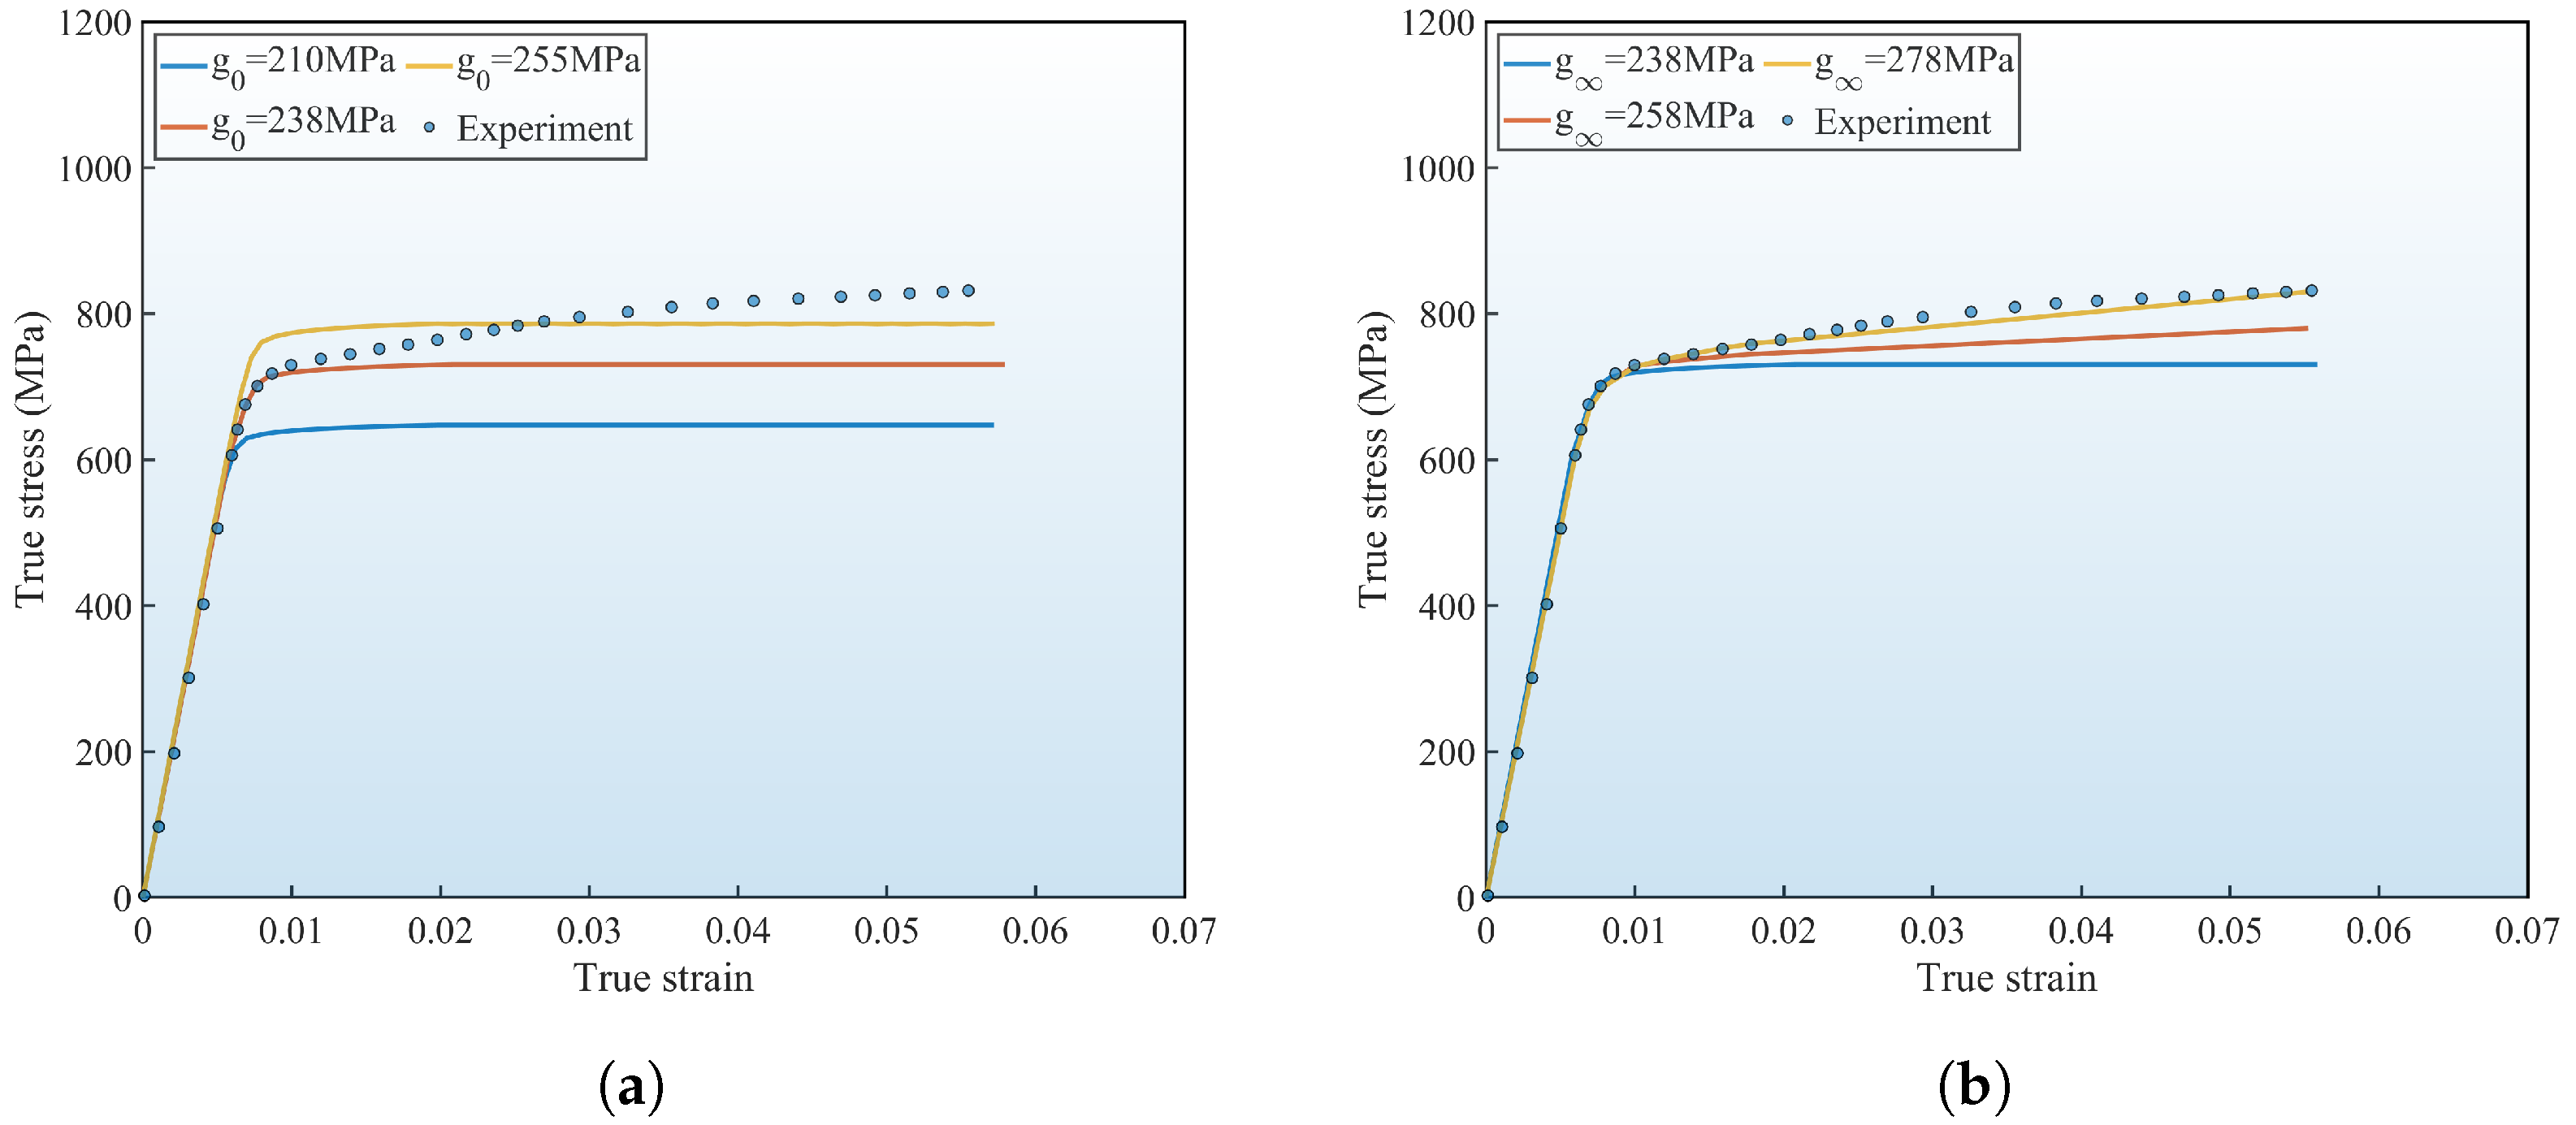
The parameters of the CP model are obtained in the iterative optimization procedure until the deviations between the predicted stress–strain curves and experimental ones are minimized. Firstly, the elastic modules are determined by the experimental results in the linear elastic stage. The g 0 could be defined by using the initial yield stress of experiments as illustrated in Figure 5a. Finally, g is determined through an iterative optimization process to match the strain hardening curve from the CP simulation with the experimental data, as shown in Figure 5b.
The material parameters employed in the CP simulations are summarized in Table 1. The critical resolved shear stress (CRSS) for the γ -TiAl phase is determined to be approximately 238 MPa. Utilizing these parameters, the calibrated CP model successfully captures the homogenized macroscopic stress–strain behavior under uniaxial and biaxial tension, aligning well with experimental data, as illustrated in Figure 6. The deviations between the experimental data and CP modeling in biaxial tensile loading are observed especially for the loading direction aligned with 0°. The CP model-predicted stress in 0° is lower than experiments at the same plastic strain. This deviation may be attributed to the boundary conditions of the CP model not being completely the same as the experiments. In the experimental tests, the same loading force is applied on the two directions, while the boundary condition of loading force ratio is difficult to apply on the CP model due to a convergence problem. Therefore, the same deformation rate is applied in the direction of σ 11 and σ 22 in the CP model, as shown in Equation (8).
The microstructure of TiAl alloys investigated in this work is a unidirectional lamellar crystal. This crystalline morphology and strong texture result in the anisotropy in both the yield stress and elongation. The loading direction is parallel to lamellar direction in the 0° specimen, which leads to the best mechanical performance of yield stress and elongation. For the 45° specimen, the shear loading is applied on the boundary of the lamellar grains, in which the slip is easy to activate. Therefore, the lowest yield stress and elongation are observed in the 45° specimen. For the 90° specimen, the loading direction is vertical to the boundary of the lamellar grains, which results in relatively high yield strength but low elongation due to the stress concentration of the grain boundary. The yield strength of the polycrystalline γ -TiAl alloy with various compositions is 350 MPa to 800 MPa, and the elongation is generally lower than 3% at room temperature [10]. The γ -TiAl alloy with lamellar grains shows good yield strength in 0° with 675 MPa and high elongation with 5.4%.
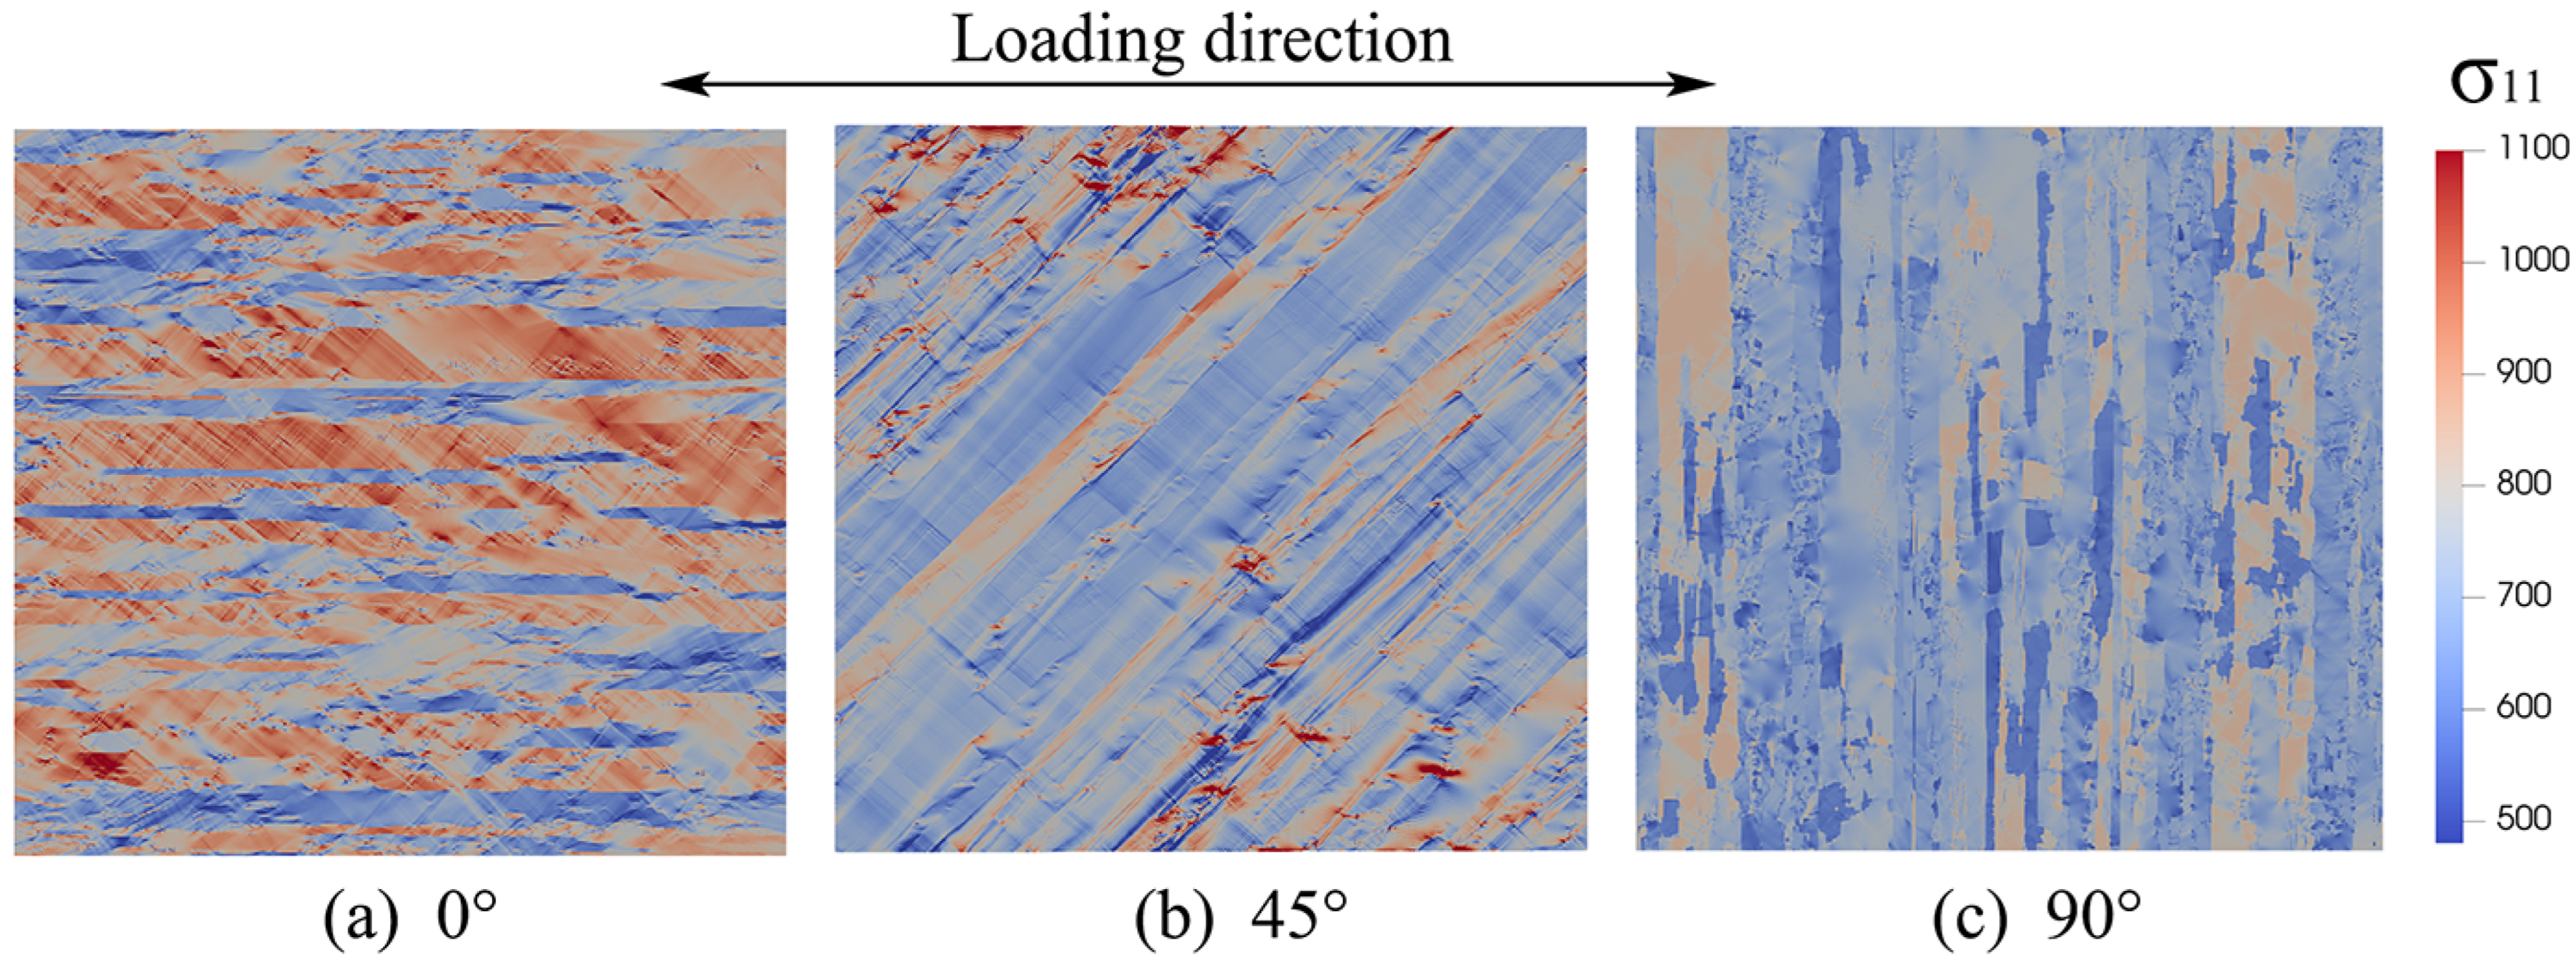
Figure 7a–c show the distribution of the stress component σ 11 aligned with loading direction in uniaxial tensile simulation at an average plastic strain of 0.2% using full-field CP modeling for 0°, 45°, and 90° of the TiAl alloy, respectively. The corresponding distributions of strain component ε 11 at an average plastic strain of 0.2% for 0°, 45°, and 90° are illustrated in Figure 8a–c, respectively. It is seen that the micromechanical stress and strain field in uniaxial loading are significantly influenced by the preferred crystalline orientation and morphology. The average stress in 0° is significantly higher than 45° and 90°. Furthermore, the direction of the stress transmission is aligned with the direction of lamellar structure even though the loading direction is a rotation. For the plastic deformation, the relative uniform intersecting shear slip deformations are observed in 0° and 90°. However, the continued shear slip deformation aligned with the direction of lamellar structure is observed in 45°, which results in higher plastic strain than 0° and 90°.
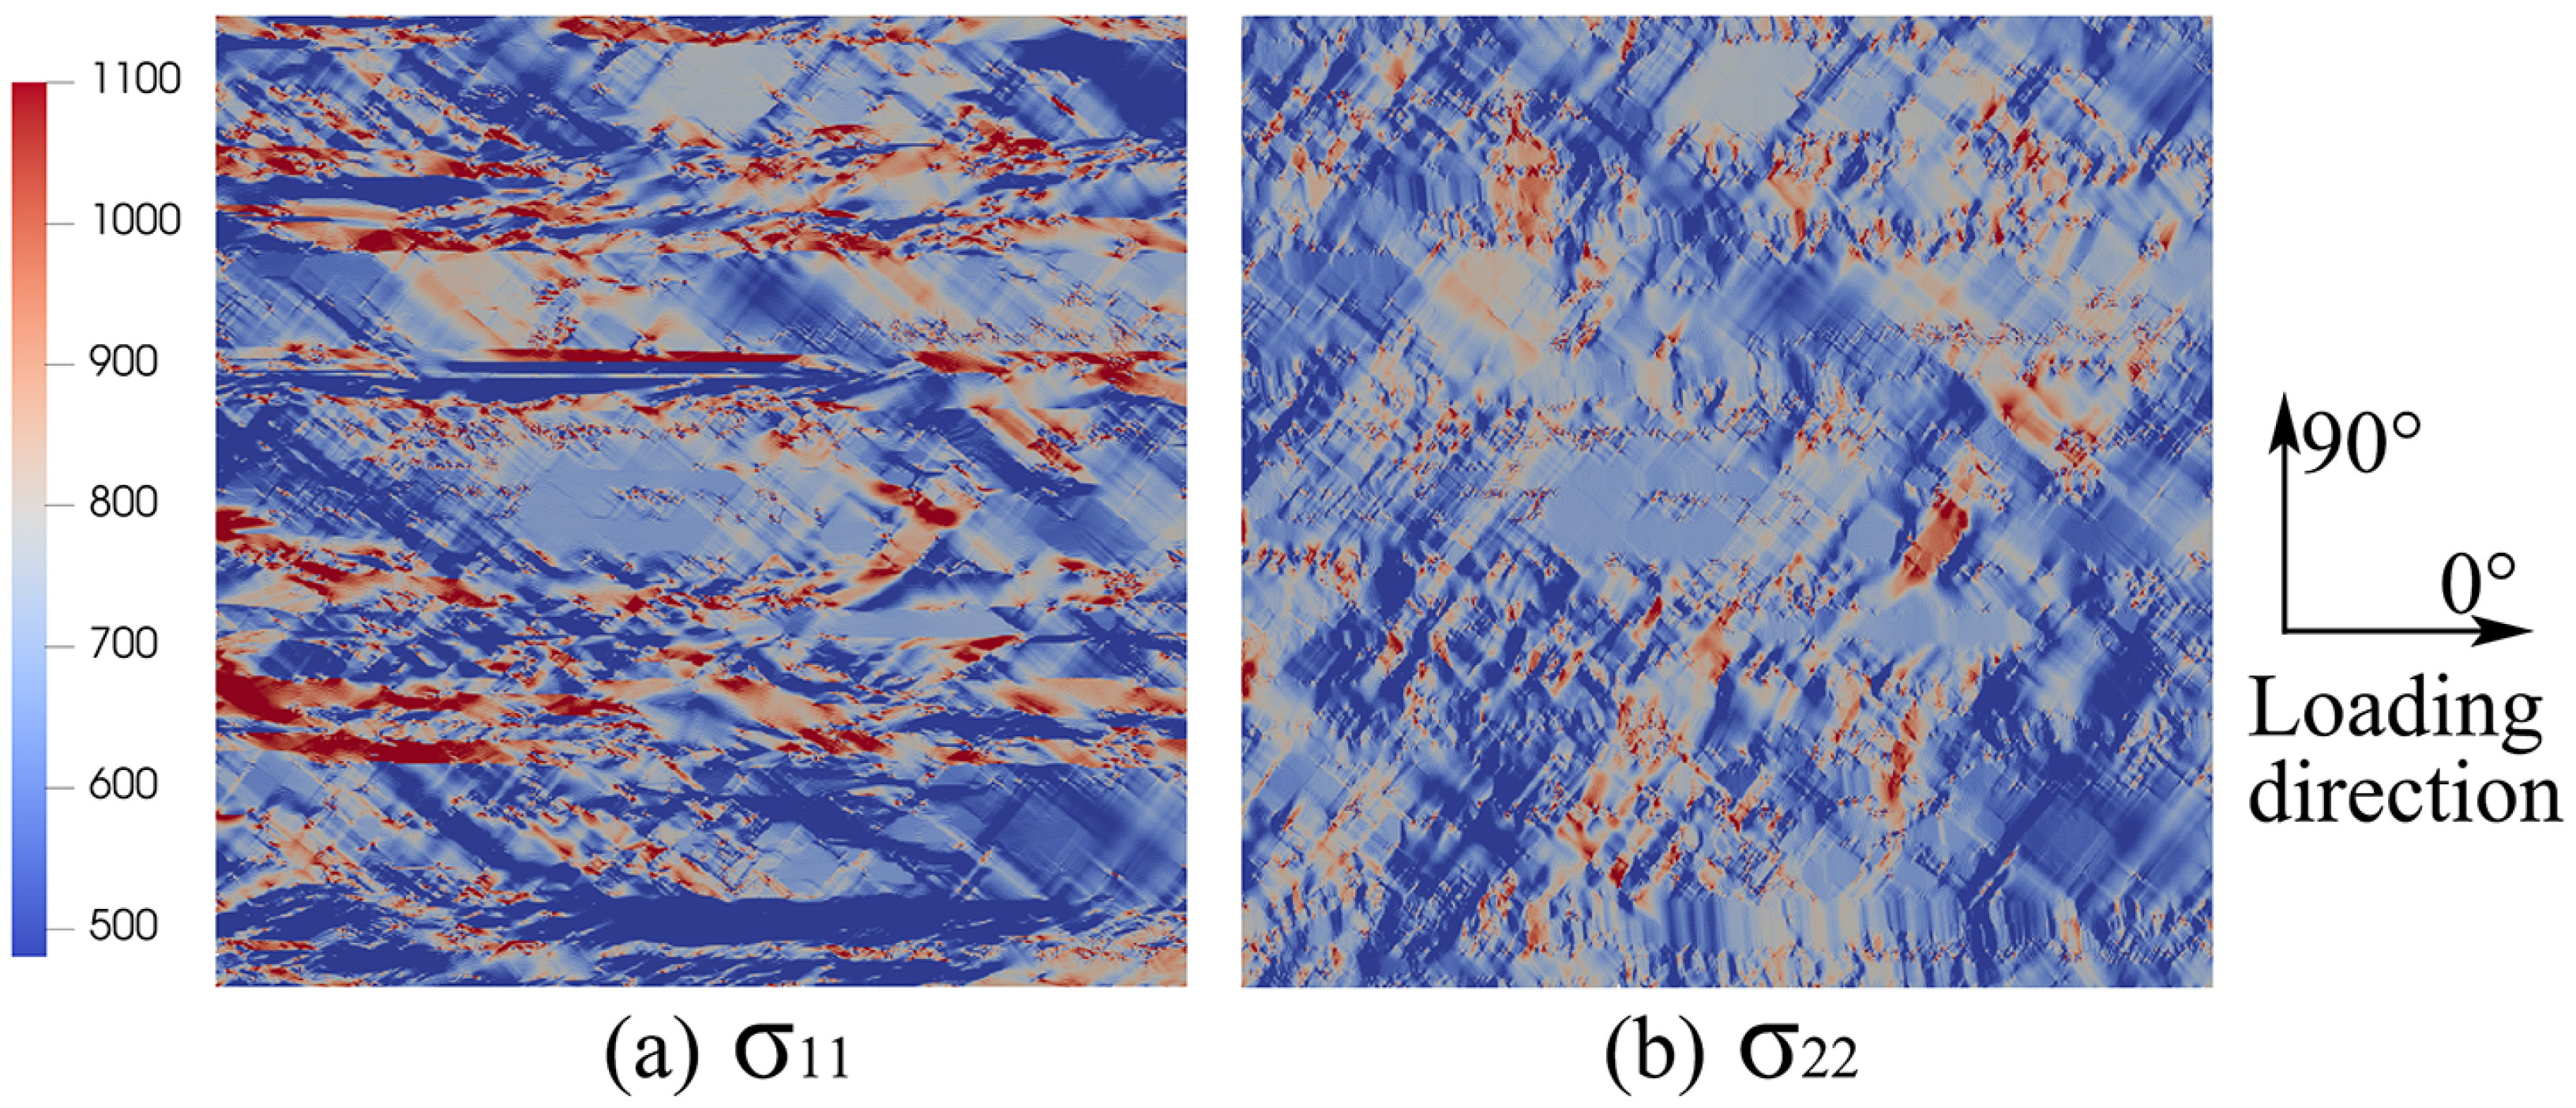
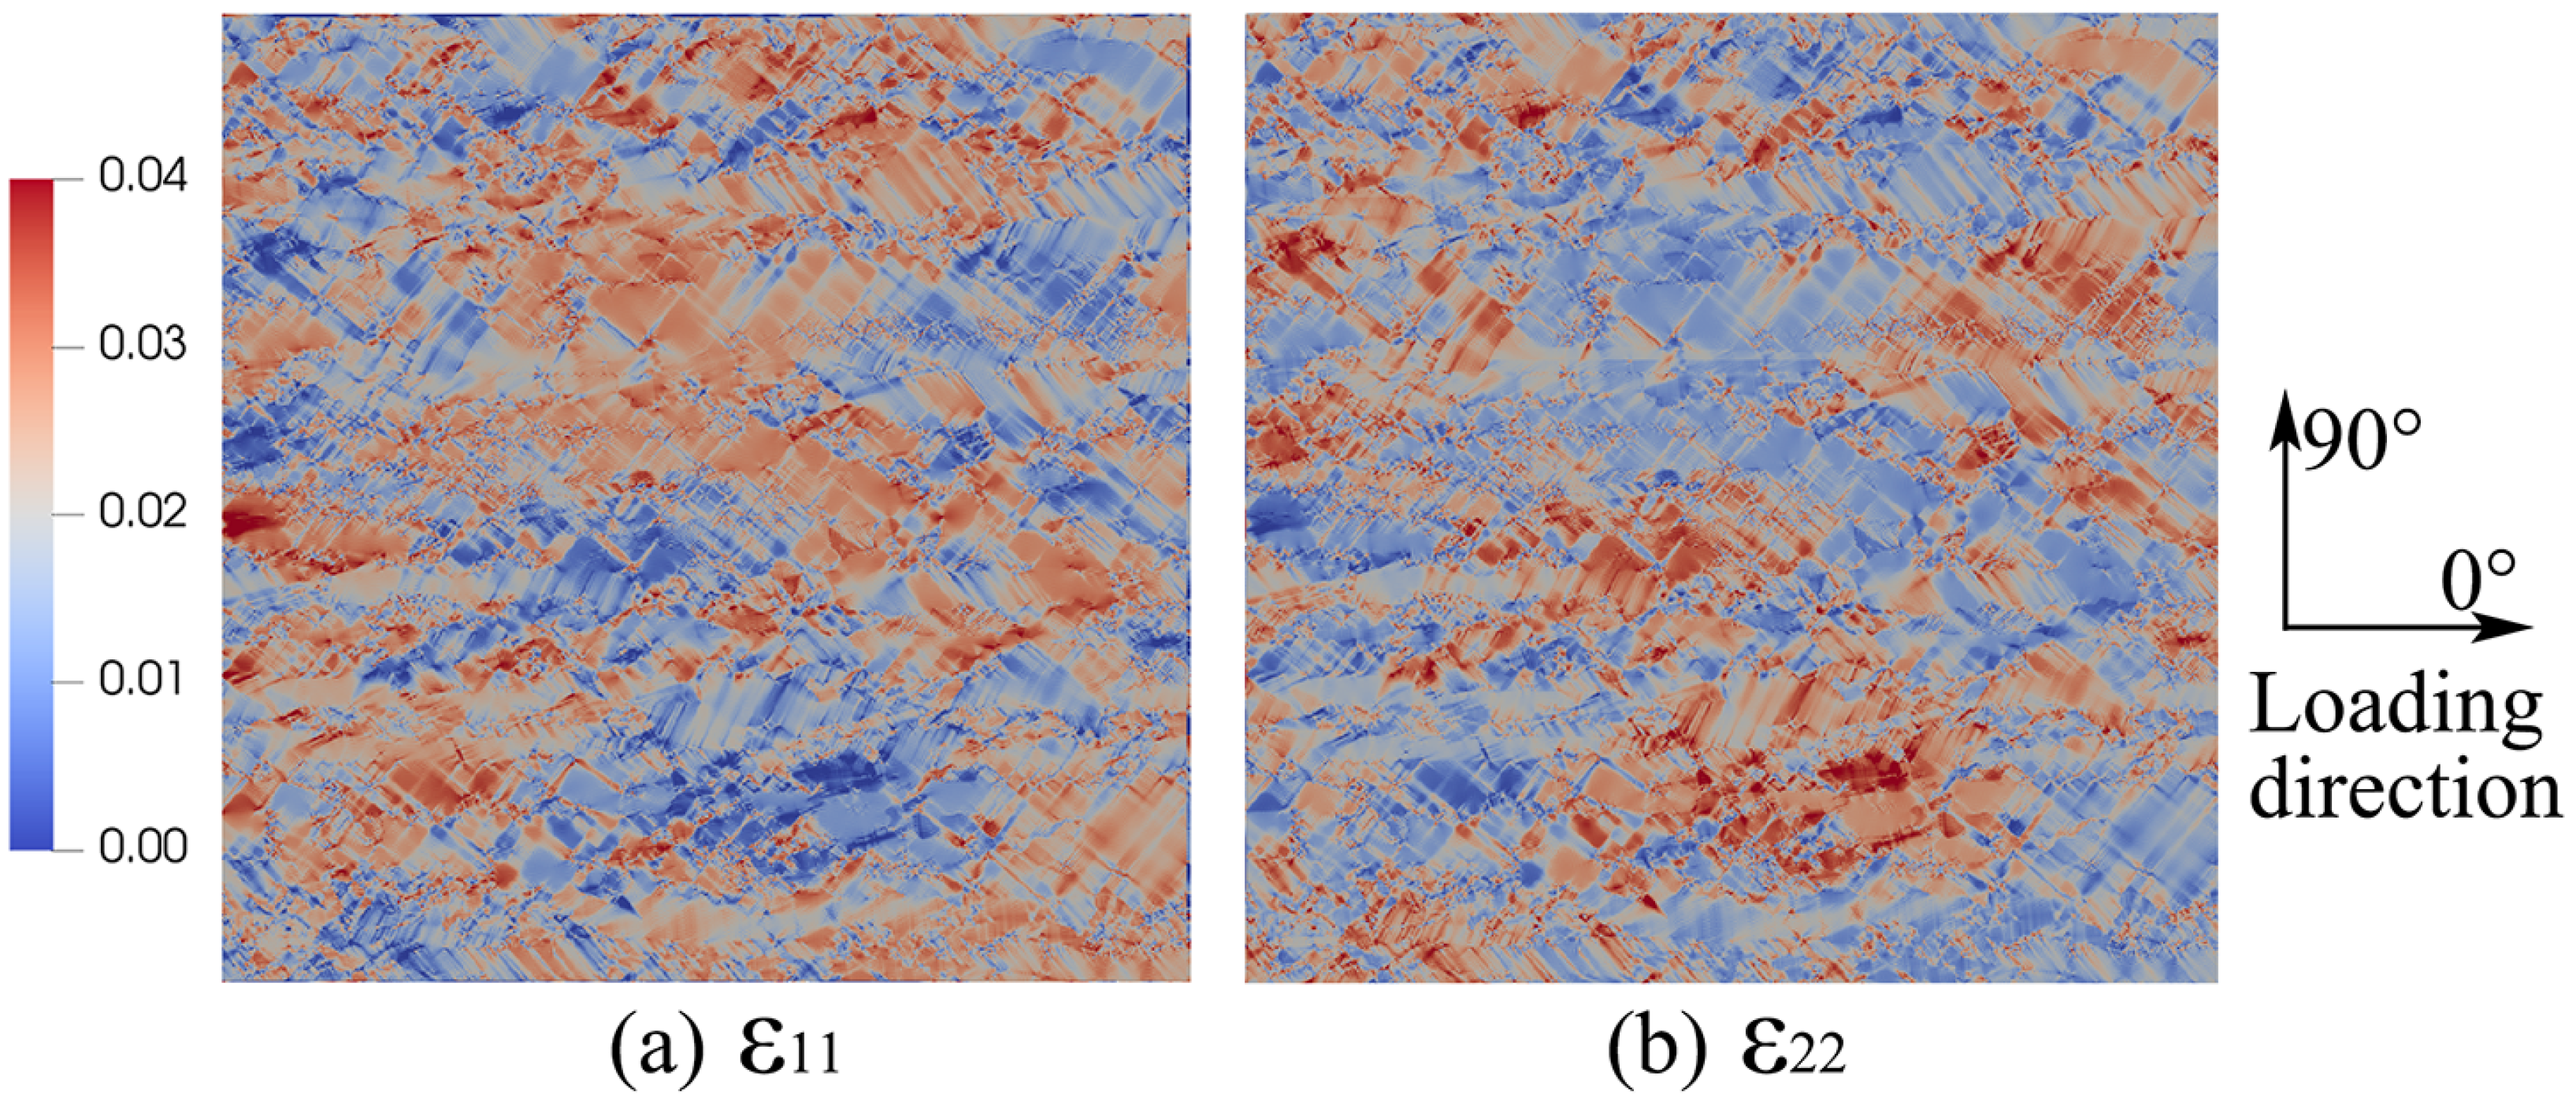
Figure 9a,b show the distribution of the stress component σ 11 aligned with 0° and σ 22 aligned with 90° directions in biaxial tensile simulation with loading force proportion 0°:90° = 1:1 at average plastic strain of 0.2% using full-field CP modeling. The corresponding distributions of strain components ε 11 and ε 22 at average equivalent plastic strain of 0.2% are illustrated in Figure 10a,b, respectively. For the biaxial tensile loading, the average stress in 0° is lower than the uniaxial tension in 0° at the same plastic strain level due to more slip systems being activated in biaxial loading. Therefore, the strain distribution in biaxial loading is more uniform compared with uniaxial loading.
In this work, the full-field CP model is used to predict the mechanical anisotropy in uniaxial tension from 0° to 90° at an interval of 15° and 80 biaxial loading proportions including biaxial tension, compression, and tension-compression loading. This extensive data is used to establish the macroscale anisotropic constitutive model.

5.2. Calibration of Anisotropic Constitutive Model

Since a significantly mechanical anisotropy is observed in TiAl alloys, an anisotropic model is proposed using the Swift hardening model and Yld2004-18p yield function, which could be used in the engineering structure design and strength analysis.
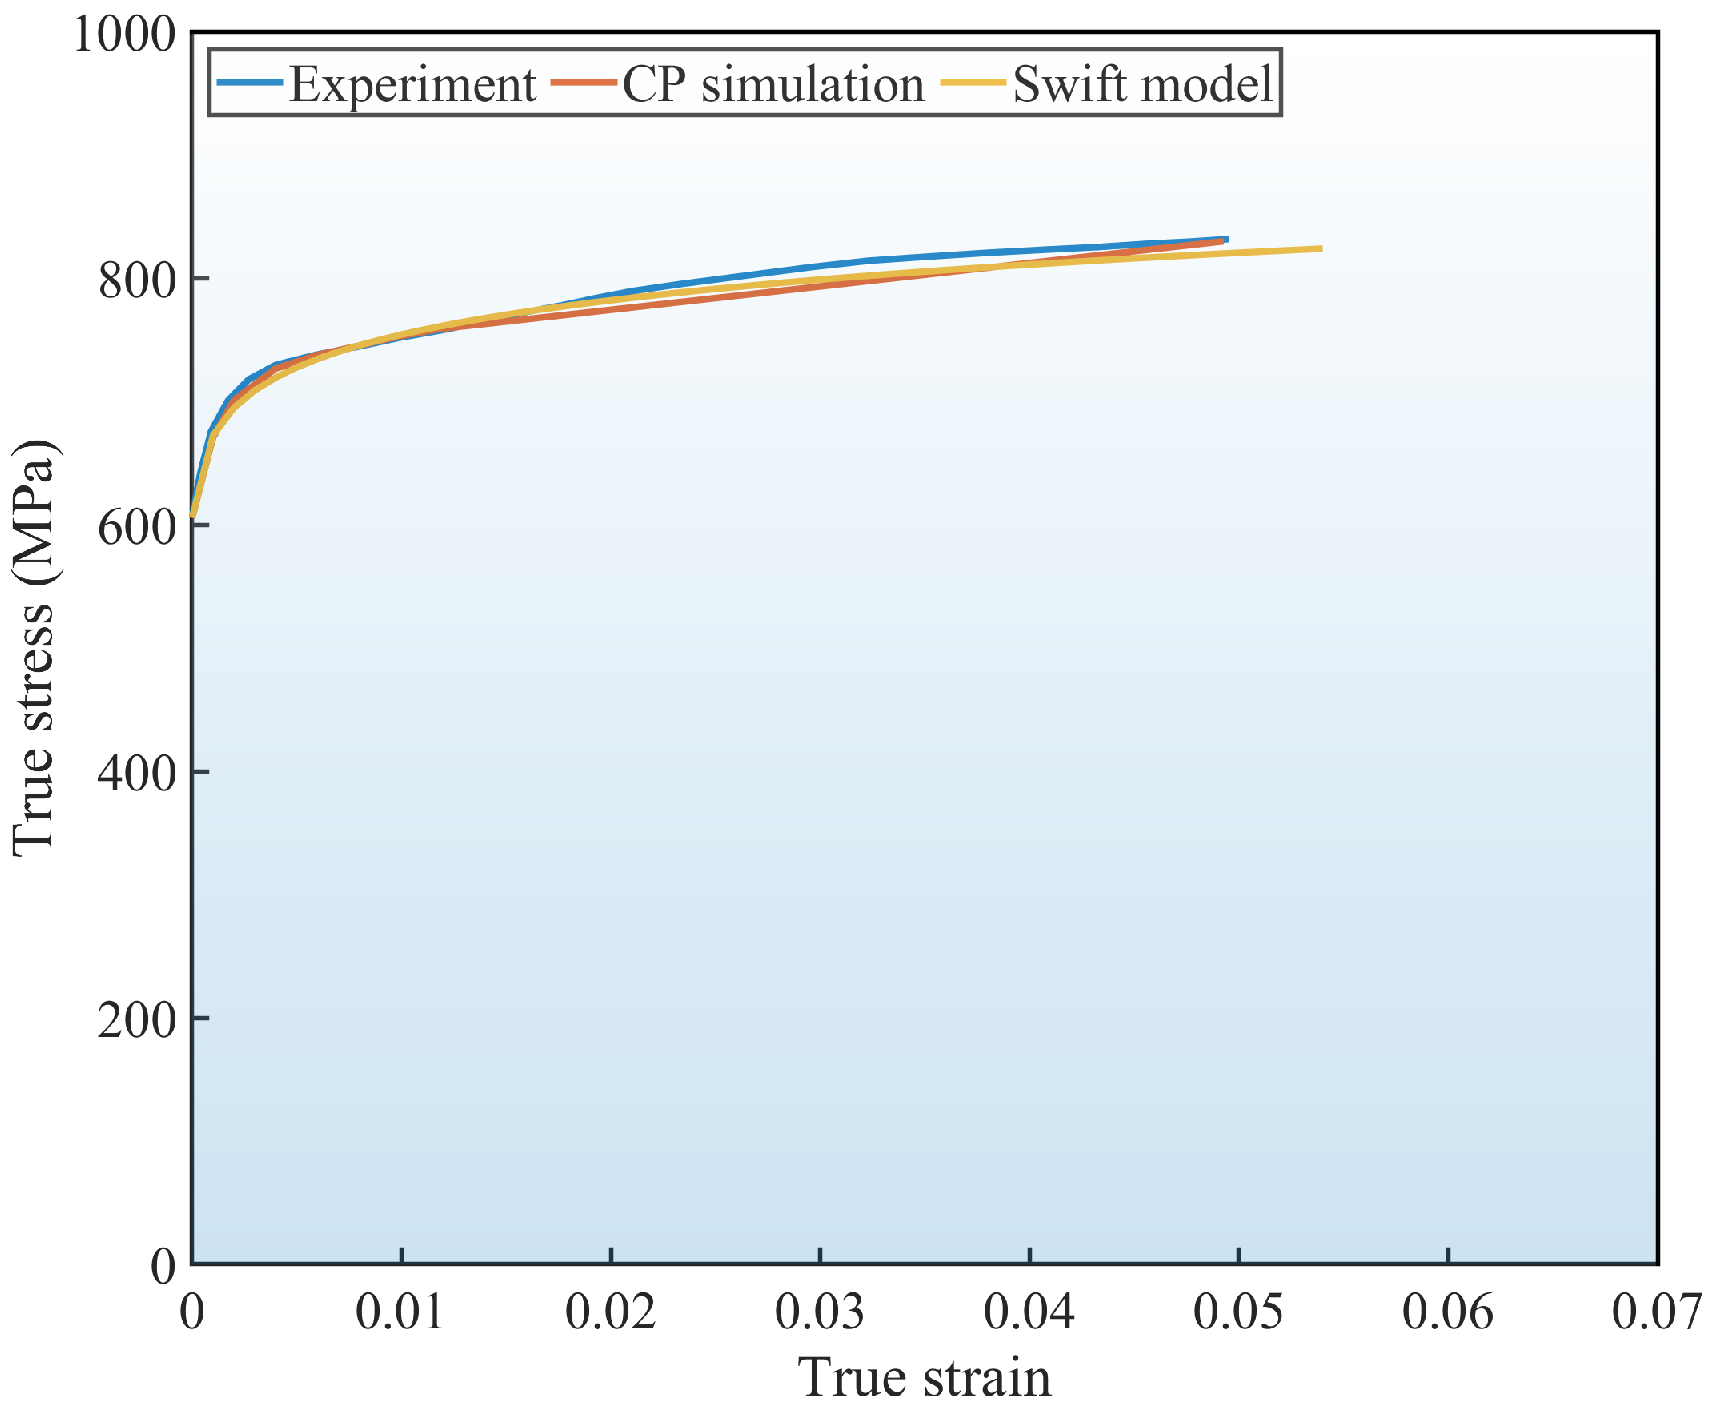
The elastic modules, Poisson’s ratio, and parameters of Swift model are calibrated using the CP model-predicted uniaxial stress–strain curves in 0° (shown in Figure 11) via a least-square fitting program and given in Table 2. The variation of normalized yield stress in uniaxial tension from 0° to 90° at an interval of 15° is illustrated in Figure 12a. It is seen that the uniaxial yield stress decreases from 0° to 45° and increases from 45° to 90°. The normalized experimental yield stresses are 0.732 and 0.871 in 45° and 90°, and this data predicted by CP simulations is 0.787 and 0.897. The corresponding deviation error is 7.51% and 2.98% in 45° and 90°, respectively. The deviations between the CP predictions and the experimental results have been noted and these may be attributed to several factors, including inhomogeneity of various regions selected for texture measurements, deviation of constitutive model and numerical solver, and prime- γ phases not being taken account in CP model.
The variation of r-value in various material orientations, which is the ratio of the plastic strain rate ε ˙ 22 p ε ˙ 33 p , is difficult to be measured in TiAl alloys due to relatively low plastic strain in uniaxial tests. Therefore, these values are predicted by the CP model and shown in Figure 12b. The highest r-value is observed in 45° and lowest r-value is in 0° and 90°. The experimental normalized yield stress in 0°, 45°, and 90° is also plotted in Figure 12a. The CP modeling successfully predicts the mechanical anisotropy in uniaxial tensile loading.
The yield stresses in biaxial loading, including biaxial tension, compression, and tension–compression predicted by the CP modeling, are shown in Figure 13. The experimental yield stresses of uniaxial tension in 0° and 90° and equi-biaxial tension are also plotted in Figure 13. It is seen that a good agreement between the experiments and full-field CP simulations is obtained in biaxial loading.
The CP modeling-predicted yield stresses in all uniaxial and biaxial tests are used to calibrate the parameters of the anisotropic Yld2004-18p yield function and documented in Table 3. The variation of yield stress and r-value from 0° to 90° predicted by the Yld2004-18p yield function is shown in Figure 12a,b, respectively. The mechanical anisotropy of TiAl alloys in uniaxial stress state is accurately captured by the Yld2004-18p yield function.
The yield surfaces predicted by the anisotropic Yld2004-18p yield function and isotropic Mises yield function are illustrated in Figure 13. It is seen that the anisotropy is observed in the yield surface, in which the isotropic Mises yield function shows significant deviation while the Yld2004-18p yield function accurately describes the anisotropic yield surface. Therefore, the constitutive model consisting of the Swift model and Yld2004-18p yield function proposed in this work is capable of accurately describing the strain hardening and plastic anisotropy behavior of TiAl alloys.

6. Conclusions

This study establishes a crystal plasticity model based on EBSD data to investigate the mechanical anisotropy of TiAl alloy. The model successfully captures the micromechanical fields under different loading conditions and is validated by uniaxial and biaxial tests. The TiAl alloy exhibits significant mechanical anisotropy, with yield stress ranking as 0° > 90° > 45°. The CP model accurately predicts this anisotropy in uniaxial tension. While a slight deviation (7.51%) exists at 45° between the predicted (0.787) and experimental (0.732) normalized yield stress, the agreement is excellent at 90° (2.98% deviation). The CP model predicts the r-value variation, identifying the highest value at 45° and the lowest at 0°/90°. An anisotropic constitutive model combining the Swift hardening law and the Yld2004-18p yield function is developed and calibrated using CP results. This model outperforms the isotropic Mises criterion by accurately describing both the strain hardening and the anisotropic yield surface. Therefore, the proposed constitutive model could be used in engineering design and strength analysis of TiAl components under complex loading.

Author Contributions

Conceptualization, W.L.; Methodology, Q.M.; Software, K.J.; Validation, W.M.; Formal analysis, K.L.; Investigation, W.P.; Resources, C.Z.; Data curation, B.D.; Writing—original draft, W.P.; Writing—review & editing, W.L.; Supervision, C.Z. All authors have read and agreed to the published version of the manuscript.

Funding

This research was funded by National Natural Science Foundation of China [12002211], Suzhou Innovation and Entrepreneurship Leading Talents Program [ZXL2023165], the Entrepreneurship and Entrepreneurship Doctoral Program of Jiangsu Province [JSSCBS20220939], and Taicang Basic Research Program [TC2022JC01].

Data Availability Statement

Dataset available on request from the authors.

Acknowledgments

Thanks to Herculi® company (Oxford, UK) for providing the NOIA-150 biaxial tensile test machine.

Conflicts of Interest

The authors declare no conflicts of interest.

References

  1. Tetsui, T. Identifying low-cost, machinable, impact-resistant TiAl alloys suitable for last-stage turbine blades of jet engines. Intermetallics 2024, 168, 108263. [Google Scholar] [CrossRef]
  2. Han, D.; Pan, Y.; Niu, Y.; Chen, Y.; Qi, Z.; Pan, X.; Zheng, X.; Chen, G. Isothermal oxidation resistance and microstructure evolution of VPS-TiAlCrY coating on TiAl single crystals at 1100–1200 °C. Corros. Sci. 2022, 208, 110664. [Google Scholar] [CrossRef]
  3. Zheng, M.; Dai, X.; Qu, D.; Lu, Q.; Chen, W.; Wei, X.; Luo, D.; Zhu, Z. Impact of phase/grain boundary on tensile properties and dynamic deformation mechanisms of duplex fully lamellar TiAl polycrystalline. J. Alloys Compd. 2025, 1039, 183111. [Google Scholar] [CrossRef]
  4. Tang, J.; Cheng, X.; Sun, Y.; Zhang, Y.; Liu, B.; Zhu, Y. Microstructure and mechanical properties of TC11-TiAl three-dimensional heterogeneous material fabricated by laser directed energy deposition. Mater. Lett. 2025, 402, 139342. [Google Scholar] [CrossRef]
  5. Wei, Y.; Miao, B.; Shu, S.; Yang, H.; Zhong, X.; Dong, B.; Chen, L.; Qiu, F.; Jiang, Q. Development and future of TiAl composites – microstructural characteristics and high-temperature service performance. J. Mater. Res. Technol. 2025, 38, 651–673. [Google Scholar] [CrossRef]
  6. Nath, P.; Bar, H.N.; Bhattacharjee, A.; Sen, I. Designing of novel microstructure and its impact on the improved service temperature mechanical performance of 2nd and 3rd generation advanced intermetallic TiAl alloys. Mater. Sci. Eng. A 2024, 893, 146108. [Google Scholar] [CrossRef]
  7. Zhu, Y.; Yi, M.; Guo, W. Pseudo-twin boundary improves flow stress and cyclic stability of TiAl single crystal. Int. J. Plast. 2024, 179, 104021. [Google Scholar] [CrossRef]
  8. Tetsui, T.; Lee, Y.Y.; Vaubois, T.; Sallot, P. Effects of Composition on Melt Fillability and Impact Resistance of TiAl Alloys for Thin-Blade Turbine Wheels: Laboratory Predictions and Product Verification. Metals 2025, 15, 474. [Google Scholar] [CrossRef]
  9. Han, D.; Tong, Z.; Pan, X.; Jin, Z.; Sun, T.; Shen, Y.; Niu, Y. Oxidation and thermal shock resistance of TiAlCrY/YSZ thermal barrier coating on single-crystal TiAl alloys. J. Mater. Res. Technol. 2025, 35, 4859–4869. [Google Scholar] [CrossRef]
  10. Hao, J.; Qian, K.; Li, X.; Xue, P.; Shu, L.; Chen, B.; Liu, K. Thermomechanical characterization and conventional rolling of a novel b-solidifying y-TiAl alloy with excellent comprehensive properties. J. Mater. Res. Technol. 2023, 26, 18. [Google Scholar] [CrossRef]
  11. Huang, D.; Tan, Q.; Zhou, Y.; Yin, Y.; Wang, F.; Wu, T.; Yang, X.; Fan, Z.; Liu, Y.; Zhang, J.; et al. The significant impact of grain refiner on γ-TiAl intermetallic fabricated by laser-based additive manufacturing. Addit. Manuf. 2021, 46, 102172. [Google Scholar] [CrossRef]
  12. Wang, Y.; Li, S.; Ma, T.; Wang, X.; Li, Q.; Wang, Y.; Fang, H.; Chen, R. In-situ synthesized Ti5Si3-Ti2AlC reinforced TiAl composite with enhanced tribological properties. Intermetallics 2025, 185, 108880. [Google Scholar] [CrossRef]
  13. Sun, Y.; Chen, F.; Qian, S.; Wang, N.; Ding, J.; Chang, H.; Chen, X.; Zhou, L. Microstructure evolution mechanism of Fe microalloying high Nb–TiAl alloy fabricated by HIP. J. Mater. Res. Technol. 2025, 36, 1273–1282. [Google Scholar] [CrossRef]
  14. Kwak, S.; Kim, J.; Ding, H.; Xu, X.; Chen, R.; Guo, J.; Fu, H. Machine learning prediction of the mechanical properties of γ-TiAl alloys produced using random forest regression model. J. Mater. Res. Technol. 2022, 18, 520–530. [Google Scholar] [CrossRef]
  15. Chen, G.; Peng, Y.; Zheng, G.; Qi, Z.; Wang, M.; Yu, H.; Dong, C.; Liu, C.T. Polysynthetic twinned TiAl single crystals for high-temperature applications. Nat. Mater. 2016, 15, 876–881. [Google Scholar] [CrossRef] [PubMed]
  16. Genc, O.; Unal, R. Development of gamma titanium aluminide (γ-TiAl) alloys: A review. J. Alloys Compd. 2022, 929, 167262. [Google Scholar] [CrossRef]
  17. Chen, Y.; Cao, Y.; Qi, Z.; Chen, G. Increasing high-temperature fatigue resistance of polysynthetic twinned TiAl single crystal by plastic strain delocalization. J. Mater. Sci. Technol. 2021, 93, 53–59. [Google Scholar] [CrossRef]
  18. Liu, S.; Ding, H.; Chen, R.; Guo, J.; Fu, H. Substantial 〈101] superlattice dislocations and nanotwins achieved without deformation in a casting Cr-rich TiAl-based alloy after a normalizing treatment. Mater. Lett. 2025, 398, 138937. [Google Scholar] [CrossRef]
  19. Chen, Z.; Sun, M.; Liu, H.; Nie, X.; Wang, M.; Zhao, C.; Li, L.; Pan, J.; Li, N. Vibration-enhanced hot workability of TiAl alloy induced by the motion of 1/2 < 112] superdislocations. Acta Mater. 2025, 296, 121191. [Google Scholar] [CrossRef]
  20. Xiang, H.; Guo, W. Synergistic effects of twin boundary and phase boundary for enhancing ultimate strength and ductility of lamellar TiAl single crystals. Int. J. Plast. 2022, 150, 103197. [Google Scholar] [CrossRef]
  21. Wen, Y.; Jin, C.; Yu, Y.; Zeng, X.; Lai, Z.; Xiong, K.; Liu, L. A Theoretical Study of Ordinary Dislocations and Order Twinning in y-TiAl at Finite Temperatures. Metals 2025, 15, 495. [Google Scholar] [CrossRef]
  22. Liu, W.; Huang, J.; Pang, Y.; Zhu, K.; Li, S.; Ma, J. Multi-scale modelling of evolving plastic anisotropy during Al-alloy sheet forming. Int. J. Mech. Sci. 2023, 247, 108168. [Google Scholar] [CrossRef]
  23. Liu, J.; Wang, Z.; Li, P.; Zhang, Z.; Zhao, C.; Zhao, Y.; Zhang, Y.; Liang, Y.; Lin, J. Fabrication of high strength TiAl alloy with nano-lamellar and ultra-fine-grained microstructure by selective electron beam melting. J. Mater. Res. Technol. 2025, 35, 7156–7166. [Google Scholar] [CrossRef]
  24. Zhang, X.; Tang, B.; Wei, B.; Chen, X.; Dai, J.; Pan, X.; Li, J. A new developed Re-containing β-solidified TiAl alloy with superior strength and plasticity at 800 °C. Mater. Charact. 2025, 227, 115314. [Google Scholar] [CrossRef]
  25. Liu, W.; Liu, J.; Li, X.; Huang, J.; Chen, Y.; Li, Y.; Ma, J.; Cui, H. Anisotropic elastoplasticity and fracture of SCFR-PEEK composites in complex biaxial loading: Experiments and modelling. Compos. Sci. Technol. 2024, 251, 110569. [Google Scholar] [CrossRef]
  26. Liu, W.; Li, X.; Liu, M.; Cui, H.; Huang, J.; Pang, Y.; Ma, J. Virtual laboratory enabled constitutive modelling of dual phase steels. Int. J. Plast. 2024, 175, 103930. [Google Scholar] [CrossRef]
  27. Li, R.; Song, X.; Duan, Z.; Hao, Z.; Yang, Y.; Han, Y.; Ran, X.; Liu, Y. Improving the high-temperature ductility of γ-TiAl matrix composites by incorporation of AlCoCrFeNi high entropy alloy particles. J. Alloys Compd. 2025, 1012, 178515. [Google Scholar] [CrossRef]
  28. Zheng, M.; Zhao, H.; Liu, C.; Wu, J.; Kang, X.; Pu, Z. Simultaneously optimization of microstructure and high-temperature tensile property for TiAl-based composites through Nb step milling and sintering. J. Alloys Compd. 2025, 1020, 179388. [Google Scholar] [CrossRef]
  29. Brotzu, A.; Felli, F.; Marra, F.; Pilone, D.; Pulci, G. Mechanical properties of a TiAl-based alloy at room and high temperatures. Mater. Sci. Technol. 2018, 34, 1847–1853. [Google Scholar] [CrossRef]
  30. Barlat, F.; Aretz, H.; Yoon, J.; Karabin, M.; Brem, J.; Dick, R. Linear transfomation-based anisotropic yield functions. Int. J. Plast. 2005, 21, 1009–1039. [Google Scholar] [CrossRef]
  31. Liu, W.; Huang, J.; Liu, J.; Wu, X.; Zhang, K.; Huang, A. Experimental and crystal plasticity modelling study on the crack initiation in micro-texture regions of Ti-6Al-4V during high cycle fatigue tests. Int. J. Fatigue 2021, 148, 106203. [Google Scholar] [CrossRef]
  32. Roters, F.; Diehl, M.; Shanthraj, P.; Eisenlohr, P.; Reuber, C.; Wong, S.; Maiti, T.; Ebrahimi, A.; Hochrainer, T.; Fabritius, H.O.; et al. DAMASK—The Düsseldorf Advanced Material Simulation Kit for modeling multi-physics crystal plasticity, thermal, and damage phenomena from the single crystal up to the component scale. Comput. Mater. Sci. 2019, 158, 420–478. [Google Scholar] [CrossRef]
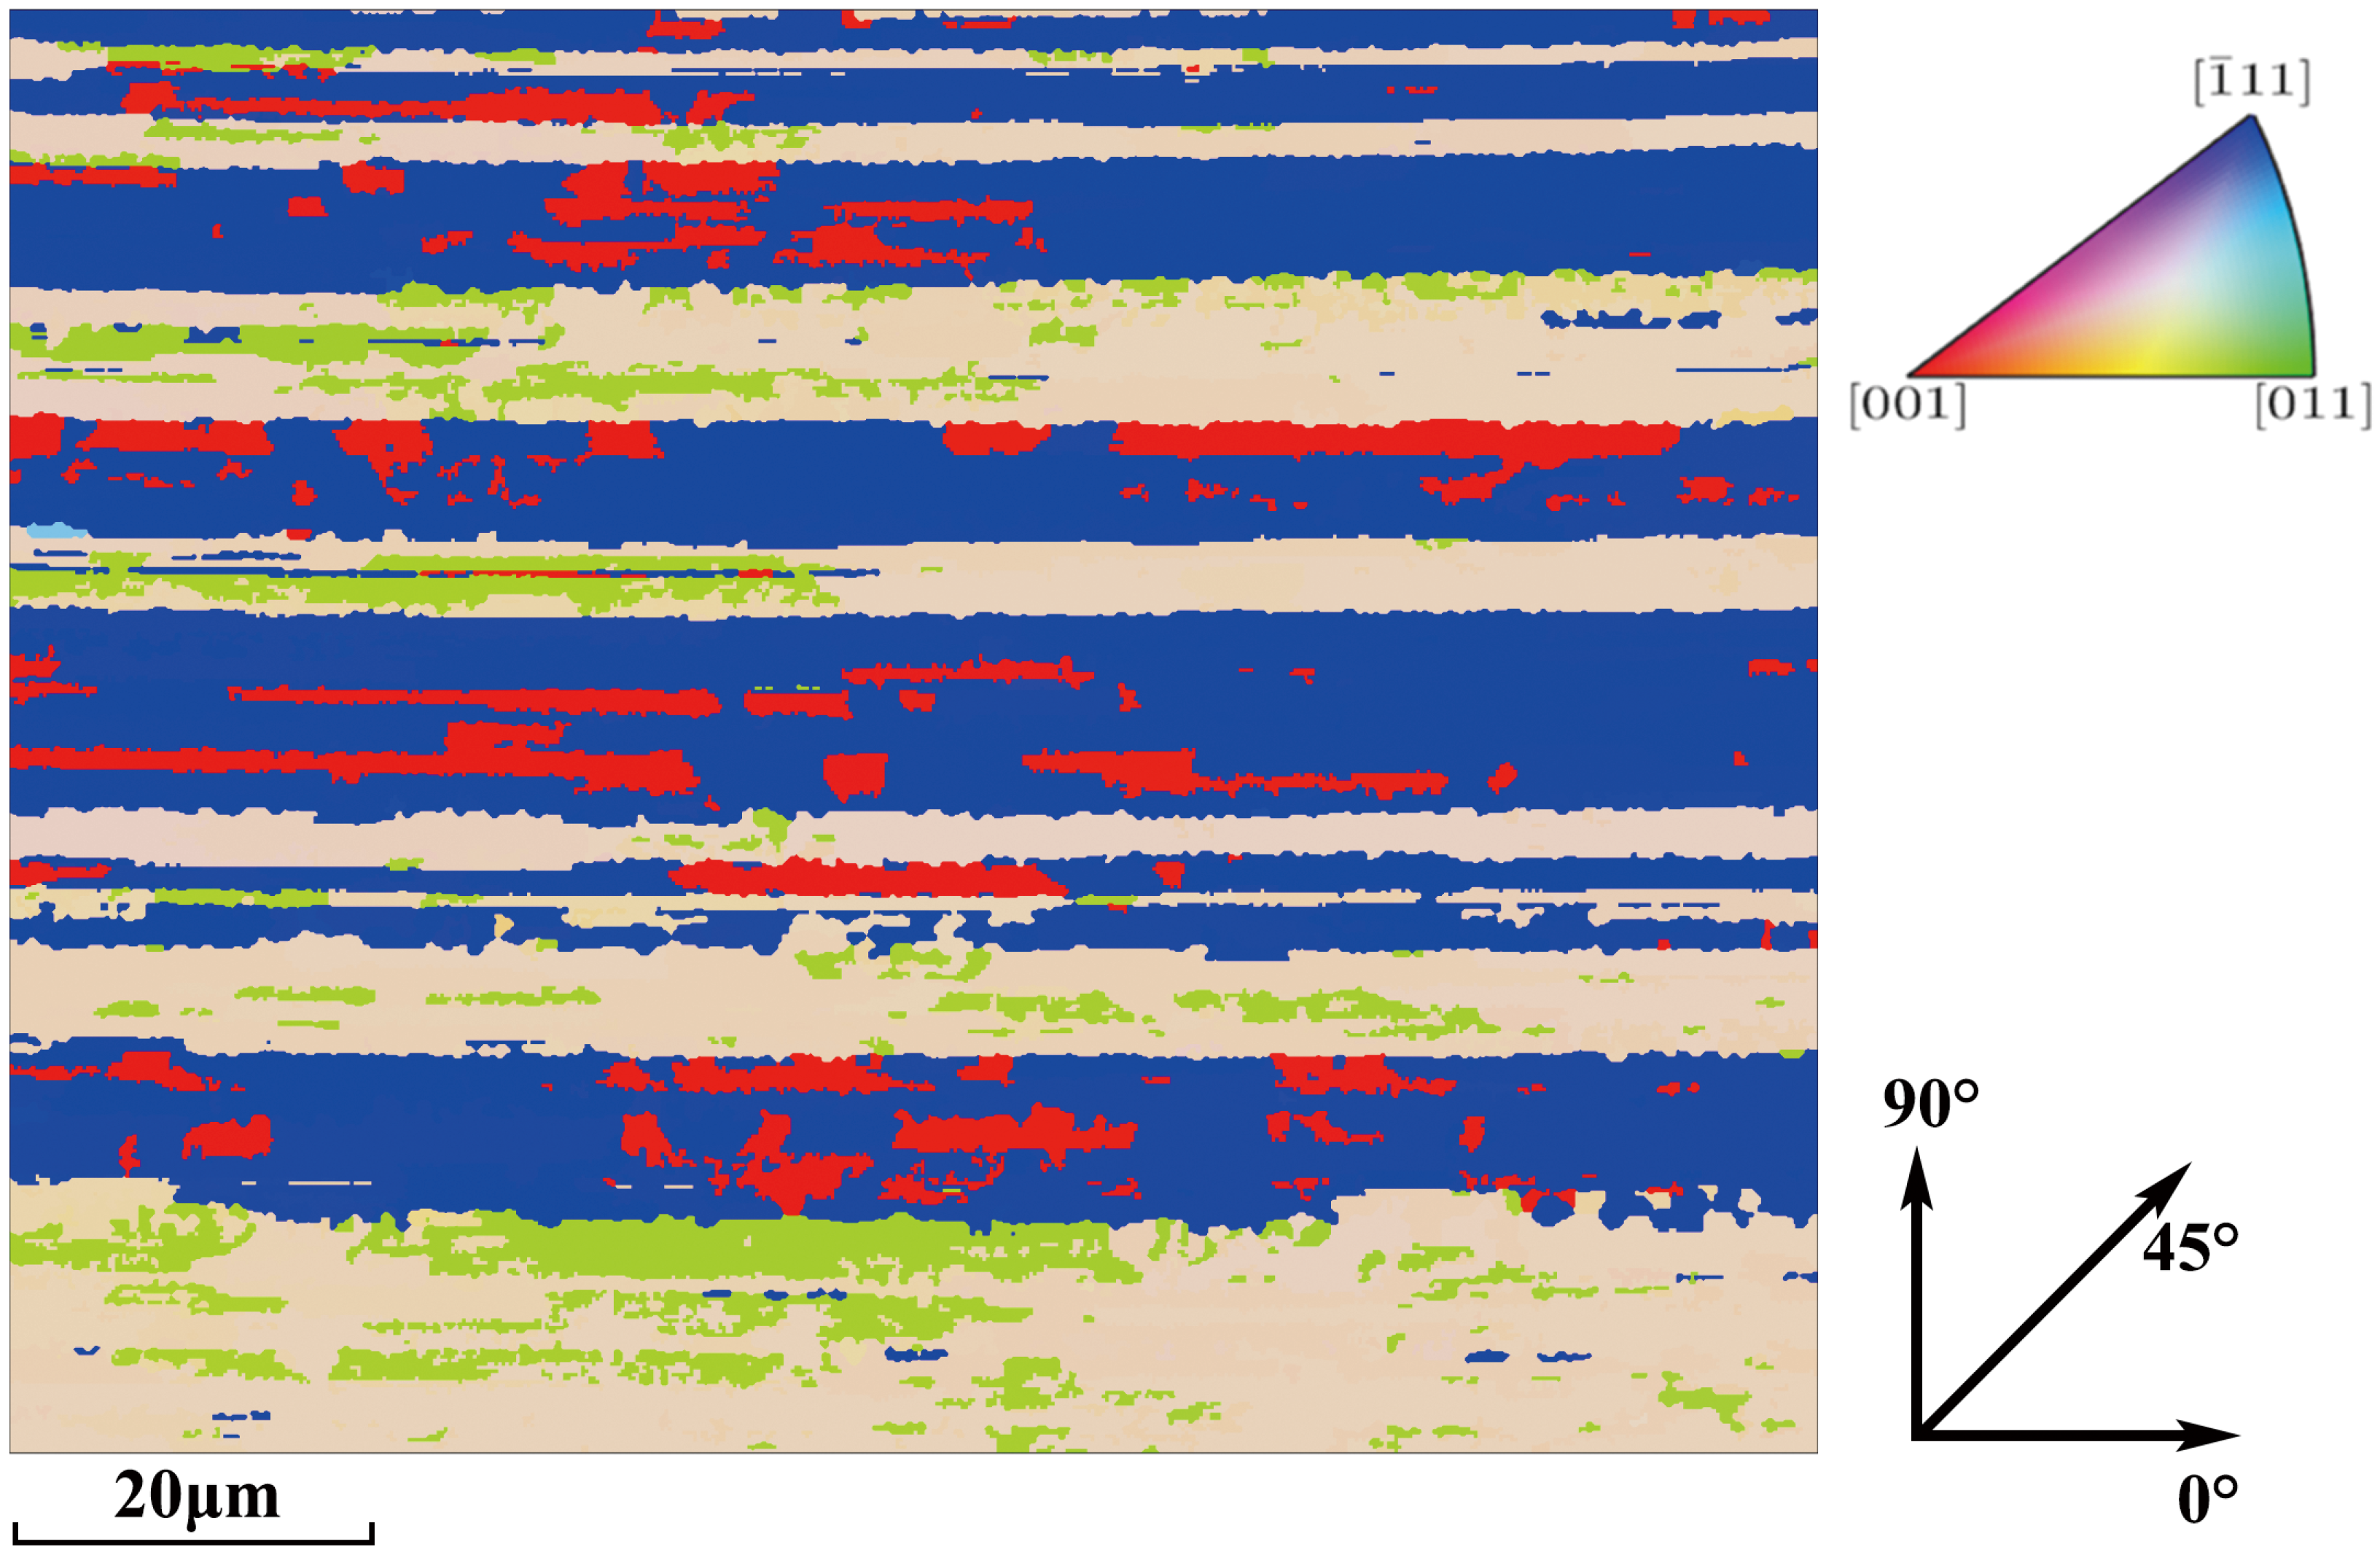
Figure 1. The EBSD IPF color map of the TiAl alloy.
Crystals 15 00943 g001
Figure 2. The pole figure (a) 100 , (b) 110 , and (c) 111 of the TiAl alloy.
Crystals 15 00943 g002
Figure 3. The ODF map of the TiAl alloy as sections through the reduced Euler space for cubic–orthorhombic symmetry (constant ϕ 2 sections, 0° to 90° in 15° steps, Euler angles in Bunge‘s convention).
Crystals 15 00943 g003
Figure 4. (a) Uniaxial testing system; (b) biaxial testing system; (c) biaxial tests of TiAl alloy. Dimension of (d) uniaxial and (e) biaxial tensile specimens.
Crystals 15 00943 g004
Figure 5. (a) The CP model-predicted stress–strain in 0° using g 0 = g = 210 MPa, 238 MPa, and 255 MPa. (b) The CP model-predicted stress–strain in 0° using g 0 = 238 MPa and g = 238 MPa, 258 MPa, and 278 MPa.
Crystals 15 00943 g005
Figure 6. The homogenized macroscopic stress–strain curves in 0°, 45°, and 90° predicted by a calibrated CP model and obtained by (a) uniaxial and (b) biaxial tension tests for the TiAl alloy are in close agreement.
Crystals 15 00943 g006
Figure 7. Distribution of the stress component σ 11 in loading direction at plastic strain of 0.02 in EBSD map-based full-field CP modeling for (a) 0°, (b) 45°, and (c) 90° orientation of TiAl alloys.
Crystals 15 00943 g007
Figure 8. Distribution of the strain component ε 11 in loading direction at plastic strain of 0.02 in EBSD map-based full-field CP modeling for (a) 0°, (b) 45°, and (c) 90° orientation of TiAl alloys.
Crystals 15 00943 g008
Figure 9. Distribution of stress components (a) σ 11 and (b) σ 22 in loading direction at plastic strain of 0.02 in EBSD map-based full-field CP modeling for biaxial tension with loading force proportion 0°:90° = 1:1 of TiAl alloys.
Crystals 15 00943 g009
Figure 10. Distribution of strain components (a) ε 11 and (b) ε 22 in loading direction at plastic strain of 0.02 in EBSD map-based full-field CP modeling for biaxial tension with loading force proportion 0°:90° = 1:1 of TiAl alloys.
Crystals 15 00943 g010
Figure 11. The stress–strain curves in 0° predicted by calibrated CP model, Swift model, and obtained by a uniaxial tension test for the TiAl alloy are in close agreement.
Crystals 15 00943 g011
Figure 12. The variation of (a) normalized yield stress and (b) r-value from 0° to 90° predicted by the full-field CP modeling and Yld2004-18p yield function.
Crystals 15 00943 g012
Figure 13. The CP modeling, anisotropic Yld2004-18p yield function, and isotropic Mises yield function predicted yield stresses, which were compared with experimental results.
Crystals 15 00943 g013
Table 1. The parameters of the full-field crystal plasticity model of the TiAl alloy.
C 11 C 12 C 44 γ ˙ 0 h 0 g 0 g maq
135 GPa78 GPa40 GPa0.001 s−11180 MPa238 MPa273 MPa0.022.01.4
Table 2. Parameters of Swift model of TiAl alloy.
E (GPa) ν K 0 (MPa) ε 0 n
1380.33960.940.000160.0528
Table 3. Parameters of Yld2004 yield function of TiAl (a = 12).
α 1 α 2 α 3 α 4 α 5 α 6 α 7 α 8 α 9
1.2032140.9466140.7421041.0004890.688325−0.5556110.903064−4.3019360.1405193
α 10 α 11 α 12 α 13 α 14 α 15 α 16 α 17 α 18
0.7504000.2689750.113808−0.4342321.3028951.4963411.3200484.0453380.046845
Disclaimer/Publisher’s Note: The statements, opinions and data contained in all publications are solely those of the individual author(s) and contributor(s) and not of MDPI and/or the editor(s). MDPI and/or the editor(s) disclaim responsibility for any injury to people or property resulting from any ideas, methods, instructions or products referred to in the content.