Article

What Is the Limit of Quantification for the Minor Phase in Time-of-Flight Neutron Diffraction? A Case Study on Fe and Ni Powder Mixtures at VULCAN

Neutron Scattering Division, Oak Ridge National Laboratory, Oak Ridge, TN 37831, USA
*
Author to whom correspondence should be addressed.
Crystals 2025, 15(11), 934; https://doi.org/10.3390/cryst15110934
Submission received: 1 October 2025 / Revised: 24 October 2025 / Accepted: 27 October 2025 / Published: 30 October 2025
(This article belongs to the Section Inorganic Crystalline Materials)

Abstract

A phase present in small quantities within materials may not simply serve as a secondary component; it can play a crucial role in determining the integrity, properties, and performance of the material. These minor but important phases usually draw attention in material design and processing for fundamental understanding as well as material quality control. Accurately quantifying a minor phase amid a majority phase, especially at extremely low fractions, remains a challenging task. Time-of-flight neutron diffraction, coupled with advanced pattern analysis techniques like Rietveld refinement, is a powerful tool for crystal structure identification and phase quantification. The deep penetrating capability of neutrons enables the detection and quantification of trace phases within materials. In this study, the quantification limits of time-of-flight neutron diffraction were explored using the VULCAN diffractometer at the Spallation Neutron Source, using Fe–Ni powder mixtures as a sample system. By comparing the refinement results to the known weighed values, it was determined that the reliable quantification of a minor Ni phase is achievable down to about 0.1 wt% while a Ni fraction as low as 0.02 wt% is difficult to trace. Effective control of the refinement parameters, especially the profile function parameters, are found to significantly influence the convergence of fittings and the accuracy of phase quantification.

1. Introduction

Diffraction originating from lattice coherent scattering is a widely used characterization tool for identifying crystalline phases. As diffraction intensity is proportional to a phase’s mass or volume within a measurement gauge, it can be used to quantify phase fractions in mixtures using precise diffraction peak analysis methods, such as Rietveld refinement [1]. Compared to commonly used techniques like X-ray diffraction and electron diffraction, neutron diffraction [2,3] offers distinct advantages in phase quantification. Thanks to its deep penetrating capability in materials, neutron diffraction can sample volumes ranging from cubic millimeters to cubic centimeters, providing bulk statistical measurements. This is in contrast to the shallow surface probing in laboratory X-ray diffraction, the micrometer-scale sampling achieved by high-energy synchrotron X-ray diffraction, and the extremely localized characterization provided by electron diffraction. Therefore, neutron diffraction ensures high accuracy in phase fraction calculation in bulk samples, and it is highly suitable for detecting and quantifying minor phases with low fractions. Additionally, neutron diffraction exhibits unique sensitivities due to the special dependence of scattering lengths of isotopes [4,5]. For example, it can more effectively characterize phases containing lightweight elements [6] and avoid shadowing effects from phases composed of very heavy elements [7].
VULCAN is a time-of-flight (TOF) engineering diffractometer at the Spallation Neutron Source (SNS) at the Oak Ridge National Laboratory [8]. When using neutron diffraction to answer various scientific and engineering questions with VULCAN as well as with other diffractometers, it is crucial to detect and to quantify multiple phases including minor phases. This is essential not only for characterizing constituent secondary phases [9,10] and composite phases [11,12,13,14] but also for gaining insights into load partitioning behaviors [15,16,17,18], dynamic phases transformation [19,20,21], diffusive phase transition and precipitation [22], synthesis and reaction mechanisms [23,24,25,26], and so forth. Through analysis such as Rietveld refinement applied to neutron diffraction patterns, phase fractions can be calculated if proper structure models are used and fitting convergence is achieved. But critical questions arise: what is the minimum phase fraction detectable by VULCAN, and what is the accuracy of such quantification?
Due to differences in sample complexities and varying instrument configurations, there are no universal answers to questions surrounding phase quantification limits; these factors are highly case-dependent. In this study, we employ a simple case to establish a baseline reference for minor-phase quantification. Powder mixtures of Fe and Ni are chosen as the test samples due to their relevance in a wide range of engineering materials [27,28]. Their crystal structures are simple and widely encountered in many alloy systems. In addition, their neutron scattering properties do not show significant differences (Appendix A Table A1) [4]. Therefore, changes in weight fractions do not significantly affect the overall scattering and absorption of the powder mixtures. Moreover, the diffraction patterns of Fe and Ni have some overlapping peaks but also isolated peaks—a scenario often observed in samples with multiple coexisting phases. Rietveld refinement over neutron powder diffraction patterns is employed to calculate the phase fractions. Different refinement parameter controls are tested for capturing and fitting the weak peaks of the minor phase. The calculated phase fractions are compared to the known weighed values to assess the limits of quantification for the minor phase.

2. Materials and Methods

2.1. Sample Preparation

Fe–Ni mixtures were prepared using commercial Fe powders (>99.9%, <10 µm, Sigma-Aldrich, USA) and Ni powders (99.99%, <150 µm, Sigma-Aldrich, USA). The nominal weight percentages of Ni were designed to be 0, 0.02%, 0.08%, 0.5%, 1%, 10%, and 100%, with the samples designated as Fe-100, Ni-0.02, Ni-0.08, Ni-0.5, Ni-1, Ni-10, and Ni-100, respectively. The powders were weighed and loaded into vanadium cans with a diameter of 6 mm for neutron diffraction experiments. To ensure realistic sample conditions, the powders were intentionally hand-mixed, resulting in a potential non-ideal homogeneous dispersion of the Ni phase. Each sample’s height in the can was measured to be less than 12 mm, ensuring complete exposure of the powder mixture to the neutron beam.

2.2. Powder Neutron Diffraction Measurement

The TOF neutron diffraction measurements were carried out at VULCAN, when the SNS was operated at a nominal power of 1.4 MW. The configuration of a 30 Hz chopper frequency and the high-intensity No. 8 Guide without the No. 9 Guide was used. The 8 mm horizontal slits and 12 mm vertical slits were used for the incident neutron beam. The −90° detector bank (Bank 1) was equipped with a coarse collimator, which reduced background noise but did not define a gauge volume. The 3He gas-filled linear position sensitive detectors were equipped, which offer high neutron detection efficiency along with extremely low sensitivity to gamma radiation [29]. The sample was optically aligned to the instrument center for the diffraction measurement so that the entire sample was measured. The nominal measurement time for each sample was 90 min for Ni-0.02 and Ni-0.08, 60 min for Ni-0.5, 30 min for Ni-1, and 10 min for the remaining samples. Importantly, the measurement durations were intentionally extended beyond typical neutron diffraction measurement time for the samples, eliminating concerns related to insufficient data statistics. Prior to powder sample measurements, a standard Si powder sample was measured to calibrate the instrument diffraction parameters and the instrument profile function parameters. A standard vanadium rod sample (6 mm in diameter) was measured under the same condition to determine the incident neutron spectrum for normalizing the sample diffraction patterns. In the following results and figures, the term “intensity” refers to the diffraction pattern after this vanadium normalization. Meanwhile, during each measurement, the proton charge was recorded as a parameter to represent the accumulated neutron flux on the sample or the neutron exposure time. Subsequent to the vanadium normalization, the diffraction patterns were further normalized to the proton charge or neutron exposure time to facilitate comparison between samples. This second normalization is referred to “normalized intensity”.

2.3. Rietveld Refinement of Neutron Diffraction

The time-of-flight data from Bank 1 were reduced into diffraction patterns with a d-spacing range 0.45–2.5 Å. Rietveld refinement was performed on the sample diffraction patterns with the incident neutron spectrum to calculate the phase fractions using GSAS and its graphical interface EXPGUI (version 1166) [30,31]. Unless specifically noted, the refinement parameters included the following: the lattice parameter of the phase, isotropic atomic displacement parameter Uiso, scale factor and phase fraction, phase profile function parameters (based on the 3rd TOF Profile Function implemented in GSAS [30]), Type 1 background function in GSAS (Shifted Chebyschev [30]; 12 terms, which is standard for VULCAN data), and absorption correction. For the sample profile function, refinement was limited to three main parameters: “sig-1” and “sig-2” for Gaussian broadening and “gam-1” for Lorentz broadening. Other profile parameters were fixed using the results from the Si calibration. For the minor Ni phase, refinement controls included Uiso, the phase profile function parameters, and the lattice parameter. The following notations are used to describe the refinement controls for the minor Ni phase in this study. “All free” stands for refining all the refinable parameters mentioned above. “U” stands for fixing Uiso to the value that was determined in Ni-100. “P” stands for fixing profile parameters to particular values, where “Ins” means determination in instrument calibration; “Ni-x” means determination in the “Ni-x” (x = 1, 10, and 100) sample; and “self” means determination in the fitting of only the isolated peaks of the same sample. “A” stands for fixing the lattice parameter of Ni by using the value determined by fitting the isolated peaks of the same sample.
The calculated values (Wr) and the fitting errors ( σ r ) of the Ni phase weight fractions in the mixtures were exported from GSAS refinements. To evaluate the accuracy of these calculated values, they were compared to the weight fraction by weighing in sample preparation (Ww). The relative deviation (Ddiff) was calculated via Equation (1), and the relative fitting error (Derr) was evaluated via Equation (2).
D d i f f = W r W w / W w
D e r r = σ r / W w

3. Results and Discussion

3.1. Diffraction Signal of Minor Ni Phase

To provide references, the plots of Rietveld refinement of the pure phases are displayed in Figure 1A,B. The Fe phase fits the body-centered cubic structure (space group Im 3 ¯ m) [32] with a refined lattice parameter of 2.86681(2) Å (Figure 1A). Similarly, the Ni phase fits the face-centered cubic structure (space group Fm 3 ¯ m) [33] with a refined lattice parameter of 3.52554(2) Å (Figure 1B). When the two phases are mixed, some peaks overlap (Figure 1C,D), such as (110) of Fe versus (111) of Ni near 2 Å, (220) of Fe versus (222) of Ni near 1 Å, and so forth. There are also isolated peaks, such as (200) and (211) of Fe and (200), (220), and (311) of Ni. This is a typical scenario with multiple phases. Rietveld refinement over full patterns includes contributions from both isolated peaks and overlapping peaks of the constituent phases to evaluate their weight fractions.
A small quantity of the minor phase leads to a weak signal of the diffraction over the background noise and other strong signals if they are overlapping. Taking the isolated peaks of Ni as representatives, clear signals are still visible when the fraction of the minor Ni phase is relatively significant, for example, at 10 wt% (Figure 1C). However, as the fraction is reduced to approximately 1 wt%, only some traces of Ni peaks are discernible in the viewing scale for the full pattern (Figure 1D). In both Ni-10 and Ni-1 samples, standard Rietveld refinement approach was successfully executed. All refinement parameters outlined in Section 2.3 were unconstrained during fitting. The process yielded converged results with reasonable values for the refinement parameters.
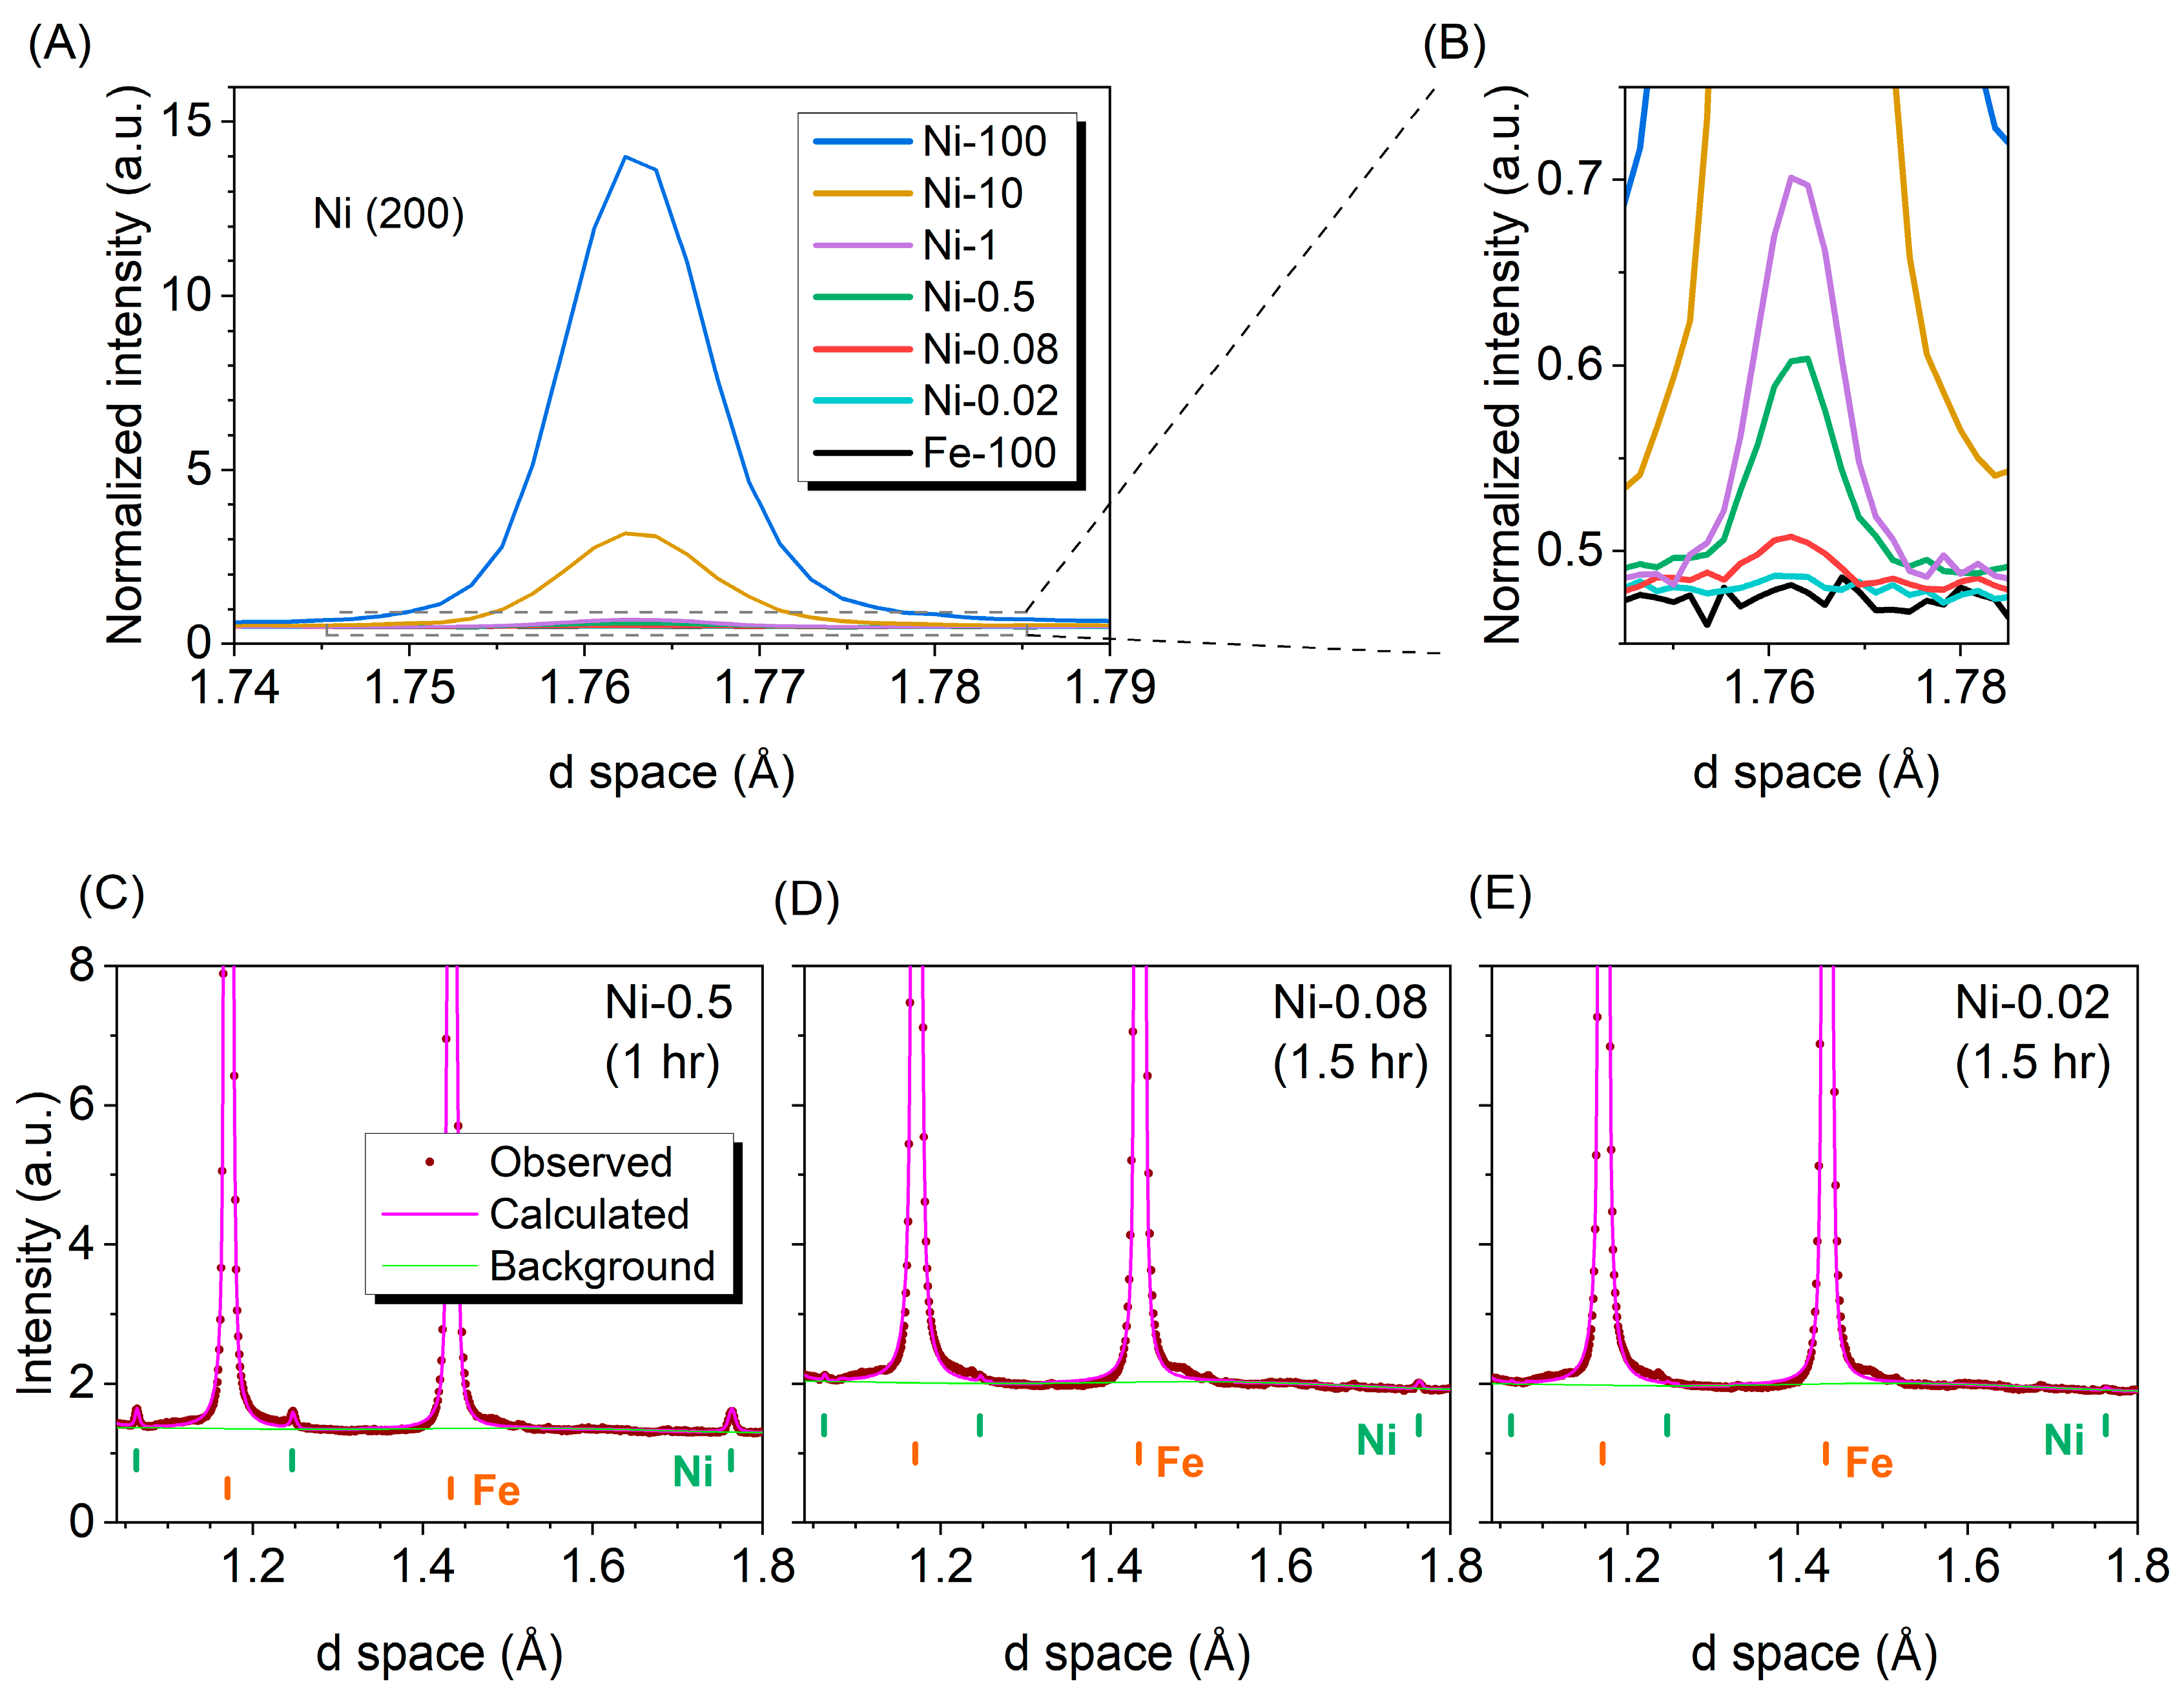
For samples with extremely low Ni fractions (Ni-0.5, Ni-0.08, and Ni-0.02), the visualization and fitting became increasingly challenging. Figure 2A illustrates the measured Ni (200) diffraction peaks of all samples, which correspond to the strongest isolated peaks of Ni. The patterns are normalized to the proton charges, so that the intensities are related to the weight fractions and comparable. The results demonstrate that the peak weakens significantly as the Ni fraction drops below 1% when compared to that of the pure Ni sample (Ni-100). Despite this, fitting remains feasible for the Ni-0.08 sample, as the peak remains distinguishable from background noise (Figure 2B). On the other hand, the Ni-0.02 sample does not exhibit a clear peak in the Ni (200) region, as its signal is indistinguishable from the background. To assess the visibility of the Ni phase at 0.02 wt%, a comparison was made between the Ni-0.02 sample and the pure Fe sample (Fe-100). Both samples exhibit similar fluctuations in peak amplitudes, as observed visually. Therefore, the strongest isolated Ni (200) peak in the Ni-0.02 sample is hard to distinguish from the background noise, making reliable refinement for such a low fraction infeasible.
Refinement attempts were made for the diffraction data for those samples with extremely low Ni fractions. When all the refinement parameters were allowed to freely vary without constraints, the fitting often failed to converge or returned invalid values (such as negative Uiso and negative profile parameters). To achieve a converged refinement, it was necessary to fix some parameters (more details are given in the next section). Zoomed-in images of examples of refinement attempts are shown in Figure 2C–E. In these images, many minor details which can be neglected when the phase fraction is high become evident simultaneously. Such details include the following: the diffraction peaks arising from the vanadium sample can, the diffraction peaks of possible impurity phases in the sample, the fluctuating background noise, and so on. These factors can be influential in the refinement of the minor Ni phase, as they compete with weak Ni signals. The refinement practice agrees with the intensity comparison in Figure 2B. For Ni-0.5, a set of Ni diffraction peaks can be identified and fitted. For Ni-0.08, only some stronger peaks can be distinguished from the background. For Ni-0.02, refinement of the Ni phase becomes questionable, as the Ni signal appears to be buried in the background and is weaker than the signal of impurity phases present in the sample. It is important to note that the measurement time was extended for samples containing lower amounts of Ni in order to improve data statistics. Comparing Figure 2C–E, the increase in measurement time increased the total background while the smoothness could not significantly improve further. This indicates that even prolonged measurements cannot overcome the limitations of refining the Ni phase in samples where its fraction is extremely low.

3.2. Phase Quantification with Refinement Parameter Controls

For the Fe–Ni mixture, all relevant parameters of the major Fe phase are open for refinement without issue. However, for quantifying the minor Ni phase, the refinement parameter controls require careful tuning to ensure convergence. Only for Ni-10 and Ni-1, which have significant amounts of the Ni phase and thus still have strong diffraction peaks, the statistics of the diffraction peaks are sufficient for estimating all fitting parameters. However, as the Ni fraction decreases, these parameters may not be deconvoluted simultaneously. This results in the divergence of linear regression or the failure of the refinement. In this case, the freedoms of the variables shall be reduced to ensure converging the fitting. Practically, selected parameters are fixed to reasonable values, such as those from the other experimental results or the instrument default values. In general, lower signal quality necessitates fixing more parameters, as reduced freedom allows stabilization of the fitting. However, the choice of fixed values may affect the accuracy and reliability of the phase quantity evaluation. The refinement results for different samples under various parameter control strategies are illustrated in Figure 3 and summarized in Table A2. In the following, the influence on Uiso, peak profile function, and lattice parameters will be discussed.
The isotropic atomic displacement parameter Uiso characterizes an atom’s thermal oscillation around the equilibrium crystallographic site and is highly temperature-dependent. In Rietveld refinement, it can be deconvoluted by fitting multiple peaks’ intensities over a wide range of d-spacing. However, Uiso may become unstable when there are no strong signals of enough peaks, especially in the low-d region where the peaks are often less pronounced. This instability is especially evident in samples with very low Ni content, such as Ni-0.5, where Uiso reaches unreasonable values, such as negative ones. Given that the temperature was kept constant during the experiments, fixing Uiso at its best-estimated value from Ni-100 was a rational approach. The comparison between the results of “All free” and “U only” for Ni-10 and Ni-1 (Table A2) demonstrates no significant changes after fixing Uiso. With lower Ni amounts, Ni peaks are generally weaker, resulting in less sensitivity to slight deviations in the fixed Uiso. Thus, inaccuracies in Uiso have minimal impact on the refinement of other fitting parameters in low-Ni samples.
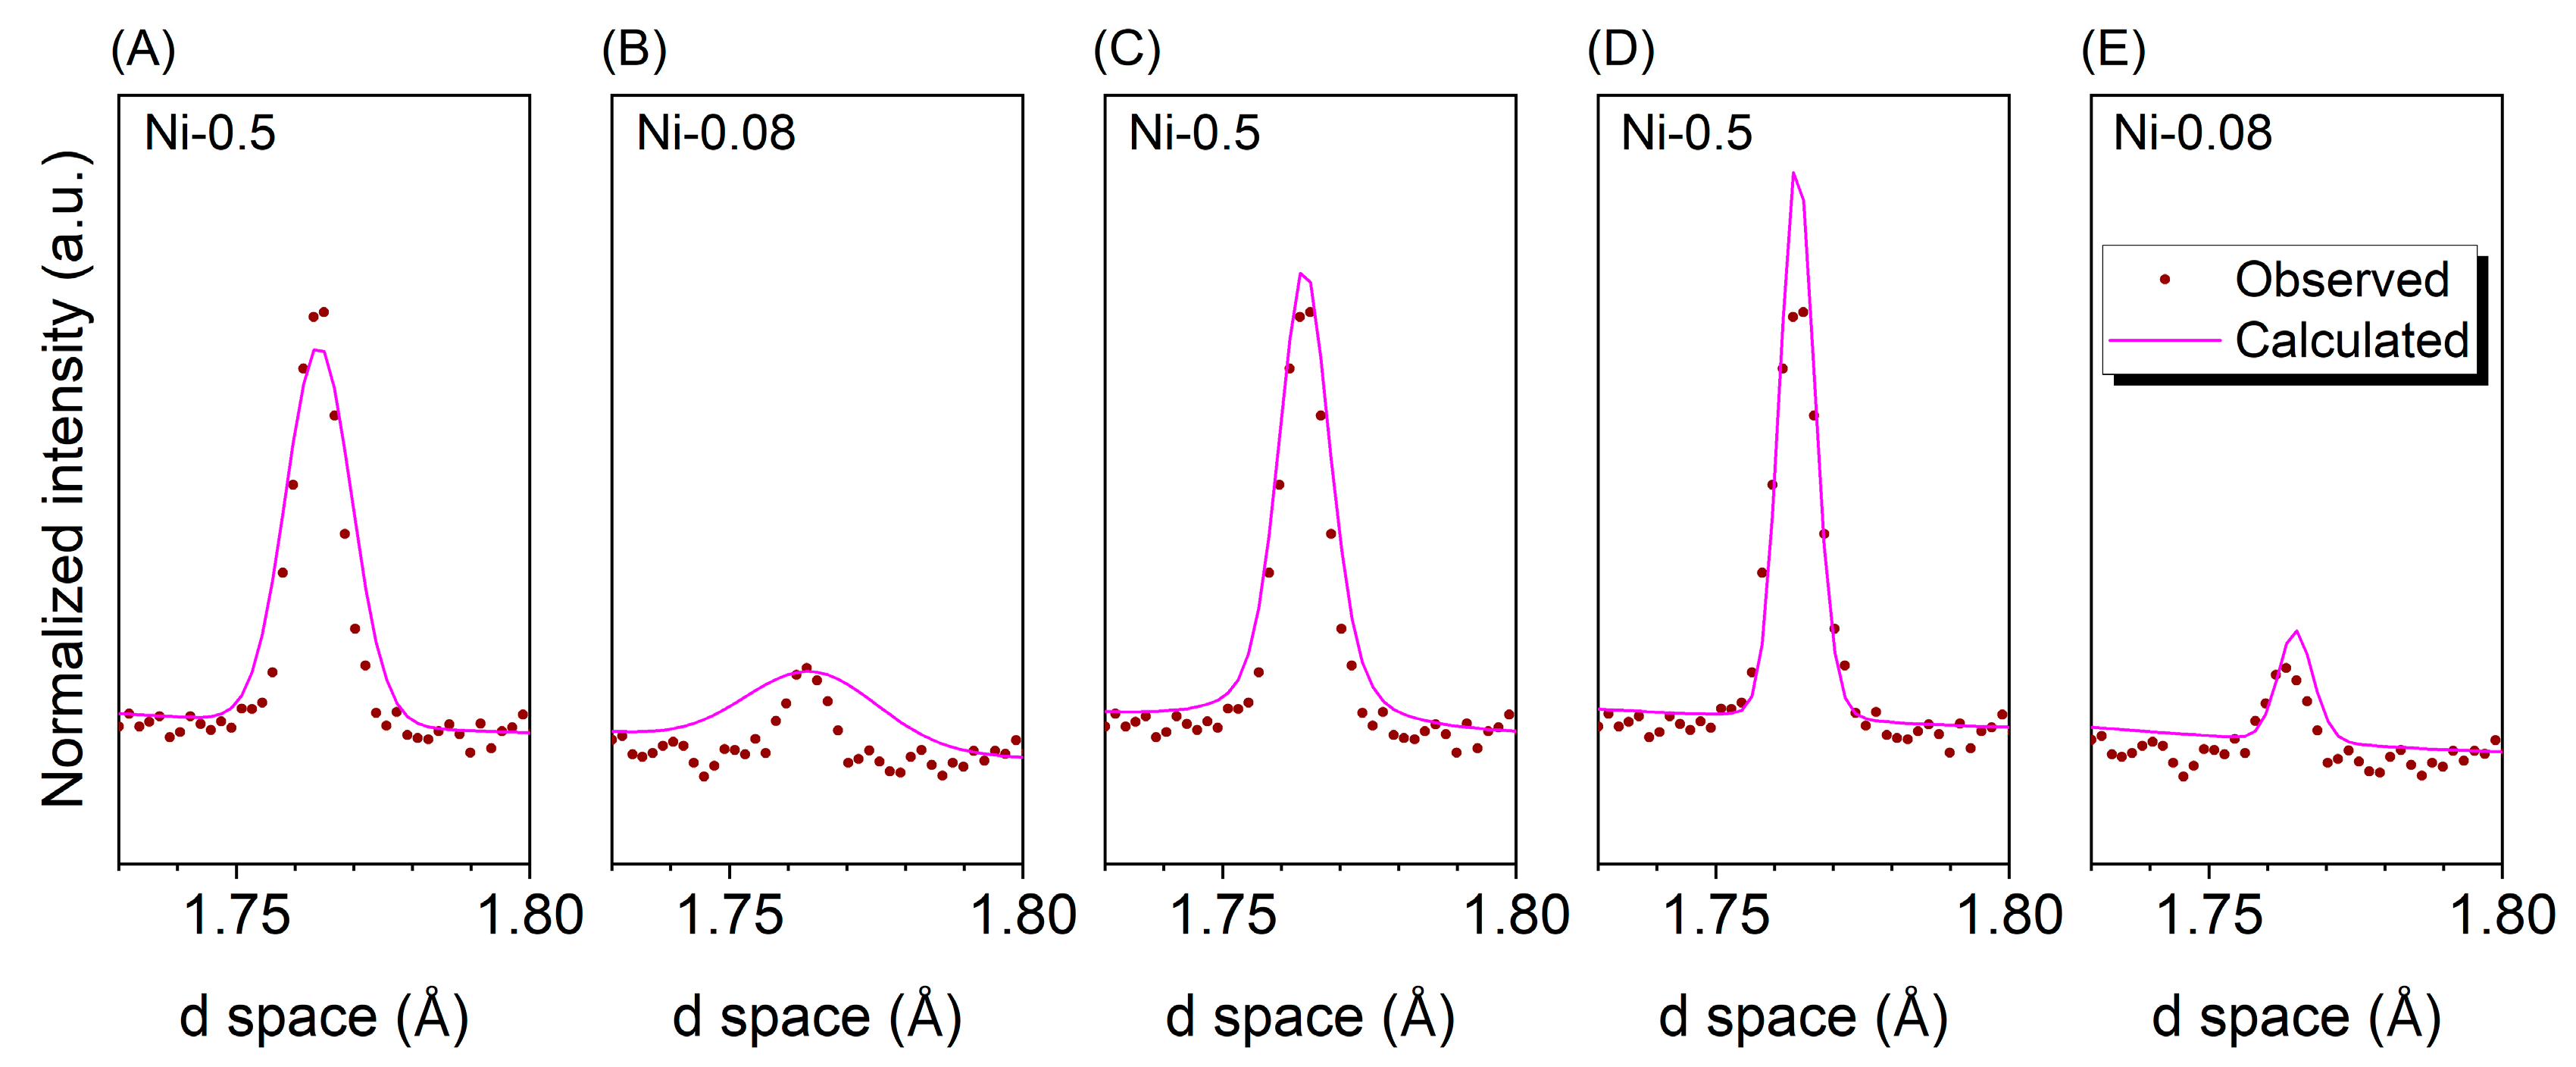
The peak profile function parameters can be misevaluated when the diffraction peaks of the minor phase are weak. This can result in deviations in intensity calculation and thus phase quantification. Starting at Ni-0.5, it became increasingly difficult to reliably determine all three profile parameters. They were then set to the values of the instrument profile parameters and enabled fewer variables to be refined. It turned out that the fitting was converged by fixing “gam-1” (U + Ins P1) for Ni-0.5 and fixing “gam-1” and “sig-2” (U + Ins P2) for Ni-0.08. However, the fitting results may not be satisfactory, as evident from the mismatched fits of the Ni (200) peaks in Figure 4A,B. Although this misfit does not result in large Ddiff for Ni-0.5, it overestimates the Ni fraction by 142.64% in Ni-0.08 (Table A2). Therefore, the direct fitting of profile functions may not be reliable for samples containing a minor phase. In samples like Ni-0.08, even enabling only one freedom for peak broadening refinement could be infeasible. This is because the background noise, fitting residual of major-phase peaks, and impurity peaks can impact the fitting of minor peaks when their amplitudes are comparable. It is necessary to find a set of reasonable and available profile parameters that assist in maximizing the accuracy of the minor-phase quantification. There are three practical approaches that will be discussed and compared in the following, including (1) using the experimental result of a similar sample (U + Ni-x P); (2) using the instrument calibration result from a standard Si powder sample (U + Ins P); and (3) using a converged result from fitting only the isolated peaks of the minor phase in the same sample.
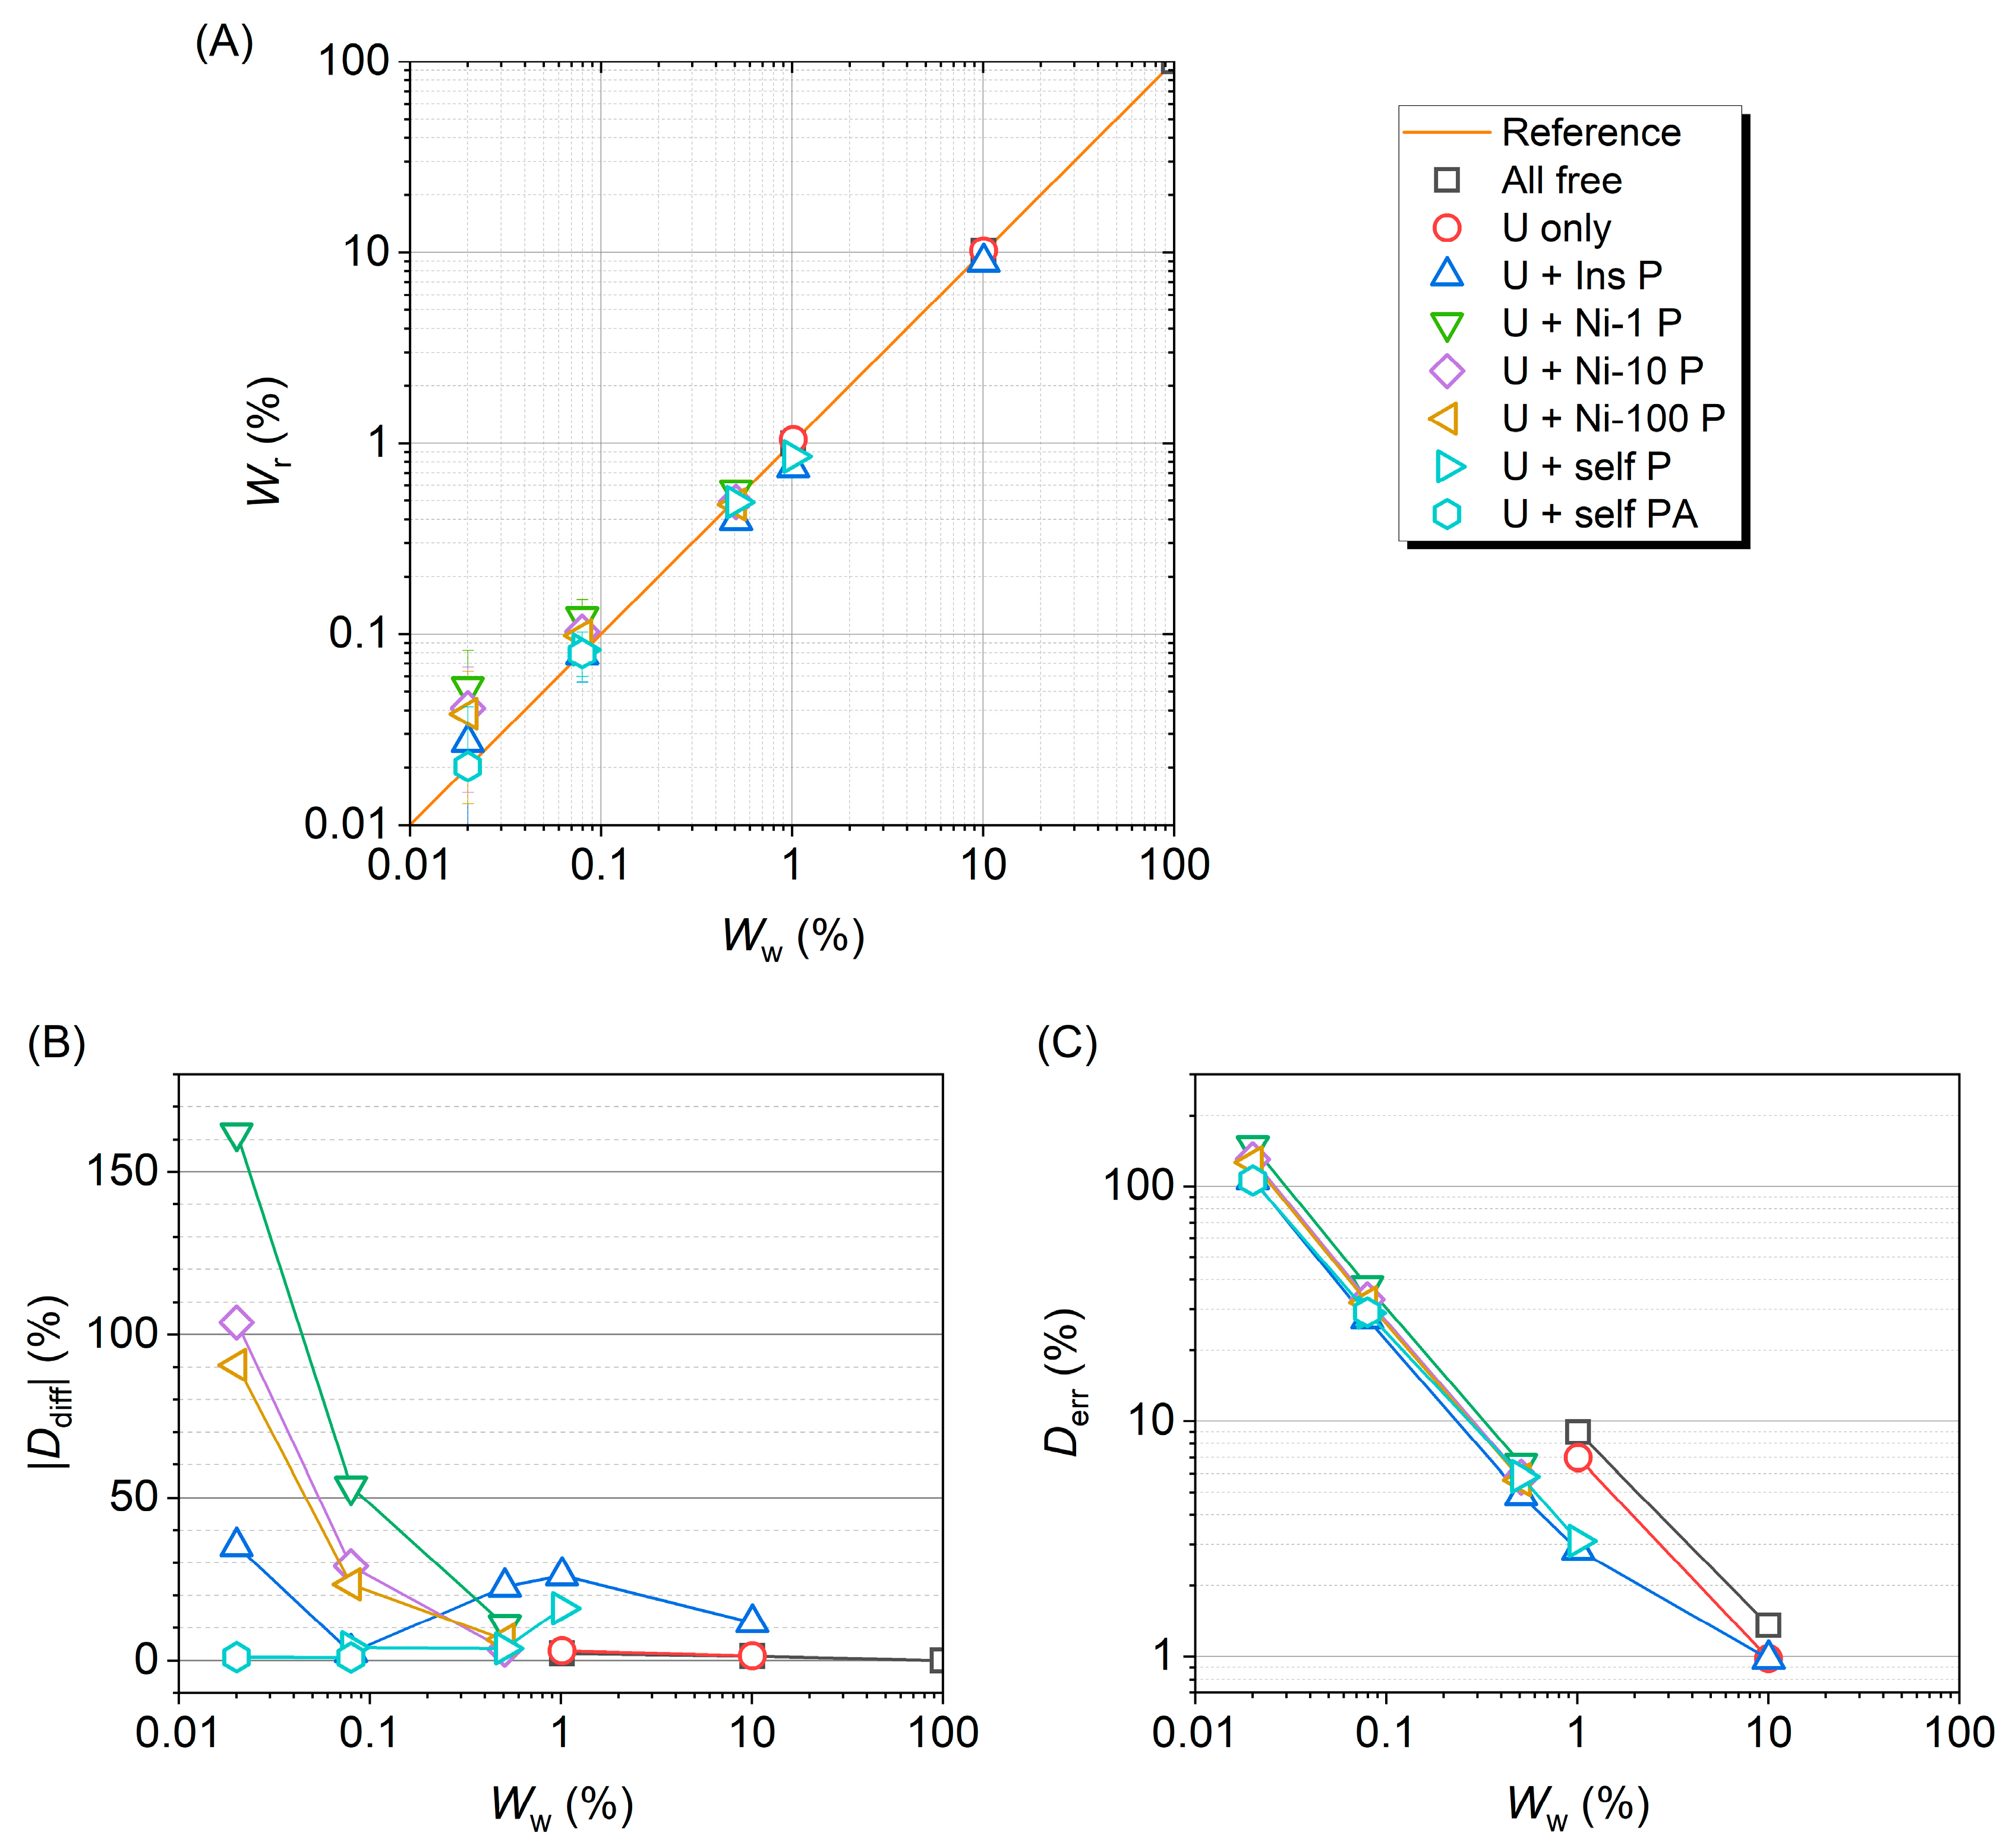
Figure 4C shows the fitting results obtained using the peak profile parameters derived from Ni-100. For the Ni-0.5 sample, this method provides a reasonable estimation, though it is not perfect. Comparison was performed using results from Ni-100, Ni-10, and Ni-1. Among these, Ni-100 is a pure phase that has the strongest peak signal; Ni-1 has the closest composition to Ni-0.5 as well as Ni-0.08 and Ni-0.02; and Ni-10 serves as a middle ground. Figure 3B shows that the application of “Ni-100 P” results in the best estimation. “Ni-10 P” exhibits similar performance, while “Ni-1 P” leads to the largest deviation when evaluating the three smallest quantities of Ni. Interestingly, the peak profile refinement shows a correlation to the phase fraction. With an extremely low phase fraction, using the values derived from pure or high-fraction phases provides a reasonable approximation.
In cases where experimental results for similar samples are unavailable, the instrument calibration profile parameters can serve as an alternative (Figure 4D,E). This assumes that the sample exhibits no peak broadening effects, such as nano-sized crystallites, high defect densities, complexities of irregular or gradient chemistry, straining, microstructure and morphology, and so forth. According to the comparison in Figure 3B, this approach yields better results for samples with extremely low Ni fractions. However, the mismatch introduces larger deviations in the samples with higher Ni fractions, such as Ni-0.5, Ni-1, and Ni-10. Instrument peak profiles are generally sharper than those of real samples, leading to systematic underestimation of minor-phase quantities.
The two approaches above employ the existing approximates without fitting the profile parameters, which is convenient but not accurate. As an open fitting is usually not converged, the third approach focuses on the significant isolated peaks only to fit appropriate profile parameters as well as the lattice parameters. Then, these parameters are applied to the minor phase and fixed in the full pattern refinement for phase quantification (“self P”). By excluding the major-phase peaks, any unfittable weak peaks, and regions with only uninformative backgrounds, this approach avoids many interfering factors in the full pattern refinement, such as the overlapping peaks and the weak peaks with background noise. Figure 5 shows the fitting of the isolated significant peaks for each sample. For Ni-1 and Ni-0.5, six peaks were fitted simultaneously, and all three profile parameters as well as the lattice parameters were calculated. For Ni-0.08, only two peaks were fitted, with refinement limited to “sig-1” and the lattice parameter. All other parameters were fixed using instrument calibration values. Similarly, for Ni-0.02, only one peak was isolated for fitting. This approach maximized the fitting accuracy for the minor-phase peaks, leading to improved estimations of their intensities. It effectively reduced |Ddiff| for the samples with extremely low Ni fractions (Figure 3B). Nevertheless, it did not perfectly work when the phase fraction was high, such as Ni-1, as it neglected overlapping and less prominent peaks that could otherwise be included in refinement.
The refinement of lattice parameters is usually stable. However, it can be derailed by the overlapping strong peaks of the major phase and the noise when the minor-phase peaks are weak. Figure 4E shows an example of Ni-0.08. The slight mismatch of peak position in the fitting may not significantly impact the intensity calculation if the peak is strong but can be pronounced for weak peaks. Using Ni-0.08 data, comparison was carried out to investigate the impact of lattice parameter misfit. As shown in Table A2, when fixing the lattice parameter (with “A”), the results were generally better than that with lattice parameter freed up (without “A”). Nevertheless, this improvement was secondary when considering the influence of the peak profile parameters. In Ni-0.02, the lattice parameter had to be fixed to ensure convergence.
The accuracy of Ni phase fraction estimation generally becomes lower with a decrease in the fraction. By applying an appropriate refinement parameter control, especially on the peak profile, the values of |Ddiff| can be suppressed to a magnitude of 10% or less. However, these estimated values inherently contain uncertainties, including the fitting errors of the generalized least-square regression of multiple variables in the refinement. As shown in Figure 3C, the relative fitting error Derr exhibits a nearly linear dependence on the minor-phase fraction on the double-logarithmic scale. This trend remains consistent regardless of the refinement controls used. It is noted that Derr is correlated to the number of variables. In the Ni-10 and Ni-1 samples, Derr is higher with more variables while |Ddiff| is lower, indicating a better estimation of weight fraction. Numerically, Derr is lower than 10% for Ni-0.5, is around 30% for Ni-0.08, and exceeds 100% for Ni-0.02. The enforced refinement with proper controls achieves fitting convergence for Ni-0.02, and the calculated fraction appears to be within a reasonable range; however, the high fitting error indicates that the estimation cannot be reliable. Combining the results of Ddiff and Derr, it can be concluded that this time-of-flight neutron diffraction can quantify, with high precision, the minor Ni phase down to 0.5 wt%, it can provide a reliable estimation down to around 0.1 wt%, and it may make it difficult to evaluate the Ni phase at an extremely low fraction of 0.02 wt%.
The limits of detection and quantification of the minor phase can be influenced by various factors of the diffraction measurement configuration, in addition to the refinement controls. One key factor is the background. It may not be a concern when the phase fraction is high; however, the low fraction limit depends on whether the outstanding peaks are detected from the background noise. Extending the measurement duration can average out the noise and smooth the curve. In this study, longer time was employed in the samples with lower Ni fractions, resulting in good statistics over the background. However, disruptive signals, such as air scattering noise, diffraction from the vanadium sample can, and impurity phase peaks from the sample, cannot be suppressed simply by prolonging measurements. Among these, the scattering from air and sample environments such as the sample container can be minimized by utilizing incident slits and receiving collimators, which are available configurations at VULCAN. The slits and collimator system defines a precise neutron gauge volume inside the sample, and the unwanted scattering signals from environment are effectively reduced to clean up the diffraction pattern background and noise [34]. This configuration was not employed in this study; this is because the full sample volume had to be measured to calculate the weight fraction, accounting for potential inhomogeneity in the powder mixture. In addition, the refinement control helps with the convergence of the fitting; however, it may possibly introduce deviation in estimation of the phase fraction because not all of the refinement parameters can be tuned at the same time. This influence may not be fully reflected by the fitting quality indicators such as wRp and Rp. As shown in Table A2, for Ni-10 and Ni-1, which have relatively large Ni fractions, both wRp and Rp tend to increase when the refinement quality is poor. However, for extremely low fractions, the indicators are less responsive or may not change significantly because the fitting for the major phase dominates while the minor-phase fitting is overlooked. In such cases, the fitting plots and results need to be carefully reviewed to avoid accepting questionable refinement results.
The minor-phase peak intensities depend on the structure factors, element and isotope types, and other factors of samples and optics as well. This case study demonstrates the limit of minor-phase quantification in Fe–Ni powder mixtures. It provides a reference for a baseline, but it is worth noting that the absolute limit depends on the specific case. For example, Cr and Ti have smaller coherent scattering lengths and coherent scattering cross sections compared to Fe and Ni (Table A1). With the same quantity, the diffraction peak intensities are generally weaker. Therefore, the lower limit of Cr and Ti could be higher than that of Ni in this study. Beyond the model samples analyzed here, real-world minor-phase quantification can be more complex due to additional factors influencing diffraction peak intensities. The cases include those with low crystal symmetry, complex crystal structure, anisotropic atom displacement, fractional site occupancies by elements and vacancies, freedom of atom coordinates, strong material absorption, preferred crystallographic orientation or texture, and so forth. Evaluating the phase fraction requires high-quality data for peak intensity fitting across a sufficient Q-range (or d-spacing range) to deconvolute the contributions of these factors to the intensities. When the phase fraction is low, such deconvolution may not be feasible, necessitating the predetermination of some parameters. This approach is conceptually similar to selecting the profile function parameters in this work. Final evaluations may vary depending on these assumptions. Enforcing fitting with multiple variables when the phase peaks are very weak can be risky, and it may yield misleading results even if the fitting appears to converge. Careful examination of the fitting errors as well as the fitting curve of each minor peak is essential to ensure reliability.

4. Conclusions

The limits of minor-phase detection and quantification in time-of-flight neutron diffraction at VULCAN were demonstrated using mixtures of Ni and Fe powders. As the Ni fraction decreases, the fitting error generally increases. Effective control of refinement parameters aids the convergence of fittings for phase quantification, with peak profile function parameters exerting the greatest influence. However, these parameters cannot be directly deconvoluted in full pattern refinement when the Ni fraction is extremely low. Through proper Rietveld refinement, the calculated Ni weight fractions in the mixtures agree with the weighed values. The results establish that reliable quantification of Ni is achievable down to approximately 0.1 wt% while detection of Ni at 0.02 wt% is challenging and uncertain. This quantification limit could potentially be improved by minimizing background noise in the diffractometer.

Author Contributions

Conceptualization, Y.C., D.Y. and K.A.; methodology, Y.C., D.Y. and K.A.; formal analysis, Y.C.; writing—original draft preparation, Y.C.; writing—review and editing, D.Y. and K.A.; visualization, Y.C. All authors have read and agreed to the published version of the manuscript.

Funding

This research was funded by U.S. Department of Energy under Contract No. DE-AC05-00OR22725.

Data Availability Statement

The original contributions presented in the study are included in the article; further inquiries can be directed to the corresponding author.

Acknowledgments

This research used resources at the Spallation Neutron Source, a DOE Office of Science User Facility operated by the Oak Ridge National Laboratory. The beam time was allocated to VULCAN with the proposal number IPTS-30087.

Conflicts of Interest

The authors declare no conflicts of interest.

Abbreviations

The following abbreviations are used in this manuscript:
TOFtime-of-flight
SNSSpallation Neutron Source

Appendix A

Table A1. Neutron scattering lengths and cross sections of Fe, Ni and other selected elements. (The data are averaged to the concentration of natural isotopes. Coh: coherent; Inc: incoherent; Scatt: scattering; Abs: absorption; b: scattering length in 10−15 m; xs: cross section in 10−24 cm2.)
ElementCoh bInc bCoh xsInc xsScatt xsAbs xs
Fe9.45---11.220.411.622.56
Ni10.3---13.35.218.54.49
Cr3.635---1.661.832.543.05
Ti−3.438---1.4852.874.356.09
Table A2. Ni weight fractions that were estimated from Rietveld refinement of neutron diffraction patterns with various refinement controls. The fitting quality parameters wRp, Rp, and χ2 and the number of variables in the fitting are listed.
SampleWw (%)ControlWr (%)wRp/Rp/χ2/VariablesDdiff (%)
Fe-1000All free00.0508/0.0407/20.73/19
Ni-100100All free1000.0320/0.0229/7.758/19
Ni-1010.057All free10.19 (14)0.0401/0.0331/13.82/25+1.29
U only10.20 (10)0.0401/0.0331/13.81/24+1.39
U + Ins P8.89 (9)0.0541/0.0407/25.11/21−11.63
Ni-11.0143All free0.993 (91)0.0430/0.0394/29.43/25−2.09
U only1.044 (71)0.0430/0.0395/29.43/24+2.96
U + Ins P0.750 (29)0.0437/0.0398/30.28/21−26.07
U + Self P0.906 (33)0.0432/0.0394/29.58/21−16.00
Ni-0.50.5098U + Ins P10.497 (35)0.0400/0.0389/34.32/23−2.47
U + Ins P0.395 (25)0.0403/0.0392/34.71/21−22.55
U + Ni-1 P0.565 (33)0.0400/0.0389/34.19/21+10.87
U + Ni-10 P0.493 (30)0.0401/0.0390/34.32/21−3.32
U + Ni-100 P0.478 (29)0.0401/0.0390/34.36/21−6.30
U + Self P0.491 (30)0.0402/0.0391/34.54/21−3.71
Ni-0.080.0798U + Ins P20.194 (53)0.0396/0.0397/38.14/22+142.64
U + Ins P0.078 (22)0.0397/0.0396/38.28/21−2.43
U + Ins PA0.076 (22)0.0397/0.0396/38.28/20−5.26
U + Ni-1 P0.122 (30)0.0397/0.0395/38.18/21+53.37
U + Ni-1 PA0.119 (30)0.0397/0.0395/38.19/20+48.80
U + Ni-10 P0.103 (26)0.0397/0.0396/38.23/21+29.00
U + Ni-10 PA0.100 (26)0.0397/0.0396/38.23/20+25.12
U + Ni-100 P0.098 (26)0.0397/0.0396/38.24/21+23.34
U + Ni-100 PA0.096 (26)0.0397/0.0396/38.24/20+20.20
U + Self P0.083 (23)0.0399/0.0398/38.53/21+3.94
U + Self PA0.079 (23)0.0399/0.0398/38.53/20−0.89
Ni-0.020.0201U + Ins PA0.027 (22)0.0391/0.0392/36.91/20+35.12
U + Ni-1 PA0.053 (30)0.0391/0.0391/38.19/20+161.88
U + Ni-10 PA0.041 (26)0.0391/0.0392/38.23/20+103.71
U + Ni-100 PA0.038 (25)0.0391/0.0392/38.24/20+90.60
U + Self PA0.020 (21)0.0393/0.0394/38.53/20+1.00

References

  1. Pecharsky, V.K.; Zavalij, P.Y. Fundamentals of Powder Diffraction and Structural Characterization of Materials; Springer: Boston, MA, USA, 2003. [Google Scholar]
  2. Börner, H.; Brown, J.; Carlile, C.J.; Cubitt, R.; Currat, R.; Dianoux, A.J.; Farago, B.; Hewat, A.W.; Kulda, J.; Lelièvre-Berna, E.; et al. Neutron Data Booklet, 2nd ed.; Dianoux, A., Lander, G., Eds.; OCP Science: Philadelphia, PA, USA, 2003. [Google Scholar]
  3. Dronskowski, R.; Brückel, T.; Kohlmann, H.; Avdeev, M.; Houben, A.; Meven, M.; Hofmann, M.; Kamiyama, T.; Zobel, M.; Schweika, W.; et al. Neutron diffraction: A primer. Z. Kristallogr. Cryst. Mater. 2024, 239, 139–166. [Google Scholar] [CrossRef]
  4. Sears, V.F. Neutron scattering lengths and cross sections. Neutron News 1992, 3, 26–37. [Google Scholar] [CrossRef]
  5. Kameda, Y.; Mimuro, T.; Kondo, S.I.; Honda, T.; Otomo, T. Structure of Ion Pair Receptor Combined with Li+ Cl–in Concentrated Acetonitrile Solutions Studied by Neutron Diffraction with 6Li/7Li Isotopic Substitution Method. J. Phys. Chem. B 2024, 128, 12533–12539. [Google Scholar] [CrossRef] [PubMed]
  6. Komatsu, K.; Hattori, T.; Klotz, S.; Machida, S.; Yamashita, K.; Ito, H.; Kobayashi, H.; Irifune, T.; Shinmei, T.; Sano-Furukawa, A.; et al. Hydrogen bond symmetrisation in D2O ice observed by neutron diffraction. Nat. Commun. 2024, 15, 5100. [Google Scholar] [CrossRef] [PubMed]
  7. Liu, J.; Gasparrini, C.; White, J.T.; Johnson, K.; Lopes, D.A.; Peterson, V.K.; Studer, A.; Griffiths, G.J.; Lumpkin, G.R.; Wenman, M.R.; et al. Thermal expansion and steam oxidation of uranium mononitride analysed via in situ neutron diffraction. J. Nucl. Mater. 2023, 575, 154215. [Google Scholar] [CrossRef]
  8. An, K.; Chen, Y.; Stoica, A.D. VULCAN: A “hammer” for high-temperature materials research. MRS Bull. 2019, 44, 878–885. [Google Scholar] [CrossRef]
  9. Ganesh Jangam, R.; Thamizhavel, A.; Knotko, A.V.; Yapaskurt, V.O.; Morozkin, A.V. Magnetic structure of rare earth intermetallic compound Er6MnTe2: Neutron diffraction and magnetization study. AIP Adv. 2025, 15, 035113. [Google Scholar] [CrossRef]
  10. Tanji, A.; Fan, X.; Sakidja, R.; Liaw, P.K.; Hermawan, H. Niobium addition improves the corrosion resistance of TiHfZrNbx high-entropy alloys in Hanks’ solution. Electrochim. Acta 2022, 424, 140651. [Google Scholar] [CrossRef]
  11. Zhang, Q.; Arnold, W.; Hood, Z.D.; Li, Y.; DeWees, R.; Chi, M.; Chen, Z.; Chen, Y.; Wang, H. Li0.625Al0.125H0.25Cl0.75O0.25 Superionic Conductor with Disordered Rock-Salt Structure. ACS Appl. Energy Mater. 2021, 4, 7674–7680. [Google Scholar] [CrossRef]
  12. Zhomartova, A.Z.; Abdurakhimov, B.A.; Talmațchi, C.; Kichanov, S.E.; Kozlenko, D.P.; Bǎlǎșoiu, M.; Talmațchi, G.; Șova, C.; Belc, M.C. The systematic structural studies of some Byzantine ceramic fragments from Dobrudja region of Romania: Raman spectroscopy, neutron diffraction, and imaging data. Archaeometry 2024, 66, 787–802. [Google Scholar] [CrossRef]
  13. Zhou, H.; Shen, Y.; Cao, Y.; Yang, W.; Sun, X.; Yu, C.; Lin, K.; Xing, X. A Kagome Metallic Composite Realizes Mechanically Axial Zero Thermal Expansion up to 800 K. Adv. Mater. 2025, 37, 2502030. [Google Scholar] [CrossRef]
  14. Xie, D.; Lyu, Z.; Fan, M.; Chew, H.B.; Liaw, P.K.; Bei, H.; Zhang, Z.; Gao, Y. Micromechanical origin of the enhanced ductility in twinless duplex Mg–Li alloy. Mater. Sci. Eng. A 2021, 815, 141305. [Google Scholar] [CrossRef]
  15. Yu, D.; Huang, L.; Chen, Y.; Komolwit, P.; An, K. Real-Time In Situ Neutron Diffraction Investigation of Phase-Specific Load Sharing in a Cold-Rolled TRIP Sheet Steel. JOM 2018, 70, 1576–1586. [Google Scholar] [CrossRef]
  16. Park, K.; Iftikhar, H.; Shin, S.; Jung, Y.; Lee, K.; Lee, C.; Song, G. Balanced mechanical properties of Al0. 5CoCrFeNiTi0. 1 high entropy alloy under extreme environments from cryogenic temperature to 800° C. J. Alloys Compd. 2025, 1010, 178199. [Google Scholar] [CrossRef]
  17. Gu, G.H.; Ha, H.; Harjo, S.; Gong, W.; Louzguine-Luzgin, D.V.; Kim, H.S. Mechanistic insights into deformation, load redistribution, and stress partitioning in high-strength dual-phase medium-entropy alloys. Mater. Sci. Eng. A 2025, 943, 148818. [Google Scholar] [CrossRef]
  18. Jiang, S.; Lin Peng, R.; Zhao, X.; Zuo, L.; Jia, N. Deformation incompatibility enables hetero-deformation induced strengthening in Ti/Nb laminates. Mater. Res. Lett. 2023, 11, 126–133. [Google Scholar] [CrossRef]
  19. Wang, X.; Fu, Y.; Wu, Y.; Wang, J.; Fan, J.; Zhang, F.; Ruan, H.; Wu, Y. Crystalline-amorphous-crystalline two-step phase transformation and the resulting supra-nano structure in a metastable iron-based alloy. Acta Mater. 2024, 266, 119690. [Google Scholar] [CrossRef]
  20. Lychagina, T.; Zisman, A.; Yashina, E.; Nikolayev, D. Directly verifiable neutron diffraction technique to determine retained austenite in steel. Adv. Eng. Mater. 2018, 20, 1700559. [Google Scholar] [CrossRef]
  21. Gnäupel-Herold, T.; Creuziger, A. Diffraction study of the retained austenite content in TRIP steels. Mater. Sci. Eng. A 2011, 528, 3594–3600. [Google Scholar] [CrossRef]
  22. Kozakevich, J.R.; Sediako, D.; Weiss, D.; Vogel, S.C. A Quantitative Phase Analysis by Neutron Diffraction of Conventional and Advanced Aluminum Alloys Thermally Conditioned for Elevated-Temperature Applications. Mater. 2024, 17, 4311. [Google Scholar] [CrossRef]
  23. Chen, Y.; Rangasamy, E.; dela Cruz, C.; Liang, C.; An, K. A Study of Suppressed Formation of Low-Conductive Phases in Doped Li7La3Zr2O12 Garnets by in-situ Neutron Diffraction. J. Mater. Chem. A 2015, 3, 22868–22876. [Google Scholar] [CrossRef]
  24. Yu, D.; Chen, Y.; Huang, L.; An, K. Tracing Phase Transformation and Lattice Evolution in a TRIP Sheet Steel under High-Temperature Annealing by Real-Time In Situ Neutron Diffraction. Crystals 2018, 8, 360. [Google Scholar] [CrossRef]
  25. Hua, Y.; Huang, Z.; Li, S.; Chen, S.; He, X.; Liu, H.; Feng, J. Unraveling the correlation between the synthesis time and electrochemical performance of transition metal layered oxides by in situ neutron powder diffraction. ACS Appl. Energy Mater. 2023, 6, 6563–6571. [Google Scholar] [CrossRef]
  26. Nisar, U.; Klein, F.; Pfeifer, C.; Wohlfahrt-Mehrens, M.; Hölzle, M.; Axmann, P. Elucidating the nature of secondary phases in LiNi0.5Mn1.5O4 cathode materials using correlative Raman-SEM microscopy. Energy Storage Mater. 2025, 74, 103905. [Google Scholar] [CrossRef]
  27. Chen, T.C.; Tsay, L.W.; Chou, C.C.; Hsu, S.C. Enhancing the corrosion–wear resistance of HVOF-sprayed inconel 625 coatings via micro-shot peening. Surf. Coat. Technol. 2025, 517, 132801. [Google Scholar] [CrossRef]
  28. Magagnosc, D.J.; Field, D.M.; Meredith, C.S.; Walter, T.R.; Limmer, K.R.; Lloyd, J.T. Superior strength and ductility in a low density duplex steel studied by in situ neutron diffraction. Mater. Sci. Eng. A 2021, 799, 140252. [Google Scholar] [CrossRef]
  29. Berry, K.D.; Bailey, K.M.; Beal, J.; Diawara, Y.; Funk, L.; Hicks, J.S.; Jones, A.B.; Littrell, K.C.; Pingali, S.V.; Summers, P.R.; et al. Characterization of the neutron detector upgrade to the GP-SANS and Bio-SANS instruments at HFIR. Nucl. Instrum. Methods Phys. Res. Sect. A 2012, 693, 179–185. [Google Scholar] [CrossRef]
  30. Larson, A.C.; Von Dreele, R.B. General Structure Analysis System (GSAS). Los Alamos National Laboratory Report LAURM. 2004; pp. 86–748. Available online: https://subversion.xray.aps.anl.gov/EXPGUI/gsas/all/GSAS%20Manual.pdf (accessed on 30 September 2025).
  31. Toby, B.H. EXPGUI, a graphical user interface for GSAS. J. Appl. Crystallogr. 2001, 34, 210–213. [Google Scholar] [CrossRef]
  32. Harmer, C.P.; Kamali, S.; Lebedev, O.I.; Lee, S.J.; Ribeiro, R.A.; Canfield, P.C.; Kovnir, K. Pseudo-polymorphism in layered FeS intercalates: A competition between charged and neutral guest species. Chem. Mater. 2022, 34, 5397–5408. [Google Scholar] [CrossRef]
  33. Mondal, S.; Dutta, S.; Mal, S.; Pati, S.K.; Bhattacharyya, S. Lattice Mismatch Guided Nickel-Indium Heterogeneous Alloy Electrocatalysts for Promoting the Alkaline Hydrogen Evolution. Angew. Chem. Int. Ed. 2023, 62, 202301269. [Google Scholar] [CrossRef]
  34. Yu, D.; Chen, Y.; Conner, D.; Berry, K.D.; Skorpenske, H.D.; An, K. Effect of Collimation on Diffraction Signal-to-Background Ratios at a Neutron Diffractometer. Quantum Beam Sci. 2024, 8, 14. [Google Scholar] [CrossRef]
Figure 1. Diffraction patterns and Rietveld refinement of pure phases (A,B) and mixture with significant Ni fractions (C,D).
Crystals 15 00934 g001
Figure 2. Diffraction patterns of the mixture with low fractions of Ni. (A) A comparison of the normalized Ni (200) peaks in all samples. (B) A zoomed-in view of (A). (CE) Zoomed-in regions of refinement plots showing the low-intensity peaks of Ni in the Ni-0.5, Ni-0.08, and Ni-0.02 samples.
Crystals 15 00934 g002
Figure 3. A comparison of the calculated and weighed Ni fractions by using different parameter controls in Rietveld refinement. (A) Refined Ni weight fraction, Wr. (B) Absolute value of relative difference, |Ddiff|. (C) Relative fitting error, Derr.
Crystals 15 00934 g003
Figure 4. Ni (200) peak fitting in the refinement of Ni-0.5 and Ni-0.08 with different peak profile parameter controls. (A,B) With one or two parameters enabled to fit. (C) Profile parameters fixed as those for Ni-100. (D,E) Profile parameters fixed as those from instrument calibration.
Crystals 15 00934 g004
Figure 5. Fitting for the peak profile parameters by excluding other parts of neutron diffraction pattern and leaving only significant isolated peaks. The data of Ni-0.5 and Ni-0.02 are shifted upwards for clarity.
Crystals 15 00934 g005
Disclaimer/Publisher’s Note: The statements, opinions and data contained in all publications are solely those of the individual author(s) and contributor(s) and not of MDPI and/or the editor(s). MDPI and/or the editor(s) disclaim responsibility for any injury to people or property resulting from any ideas, methods, instructions or products referred to in the content.