Figure 1.
Schematic representation of the solid-state processing route.
Figure 1.
Schematic representation of the solid-state processing route.
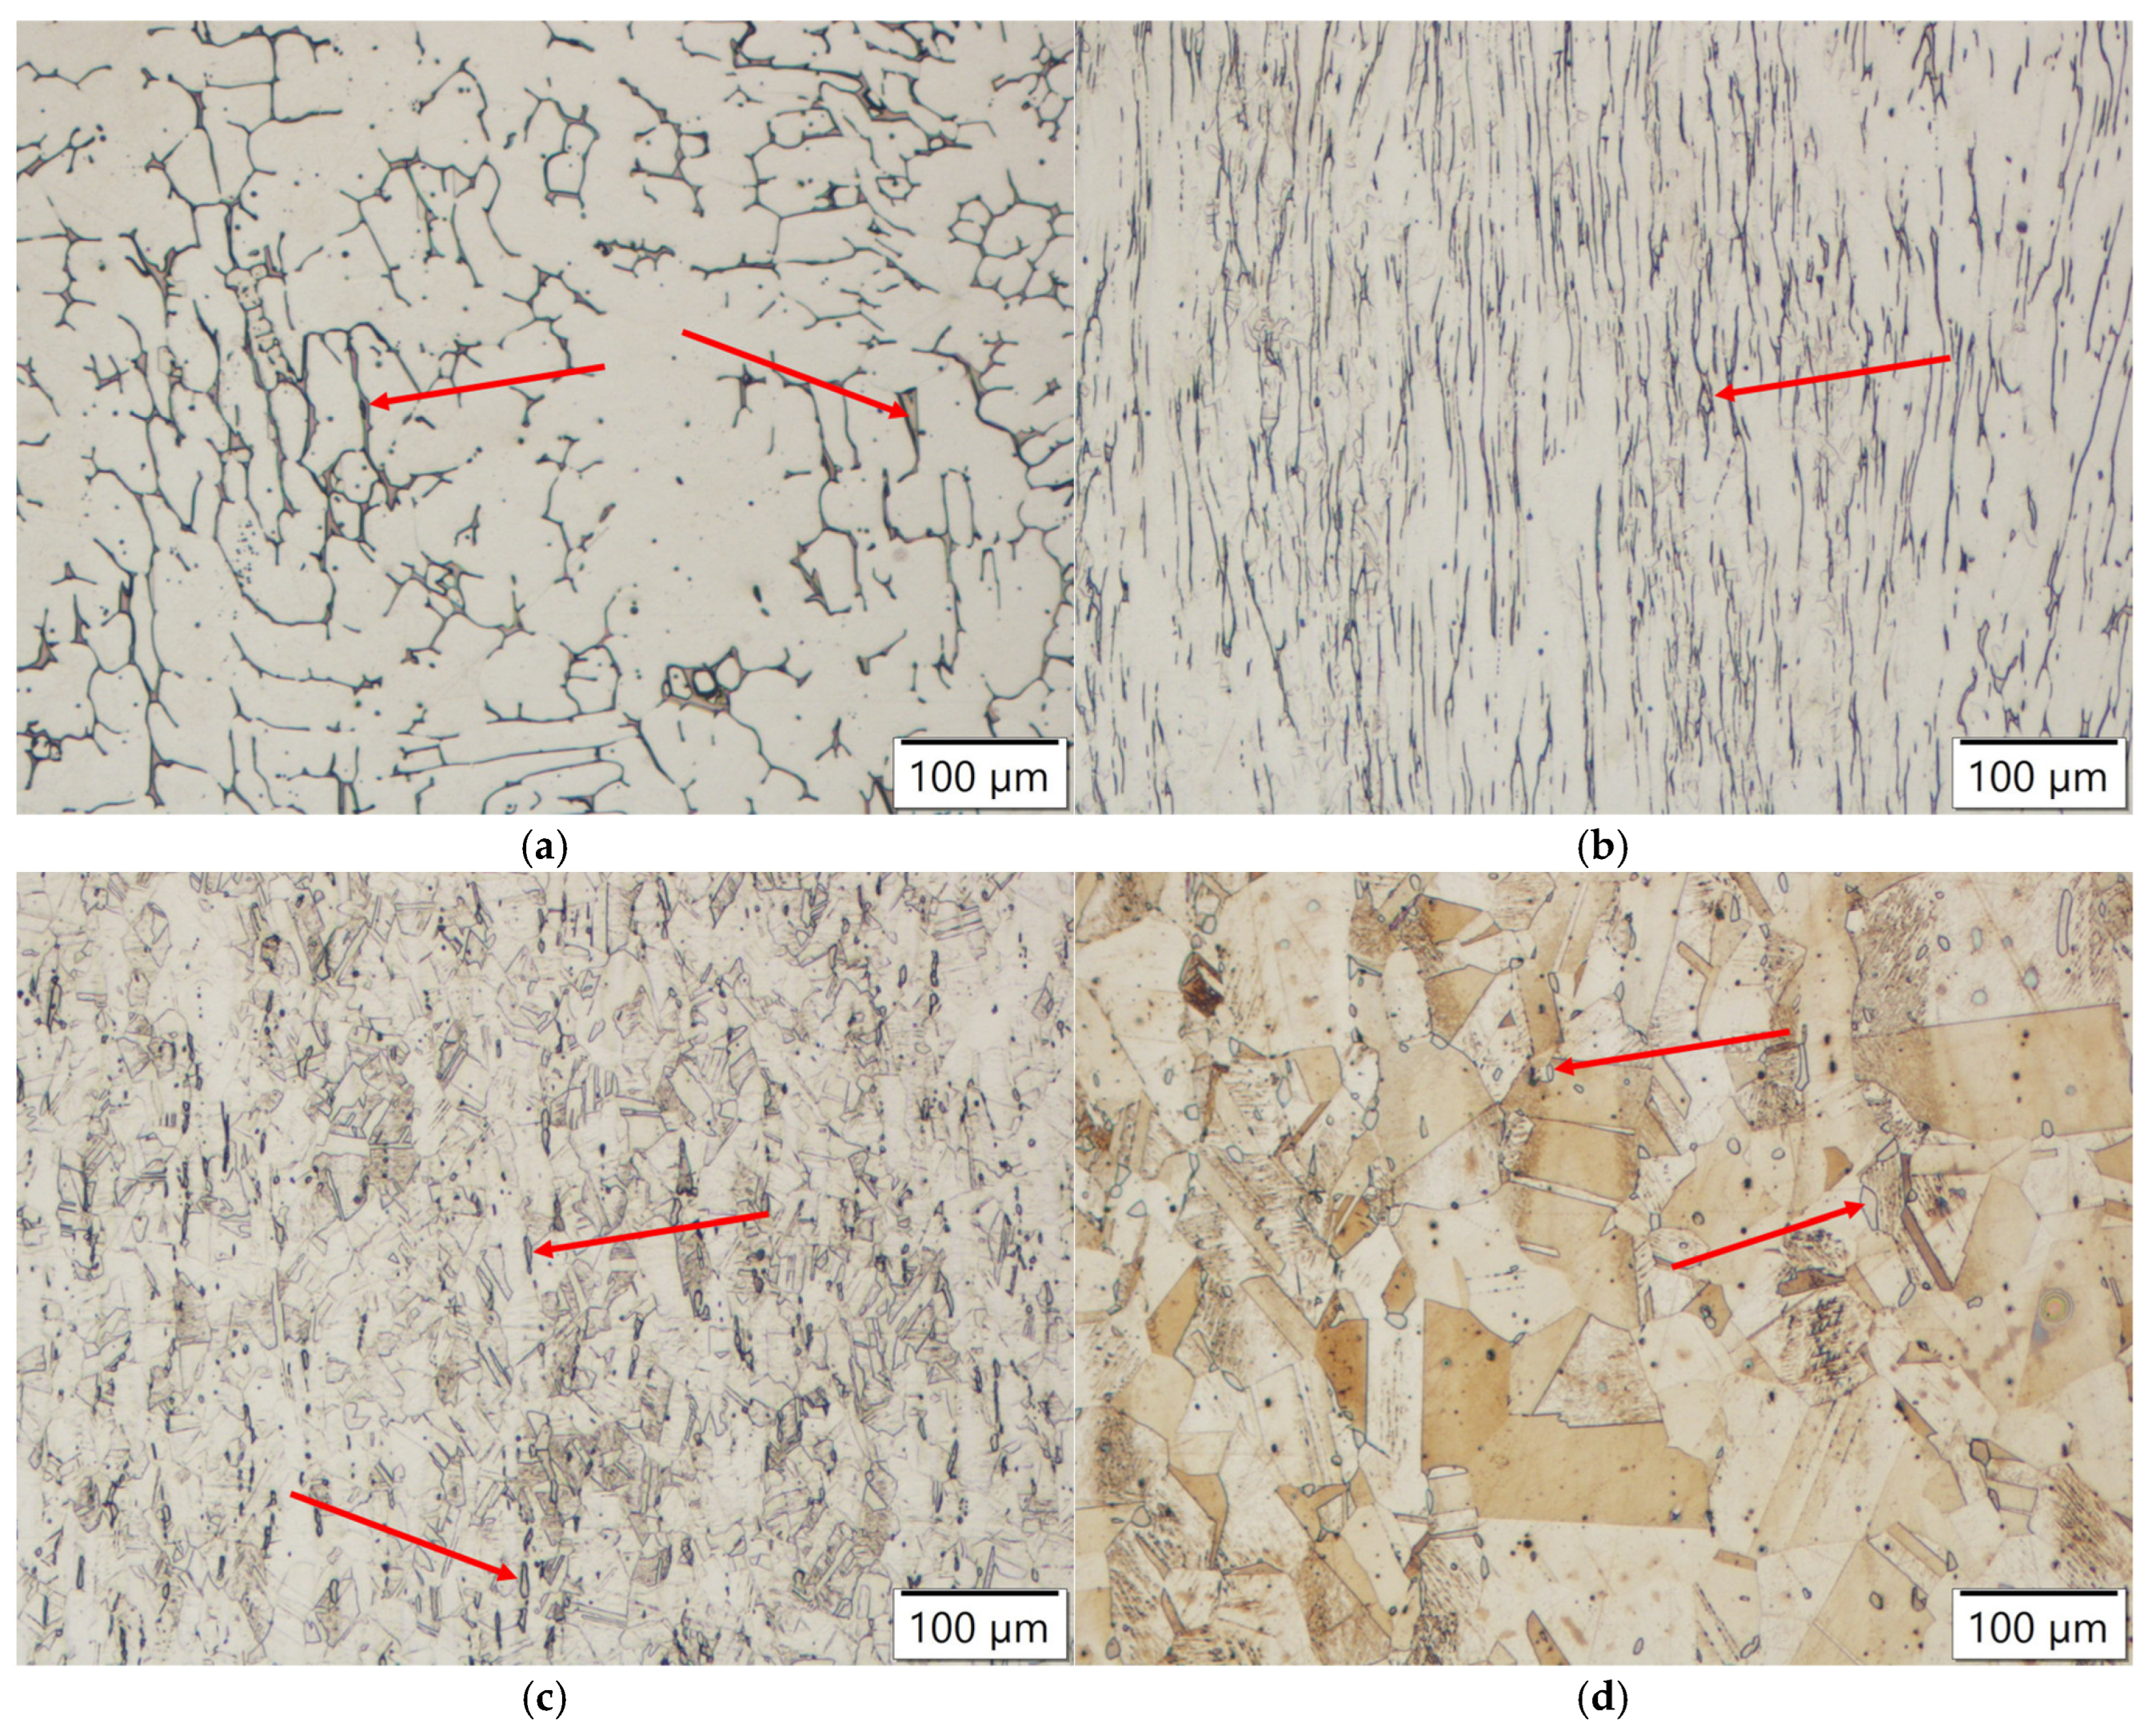
Figure 2.
Microstructure of AISI 304 steel with marked delta ferrite (red arrows): (a) in as-cast state, (b) in as-rolled state, (c) quenched after the furnace reached 1050 °C, (d) annealed for four hours at 1200 °C.
Figure 2.
Microstructure of AISI 304 steel with marked delta ferrite (red arrows): (a) in as-cast state, (b) in as-rolled state, (c) quenched after the furnace reached 1050 °C, (d) annealed for four hours at 1200 °C.
Figure 3.
SEM image of delta ferrite and austenite and the distribution of nickel and chromium in the microstructure.
Figure 3.
SEM image of delta ferrite and austenite and the distribution of nickel and chromium in the microstructure.
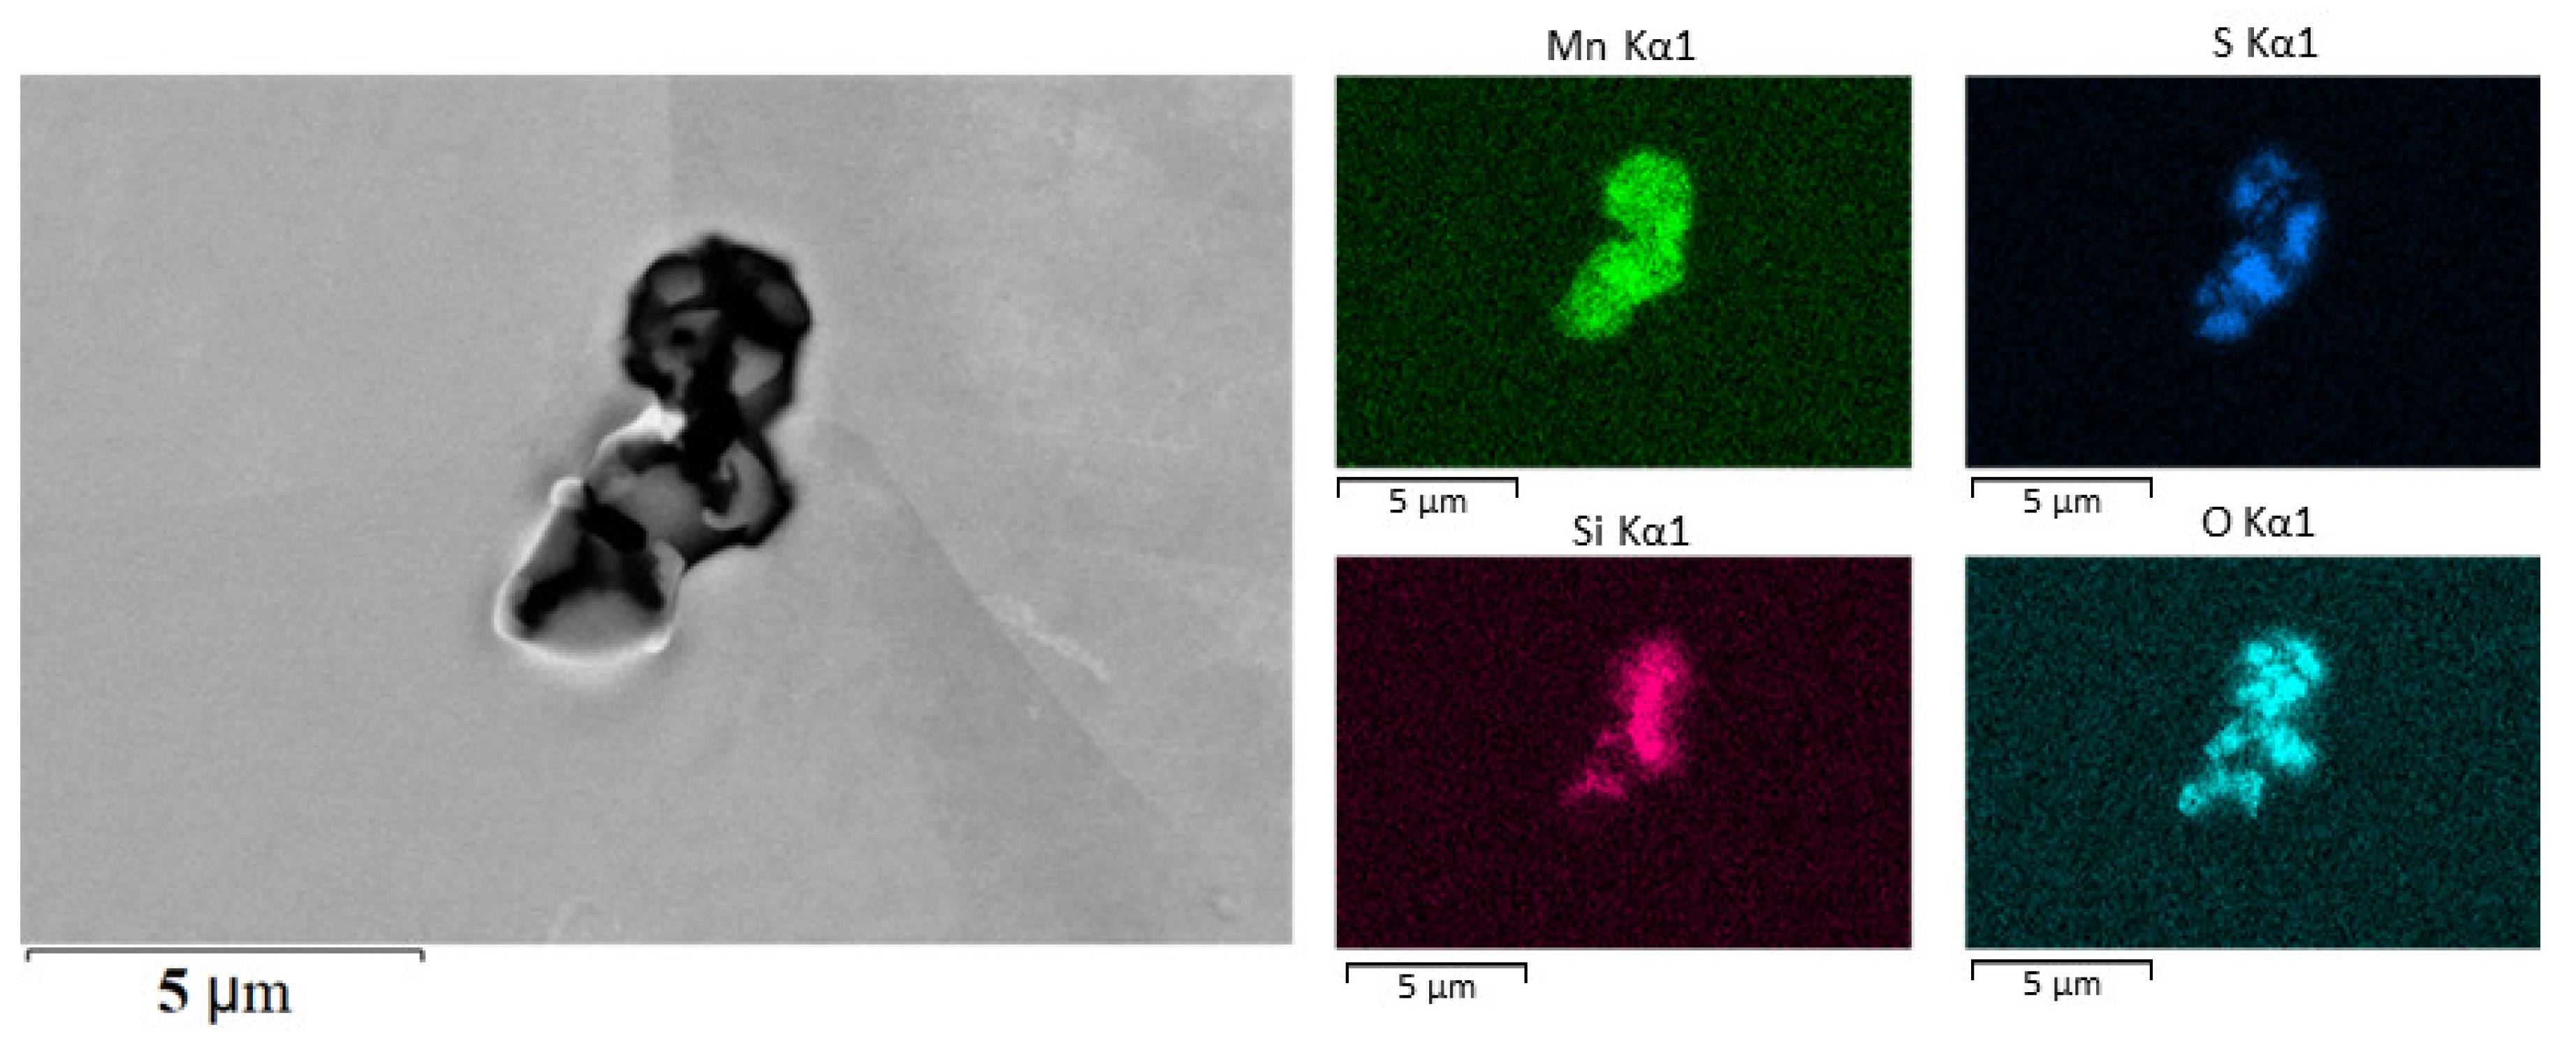
Figure 4.
SEM image of manganese sulfide and silicon oxide inclusions in steel without additional alloying and the elemental mapping of Mn, S, Si, and O.
Figure 4.
SEM image of manganese sulfide and silicon oxide inclusions in steel without additional alloying and the elemental mapping of Mn, S, Si, and O.
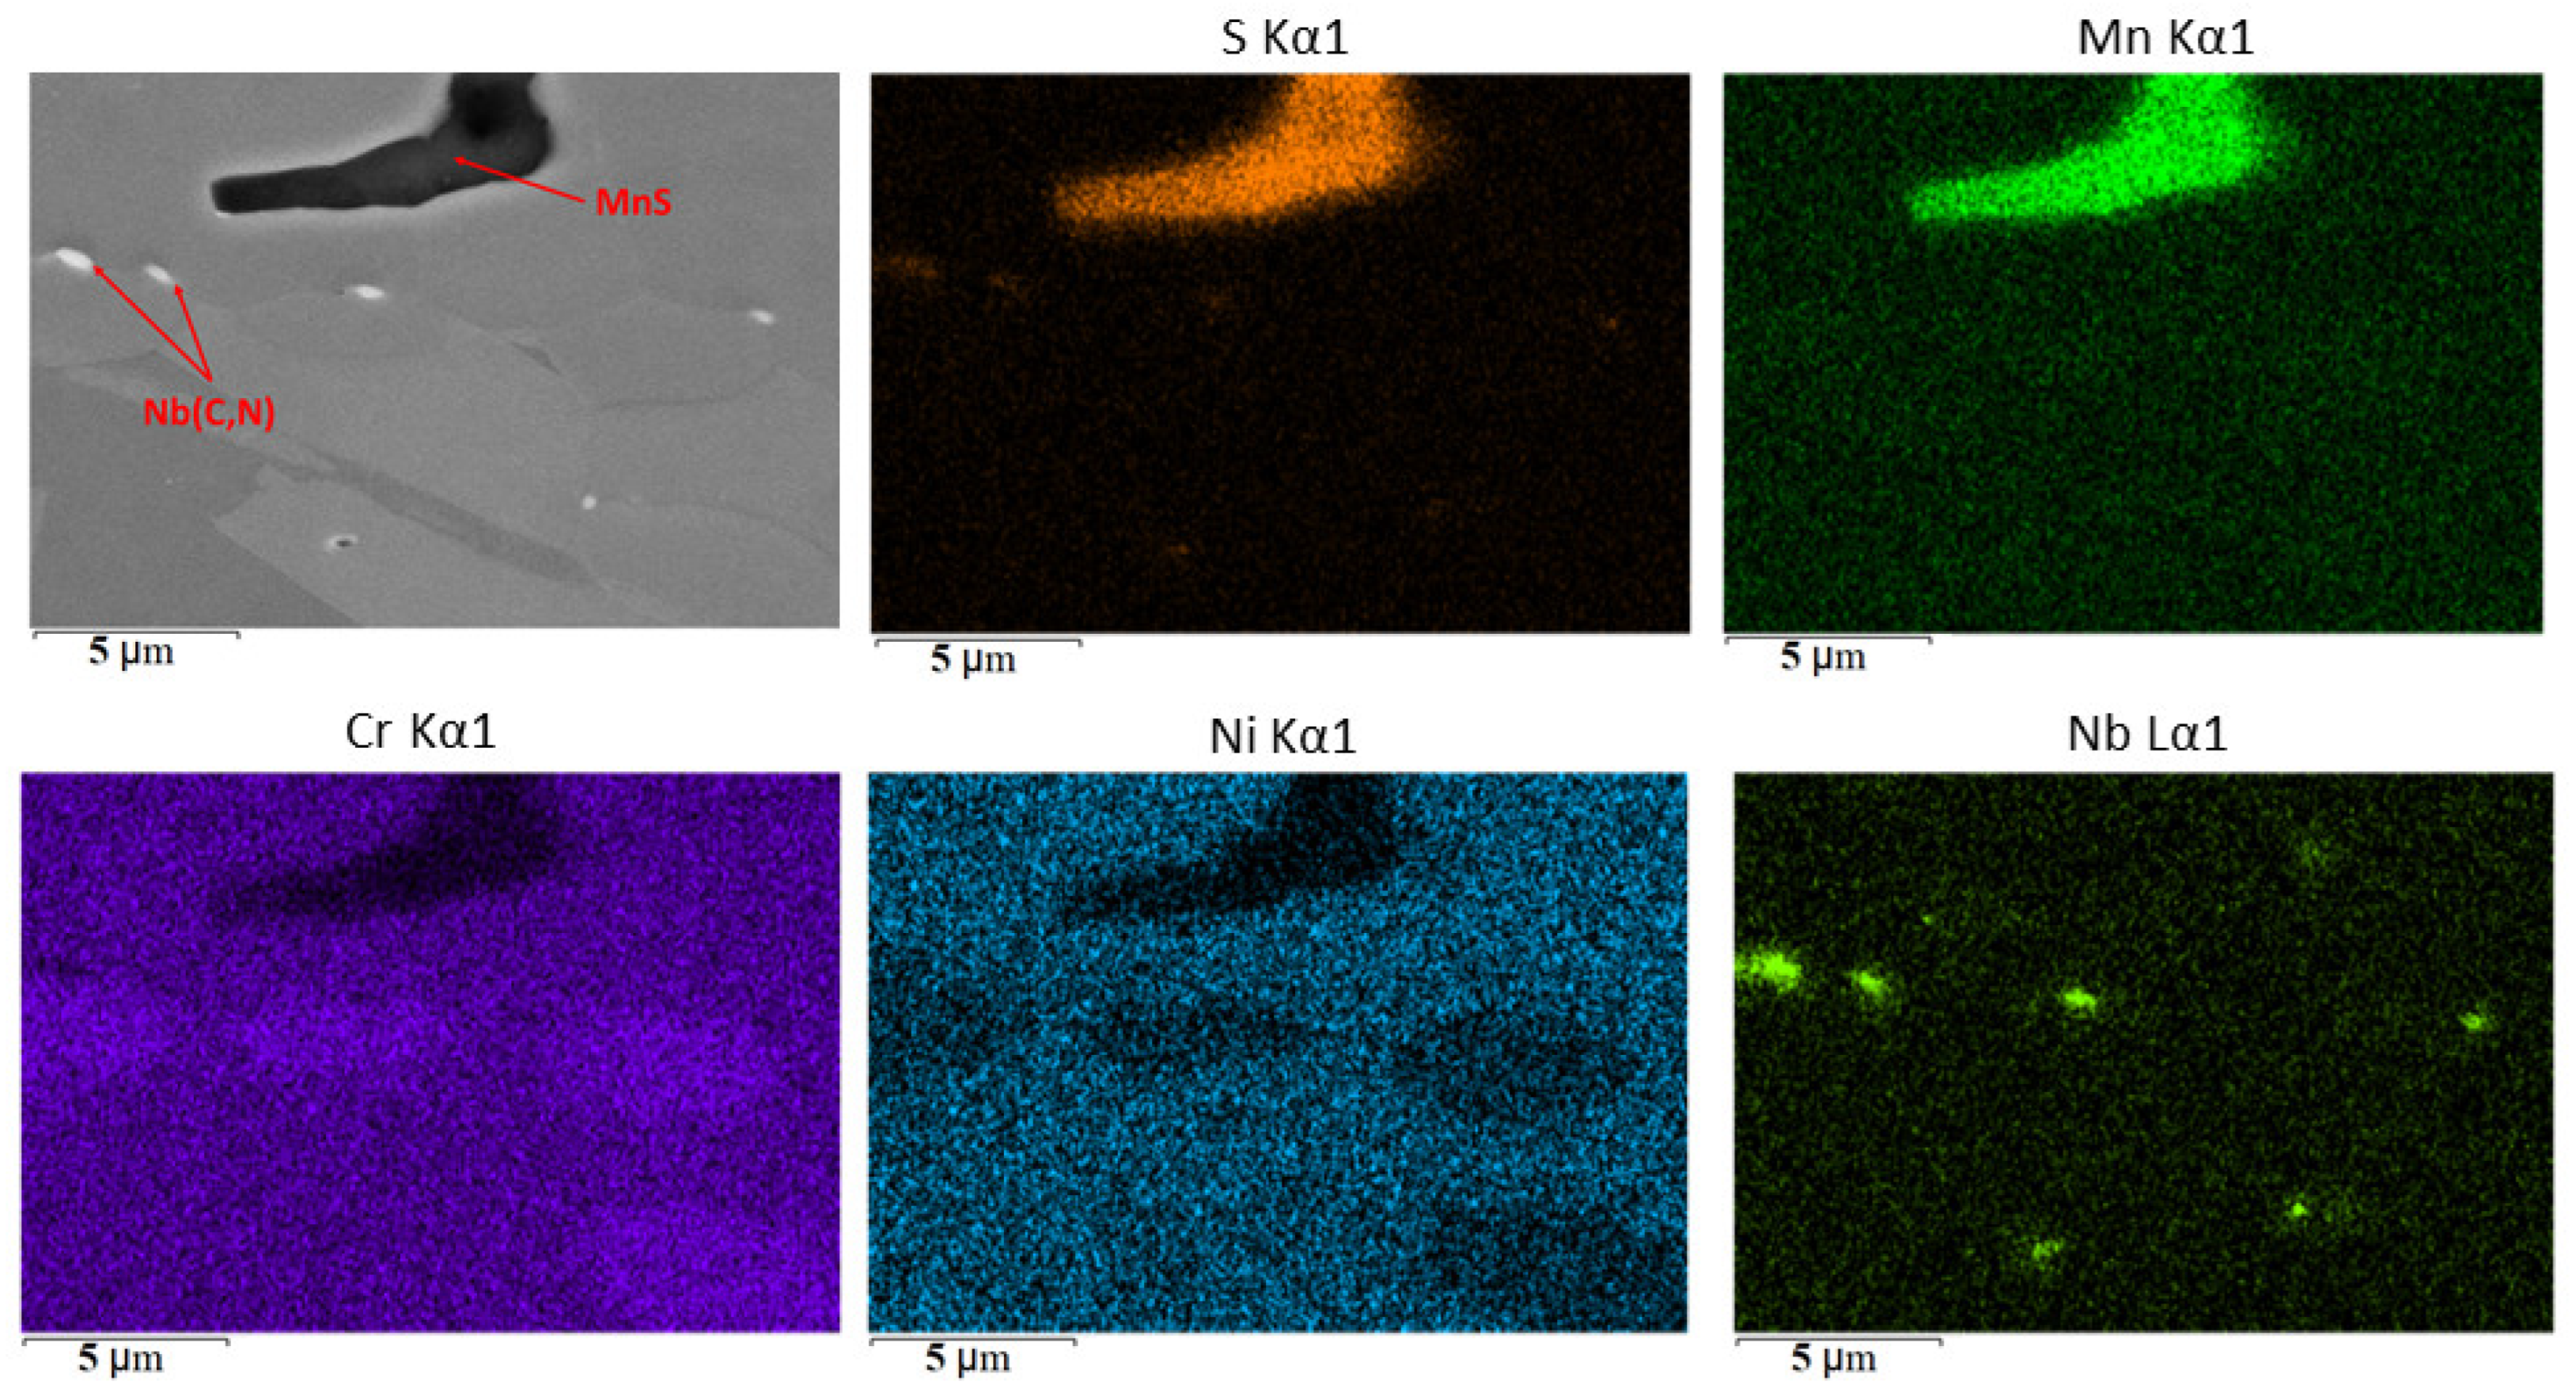
Figure 5.
SEM image of manganese sulfide and niobium carbonitride inclusions in niobium-alloyed steel and the distribution of Mn, S, N, Cr, and Ni elements in the steel microstructure.
Figure 5.
SEM image of manganese sulfide and niobium carbonitride inclusions in niobium-alloyed steel and the distribution of Mn, S, N, Cr, and Ni elements in the steel microstructure.
Figure 6.
SEM image and location of point EDS analysis of a niobium carbonitride precipitate.
Figure 6.
SEM image and location of point EDS analysis of a niobium carbonitride precipitate.
Figure 7.
SEM image of a titanium oxide inclusion and the EDS elemental distribution mapping of Ti and O.
Figure 7.
SEM image of a titanium oxide inclusion and the EDS elemental distribution mapping of Ti and O.
Figure 8.
SEM image of a complex inclusion of yttrium silicate, manganese sulfide, and aluminum oxide and the EDS elemental distribution mapping of yttrium, oxygen, silicon, aluminum, manganese, and sulfur.
Figure 8.
SEM image of a complex inclusion of yttrium silicate, manganese sulfide, and aluminum oxide and the EDS elemental distribution mapping of yttrium, oxygen, silicon, aluminum, manganese, and sulfur.
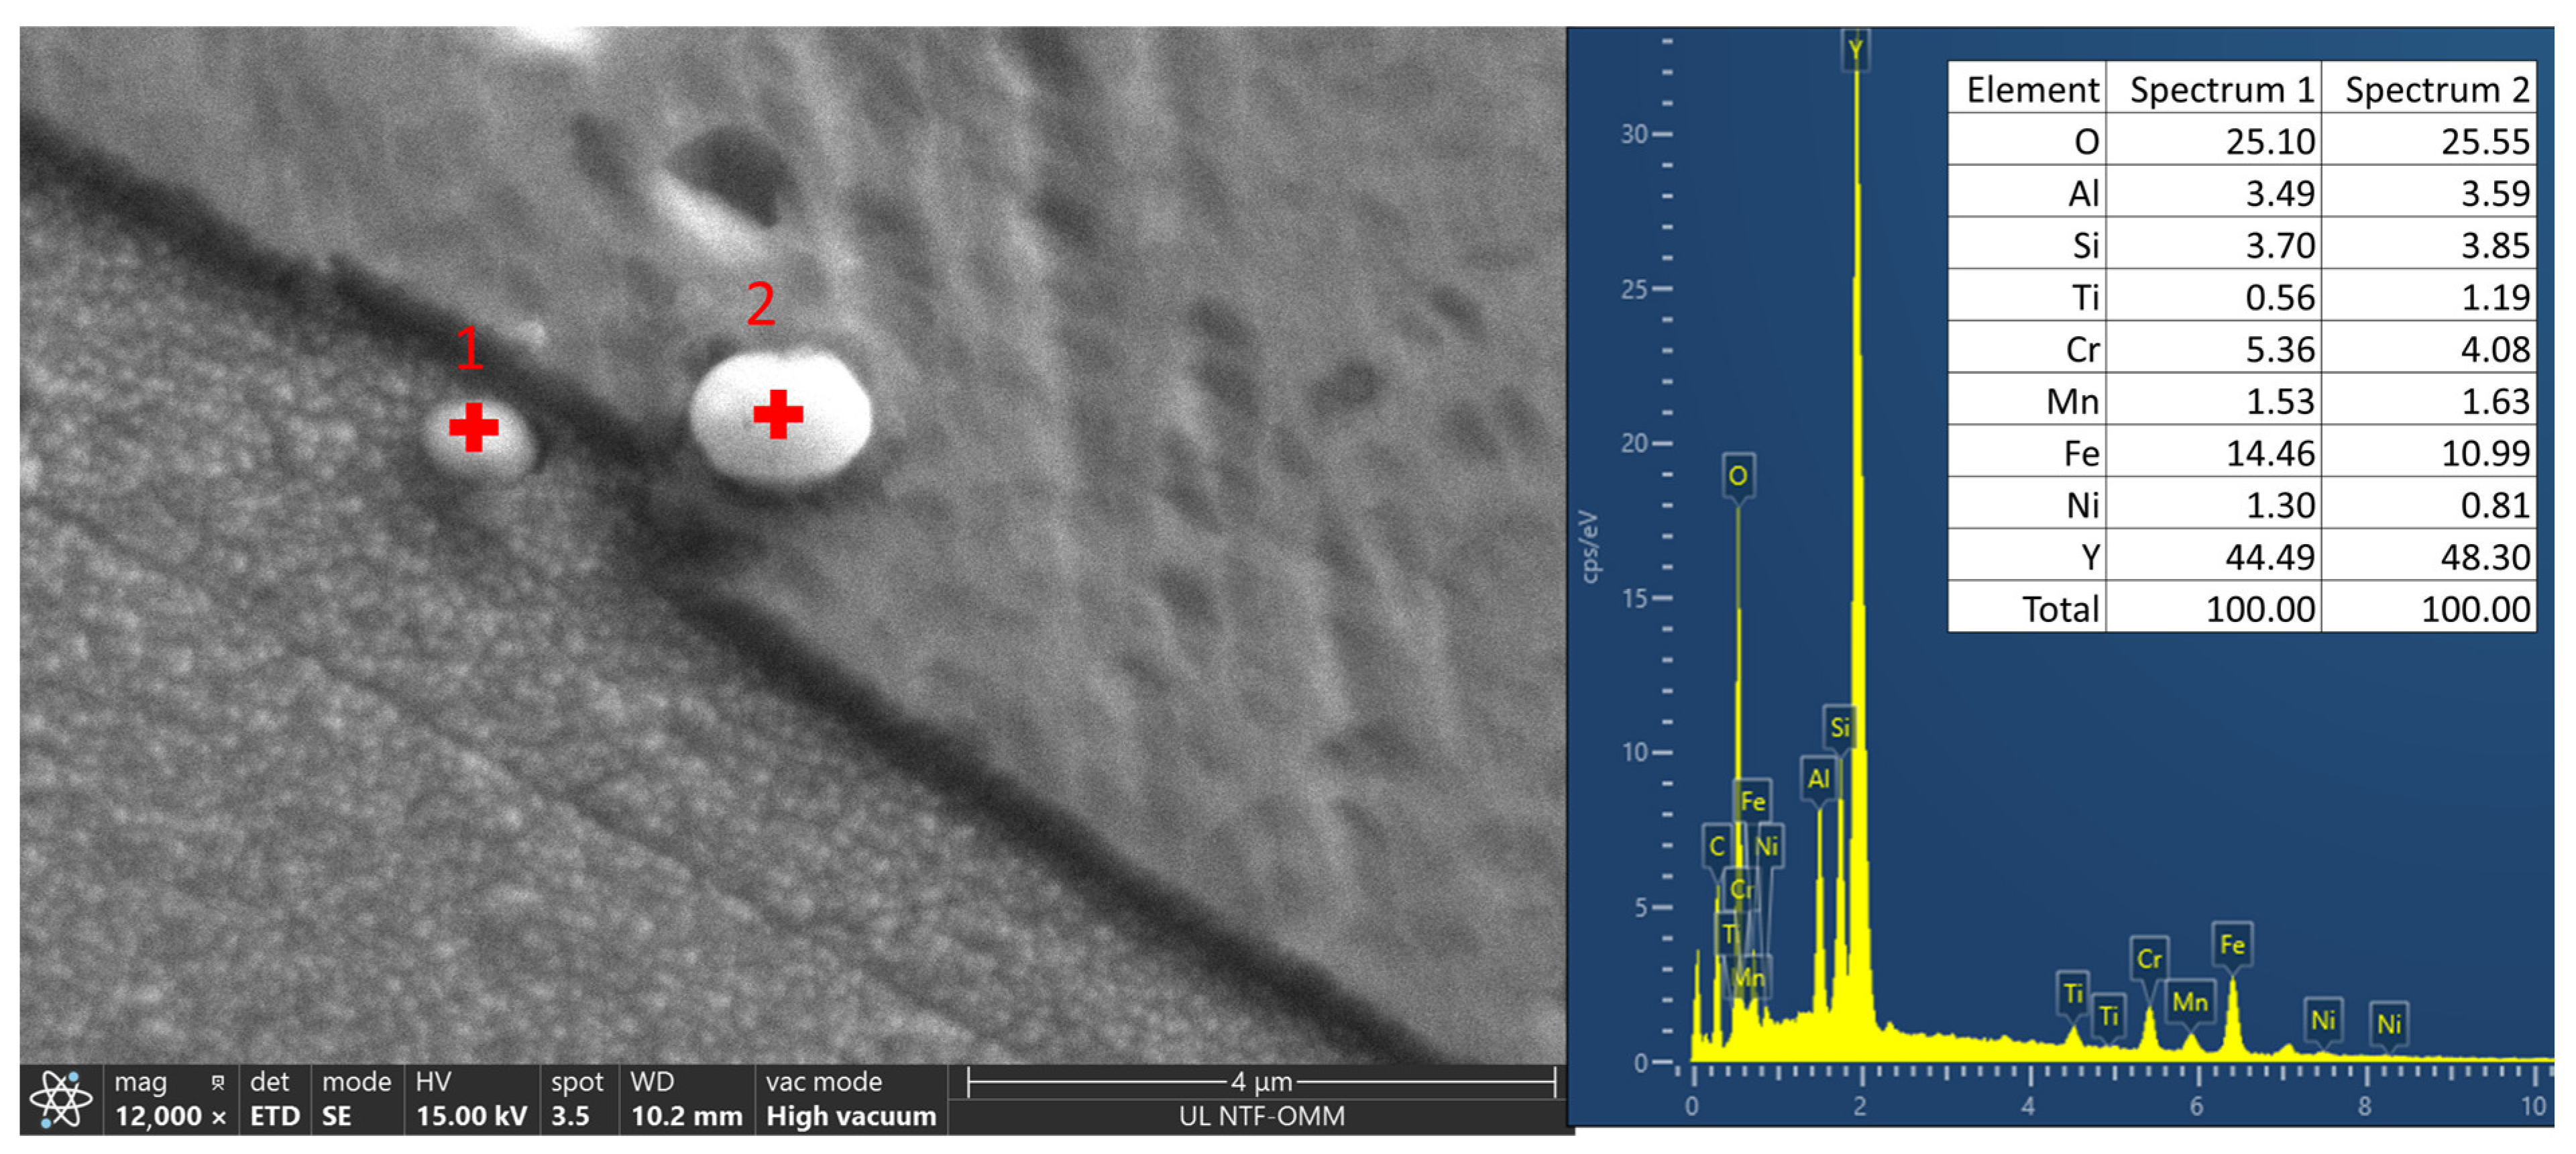
Figure 9.
SEM image of yttrium oxides on a grain boundary with elemental analysis.
Figure 9.
SEM image of yttrium oxides on a grain boundary with elemental analysis.
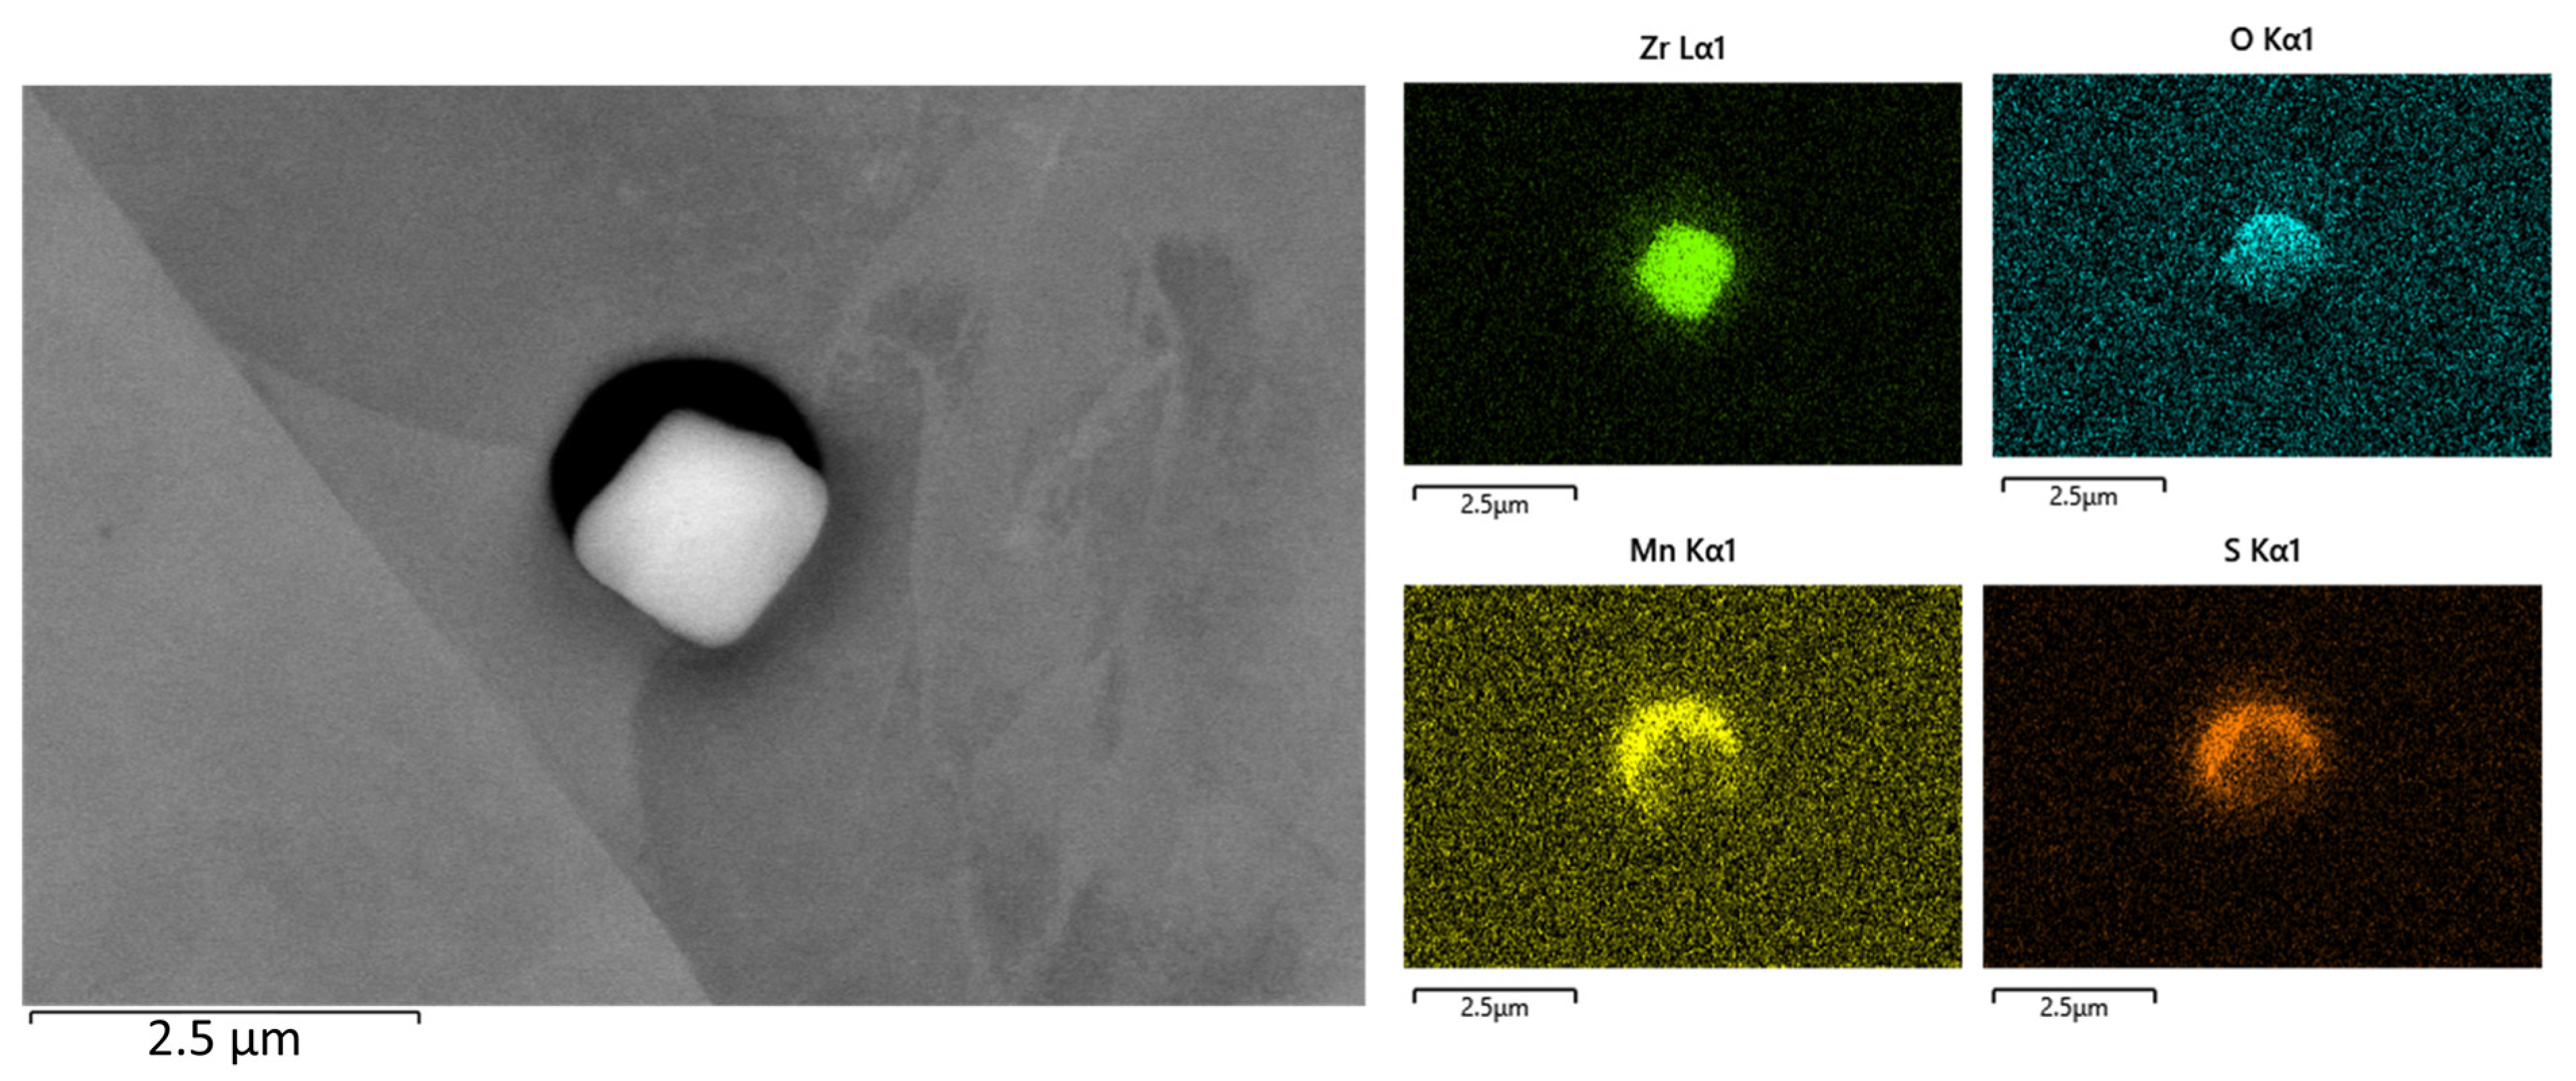
Figure 10.
SEM image of a zirconium oxide and manganese sulfide inclusion and the EDS elemental distribution mapping of zirconium, oxygen, manganese, and sulfur.
Figure 10.
SEM image of a zirconium oxide and manganese sulfide inclusion and the EDS elemental distribution mapping of zirconium, oxygen, manganese, and sulfur.
Figure 11.
Example of a bimodal crystal grain size distribution.
Figure 11.
Example of a bimodal crystal grain size distribution.
Figure 12.
An exceptionally large austenitic crystal grain with a twin (grain boundary outlined with red).
Figure 12.
An exceptionally large austenitic crystal grain with a twin (grain boundary outlined with red).
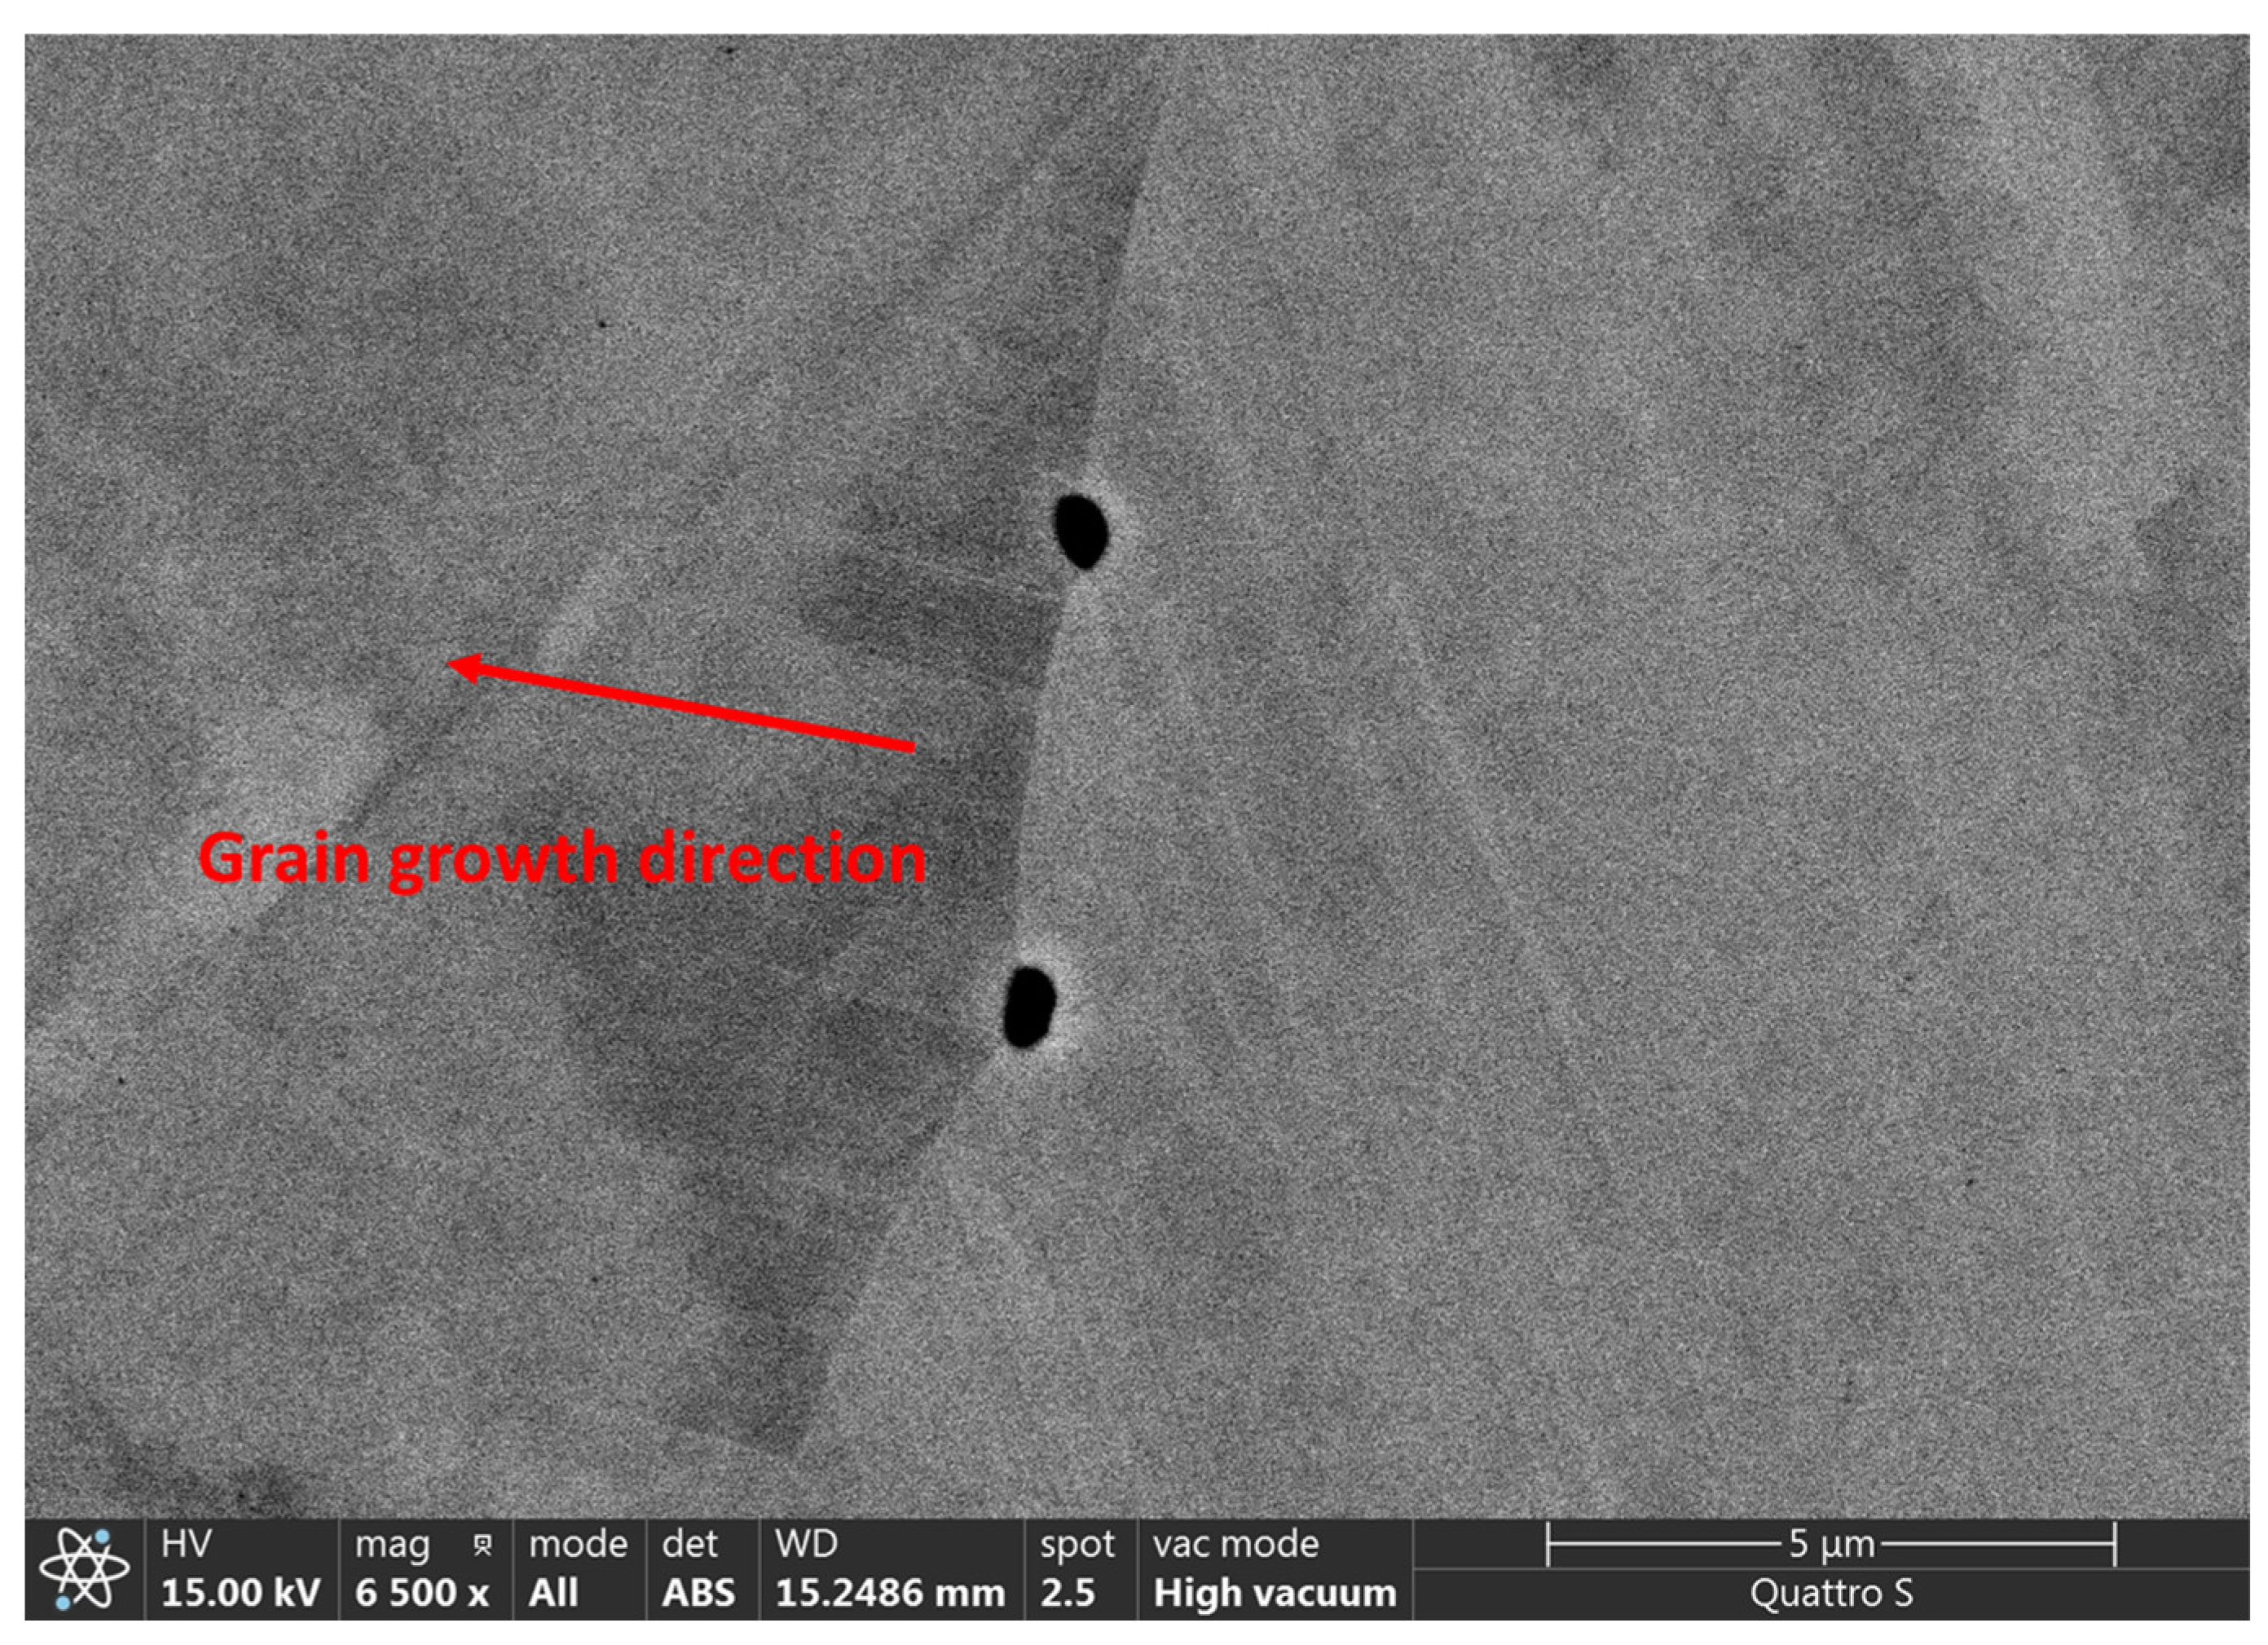
Figure 13.
SEM image of Ti(C,N) precipitates on a grain boundary with the direction of grain growth indicated.
Figure 13.
SEM image of Ti(C,N) precipitates on a grain boundary with the direction of grain growth indicated.
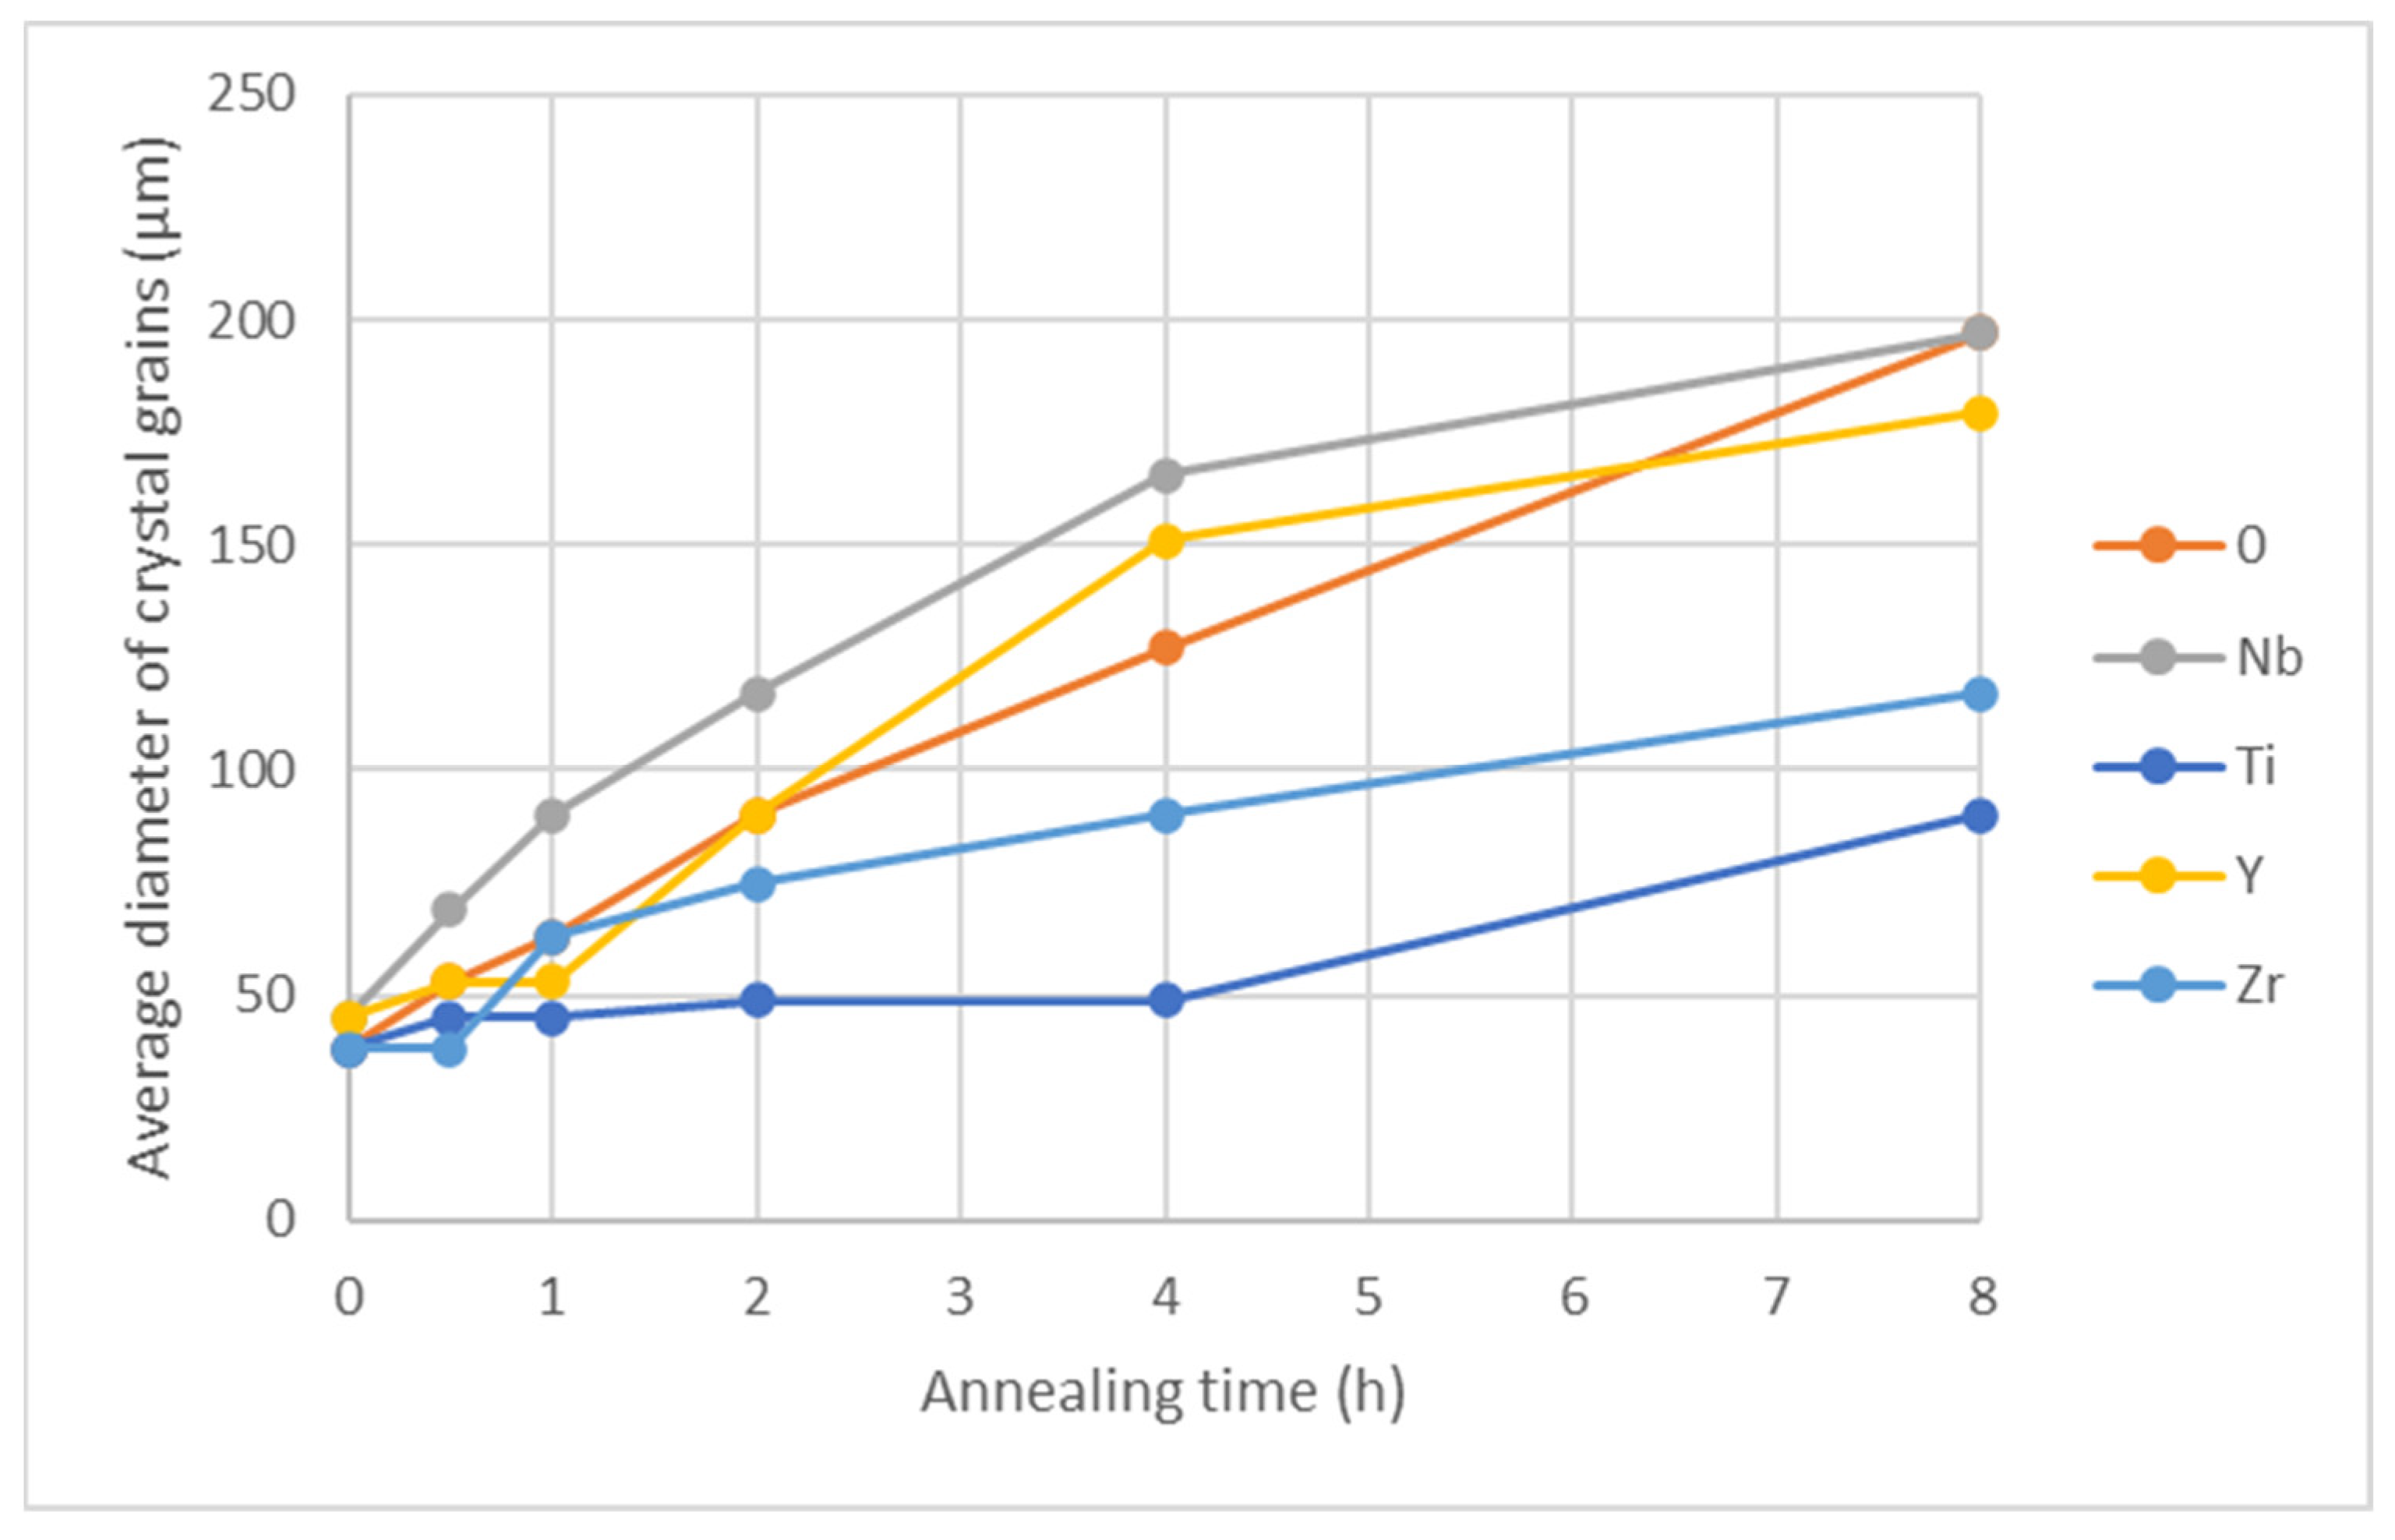
Figure 14.
Crystal grain size as a function of annealing time at 1050 °C.
Figure 14.
Crystal grain size as a function of annealing time at 1050 °C.
Figure 15.
Crystal grain size as a function of annealing time at 1100 °C.
Figure 15.
Crystal grain size as a function of annealing time at 1100 °C.
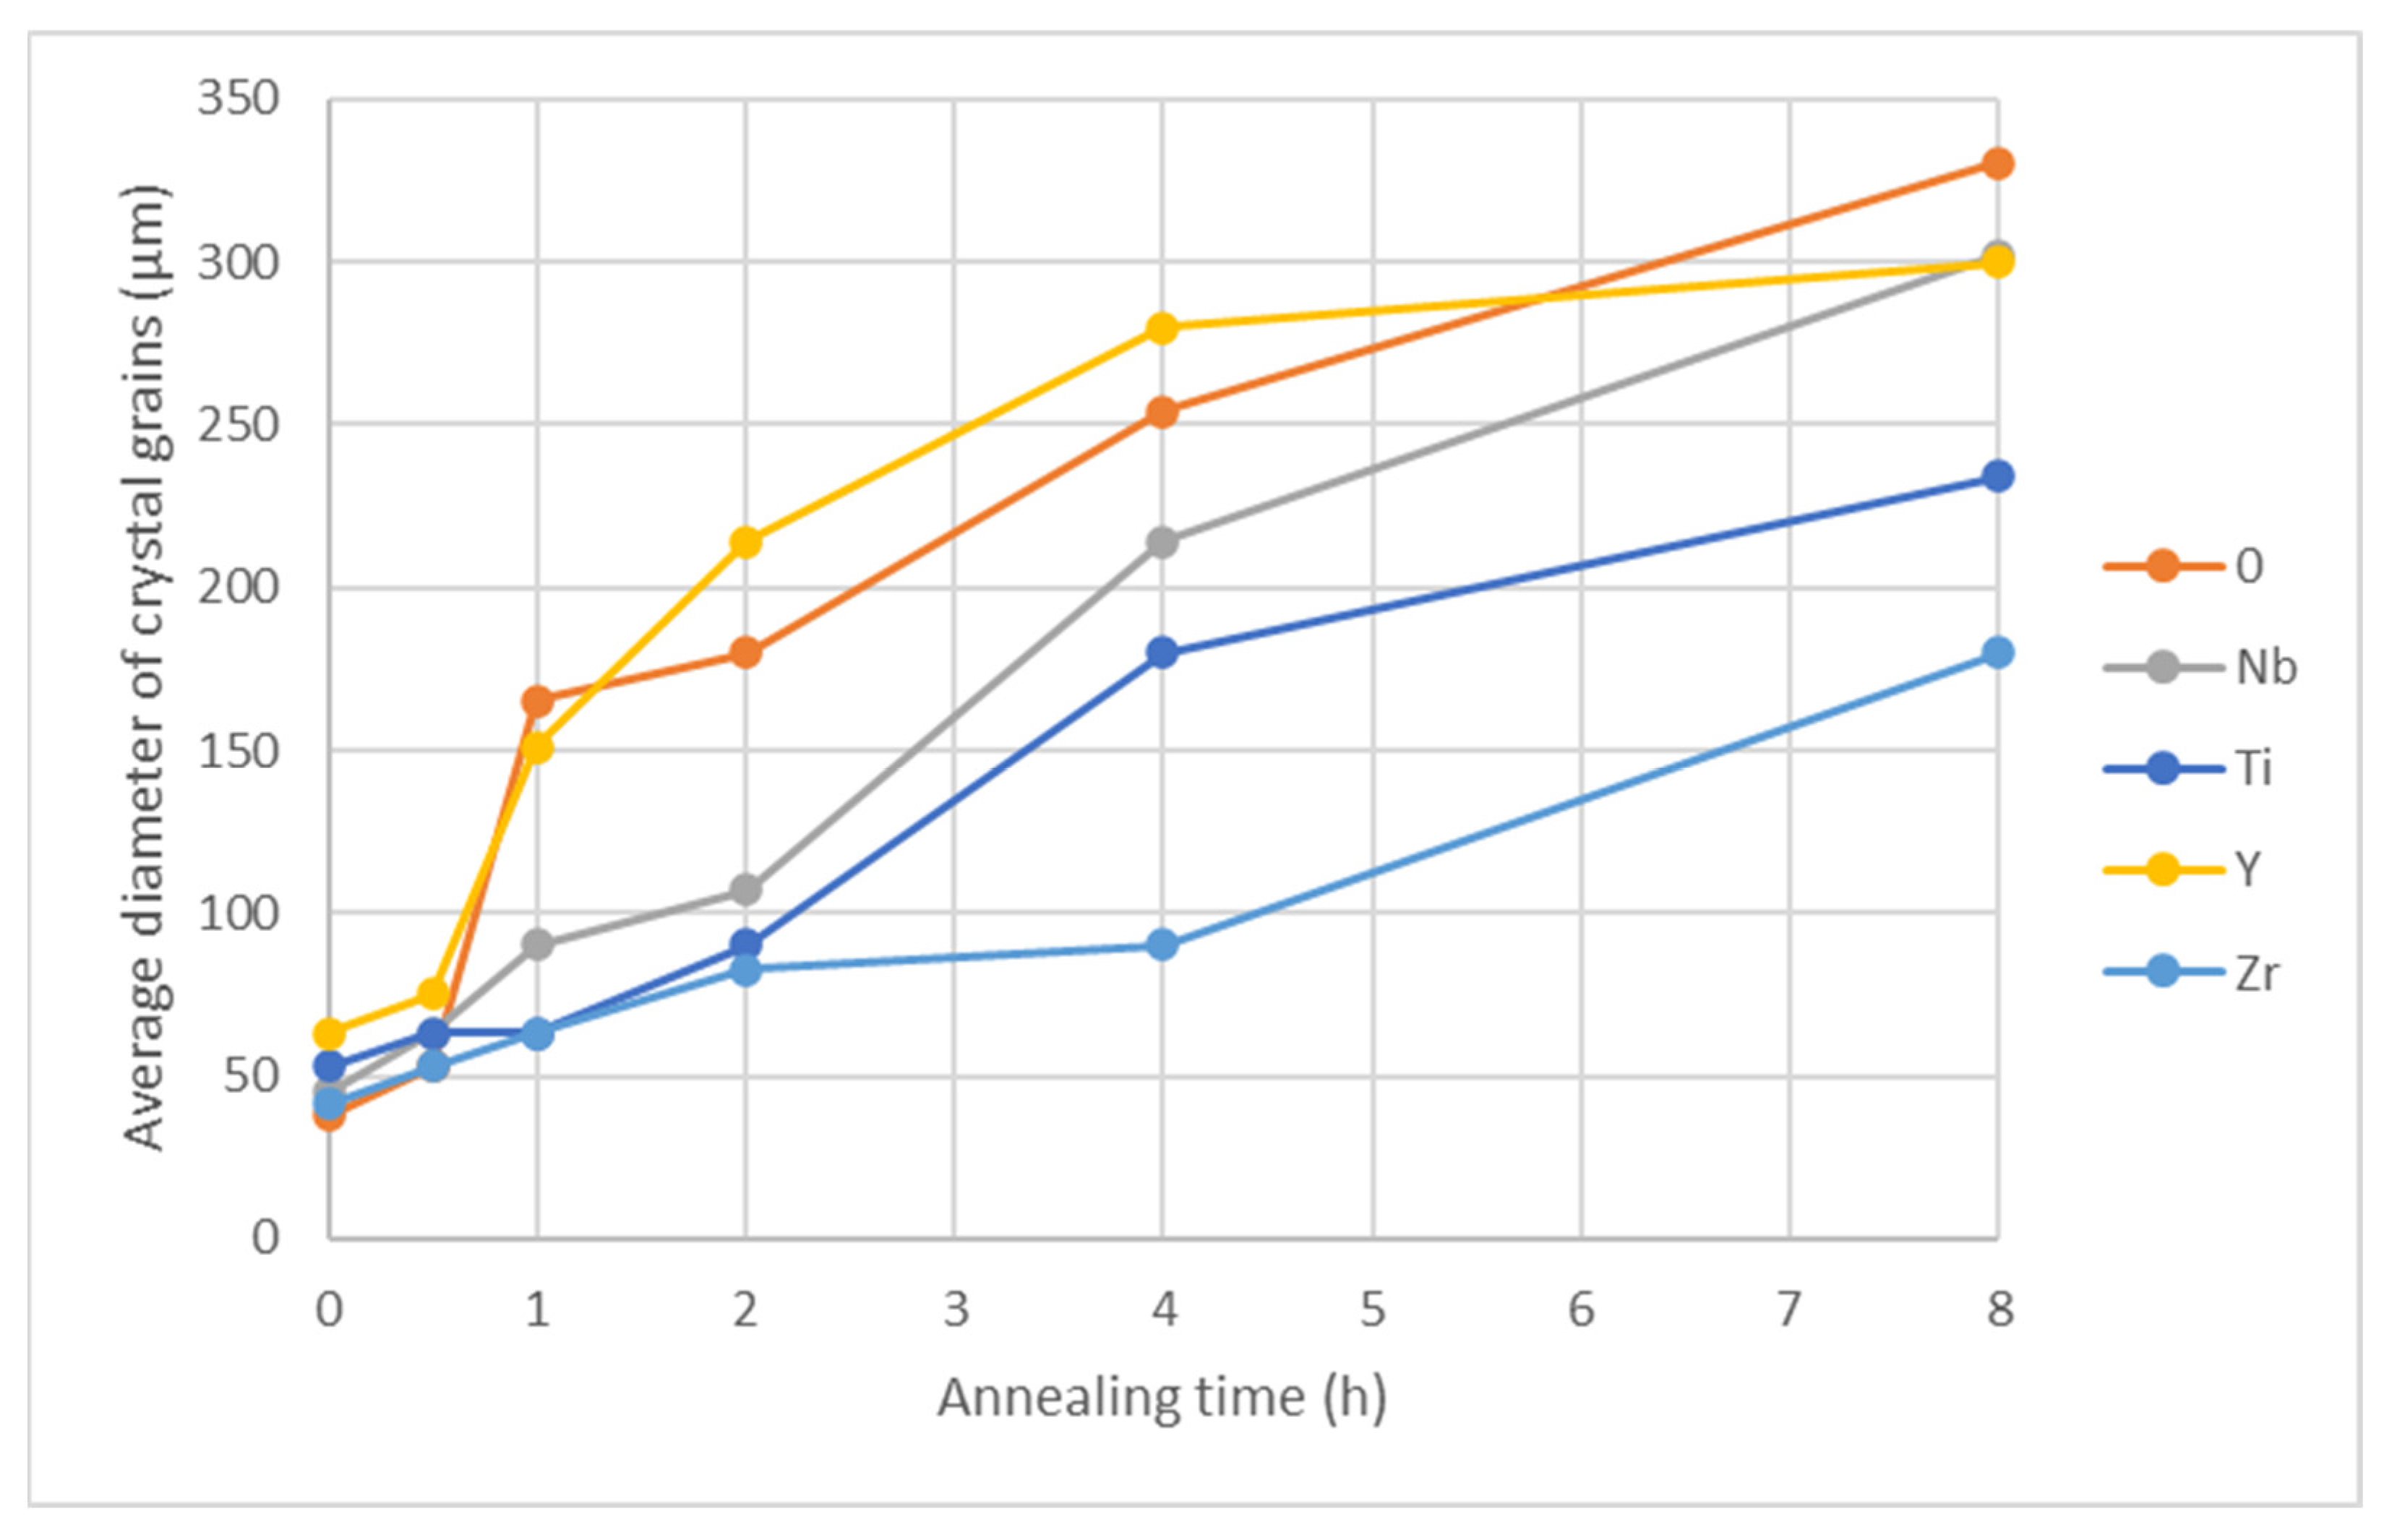
Figure 16.
Crystal grain size as a function of annealing time at 1150 °C.
Figure 16.
Crystal grain size as a function of annealing time at 1150 °C.
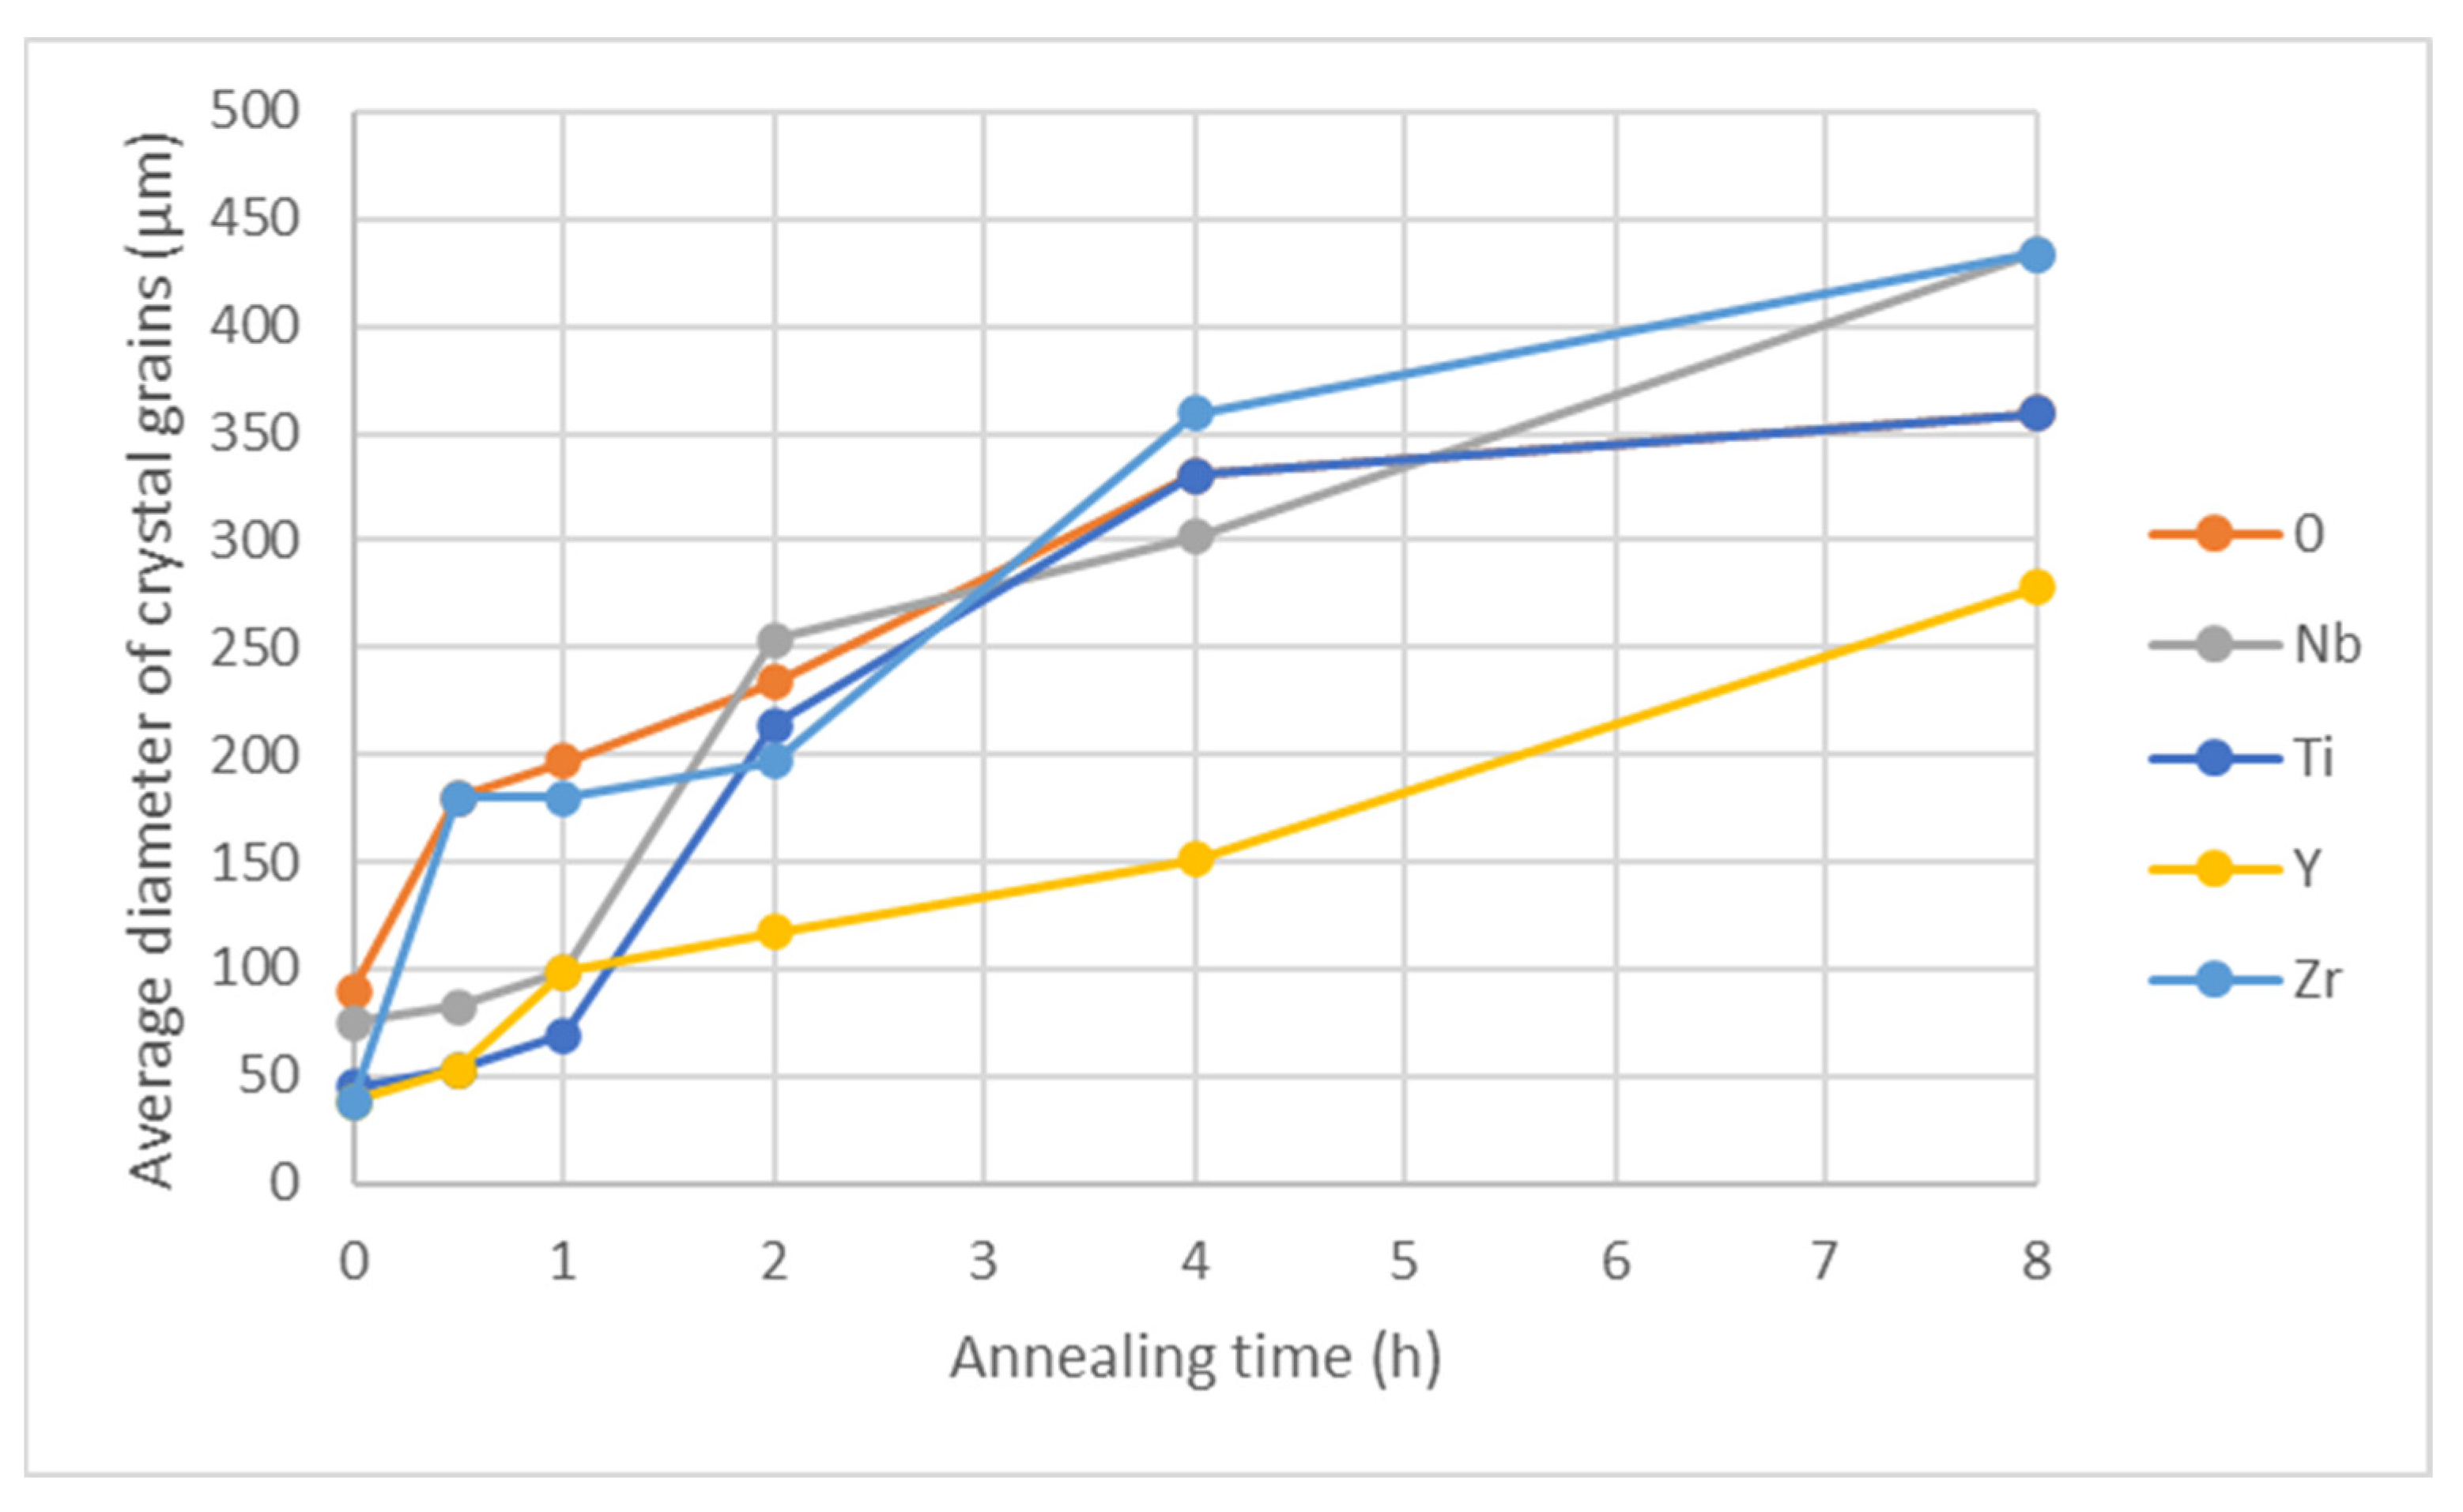
Figure 17.
Crystal grain size as a function of annealing time at 1200 °C.
Figure 17.
Crystal grain size as a function of annealing time at 1200 °C.
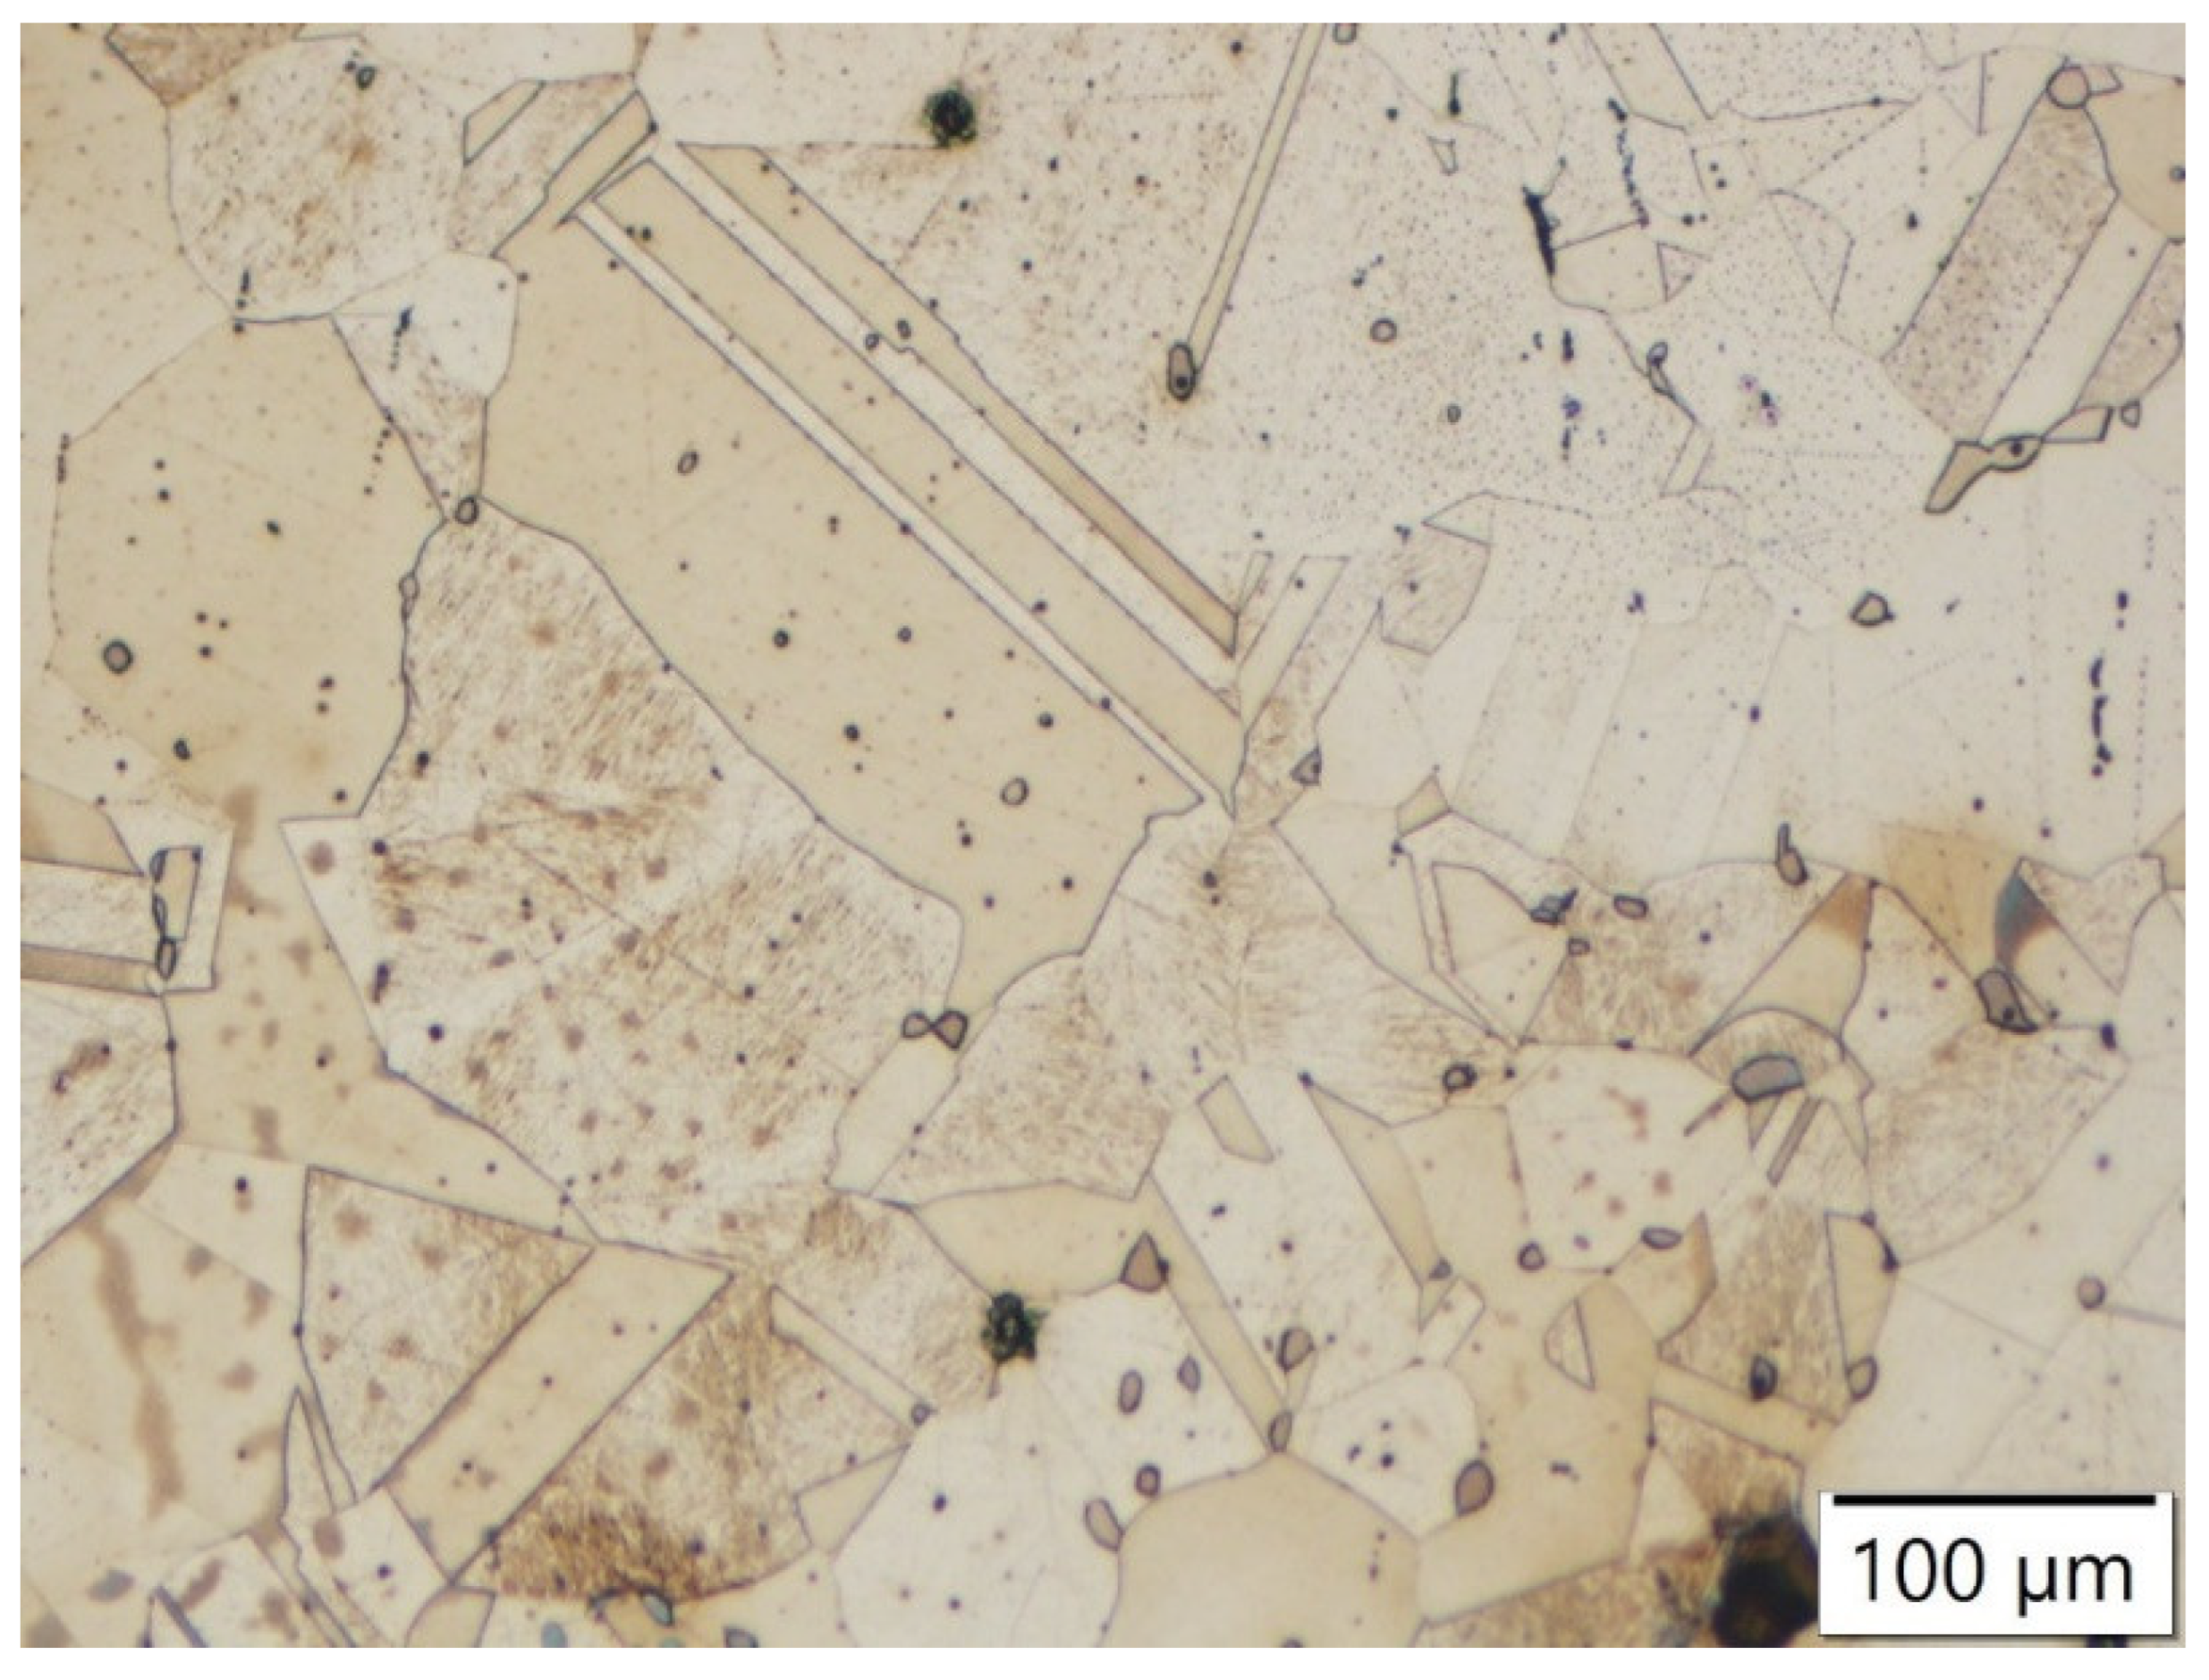
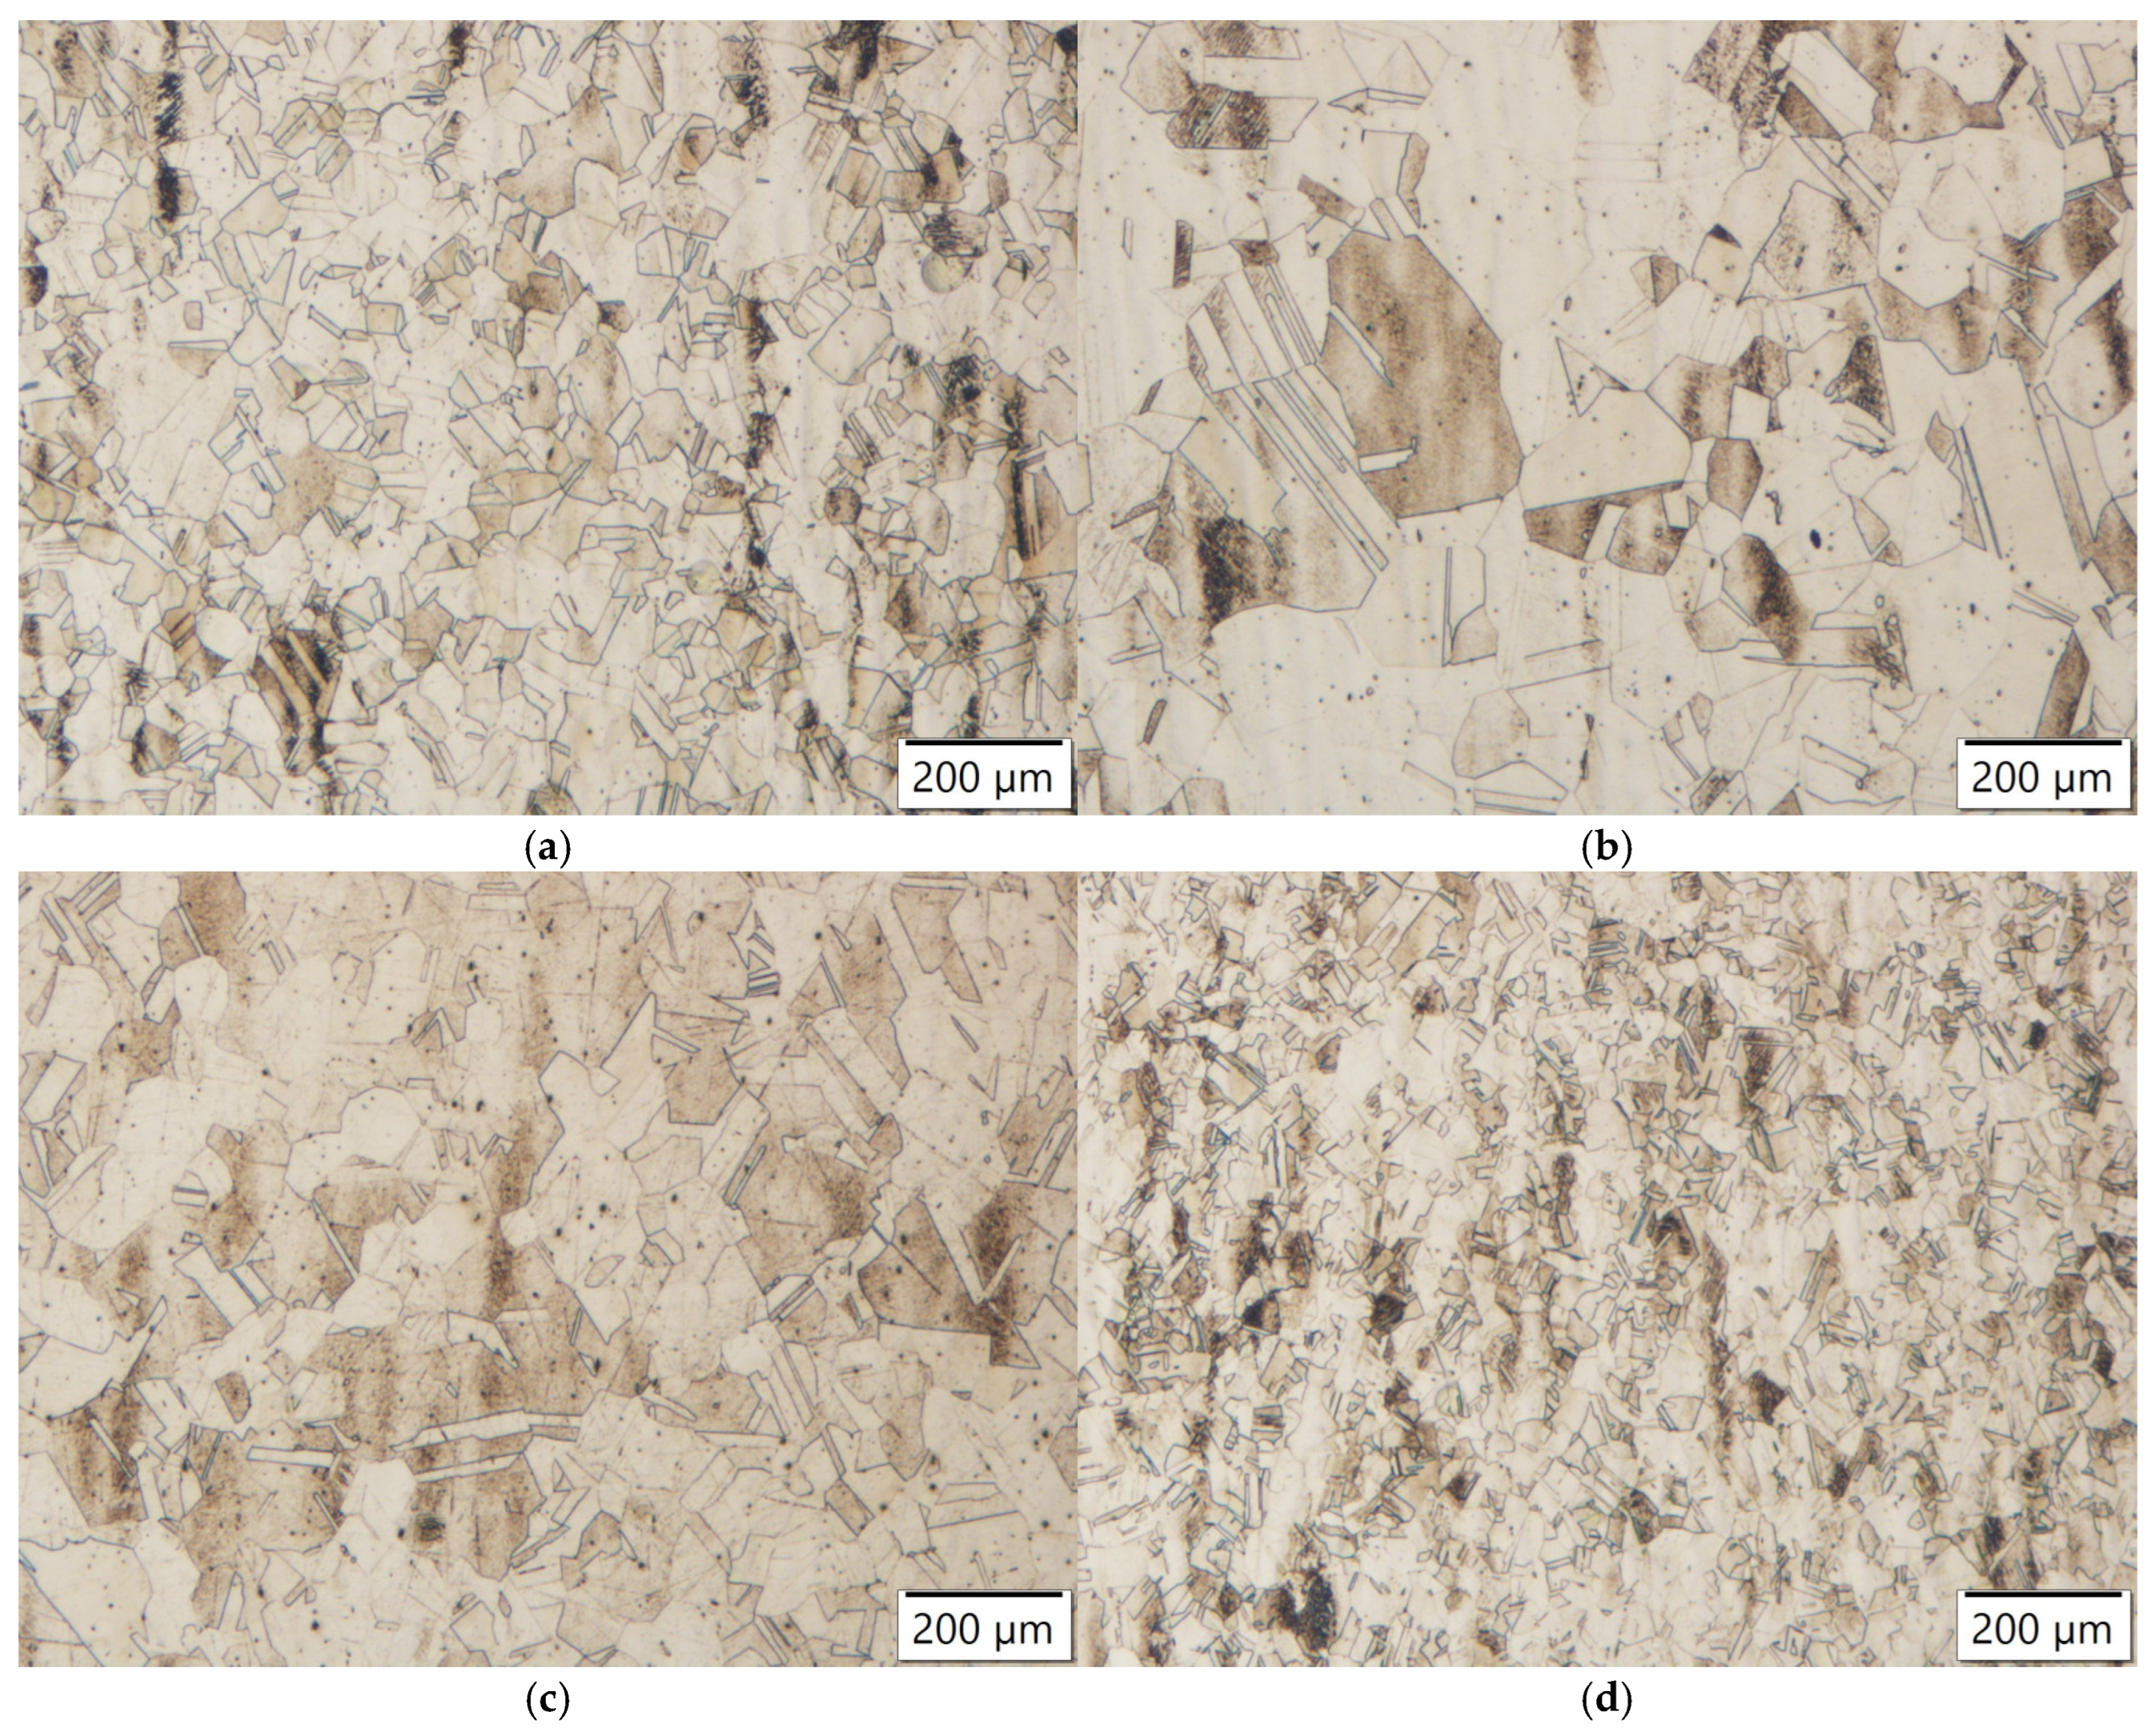
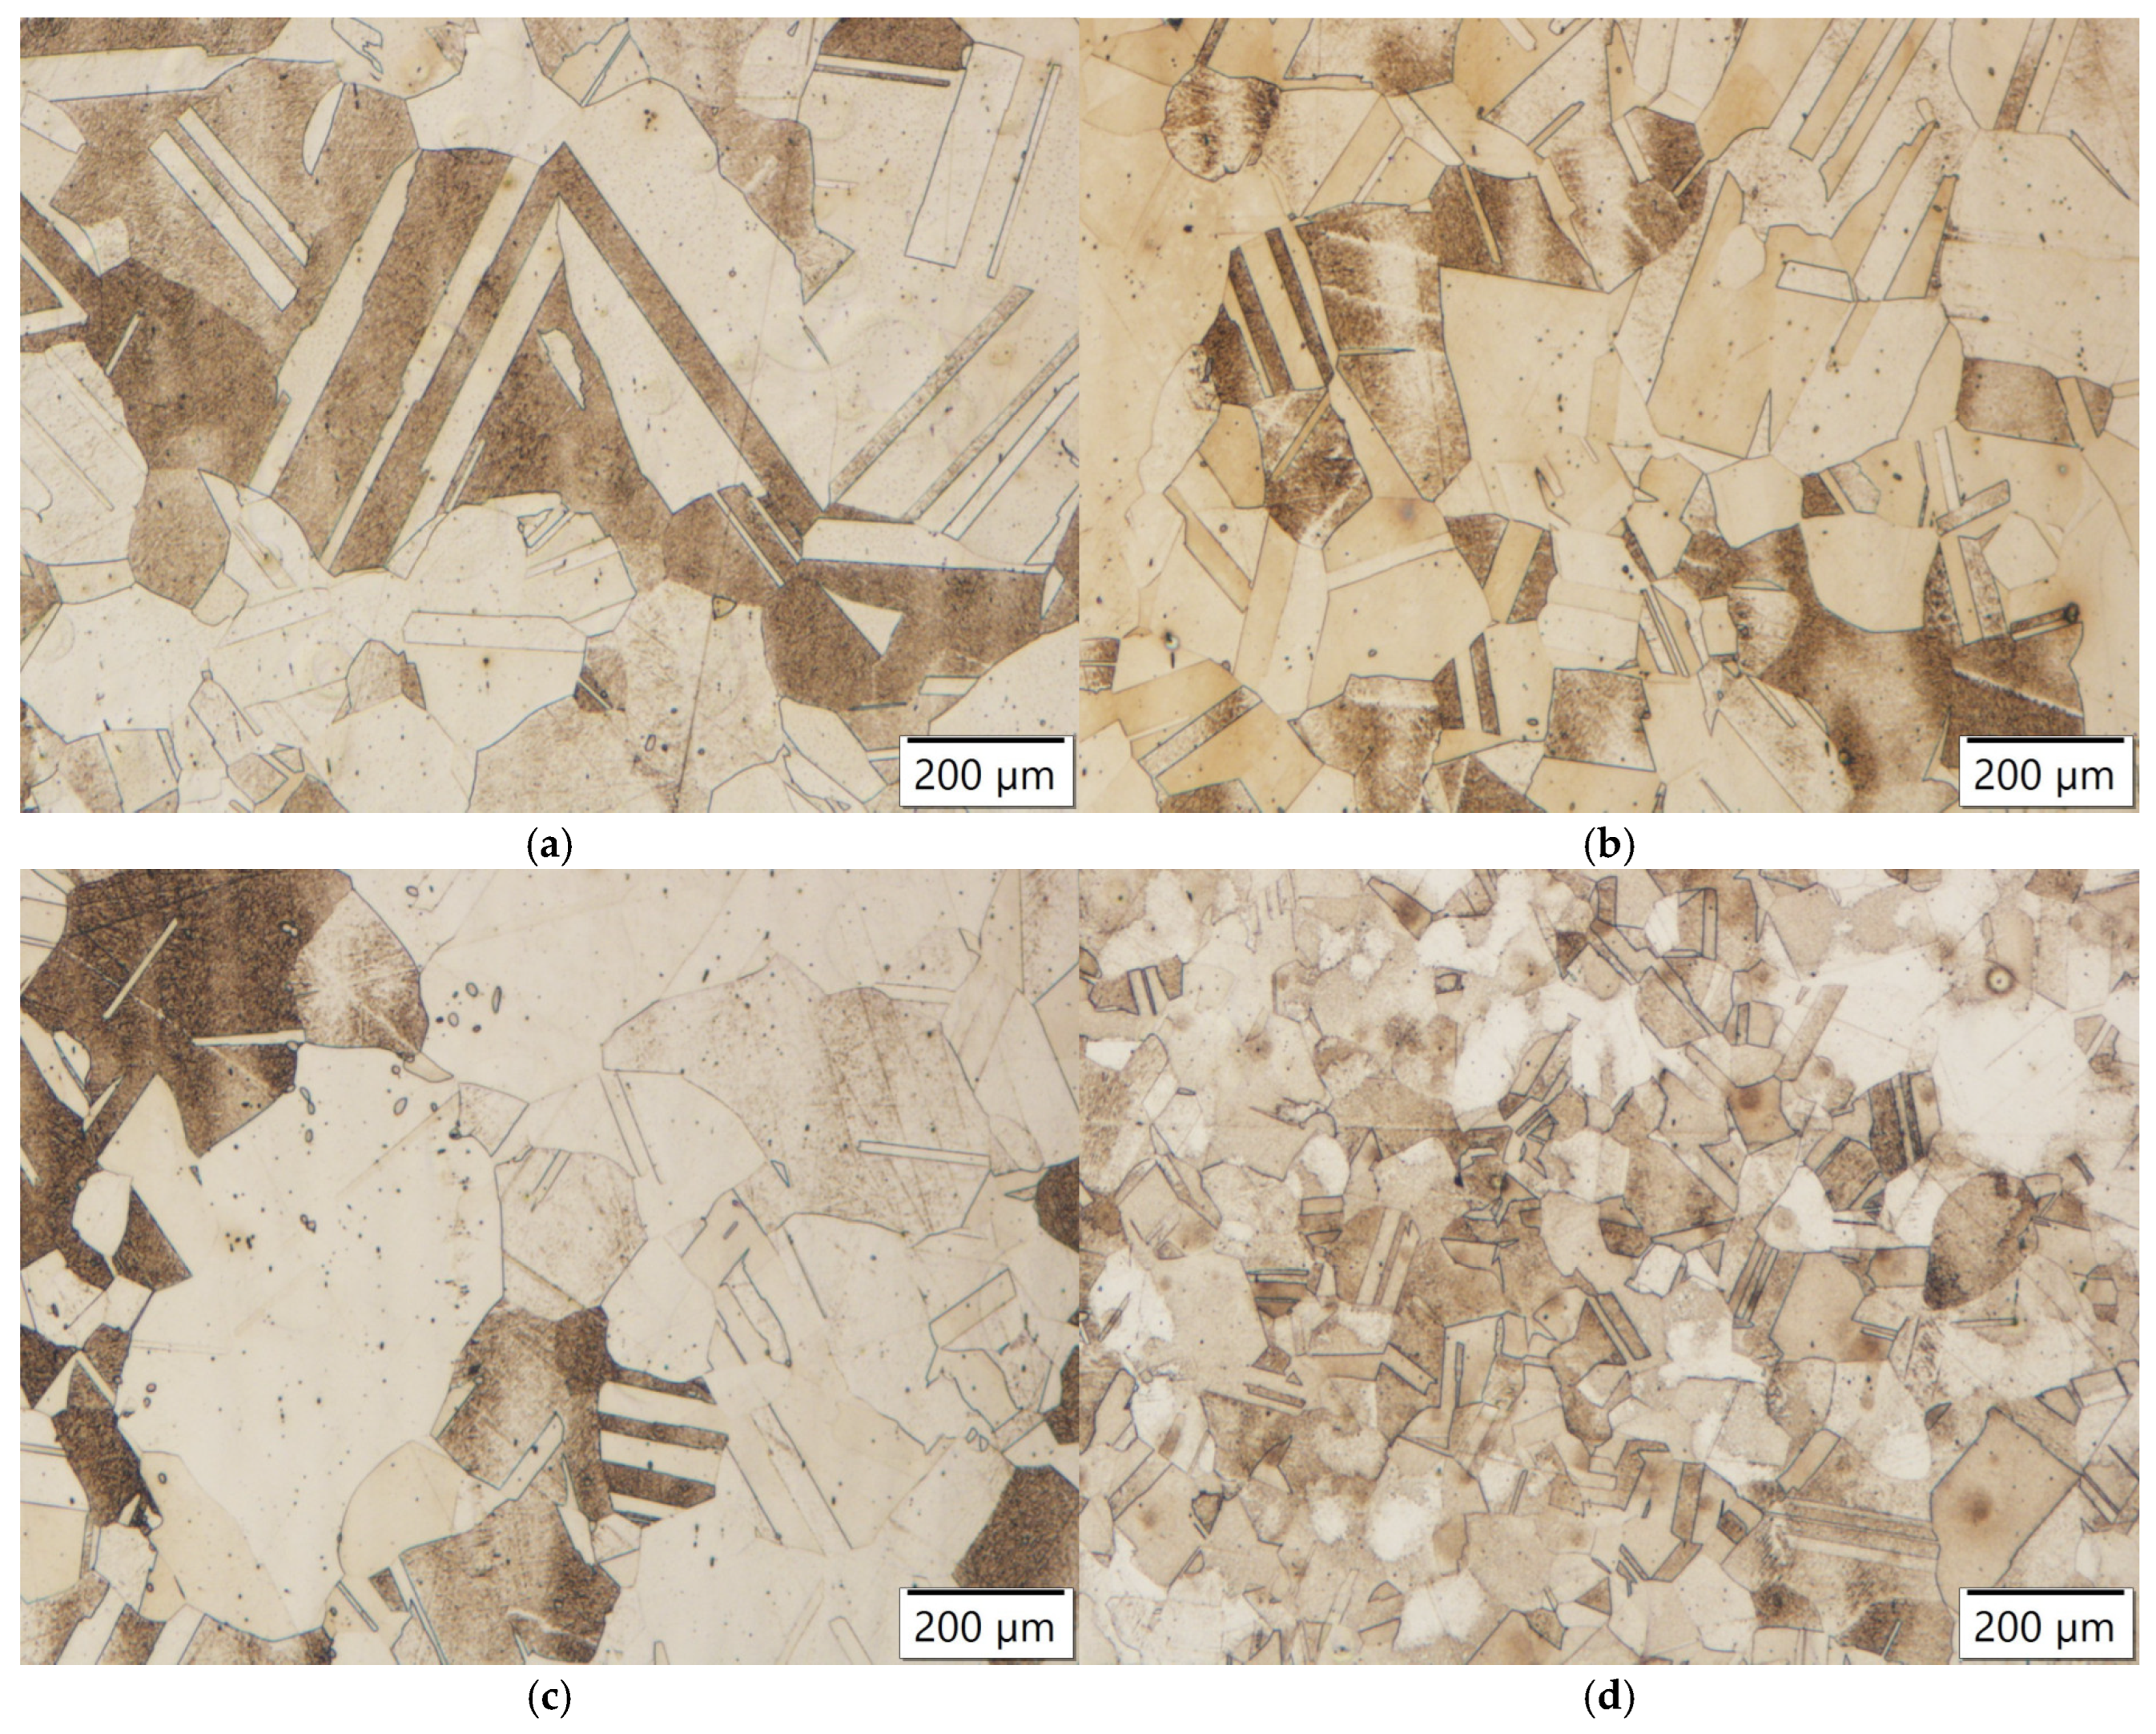
Figure 18.
Microstructures of steel samples annealed at 1050 °C for 8 h: (a) Ti-alloyed steel; (b) reference steel; (c) Zr-alloyed steel (d) Y-alloyed steel.
Figure 18.
Microstructures of steel samples annealed at 1050 °C for 8 h: (a) Ti-alloyed steel; (b) reference steel; (c) Zr-alloyed steel (d) Y-alloyed steel.
Figure 19.
Microstructures of steel samples annealed at 1100 °C for 4 h: (a) Ti-alloyed steel; (b) Nb-alloyed steel; (c) Zr-alloyed steel; (d) Y-alloyed steel.
Figure 19.
Microstructures of steel samples annealed at 1100 °C for 4 h: (a) Ti-alloyed steel; (b) Nb-alloyed steel; (c) Zr-alloyed steel; (d) Y-alloyed steel.
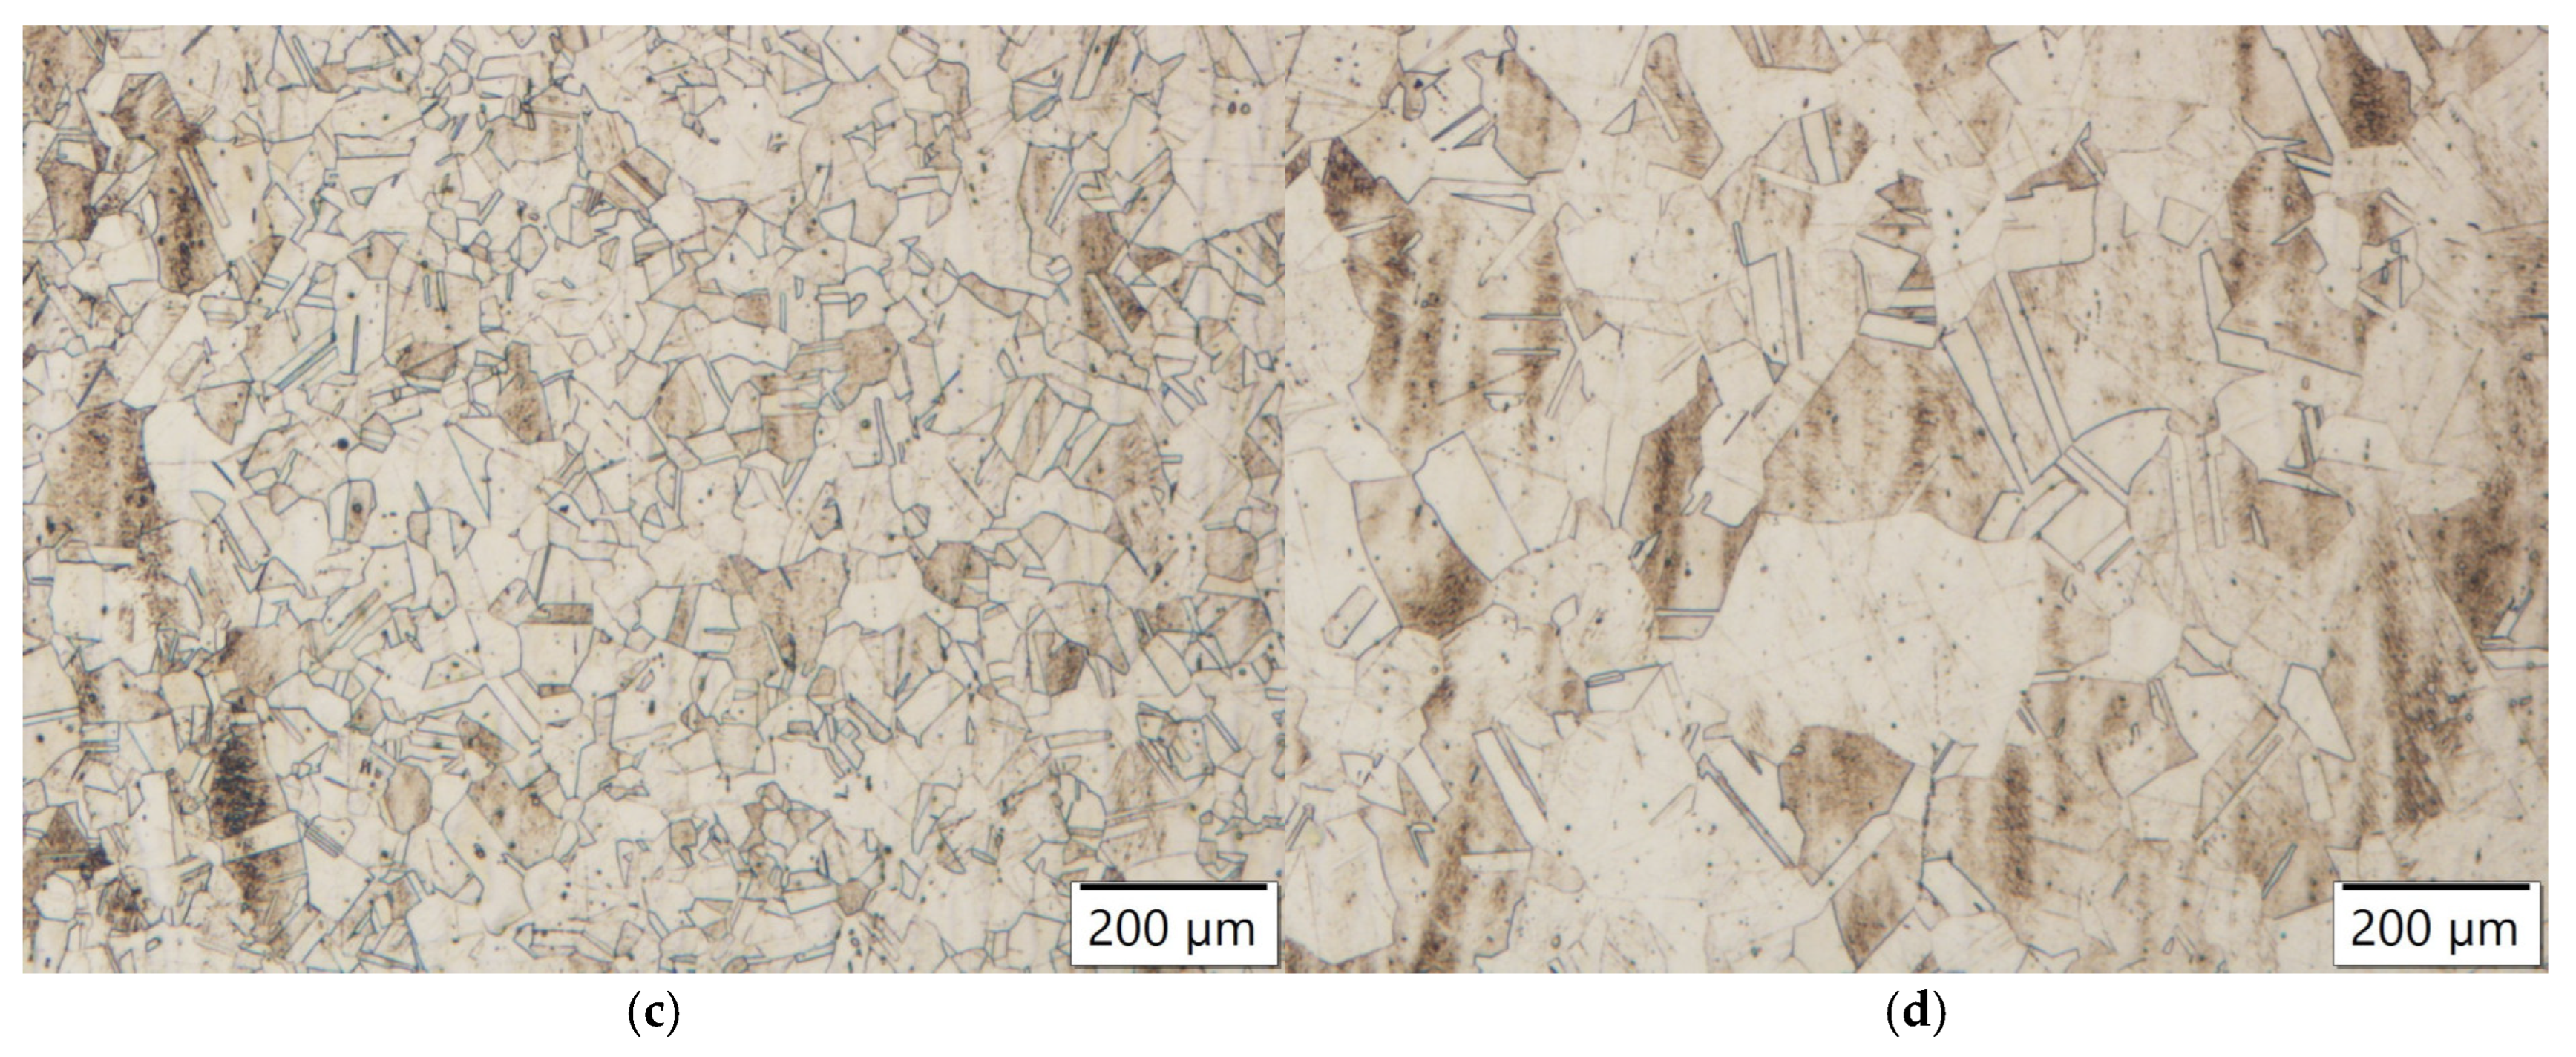
Figure 20.
Microstructures of samples annealed at 1150 °C for 4 h: (a) Zr-alloyed steel; (b) reference steel; (c) Nb-alloyed steel; (d) Ti-alloyed steel.
Figure 20.
Microstructures of samples annealed at 1150 °C for 4 h: (a) Zr-alloyed steel; (b) reference steel; (c) Nb-alloyed steel; (d) Ti-alloyed steel.
Figure 21.
Microstructures of samples annealed at 1150 °C for 4 h: (a) Zr-alloyed steel, (b) Ti-alloyed steel; (c) reference steel; (d) Y-alloyed steel.
Figure 21.
Microstructures of samples annealed at 1150 °C for 4 h: (a) Zr-alloyed steel, (b) Ti-alloyed steel; (c) reference steel; (d) Y-alloyed steel.
Figure 22.
Comparison of experimentally measured austenitic crystal grain size with calculated values as a function of temperature and time, in steel without microalloying elements.
Figure 22.
Comparison of experimentally measured austenitic crystal grain size with calculated values as a function of temperature and time, in steel without microalloying elements.
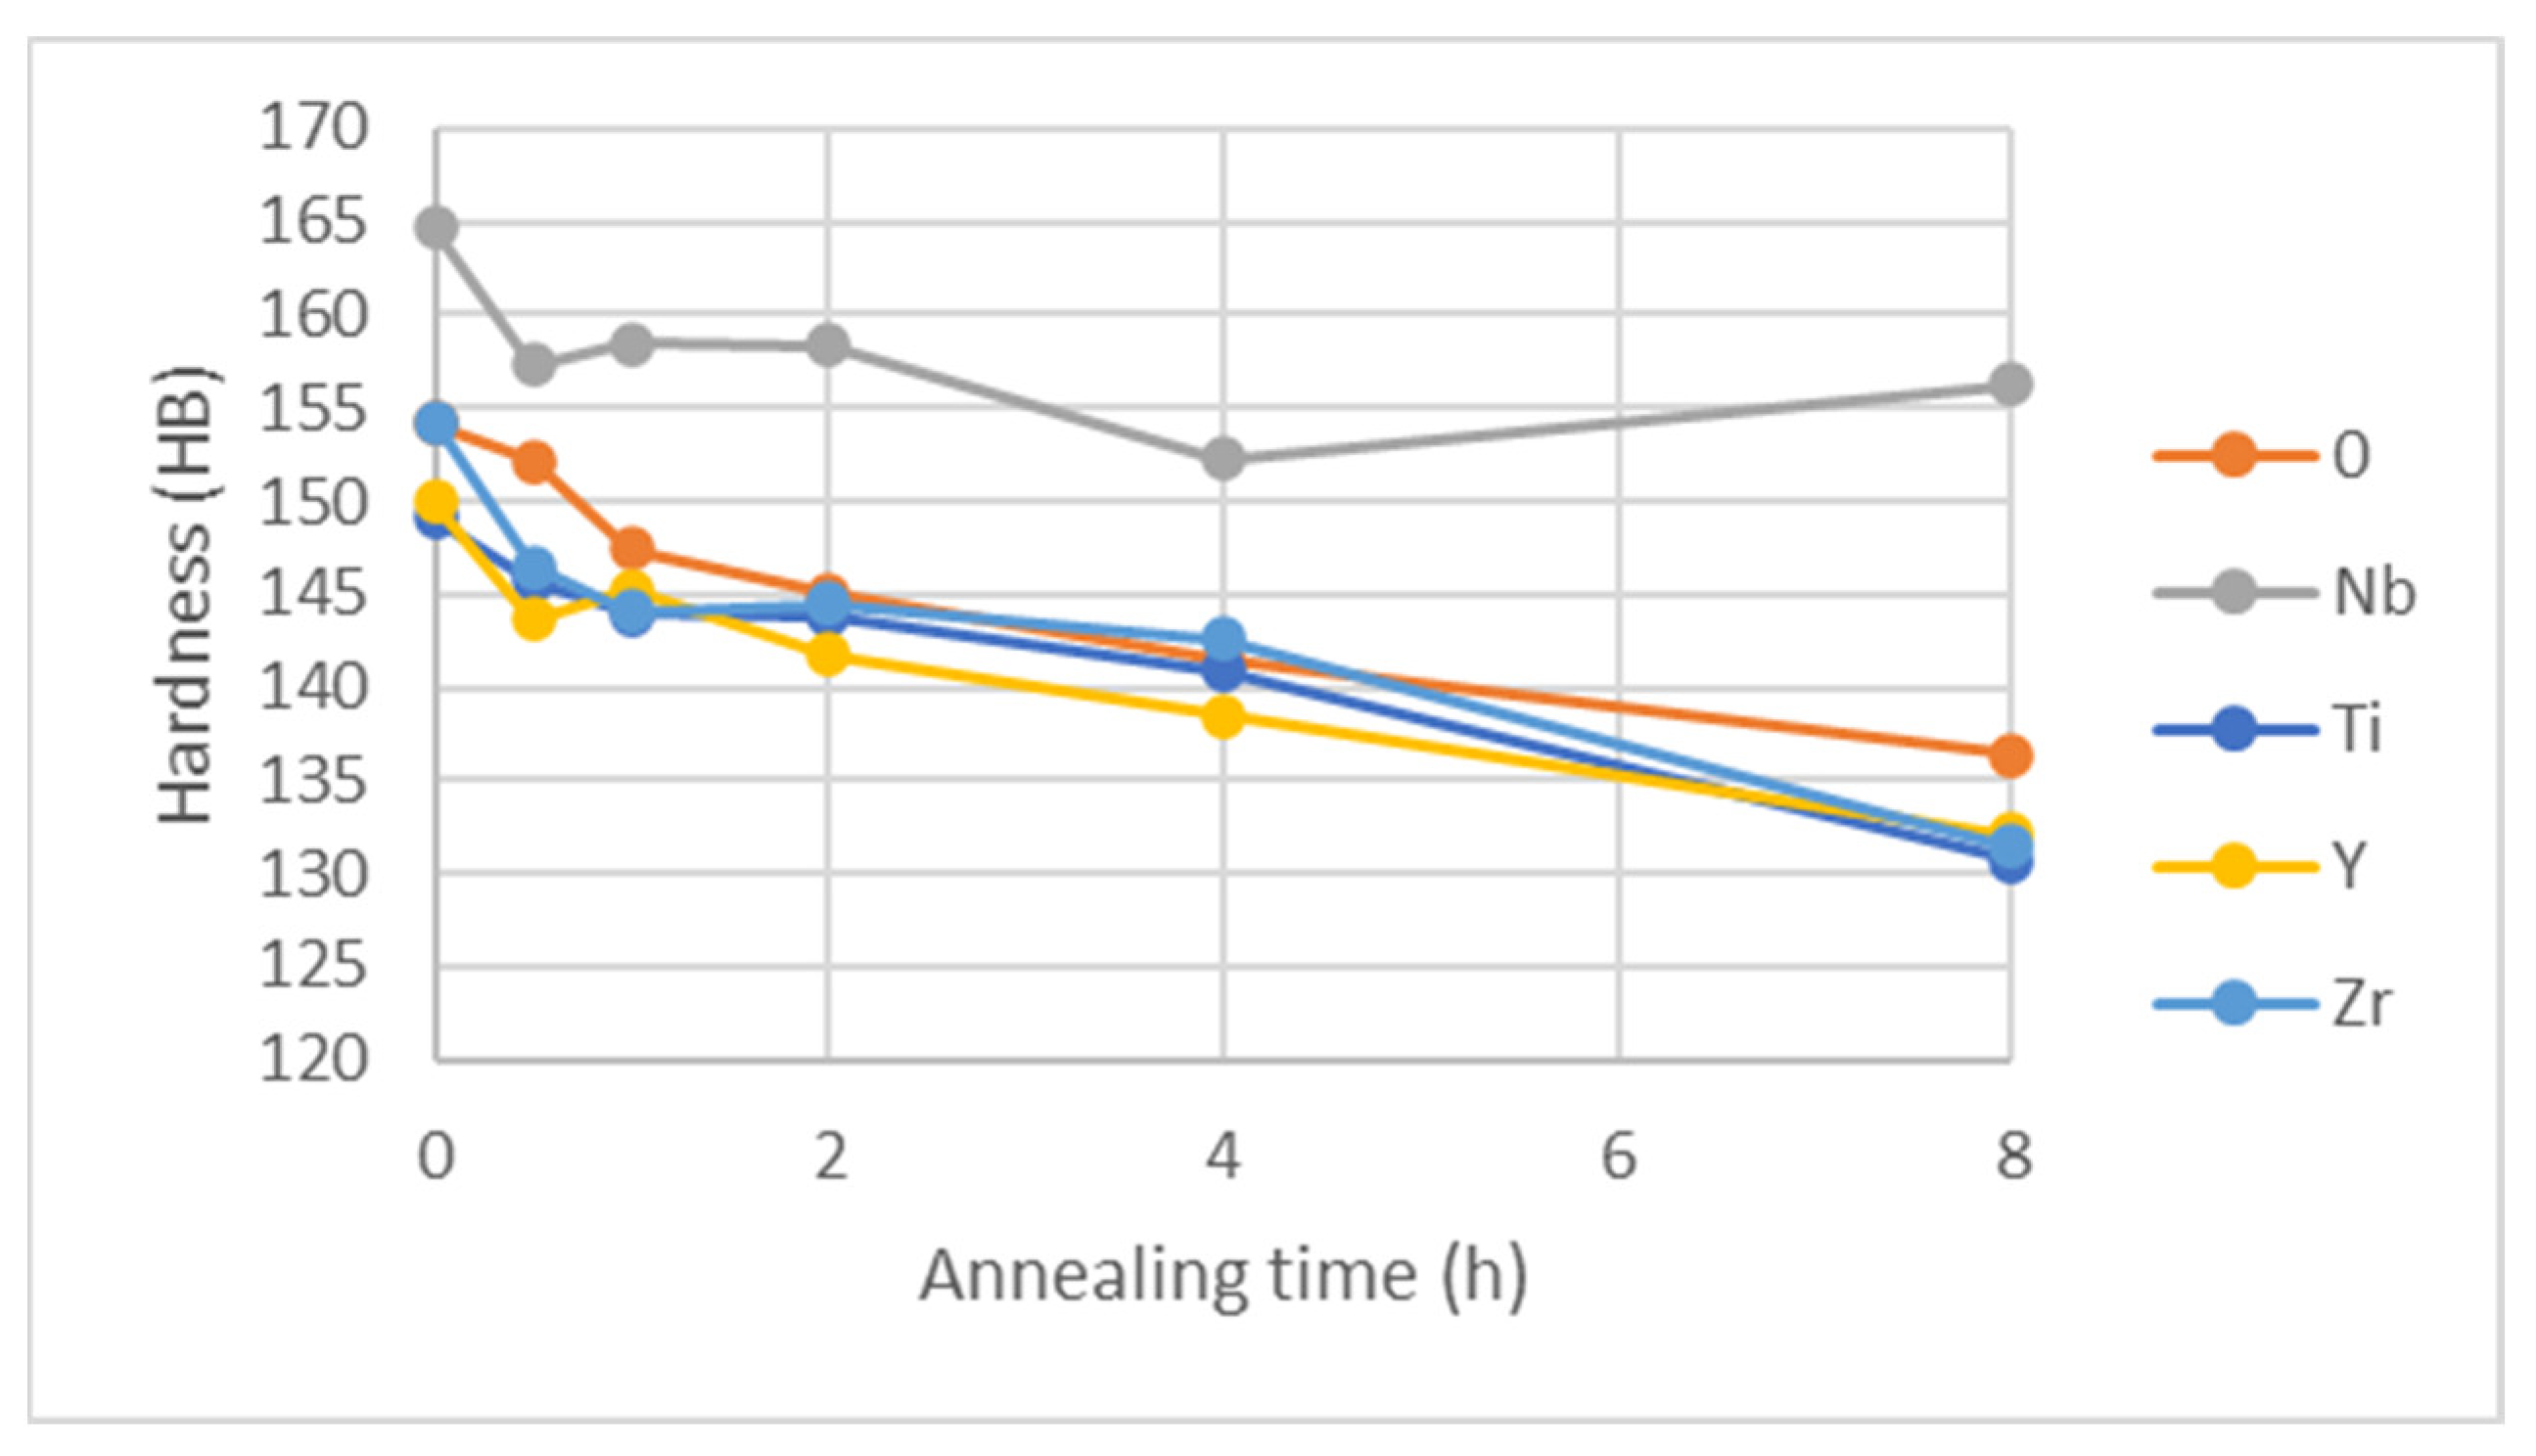
Figure 23.
Brinell hardness for samples annealed at 1050 °C.
Figure 23.
Brinell hardness for samples annealed at 1050 °C.
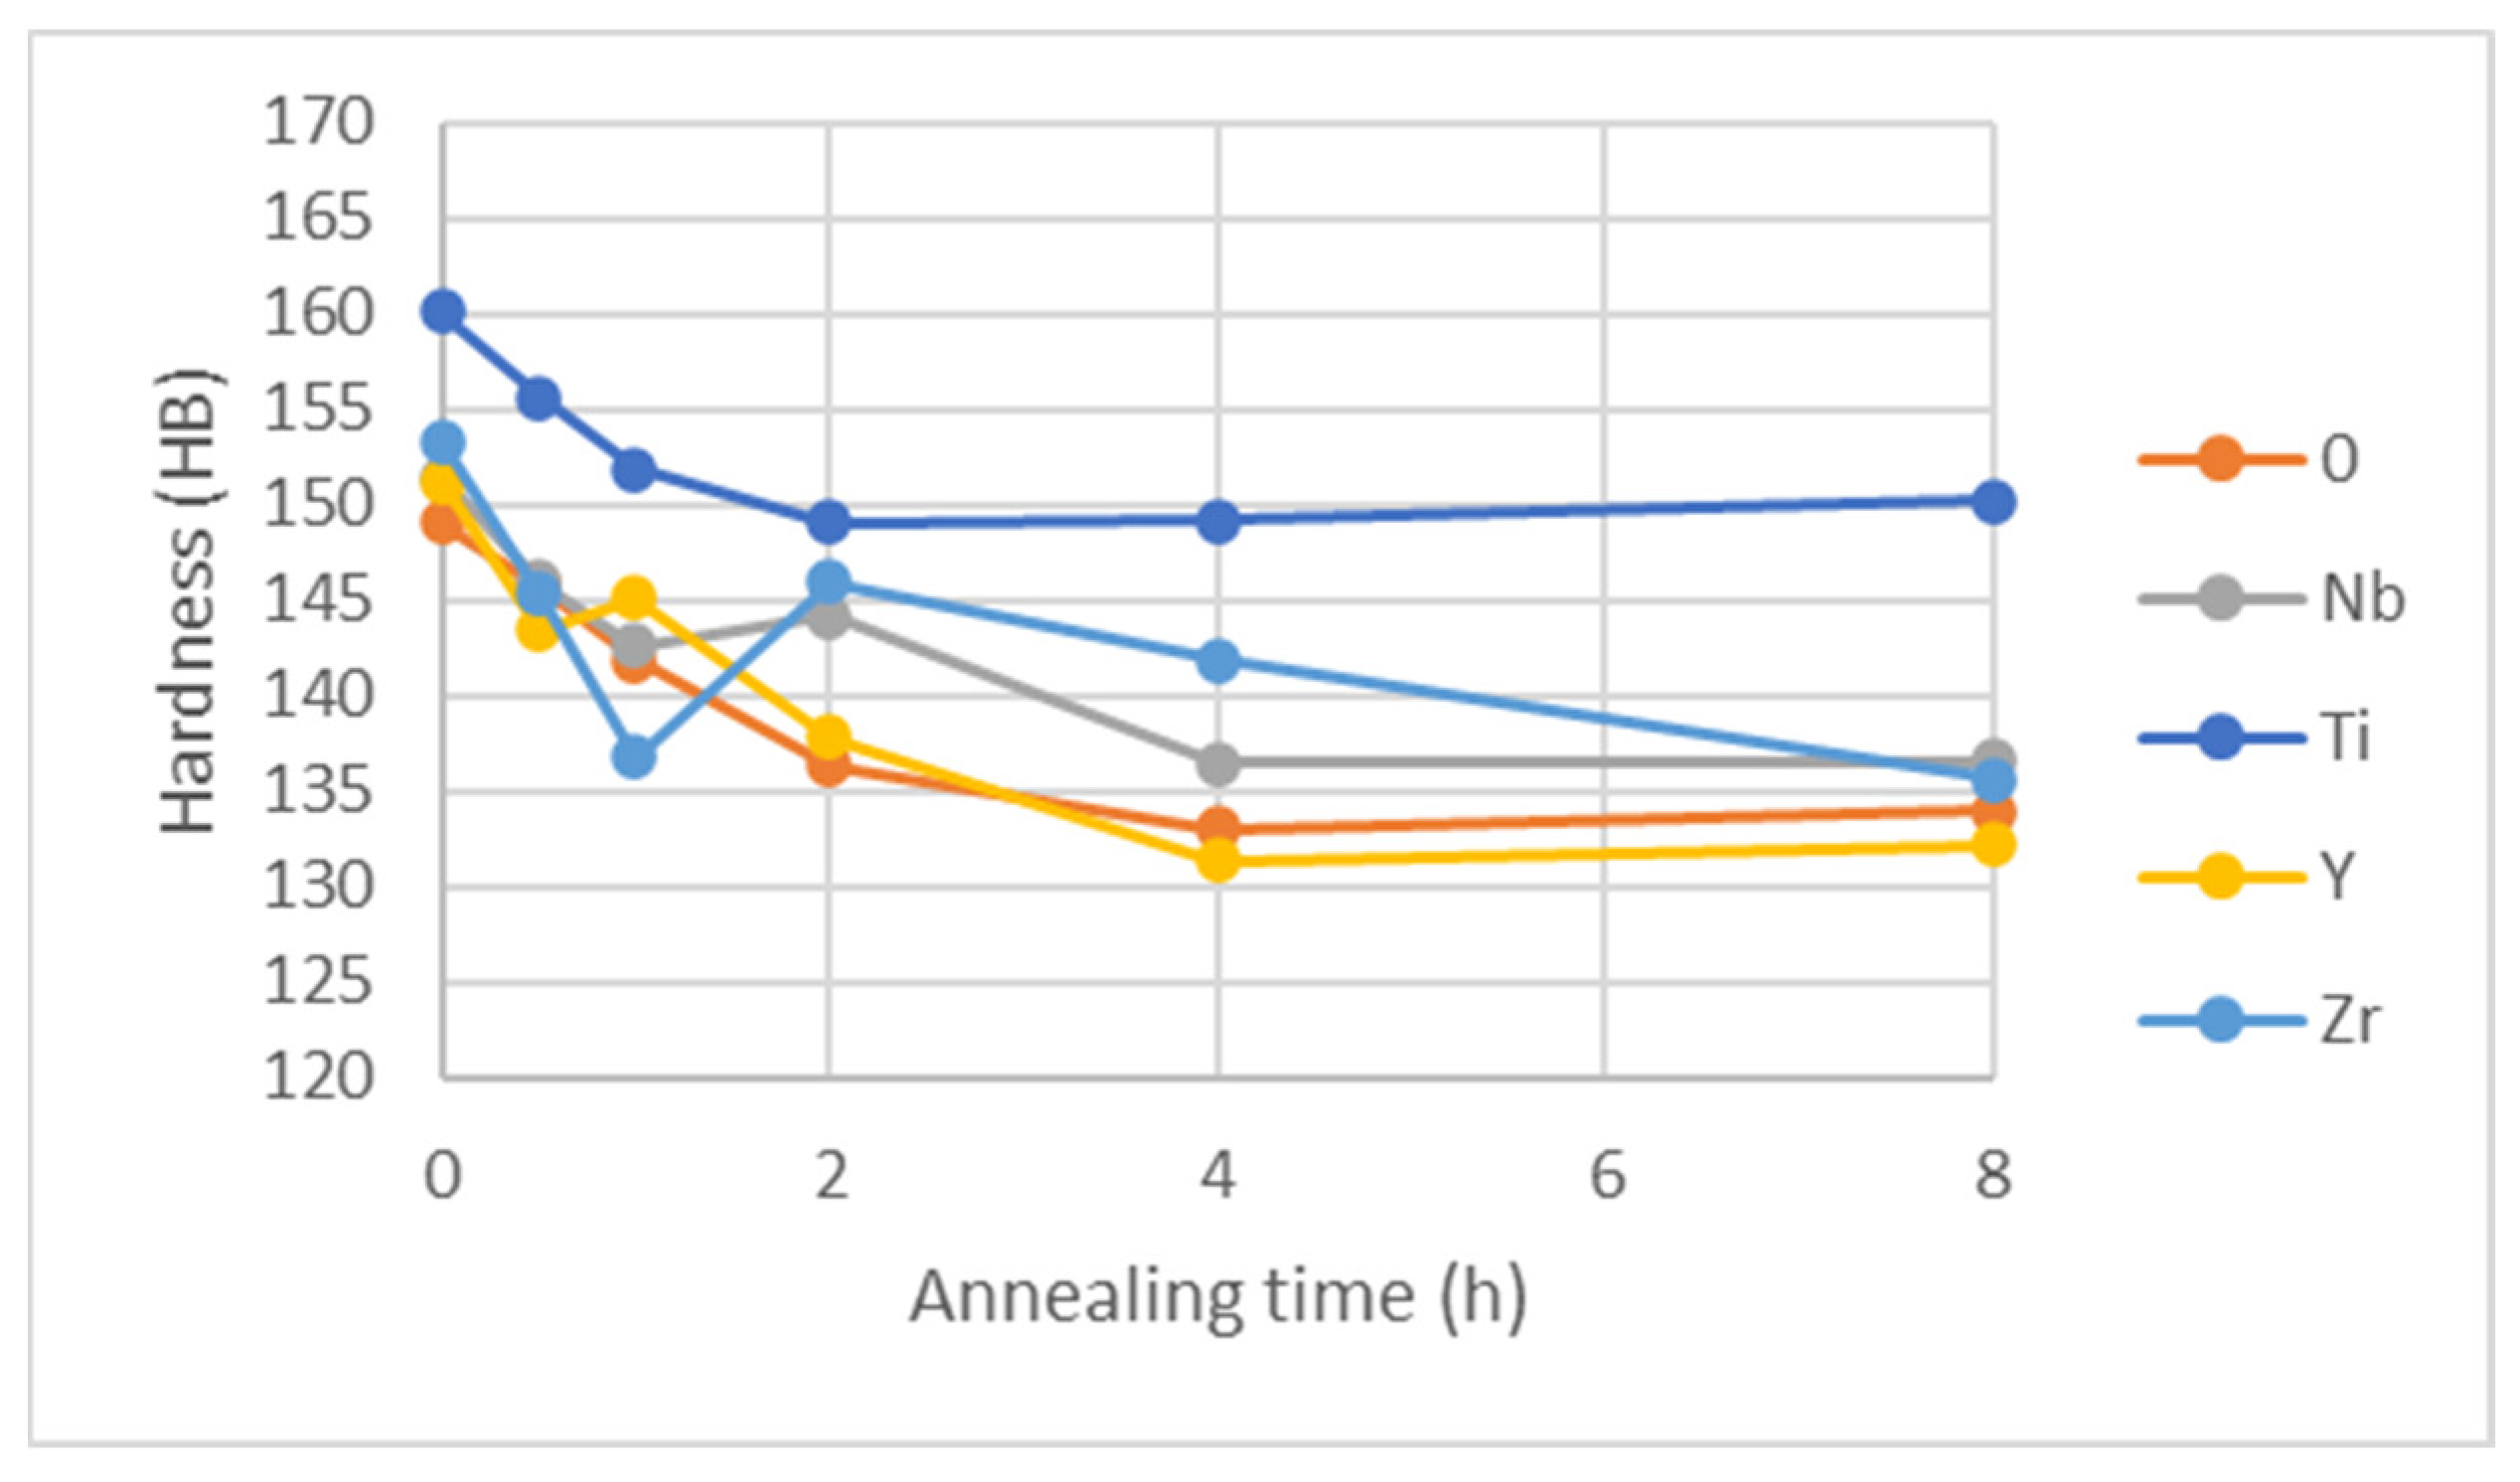
Figure 24.
Brinell hardness for samples annealed at 1100 °C.
Figure 24.
Brinell hardness for samples annealed at 1100 °C.
Figure 25.
Brinell hardness for samples annealed at 1150 °C.
Figure 25.
Brinell hardness for samples annealed at 1150 °C.
Figure 26.
Brinell hardness for samples annealed at 1200 °C.
Figure 26.
Brinell hardness for samples annealed at 1200 °C.
Figure 27.
Simulation of stable phases for steel without microalloying elements.
Figure 27.
Simulation of stable phases for steel without microalloying elements.
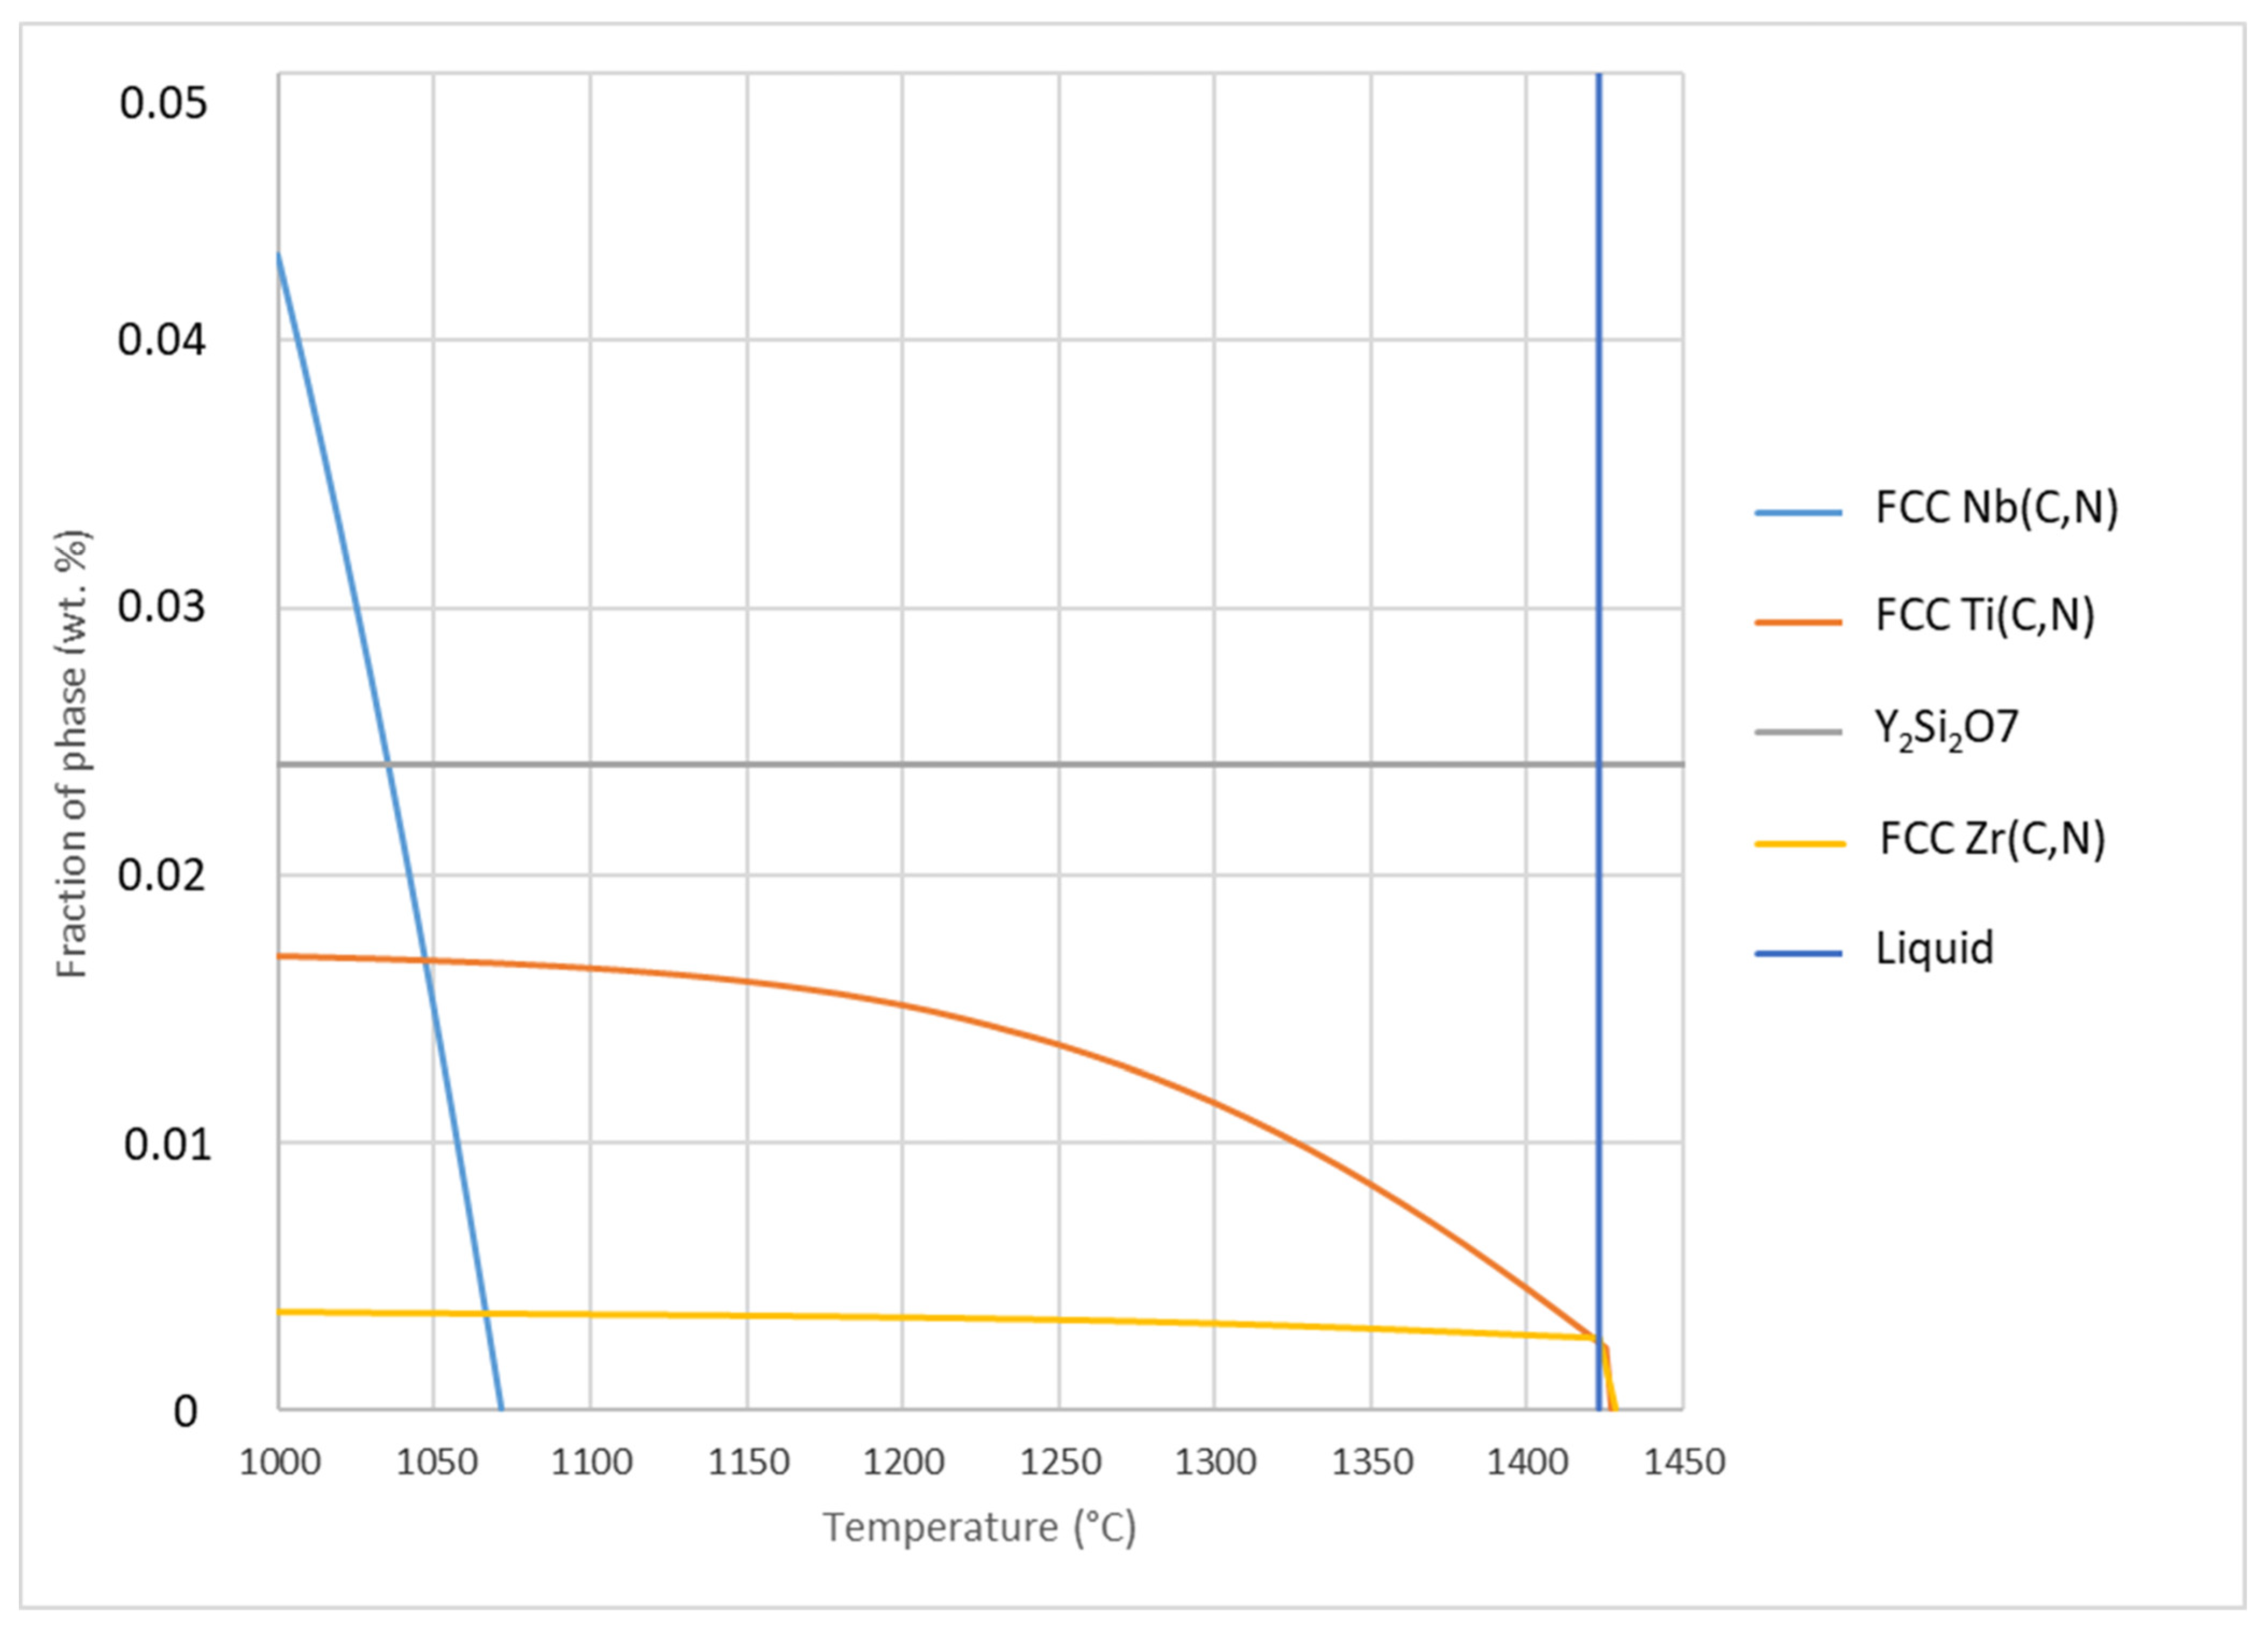
Figure 28.
Fraction of stable phases as a function of temperature, calculated with ThermoCalc.
Figure 28.
Fraction of stable phases as a function of temperature, calculated with ThermoCalc.
Table 1.
Composition of AISI 304 steel in wt.%.
Table 1.
Composition of AISI 304 steel in wt.%.
| C | Si | Mn | S | Cr | Ni | Cu | Mo | N |
|---|
| 0.022 | 0.43 | 1.8 | 0.022 | 18.4 | 9.2 | 0.14 | 0.15 | 0.017 |
Table 2.
Mass of 304 steel charge.
Table 2.
Mass of 304 steel charge.
| Batch Name | Mass of Steel Charge (kg) | Alloying Addition | Mass of Addition (g) |
|---|
| 304-0 | 8.30 | / | / |
| 304-Ti | 8.23 | FeTi (70 mas. %) | 6 |
| 304-Nb | 8.30 | FeNb (65 mas. %) | 12 |
| 304-Zr | 8.31 | Zr | 2.5 |
| 304-Y | 8.00 | Y | 2.5 |
Table 3.
Melting and stirring times.
Table 3.
Melting and stirring times.
| Batch | Melting Time (min) | Stirring Time After Addition (s) |
|---|
| 1—304-0 | 78 | / |
| 2—304-Ti | 36 | 20 |
| 3—304-Nb | 31 | 90 |
| 4—304-Zr | 29 | 20 |
| 5—304-Y | 26 | 20 |
Table 4.
Dimensions of cast ingots and strips after rolling and relative cross-sectional deformation.
Table 4.
Dimensions of cast ingots and strips after rolling and relative cross-sectional deformation.
| | Cross-Section Before Rolling (mm × mm) | Cross-Section After Rolling (mm × mm) | Reduction Ratio |
|---|
| 304-0 | 60 × 60 | 21 × 69 | 2.48 |
| 304-Nb | 60 × 60 | 20 × 70 | 2.57 |
| 403-Ti | 60 × 60 | 20 × 71 | 2.53 |
| 304-Zr | 60 × 60 | 19 × 72 | 2.63 |
| 304-Y | 60 × 60 | 20 × 69 | 2.61 |
Table 5.
Chemical analysis of primary elements in various metallic materials by inductively coupled plasma optical emission spectrometry (ICP-OES) in wt.%.
Table 5.
Chemical analysis of primary elements in various metallic materials by inductively coupled plasma optical emission spectrometry (ICP-OES) in wt.%.
| | C | Si | Mn | Cr | Ni | Cu | Mo | V | Ti | Nb | Zr | Y | O | N |
|---|
| 304-0 | 0.022 | 0.46 | 1.68 | 18.4 | 9.3 | 0.14 | 0.14 | 0.05 | / | / | / | / | 0.011 | 0.018 |
| 304-Nb | 0.021 | 0.47 | 1.70 | 18.4 | 9.2 | 0.14 | 0.15 | 0.05 | / | 0.08 | / | / | 0.010 | 0.020 |
| 304-Ti | 0.022 | 0.48 | 1.69 | 18.3 | 9.3 | 0.14 | 0.14 | 0.05 | 0.013 | / | / | / | 0.012 | 0.020 |
| 304-Y | 0.019 | 0.47 | 1.69 | 18.3 | 9.0 | 0.14 | 0.14 | 0.05 | / | / | / | 0.013 | 0.008 | 0.019 |
| 304-Zr | 0.021 | 0.48 | 1.76 | 18.9 | 9.5 | 0.14 | 0.14 | 0.05 | / | / | 0.003 | / | 0.010 | 0.019 |
Table 6.
Amount of alloying elements in wt.%.
Table 6.
Amount of alloying elements in wt.%.
| | Nb | Ti | Y | Zr |
|---|
| Theoretical addition | 0.094 | 0.051 | 0.03 | 0.03 |
| Final composition | 0.08 | 0.013 | 0.013 | 0.003 |
| Yield | 85% | 25.5% | 43.3% | 10% |
Table 7.
Average delta ferrite content in as-cast samples, given in vol.%.
Table 7.
Average delta ferrite content in as-cast samples, given in vol.%.
| Sample | 304-0 | 304-Nb | 304-Ti | 304-Y | 304-Zr |
|---|
| δ-ferrite content | 10.02 | 9.2 | 9.46 | 9.80 | 9.12 |
Table 8.
Average delta ferrite content in as-rolled samples, given in vol.%.
Table 8.
Average delta ferrite content in as-rolled samples, given in vol.%.
| Sample | 304-0 | 304-Nb | 304-Ti | 304-Y | 304-Zr |
|---|
| δ-ferrite content | 6.78 | 6.42 | 6.08 | 4.80 | 4.06 |
Table 9.
Average delta ferrite content by annealing time at 1050 °C, given in vol.%.
Table 9.
Average delta ferrite content by annealing time at 1050 °C, given in vol.%.
| Time Annealed (h) | 0 | Nb | Ti | Y | Zr |
|---|
| 0 | 1.98 | 4.04 | 3.74 | 2.44 | 2.11 |
| 0.5 | 1.66 | 2.58 | 1.92 | 1.7 | 1.72 |
| 1 | 1.82 | 2.2 | 2.22 | 1.86 | 1.4 |
| 2 | 0.95 | 1.34 | 1.24 | 1.07 | 1.03 |
| 4 | 0.73 | 0.84 | 0.70 | 0.52 | 0.44 |
| 8 | 0.38 | 0.44 | 0.28 | 0.37 | 0.27 |
Table 10.
Average delta ferrite content by annealing time at 1100 °C, given in vol.%.
Table 10.
Average delta ferrite content by annealing time at 1100 °C, given in vol.%.
| Time Annealed (h) | 0 | Nb | Ti | Y | Zr |
|---|
| 0 | 3.62 | 4.3 | 3.86 | 3.86 | 2.56 |
| 0.5 | 2.8 | 2.74 | 2.22 | 2.34 | 1.82 |
| 1 | 0.74 | 1.4 | 1.5 | 1.36 | 1.11 |
| 2 | 1.03 | 1.12 | 0.64 | 1.45 | 0.75 |
| 4 | 0.97 | 0.45 | 0.28 | 0.75 | 0.31 |
| 8 | 0.91 | 0.64 | 0.23 | 1.25 | 0.23 |
Table 11.
Average delta ferrite content by annealing time at 1150 °C, given in vol.%.
Table 11.
Average delta ferrite content by annealing time at 1150 °C, given in vol.%.
| Time Annealed (h) | 0 | Nb | Ti | Y | Zr |
|---|
| 0 | 3.16 | 4.36 | 2.78 | 3.34 | 2.34 |
| 0.5 | 2.44 | 2.78 | 1.76 | 1.29 | 1.46 |
| 1 | 1.12 | 0.93 | 0.62 | 0.79 | 0.53 |
| 2 | 0.34 | 0.80 | 0.40 | 0.37 | 0.51 |
| 4 | 0.35 | 0.47 | 0.30 | 1.02 | 0.29 |
| 8 | 0.31 | 0.36 | 0.63 | 0.92 | 0.39 |
Table 12.
Average delta ferrite content by annealing time at 1200 °C, given in vol.%.
Table 12.
Average delta ferrite content by annealing time at 1200 °C, given in vol.%.
| Time Annealed (h) | 0 | Nb | Ti | Y | Zr |
|---|
| 0 | 1.56 | 1.88 | 1.01 | 0.94 | 0.92 |
| 0.5 | 0.94 | 1.32 | 0.75 | 0.60 | 0.35 |
| 1 | 0.71 | 0.77 | 0.63 | 0.30 | 0.59 |
| 2 | 0.49 | 0.29 | 0.26 | 0 | 0.29 |
| 4 | 0.20 | 0.31 | 0.23 | 0.17 | 0.22 |
| 8 | 0 | 0 | 0 | 0 | 0 |
Table 13.
Point EDS analysis of the niobium carbonitride precipitate (in wt.%) from
Figure 6.
Table 13.
Point EDS analysis of the niobium carbonitride precipitate (in wt.%) from
Figure 6.
| | C | N | Cr | Fe | Nb |
|---|
| Spectrum 1 | 34.14 | 2.93 | 0.38 | 0.74 | 61.81 |
Table 14.
Average crystal grain sizes at annealing temperatures of 1050 °C and 1100 °C, measured according to the ASTM E112 standard.
Table 14.
Average crystal grain sizes at annealing temperatures of 1050 °C and 1100 °C, measured according to the ASTM E112 standard.
| Temperature 1050 °C | Temperature 1100 °C |
|---|
| Annealing Time (h) | Annealing Time (h) |
|---|
| | 0 | 0.5 | 1 | 2 | 4 | 8 | | 0 | 0.5 | 1 | 2 | 4 | 8 |
|---|
| 304-0 | 5.5 | 5 | 5 | 4 | 3.5 | 1.5 | 304-0 | 6.5 | 5.5 | 5 | 4.0 | 3.0 | 1.75 |
| 304-Nb | 6 | 5.5 | 4.5 | 4.25 | 3.25 | 2.5 | 304-Nb | 6 | 4.75 | 4 | 3.25 | 2.25 | 1.75 |
| 304-Ti | 6.5 | 6.5 | 6.5 | 6.5 | 6.5 | 6 | 304-Ti | 6.5 | 6.0 | 6.0 | 5.75 | 5.75 | 4.0 |
| 304-Y | 6.25 | 6 | 5.5 | 4.5 | 3.0 | 2.0 | 304-Y | 6 | 5.5 | 5.5 | 4 | 2.25 | 0.25 |
| 304-Zr | 6 | 6 | 5.25 | 5.25 | 4.5 | 4.0 | 304-Zr | 6.5 | 6.5 | 5 | 4.5 | 4 | 3.25 |
Table 15.
Average crystal grain sizes at annealing temperatures of 1150 °C and 1200 °C, measured according to the ASTM E112 standard.
Table 15.
Average crystal grain sizes at annealing temperatures of 1150 °C and 1200 °C, measured according to the ASTM E112 standard.
| Temperature 1150 °C | Temperature 1200 °C |
|---|
| Annealing Time (h) | Annealing Time (h) |
|---|
| | 0 | 0.5 | 1 | 2 | 4 | 8 | | 0 | 0.5 | 1 | 2 | 4 | 8 |
|---|
| 304-0 | 6.5 | 5.5 | 2.25 | 2.0 | 1.0 | 0.25 | 304-0 | 4 | 2.0 | 1.75 | 1.25 | 0.25 | 0 2 |
| 304-Nb | 6.0 | 5.0 | 4.0 | 3.5 | 1.5 | 0.5 | 304-Nb | 4.5 | 4.25 | 3.75 | 1 | 0.5 1 | 0 2 |
| 304-Ti | 5.5 | 5.0 | 5.0 | 4.0 | 2.0 | 1.25 | 304-Ti | 6 | 5.5 | 4.75 | 1.5 | 0.25 | 0 2 |
| 304-Y | 5.0 | 4.5 | 2.5 | 1.5 | 0.5 | 0.25 | 304-Y | 6.5 | 5.5 | 3.75 | 3.25 | 2.5 | 0.75 1 |
| 304-Zr | 6.25 | 5.5 | 5.0 | 4.25 | 4.0 | 2.0 | 304-Zr | 6.5 | 2.0 | 2.0 | 1.75 | 02 | 0 2 |

