Abstract
Oxygen diffusion in (PuxTh1−x)O2 mixed oxide crystals was investigated using molecular dynamics simulation. The model systems were isolated nanocrystals of 5460 and 15,960 particles, featuring a free surface. The oxygen diffusion coefficient D increased with decreasing thorium content, in accordance with the decrease in the melting temperature of (PuxTh1−x)O2 as x varied from 0 to 1. The temperature dependences D(T) exhibited non-linearity in the Arrhenius coordinates lnD = f(1/kT). The three linear segments of the plots corresponded to the superionic state, a transitional region, and the low-temperature crystalline phase. The transitional region was characterized by maximum values of the effective diffusion activation energy ED(PuO2) = 3.47 eV, ED(ThO2) = 5.24 eV and a complex collective mechanism of oxygen migration, which involved the displacement of anions into interstitial sites. At lower temperatures, an interstitialcy mechanism of oxygen diffusion was observed. The temperature dependence of D(PuO2) showed quantitative agreement with low-temperature experimental data.
1. Introduction
Plutonium dioxide is used as a nuclear fuel in a mixture with uranium dioxide. The presence of the plutonium-239 isotope increases the average fission neutron yield, which facilitates the breeding of fissile isotopes. A similar application of PuO2 in a mixture with thorium dioxide is also feasible; this would enable the production of the fissile uranium-233 isotope through neutron capture by thorium-232 [1]. PuO2 and ThO2 crystals share the same fluorite structure (Fm-3m) and have similar lattice parameters, thus allowing for the formation of a mixed oxide (PuxTh1−x)O2 [1].
Within a nuclear reactor core, fuel crystals are subjected to intense radiation damage. To model phenomena related to mass and charge transport under neutron irradiation, as well as to improve techniques for the electrochemical recovery of plutonium and thorium from irradiated fuel [2,3,4], it is essential to study the oxygen transport mechanisms in (PuxTh1−x)O2 oxides.
Oxygen diffusion in pure PuO2 and ThO2 oxides has been experimentally investigated [5,6,7,8,9]. However, interpreting the underlying diffusion mechanisms is challenging due to discrepancies in the reported data, which vary in both the values of the diffusion coefficients and the activation energies (in the case of ThO2). In particular, the relative contribution of oxygen transport via interstitial sites versus anion vacancies remains unclear.
Near the melting point, PuO2 and ThO2 crystals may transition to a superionic state, characterized by an extreme disordering of the oxygen sublattice. A transitional region exists between this state and the “normal” crystalline phase [10], where the mechanisms of oxygen transport may change with temperature. The available experimental data pertain to lower temperatures and thus do not characterize this specific region. Therefore, computational modeling of oxygen diffusion in PuO2, ThO2, and (PuxTh1−x)O2 crystals is relevant.
Computational methods have been used to calculate the energies of Frenkel and Schottky disorder in PuO2 and ThO2 crystals, as well as the activation energies for oxygen transport under such disordered conditions [11,12,13,14]. These static calculations employed both first-principles approaches [11,12] and classical interatomic potentials [13,14]. Both first-principles and classical models yielded quantitative agreement between the calculated energies and experimental estimates. However, these static calculations were limited to relatively simple single-particle transport models, which may not accurately represent the actual processes occurring at high temperatures, particularly near the superionic transition.
Studies on the dynamic modeling of oxygen diffusion in crystalline nuclear oxide fuels have primarily focused on uranium dioxide, which is a structural analog of PuO2 and ThO2 [15,16,17,18,19,20]. In most of these works, periodic boundary conditions were used. The periodic boundary conditions eliminate the presence of surface. To stimulate oxygen diffusion, some studies have created artificial crystal lattice defects [17,18,19,20]. However, it is interesting to study systems in which lattice disordering occurs without direct intervention by the researcher. The work [15] modeled isolated UO2 nanocrystals with free surfaces, which led to an improved agreement between the calculated oxygen diffusion coefficient and experimental data. Further investigation into the influence of surfaces as a source of point defects involved in oxygen transport is therefore of significant interest. This has become one of the objectives of the present work.
The model systems in this work were isolated (PuxTh1−x)O2 nanocrystals. This system is of particular interest because pure PuO2 and ThO2 crystals, despite sharing the same fluorite structure, exhibit significantly different melting temperatures. Due to its higher melting point, ThO2 is expected to have lower oxygen diffusion coefficients compared to PuO2. Consequently, mixed (PuxTh1−x)O2 crystals may exhibit a strong dependence of oxygen mobility on the oxide composition.
To the best of our knowledge, oxygen diffusion in (PuxTh1−x)O2 has not been previously modeled using the molecular dynamics method. A methodology analogous to the one employed here was used in an earlier study to investigate anion and cation diffusion in ThO2 and (Ux,Puy,Th1−x−y)O2 [21,22]. In [21,22], the primary mechanism for cation migration was the movement of cation vacancies formed in the near-surface layer.
2. Modeling Methodology
Molecular dynamics simulations were used to calculate the oxygen diffusion coefficients in ThO2, PuO2, (Pu0.125Th0.875)O2, (Pu0.25Th0.75)O2 and (Pu0.5Th0.5)O2 crystals. The selection of these model system compositions allowed us to track the correlation between oxygen mobility and the plutonium-to-thorium ratio. The model systems were nanocrystals comprising 5460 and 15,960 particles, isolated in vacuum. These crystallites possessed a free surface, predominantly faceted by {111} crystallographic planes. The presence of the free surface enabled the migration of point defects (such as interstitial ions and vacancies) from the surface into the crystal bulk.
At the start of the simulation, the nanocrystals had the shape of a perfect octahedra (Figure 1). During the computational experiments, the model systems transformed into octahedra with truncated vertices. This result is consistent with the findings of an experimental work [23], which reported that the equilibrium shape for nanoscale cavities in a UO2 crystal is a truncated octahedron.
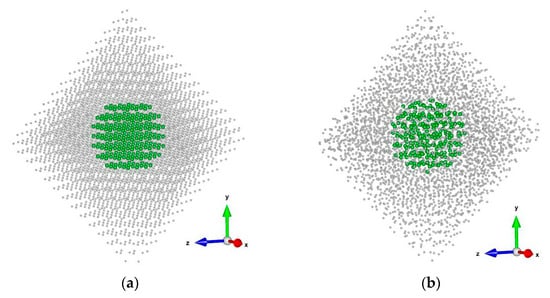
Figure 1.
A model PuO2 nanocrystal consisting of 5460 particles: (a) at the beginning of a computational experiment; (b) 13.5 nanoseconds after the start of the simulation. The temperature is 2500 K. For clarity, only the oxygen anion sublattice is shown. The central region, used for calculating the oxygen diffusion coefficient, is highlighted in green and with a larger particle size. The coordinate axes used for representing particle coordinates are shown. The images were prepared with VESTA application (Ver. 3.4.4) [24].
To maintain a symmetric charge distribution on the nanocrystal surface, the structures were constructed from neutral PuO2 and ThO2 molecules as building blocks. Within each molecule, the two oxygen ions were positioned collinearly with the metal cation. Their specific coordinates were defined by the displacements (−0.25, −0.25, −0.25) a and (0.25, 0.25, 0.25) a relative to the cation, where a is the lattice constant. This approach minimized the influence of surface charges on the bulk properties of the model crystals, which is essential due to the long-range character of Coulomb forces.
Despite the presence of surfaces, the aim of this study was to calculate the oxygen diffusion coefficient representative of the crystal bulk. The calculation of the diffusion coefficient was confined to a central region situated no less than 1.75 lattice constants from the surface to avoid the influence of surface migration (Figure 1). The evolution of the surface morphology during the computational experiments did not affect the central region of the crystals.
The interatomic interactions in the model crystals were described using the MOX-07 pair potentials [25], which were supplemented with a compatible Th-O pair potential proposed later in the work [26]. In previous studies [15,18], the MOX-07 potentials yielded a quantitative agreement for the oxygen diffusion coefficient in UO2 with experimental data [5,6]. Furthermore, the work [17] demonstrated that the MOX-07 potentials performed well in modeling radiation damage in (U,Pu)O2.
A comparison of the MOX-07 potentials with the CRG many-body potentials proposed by [27] was conducted in studies [13,17]. It was found that the MOX-07 and CRG potentials give close energies of intrinsic disordering of UO2 and PuO2 crystals. Moreover, the MOX-07 and [26] potentials have been shown to quantitatively predict the superionic transition temperatures for UO2 [15] and ThO2 [21], respectively.
The specified interatomic potentials were presented in the Born-Mayer form with dispersive attraction:
where KE is Coulomb’s constant; Aij, Bij and Cij are the parameters describing both the repulsion between valence electron shells and the dispersion attraction. The parameter values are given in [25,26]. The effective charges for the cations and anions were set to q+ = 2.745e, q− = −1.3725e, respectively, where e is the elementary charge.
Uij(Rij) = KE × qiqj/Rij + Aij × exp(−Bij) − Cij/Rij6,
Molecular dynamics simulations were performed using original in-house software (Ver. 1), previously employed in [21]. The particle equations of motion were integrated using the “leapfrog” scheme, which is mathematically equivalent to the Verlet integration [28]. The integration time step was set to ∆t = 3 × 10⁻¹⁵ s. At each step, the center-of-mass displacement and rigid-body rotation of the entire crystal were compensated for.
At the beginning of each computational experiment, the particles were placed at the sites of a perfect crystal lattice. The mixed cation arrangement of plutonium and thorium was modeled in two ways. The first method involved a regular alternation of the two cation types. For composition (Pu0.5Th0.5)O2, plutonium cations had coordinates (0.75, 0.75, 0.25) × a and (0.75, 0.25, 0.75) × a relative to the bottom-left corner of the cubic unit cell, while thorium cations had coordinates (0.25, 0.25, 0.25) × a and (0.25, 0.75, 0.75) × a. For (Pu0.25Th0.75)O2, the single plutonium cation in each unit cell had coordinates (0.75, 0.75, 0.25) × a. For composition (Pu0.125Th0.875)O2, the regular alternation of cations was not applied, since at low plutonium concentration, it was considered necessary to simulate fluctuations in the arrangement of Pu cations.
In the second method for creating mixed crystallites, thorium cations were randomly replaced with plutonium cations. The indices of the plutonium cations were determined using a linear congruential generator of pseudorandom numbers. The total number of plutonium cations generated in the (PuxTh1−x)O2 nanocrystal strictly corresponded to the required composition. Fluctuations associated with the random placement of plutonium led to the thorium-to-plutonium ratio within the central region (Figure 1) becoming a random variable. To average out this effect, no fewer than 10 computational experiments with differing plutonium cation arrangements were performed.
The simulation times considered in this work were too short for diffusive cation displacement. Consequently, the cation positions specified during the creation of the model systems remained unchanged throughout the computational experiments.
The components of the particle velocity vectors were assigned according to a Maxwell-Boltzmann distribution using the Box-Muller algorithm [29]. During the initial simulation stage, the system temperature increased due to the relaxation of the free surface. A Berendsen thermostat [30] with a time constant of τ = 200 × ∆t = 0.6 ps was used to bring the system to the target temperature.
For the production stage, during which the diffusion coefficient was calculated, the target temperature was maintained using a stochastic velocity rescaling thermostat [31] with a time constant of τ = 3000 × ∆t = 9 ps.
The diffusion coefficients D were calculated using the well-known relation
where <a2(t)> is the mean squared displacement of the oxygen anions as a function of simulation time t. The total duration of the simulations varied from 1.5 ns to 120 ns, increasing as the temperature decreased. For statistical averaging, the displacements of all oxygen ions located within the central spherical region (Figure 1) were used. Furthermore, multiple independent simulation runs—from 10 to 50 for each temperature—were performed to improve the statistical accuracy of the results.
<a2(t)> = 6Dt,
During long simulation times exceeding 80 ns, the model crystals could rotate from their initial positions despite the ongoing compensation for rigid-body rotation. These rotations led to a non-diffusive displacement of the oxygen ions, introducing an error into the calculated diffusion coefficient. This rotation was removed during the post-processing of the saved crystal configurations using a procedure detailed in [22]. This same procedure also enabled the tracking of individual diffusion jumps of specific anions. Consequently, it was used to analyze the underlying diffusion mechanisms, which are discussed in the Section 3.
To achieve the necessary computational performance, we employed an in-house code optimized for parallel execution on CUDA architecture Graphics Processing Units (GPUs).
The diffusion coefficient in PuO2 crystals composed of 1500 particles with periodic boundary conditions (PBC) was calculated using the LAMMPS software package (Ver. 29 August 2024) [32] with a Nose-Hoover thermostat [33,34] and a time integration step of 3 × 10⁻¹⁵ s. The LAMMPS simulations also employed parallel computing on GPUs.
To elucidate the mechanisms of oxygen migration, this work obtained the temperature dependence of the average concentration of anion interstitials in the central regions of model PuO2 and ThO2 nanocrystals consisting of 5460 particles. Interstitial anions were identified based on the fact that the Cartesian coordinates of the anion sublattice sites are multiples of half the lattice constant (0.5a), and these coordinates remained unchanged throughout the simulations. In PuO2 and ThO2 crystals, the cations are located in every other center of the cubes formed by the anion sublattice. The unoccupied centers of these cubes were defined as interstitial sites. Other types of interstitial positions, such as the centers of cube faces or edges, were not considered.
To identify interstitial ions, their coordinates were averaged over a sliding time window of 0.3 ps, which constituted approximately half of the characteristic time for an oxygen anion’s diffusion jump between two equilibrium positions. A particle was considered to occupy an interstitial site if its time-averaged coordinates were closer to that interstitial position than to any node of the anion sublattice. The concentration of interstitial anions [OI] was calculated as the ratio of their number to the number of anion sublattice sites. This concentration was then averaged over the entire simulation time. At sufficiently low temperatures, the appearance of even a single interstitial ion in the central region of the crystallite became a rare event. In such cases, the interstitial ion concentration was assumed to be proportional to the probability of detecting such an ion.
3. Results and Discussion
3.1. Oxygen Diffusion Coefficient as a Function of Model System Composition
The temperature-dependent oxygen diffusion coefficients calculated in this work for ThO2, PuO2, (Pu0.25Th0.75)O2 and (Pu0.5Th0.5)O2, nanocrystals are presented in Figure 2. The data are plotted in Arrhenius coordinates as ln(D) versus 1/kT, where k is the Boltzmann constant and T is the absolute temperature. In Figure 2 and throughout this paper, the abbreviation FBC refers to the free-surface boundary conditions employed in the simulations.
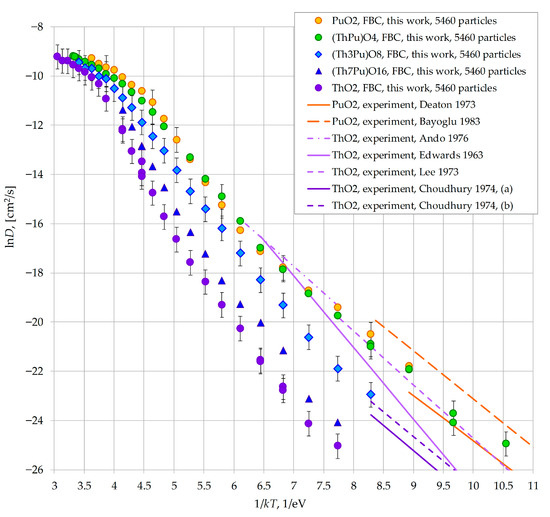
Figure 2.
Oxygen diffusion coefficient as a function of temperature in model nanocrystals consisting of 5460 particles. Chemical formulas (ThPu)O4, (Th3Pu)O8 and (Th7Pu)O16 are used in the Legend as analogs of the formulas (Th0.5,Pu0.5)O2, (Th0.75,Pu0.25)O2 and (Th0.875,Pu0.125)O2. Error bars are not displayed for some points to improve clarity, as they are identical to those shown. Abbreviation FBC denotes the free-surface boundary conditions used in this work. For mixed compositions (Th0.5,Pu0.5)O2, (Th0.75,Pu0.25)O2, the presented values of the diffusion coefficient were obtained using the regular alternation of plutonium and thorium cations. For (Th0.875,Pu0.125)O2, the values shown were calculated with the random distribution of plutonium cations within the model nanocrystals. Data from other works in this Figure are from: Deaton 1973 [35]; Bayoglu 1983 [36]; Edwards 1963 [37]; Lee 1973 [38]; Ando 1976 [39]; Choudhury 1974 [40].
The lowest diffusion coefficients correspond to ThO2. The oxygen diffusion coefficient increases with the plutonium fraction. Furthermore, increasing the plutonium content to 50% is sufficient for the oxygen mobility in (PuxTh1−x)O2 to reach values comparable to those in pure PuO2.
The increase in the oxygen diffusion coefficient observed when transitioning from ThO2 to PuO2 correlates with a decrease in the melting temperature of the system. The experimental melting point of ThO2 is 3665 K [41], whereas for plutonium dioxide it drops to 3017 K [42]. The model (PuxTh1−x)O2 crystals simulated using the MOX-07 potentials exhibit the same behavior, as demonstrated in a previous study [22].
3.2. High-Temperature Diffusion
The non-linearity of the lnD = f(1/kT) dependencies in Figure 2 is caused by changes in the oxygen transport mechanisms and/or the disordering of the oxygen sublattice with temperature. Values of lnD > −10 (D > 4.5 cm2/s) correspond to the superionic state of the system, where the oxygen sublattice resembles a melt. Consequently, the effective activation energies for oxygen diffusion ED reach minimal values, close to 1 eV (Figure 3 and Figure 4). As the temperature decreases, the ED values become linear combinations that include the formation energies of oxygen sublattice defects (either interstitial anions or anion vacancies) and the migration energies of these defects. Specifically, for the classical anti-Frenkel (AF) disorder of oxygen [4]:
where EAF is the formation energy of an unbound interstitial anion–anion vacancy pair, and EM is the migration energy, defined here as the height of the potential energy barrier separating the stable positions of the mobile defects, either interstitial anions or vacancies.
ED = EM + EAF/2,
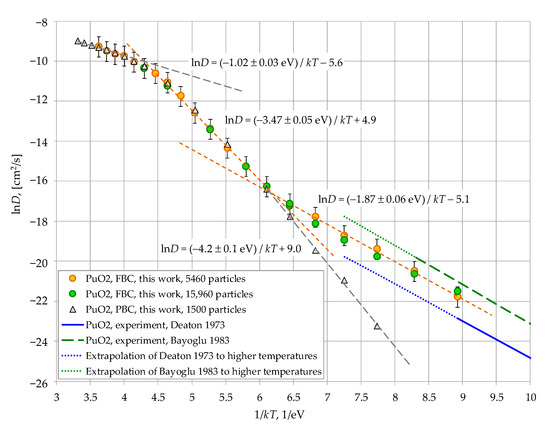
Figure 3.
Analysis of the temperature dependence of the calculated oxygen diffusion coefficient in PuO2. Data from other works in this Figure are from: Deaton 1973 [35] and Bayoglu 1983 [36].
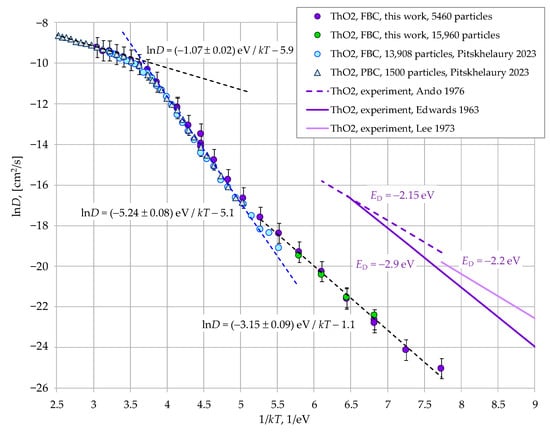
Figure 4.
Analysis of the temperature dependence of the calculated oxygen diffusion coefficient in ThO2. Data from other works in this Figure are from: Pitskhelaury 2023 [21]; Edwards 1963 [37]; Lee 1973 [38]; Ando 1976 [39].
In order to discuss the mechanisms of oxygen diffusion, the lnD = f(1/kT) dependencies for PuO2 and ThO2 crystals are presented separately in Figure 3 and Figure 4. It can be seen that in both cases, as the temperature decreases, the superionic state gives way to a transitional region (Region I). The diffusion coefficients calculated using periodic and free-surface boundary conditions coincide in this region. This suggests that cation transport in this region is governed by bulk disorder within the crystallite, without significant influence from the surface.
Figure 3 and Figure 4 demonstrate the linear segments of the graphs, which are described by Equation (4)
where ED represents the effective activation energies for diffusion. In Region I, we obtained the following values for these energies:
ln(D) = −ED/kT + const,
- -
- ED(PuO2, free-surface border conditions, 5460 particles) = 3.47 ± 0.05 eV;
- -
- ED(PuO2, periodic border conditions, 1500 particles) = 4.2 ± 0.05 eV;
- -
- ED(ThO2, free-surface border conditions, 5460 particles) = 5.24 ± 0.08 eV.
These values are overestimated compared to the experimental data presented in Figure 2, Figure 3 and Figure 4: ED(PuO2 [35]) = 1.8 eV, ED(PuO2 [36]) = 1.95 eV, ED(ThO2 [37]) = 2.9 eV, ED(ThO2 [38]) = 2.2 eV, ED(ThO2 [39]) = 2.15 eV, ED(ThO2 [40]) = 2.0 and 2.05 eV. However, the experimental data correspond to lower temperatures, where the oxygen transport mechanism may have changed. The present modeling demonstrates that such a change could indeed have occurred.
To clarify the diffusion mechanism, this work analyzed the trajectories of migrating anions. It was found that anion migration in Region I involved the collective motion of several particles. An example of such a process is illustrated in Figure 5 and Figure 6.
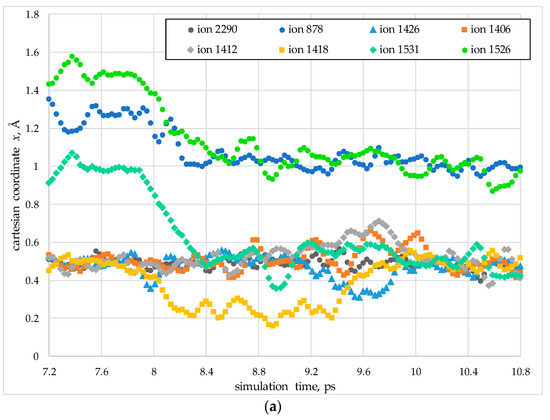
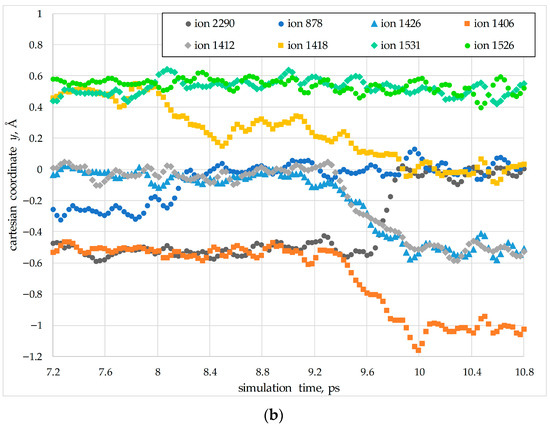
Figure 5.
An example of coordinate changes during the collective migration of oxygen anions in a model PuO2 nanocrystal at a temperature of T = 2200 K (temperature Region I). The Cartesian x (a) and y (b) coordinates are shown in units of the lattice constant a. Coordinate values that are multiples of 0.5 correspond to the sites of the oxygen sublattice, whereas other values indicate interstitial positions.
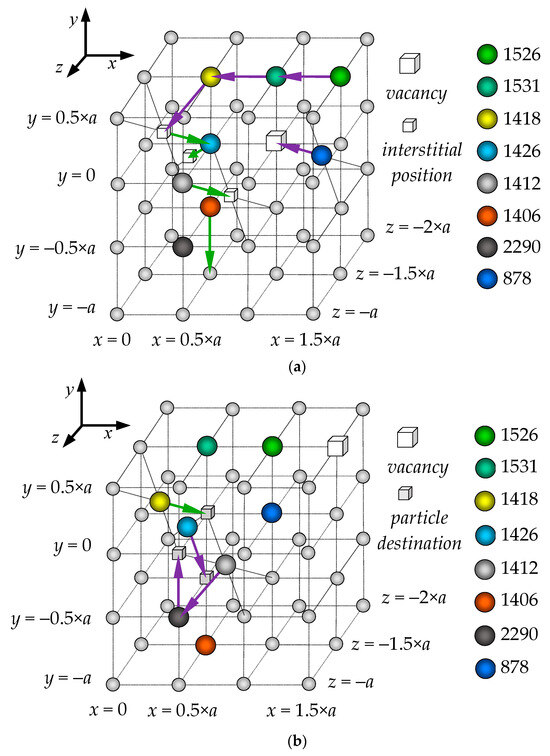
Figure 6.
An example of the collective migration of oxygen anions in a PuO2 nanocrystal at T = 2200 K (temperature Region I). Panel (a) shows the first and second migration stages, indicated by purple and green arrows, respectively. Panel (b) illustrates the third migration stage, indicated by purple arrows. The ion indices and colors correspond to those used in the graphs in Figure 5.
In the first stage of the migration (Figure 6a, purple arrows), ions #1526 and #1531 simultaneously move into adjacent sites of the anion sublattice. Concurrently, ion #1418 shifts into an interstitial position, while ion #878 moves into an anion vacancy.
The second stage of the migration corresponds to the 9.6 ps mark in Figure 5. At this stage, ions #1412 and #1426 move into adjacent interstitial sites, while ion #1406 begins to move towards a neighboring lattice site. In the third stage, ions #1412 and #1426 transition from their interstitial positions back into lattice sites. In this process, ion #1412 occupies the site vacated by ion #2290, which itself shifts into an adjacent vacant lattice site.
3.3. Ionic Conductivity Compared to Structural Analogs
It should be noted that some anions exchanged positions during the collective migration, such as ions #1412 and #2290 in Figure 5 and Figure 6. This exchange diffusion does not result in net charge transport. However, the movement of interstitial anions and anion vacancies in opposite directions was also observed. We propose that the diffusion mechanism described above for Region I is capable of supporting net charge transport. As indirect support for this hypothesis, Figure 7 compares the lnD = f(1/kT) dependencies obtained in this work with experimental data from [10] on the ionic conductivities of SrCl2, CaF2, SrF2, and BaF2 crystals. These materials share the fluorite structure with PuO2 and ThO2.
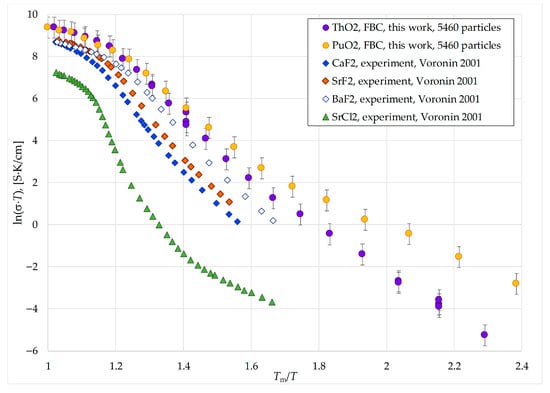
Figure 7.
Comparison of the ionic conductivity of model PuO2 and ThO2 nanocrystals with experimental data for structural analogs. Data from other works in this Figure are from Voronin 2001 [10].
In order to compare the results of this work with the data from [10], we calculated the ionic conductivity of the model PuO2 and ThO2 crystals using the known formula
where n is the numerical concentration of oxygen anions, and q is their charge, taken to be −1.3725e. For simplicity, it was assumed that charge transport could be mediated by any diffusive displacement of the anions that occurred during the simulation. According to Equation (5), the diffusion coefficient D(T) is effectively proportional to σ(T) × T, since the density n exhibits only a weak dependence on temperature.
σ(T) = n × q2 × D(T)/(kT),
The plots of σ(T) ×T are presented in Figure 7, graphed as a function of the normalized coordinate Tm/T, where Tm is the melting temperature of the crystals. It is known that when using Tm/T coordinates, the transport coefficients for various fluorite-structure crystals are found to be similar [4]. The melting temperatures used for CaF2, SrF2, BaF2, and SrCl2 were Tm(CaF2) = 1690 K, Tm(SrF2) = 1740 K, Tm(BaF2) = 1620 K, and Tm(SrCl2) = 1148 K, as taken from [10].
All the ln(σ × T) curves in Figure 7 share a common nonlinear shape, indicative of a transitional region between the superionic state and the low-temperature crystalline phase. This region is characterized by an elevated effective activation energy for charge carrier diffusion. It can be inferred that the anion transport mechanisms in all systems considered in Figure 7 are similar. This supports the physical realism of the oxygen transport mechanisms identified in the present work. It is noteworthy that similar results were previously obtained in simulations of oxygen diffusion in uranium dioxide [15,18].
3.4. Interstitial Oxygen Anions
To analyze the mechanisms of oxygen transport, this work calculated the temperature dependence of the oxygen interstitial ion concentration [OI] in PuO2 and ThO2 crystals, as shown in Figure 8. It can be seen that the shape of these dependencies closely resembles that of the diffusion coefficient graphs. The linear segments highlighted in Figure 8 can be described by the relations
where Ef,eff is the effective formation energy of an interstitial anion. Specifically, in the case of classical anti-Frenkel disorder, Ef,eff = EAF/2, where EAF is the energy required to form an unbound interstitial anion–anion vacancy pair within the crystal bulk.
ln(D) = −Ef,eff/kT + const,
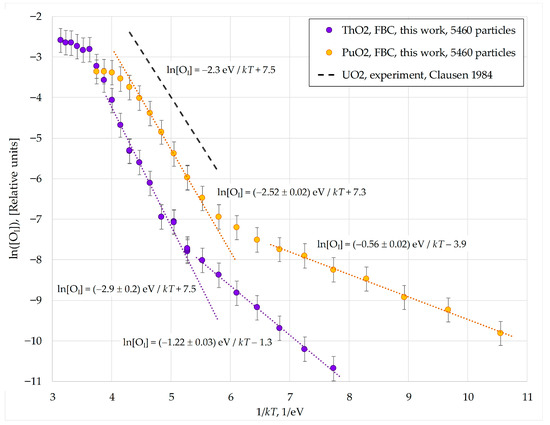
Figure 8.
Temperature dependence of the interstitial anion concentration in model PuO2 and ThO2 nanocrystals consisting of 5460 particles. Data from other works in this Figure are from Clausen 1984 [7].
The plots in Figure 8 demonstrate a transitional region between the superionic and crystalline phases, which corresponds to Region I discussed previously. Within this region, the effective formation energies of interstitial anions reach their maximum values:
- -
- Ef,eff(PuO2, I) = 2.52 ± 0.02 eV;
- -
- Ef,eff(ThO2, I) = 2.9 ± 0.2 eV.
These values are close to the experimental formation energy of an oxygen interstitial in uranium dioxide, Ef,eff(UO2, exp) = 2.3 eV measured in [7].
The Ef,eff values obtained in Region I should correspond to the formation of interstitial anion—vacancy pairs within the crystal bulk, as the influence of the surface on oxygen diffusion in this Region is small. The formation energies of unbound Frenkel pairs EAF, calculated for the MOX-07 potentials using the static lattice method, are EAF(ThO2) = 4.5 eV [21] and EAF(PuO2) = 3.9 eV [17,22]. Halving these values gives EAF(ThO2)/2 = 2.25 eV and EAF(PuO2)/2 = 1.95 eV, which are lower than the dynamic values from Region I.
The discrepancy between the dynamic Ef,eff values and the EAF/2 values can be attributed to the formation of short-lived, close interstitial-vacancy pairs during the simulation. The recombination rate of such correlated pairs is not proportional to the product of the vacancy and interstitial concentrations. This leads to the disappearance of the 1/2 factor that links Ef,eff and EAF in the classical model of Frenkel disorder.
Based on the plots shown in Figure 8, the oxygen migration energies in the model nanocrystals can be estimated as the difference between the effective activation energies for diffusion and the formation energies of interstitial anions:
EM = ED − Ef,eff.
This yields EM(PuO2, I) = 3.47 − 2.52 = 0.95 eV and EM(ThO2, I) = 5.24 − 2.9 = 2.34 eV. For plutonium dioxide, the EM value is close to the experimental estimate of the potential barrier for interstitial diffusion in UO2 (1.0 eV [6]). However, the significance of a direct comparison between these energies is questionable, since anion diffusion in Region I involved a complex collective motion of multiple particles.
3.5. Low-Temperature Region
As can be seen from Figure 2, Figure 3 and Figure 4, at oxygen diffusion coefficients below ~5 × 10⁻⁸ cm2/s (Region II), the slope of the lnD = f(1/kT) plots decreases significantly. Consequently, the effective activation energies for diffusion ED are reduced. This change results in the low-temperature segment of the lnD(PuO2) = f(1/kT) plot showing quantitative agreement with experimental data [35,36] (Figure 3). In the case of ThO2, the agreement is substantially improved, with the calculated ED = 3.15 eV aligning much more closely with experimental value [37] (2.9 eV). Figure 8 indicates that the primary reason for this change is a decrease in the effective formation energy of interstitial anions Ef,eff. In Region II, these energies become significantly lower than the corresponding EAF/2 values.
The data obtained in this work reveal a fundamental divergence in the calculated oxygen diffusion coefficients for PuO2 below 1800 K, depending on whether periodic (PBC) or free-surface (FBC) boundary conditions are used. The data presented in Figure 4 suggest that a similar discrepancy exists for ThO2 below 2300 K. Therefore, the observed change in the Ef,eff values must be caused by the presence of the free surface.
Figure 9 and Figure 10 illustrate the characteristic sequence of displacement for oxygen anions involved in a diffusion event within the bulk of a 5460-particle PuO2 nanocrystal at T = 1500 K, which lies within the discussed low-temperature Region II. Figure 9 shows the initial positions of the anions involved in the migration process, as well as the directions of their displacement through interstitial sites.
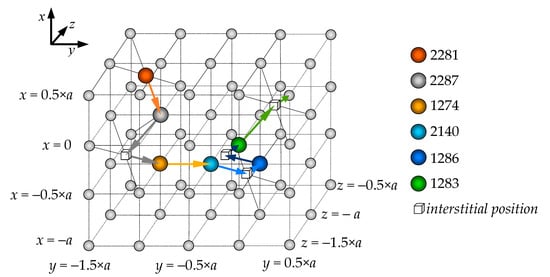
Figure 9.
Chain of interstitialcy migration of oxygen anions in a model PuO2 nanocrystal consisting of 5460 particles at T = 1500 K. The particle indices match those shown in Figure 10. The arrows indicate the migration direction of each anion, taking into account their movement through interstitial sites.
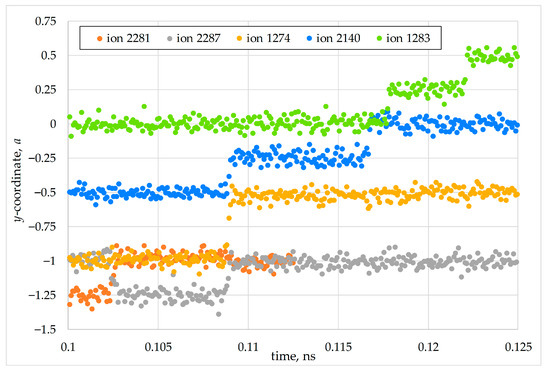
Figure 10.
Evolution of anion coordinates during interstitialcy migration of oxygen in a model PuO2 nanocrystal consisting of 5460 particles at T = 1500 K. The coordinates −1, −0.5, 0, and 0.5 correspond to sites of the anion sublattice, whereas the coordinates −1.25, −0.75, −0.25, and 0.25 correspond to interstitial positions. The particle indices match those shown in Figure 9.
Figure 10 demonstrates the temporal sequence of displacement for the same anions. The particle numbering is consistent between Figure 9 and Figure 10. For brevity, only the motion along the Cartesian y-axis is shown; the other coordinates exhibited analogous changes. The values y = −a, −0.5 × a, 0, and 0.5 × a correspond to the sites of the anion sublattice, whereas y = −1.25 × a, −0.75 × a,−0.25 × a, 0, and 0.25 × a, correspond to interstitial positions.
The change in the y-coordinate shows that the anions moved in a chain, sequentially displacing each other into different interstitial positions—a process known as the interstitialcy mechanism. In this event, anion #1274, under the influence of ion #2287, moved into an adjacent lattice site very rapidly, although a brief displacement of ion #1274 into an interstitial position was still recorded. The displacement of ion #1286 is omitted, as its jump to an interstitial position was short-lived, and the y-coordinate in its new equilibrium position remained unchanged.
The anion migration mechanism shown in Figure 9 and Figure 10 is simplified compared to the collective particle motion characteristic of high-temperature Region I (Figure 5 and Figure 6). Nevertheless, the diffusion is still facilitated by the presence of interstitial anions. We propose that in low-temperature Region II, the primary source of these interstitial anions is the surface, or anti-Frenkel disorder within the near-surface layer. This would account for the observed decrease in the defect formation energy Ef,eff.
The migration energies of interstitial anions in Region II are calculated as follows:
- -
- EM(PuO2, II) = 1.87 − 0.56 = 1.31 eV;
- -
- EM(ThO2, II) = 3.15 − 1.22 = 1.93 eV.
These values are close to those in Region I, indicating the similarity of the anion diffusion mechanisms in both regions. Notably, the EM(PuO2, II) value for PuO2 approaches the experimental estimate of 1.58 eV for the activation energy of low-temperature oxygen interstitial diffusion from Ref. [5].
Figure 3 and Figure 4 compare the simulations performed with free-surface boundary conditions for PuO2 and ThO2 nanocrystals consisting of 5460 and 15,960 particles. It can be seen that for the larger crystallites, the position of the kink in the lnD = f(1/kT) dependencies remains unchanged, and the diffusion activation energies ED are also unaffected.
This result indicates that the formation of Region II may be independent of the crystallite size, a finding that requires further investigation. If this holds true, a similar oxygen transport mechanism could be applicable to real crystals, where the role of the surface may be played by grain boundaries or other extended defects.
It should be noted that in Region II, we did not observe the migration of anion vacancies through the internal region of the model nanocrystals. The methodology for processing the simulation data allowed for detecting the vacancy migration, since the movement of cation vacancies was detected in a previous study [20] investigating cation diffusion in (UxPuyTh1−x−y)O2 nanocrystals (at temperatures above 2700 K). We can hypothesize that at low temperatures, anion vacancies are bound to the nanocrystal surface. Consequently, their migration into the central region is a rarer event than the appearance of interstitial anions.
3.6. The Effect of Model Nanocrystal Size on Low-Temperature Cation Diffusion
As discussed above, increasing the size of the model system from 5460 to 15,960 particles had virtually no effect on the calculated values of the bulk oxygen diffusion coefficient D in pure PuO2 and ThO2 nanocrystals. Furthermore, the fundamental discrepancy between the results obtained with free-surface and periodic boundary conditions remained unchanged.
To verify the reliability of this result, we additionally calculated the D(PuO2) and D(ThO2) values for model systems of N = 11,628 and N = 27,600 particles at temperatures of T(PuO2) = 1400 K and T(ThO2) = 1800 K, which belong to low-temperature Region II. The D values remained practically unchanged, as shown in Figure 11. Further investigation is required to determine the reasons for such stability of the diffusion coefficient.
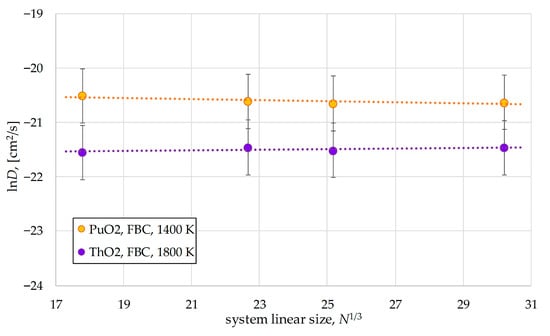
Figure 11.
Test dependencies of the oxygen diffusion coefficient on the size of PuO2 and ThO2 model systems. The temperatures considered correspond to the low-temperature diffusion regime.
3.7. Influence of Plutonium and Thorium Cation Arrangement in the Mixed Oxide on the Oxygen Diffusion Coefficient
In order to investigate the sensitivity of the oxygen diffusion coefficient to the mutual arrangement of plutonium and thorium cations in the mixed oxide (PuxTh1−x)O2, we obtained the temperature dependences D(T) for the (Pu0.25Th0.75)O2 composition using two methods: regular and random cation alternation, as described in the Section 2.
The relationship between the two dependencies is illustrated in Arrhenius coordinates in Figure 12. For comparison, the lnD = f(1/kT) dependence obtained by random placement of plutonium for the (Pu0.125Th0.875)O2 composition is also shown. Additionally, experimental data for pure ThO2 [38,39,40] are presented, which are in close agreement with the simulation results provided in this figure.
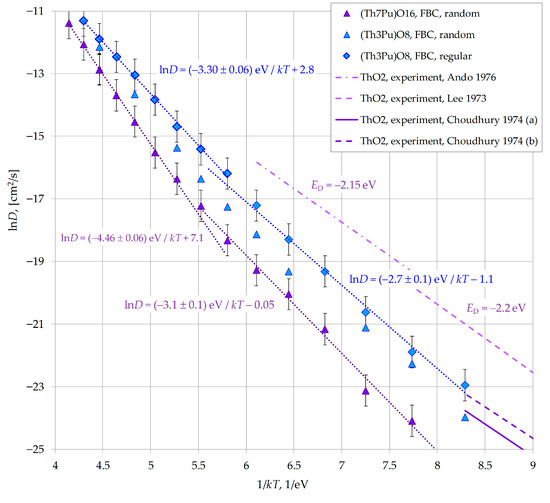
Figure 12.
Effect of plutonium arrangement method on oxygen mobility in the mixed oxide (Pu0.25Th0.75)O2. Data from other works in this Figure are from: Lee 1973 [38]; Ando 1976 [39]; Choudhury 1974 [40].
It can be seen that the random placement of plutonium cations systematically underestimates the oxygen diffusion coefficient compared to the regular placement, but does not lead to a fundamental change in the D values or in the temperature dependence of this coefficient.
To clarify the mechanism of the plutonium impurity effect on oxygen migration, we tracked the plutonium-to-thorium ratio in the immediate vicinity of oxygen anions undergoing diffusion jumps (crystallite (Pu0.25Th0.75)O2, free-surface border conditions, random Pu distribution, T = 1700 K, low-temperature Region II).
It was found that the probability of finding plutonium is increased near anions that are displaced by another interstitial ion from their lattice site. The Pu:Th ratio in the first coordination shell of the displaced anions was 0.52:1, whereas the nominal crystal composition was Pu:Th = 3:1.
This suggests that in (PuxTh1−x)O2 oxides, oxygen anions are less strongly bound to plutonium than to thorium, so the presence of plutonium promotes interstitialcy migration. With a random distribution of plutonium in the crystallites, plutonium-depleted regions may have formed, which limited oxygen diffusion.
3.8. Activation Energies for Oxygen Diffusion in Mixed Oxides (PuxTh1−x)O2
The effective activation energies ED for oxygen diffusion obtained in this work for various compositions of the model nanocrystals (comprising 5460 particles) are summarized in Table 1. The table also presents the boundary temperatures between high-temperature Region I and low-temperature Region II (TI->II).

Table 1.
The effective activation energies for oxygen diffusion in (PuxTh1−x)O2.
As can be seen from Table 1, there is a trend of increasing ED with increasing thorium content, which is consistent with experimental data for the pure oxides PuO2 and ThO2 [35,36,37,38,39,40]. Furthermore, the boundary of the low-temperature region shifts towards higher temperatures as the thorium content increases, which qualitatively corresponds to the increase in the melting point of the crystal.
4. Conclusions
In this work, oxygen diffusion in (PuxTh1−x)O2 mixed oxide crystals was investigated using molecular dynamics simulation. The primary model systems were isolated nanocrystals consisting of 5460 and 15,960 particles, featuring a free surface. The oxygen diffusion coefficient in the model systems increased with decreasing thorium content, which correlates with the decrease in the melting temperature of (PuxTh1−x)O2 crystals as x varies from 0 to 1. For plutonium contents exceeding 50%, the oxygen diffusion coefficients were virtually identical to those obtained for pure PuO2.
For all thorium-to-plutonium ratios, the temperature dependence of D(T) exhibited non-linearity in the Arrhenius coordinates lnD = f(1/kT). The three linear segments of these dependencies corresponded to the superionic state, a transitional region, and the low-temperature crystalline phase. This shape of the calculated lnD = f(1/kT) curves is similar to the experimental temperature dependencies of ionic conductivity for structural analogs—CaF2, SrF2, BaF2, and SrCl2 crystals—reported in [10].
In the superionic state, the effective activation energy for diffusion was independent of the (PuxTh1−x)O2 composition. The obtained values, close to 1.0 eV, are in good agreement with existing computational results for uranium dioxide [15,18].
The transitional region between the superionic and low-temperature phases corresponded to diffusion coefficients exceeding 5 × 10⁻⁸ cm2/s. In this region, the results obtained from simulations using free-surface and periodic boundary conditions coincided. The effective formation energies of interstitial ions obtained in this region—Ef,eff(PuO2, I) = 2.52 eV and Ef,eff(ThO2, I) = 2.9 eV—are close to the experimental value of 2.3 eV measured for UO2 at high temperatures (2000 K to 3000 K) in [7]. The effective activation energies for oxygen diffusion ED in this region are elevated compared to low-temperature experimental data, which may be attributed to a difference in the mechanisms of interstitial anion generation.
For the first time, we investigated the low-temperature region in modeled PuO2 and ThO2 nanocrystals with free surfaces, where the formation energy for bulk anion interstitials is significantly reduced. Due to this reduction in energy, the lnD = f(1/kT) plot showed quantitative agreement with experimental data. For ThO2, the calculated ED value converged significantly with experimental results.
The existence of a similar temperature regime in real PuO2 and ThO2 crystals is supported by the agreement between the modeled lnD = f(1/kT) curves and the experimental ionic conductivity data of their structural analogs, CaF2, SrF2, BaF2, and SrCl2 [10].
The transition from the high-temperature to the low-temperature oxygen migration regime in this work required the use of free-surface border conditions. This suggests that the surface influences low-temperature oxygen migration within the volume of the nanocrystals. However, in this work the diffusion coefficient was insensitive to the size of the model systems. This finding implies that analogous bulk diffusion mechanisms, potentially associated with distant grain boundaries and extended defects, may also be significant in real crystals of macroscopic size. Similar results were obtained by Jin et al. for thorium dioxide in a recent study [43].
Author Contributions
Conceptualization, D.D.S., K.A.N., Y.A.K. and S.K.G.; methodology, D.D.S., K.A.N., D.A.U., A.S.B. and S.K.G.; software, K.A.N., D.A.U. and A.S.B.; validation, D.D.S., Y.A.K. and K.A.N.; formal analysis, D.D.S., K.A.N. and S.S.P.; investigation, D.D.S., K.A.N., D.A.U., A.S.B. and S.S.P.; resources, D.D.S. and K.A.N.; data curation, D.D.S.; writing—original draft preparation, D.D.S. and K.A.N.; writing—review and editing, D.D.S., K.A.N. and S.S.P.; visualization, D.D.S. and S.S.P.; supervision, K.A.N., Y.A.K. and S.K.G.; project administration, D.D.S.; funding acquisition, D.D.S. and S.S.P. All authors have read and agreed to the published version of the manuscript.
Funding
This research was funded by the Science Committee of the Ministry of Education and Science of the Republic of Kazakhstan (Grant No. AP19174919). S.S.P. thanks the Ministry of Science and Higher Education of the Russian Federation, project No. FEUZ-2023-0013.
Data Availability Statement
The original contributions presented in this study are included in the article. Further inquiries can be directed to the corresponding author(s).
Conflicts of Interest
Author Anton S. Boyarchenkov is employed by company OOO “Vision Labs”, Podsosensky Lane, bld. 23, str. 3, 101000, Moscow, Russia. The authors declare that this affiliation has not influenced the design, outcomes, or interpretation of the research presented in this manuscript.
References
- Ghosh, P.S.; Kuganathan, N.; Galvin, C.O.T.; Arya, A.; Dey, G.K.; Dutta, B.K.; Grimes, R.W. Melting Behavior of (Th,U)O2 and (Th,Pu)O2 Mixed Oxides. J. Nucl. Mater. 2016, 479, 112–122. [Google Scholar] [CrossRef]
- Hur, J.-M.; Hong, S.-S.; Lee, H. Electrochemical reduction of UO2 to U in a LiCl–KCl–Li2O molten salt. J. Radioanal. Nucl. Chem. 2013, 295, 851–854. [Google Scholar] [CrossRef]
- Choi, E.-Y.; Won, C.Y.; Cha, J.-S.; Park, W.; Im, H.S.; Hong, S.S.; Hur, J.-M. Electrochemical reduction of UO2 in LiCl–Li2O molten salt using porous and nonporous anode shrouds. J. Nucl. Mater. 2014, 444, 261–269. [Google Scholar] [CrossRef]
- Yoo, T.-S.; Herrmann, S.D.; Yoon, S.-J.; Marsden, K.C. Analysis and Modeling of Oxide Reduction Processes for Uranium Oxides. J. Nucl. Mater. 2021, 545, 152625. [Google Scholar] [CrossRef]
- Matzke, H. Atomic Transport Properties in UO2 and Mixed Oxides (U, Pu)O2. J. Chem. Soc. Faraday Trans. 2 Mol. Chem. Phys. 1987, 83, 1121–1142. [Google Scholar] [CrossRef]
- Murch, G.E.; Catlow, C.R.A. Oxygen Diffusion in UO2, ThO2 and PuO2: A Review. J. Chem. Soc. Faraday Trans. 2 Mol. Chem. Phys. 1987, 83, 1157–1169. [Google Scholar] [CrossRef]
- Clausen, K.; Hayes, W.; Macdonald, J.E.; Osborn, R.; Hutchings, M.T. Observation of Oxygen Frenkel Disorder in Uranium Dioxide above 2000 K by Use of Neutron-Scattering Techniques. Phys. Rev. Lett. 1984, 52, 1238–1241. [Google Scholar] [CrossRef]
- Clausen, K.N.; Hackett, M.A.; Hayes, W.; Hull, S.; Hutchings, M.T.; Macdonald, J.E.; McEwen, K.A.; Osborn, R.; Steigenberger, U. Coherent Diffuse Neutron Scattering from UO2 and ThO2 at Temperatures above 2000 K. Phys. B Condens. Matter 1989, 156–157, 103–106. [Google Scholar] [CrossRef]
- Vauchy, R.; Robisson, A.-C.; Bienvenu, P.; Roure, I.; Hodaj, F.; Garcia, P. Oxygen Self-Diffusion in Polycrystalline Uranium-Plutonium Mixed Oxide U0.55Pu0.45O2. J. Nucl. Mater. 2015, 467, 886–893. [Google Scholar] [CrossRef]
- Voronin, B.M.; Volkov, S.V. Ionic Conductivity of Fluorite-Type Crystals CaF2, SrF2, BaF2, and SrCl2 at High Temperatures. J. Phys. Chem. Solids 2001, 62, 1349–1358. [Google Scholar] [CrossRef]
- Murphy, S.T.; Cooper, M.W.D.; Grimes, R.W. Point Defects and Non-Stoichiometry in Thoria. Solid State Ion. 2014, 267, 80–87. [Google Scholar] [CrossRef]
- Nakamura, H.; Machida, M. A First-Principles Study on Point Defects in Plutonium Dioxide. Prog. Nucl. Sci. Technol. 2018, 5, 132–135. [Google Scholar] [CrossRef]
- Balboa, H.; Van Brutzel, L.; Chartier, A.; Le Bouar, Y. Assessment of Empirical Potential for MOX Nuclear Fuels and Thermomechanical Properties. J. Nucl. Mater. 2017, 495, 67–79. [Google Scholar] [CrossRef]
- Wang, L.F.; Sun, B.; Liu, H.F.; Lin, D.Y.; Song, H.F. Thermodynamics and Kinetics of Intrinsic Point Defects in Plutonium Dioxides. J. Nucl. Mater. 2019, 526, 151762. [Google Scholar] [CrossRef]
- Potashnikov, S.I.; Boyarchenkov, A.S.; Nekrasov, K.A.; Kupryazhkin, A.Y. High-Precision Molecular Dynamics Simulation of UO2–PuO2: Anion Self-Diffusion in UO2. J. Nucl. Mater. 2013, 433, 215–224. [Google Scholar] [CrossRef]
- Govers, K.; Lemehov, S.E.; Hou, M.; Verwerft, M. Comparison of Interatomic Potentials for UO2: Part II: Molecular Dynamics Simulations. J. Nucl. Mater. 2008, 376, 66–77. [Google Scholar] [CrossRef]
- Balboa, H.; Van Brutzel, L.; Chartier, A.; Le Bouar, Y. Damage Characterization of (U,Pu)O2 Under Irradiation by Molecular Dynamics Simulations. J. Nucl. Mater. 2018, 512, 440–451. [Google Scholar] [CrossRef]
- Kovalenko, M.A.; Kupryazhkin, A.Y. Mechanisms of Exchange and Anion Frenkel Diffusion in Uranium Dioxide: Molecular Dynamics Study. J. Nucl. Mater. 2019, 522, 255–264. [Google Scholar] [CrossRef]
- Kovalenko, M.A.; Kupryazhkin, A.Y. States of the Schottky Defect in Uranium Dioxide and Other Fluorite Type Crystals: Molecular Dynamics Study. J. Alloys Compd. 2015, 645, 405–413. [Google Scholar] [CrossRef]
- Antropov, A.; Stegailov, V. Ultrafast Diffusion of Overpressurized Gas Filled Nanobubbles in UO2. J. Nucl. Mater. 2021, 551, 152942. [Google Scholar] [CrossRef]
- Pitskhelaury, S.; Seitov, D.; Nekrasov, K.; Boyarchenkov, A.; Kupryazhkin, A.; Gupta, S.K. Influence of the Superionic Transition on the Diffusion of Cations in ThO2 Nanocrystals: A Molecular Dynamics Simulation. Mater. Today Proc. 2023, in press. [Google Scholar] [CrossRef]
- Seitov, D.D.; Nekrasov, K.A.; Pitskhelaury, S.S.; Abuova, F.U.; Kabdrakhimova, G.D.; Abuova, A.U.; Gupta, S.K. Computational Modeling of Cation Diffusion in Isolated Nanocrystals of Mixed Uranium, Plutonium and Thorium Dioxides. Crystals 2025, 15, 532. [Google Scholar] [CrossRef]
- Castell, M.R. Wulff Shape of Microscopic Voids in UO2 Crystals. Phys. Rev. B 2003, 68, 235411. [Google Scholar] [CrossRef]
- Momma, K.; Izumi, F. VESTA 3 for three-dimensional visualization of crystal, volumetric and morphology data. J. Appl. Crystallogr. 2011, 44, 1272–1276. [Google Scholar] [CrossRef]
- Potashnikov, S.I.; Boyarchenkov, A.S.; Nekrasov, K.A.; Kupryazhkin, A.Y. High-Precision Molecular Dynamics Simulation of UO2–PuO2: Pair Potentials Comparison in UO2. J. Nucl. Mater. 2011, 419, 217–225. [Google Scholar] [CrossRef]
- Boyarchenkov, A.S.; Nekrasov, K.A.; Kupryazhkin, A.Y.; Gupta, S.K. A Novel Empirical Potential for High-Temperature Molecular Dynamics Simulation of ThO2 and MOX Nuclear Fuel Crystals. AIP Conf. Proc. 2020, 2313, 030064. [Google Scholar] [CrossRef]
- Cooper, M.W.D.; Rushton, M.J.D.; Grimes, R.W. A Many-Body Potential Approach to Modelling the Thermomechanical Properties of Actinide Oxides. J. Phys. Condens. Matter 2014, 26, 105401. [Google Scholar] [CrossRef]
- Verlet, L. Computer “Experiments” on Classical Fluids. I. Thermodynamical Properties of Lennard-Jones Molecules. Phys. Rev. 1967, 159, 98–103. [Google Scholar] [CrossRef]
- Box, G.E.P.; Muller, M.E. A note on the generation of random normal deviates. Ann. Math. Stat. 1958, 29, 610–611. [Google Scholar] [CrossRef]
- Berendsen, H.J.C.; Postma, J.P.M.; van Gunsteren, W.F.; DiNola, A.; Haak, J.R. Molecular Dynamics with Coupling to an External Bath. J. Chem. Phys. 1984, 81, 3684–3690. [Google Scholar] [CrossRef]
- Bussi, G.; Donadio, D.; Parrinello, M. Canonical Sampling Through Velocity Rescaling. J. Chem. Phys. 2007, 126, 014101. [Google Scholar] [CrossRef]
- Plimpton, S. Fast Parallel Algorithms for Short-Range Molecular Dynamics. J. Comput. Phys. 1995, 117, 1–19. [Google Scholar] [CrossRef]
- Nosé, S. A Unified Formulation of the Constant Temperature Molecular Dynamics Methods. J. Chem. Phys. 1984, 81, 511–519. [Google Scholar] [CrossRef]
- Hoover, W.G. Canonical Dynamics: Equilibrium Phase-Space Distributions. Phys. Rev. A 1985, 31, 1695–1697. [Google Scholar] [CrossRef] [PubMed]
- Deaton, R.L.; Wiedenheft, C.J. Self-diffusion of oxygen in 238PuO2. J. Inorg. Nucl. Chem. 1973, 35, 649–650. [Google Scholar] [CrossRef]
- Bayoglu, A.S.; Giordano, A.; Lorenzelli, R. Mesure de l’autodiffusion de l’oxygene dans PuO2.00 par echange isotopique. J. Nucl. Mater. 1983, 113, 71–74. [Google Scholar] [CrossRef]
- Edwards, H.S.; Rosenberg, A.F.; Bittel, J.T. Aeronautical Systems Division; Wright-Patterson Air Force Base: Dayton, OH, USA, 1963; ASD-TDR-63-635. [Google Scholar]
- Lee, H.M. Electrical conductivity of UO2-ThO2 solid solutions. J. Nucl. Mater. 1973, 48, 107–117. [Google Scholar] [CrossRef]
- Ando, K.; Oishi, Y.; Hidaka, Y. Self-Diffusion of Oxygen in Single Crystal Thorium Oxide. J. Chem. Phys. 1976, 65, 2751–2755. [Google Scholar] [CrossRef]
- Choudhury, N.S.; Patterson, J.W. Transition from Ionic to Electronic Conduction in Pure ThO2 Under Reducing Conditions. J. Am. Ceram. Soc. 1974, 57, 90–93. [Google Scholar] [CrossRef]
- Pavlov, T.R.; Wangle, T.; Wenman, M.R.; Tyrpekl, V.; Vlahovic, L.; Robba, D.; Van Uffelen, P.; Konings, R.J.M.; Grimes, R.W. High Temperature Measurements and Condensed Matter Analysis of the Thermo-Physical Properties of ThO2. Sci. Rep. 2018, 8, 5038. [Google Scholar] [CrossRef]
- De Bruycker, F.; Boboridis, K.; Manara, D.; Pöml, P.; Rini, M.; Konings, R.J.M. Reassessing the Melting Temperature of PuO2. Mater. Today 2010, 13, 52–55. [Google Scholar] [CrossRef]
- Jin, M.; Miao, J.; Chen, B.; Khafizov, M.; Zhang, Y.; Hurley, D.H. Extended Defects-Enhanced Oxygen Diffusion in ThO2. Comput. Mater. Sci. 2024, 235, 112842. [Google Scholar] [CrossRef]
Disclaimer/Publisher’s Note: The statements, opinions and data contained in all publications are solely those of the individual author(s) and contributor(s) and not of MDPI and/or the editor(s). MDPI and/or the editor(s) disclaim responsibility for any injury to people or property resulting from any ideas, methods, instructions or products referred to in the content. |
© 2025 by the authors. Licensee MDPI, Basel, Switzerland. This article is an open access article distributed under the terms and conditions of the Creative Commons Attribution (CC BY) license (https://creativecommons.org/licenses/by/4.0/).