Abstract
NASICON-type Li1+XFeXTi2-X(PO4)3 (x = 0.1, 0.3, 0.4) solid electrolytes for all-solid-state Li-ion batteries were synthesized using a sol–gel method. This study investigated the impact of substituting Fe3+ (0.645 Å), a trivalent cation, for Ti4+ (0.605 Å) on ionic conductivity. Li1+XFeXTi2-X(PO4)3 samples, subjected to various sintering temperatures, were characterized using TG-DTA, XRD with Rietveld refinement, XPS, FE-SEM, and AC impedance to evaluate composition, crystal structure, fracture-surface morphology, densification, and ionic conductivity. XRD analysis confirmed the formation of single-crystalline NASICON-type Li1+XFeXTi2-X(PO4)3 at all sintering temperatures. However, impurities in the secondary phase emerged owing to the high sintering temperature above 1000 °C and increased Fe content. Sintered density increased with the densification of Li1+XFeXTi2-X(PO4)3, as evidenced by FE-SEM observations of sharper edges of larger quasi-cubic grains at elevated sintering temperatures. At 1000 °C, with Fe content exceeding 0.4, grain coarsening resulted in additional grain boundaries and internal cracks, thereby reducing the sintered density. Li1.3Fe0.3Ti1.7(PO4)3 sintered at 900 °C exhibited the highest density among the other conditions and achieved the maximum total ionic conductivity of 1.51 × 10⁻⁴ S/cm at room temperature, with the lowest activation energy for Li-ion transport at 0.37 eV. In contrast, Li1.4Fe0.4Ti1.6(PO4)3 sintered at 1000 °C demonstrated reduced ionic conductivity owing to increased complex impedance associated with secondary phases and grain crack formation.
1. Introduction
In recent years, the escalating demand for mid- to large-scale energy storage in electric vehicles (EVs) and battery energy storage systems (BESS) necessitates Li-ion batteries (LIBs) that concurrently provide high energy and power densities [1,2]. Nevertheless, the conventional liquid electrolytes in LIBs depend on flammable organic solvents, leading to safety concerns such as leakage, fire hazards, and limited cycle life [3,4]. To enhance safety while preserving performance, extensive research has investigated inorganic solid electrolytes—including Na Super ionic Conductor (NASICON)-, perovskite-, garnet-, and sulfide-type materials—that demonstrate favorable electrochemical and thermal stability at ambient conditions [5,6,7,8].
Among the candidates for solid electrolytes, NASICON-type materials, characterized by the general formula AMe2(PO4)3 (where A = Li+, Na+, K+; Me = Ge4+, Ti4+, Zr4+, etc.), crystallize within a rhombohedral framework. This structure is composed of corner-sharing PO4 tetrahedra and MeO6 octahedra, which facilitate robust structural integrity and interconnected Li-ion pathways, thereby enhancing rapid ion transport [1,2,9,10,11]. LiTi2(PO4)3 is a representative NASICON-type material with grain ionic conductivity of approximately 10−4 S/cm. However, its total conductivity is often constrained (10−8–10−6 S/cm) owing to significant grain-boundary resistance [1,9,12]. To address this limitation, aliovalent substitution in Li1+XMXTi2-X(PO4)3—where a trivalent transition metal (M3+) substitutes for Ti4+—has been utilized to augment Li content and improve conduction while maintaining charge balance [13]. The Al3+-substituted Li1+XAlXTi2-X(PO4)3 electrolyte is the most extensively investigated variant, consistently demonstrating high ionic conductivities and reliable enhancement of Li+ transport [1,12,13,14,15,16,17,18,19,20,21,22,23,24,25,26].
Various synthetic methodologies have been documented for the preparation of Li1+XAlXTi2-X(PO4)3 and related Li1+XMXTi2-X(PO4)3 compositions, including: (1) solid-state reaction [13,15,16], (2) sol-gel synthesis [16,17,18,19,20], (3) other wet-chemical synthesis [1,16,21,22,23,24], and (4) melting and quenching [16,25,26]. Despite the availability of numerous synthetic approaches within these categories, meticulous design of the synthesis procedure is imperative, as achieving a single-phase product while preventing the formation of impurity phases presents a significant challenge. Most Li1+XMXTi2-X(PO4)3 compounds are prepared by solid-state methods, which necessitate high thermal treatment temperatures exceeding 1200 °C and extended holding durations. These methods have several drawbacks, including substantial energy consumption during production, potential contamination from impurities, irregular particle morphologies, broad particle size distribution, and loss of Li ions. Conversely, the sol-gel method offers numerous benefits for synthesizing multicomponent oxides and Li-based solid electrolytes, such as lower processing temperatures, precise compositional control, high purity, excellent homogeneity with narrow size distributions, morphological versatility, and potential for nanostructuring.
Despite extensive research on Al3+ substitution, systematic investigations of Fe3+ substitution in LiTi2(PO4)3 are scarce. Fe3+ and Al3+ have the same number of valence electrons, but Fe possesses distinct ionic radii and electronic configurations, which can induce subtle modifications in the lattice parameters, distort the Ti–O framework, and alter the Li+ diffusion pathways. These features suggest that Fe substitution may provide a unique means of tuning the ionic conductivity; however, only limited and fragmentary reports have explored this possibility [27,28,29,30]. Furthermore, very few studies have examined Fe-substituted Li1+XFeXTi2-X(PO4)3 synthesized specifically using the sol-gel route, despite its advantages in achieving phase-pure and compositionally homogeneous products.
In this work, we aim to bridge this gap by synthesizing Li1+XFeXTi2-X(PO4)3 (x = 0.1, 0.3, 0.4) using a sol-gel method and systematically evaluating the effects of Fe contents on the crystal structure, grain size, morphology, and ionic conductivity of the synthesized materials. Unlike prior studies that primarily focused on Al doping, this study emphasizes Fe doping as an underexplored but potentially promising strategy for enhancing Li+ transport in NASICON frameworks. Through complex impedance spectroscopy and structural characterization, we elucidated the correlation between Fe content, microstructural evolution, and ionic conductivity. These results provide new insights into the role of Fe3+ in tailoring NASICON-type electrolytes and highlight the sol-gel approach as a versatile synthesis method for designing next-generation solid electrolytes.
2. Experimental Procedures
In this study, we employed the sol-gel method to synthesize Li1+XFeXTi2-X(PO4)3 (x = 0.1, 0.3, 0.4) solid electrolytes. Initially, an aqueous solution of the Ti source was prepared by diluting 6 mL of HNO3 (60%, Matsunoen Chemicals Ltd., Osaka, Japan) in 50 mL of deionized water to catalyze the reaction for dissolving 0.03 mol of TiO(C5H7O2)2 (TCI, Tokyo, Japan) powder. Acetylacetone (99%, Samchun Chemical, Gyeonggi-do, Republic of Korea) was introduced as a chelating agent under stirring, maintaining a TiO(C5H7O2)2:acetylacetone molar ratio of 1:2. Concurrently, aqueous solutions of LiNO3 (99.0%, Kanto, Tokyo, Japan), Fe(NO3)3∙9H2O (99.0%, Fujifilm, Osaka, Japan), and NH4H2PO4 (99.0%, Junsei, Tokyo, Japan) were prepared in stoichiometric proportions and combined with the Ti solution under stirring to produce a homogeneous sol, which was aged at approximately 75 °C until gelation occurred. The resulting gel was cooled, oven-dried, and ground in an agate mortar to obtain a precursor powder.
The precursor was subjected to thermal treatment in an alumina crucible at 450 °C for 3 h, followed by regrinding to obtain the final powder. Pellets with a diameter of 13 mm were uniaxially pressed at a pressure of 350 MPa and subsequently sintered for 6 h at temperatures ranging from 800 to 1000 °C to achieve densification. The sintered densities of the resulting bodies at each temperature for Li1+XFeXTi2-X(PO4)3, synthesized with varying amounts of Fe, were determined using the apparent density.
Thermogravimetric and differential thermal analysis (TG-DTA, MAC Science 2000, Tokyo, Japan) was employed to assess weight loss and thermal decomposition changes of the obtained precursors under atmospheric conditions. Phase analysis was conducted using X-ray diffraction (XRD, X’Pert Pro, Panalytical, Cu-Kα, 40 KV, 30 mA, 4°/min, 2θ = 10–80°, Almelo, The Netherlands) to investigate the presence of crystalline and secondary phases of Li1+XFeXTi2-X(PO4)3, with Fe content determined by thermal treatment at different temperatures. The crystal structure of the materials was generally determined through Rietveld refinement of the XRD profile [31,32,33]. This analysis was performed using the powder plug-in included in Rigaku’s SmartLab Studio II (ver. 4.6) software to evaluate crystal properties, such as lattice parameters, impurities, and crystallinity. X-ray photoelectron spectroscopy (XPS, MultiLab, ESCA 2000, Monochromator Al-Kα, VG Microtech, Uckfield, Sussex, UK) was utilized to verify elemental states and valences in the synthesized Li1+XFeXTi2-X(PO4)3. The fracture-surface morphology and densification of Li1+XFeXTi2-X(PO4)3 as a function of sintering temperature were examined using a Field Emission-Scanning Electron Microscope (FE-SEM, Hitachi S-4800, Tokyo, Japan). Complex impedance was measured from room temperature to 300 °C with an LCR meter (HIOKI 3532-50, Hioki Electric Co., Ltd., Nagano, Japan) using a two-terminal AC method to determine total ionic conductivity and activation energy. Detailed synthesis and measurement methods for preparing Li1+XFeXTi2-X(PO4)3 are available in the literature [34].
3. Results and Discussions
Thermal behavior analysis was conducted to identify a suitable pre-calcination temperature for the dry precursors synthesized via the sol-gel method with varying Fe contents. As reported in the authors’ previous study, all precursors with varying Fe contents exhibited similar thermal behavior, with approximately 40% weight loss attributed to organic matter decomposition and solvent evaporation occurring up to approximately 430 °C as the temperature increased [34]. Although no significant weight change was observed, a small exothermic peak at approximately 630 °C indicated that the crystallization temperature for Li1+XFeXTi2-X(PO4)3 (x = 0.1, 0.3, 0.4) was above 630 °C, as the synthesized amorphous precursor transitioned into a crystalline phase through crystallization. Therefore, the optimal pre-calcination temperature for each precursor was determined to be 450 °C. This decision was made to remove the organic components completely while preventing unwanted particle growth, phase segregation, or lithium loss, which could occur at higher temperatures. The choice of 450 °C facilitates morphological control and maintains the powder features synthesized via the sol-gel method, which is beneficial for final sintering or electrochemical applications. The representative results of the thermal behavior analysis of the sol-gel precursors Li1.3Fe0.3Ti1.7(PO4)3 are shown in Figure 1.
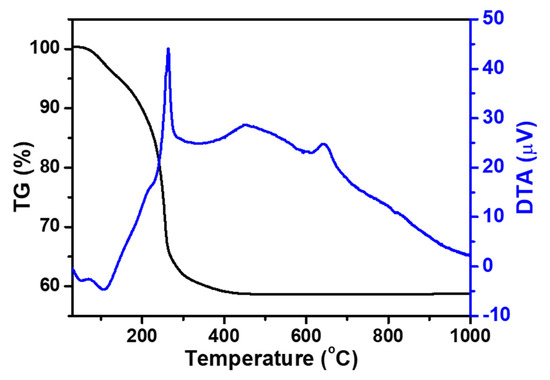
Figure 1.
TG-DTA curves of the Li1.3Fe0.3Ti1.7(PO4)3 sol-gel precursors.
Figure 2 shows the crystalline phase results obtained through XRD measurements of Li1+XFeXTi2-X(PO4)3 (x = 0.1, 0.3, 0.4) solid electrolyte powders, which were prepared by calcining precursors with varying Fe contents synthesized using the sol-gel method and thermal-treating them at sintering temperatures ranging from 800 to 1000 °C at 100 °C intervals for 6 h. The XRD patterns of Li1+XFeXTi2-X(PO4)3 powders with varying Fe contents at different sintering temperatures revealed a rhombohedral crystal structure with a group of the NASICON system corresponding to LiTi2(PO4)3 (JCPDS 35-0754). As the sintering temperature and Fe content increased, the diffraction pattern peaks became sharper, and their intensities increased. This indicates that a high-quality crystalline phase of the Li-based solid electrolyte was obtained. Li1+XFeXTi2-X(PO4)3 with an Fe content up to x = 0.3 exhibited a single-phase diffraction pattern with no secondary phase across all thermal-treatment temperatures. However, at all thermal treatment temperatures, Li1.4Fe0.4Ti1.6(PO4)3 with an Fe content of x = 0.4 exhibited an additional diffraction peak of a very weak secondary phase at 2θ = 23.6°. This was attributed to the partial substitution of Fe3+ (ionic radius = 0.645 Å), which has a slightly larger ionic radius than Ti4+ (ionic radius = 0.605 Å). When the Fe content exceeds x = 0.4, this indicates the limit of the solid solubility, which likely leads to the formation of an FePO4-like secondary phase (JCPDS 29-0715) [27,35,36]. Additionally, secondary phases, such as those attributed to FePO4, can result from Li volatilization during high-temperature sintering above 1000 °C. Partial substitution was structurally stable up to an Fe content of x = 0.3. When the Fe content is x = 0.4, the sample is thought to crystallize in a different crystal structure with lower symmetry, which was ascribed to monoclinic with a P21/n space group, as previously reported [29].
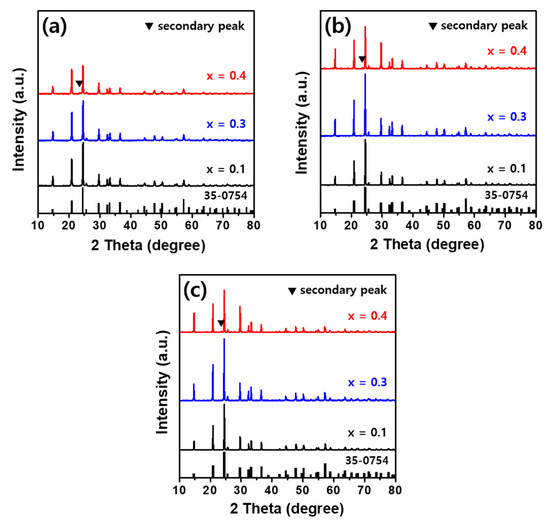
Figure 2.
XRD patterns of Li1+XFeXTi2-X(PO4)3 (x = 0.1, 0.3, 0.4) powders sintered for 6 h at (a) 800 °C, (b) 900 °C, and (c) 1000 °C.
Rietveld refinement was also conducted to generate more detailed information related to the structure of Li1+XFeXTi2-X(PO4)3. The initial model crystal structure of Li1.3Fe0.3Ti1.7(PO4)3 for the refinement method was obtained from a paper published by M. Pérez-Estébanez et al. [29]. Using the International Centre for Diffraction Data (ICDD 04-023-1708) were identified crystalline phases. Data from the measured powder XRD patterns were used to evaluate the cell lattice parameters of the samples. The process of reducing the difference between the measured diffraction pattern and calculated model was repeated using the least-squares method. In the Rietveld refinements, a pseudo-Voigt function, which is created by combining the Gaussian and Lorentz functions, was chosen to describe the line shape of the diffraction peaks.
Figure 3 shows the observed, calculated, and residual XRD patterns with Rietveld refinement results of the hand-milled Li1+XFeXTi2-X(PO4)3 (x = 0.1, 0.3, 0.4) powders from a pellet sintered at 900 °C for 6 h. All Li1+XFeXTi2-X(PO4)3 materials represented the pristine NASICON phase. Therefore, Li1+XFeXTi2-X(PO4)3 was obtained as a highly pure, well-crystall. FePO4 was commonly observed in the XRD patterns, even in trace amounts. It is well known that FePO4 acts as a resistive component and is detrimental to ionic conductivity. The lattice parameters estimated by Rietveld refinement for Li1+XFeXTi2-X(PO4)3 (x = 0.1, 0.3, 0.4), as presented in Table 1, are similar to those reported previously crystallographic data [13,29,30]. The unit cell parameters increased as the Fe content in Li1+XFeXTi2-X(PO4)3 increased, indicating unit cell expansion. This increase can be attributed to the larger ionic radius of Fe3+ compared with that of Ti4+. The final atomic coordinates and multiplicities of Li1+XFeXTi2-X(PO4)3 (x = 0.1, 0.3, 0.4) are listed in Table 2 [37].
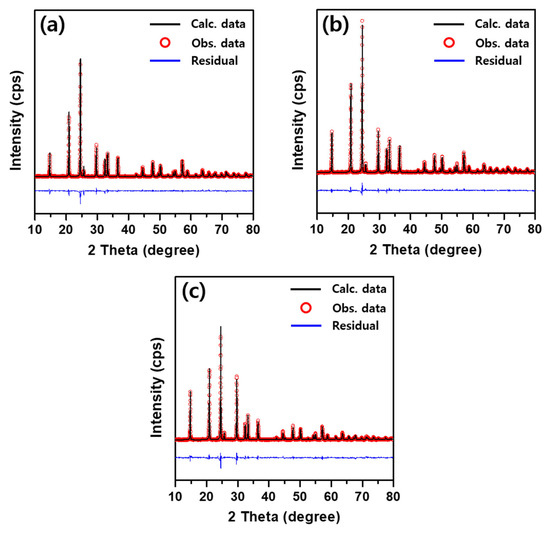
Figure 3.
Rietveld refinement plots for Li1+XFeXTi2-X(PO4)3 powders (x = 0.1 (a), 0.3 (b), 0.4 (c)) obtained from pellets sintered at 900 °C for 6 h.

Table 1.
Lattice parameters and cell volume from the Rietveld refinement for Li1+XFeXTi2-X(PO4)3 (x = 0.1, 0.3, 0.4) powders sintered at 900 °C for 6 h.
Table 2.
Atomic fractional coordinates and Wyckoff multiplicities for Li1+XFeXTi2-X(PO4)3 (x = 0.1, 0.3, 0.4) powders sintered at 900 °C for 6 h.
Table 3 summarizes the interatomic distances and R-factors obtained from the Rietveld refinements for Li1+XFeXTi2-X(PO4)3 (x = 0.1, 0.3, 0.4) powders sintered at 900 °C for 6 h. The R-factors obtained from the refinement analysis consisted of the weighted profile R-factor (RWP) and a reduced chi-square (χ2), which indicated the degree of Rietveld agreement. The RWP obtained in this work was lower than that reported in previous studies, indicating a better-fitting refinement result [27,28,29,30]. The small RWP values of less than 1% finally obtained suggest the validity of the refinement hypothesis of this study, especially with regard to the position of Li ions within the structure. In the Rietveld refinement of Li1.4Fe0.4Ti1.6(PO4)3, two distinct interatomic distances for P–O1 and P–O2 were observed. This bifurcation arises from the increased distortion of the PO4 tetrahedra owing to the local charge and size mismatch effects as Fe3+ replaces Ti4+. The mixed valency and charge compensation mechanisms affect the electron density distribution and induce asymmetry in the P–O bonding environment. The increase in Fe content at x = 0.4 appears to disrupt the uniformity of the P–O bond lengths, leading to the static or dynamic distortion of the tetrahedral units, which is captured as two separate distances in Rietveld refinement. Simultaneously, the Li–O bond distance decreased. This contraction can be attributed to enhanced Li+ localization near the negatively charged oxygen framework caused by Fe3+ substitution. The increased Fe3+ content results in more available interstitial Li-ions, which, in turn, intensifies the coulombic interactions and draws Li+ closer to the oxygen atoms, promoting more compact Li–O polyhedra. Furthermore, the partial Fe3+ occupancy at the Ti4+ sites causes lattice shrinkage owing to stronger Fe–O bonding than Ti–O, contributing to a more compact local environment around the Li-ions.
Table 3.
Selected interatomic distances and R-factors obtained by Rietveld refinement for Li1+XFeXTi2-X(PO4)3 (x = 0.1, 0.3, 0.4) powders sintered at 900 °C for 6 h.
To evaluate the presence of constituent elements, as well as the binding energy of internal ion occupancy positions and oxidation state in the synthesized Li1+XFeXTi2-X(PO4)3, XPS analysis was performed on Li1.3Fe0.3Ti1.7(PO4)3 sintered at 900 °C for 6 h, as illustrated in Figure 4. The characteristic binding energy spectra corresponding to Li 1s, P 2s, P 2p, Ti 2p, O 1s, and Fe 2p, as indicated by the full range of binding energies, confirmed the qualitative presence of each element in the synthesized solid electrolyte. The XPS spectrum for Li 1s exhibited very low intensity, with the central peak having a binding energy of approximately 56.8 eV. The spectra for Ti and Fe displayed distinct binding energies separated by a spin-orbit doublet. For Ti, the binding energies were identified as 459.7 eV and 465.6 eV at Ti 2p3/2 and Ti 2p1/2, respectively, indicating an oxidation state characteristic of Ti4+. Fe also demonstrated characteristic binding energies of Fe3+ equivalent to 712.5 eV and 726 eV at Fe 2p3/2 and Fe 2p1/2, respectively. This suggests that the partial substitution of Fe at the Ti site facilitated the synthesis of a solid electrolyte comprising Ti4+ and Fe3+ without altering their valences. Additionally, a binding energy of approximately 133.5 eV was observed, corresponding to P5+ in the form of (PO4)3. The binding energy of 284.6 eV for C 1s of the C−C is likely the result of contamination during exposure to air.
The production of dense sintered bodies is essential for obtaining solid electrolytes with excellent ion conductivity properties. Figure 5 presents the FE-SEM fracture-surface micrographs of the sintered bodies of the Li1+XFeXTi2-X(PO4)3 (x = 0.1, 0.3, 0.4) solid electrolyte, which were obtained by sintering each precursor prepared using the sol-gel method at each sintering temperature for 6 h. Figure 5a–c displays the FE-SEM images of the fracture-surfaces of Li1.1Fe0.1Ti1.9(PO4)3 at each sintering temperature. Overall, the small sub-µm-sized grains appeared loosely packed under all sintering temperature conditions. Although some neck formation owing to grain growth was observed as the sintering temperature increased, densification was minimal because many pores remained. Figure 5d–f shows images of the fracture-surfaces of Li1.3Fe0.3Ti1.7(PO4)3 at different sintering temperatures. With an increase in the Fe content, the grains exhibited both growth and densification, although small pores persisted between the grown grains. The grain morphology also changed from quasi-spherical to quasi-cube-like shapes. At 900 °C and 1000 °C, uniform grain sizes of approximately 1 μm and 2–3 μm, respectively, were observed in the fracture-surfaces of Li1.3Fe0.3Ti1.7(PO4)3, indicating significant densification. Figure 5g–i shows fracture-surfaces images of Li1.4Fe0.4Ti1.6(PO4)3 at different sintering temperatures. At the lower sintering temperature of 800 °C, results similar to those of the solid electrolytes with varying Fe contents were observed, with increased densification correlating with rising sintering temperatures and resulting grain growth. Notably, the fracture-surface of the solid electrolyte sintered at 1000 °C exhibited rapidly coarsening grains ranging from 3 to 10 μm. However, a closer examination of these surfaces revealed intragranular fracture patterns rather than intergranular fractures, suggesting that rapid grain coarsening may negatively impact the densification process, resulting in poor sintering properties [38]. The apparent density of the Li1+XFeXTi2-X(PO4)3 solid electrolytes with low Fe content slightly increased with higher sintering temperatures; however, this still resulted in lower sintered densities than other compositions. In contrast, at Fe contents of x = 0.3 and 0.4, a denser morphology was observed along with grain growth at elevated sintering temperatures, indicating an increased sintered density. However, the solid electrolyte sintered at 1000 °C with an Fe content of x = 0.4 exhibited cracks due to rapid grain coarsening and poor sintering properties caused by uneven contact between grains, which may negatively impact Li+ migration. The detailed results of the apparent sintered densities for each Li1+XFeXTi2-X(PO4)3 are presented in Table 4.

Figure 4.
XPS spectra of Li1.3Fe0.3Ti1.7(PO4)3 sintered at 900 °C for 6 h.
Figure 6 presents the Cole-Cole plot results of the AC complex impedance measured at room temperature for the Li1+XFeXTi2-X(PO4)3 (x = 0.1, 0.3, 0.4) solid electrolytes, which were prepared at different sintering temperatures. The complex impedance generally exhibited semicircular patterns in the high-frequency range, indicative of the total impedance of the grains and grain boundaries, while straight lines in the low-frequency range suggested the blocking of Li-ions by the electrodes. Figure 6a illustrates the impedance results for the Li1+XFeXTi2-X(PO4)3 (x = 0.1, 0.3, 0.4) sintered at 800 °C. Li1.1Fe0.1Ti1.9(PO4)3, characterized by a relatively low Fe content, demonstrated significantly larger impedance values owing to its less dense sintered structure. As the Fe content increased to x = 0.3, the impedance values decrease, attributed to the denser sintering nature. However, for Li1.4Fe0.4Ti1.6(PO4)3 with an increased Fe content, the impedance values increased again, attributed to the high resistance component associated with the presence of a secondary phase, as indicated by the XRD results. As depicted in the Cole-Cole plots in Figure 6b,c, the impedance measurements for the Li1+XFeXTi2-X(PO4)3 (x = 0.1, 0.3, 0.4) sintered at 900 °C and 1000 °C also exhibit similar results. The densification and increased sintering density owing to grain growth resulted in relatively lower impedance values. However, as shown in Figure 6c, the impedance of Li1+XFeXTi2-X(PO4)3 sintered at 1000 °C shows a slight increase compared to that sintered at 900 °C. This may be attributed to the elevated impedance component owing to grain boundaries and intragranular cracks formed by the rapid coarsening of grains at higher sintering temperatures [21,39]. Additionally, despite similar sintered densities, the impedance characteristics of the solid electrolyte increased owing to factors such as Li volatilization and the formation of a secondary phase, leading to Li deficiency and decreased Li mobility, ultimately affecting the impedance.

Figure 5.
FE-SEM fracture-surface micrographs of the sintered bodies Li1+XFeXTi2-X(PO4)3 (x = 0.1, 0.3, 0.4) after 6 h sintering at (a,d,g) 800 °C, (b,e,h) 900 °C, and (c,f,i) 1000 °C.
Table 4.
Apparent density, room temperature total ion conductivity (σtot), and activation energy (Ea) for Li1+XFeXTi2-X(PO4)3 (x = 0.1, 0.3, 0.4) sintered bodies for 6 h at 800~1000 °C.
Table 4.
Apparent density, room temperature total ion conductivity (σtot), and activation energy (Ea) for Li1+XFeXTi2-X(PO4)3 (x = 0.1, 0.3, 0.4) sintered bodies for 6 h at 800~1000 °C.
| Sintering Temperature (°C) | Fe Content (mol) | Apparent Density (%) | σtot,303K (S/cm) | Ea (eV) |
|---|---|---|---|---|
| 800 | 0.1 | 48 | 1.11 × 10⁻⁶ | 0.46 |
| 0.3 | 69 | 4.62 × 10⁻⁵ | 0.41 | |
| 0.4 | 60 | 9.13 × 10⁻⁶ | 0.46 | |
| 900 | 0.1 | 55 | 1.24 × 10⁻⁵ | 0.46 |
| 0.3 | 90 | 1.51 × 10⁻⁴ | 0.37 | |
| 0.4 | 88 | 7.69 × 10⁻⁵ | 0.38 | |
| 1000 | 0.1 | 74 | 1.14 × 10⁻⁵ | 0.44 |
| 0.3 | 89 | 9.23 × 10⁻⁵ | 0.38 | |
| 0.4 | 87 | 2.86 × 10⁻⁵ | 0.40 |

Figure 6.
Cole-Cole plots of room temperature complex impedance for Li1+XFeXTi2-X(PO4)3 (x = 0.1, 0.3, 0.4) sintered for 6 h at (a) 800 °C, (b) 900 °C, and (c) 1000 °C.
The total ionic conductivity, encompassing both grains and grain boundaries, was ascertained from impedance measurements conducted at room temperature,
where σtot represents the total ionic conductivity, l denotes the thickness of the solid electrolyte, Rtot is the measured impedance, and S signifies the electrode area. The total ionic conductivity as a function of sintering temperature and Fe content is detailed in Table 4. The maximum ionic conductivity of 1.51 × 10⁻⁴ S/cm was achieved with Li1.3Fe0.3Ti1.7(PO4)3 sintered at 900 °C. Although ionic conductivity generally increases with elevated Fe content and sintering temperature, the ionic conductivity of Li1.4Fe0.4Ti1.6(PO4)3 sintered at 1000 °C decreased to 2.86 × 10⁻⁵ S/cm. This reduction is attributed to the high resistance component of numerous grain boundaries and cracks resulting from rapid grain growth and uneven intergranular contact. As indicated in Table 4, the apparent sintered densities of the Li1+XFeXTi2-X(PO4)3 ranged from 48% to 90%, contingent on the Fe content and sintering temperature. Although these values fall below the 95% benchmark often cited for solid electrolytes, sintering aids were deliberately not employed, as secondary glassy phases can degrade ionic conductivity. Furthermore, advanced densification techniques were excluded to maintain a straightforward and reproducible fabrication process. Consequently, this study systematically evaluates the effects of Fe substitution on the structure, microstructure, and ionic conductivity under comparable processing conditions. As demonstrated by the Rietveld refinement results in Table 3, the observed decrease in the Li–O interatomic distance with increasing Fe content (x = 0.4) in Li1+XFeXTi2-X(PO4)3 direct impact on Li-ion conductivity. In NASICON-type structures, a three-dimensional framework facilitates interconnected pathways for Li+ migration through interstitial sites and channels. While a reduction in the Li–O interatomic distance generally suggests stronger interactions and potential stabilization of Li+ conduction paths, in the case of Li1.4Fe0.4Ti1.6(PO4)3, it is associated with a decrease in ionic conductivity. This is likely due to the excessive strengthening of the Li–O bonds, which impedes the mobility of Li ions within the NASICON framework. A moderate decrease in the Li–O distance can lower the energy barrier for hopping by stabilizing the intermediate states along the conduction pathway, thereby enhancing ion mobility. Furthermore, Fe3+ substitution increases the Li content, thereby increasing the Li+ carrier concentration. Combined with structural shrinkage and tighter Li–O interactions, these changes can optimize the bottleneck size of the conduction channels, improving the conductivity of Li+ across the framework. However, excess Li+ may occupy interstitial or previously vacant sites, leading to congestion within the conduction pathways and obstruction of the percolation channels. Therefore, although a moderate shortening of the Li–O distance may enhance conductivity, as evidenced by our results, excessive contraction is believed to exacerbate the trapping of Li+, resulting in decreased ionic conductivity. Although Al3+ doping yields slightly higher conductivity owing to its smaller ionic radius and stable lattice incorporation, Fe3+ substitution presents an attractive alternative, offering unique local distortion effects and cost benefits. Unlike Al3+, Fe3+ also introduces a more pronounced bonding asymmetry, which may further modulate the Li+ migration pathways.
Figure 7 presents the Arrhenius plots illustrating the relationship between total ionic conductivity and measurement temperature for Li1+XFeXTi2-X(PO4)3 (x = 0.1, 0.3, 0.4) solid electrolytes synthesized at different sintering temperatures. The activation energy was derived from the slope of the linear fit. The Arrhenius equation is as follows,
where is the exponential factor, Ea represents the activation energy, k denotes the Boltzmann constant, and T is the absolute temperature. As shown in Table 4, lower activation energies are generally associated with increased Li-ion conductivity. The ion conductivity exhibited an upward trend with rising measurement temperature, and overall, Li1.1Fe0.1Ti1.9(PO4)3 demonstrated a higher activation energy irrespective of the sintering temperature. Conversely, relatively low activation energies were observed at Fe contents of x = 0.3 and 0.4. The improved ionic conductivity is attributed to the facile movement of Li ions within the lattice, facilitated by the densification of the relatively enlarged grains [22]. This suggests that a lower activation energy correlates with enhanced Li-ion conductivity. A notably low activation energy of 0.37 eV was recorded for Li1.3Fe0.3Ti1.7(PO4)3 sintered at 900 °C, which exhibited the highest ionic conductivity.
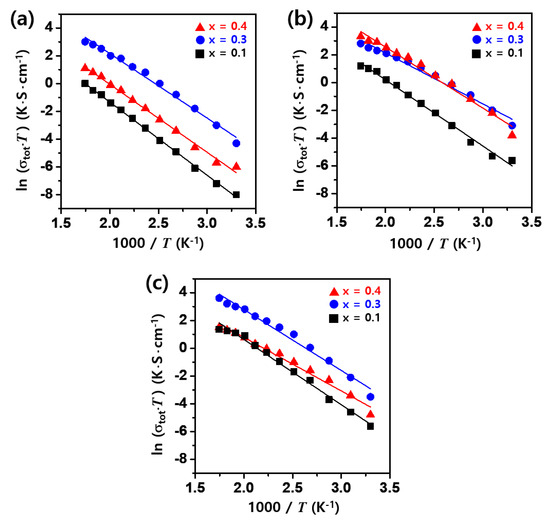
Figure 7.
Arrhenius plots of total ion conductivity for Li1+XFeXTi2-X(PO4)3 (x = 0.1, 0.3, 0.4) sintered for 6 h at (a) 800 °C, (b) 900 °C, and (c) 1000 °C.
4. Conclusions
The sol–gel synthesis of Li1+XFeXTi2-X(PO4)3 (x = 0.1, 0.3, 0.4) solid electrolytes was systematically examined to assess the influence of Fe content on both the sintering properties at various sintering temperatures and the ionic conductivity properties via complex impedance analysis. The synthesized Li1+XFeXTi2-X(PO4)3 solid electrolytes, across all sintering temperatures, exhibited a single-phase NASICON-type rhombohedral crystal structure, where the trivalent cation Fe3+ (0.645 Å) partially substituted Ti4+ (0.605 Å). However, at elevated sintering temperatures exceeding 1000 °C, a secondary phase began to manifest. The analysis of the fracture-surfaces of solid electrolytes at different sintering temperatures indicated that Li1.1Fe0.1Ti1.9(PO4)3, characterized by a low Fe content, exhibited minimal ionic conductivity owing to its suboptimal sintering properties. Although the addition of Fe enhanced densification, the rapid growth of irregular grains led to coarsening, resulting in reduced ionic conductivity and increased resistance owing to the formation of grain boundaries and internal cracks within the grains. With increasing sintering temperature and Fe content, densification was observed as the grains expanded to a uniform size of 2–3 μm, adopting a quasi-cube-like morphology at the fracture-surface of the sintered solid electrolyte. Among the examined conditions, Li1.3Fe0.3Ti1.7(PO4)3 sintered at 900 °C demonstrated the most favorable balance, achieving a relatively high apparent sintered density and the maximum room-temperature total ionic conductivity of 1.51 × 10⁻⁴ S/cm with a low activation energy of 0.37 eV. By contrast Li1.4Fe0.4Ti1.7(PO4)3 synthesized at 1000 °C—despite grain growth that could aid intragranular transport, the additional formation of grain boundaries and the presence of cracks and secondary phases due to grain growth hindered Li-ion migration, resulting in low ionic conductivity and increased activation energies. These results highlight that Fe substitution can be an effective handle to tune NASICON-type solid electrolytes when combined with sintering conditions that promote densification without triggering deleterious phase formation or microstructural defects.
Author Contributions
Conceptualization, S.-J.C. and J.-H.S.; methodology, J.-H.S.; validation, S.-J.C. and J.-H.S.; formal analysis, S.-J.C.; investigation, S.-J.C. and J.-H.S.; data curation, J.-H.S.; writing—original draft preparation, S.-J.C. and J.-H.S.; writing—review and editing, J.-H.S.; visualization, S.-J.C. and J.-H.S.; supervision, J.-H.S.; project administration, J.-H.S.; funding acquisition, J.-H.S. All authors have read and agreed to the published version of the manuscript.
Funding
This work was supported by the National Research Foundation of Korea (NRF) grant funded by the Korea government (MIST) (RS-2025-16903034).
Data Availability Statement
The original contributions presented in this study are included in the article material. Further inquiries can be directed to the corresponding author(s).
Conflicts of Interest
The authors declare no conflicts of interest.
References
- Kim, K.M.; Shin, D.O.; Lee, Y.G. Effects of preparation conditions on the ionic conductivity of hydrothermally synthesized Li1+ xAlxTi2-x(PO4)3 solid electrolytes. Electrochim. Acta 2015, 176, 1364–1373. [Google Scholar] [CrossRef]
- Chung, H.; Kang, B. Increase in grain boundary ionic conductivity of Li1.5Al0.5Ge1.5(PO4)3 by adding excess lithium. Solid State Ion. 2014, 263, 125–130. [Google Scholar] [CrossRef]
- Janek, J.; Zeier, W.G. A solid future for battery development. Nat. Energy 2016, 1, 16141. [Google Scholar] [CrossRef]
- Li, Y.T.; Zhou, W.D.; Xin, S.; Li, S.; Zhu, J.L.; Lu, X.J.; Cui, Z.M.; Jia, Q.X.; Zhou, J.S.; Zhao, Y.S.; et al. Fluorine-Doped Antiperovskite Electrolyte for All-Solid-State Lithium-Ion Batteries. Angew. Chem. Int. Ed. Eng. 2016, 55, 9965–9968. [Google Scholar] [CrossRef]
- Zheng, F.; Kotobuki, M.; Song, S.; Lai, M.O.; Lu, L. Review on solid electrolytes for all-solid-state lithium-ion batteries. J. Power Sources 2018, 389, 198–213. [Google Scholar] [CrossRef]
- Bachman, J.C.; Muy, S.; Grimaud, A.; Chang, H.-H.; Pour, N.; Lux, S.F.; Paschos, O.; Maglia, F.; Lupart, S.; Lamp, P.; et al. Inorganic Solid-State Electrolytes for Lithium Batteries: Mechanisms and Properties Governing Ion Conduction. Chem. Rev. 2016, 116, 140–162. [Google Scholar] [CrossRef]
- Hayashi, A.; Noi, K.; Sakuda, A.; Atsumisago, M.T. Superionic glass-ceramic electrolytes for room-temperature rechargeable sodium batteries. Nat. Commun. 2012, 3, 856. [Google Scholar] [CrossRef]
- Knauth, P. Inorganic solid Li ion conductors: An overview. Solid State Ion. 2009, 180, 911–916. [Google Scholar] [CrossRef]
- Zhu, J.; Zhao, J.; Xiang, Y.; Lin, M.; Wang, H.; Zheng, B.; He, H.; Wu, Q.; Huang, J.Y.; Yang, Y. Chemomechanical Failure Mechanism Study in NASICON-Type Li1.3Al0.3Ti1.7(PO4)3 Solid-State Lithium Batteries. Chem. Mater. 2020, 32, 4998–5008. [Google Scholar] [CrossRef]
- Goodenough, J.B.; Hong, H.Y.P.; Kafalas, J.A. Fast Na+-ion transport in skeleton structures. Mater. Res. Bull. 1976, 11, 203–220. [Google Scholar] [CrossRef]
- Yao, X.Y.; Huang, B.X.; Yin, J.Y.; Peng, G.; Huang, Z.; Gao, C.; Liu, D.; Xu, X.X. All-solid-state lithium batteries with inorganic solid electrolytes: Review of fundamental science. Chin. Phys. B 2016, 25, 018802. [Google Scholar] [CrossRef]
- Kwatek, K.; Nowiński, J.L. Electrical properties of LiTi2(PO4)3 and Li1.3Al0.3Ti1.7(PO4)3 solid electrolytes containing ionic liquid. Solid State Ion. 2017, 302, 54–60. [Google Scholar] [CrossRef]
- Aono, H.; Sugimoto, E.; Sadaoka, Y.; Imanaka, N.; Adachi, G.-Y. Ionic conductivity and sinterability of lithium titanium phosphate system. Solid State Ionics. 1990, 40/41, 38–42. [Google Scholar] [CrossRef]
- Yang, K.; Chen, L.; Ma, J.; He, Y.; Kang, F. Progress and perspective of Li1+xAlxTi2-x(PO4)3 ceramic electrolyte in lithium batteries. InfoMat 2021, 3, 1195–1217. [Google Scholar] [CrossRef]
- Wang, G.X.; Bradhurst, D.H.; Dou, S.X.; Liu, H.K. LiTi2(PO4)3 with NASICON-type structure as lithium-storage materials. J. Power Sources 2003, 124, 231–236. [Google Scholar] [CrossRef]
- DeWees, R.; Wang, H. Synthesis and Properties of NaSICON-type LATP and LAGP Solid Electrolytes. Chem. Sus. Chem. 2019, 12, 3713–3725. [Google Scholar] [CrossRef] [PubMed]
- Kotobuki, M.; Koishi, M. Preparation of Li1.5Al0.5Ti1.5(PO4)3 solid electrolyte via a sol–gel route using various Al sources. Ceram. Int. 2013, 39, 4645–4649. [Google Scholar] [CrossRef]
- Bucharsky, E.C.; Schell, K.G.; Hintennach, A.; Hoffmann, M.J. Preparation and characterization of sol–gel derived high lithium ion conductive NZP-type ceramics Li1+xAlxTi2-X(PO4)3. Solid State Ion. 2015, 274, 77–82. [Google Scholar] [CrossRef]
- Ma, Q.; Xu, Q.; Tsai, C.-L.; Tietz, F.; Guillon, O. A Novel Sol–Gel Method for Large-Scale Production of Nanopowders: Preparation of Li1.5Al0.5Ti1.5(PO4)3 as an Example. J. Am. Ceram. Soc. 2016, 99, 410–414. [Google Scholar] [CrossRef]
- Waetzig, K.; Heubner, C.; Kusnezoff, M. Reduced Sintering Temperatures of Li+ Conductive Li1.3Al0.3Ti1.7(PO4)3 Ceramics. Crystals 2020, 10, 408. [Google Scholar] [CrossRef]
- Ma, F.; Zhao, E.; Zhu, S.; Yan, W.; Sun, D.; Jin, Y.; Nan, C. Preparation and evaluation of high lithium ion conductivity Li1.3Al0.3Ti1.7(PO4)3 solid electrolyte obtained using a new solution method. Solid State Ion. 2016, 295, 7–12. [Google Scholar] [CrossRef]
- Zhao, E.; Ma, F.; Jin, Y.; Kanamura, K. Pechini synthesis of high ionic conductivity Li1.3Al0.3Ti1.7 (PO4)3 solid electrolytes: The effect of dispersant. J. Alloys Compd. 2016, 680, 646–653. [Google Scholar] [CrossRef]
- Huang, L.; Wen, Z.; Wu, M.; Wu, X.; Liu, Y.; Wang, X. Electrochemical properties of Li1.4Al0.4Ti1.6(PO4)3 synthesized by a co-precipitation method. J. Power Sources 2011, 196, 6943–6946. [Google Scholar] [CrossRef]
- Schroeder, M.; Glatthaar, S.; Binder, J.R. Influence of spray granulation on the properties of wet chemically synthesized Li1.3Ti1.7Al0.3(PO4)3 (LATP) powders. Solid State Ion. 2011, 201, 49–53. [Google Scholar] [CrossRef]
- Davis, C., III; Nino, J.C. Microwave Processing for Improved Ionic Conductivity in Li2O-Al2O3-TiO2-P2O5 Glass-Ceramics. J. Am. Ceram. Soc. 2015, 98, 2422–2427. [Google Scholar] [CrossRef]
- Waetzig, K.; Rost, A.; Langklotz, U.; Matthey, B.; Schilm, J. An explanation of the microcrack formation in Li1.3Al0.3Ti1.7(PO4)3 ceramics. J. Eur. Ceram. Soc. 2016, 36, 1995–2001. [Google Scholar] [CrossRef]
- Zhang, M.; Liu, J.; He, W. Preparation, Characterization and Conductivity Studies of Li1.3M0.3Ti1.7(PO4)3 (M = Al, Cr and Fe) Glass–Ceramics. Adv. Mater. Res. 2013, 602–604, 548–552. [Google Scholar]
- Dindune, A.; Kanepe, Z.; Kazakevičius, E.; Kežionis, A.; Ronis, J.; Orliukas, A.F. Synthesis and electrical properties of Li1+xMxTi2-X(PO4)3 (where M = Sc, Al, Fe, Y; x = 0.3) superionic ceramics. J. Solid State Electrochem. 2003, 7, 113–117. [Google Scholar] [CrossRef]
- Pérez-Estébanez, M.; Isasi-Marín, J.; Többens, D.M.; Rivera-Calzada, A.; León, C. A systematic study of Nasicon-type Li1+xMxTi2-x(PO4)3 (M: Cr, Al, Fe) by neutron diffraction and impedance spectroscopy. Solid State Ion. 2014, 266, 1–8. [Google Scholar] [CrossRef]
- Rao, A.V.; Veeraiah, V.; Rao, A.V.P.; Babu, B.K. Effect of Fe3+ doping on the structure and conductivity of LiTi2(PO4)3. Res. Chem. Intermed. 2015, 41, 2307–2315. [Google Scholar]
- McCusker, L.B.; Von Dreele, R.B.; Cox, D.E.; Louër, D.; Scardi, P. Rietveld refinement guidelines. J. Appl. Cryst. 1999, 32, 36–50. [Google Scholar] [CrossRef]
- Shiramata, Y.; Konya, T.; Kobayashi, K.; Ishii, Y.; Hiroi, S.; Yamada, H.; Ohara, K. Extracting accurate PDF data from in situ environment of materials using X-ray diffractometer. Anal. Sci. 2025, 41, 777–782. [Google Scholar] [CrossRef]
- Rietveld, H.M. A Profile Refinement Method for Nuclear and Magnetic Structures. J. Appl. Cryst. 1969, 2, 65–71. [Google Scholar]
- Cho, S.J.; Song, J.H. Influence of Ga Content on the Ionic Conductivity of Li1+XGaXTi2-X(PO4)3 Solid-State Electrolyte Synthesized by the Sol-Gel Method. Korean J. Mater. Res. 2024, 34, 185–193. [Google Scholar] [CrossRef]
- Zhang, Z.; Hu, L.; Tao, H.; Ren, J. Li super ionic conducting glasses and glass ceramics in the Li1+xGaxGe2-xP3O12 system: Solid state nuclear magnetic resonance and electrical conductivity study. J. Power Sources 2019, 442, 227169. [Google Scholar] [CrossRef]
- Kothari, D.H.; Kanchan, D.K. Study of electrical properties of gallium-doped lithium titanium aluminum phosphate compounds. Ionics 2015, 21, 1253–1259. [Google Scholar] [CrossRef]
- Catti, M.; Comotti, A.; Blas, S.D.; Ibberson, R.M. Extensive lithium disorder in Li1.5Fe0.5Ti1.5(PO4)3 Nasicon by neutron diffraction, and the Li1+xFexTi2-x(PO4)3 phase diagram. J. Mater. Chem. 2004, 14, 835–839. [Google Scholar]
- Islam, M.A.; Rahaman, M.Z.; Hasan, M.M.; Hossain, A.K.M.A. Analysis of grain growth, structural and magnetic properties of Li-Ni-Zn ferrite under the influence of sintering temperature. Heliyon 2019, 5, e01199. [Google Scholar] [CrossRef]
- Tian, Y.; Zhou, Y.; Liu, Y.; Zhao, C.; Wang, W.; Zhou, Y. Formation mechanism of sol-gel synthesized Li7−3xAlxLa3Zr2O12 and the influence of abnormal grain growth on ionic conductivity. Solid State Ion. 2020, 354, 115407. [Google Scholar] [CrossRef]
Disclaimer/Publisher’s Note: The statements, opinions and data contained in all publications are solely those of the individual author(s) and contributor(s) and not of MDPI and/or the editor(s). MDPI and/or the editor(s) disclaim responsibility for any injury to people or property resulting from any ideas, methods, instructions or products referred to in the content. |
© 2025 by the authors. Licensee MDPI, Basel, Switzerland. This article is an open access article distributed under the terms and conditions of the Creative Commons Attribution (CC BY) license (https://creativecommons.org/licenses/by/4.0/).