Article

Crystal Plasticity Modeling to Capture Microstructural Variations in Cold-Sprayed Materials

1
Center for Advanced Vehicular Systems, Mississippi State University, Mississippi State, MS 39762, USA
2
Department of Mechanical Engineering, Mississippi State University, Mississippi State, MS 39762, USA
3
DEVCOM—Army Research Laboratory, Weapons and Materials Research Directorate, Aberdeen Proving Ground, Aberdeen, MD 21005, USA
4
American Lightweight Materials Manufacturing Innovation Institute (LIFT), Detroit, MI 48216, USA
5
School of Automotive Engineering, Université Internationale de Rabat, Rabat-Shore Rocade Rabat-Salé, Rabat 11103, Morocco
*
Author to whom correspondence should be addressed.
Crystals 2024, 14(4), 329; https://doi.org/10.3390/cryst14040329
Submission received: 28 February 2024 / Revised: 20 March 2024 / Accepted: 26 March 2024 / Published: 30 March 2024
(This article belongs to the Special Issue Processing-Microstructure-Properties Relationship of Advanced Alloys)

Abstract

:
The high-velocity impact of powder particles in cold-spray additively manufactured (CSAM) parts creates intersplat boundaries with regions of high dislocation densities and sub-grain structures. Upon microstructure and mechanical characterization, CSAM Aluminum 6061 showed non-uniformity with spatial variation in the microstructure and mechanical properties, affecting the overall response of the additively manufactured parts. Post-processing treatments are conducted in as-printed samples to improve particle bonding, relieve residual stresses, and improve mechanical properties. In this work, we attempt to implement the effects of grain size and distribution of smaller grains along the intersplat boundaries using the grain size distribution function and powder size information to accurately predict the deformation response of cold-sprayed material using a mean-field viscoplastic self-consistent (VPSC) model. The incorporation of an intersplat boundary term in the VPSC model resulted in a stress–strain response closely matching the experimental findings, preventing the superficially high stresses observed due to Hall–Petch effects from ultra-fine-grain structures. Likewise, the results from the grain analysis showed the combined effects of grain size, orientation, and intersplat mechanisms that captured the stresses experienced and strain accommodated by individual grains.

1. Introduction

Cold-spray additive manufacturing (CSAM) is a process in which powdered metal is fired through a nozzle at a supersonic velocity to induce deposition on any given substrate, allowing for high precision. The low-temperature-based additive manufacturing (AM) technique is promising due to the material buildup that occurs through utilizing the kinetic energy of the powder particles [1]. The deposition occurs by localized metallurgical bonding and interlocking caused by localized plastic deformation at the interparticle and particle–substrate interfaces [2]. As a result of high velocity during the deposition process, dense fine sub-grains are present within the microstructure, as well as porosity and non-uniformity [3,4], which can result in decreased ductility of the parts [5,6]. The CSAM parts exhibit hardness and ultimate strength values similar to bulk, with the expectation that this behavior after the elastic regime is characteristically brittle compared to bulk [7,8,9,10]. The relatively low plastic regime and challenges with metallurgical bonding at the splat interface have limited the application of the cold-spray technique in commercial production [8,11,12].
In recent years, interest in cold-spray-based processes to fabricate individual components instead of only being used as a repair mechanism has motivated an understanding of the process–structure–property relations in CSAM parts [2,13,14]. While interparticle (intersplat) bonding and residual stress-related issues limit the mechanical properties and performance of CSAM parts, the microstructural characterization of the as-sprayed and the post-processed condition of the material has shown increased particle–particle bonding within cold-sprayed materials [15,16]. In particular, Aluminum 6061 (Al6061) is explicitly studied for cold-spray technology research due to its remarkable plasticity required for bonding at a relatively low critical velocity [17,18,19]. Besides being a lightweight material, Al6061 is resistant to corrosion, stress, and cracking, and its high magnesium and silicon alloying provide improved strain hardening, tensile strength, and performance at higher temperatures without breaking down, making it an effective structural candidate as a cold-sprayed material [20].
The heating effects arising from rapid plasticity during the spraying process and the residual stresses introduced from spraying kinetics have a profound influence on the mechanical performance of the deposits [3]. Although grain refinement from the spraying process enhances strength through strain hardening, the resulting heterogeneous and spatially non-uniform microstructure have localized shear instabilities, dislocation densities, ultra-fine grains, and high strains, causing a decline in hardness, recrystallization capabilities, damage nucleation, and failure [9,21,22]. Despite having a higher bonding strength than some harder materials used in CSAM such as steels, Al6061 still exhibits reduced bonding between layers, a high porosity and dislocation density at intersplat boundaries, and reduced ductility values more similar to that of highly cold-worked bulk materials [18,23,24,25].
Numerical models have been shown to provide deeper insights into missing information that can be hard to capture during deposition, such as localized stress states, temperature evolution, dislocation interactions, and residual stress developments [1,20,26,27,28]. Finite element material models are successful in predicting stress–strain responses and failures in as-sprayed conditions. However, mechanisms capturing the microstructural features specific to the cold-sprayed process such as the grain size effects, spatial distribution of ultra-fine sub-grains, and intersplat bonding mechanisms are yet to be incorporated [29]. The ultra-fine-grained structures found at particle–particle interfaces within CSAM parts show strengthened phases from the grain boundary strengthening of the ultra-fine-grained structures after thermal treatments [30]. These same ultra-fine grains, due to the heterogeneous deposition of the process, have also been found to have high dislocation densities, leading to localized mechanical property effects on the material [31]. CSAM components have been modeled with a prior focus on single particle impact, different materials, and macroscale mechanical behavior prediction of mechanical responses such as fracture and fatigue behavior [1,32]. The effects of processing parameters on the structure or properties are modeled through mesoscale simulations utilizing the Cellular Automaton method and the Monte Carlo method, both defined by the thermal history [33]. However, limited studies are performed on the mesoscale modeling of structure–property relationships regarding spatial variations in microstructural features in cold-sprayed materials as well as the post-processed conditions. Post-heat treatments of cold-sprayed components enhance the intersplat bonding, improve the combined strength and ductility, and mitigate the fracture and fatigue properties [20,34,35].
For additively manufactured materials, Herriott et al. [33] presented a Hall–Petch-type relationship to model the effects of spatially varied grain size in a full-field plasticity framework. Utilizing microstructural information and the directed distance to the nearest grain boundaries, the local heterogeneity in mechanical properties as well as grain boundary effects are captured. Likewise, crystal plasticity models capture grain interaction and topological information that affects the local micromechanical fields present within the microstructure and consider the effects of stress and strain partitions among phases and grains [36,37]. Meanwhile, the mean-field crystal plasticity modeling approach, which is computationally less expensive, also captures the evolution in crystallographic texture, average stress and strain responses, and deformation activities that match closely with experimental results [38].
This work presents a development of a modified Hall–Petch-type relationship to capture the effects of heterogeneous microstructural features and intersplat bonding inherent in the cold-sprayed materials. The microstructural characterization showed a correlation between the distribution of ultra-fine grains and dislocation densities to their location away from intersplat boundaries. With the incorporation of a phenomenological term associated with the intersplat boundary parameter, the mean-field viscoplastic self-consistent model predicted an accurate stress–strain response. The modified equation is capable of predicting the effects of post-processing conditions with proper calibration.

2. Experimental Methods

In this work, Aluminum 6061 as-sprayed material, as shown in Figure 1, was provided by Army Research Laboratories (ARLs). The material powder and processing parameters for the obtained samples are proprietary information and not presented in this manuscript. Table 1 provides the chemical composition of Al6061 [39].
For comparison, a cold-rolled Al6061 sheet was obtained from McMaster-Carr [40]. For both the rolled and CSAM Al6061 samples, an annealing heat treatment was performed for 3 h at 416 °C in a furnace and then air-cooled. For characterization purposes, the samples were cut using a diamond saw, mounted, ground using 4000 grit silicon carbide paper on Struers TegraPol-11, and polished using Buehler VibroMet-2. The optical micrographs were obtained using Zeiss Axiovert 200M. In order to enhance the intersplat boundaries and grain boundaries, samples were etched using a 10% NaOH reagent. Further microstructure characterization was performed using a Zeiss Supra 40 scanning electron microscope (SEM) and electron backscattered diffraction (EBSD) detector. The microstructure characterization was performed on planes perpendicular to and along the spray direction, as shown by planes A and B in Figure 1b. A texture analysis and microstructure information such as the orientation distribution function (ODF), grain size distribution, grain aspect ratios, misorientation angles, and so on, were obtained using the MTEX plugin [41] in MATLAB [42].
Likewise, X-ray diffraction (XRD) scans on the CSAM and rolled parts were taken using Rigaku Smartlab to obtain the grain orientations and pole figures of the material. The XRD scan was taken on the surface perpendicular to the build direction, plane B in Figure 1b, of the CSAM part. An XRD scan was performed at multiple peaks on a millimeter-thick specimen corresponding to the highest angle plane for the face-centered cubic (FCC) structured Al6061. The XRD data were used with the software MAUD version 2.93 [43] to calculate the residual stresses of the as-rolled material, as-sprayed material, and their annealed conditions.
For mechanical tests of the rolled Al6061, the samples were extracted along the rolling direction through the use of electrical discharge machining (EDM). A subsize ASTM E8 dogbone specimen [44] machined using wire EDM was obtained for mechanical tests. A quasi-static uniaxial tension test was performed on Instron 5882 using a 50 kN load cell at a strain rate of 0.001 s−1.

3. Experimental Results and Discussion

A microstructural characterization and texture analysis are performed using micrographs and orientation data obtained through OM, SEM, EBSD, and XRD. This section presents the optical and electron microscopy results and microstructure analysis determining the input parameters for viscoplastic self-consistent modeling in Section 4.

3.1. Optical Microscopy (OM)

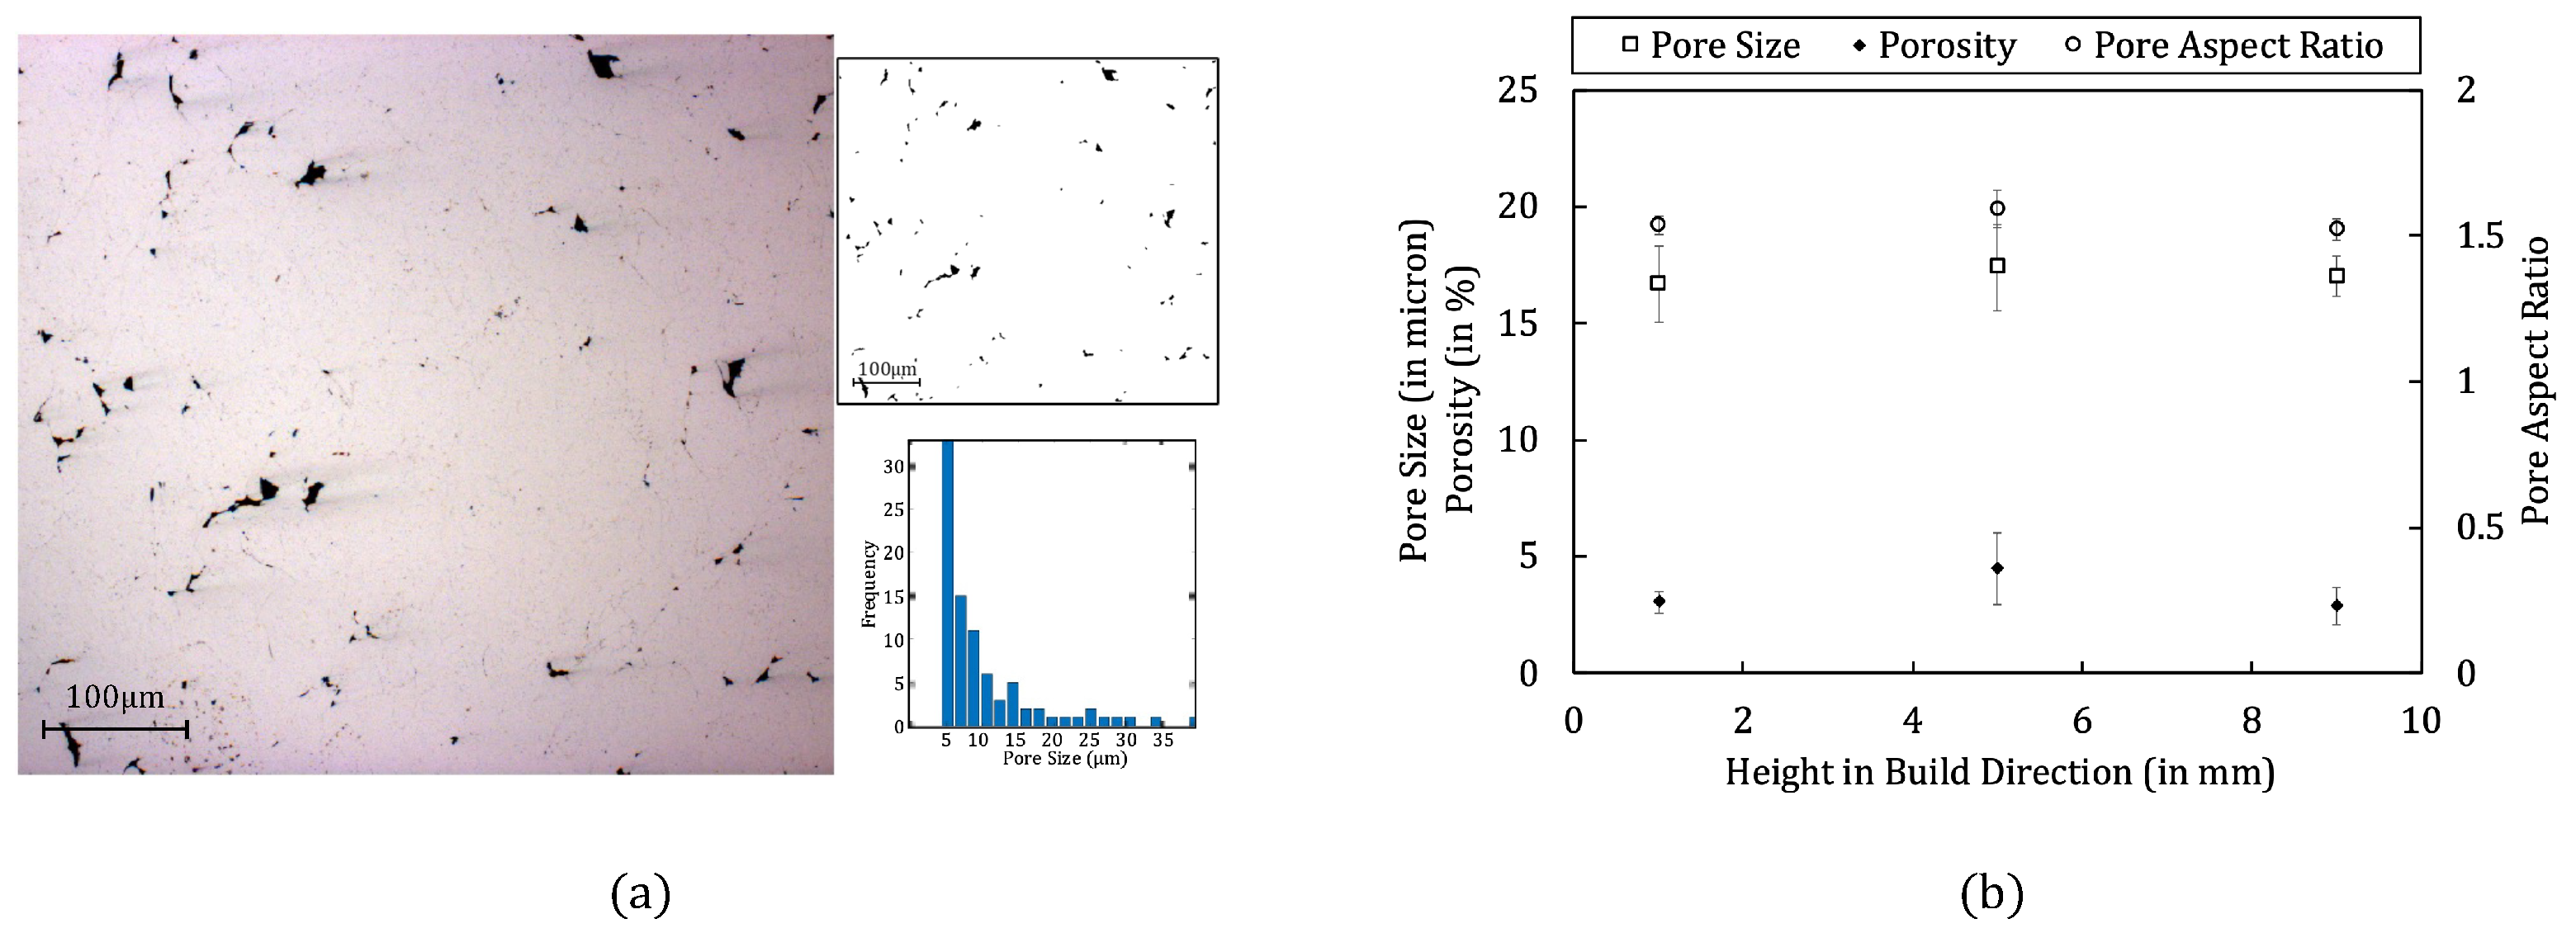
Figure 2a shows the optical micrograph of the polished surface 1 mm away from the substrate of the CSAM Al6061 samples. A MATLAB script was used to compute the area fraction of the pores (porosity), pore size distribution, and pore aspect ratio distribution. The porosity is calculated using the area fraction of the black points from a binary image, as shown in the top right of Figure 2a, and the pore size distribution is shown in the bottom right image of Figure 2a. Meanwhile, Figure 2b shows the porosity, pore size, and pore aspect ratio information averaged using multiple optical microscopy images at build heights of 1 mm, 5 mm, and 9 mm from the substrate. The porosity, pore size, and pore aspect ratio tend to be in a similar range along all build heights. These pores are majorly formed due to gaps in the interparticle (intersplat) regions and are consistent along the different heights of the build direction. The pore aspect ratio is in the range of 1.5.
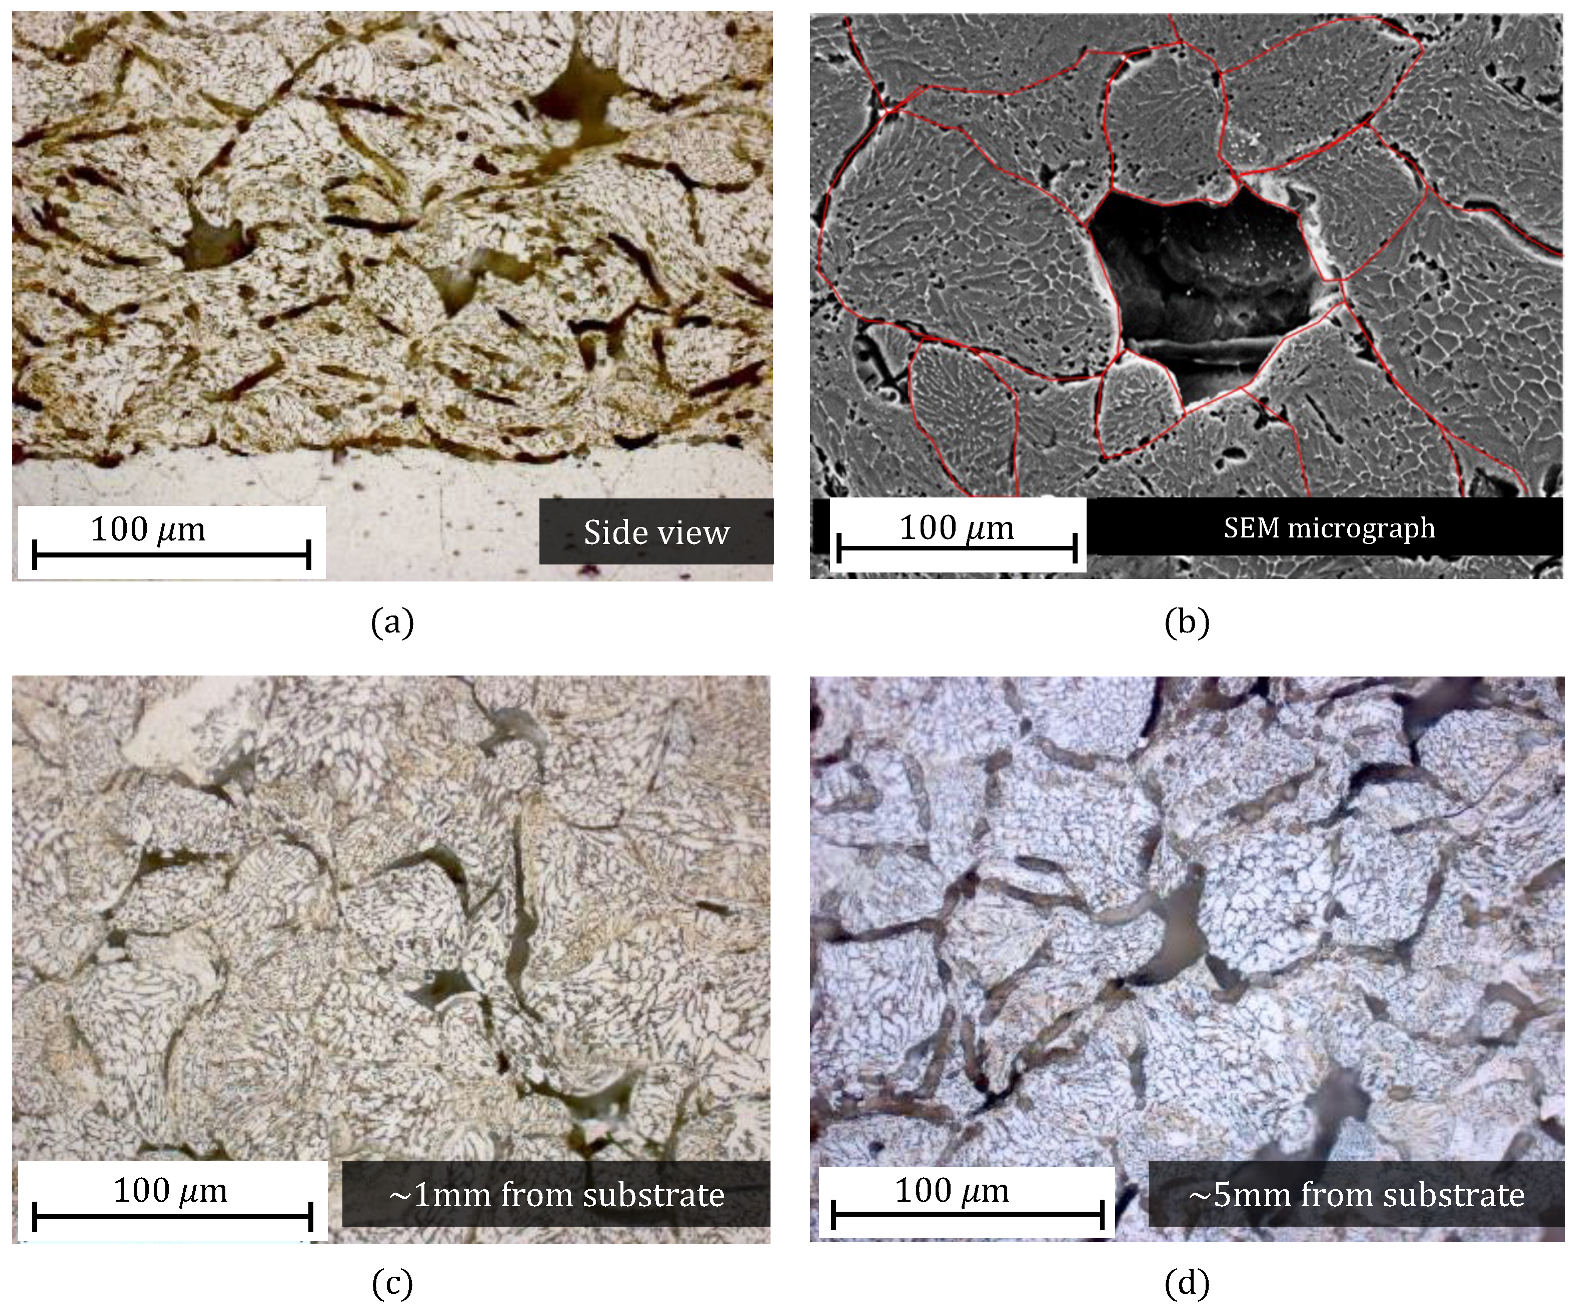
Figure 3 shows the optical microscopy images and SEM micrographs (b) of the etched surfaces of the CSAM Al6061 samples. Figure 3a shows an etched surface with a substrate–powder interface, intersplat boundaries, and grain boundaries from the side view (build direction along the y-axis of the image). Likewise, Figure 3c,d show the OM images taken at build heights 1 mm and 5 mm, consistently revealing distinguished intersplat boundaries, grain boundaries, and pores at the intersplat boundary regions. In the SEM micrograph (Figure 3b), a large pore may have resulted from debonding powder particles during the etching process. Similar to the OM images of the polished samples (see Figure 2), the pores are predominantly present at the intersplat boundaries, consistent along the build height.
Besides the intersplat boundaries and pores, the grain boundaries are also visible in the etched surfaces of CS Al6061. While the grain size distribution was quantified using the electron backscattered diffraction (EBSD) method in the later section, the visual inspection of the grains in Figure 3 shows larger grains at the center of the powder particle and smaller grains near the intersplat boundary regions. The distribution of smaller grains at the intersplat boundary is expected due to the high-velocity impact of the powder particles [45]. Likewise, distinct intersplat boundaries in the etched condition are observed because of the high-energy grain boundaries with a high dislocation density and sub-grains present in the intersplat boundaries that readily react with the etching reagent. A powder particle was distinguished from the optical micrographs of the etched surfaces of CSAM Al6061, and the powder grain size was calculated to be 26 μm. The powder size determination using 2D micrographs is challenged by variations in the splat sizes and morphologies observed during the powder size calculation due to the potential location of the cross section within a splat. However, utilizing a large sample size of splats, the variation and difficulty in comparisons can be slightly mitigated [46]. A detailed grain analysis is performed using EBSD data in the next section.

3.2. Electron Backscatter Diffraction (EBSD)

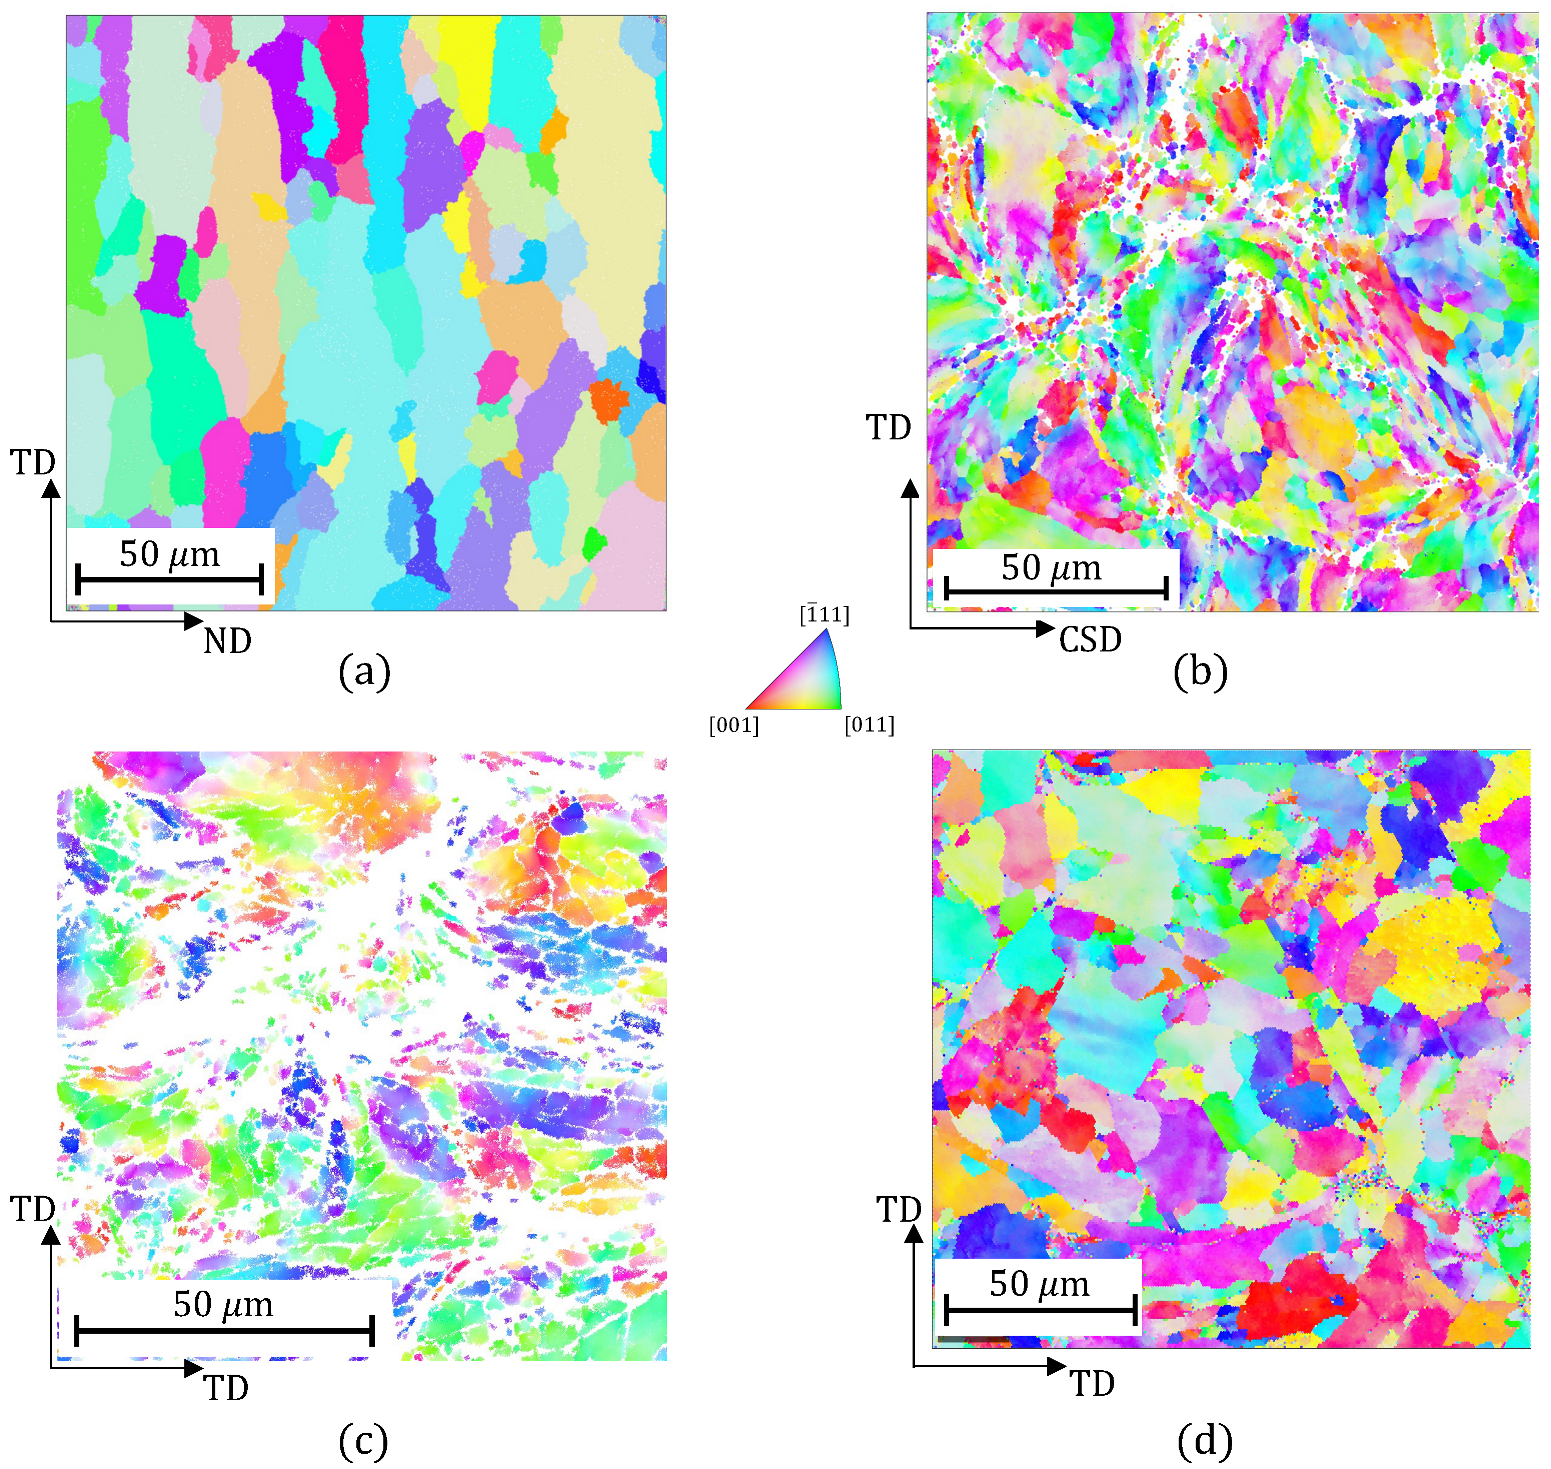
Figure 4 exhibits the EBSD micrographs for the rolled Al6061, CSAM Al6061, and annealed CSAM Al6061. When compared to the EBSD micrograph for the rolled Al6061 (Figure 4a), the as-sprayed CSAM Al6061 (Figure 4b,c) shows spatial variations in the grain size distribution. While Figure 4b shows the side view with the build direction/cold-spray direction (CSD) along the horizontal plane, Figure 4c shows the plane normal to the CSD. The white regions in Figure 4b,c represent the noise in the EBSD data resulting from the low confidence index due to the high dislocation accumulated in the region from particle impact as well as sub-grain structures at the intersplat boundary regions.
Further analysis on the grain information, such as the sizes, aspect ratios, orientation distribution function, geometrically necessary densities, and so on shows quantified microstructural differences in the rolled vs. as-sprayed vs. post-treated CSAM microstructure. The grain sizes and grain aspect ratios quantified from the EBSD images in Figure 4 are tabulated in Table 2. The average grain size for the as-sprayed CSAM microstructure is significantly smaller than the rolled microstructure. With the annealing post-process, the grain growth increases the average grain size to 17.9 µm. However, the grain aspect ratio is higher for the CSAM samples and remains unchanged even after post-processing since the grain growth occurs along the direction of the intersplat boundary, thus maintaining the aspect ratio.
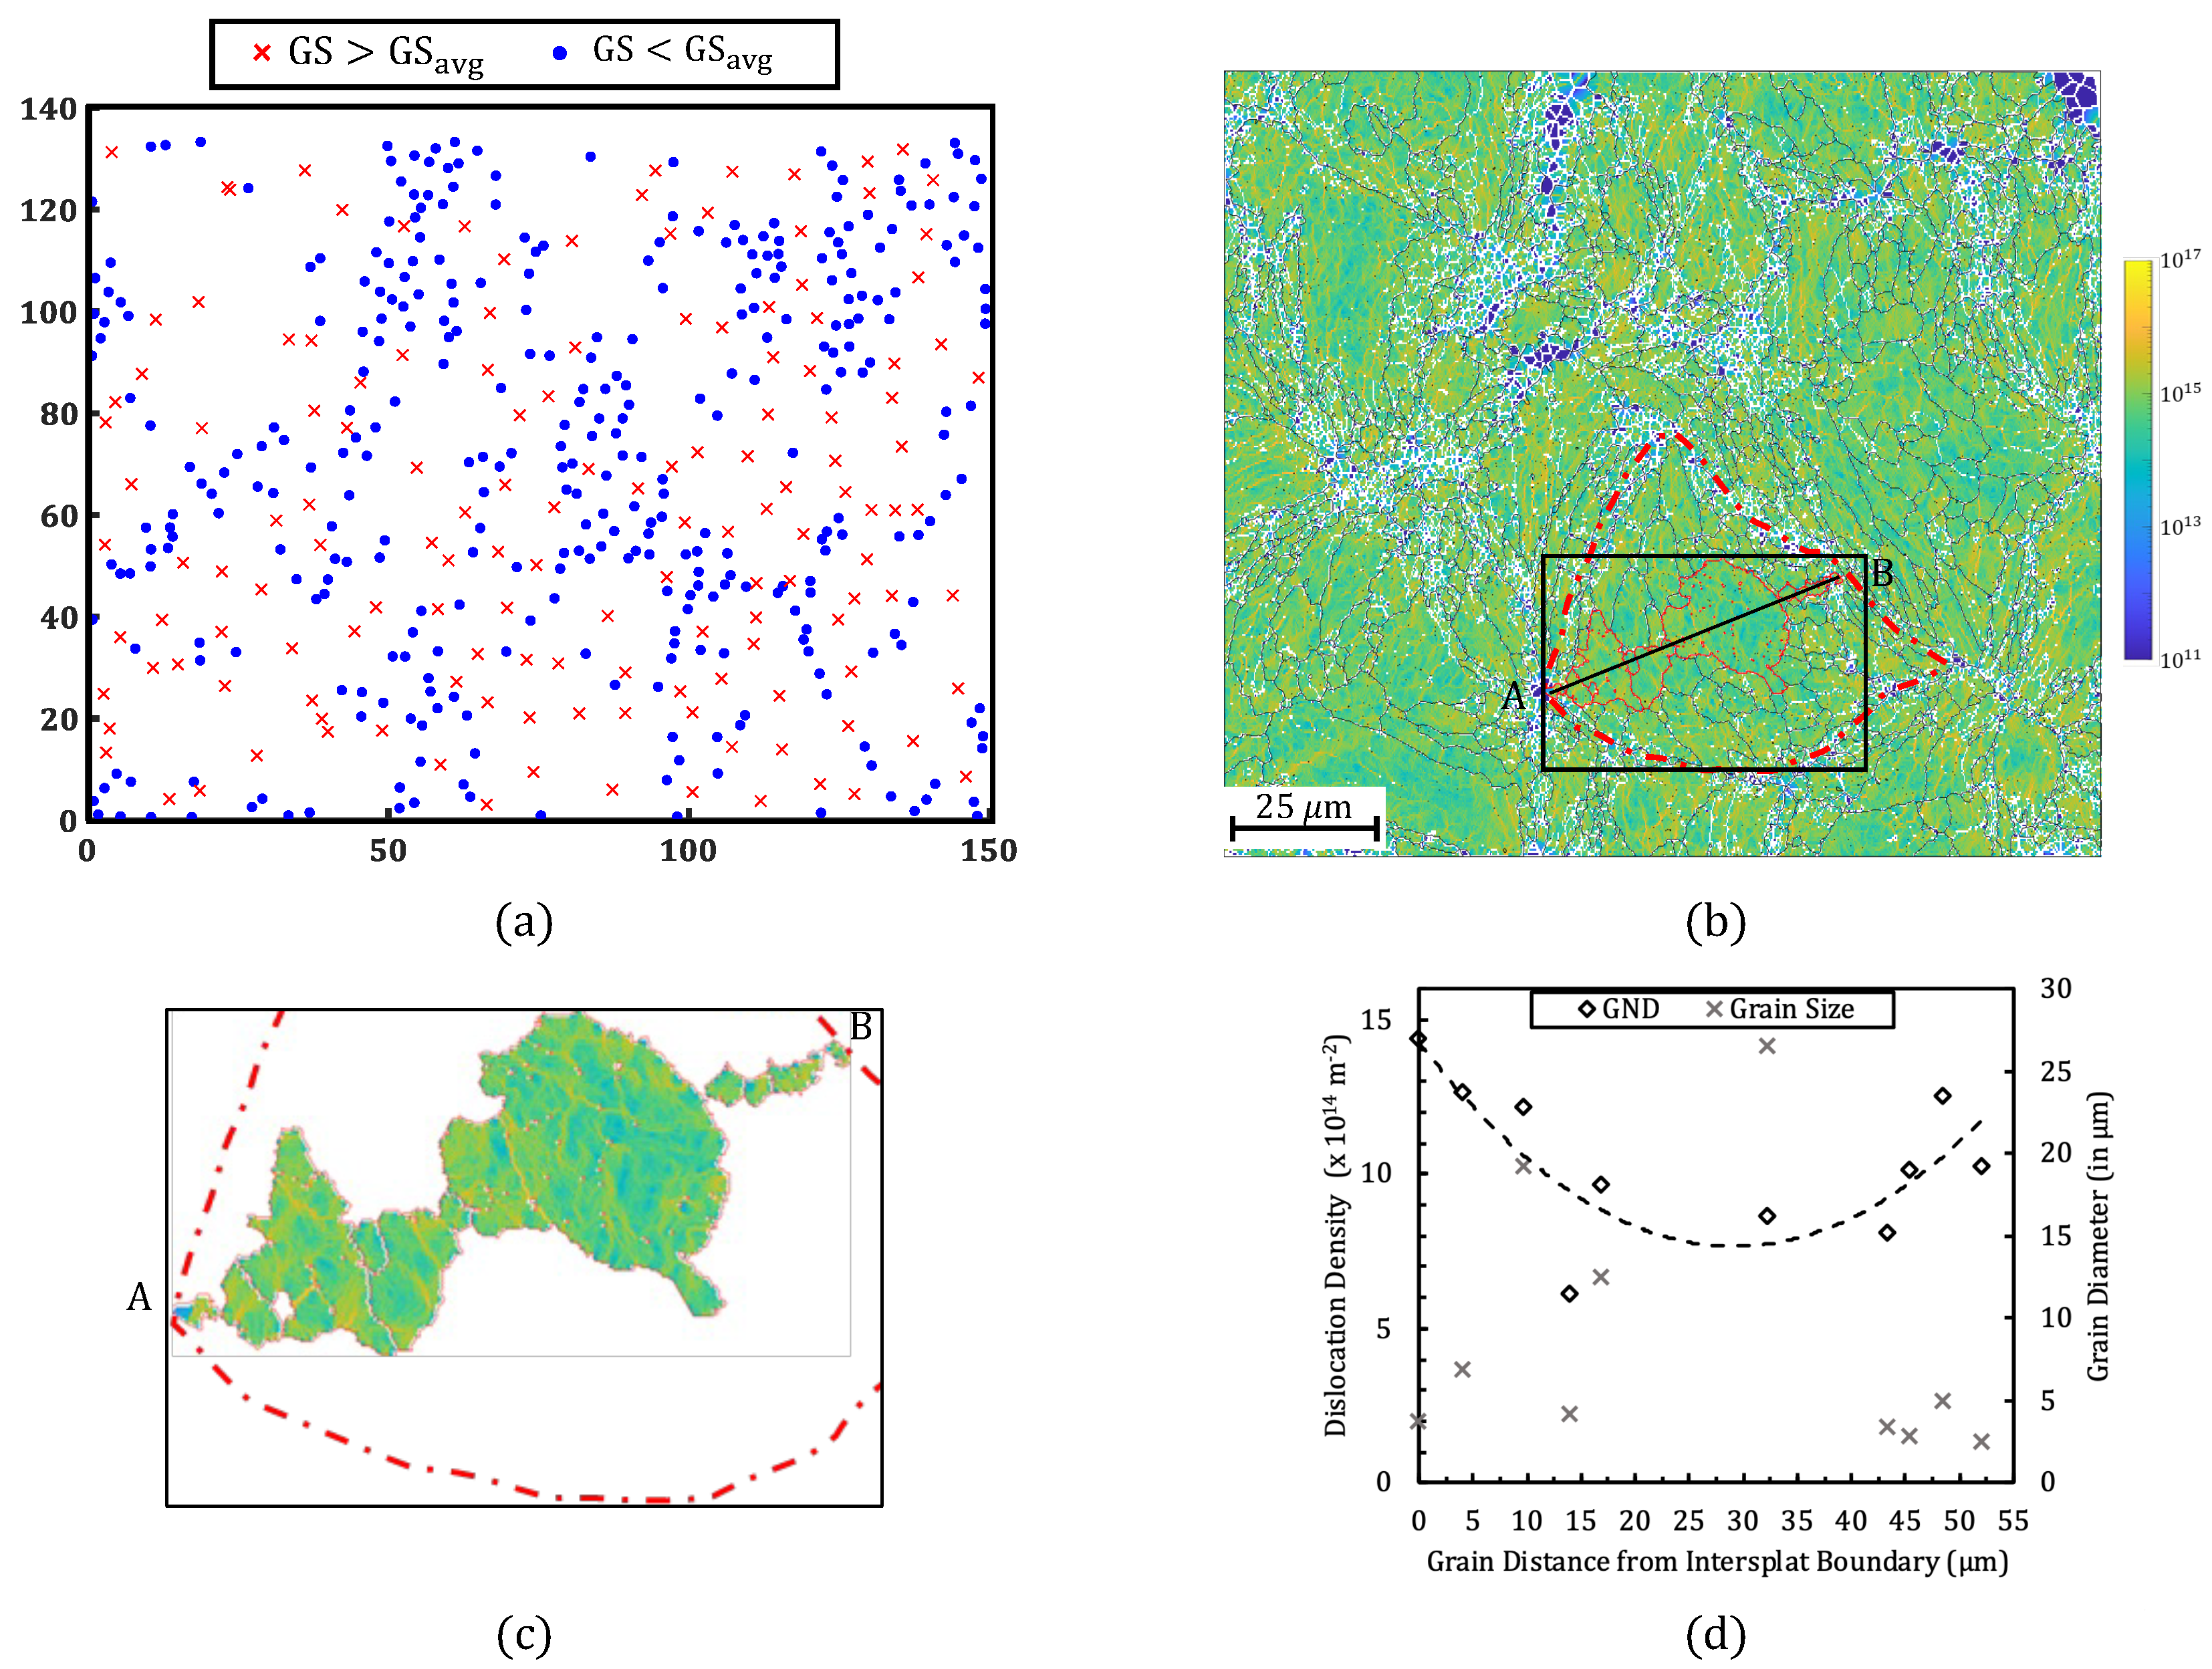
An evaluation of the grain centroids in the CSAM Al6061 microstructure, see Figure 5a, showed that grains smaller than the average grain diameter tend to distribute spatially near the intersplat regions. The large grains were distributed more homogeneously. In addition, the geometrically necessary dislocations (GNDs) map of CSAM Al6061 displayed high dislocation densities near the intersplat boundaries (see Figure 5b). Within a powder particle shown by the dashed red line, the average dislocation density, grain size, and distance from the boundary (starting from the left of Figure 5c) are calculated and plotted in Figure 5d. The dislocation density is higher for the grains closer to the intersplat boundary, and the grain sizes follow the inverse trend.

3.3. X-ray Diffraction (XRD)

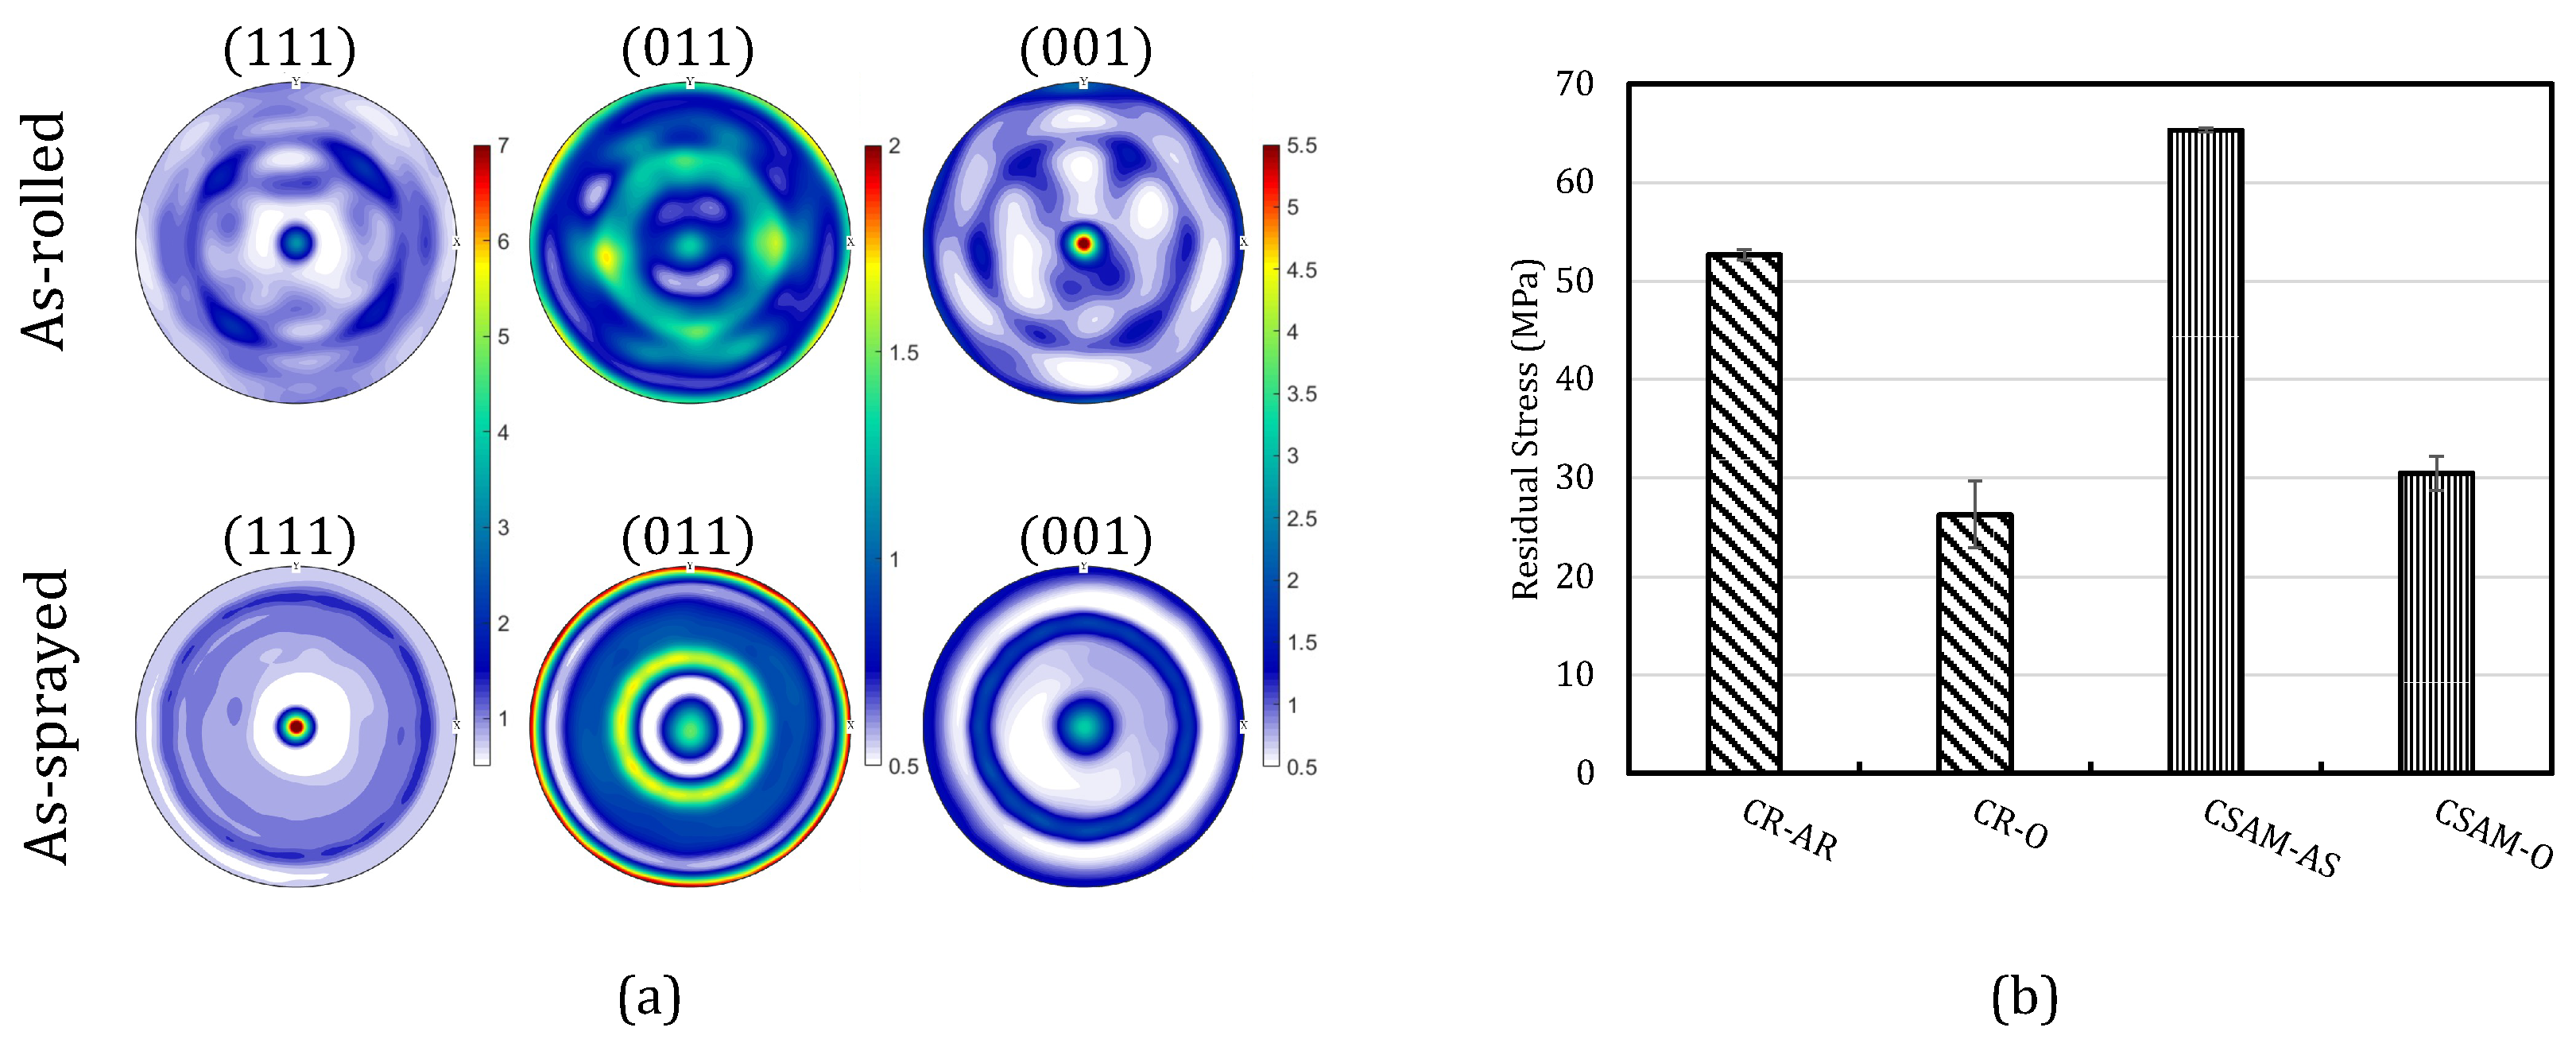
The pole figures for the rolled and CSAM Al6061, see Figure 6, show similar texture components with weaker intensities for the rolled microstructure compared to strong intensities in CSAM. The strong intensity of the (111) pole along the CSD in CSAM results from the lattice rotation of (111) slip systems during plastic deformation occurring during the spraying process [48].
Likewise, the residual stresses obtained from the XRD scans and calculated using MAUD, Figure 6c, showed compressive residual stress in CSAM Al6061 that is reduced significantly after the annealing post-treatment. A similar response of residual stresses has been seen in the rolled Al6061 where, in the annealed case, a relief of residual stresses is seen due to the post-process heat treatment.

3.4. Uniaxial Tension Test

Table 3 shows the yield stress, ultimate tensile strength, and percent elongation for the rolled, rolled-annealed, as-sprayed, and annealed CSAM Al6061. In the as-sprayed state, the particles deposit with a high-velocity impact, leading to the deposits becoming work-hardened with low elongation. When you anneal the CSAM, the deposit strength decreases, but the elongation and ductility increase [49]. CSAM Al 6061 has higher ultimate tensile strength and yield stresses, but a significantly lower percent elongation when compared to the rolled Al 6061.
Mechanical properties such as the yield strength, ultimate tensile strength, and percent elongation are shown in Table 3 for the rolled, annealed rolled, as-sprayed, and annealed CSAM Al6061. While the properties for the rolled and rolled-annealed Al6061 samples are obtained from experiments and are an average of at least three tension tests performed, the properties for the as-sprayed and annealed CSAM Al6061 are obtained from published experimental data [49]. The results show that CSAM samples have a higher strength (293 MPa) but low ductility (4%). While the ductility of the CSAM samples increased after annealing trading for lower strength, the CSAM-annealed sample has slightly reduced ductility (17%) compared to 17.8% for the rolled-annealed sample. In comparison, a significantly higher strength (160 MPa) was seen for the CSAM-annealed sample than the rolled-annealed condition (53 MPa).

4. Simulation Method

4.1. Viscoplastic Self-Consistent (VPSC)

The viscoplastic self-consistent (VPSC) method was initially used for low-symmetry materials to simulate the plastic deformation of polycrystalline aggregates. The plastic deformation occurs because of external strains and stresses and accounts for any grain interaction effects. This means that any orientations or sizes of the grains dominate the stress response in the grain. This model treats each grain as a viscoplastic ellipsoidal inclusion inside of a homogeneous effective medium [50]. The most popular VPSC code was made available by [51]. The model regards each grain as an ellipsoidal inclusion interacting with a homogeneous effective medium represented by the polycrystal. The deformation that can occur within each grain will be related to the shear mechanism from the slip system that causes the macrodeformation of the polycrystal. Once the slip system is activated from the deformation surpassing the critical resolved shear stress, the voce hardening equation updates the CRSS of the system with respect to the accumulated shear strain [50].
The stress and strain rate are second-order symmetric tensors, but since the plastic deformation occurs through shear, the plasticity can be expressed in terms of deviatoric stress and strain rate tensors. The mean-field method, which VPSC is based on, involves taking multiple information points within a grain and averaging them within each grain and treating each grain as a single element or point to input into the model; this method was used in this case for simulation. Looking at the polycrystalline aggregate, the constitutive behavior is expressed in the form of a non-linear rate-sensitivity equation. This equation involves the use of threshold stress, a symmetric Schmid tensor associated with the slip system, the normal and Burger’s vector of the slip system, the deviatoric strain rate and stress, and the local shear rate on the slip system where there is a normalization factor and a rate-sensitivity exponent. For the linear equation located inside of the grain, the equation utilizes viscoplastic compliance and the back-extrapolated term of the grain. The equivalent inclusion concept is incorporated using a homogenous macroscopic modulus so the inhomogeneity is inside of the eigenstrain-rate field, which is replaced by an equivalent inclusion. Many tensor-constitutive equations are reduced to a set of equivalent scalar equations to be solved, and the microscopic motion that a single crystal experiences is inherited from the continuum level in the basic form of pure shear and rotation. This can be seen below, where the velocity gradient has been decomposed into a strain rate and a rotation rate, or spin [52]:
L o i j c = D o i j c + W o i j c
L o i j c symbolizes the displacement gradient tensor, D o i j c the distortion rate, and W o i j c the rotation rate. The model provides a value for each grain’s velocity gradient utilizing kinematic equations as mentioned previously with the velocity gradient. To update the orientation of the crystal and the deformation gradient and shape of the grain, the following equations are used [52]:
R c ˙ = W c W o c , R R c
F c n e w = F c o l d + F c ˙ Δ t = I + L c Δ t F c o l d
X · X T = 1
R c ˙ is the rate of change of the crystal orientation matrix, W c is the rotation rate, and R c is a rigid crystal rotation that transforms from the initial to the final crystal axes. F c n e w is the deformation gradient of the grain in the new position and F c o l d is the deformation gradient of the grain in the old position. X and X T assume a spherical locus of points X in the undeformed space. To perform homogenization on the homogenous-equivalent medium, as mentioned earlier, there is a linear relation assumed at the polycrystalline level. To incorporate the equivalent inclusion earlier, the local constitutive behavior is written to make a fictional eigenstrain rate where the inhomogeneity is set aside. This can be seen in the equations below [52]:
E i j = M ¯ i j k l Σ k l + E i j o
ε i j x ¯ = M ¯ i j k l σ k l x ¯ + E i j o + ε i j * x ¯
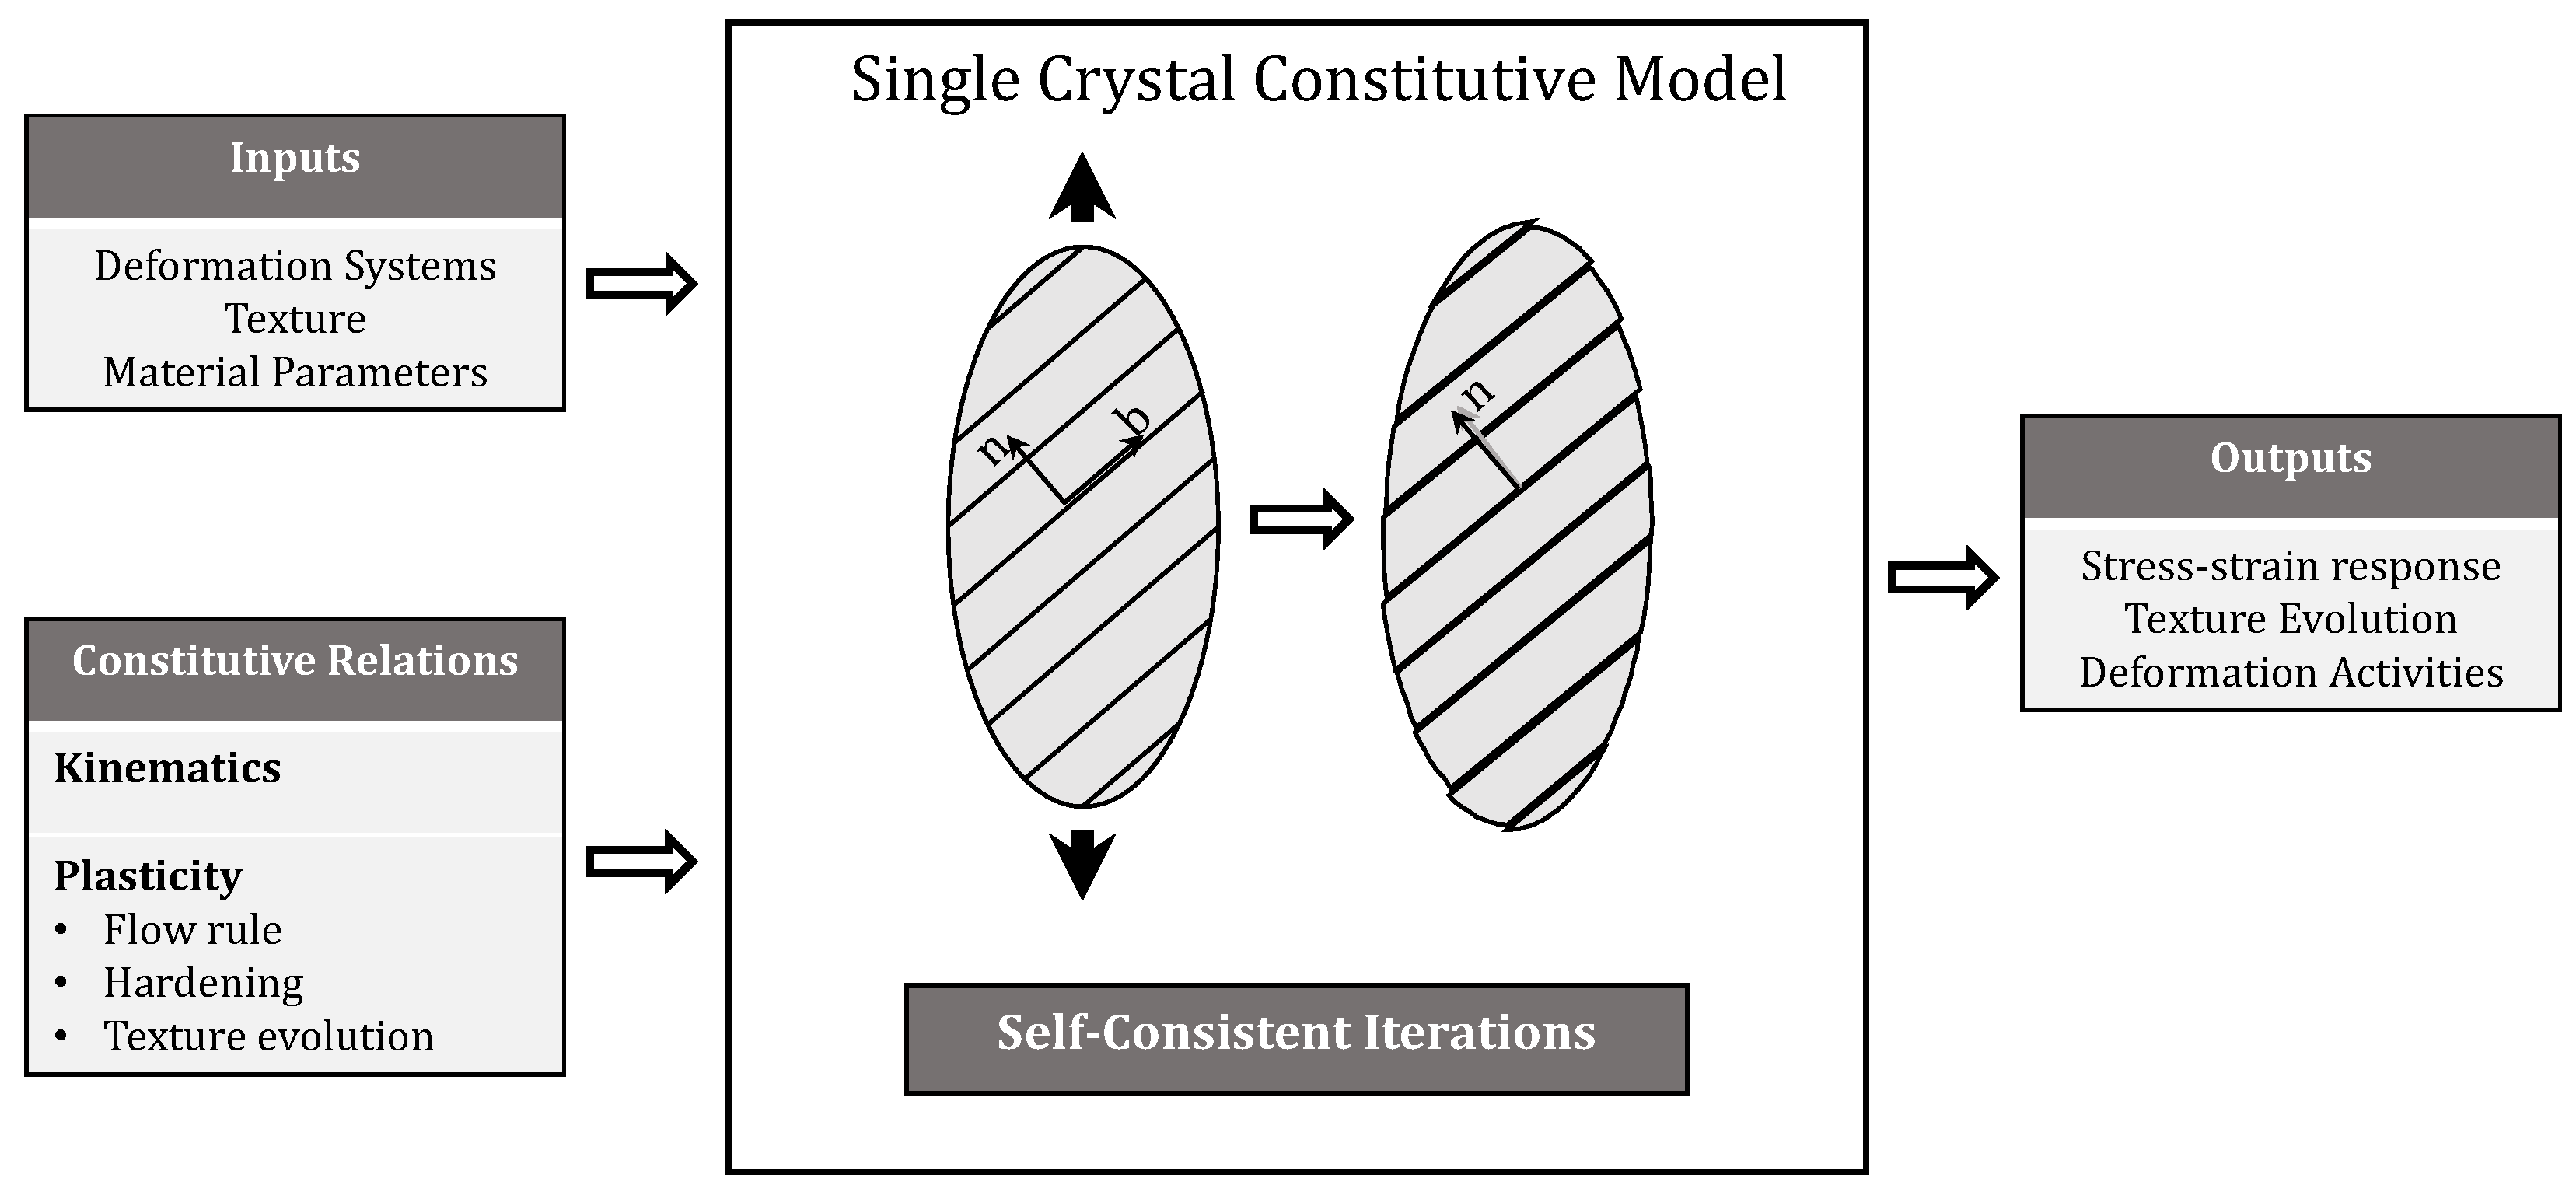
E i j and Σ k l are the overall (macroscopic) magnitudes and M ¯ i j k l and E i j o are the macroscopic viscoplastic compliance and back-extrapolated term, respectively. ε i j x ¯ is the deviatoric strain rate, σ k l is the deviatoric stress, and ε i j x x ¯ is the eigenstrain-rate field. The input for the code requires the information for the initial crystallographic texture; single crystal properties; initial morphological texture; boundary conditions; as well as parameters for convergence, precision, and run type [52]. These inputs were acquired using the experimental procedures outlined in Section 2. Figure 7 shows the schematic of the inputs, process, and outputs for the VPSC model. For VPSC simulation, the experimental data for ARL samples are used.

4.2. Hardening Rule

The voce hardening rule seen in Equation (7) imposes the local stress that the shear will experience on the slip system, adapts to the accumulated shear strain within each grain, and applies the input microstructural texture information to predict the texture evolution and stress response of the material [53]:
τ ^ s = τ 0 s + τ 1 s + θ 1 s Γ 1 e x p Γ θ 0 s τ 1 s
The variables within Equation (7) consist of the function of the accumulated shear strain within the grain of the form Γ = Σ s Δ γ s , the initial CRSS τ 0 s , the initial hardening rate θ 0 s , the asymptotic hardening rate θ 1 s , and the back-extrapolated CRSS represented by τ 0 + τ 1 . Equation (8) consists of the Hall–Petch relationship to the initial CRSS value found in the Voce hardening rule:
τ 0 = τ + k h p G S a v g
In Equation (8), the τ 0 value is still the initial CRSS value, the τ is the difference in the back-extrapolated CRSS, the G S a v g is the average grain size, and k h p is the Hall–Petch parameter.

4.3. Intersplat Boundary Effects

The high-velocity impact of the powder particles created intersplat boundaries with regions of high dislocation densities and fine sub-grain structures due to the local metallurgical bonding and mechanical interlocking caused by localized plastic deformation at these interparticle and particle–substrate interfaces [2]. This is evident from the etched OM and SEM images. Within the literature, the grain boundary effect is implemented for a crystal plasticity phase field model, where the initial CRSS τ 0 for each grain orientation had a Hall–Petch relationship related to the directed distance from a given voxel to the nearest grain boundary [33]. Using this method for CSAM materials, the initial Hall–Petch equation is modified to incorporate the localized distribution of the smaller grains at the intersplat boundaries in the CSAM material. Implementing the grain size distribution rather than an averaged value reflected the heterogeneity of the microstructure, as observed in EBSD micrographs, which resulted in localized mechanical responses. The modified Hall–Petch relationship for the CSAM microstructure is shown in Equation (9):
τ 0 = τ + k h p G S i k i b · 1 2 P S G S i
The new variables introduced in the equation are PS for powder size (in μ m ), k i b for the intersplat boundary parameter, and G S i standing for individual grain size. The modified Equation (9) is still applicable for rolled materials since the powders are absent, and the intersplat boundary parameter ‘ k i b ’ can be set to zero. Similarly, for grains larger than the average powder size, the 1 2 ( P S G S i ) in the intersplat boundary term is set to the minimum grain size. This allows for the intersplat boundary term to always be rational and positive and assumes there is a layer of small grains at the intersplat boundary in the cold-sprayed condition.

5. Simulation Results and Discussion

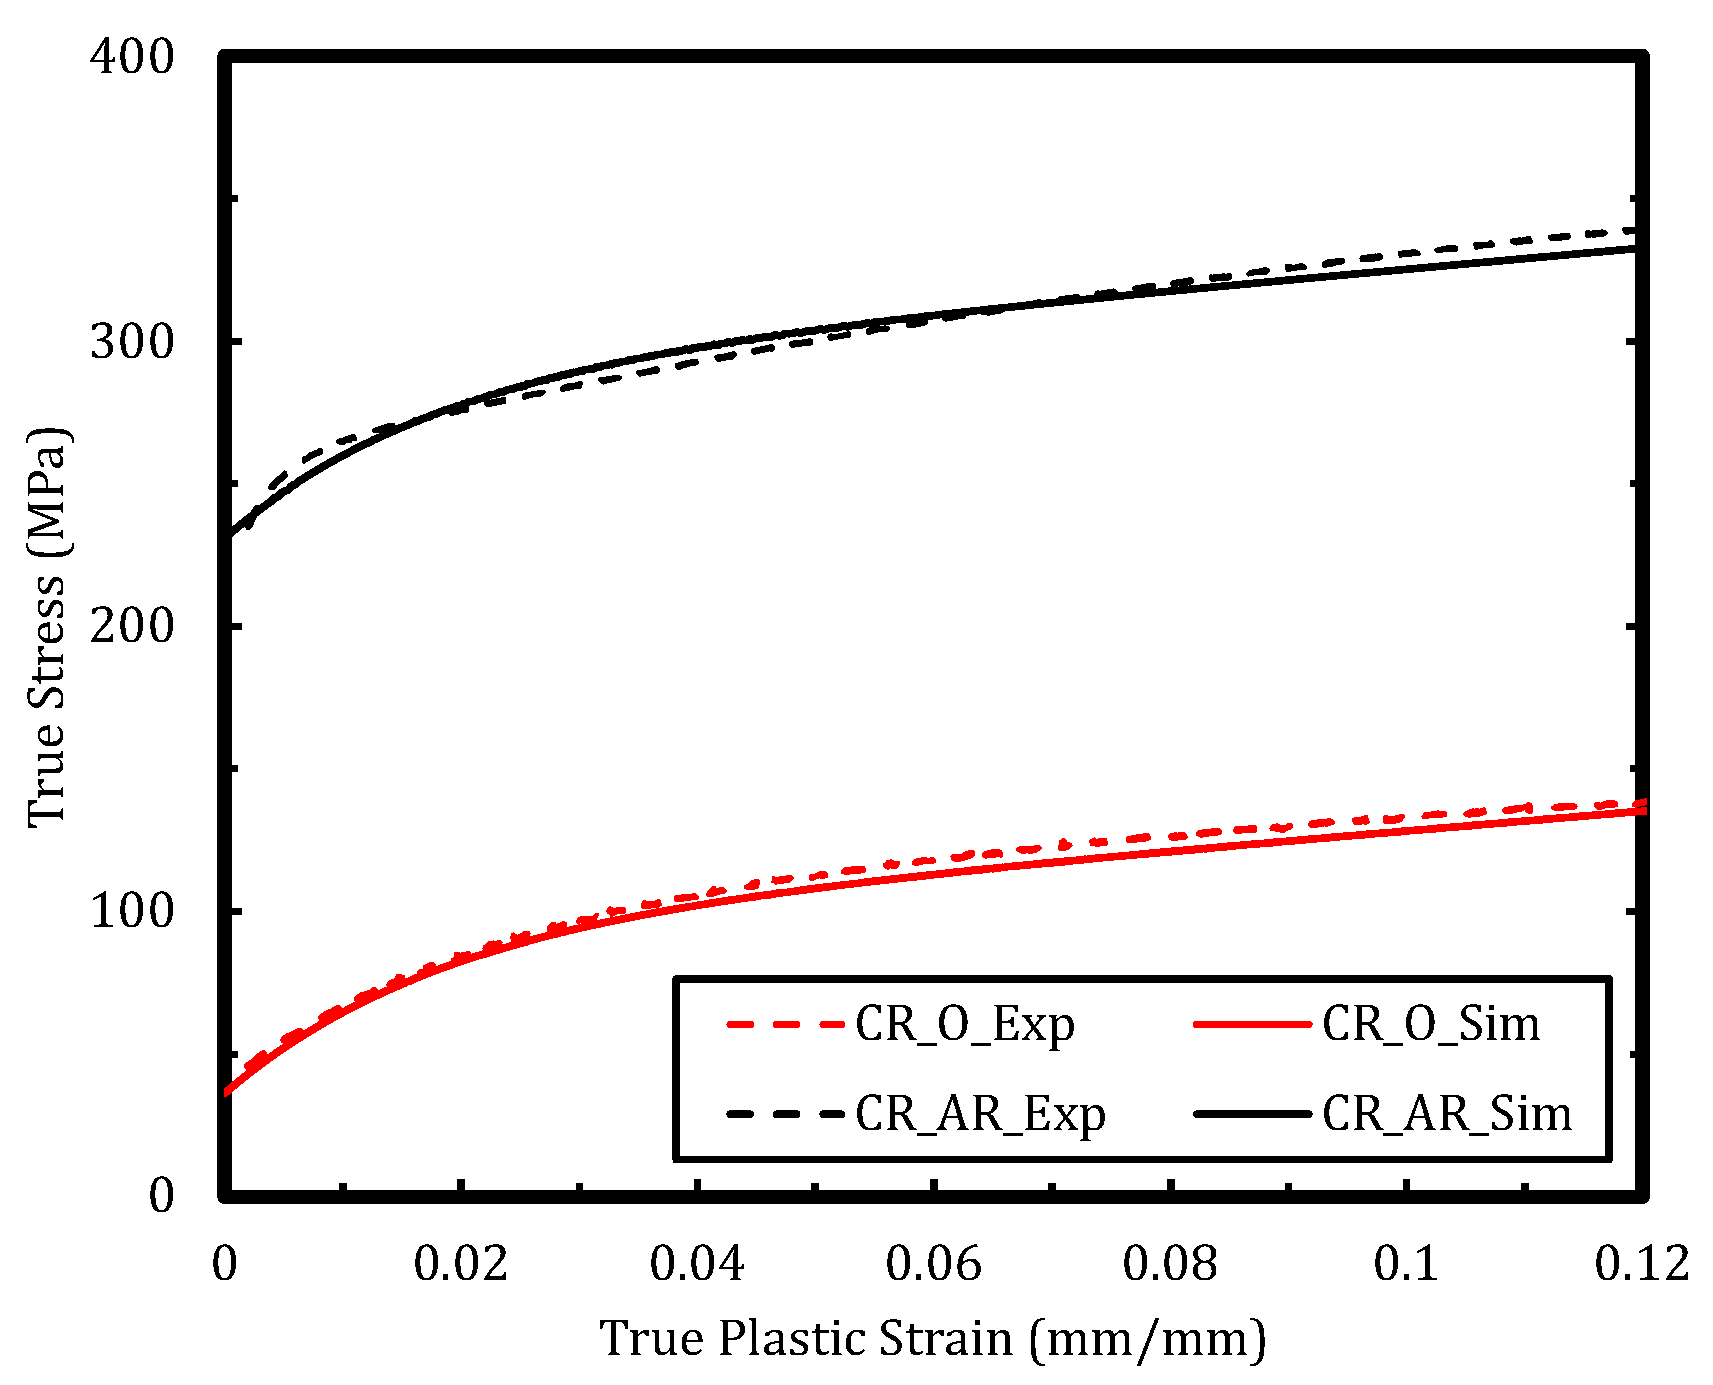
Figure 8 shows the calibrated stress–strain plots for the VPSC simulation in tension along the rolling direction for the as-rolled (CR_AR) and annealed (CR_O) Al6061 with the experimental uniaxial tension data in the rolling direction. The calibrated values for Al6061 are shown in Table 4. As shown in Figure 8, after calibration, the stress–strain response from the VPSC simulation results matches well with the experimental values.
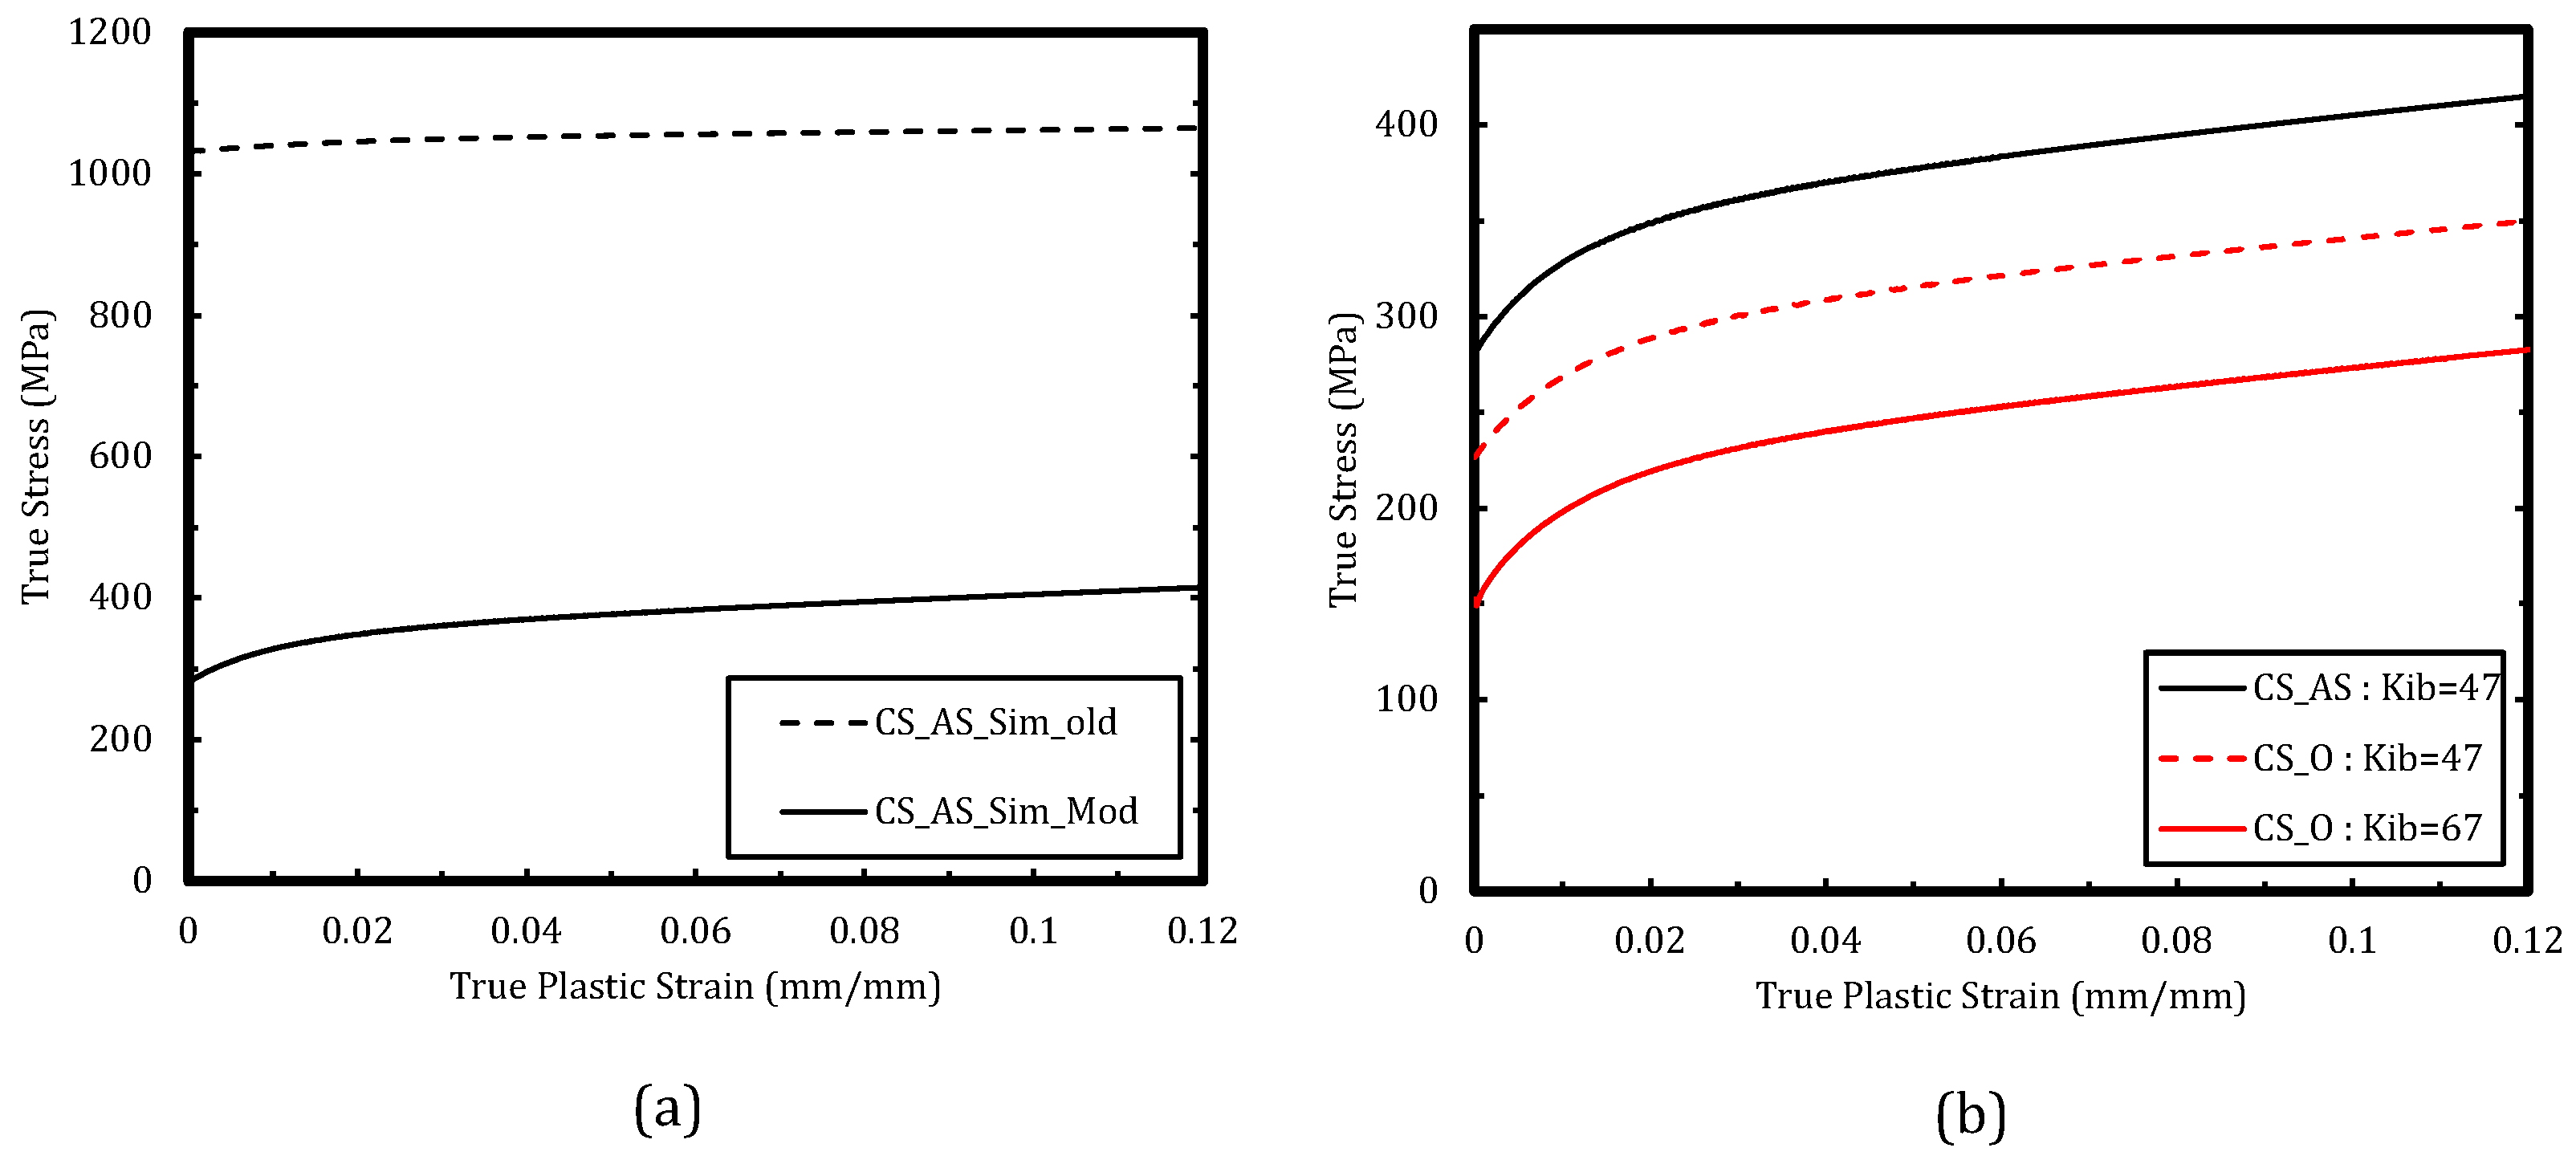
Figure 9 shows the simulated stress–strain response for CSAM Al6061 with the Hall–Petch relation (without modification), which predicted an artificially high-yield stress of approx. 1050 MPa compared to the published experimental value of 293 MPa [49]. The increase in the yield stress results from the smaller grains with high lattice distortions that accumulated at the intersplat boundaries around the powder particles. Although the average grain size lowers for the sprayed microstructure, the poor bonding and intersplat-related issues such as oxides in the as-sprayed material lower the yield of these grains. With the modified Hall–Petch relation in Equation (9), a new intersplat boundary parameter k i b accounts for the intersplat boundary phenomena, leading to a more accurate stress–strain response of the CSAM Al6061 that can be seen in Figure 9a. Figure 9a shows the deformation response comparison with and without the incorporation of intersplat boundary effects (Equations (8) and (9)) in the VPSC code. With intersplat boundary effects, a significant reduction in the yield stress is observed. The intersplat boundary parameter of k i b = 47.0 is used to simulate the as-sprayed condition. In Figure 9b, the as-sprayed and the annealed Al6061 samples clearly follow the correct trend in reduced yield stress for the post-processed Al6061, as seen in the published experimental data (see Table 3). With the same intersplat boundary parameter of k i b = 47.0 , the predicted stress–strain response is higher than the value observed in the experiment. However, the intersplat boundary value of k i b = 67.0 in the annealed condition predicted the yield point comparable to the experimental values.
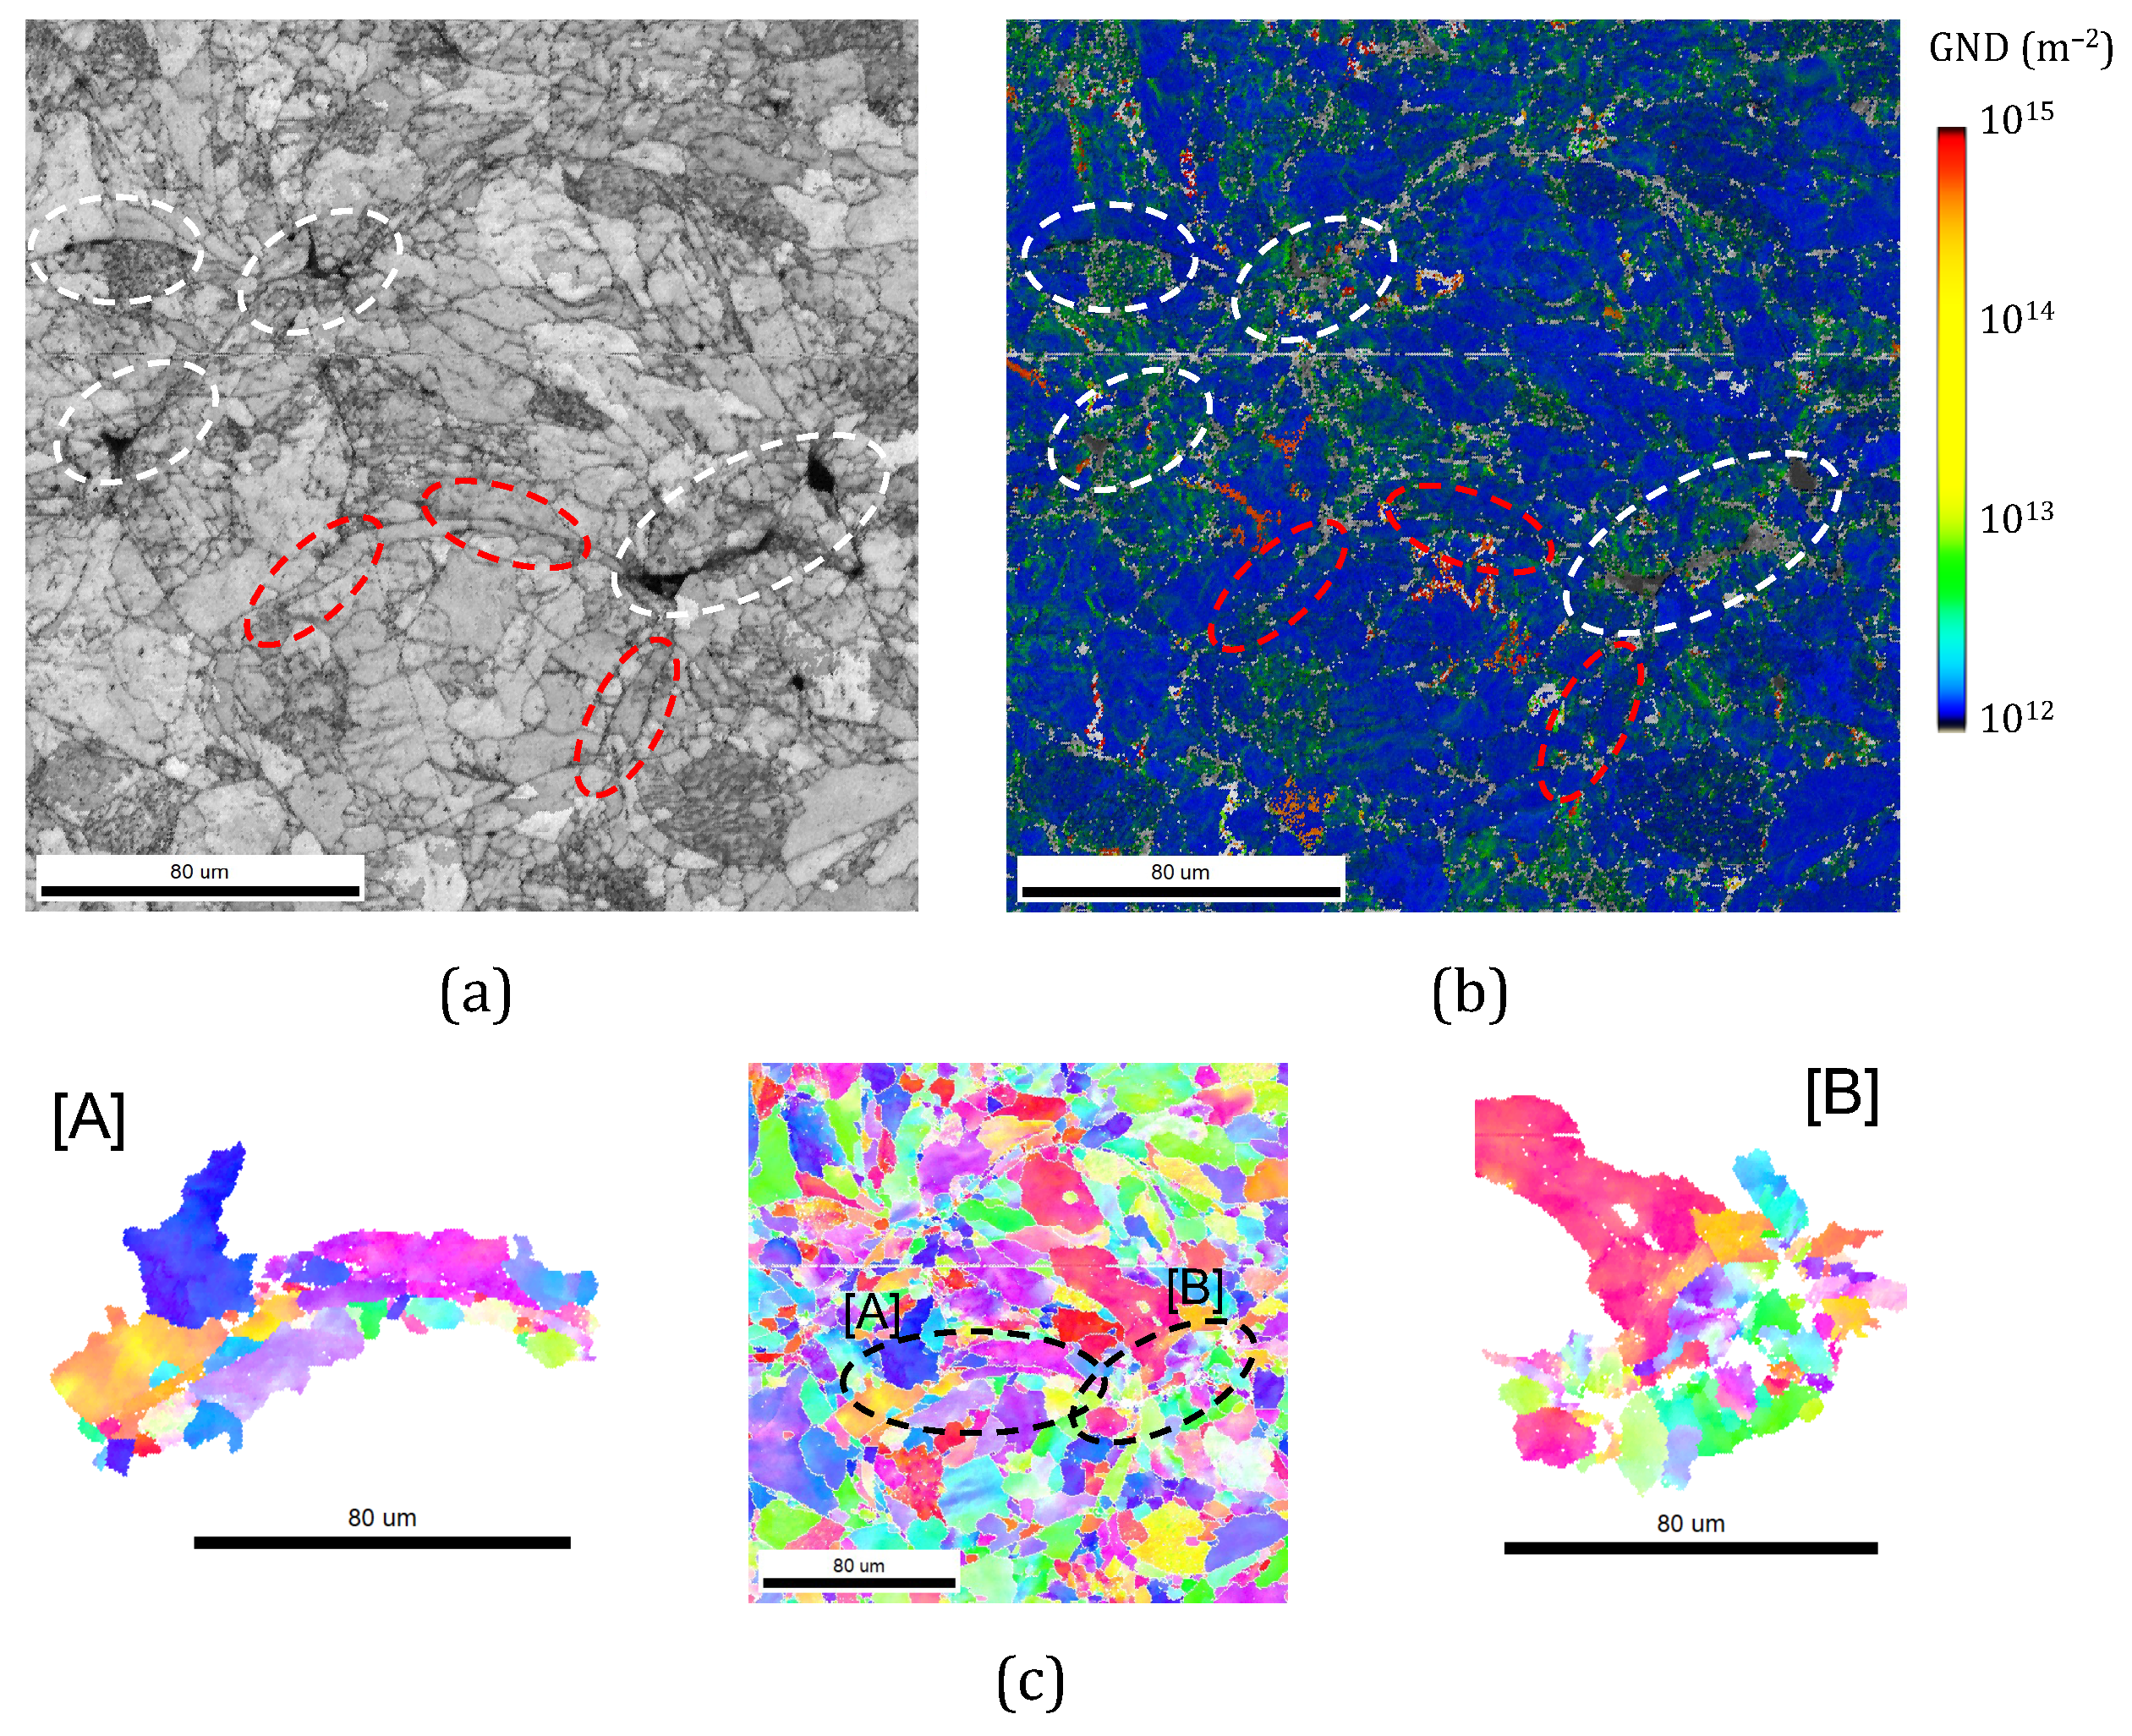
While the annealed case has bigger grains and fewer intersplat boundaries compared to the as-sprayed case, the intersplat region still has smaller grains within the microstructure. Due to the bonding-related issues that the CSAM microstructure experiences and their effect on recrystallization, grain growth, and recovery, the localization of the sub-grain structure and GNDs exists within the microstructure. These smaller grains near the poor-bonded regions lead to the reverse effect on the Hall–Petch relationship, lowering the yield point of smaller grains near the intersplat boundaries. Likewise, the higher dislocation densities present in the smaller grains cause the intersplat boundaries to be more sensitive to these bonding issues, leading to the increased value of the intersplat boundary parameter for annealed samples compared to the as-sprayed case. Accounting for these intersplat boundary mechanisms, significant improvements are observed in the yield stress and deformation response of the as-sprayed and annealed cold-sprayed samples. The value of the intersplat boundary parameter increases for the annealed cold-sprayed samples, although the heterogeneity in the microstructure and intersplat effects are reduced by the annealing heat treatment. The sensitivity of the intersplat boundary parameter to smaller grains that correlates with mechanisms associated with the cold-spraying process such as intersplat bonding, strain hardening, and oxides seems to increase with the annealing process. Image quality and geometrically necessary dislocation (GND) density maps in Figure 10a,b present the correlation between spatial variations in the dislocation density and porosity in the annealed sample. The severely plastic deformed sub-grains at the intersplat boundaries recrystallize and grow along the intersplat boundary into elongated grains, as seen for region [A] in Figure 10c. Meanwhile, the regions of bad bonding or porosity (dotted white regions in Figure 10a,b and region [B] in Figure 10c) show traces of high dislocation densities and fine-grain structures (Figure 10b,c). The elongated grains along the intersplat boundary regions also explain the slight increase in the average aspect ratio in the annealed sample, as tabulated in Table 2. The intersplat effects that are prevalent for smaller grains drive the parameter higher or lower, depending on the bonding strength present. After annealing, the weak bonding present in the microstructure, partially due to porosity, the reduction in grain growth, and lower yield, have a strong correlation with the existing smaller grains, as can be seen in Figure 10. This increased correlation of poor-bonded regions to smaller grains is reflected with an increased intersplat boundary parameter for the annealed case.
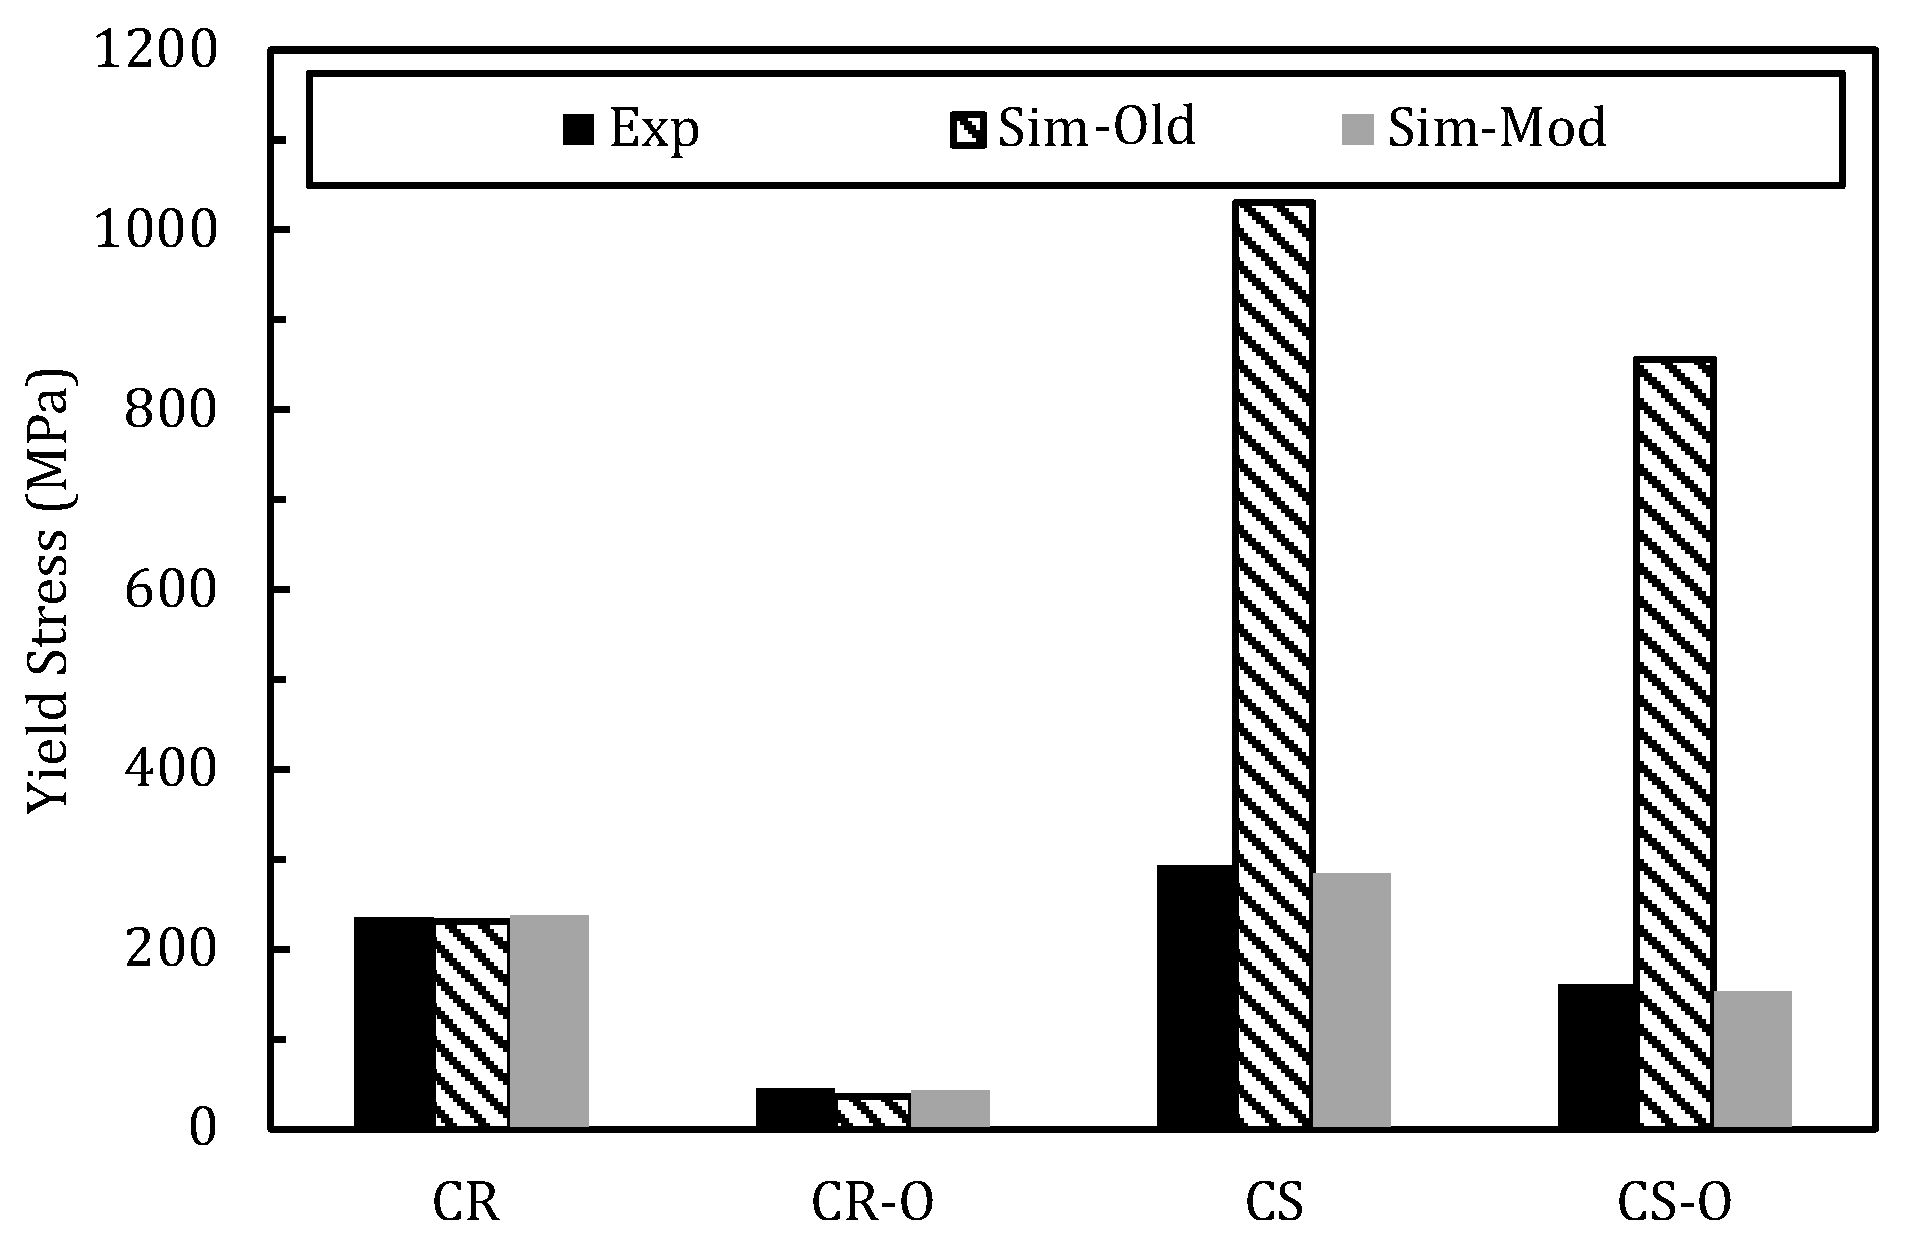
Figure 11 compares the rolled and cold-sprayed materials in their as-received and annealed conditions for the experimental, simulated, and modified simulated yield stress values depicting the superior predictive capability of the modified relationship for the cold-sprayed Al6061.
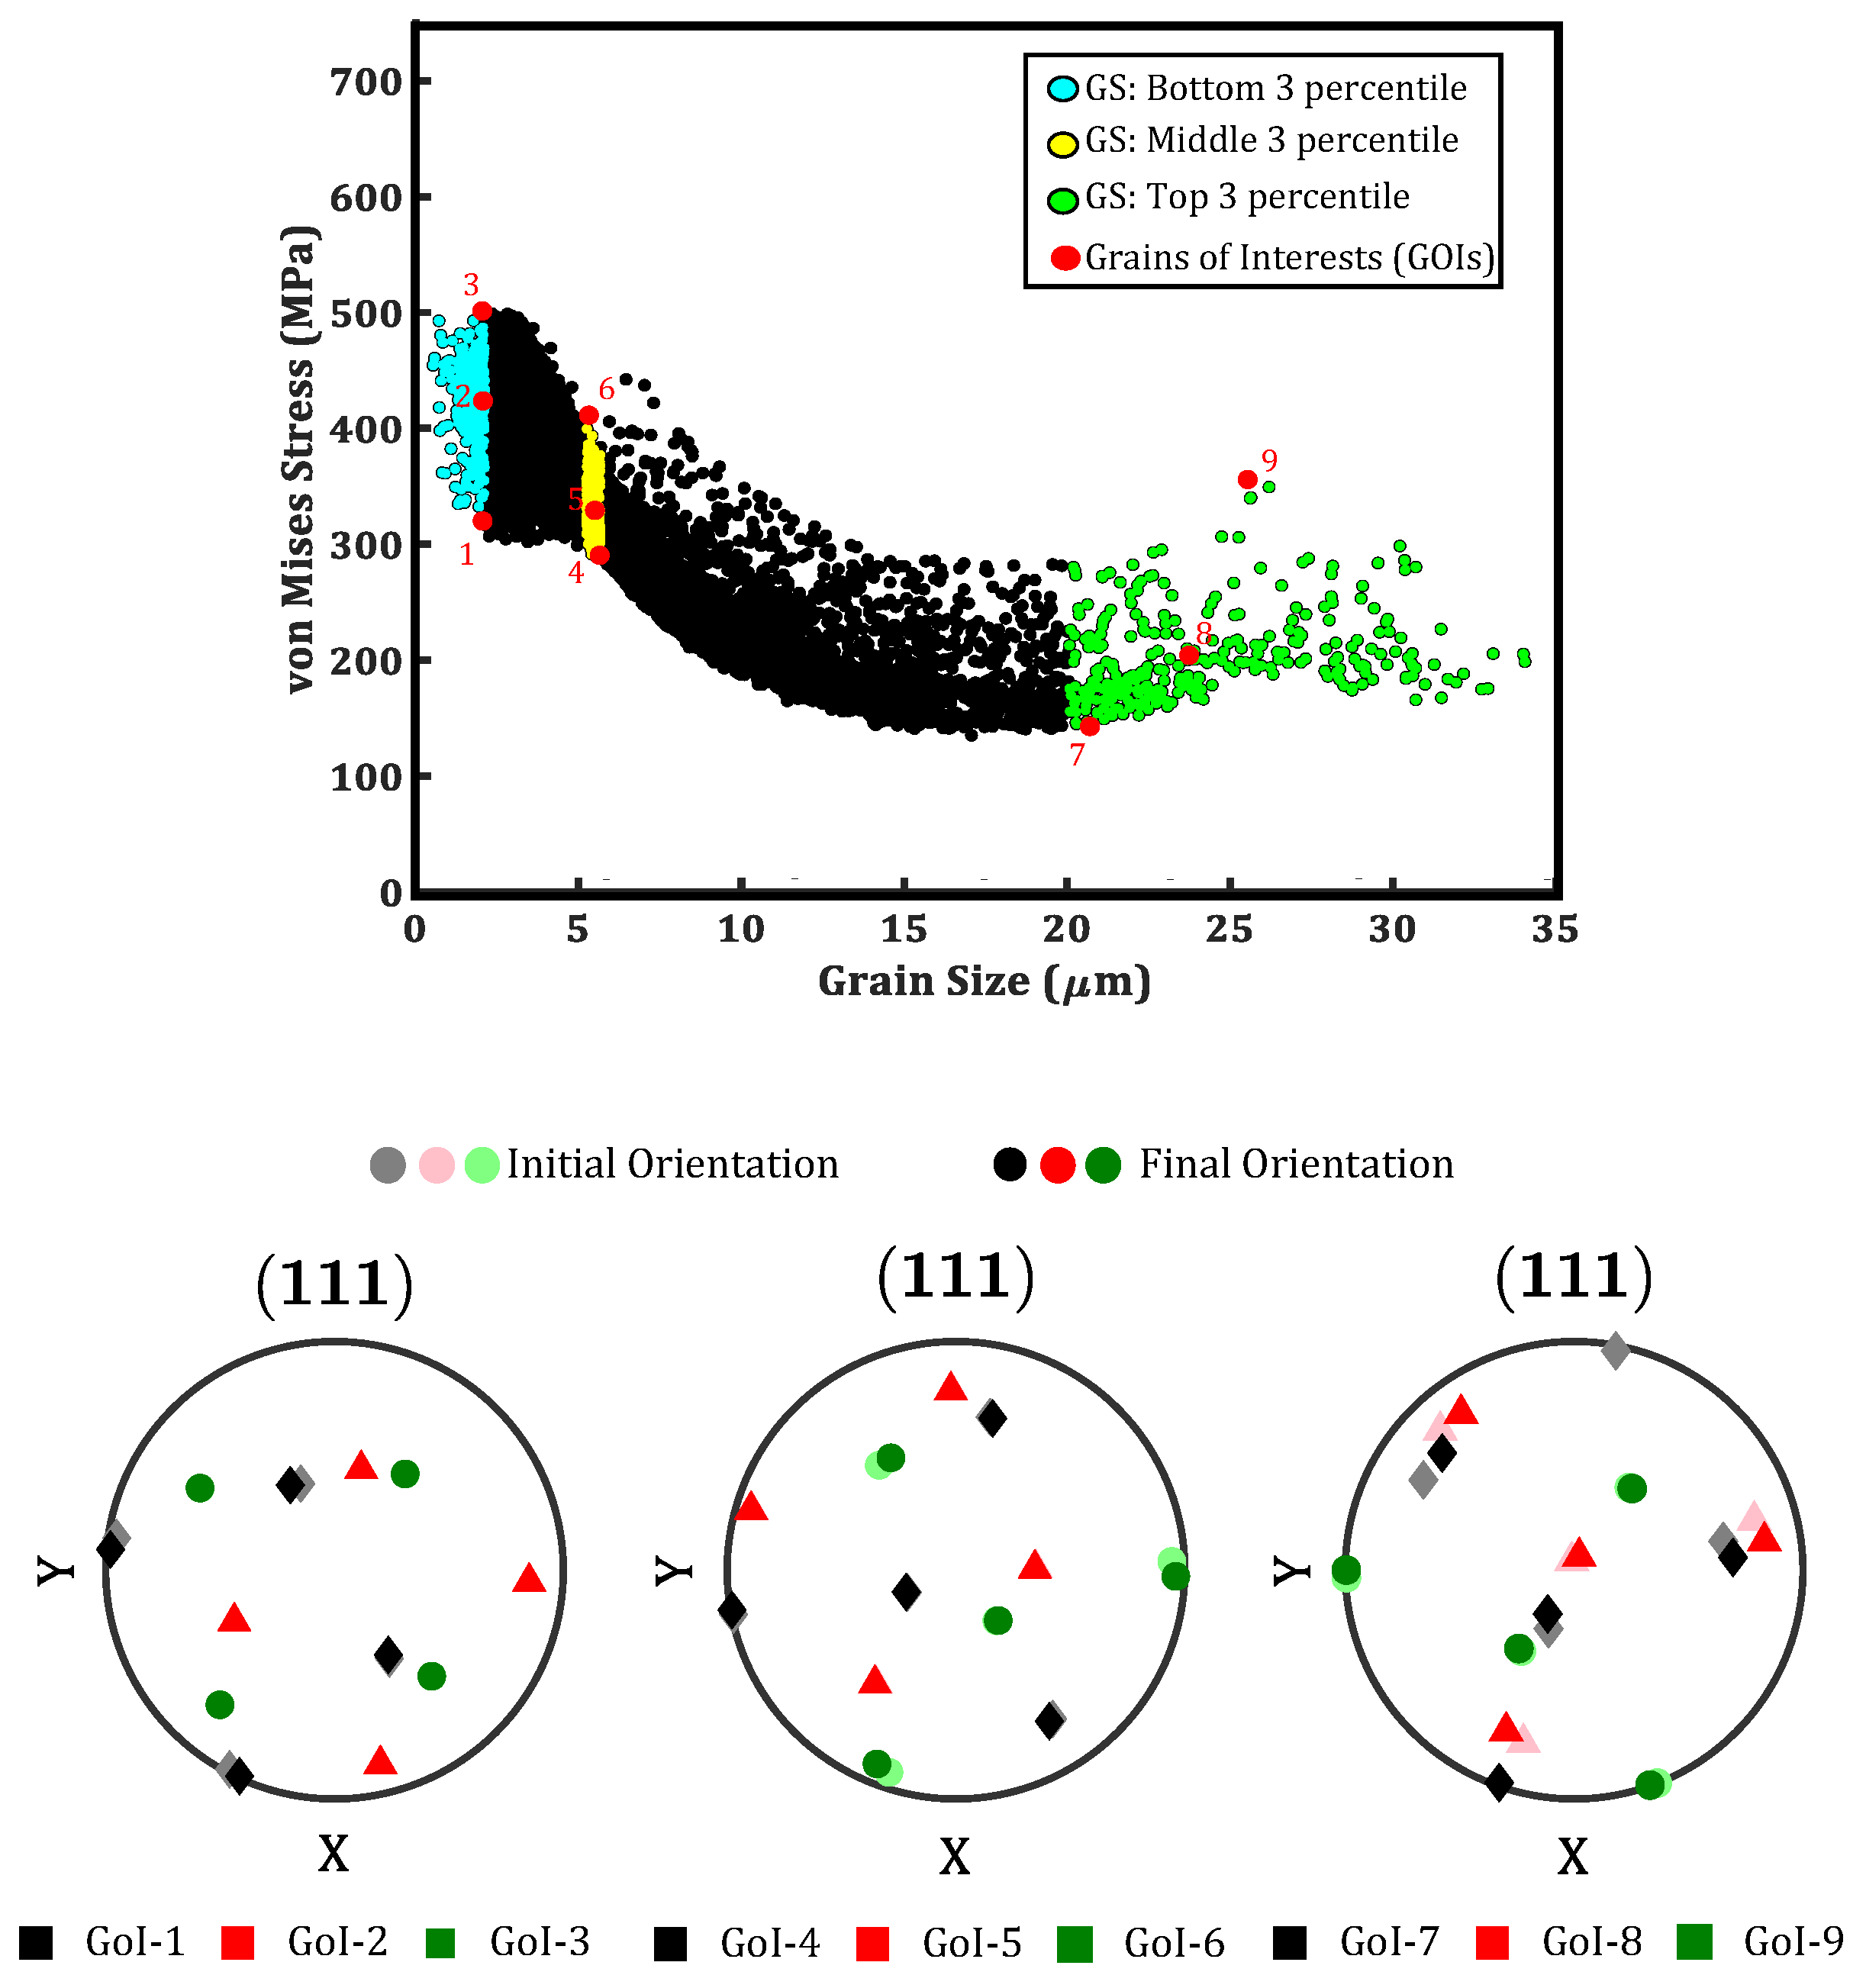
The Hall–Petch relationship states that a decreasing grain size results in an increase in the strength of the material. However, mechanical tests performed on the CSAM material show that the small grains at intersplat regions lead to early failure due to bonding-related issues and the pre-existing residual stresses [10,20,54,55]. Using VPSC simulation results, the stresses experienced by these individual grains based on their sizes within the material were analyzed at nine different regions of interest. These three separate ranges consisted of the top, middle, and bottom three percentiles of the grain sizes. These nine regions, grains of interest (GoI), were selected as seen in Table 5 below.
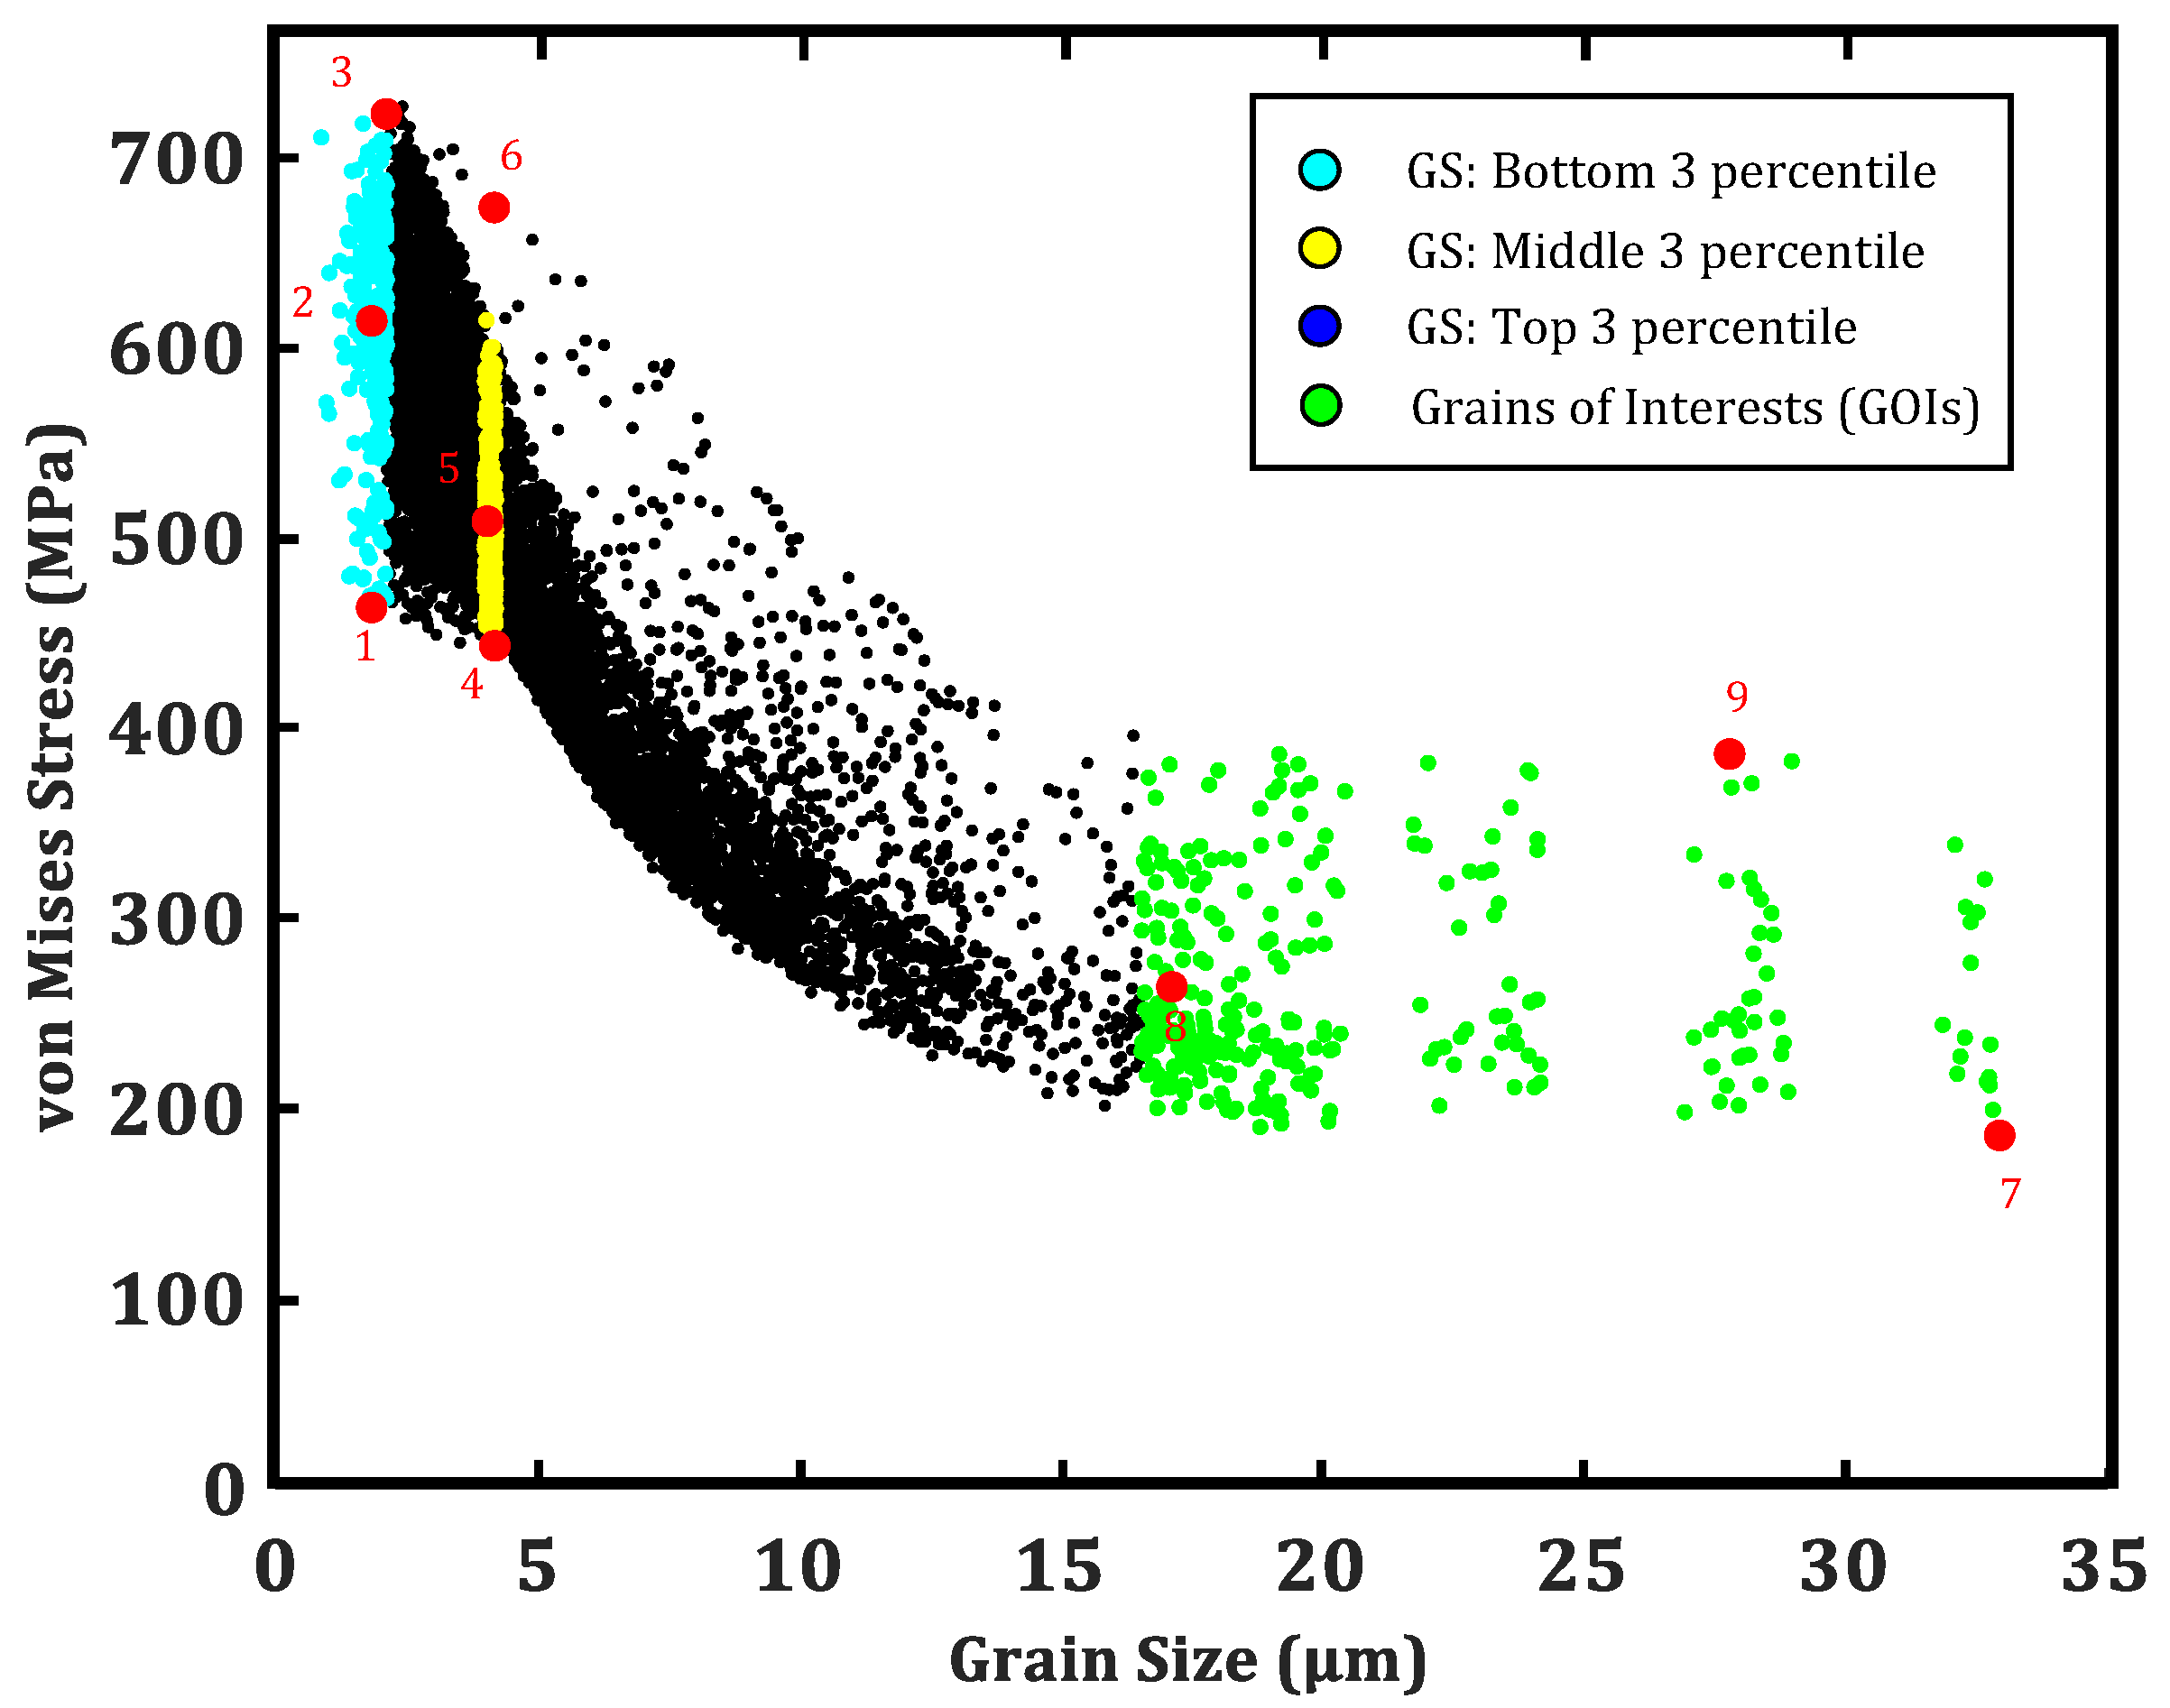
Figure 12 shows a scatter plot of von Mises stress corresponding to grain sizes at the final deformation step of 15% strain. The smaller grains experience higher localized stresses than the larger grains. Out of these grains, nine specific grains of interest (GOIs) are marked within the figure, with the minimum, mean, and maximum von Mises stress at the bottom, middle, and top three percentile of grain size.
The distribution chosen for the three regions of interest included grains with the bottom three percentiles below 2.12 µm in grain size, the middle three percentiles ranging from 4.00 to 4.20 µm, and the top three percentiles above 16.54 µm of the grain size. Overall, each percentile split shows the von Mises stress relationship to the grain size. The trend shows that the Hall–Petch relationship drives a large portion of the microstructural effects seen within the deformation response of the CSAM Al6061. However, within these regions, the grain size itself does not dictate the stress experienced, but the orientation and the Schmid factor play a significant role in the deformation accommodated by these grains. Higher dislocation activities result in the local reorientation of grains and can be followed using texture information.
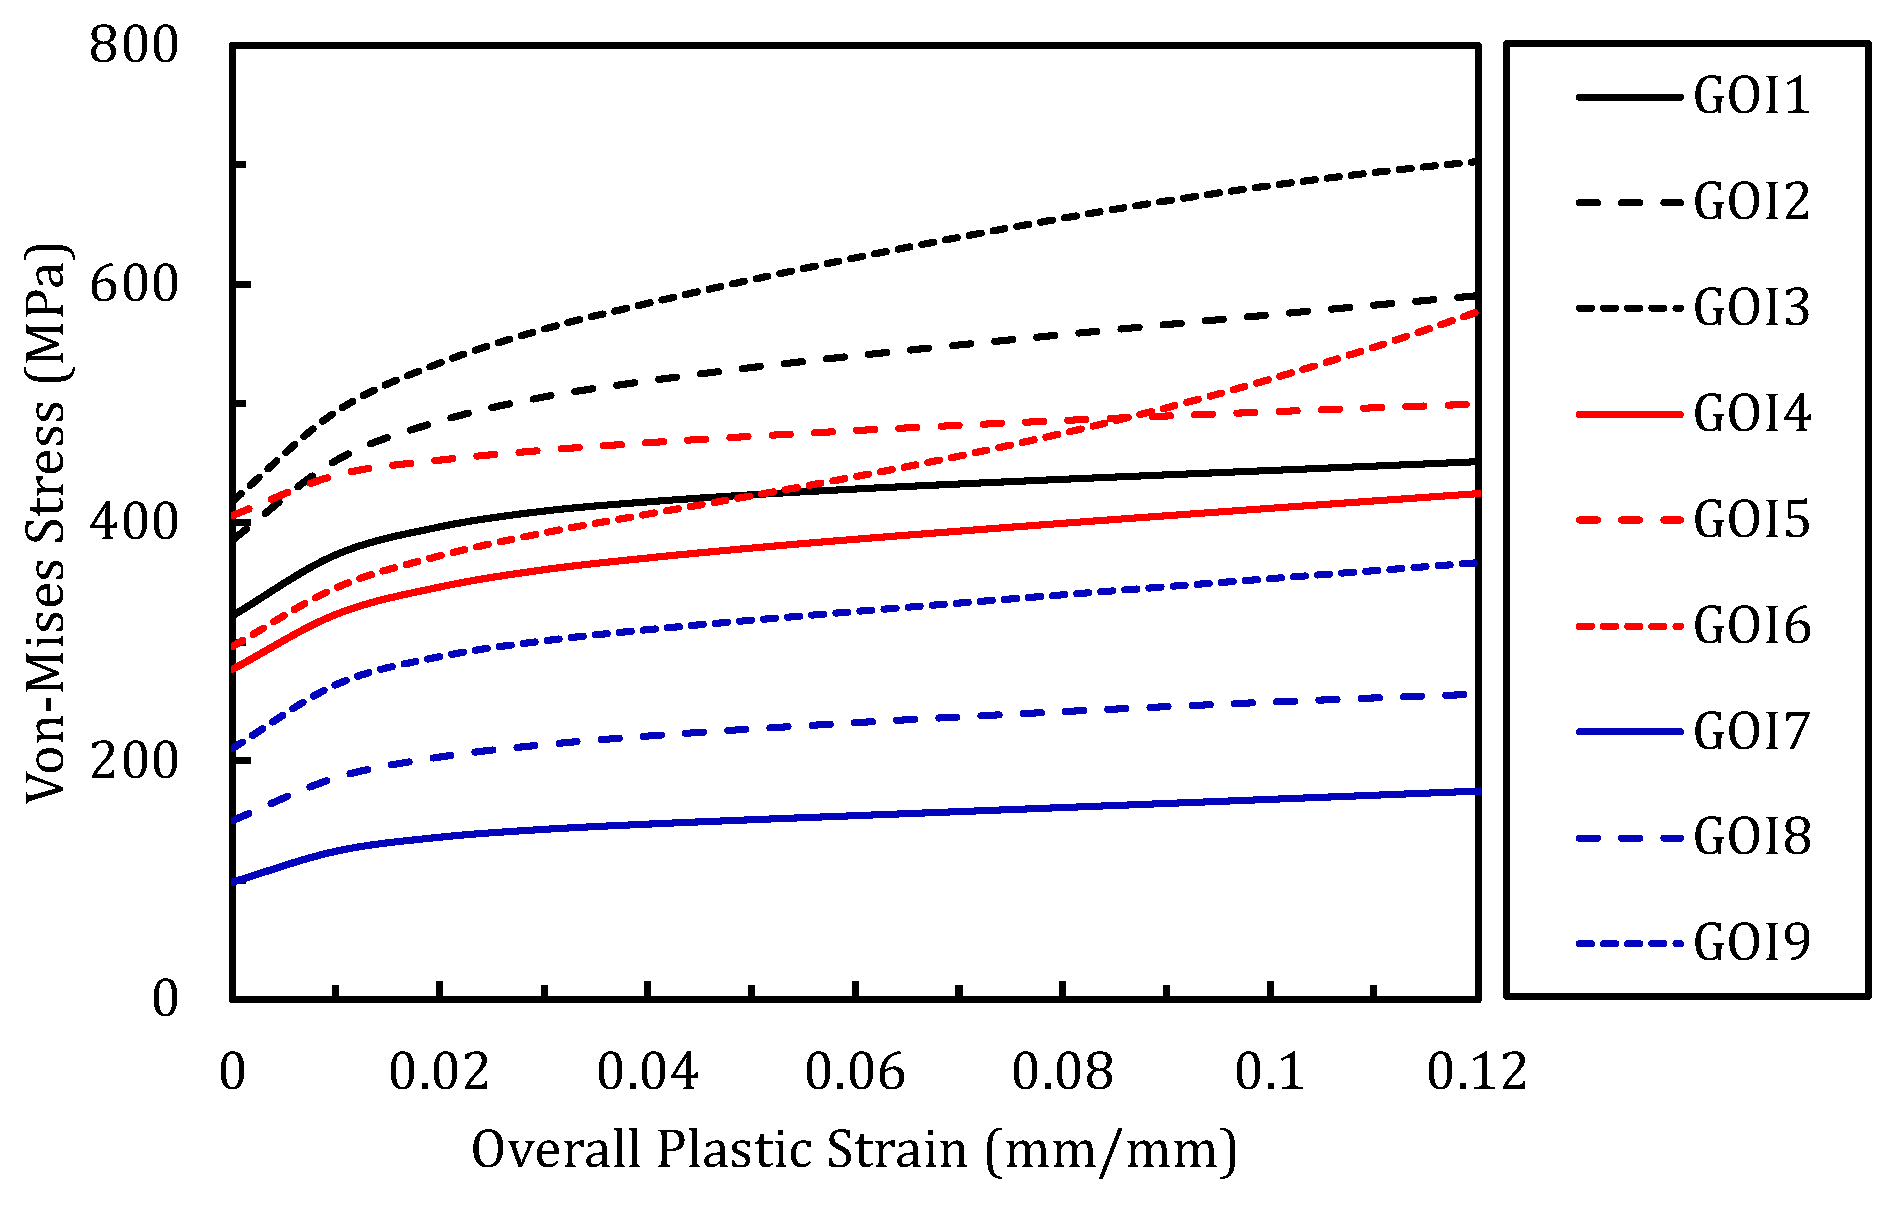
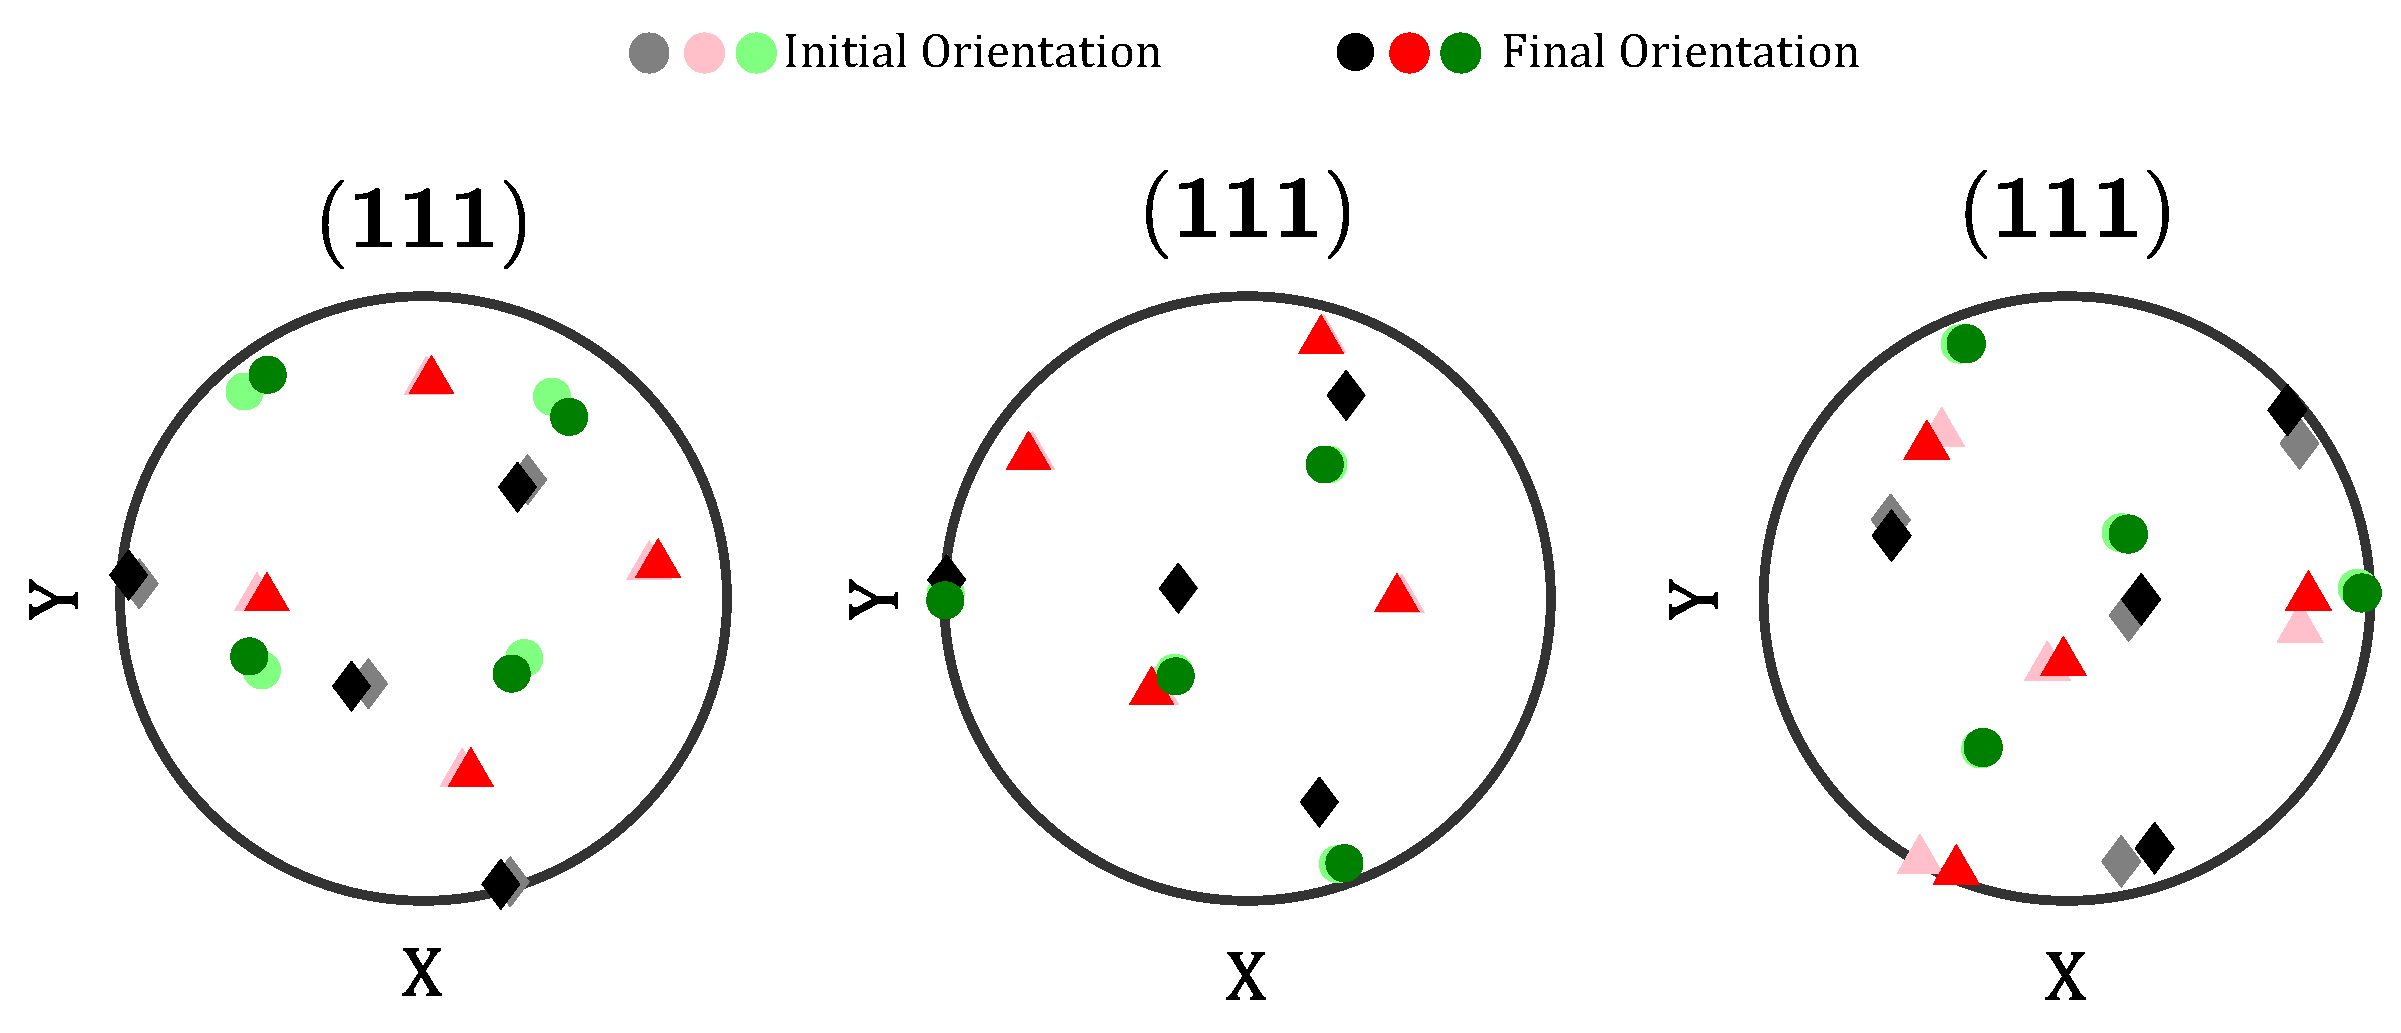
Table 6 tabulates the grain size, von Mises stress, Schmid factor, and initial and final orientation of the GoI presented in Table 5 for both the as-sprayed and annealed samples. The von Mises stress is obtained from the final deformation step of 15%, and the maximum Schmid factor experienced by the { 111 } < 1 1 ¯ 0 > slip systems is calculated from the initial condition at 0% strain. In an as-sprayed case, GOI-3 with a grain size of 2.11 µm experienced high stress whereas GOI-7 with a grain size of 32.97 µm experienced the lowest stress. Smaller grains experiencing high stresses are responsible for the premature failure of the as-sprayed condition of the CSAM Al6061, as seen through experimentation [22,56,57]. The high stresses in smaller grains are due to higher amounts of applied stress required to allow for a dislocation to nucleate across a grain boundary after dislocation pile up. Inversely, GoI-7 is considerably larger in size and located toward the centroid of the cold-sprayed powder particle holding much lower dislocation densities than the smaller grains, thus accommodating larger deformation. The evolution of stresses in the GoIs is plotted in Figure 13.
Likewise, stress and texture evolution in the GOIs of the annealed CSAM Al6061 also show a similar trend, with small grains showing higher stresses and larger grains with lower stresses. Overall, it is evident that the grain sizes are larger overall than the as-sprayed case due to the annealing process increasing the average grain size from the grain growth phase of the annealing process.
Figure 13 shows the evolution of the von Mises stress of the top, middle, and bottom three percentile of the annealed CSAM Al6061 data set tabulated in Table 6. The von Mises stress is lowest for the largest grains as well as the material behaving with a higher toughness and a more ductile behavior. Figure 14 contains the texture evolution of the GoIs for the as-sprayed modified CSAM Al6061, where the lattice rotations for GoI-1, GoI-4, GoI-5, GoI-6, and GoI-8 are negligible as they are considered unfavorable due to the initial orientation of the grains or potentially due to the proximity of the grains to the intersplat boundaries. Considering the middle three percentile is around the average of the population data set, it is not surprising that GoI-4, GoI-5, and GoI-6 have experienced little to no texture evolution and that they all have a similar grain size. Figure 14 and Figure 15 display the initial and final orientations of the grains. Figure 15 contains the texture evolution of the GoIs for the annealed modified CSAM Al6061 case where the lattice rotations for GoI-1, GoI-5, GoI-7, GoI-8, and GoI-9 are negligible as they are unfavorable due to the initial orientation of the grains being near the intersplat boundaries. It also shows that the bottom three percentiles experience a more negligible texture evolution for the annealed case whereas the as-sprayed case experienced a more negligible texture evolution for the middle three percentiles.
For the as-sprayed CSAM Al6061, the larger grains, GoI-2 and GoI-3, show lattice rotations occurring from the dislocation slips while simultaneously accommodating strains. These larger grains are located toward the centroid region of the powder particle and experience lower dislocation densities. The analysis shows that grain size effects along with the intersplat boundary effects in the incorporated modified Hall–Petch equation can predict the deformation response of CSAM materials. Further exploration with the intersplat boundary parameter is required in the future for the robust prediction of post-processed CSAM materials.

6. Conclusions

This work presents the microstructure and mechanical characterization of cold-sprayed additive manufactured (CSAM) parts, showing the effects of intersplat boundary features on the stress–strain response. The optical and electron micrographs showed evidence of smaller grains with high lattice distortions accumulating at the intersplat boundaries, depicting the heterogeneity of the cold-sprayed microstructure. Likewise, viscoplastic self-consistent (VPSC) simulations performed on the CSAM Al6061 microstructures showed higher yield stress predictions than the experimental values. Utilizing the correlation of smaller grains with the intersplat boundaries, the Hall–Petch equation is modified to include an intersplat boundary term as a function of powder size, grain size, and directed distance from the intersplat boundary. The incorporation of the intersplat boundary term in the VPSC model mitigated the artificially high-yield stress values observed due to the Hall–Petch effect from the ultra-fine-grain structure, matching more closely with the experimental values. The boundary effects of the small grains correlating with high dislocation densities and intersplat boundary locations were captured through an intersplat boundary parameter and individual grain size inputs into the modified VPSC model. The modified relation incorporates the correlation between smaller grains and poorly bonded regions, capturing accurate deformation responses for the as-sprayed and post-processed microstructures. Furthermore, a grain analysis showed that the stresses experienced and strain accommodated by individual grains are the combined effects of grain size, orientation, and intersplat mechanisms. Finally, future work is recommended to expand the intersplat boundary parameter to include more features from pre- and post-processing treatments on CSAM parts.

Author Contributions

Conceptualization, Y.P., S.M., H.E.K. and H.R.; methodology, A.W., Y.P. and S.M.; resources, M.P., P.C., H.E.K. and H.R.; data curation, A.W., Y.P. and S.M.; writing—original draft preparation, A.W., Y.P. and S.M.; writing—review and editing, A.W., Y.P., S.M., M.P., P.C., H.E.K. and H.R. All authors have read and agreed to the published version of the manuscript.

Funding

The authors gratefully acknowledge support from The Office of the Secretary of Defense (OSD); DEVCOM—Army Research Laboratory; and LIFT, through the “K005-01 PROJECT# 21025” grant entitled “Research Utilizing the Chemistry–Process–Structure–Property–Performance (CPSPP) Paradigm”.

Data Availability Statement

Research and supporting data are available upon request.

Acknowledgments

The authors acknowledge support from the Center for Advanced Vehicular Systems (CAVSs) and the Department of Mechanical Engineering at Mississippi State University.

Conflicts of Interest

The authors declare no conflicts of interest. The funders had no role in the design of the study; in the collection, analyses, or interpretation of data; in the writing of the manuscript; or in the decision to publish the results.

References

  1. Chakrabarty, R.; Song, J. Crystal plasticity finite element investigation of deformation of single crystal copper during cold spray. Addit. Manuf. 2022, 49, 1024–1084. [Google Scholar] [CrossRef]
  2. Yin, S.; Cavaliere, P.; Aldwell, B.; Jenkins, R.; Liao, H.; Li, W.; Lupoi, R. Cold spray additive manufacturing and repair: Fundamentals and applications. Addit. Manuf. 2018, 21, 628–650. [Google Scholar] [CrossRef]
  3. Rokni, M.R.; Widener, C.A.; Champagne, V.K.; Crawford, G.A.; Nutt, S.R. The effects of heat treatment on 7075 Al cold spray deposits. Surf. Coatings Technol. 2017, 310, 278–285. [Google Scholar] [CrossRef]
  4. Yin, S.; Lupoi, R. Cold Spray Additive Manufacturing; Springer: Berlin, Germany, 2021. [Google Scholar]
  5. Sabard, A.; McNutt, P.; Begg, H.; Hussain, T. Cold spray deposition of solution heat treated, artificially aged and naturally aged Al 7075 powder. Surf. Coatings Technol. 2020, 385, 125367. [Google Scholar] [CrossRef]
  6. Bagherifard, S.; Monti, S.; Zuccoli, M.V.; Riccio, M.; Kondás, J.; Guagliano, M. Cold spray deposition for additive manufacturing of freeform structural components compared to selective laser melting. Mater. Sci. Eng. A 2018, 721, 339–350. [Google Scholar] [CrossRef]
  7. Judas, J.; Zapletal, J.; Řehořek, L.; Jan, V. Effects of annealing temperature on microstructure and mechanical properties of cold sprayed AA7075. Procedia Struct. Integr. 2023, 43, 160–165. [Google Scholar] [CrossRef]
  8. Singh, R.; Kondás, J.; Bauer, C.; Cizek, J.; Medricky, J.; Csaki, S.; Čupera, J.; Procházka, R.; Melzer, D.; Konopik, P. Bulk-like ductility of cold spray additively manufactured copper in the as-sprayed state. Addit. Manuf. Lett. 2022, 3, 100052. [Google Scholar] [CrossRef]
  9. Stoltenhoff, T.; Borchers, C.; Gärtner, F.; Kreye, H. Microstructures and key properties of cold-sprayed and thermally sprayed copper coatings. Surf. Coatings Technol. 2006, 200, 4947–4960. [Google Scholar] [CrossRef]
  10. Rokni, M.; Widener, C.; Ozdemir, O.; Crawford, G. Microstructure and mechanical properties of cold sprayed 6061 Al in As-sprayed and heat treated condition. Surf. Coatings Technol. 2017, 309, 641–650. [Google Scholar] [CrossRef]
  11. Yin, S.; Cizek, J.; Chen, C.; Jenkins, R.; O’Donnell, G.; Lupoi, R. Metallurgical bonding between metal matrix and core-shelled reinforcements in cold sprayed composite coating. Scr. Mater. 2020, 177, 49–53. [Google Scholar] [CrossRef]
  12. Evans, W.C.; Dan, X.; Houshmand, A.; Müftü, S.; Ando, T. Microstructural Characterization of Aluminum 6061 Splats Cold Spray Deposited on Aluminum 6061-T6 Substrate. Metall. Mater. Trans. A 2019, 50, 3937–3948. [Google Scholar] [CrossRef]
  13. Prashar, G.; Vasudev, H. A comprehensive review on sustainable cold spray additive manufacturing: State of the art, challenges and future challenges. J. Clean. Prod. 2021, 310, 127606. [Google Scholar] [CrossRef]
  14. Birt, A.; Champagne, V.; Sisson, R.; Apelian, D. Microstructural analysis of cold-sprayed Ti-6Al-4V at the micro-and nano-scale. J. Therm. Spray Technol. 2015, 24, 1277–1288. [Google Scholar] [CrossRef]
  15. Sabard, A.; Hussain, T. Inter-particle bonding in cold spray deposition of a gas-atomised and a solution heat-treated Al 6061 powder. J. Mater. Sci. 2019, 54, 12061–12078. [Google Scholar] [CrossRef]
  16. Pathak, S.; Saha, G.C. Development of sustainable cold spray coatings and 3D additive manufacturing components for repair/manufacturing applications: A critical review. Coatings 2017, 7, 122. [Google Scholar] [CrossRef]
  17. Bedard, B.A.; Flanagan, T.J.; Ernst, A.T.; Nardi, A.; Dongare, A.M.; Brody, H.D.; Champagne, V.K.; Lee, S.W.; Aindow, M. Microstructure and Micromechanical Response in Gas-Atomized Al 6061 Alloy Powder and Cold-Sprayed Splats. J. Therm. Spray Technol. 2018, 27, 1563–1578. [Google Scholar] [CrossRef]
  18. Guo, D.; Kazasidis, M.; Hawkins, A.; Fan, N.; Leclerc, Z.; MacDonald, D.; Nastic, A.; Nikbakht, R.; Ortiz-Fernandez, R.; Rahmati, S.; et al. Cold spray: Over 30 years of development toward a hot future. J. Therm. Spray Technol. 2022, 31, 866–907. [Google Scholar] [CrossRef]
  19. Blochet, Q.; Delloro, F.; N’guyen, F.; Jeulin, D.; Borit, F.; Jeandin, M. Effect of the cold-sprayed aluminum coating-substrate interface morphology on bond strength for aircraft repair application. J. Therm. Spray Technol. 2017, 26, 671–686. [Google Scholar] [CrossRef]
  20. Kumar, S.; Bodapati, B.R.; Vinay, G.; Kumar, V.; Chavan, N.M.; Suresh Babu, P.; Jyothirmayi, A. Estimation of inter-splat bonding and its effect on functional properties of cold sprayed coatings. Surf. Coatings Technol. 2021, 420, 127318. [Google Scholar] [CrossRef]
  21. Liu, T.; Leazer, J.D.; Brewer, L.N. Particle deformation and microstructure evolution during cold spray of individual Al-Cu alloy powder particles. Acta Mater. 2019, 168, 13–23. [Google Scholar] [CrossRef]
  22. Chen, C.; Xie, Y.; Yin, S.; Li, W.; Luo, X.; Xie, X.; Zhao, R.; Deng, C.; Wang, J.; Liao, H.; et al. Ductile and high strength Cu fabricated by solid-state cold spray additive manufacturing. J. Mater. Sci. Technol. 2023, 134, 234–243. [Google Scholar] [CrossRef]
  23. Assadi, H.; Kreye, H.; Gärtner, F.; Klassen, T. Cold spraying—A materials perspective. Acta Mater. 2016, 116, 382–407. [Google Scholar] [CrossRef]
  24. Hutasoit, N.; Javed, M.A.; Rashid, R.A.R.; Wade, S.; Palanisamy, S. Effects of build orientation and heat treatment on microstructure, mechanical and corrosion properties of Al6061 aluminium parts built by cold spray additive manufacturing process. Int. J. Mech. Sci. 2021, 204, 106526. [Google Scholar] [CrossRef]
  25. Mangalarapu, T.B.; Kumar, S.; Ramakrishna, M.; Gandham, P.; Suresh, K. Precipitation behavior of cold sprayed Al6061 coatings. Materialia 2022, 24, 101510. [Google Scholar] [CrossRef]
  26. Rahmati, S.; Veiga, R.G.A.; Jodoin, B.; Zúñiga, A. Crystal orientation and grain boundary effects on plastic deformation of FCC particles under high velocity impacts. Materialia 2021, 15, 101004. [Google Scholar] [CrossRef]
  27. Zhao, P.; Zhang, Q.; Guo, Y.; Liu, H.; Deng, Z. Atomic simulation of crystal orientation effect on coating surface generation mechanisms in cold spray. Comput. Mater. Sci. 2020, 184. [Google Scholar] [CrossRef]
  28. Msolli, S.; Zhang, Z.Q.; Seng, D.H.L.; Zhang, Z.; Guo, J.; Reddy, C.D.; Sridhar, N.; Pan, J.; Tan, B.H.; Loi, Q. An experimentally validated dislocation density based computational framework for predicting microstructural evolution in cold spray process. Int. J. Solids Struct. 2021, 225, 111065. [Google Scholar] [CrossRef]
  29. Sayahlatifi, S.; Shao, C.; McDonald, A.; Hogan, J. 3D Microstructure-Based Finite Element Simulation of Cold-Sprayed Al-Al2O3 Composite Coatings Under Quasi-Static Compression and Indentation Loading. J. Therm. Spray Technol. 2022, 31, 102–118. [Google Scholar] [CrossRef]
  30. Rokni, M.; Widener, C.; Champagne, V.; Crawford, G. Microstructure and mechanical properties of cold sprayed 7075 deposition during non-isothermal annealing. Surf. Coatings Technol. 2015, 276, 305–315. [Google Scholar] [CrossRef]
  31. Rokni, M.; Nardi, A.; Champagne, V.; Nutt, S. Effects of preprocessing on multi-direction properties of aluminum alloy cold-spray deposits. J. Therm. Spray Technol. 2018, 27, 818–826. [Google Scholar] [CrossRef]
  32. Bagherifard, S.; Guagliano, M. Fatigue performance of cold spray deposits: Coating, repair and additive manufacturing cases. Int. J. Fatigue 2020, 139, 105744. [Google Scholar] [CrossRef]
  33. Herriott, C.; Li, X.; Kouraytem, N.; Tari, V.; Tan, W.; Anglin, B.; Rollett, A.D.; Spear, A.D. A multi-scale, multi-physics modeling framework to predict spatial variation of properties in additive-manufactured metals. Model. Simul. Mater. Sci. Eng. 2019, 27, 025009. [Google Scholar] [CrossRef]
  34. Yang, K.; Li, W.; Yang, X.; Xu, Y.; Vairis, A. Effect of heat treatment on the inherent anisotropy of cold sprayed copper deposits. Surf. Coatings Technol. 2018, 350, 519–530. [Google Scholar] [CrossRef]
  35. Sun, W.; Tan, A.W.Y.; Wu, K.; Yin, S.; Yang, X.; Marinescu, I.; Liu, E. Post-Process Treatments on Supersonic Cold Sprayed Coatings: A Review. Coatings 2020, 10, 123. [Google Scholar] [CrossRef]
  36. Lebensohn, R.; Castañeda, P.P.; Brenner, R.; Castelnau, O. Computational Methods for Microstructure-Property Relationships; Springer: Berlin, Germany, 2011. [Google Scholar]
  37. Patil, C.S.; Chakraborty, S.; Niezgoda, S.R. Comparison of full field predictions of crystal plasticity simulations using the Voce and the dislocation density based hardening laws. Int. J. Plast. 2021, 147, 103099. [Google Scholar] [CrossRef]
  38. Liu, J.; Xiong, W.; Behera, A.; Thompson, S.; To, A.C. Mean-field polycrystal plasticity modeling with grain size and shape effects for laser additive manufactured FCC metals. Sci. Direct 2017, 112, 35–42. [Google Scholar] [CrossRef]
  39. Christy, T.; Murugan, N.; Kumar, S. A comparative study on the microstructures and mechanical properties of Al 6061 alloy and the MMC Al 6061/TiB2/12p. J. Miner. Mater. Charact. Eng. 2010, 9, 57–65. [Google Scholar]
  40. McMaster-Carr. Available online: https://www.mcmaster.com/ (accessed on 1 August 2022).
  41. Bachmann, F.; Hielscher, R.; Schaeben, H. Texture analysis with MTEX—Free and open source software toolbox. Solid State Phenom. 2010, 160, 63–68. [Google Scholar] [CrossRef]
  42. The MathWorks Inc. MATLAB, version: 9.13.0 (R2022b); The MathWorks Inc.: Natick, MA, USA, 2022. [Google Scholar]
  43. Lutterotti, L. Total pattern fitting for the combined size–strain–stress–texture determination in thin film diffraction. Nucl. Instruments Methods Phys. Res. Sect. B Beam Interact. Mater. Atoms 2010, 268, 334–340. [Google Scholar] [CrossRef]
  44. ASTM-E0008/E0008M-22; Standard Test Methods for Tension Testing of Metallic Materials. ASTM International: West Conshohocken, PA, USA, 2022.
  45. Kazasidis, M.; Verna, E.; Yin, S.; Lupoi, R. The effect of heat treatment and impact angle on the erosion behavior of nickel-tungsten carbide cold spray coating using response surface methodology. Emergent Mater. 2021, 4, 1605–1618. [Google Scholar] [CrossRef]
  46. Abubakar, A.A. A hybrid computational approach for modeling cold spray deposition. Eng. Sci. Technol. Int. J. 2023, 48, 101579. [Google Scholar] [CrossRef]
  47. Pantleon, W. Resolving the geometrically necessary dislocation content by conventional electron backscattering diffraction. Scr. Mater. 2008, 58, 994–997. [Google Scholar] [CrossRef]
  48. Yang, K.; Li, W.; Guo, X.; Yang, X.; Xu, Y. Characterizations and anisotropy of cold-spraying additive-manufactured copper bulk. J. Mater. Sci. Technol. 2018, 34, 1570–1579. [Google Scholar] [CrossRef]
  49. Champagne, V.; Helfritch, D. Critical assessment 11: Structural repairs by cold spray. Mater. Sci. Technol. 2015, 31, 627–634. [Google Scholar] [CrossRef]
  50. Wang, Q.; Shankar, R.M.; Liu, Z. Visco-plastic self-consistent modeling of crystallographic texture evolution related to slip systems activated during machining Ti-6AL-4V. J. Alloys Compd. 2021, 853, 157336. [Google Scholar] [CrossRef]
  51. Lebensohn, R.A.; Tomé, C.N. A self-consistent anisotropic approach for the simulation of plastic deformation and texture development of polycrystals: Application to zirconium alloys. Acta Metall. Mater. 1993, 41, 2611–2624. [Google Scholar] [CrossRef]
  52. Tomé, C.; Lebensohn, R.; VISCO-PLASTIC SELF-CONSISTENT (VPSC). Los Alamos National Laboratory. Available online: https://public.lanl.gov/lebenso/VPSC7c_manual.pdf (accessed on 1 December 2021).
  53. Anglin, B.; Gockel, B.; Rollett, A. Developing constitutive model parameters via a multi-scale approach. Integr. Mater. Manuf. Innov. 2016, 5, 212–231. [Google Scholar] [CrossRef]
  54. Bobzin, K.; Wietheger, W.; Hebing, J.; Gerdt, L. Softening Behavior of Cold-Sprayed Aluminum-Based Coatings AA1200 and AA7075 During Annealing. J. Therm. Spray Technol. 2021, 30, 358–370. [Google Scholar] [CrossRef]
  55. Devi, G.N.; Kumar, S.; Balaji, T.S.; Mangalarapu, T.B.; Chandrasekhar, S.B.; Gopal, A.V.; Jyothirmayi, A. Influence of inter-splat bonding state of cold sprayed IN625 and IN718 coatings on mechanical and corrosion performance. Surf. Coatings Technol. 2022, 445, 128731. [Google Scholar] [CrossRef]
  56. Rokni, M.; Widener, C.; Champagne, V. Microstructural stability of ultrafine grained cold sprayed 6061 aluminum alloy. Appl. Surf. Sci. 2014, 290, 482–489. [Google Scholar] [CrossRef]
  57. Liu, X.; Qiao, X.; Xie, W.; Pei, R.; Yuan, L.; Zheng, M. Influence of grain size on microstructure, mechanical properties and strain hardening behavior of Mg-0.3Ca (wt.%) alloy. Mater. Sci. Eng. A 2022, 839, 142847. [Google Scholar] [CrossRef]
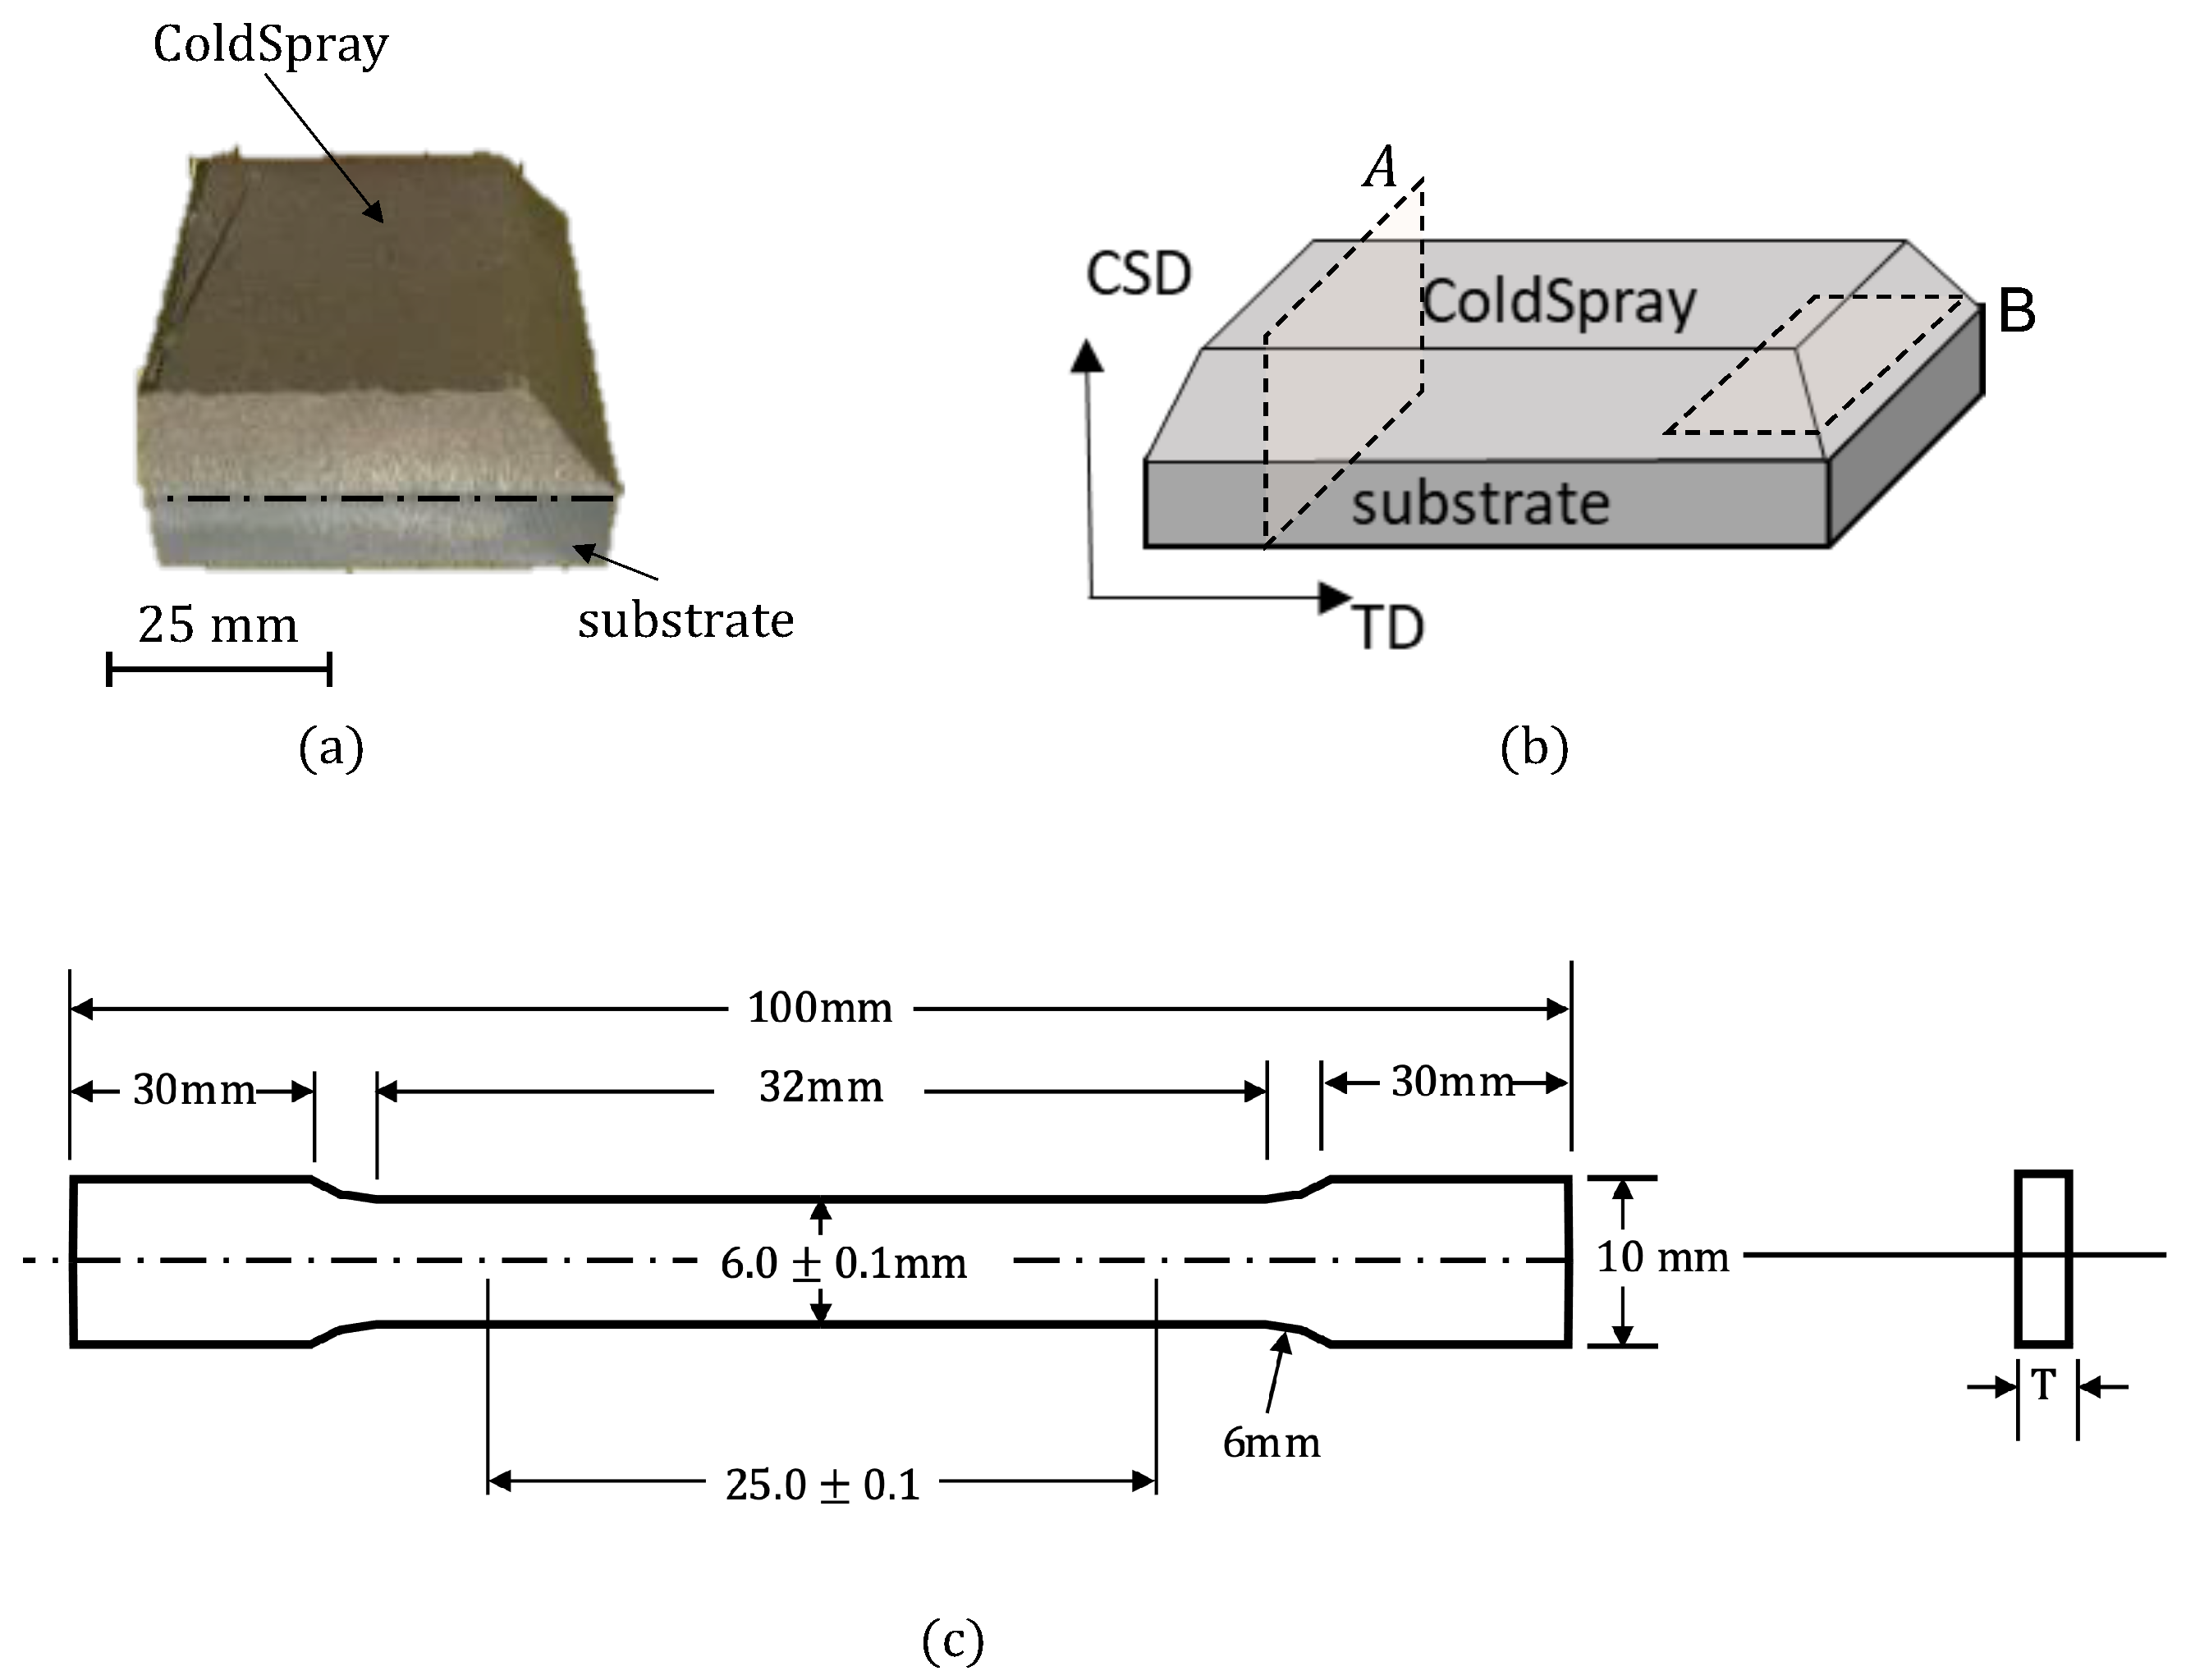
Figure 1. (a) Cold-spray additive manufactured (CSAM) part as obtained, (b) schematic showing orientation of CSAM sample with respect to cold-sprayed direction (CSD) and transverse direction (TD), and (c) ASTM E8 subsize dogbone tension test schematic.
Crystals 14 00329 g001
Figure 2. (a) OM image taken at 1mm from substrate showing pores, binary image of pores using Matlab script, and pore size distribution. (b) Porosity and pore information CSAM Al6061 sample at three different build heights: 1 mm, 5 mm, and 9 mm.
Crystals 14 00329 g002
Figure 3. OM and SEM images showing substrate–powder interface, intersplat boundaries, and grain boundaries in (a) side view of the sample and (bd) top view (spray direction into page) of the 10% NaOH etched surface in CS Al6061.
Crystals 14 00329 g003
Figure 4. EBSD inverse pole figure (IPF) micrograph of (a) cold-rolled Al6061 and CSAM Al6061 in as-sprayed condition from (b) side view, (c) top view, and (d) in annealed condition.
Crystals 14 00329 g004
Figure 5. (a) Grain centroids from EBSD data for CSAM Al6061. (b) Dislocation density map calculated from EBSD using method outlined by Pantleon [47], (c) grains of interest inside a powder particle, and (d) the average dislocation density and the diameter of the grains in (c) against their distance from intersplat boundary (from A).
Crystals 14 00329 g005
Figure 6. (a) Pole figures obtained from X-ray diffraction (XRD) scans for rolled and CSAM Al6061. (b) Residual stress measurements from XRD scans for rolled, rolled-annealed, as-sprayed, and annealed CSAM Al6061 (diagonal and vertical stripes correspond with rolled and cold-sprayed samples, respectively).
Crystals 14 00329 g006
Figure 7. Schematic showing viscoplastic self-consistent modeling framework (b represents the Burger’s vector, and n is normal to the Burger’s vector).
Crystals 14 00329 g007
Figure 8. The calibrated simulation data plotted against the experimentally obtained tensile data for as-rolled (CR_AR) Al6061 and rolled-annealed (CR_O) Al6061.
Crystals 14 00329 g008
Figure 9. (a) Plasticity simulation comparing stress–strain response predicted using modified Hall–Petch-type relation, and (b) stress–strain response prediction of annealed CSAM microstructure compared to as-sprayed condition.
Crystals 14 00329 g009
Figure 10. (a) Image quality, (b) geometrically necessary dislocation (GND) density, and (c) inverse pole figure (IPF) map showing areas of strongly bonded regions and poorly bonded regions in annealed cold-sprayed sample. White-dotted regions show pores at the intersplat boundary, and red-dotted regions show areas with good bondings.
Crystals 14 00329 g010
Figure 11. The experimental, simulated, and modified simulated yield stress values compared for the rolled and cold-sprayed materials in their as-received and annealed conditions (see Table 3 for more details on experimental results).
Crystals 14 00329 g011
Figure 12. Scatter plot showing von Mises stress (MPa) of individual grains as a function of grain size (µm).
Crystals 14 00329 g012
Figure 13. Evolution of von Mises stress of the grains of interest tabulated in Table 6 for the third-percentile annealed CSAM Al6061.
Crystals 14 00329 g013
Figure 14. The texture evolution for the as-sprayed modified CSAM Al6061 of each of the nine GoIs taken from the third-percentile data set, as can be seen for the (111) pole. The circles in the figure are colored to reflect the GoI they represent. Three GoIs are marked within each pole for ease of visualization.
Crystals 14 00329 g014
Figure 15. The texture evolution for the annealed modified CSAM Al6061 of each of the nine GoIs taken from the third-percentile data set, as can be seen for the (111) pole. The circles in the figure are colored to reflect the GoI they represent. Three GoIs are marked within each pole for ease of visualization.
Crystals 14 00329 g015
Table 1. Chemical composition of Al6061.
ElementAlMgFeSiCuMnVTi
Weight (%)97.251.080.170.630.320.520.010.02
Table 2. Microstructural information of as-rolled, as-sprayed, and sprayed annealed aluminum 6061 samples.
RolledAs-Sprayed CSAMAnnealed CSAM
Average grain size27.810.317.9
Average grain aspect ratio2.182.272.28
Table 3. Yield strength (YS), ultimate tensile strength (UTS), and percentage elongation of rolled and cold-sprayed materials [49] in as-received and annealed conditions.
RolledRolled AnnealedCSAMCSAM Annealed
YS (MPa) 243 ± 3 53 ± 2 293160
UTS (MPa) 344 ± 17 142 ± 1 345200
% Elongation 10.8 ± 0.5 17.8 ± 3.1 417
Table 4. Calibrated parameters used in VPSC simulation.
Parameters τ τ 1 θ 0 θ 1 k hp k ib k ib (Annealed)
Value−13230.0750651310.047.067.0
Table 5. Grains of interest (GoI) 1 through 9 within the microstructure used for analysis.
Grain Size
Bottom 3%Middle 3%Top 3%
StressMinimumGoI-1GoI-4GoI-7
MeanGoI-2GoI-5GoI-8
MaximumGoI-3GoI-6GoI-9
Table 6. Grain information such as von Mises stress, initial and final orientation (Euler angles), and maximum Schmid factor (SF) for grains of interest (GOIs) with grain sizes at top, middle, and bottom three percentile as obtained from the simulation results for as-sprayed and annealed CS Al6061.
As-SprayedGrain Size (µm)Stress (MPa)Initial OrientationSF (Max)Final Orientation
GoI-11.83463.2(313.6, 137.2, 78.3)0.354(315.7, 135.1, 83.6)
GoI-21.83613.8(216.2, 169.1, 166.3)0.462(210.3, 166.6, 159.9)
GoI-32.11722.5(267.5, 65.7, 100.5)0.465(260.6, 67.34, 101.94)
GoI-44.18442.9(124.9, 66.7, 298.4)0.315(124.9, 66.7, 298.4)
GoI-54.04508.4(103.9, 27.9, 97.8)0.496(106.7, 28.3, 94.9)
GoI-64.17674.0(233.5, 82.6, 139.6)0.286(234.9, 83.1, 139.4)
GoI-732.97185.5(49.5, 134.3, 64.1)0.497(57.5, 137.9, 65.8)
GoI-817.13263.6(191.2, 61.9, 204.0)0.437(197.7, 59.4, 205.1)
GoI-927.8386.0(135.9, 130.7, 163.5)0.317(135.9, 129.5, 164.9)
AnnealedGrain Size (µm)Stress (MPa)Initial OrientationSF (Max)Final Orientation
GoI-12.05320.1(29.2, 138.7, 273.1)0.373(30.9, 136.8, 271.2)
GoI-22.07423.7(230.3, 91.6, 333.4)0.421(230.3, 91.6, 333.4)
GoI-32.04501.3(276.6, 96.1, 190.1)0.460(276.6, 96.1, 190.1)
GoI-45.65290.5(321.5, 118.3, 65.8)0.391(320.5, 118.2, 66.2)
GoI-55.50329.3(118.8, 115.6, 346.4)0.410(118.7, 115.6, 345.9)
GoI-65.32411.43(48.6, 47.1, 73.3)0.347(44.1, 49.3, 74.1)
GoI-720.7142.88(207.9, 71.7, 207.8)0.479(198.3, 67.9, 210.6)
GoI-823.7204.26(135.6, 128.2, 227.2)0.475(130.5, 127.9, 230.5)
GoI-925.54355.91(326.1, 135.2, 89.2)0.295(323.9, 135.1, 88.8)
Disclaimer/Publisher’s Note: The statements, opinions and data contained in all publications are solely those of the individual author(s) and contributor(s) and not of MDPI and/or the editor(s). MDPI and/or the editor(s) disclaim responsibility for any injury to people or property resulting from any ideas, methods, instructions or products referred to in the content.